Transcript of November / December, 2017€¦ · Quanta continues to see opportunities to increase shareholder...
Investor PresentationNovember December 2017
NYSE PWR
Forward Looking Statement Disclaimer
This presentation (and oral statements regarding the subject matter of this presentation) includes forward-looking statements intended to qualifyunder the ldquosafe harborrdquo from liability established by the Private Securities Litigation Reform Act of 1995 These forward-looking statements includeany statements reflecting Quantas expectations intentions strategies assumptions or beliefs about future events or performance or that do notsolely relate to historical or current facts Forward-looking statements involve certain risks uncertainties and assumptions that are difficult topredict or beyond Quantas control and actual results may differ materially from those expected implied or forecasted by our forward-lookingstatements due to inaccurate assumptions and known and unknown risk and uncertainties For additional information concerning some of therisks uncertainties and assumptions that could affect our forward-looking statements please refer to Quantarsquos Annual Report on Form 10-K for theyear ended December 31 2016 and its other documents filed with the Securities and Exchange Commission as well as the risks uncertainties andassumptions identified in this presentation Investors and analysts should not place undue reliance on Quantarsquos forward-looking statements whichare current only as of the date of this presentation Quanta does not undertake and expressly disclaims any obligation to update or revise anyforward-looking statements to reflect events or circumstances after the date of this presentation or otherwise and Quanta expressly disclaims anywritten or oral statements made by any third party regarding the subject matter of this presentation
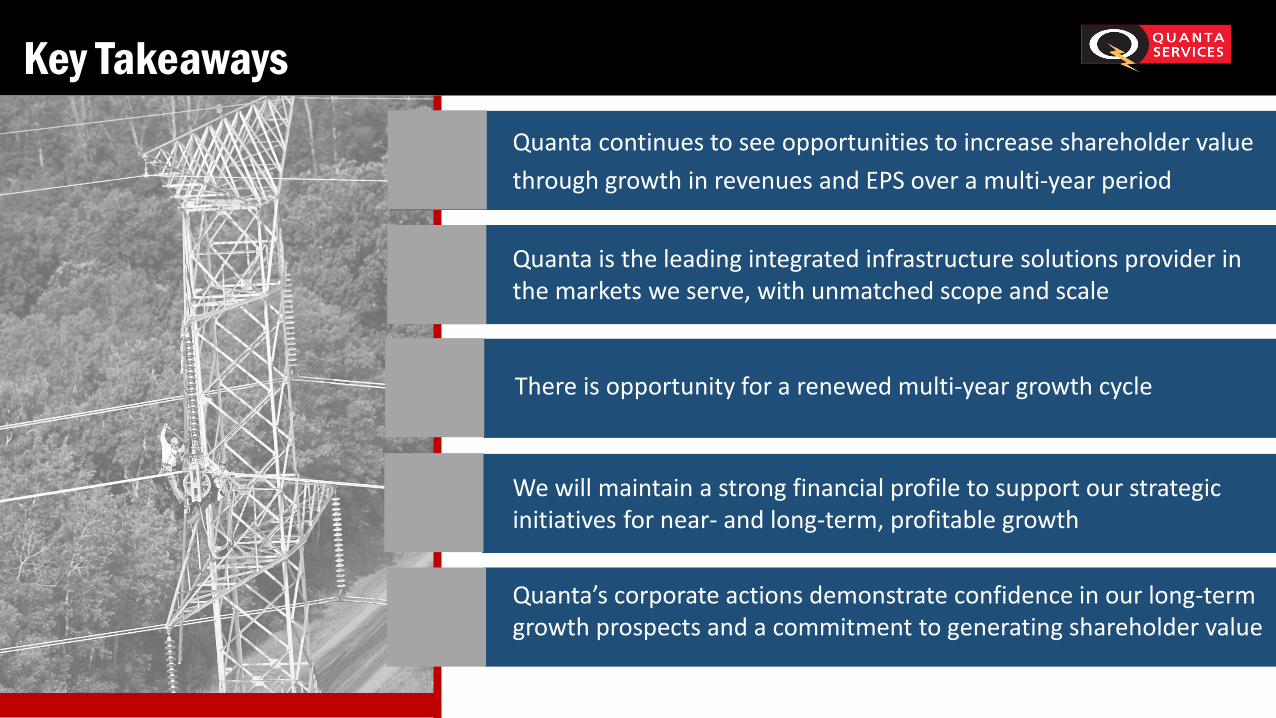
Key TakeawaysQuanta continues to see opportunities to increase shareholder value through growth in revenues and EPS over a multi-year period
Quanta is the leading integrated infrastructure solutions provider in the markets we serve with unmatched scope and scale
We will maintain a strong financial profile to support our strategic initiatives for near- and long-term profitable growth
There is opportunity for a renewed multi-year growth cycle
Quantarsquos corporate actions demonstrate confidence in our long-term growth prospects and a commitment to generating shareholder value
Leading Integrated Infrastructure Solutions Provider
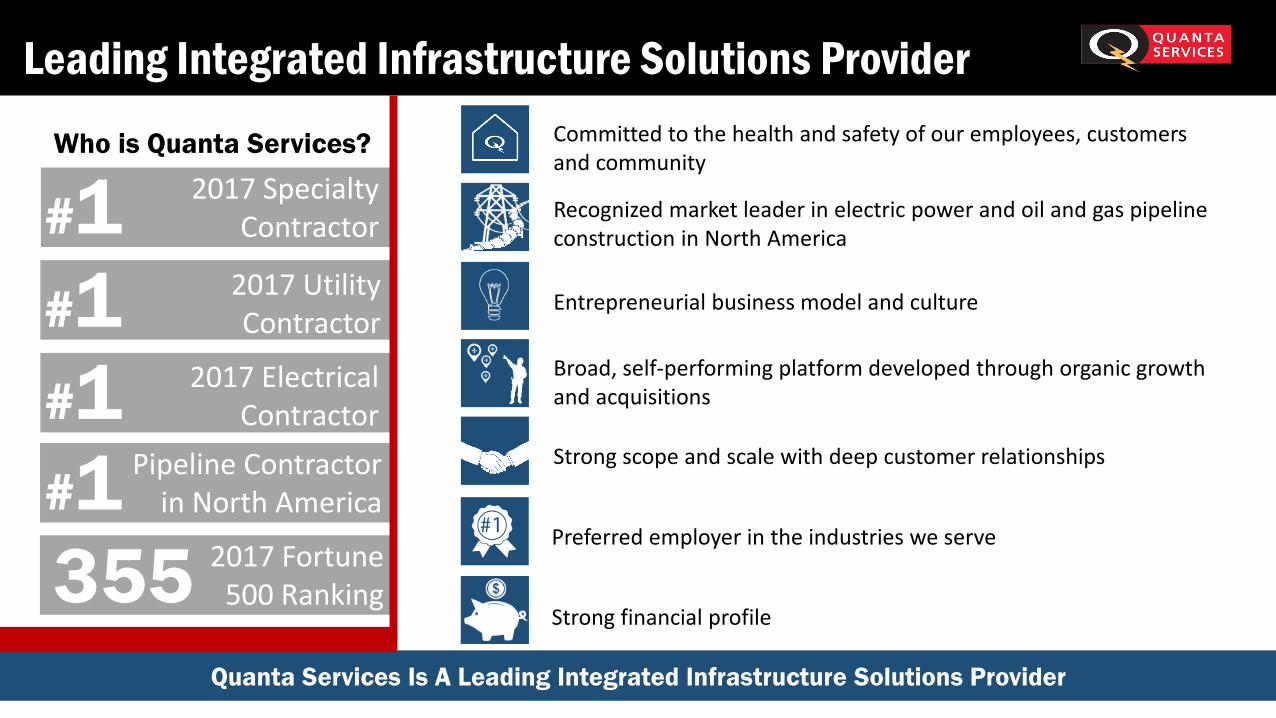
Quanta Services Is A Leading Integrated Infrastructure Solutions Provider
Who is Quanta Services Committed to the health and safety of our employees customers and community
Recognized market leader in electric power and oil and gas pipeline construction in North America
Entrepreneurial business model and culture
Broad self-performing platform developed through organic growth and acquisitions
Strong scope and scale with deep customer relationships
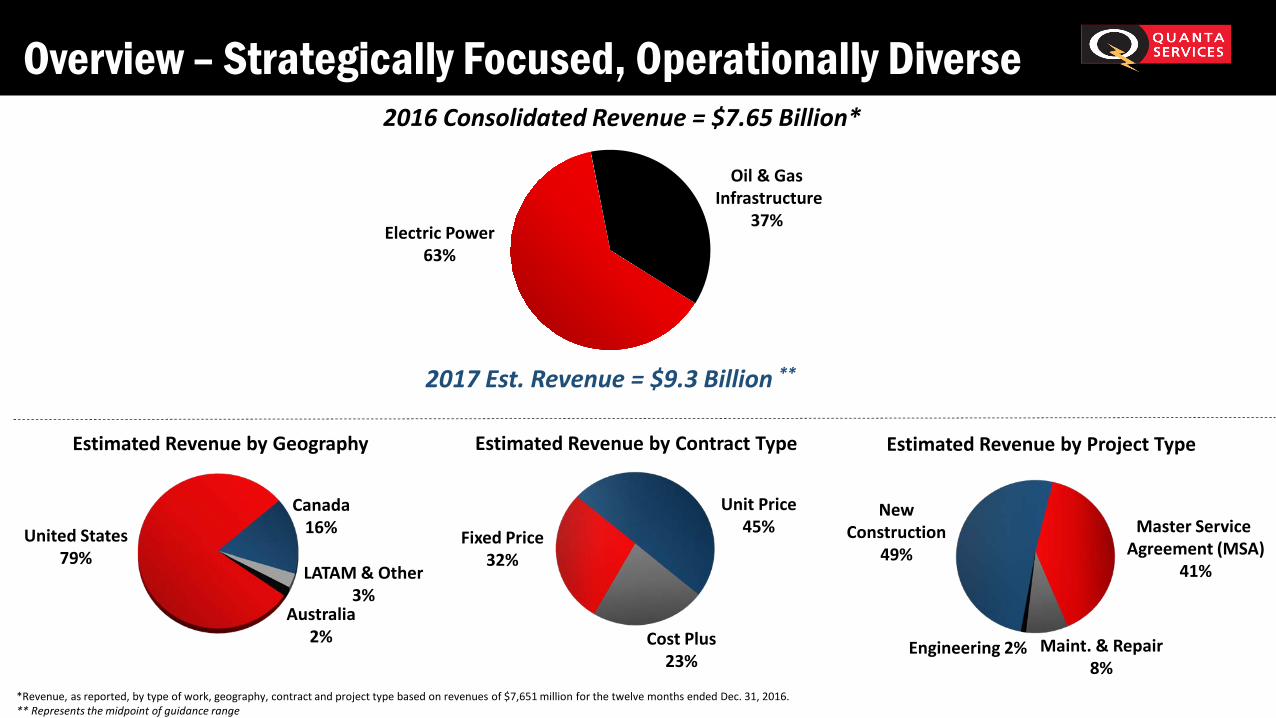
Revenue as reported by type of work geography contract and project type based on revenues of $7651 million for the twelve months ended Dec 31 2016 Represents the midpoint of guidance range
Estimated Revenue by Geography
United States79
LATAM amp Other3
Canada16
Australia2
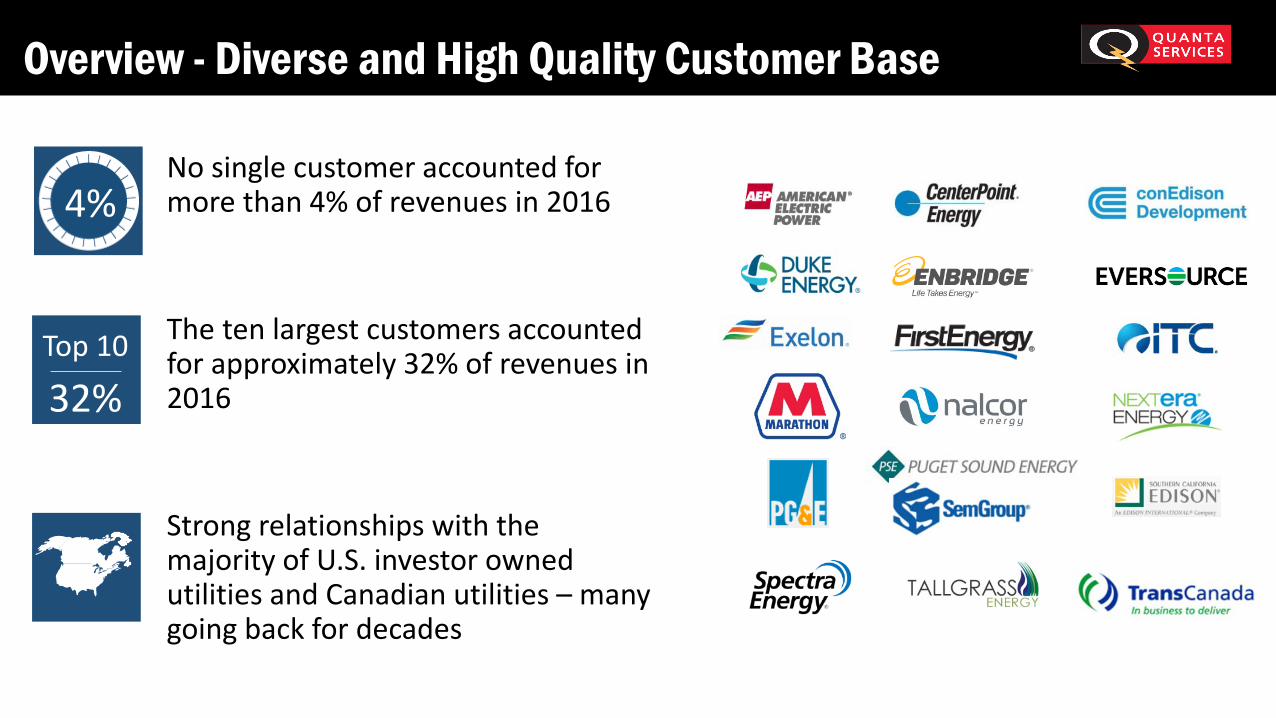
Overview - Diverse and High Quality Customer Base
No single customer accounted for more than 4 of revenues in 2016
The ten largest customers accounted for approximately 32 of revenues in 2016
Strong relationships with the majority of US investor owned utilities and Canadian utilities ndash many going back for decades
Top 10
32
4
Leading Integrated Infrastructure Solutions Provider
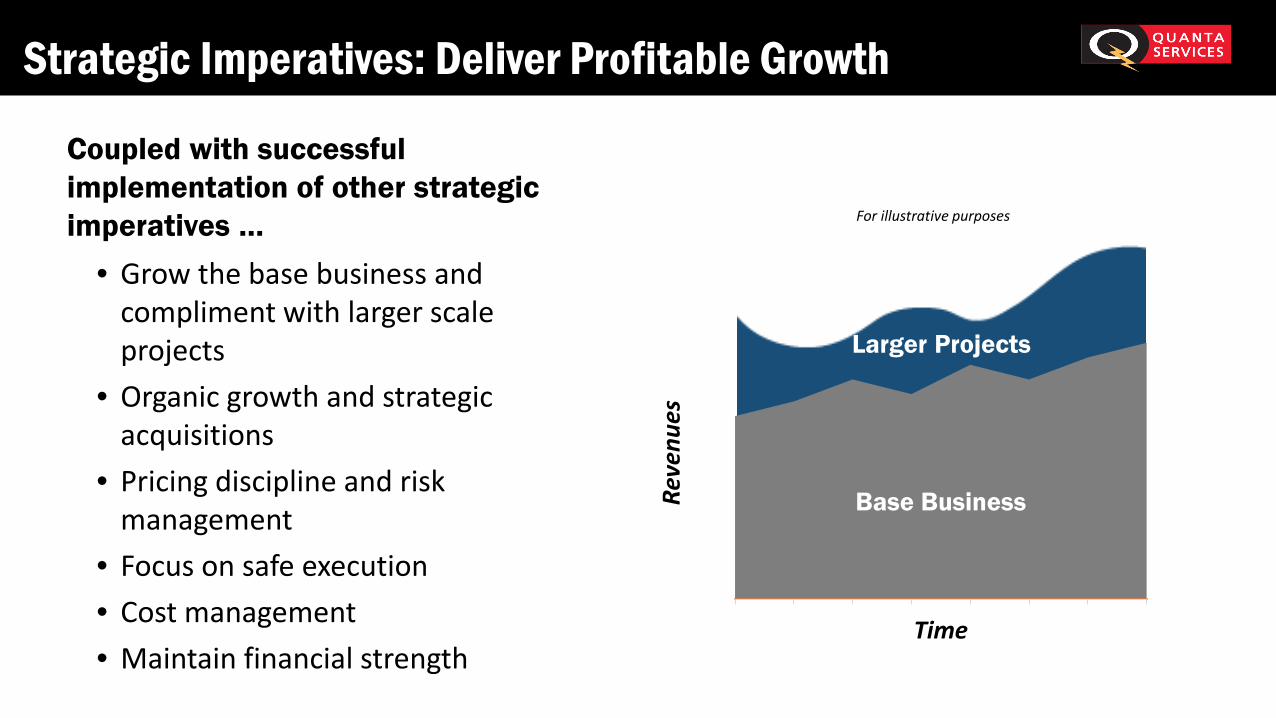
bull Grow the base business and compliment with larger scale projects
bull Organic growth and strategic acquisitions
bull Pricing discipline and risk management
bull Focus on safe executionbull Cost managementbull Maintain financial strength
TimeRe
venu
es
Coupled with successful implementation of other strategic imperatives hellip
Larger Projects
For illustrative purposes
Strategic Acquisitions Criteria and Rationale
Acquisition Strategic Rationale
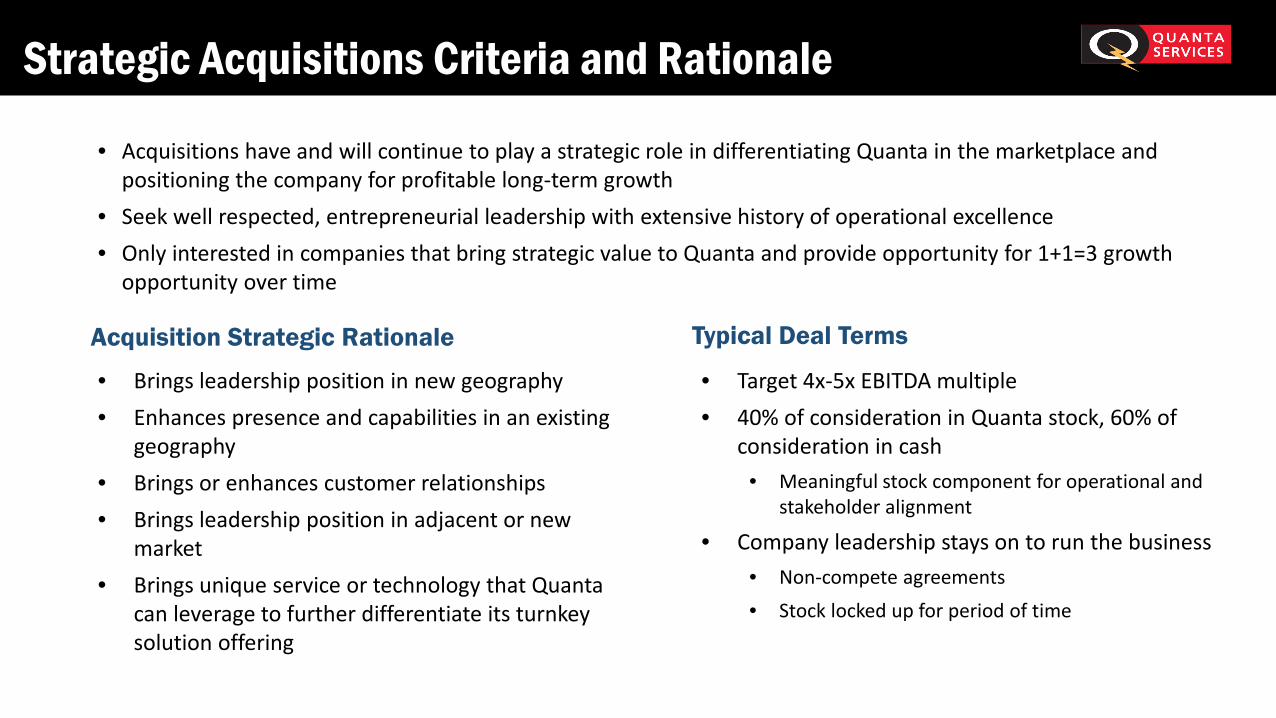
bull Acquisitions have and will continue to play a strategic role in differentiating Quanta in the marketplace and positioning the company for profitable long-term growth
bull Seek well respected entrepreneurial leadership with extensive history of operational excellencebull Only interested in companies that bring strategic value to Quanta and provide opportunity for 1+1=3 growth
opportunity over time
bull Brings leadership position in new geographybull Enhances presence and capabilities in an existing
geographybull Brings or enhances customer relationshipsbull Brings leadership position in adjacent or new
marketbull Brings unique service or technology that Quanta
can leverage to further differentiate its turnkey solution offering
Typical Deal Terms
bull Target 4x-5x EBITDA multiplebull 40 of consideration in Quanta stock 60 of
consideration in cashbull Meaningful stock component for operational and
stakeholder alignment
bull Company leadership stays on to run the businessbull Non-compete agreementsbull Stock locked up for period of time
Differentiated Competitive Position ndash In the Sweet Spot
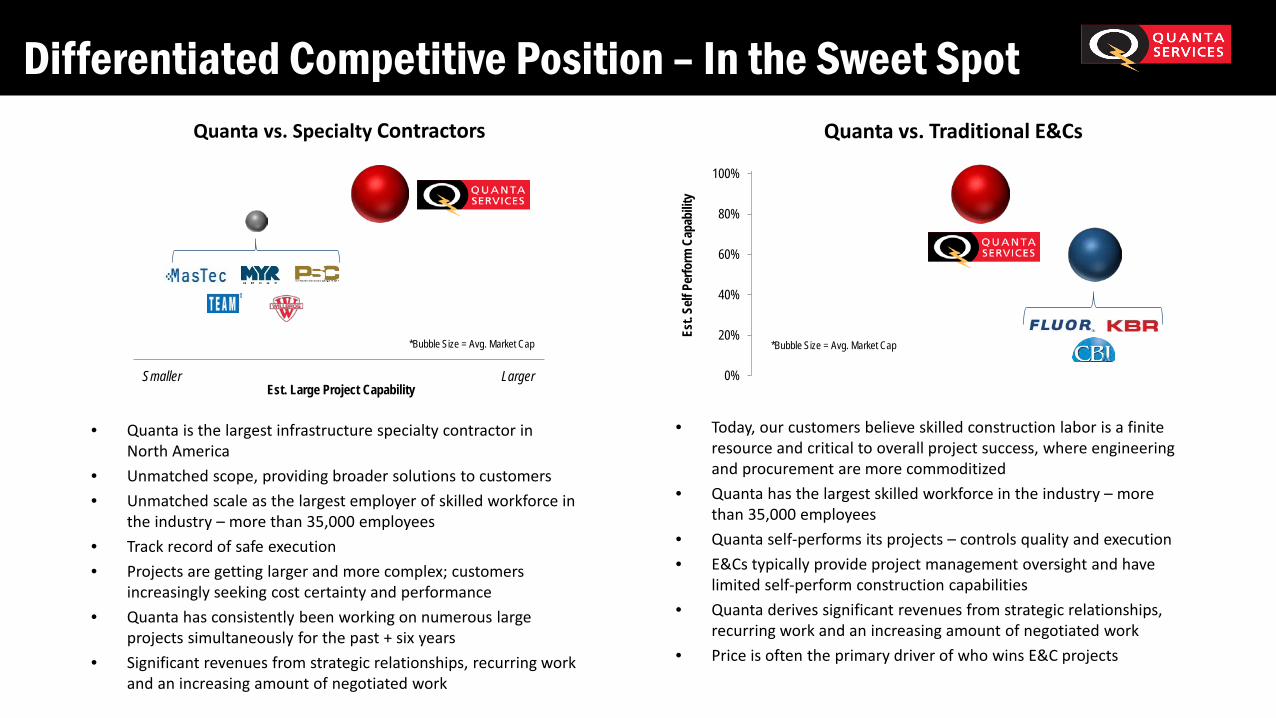
bull Quanta is the largest infrastructure specialty contractor in North America
bull Unmatched scope providing broader solutions to customersbull Unmatched scale as the largest employer of skilled workforce in
the industry ndash more than 35000 employeesbull Track record of safe executionbull Projects are getting larger and more complex customers
increasingly seeking cost certainty and performancebull Quanta has consistently been working on numerous large
projects simultaneously for the past + six yearsbull Significant revenues from strategic relationships recurring work
and an increasing amount of negotiated work
Quanta vs Specialty Contractors Quanta vs Traditional EampCs
bull Today our customers believe skilled construction labor is a finite resource and critical to overall project success where engineering and procurement are more commoditized
bull Quanta has the largest skilled workforce in the industry ndash more than 35000 employees
bull Quanta self-performs its projects ndash controls quality and executionbull EampCs typically provide project management oversight and have
limited self-perform construction capabilitiesbull Quanta derives significant revenues from strategic relationships
recurring work and an increasing amount of negotiated workbull Price is often the primary driver of who wins EampC projects
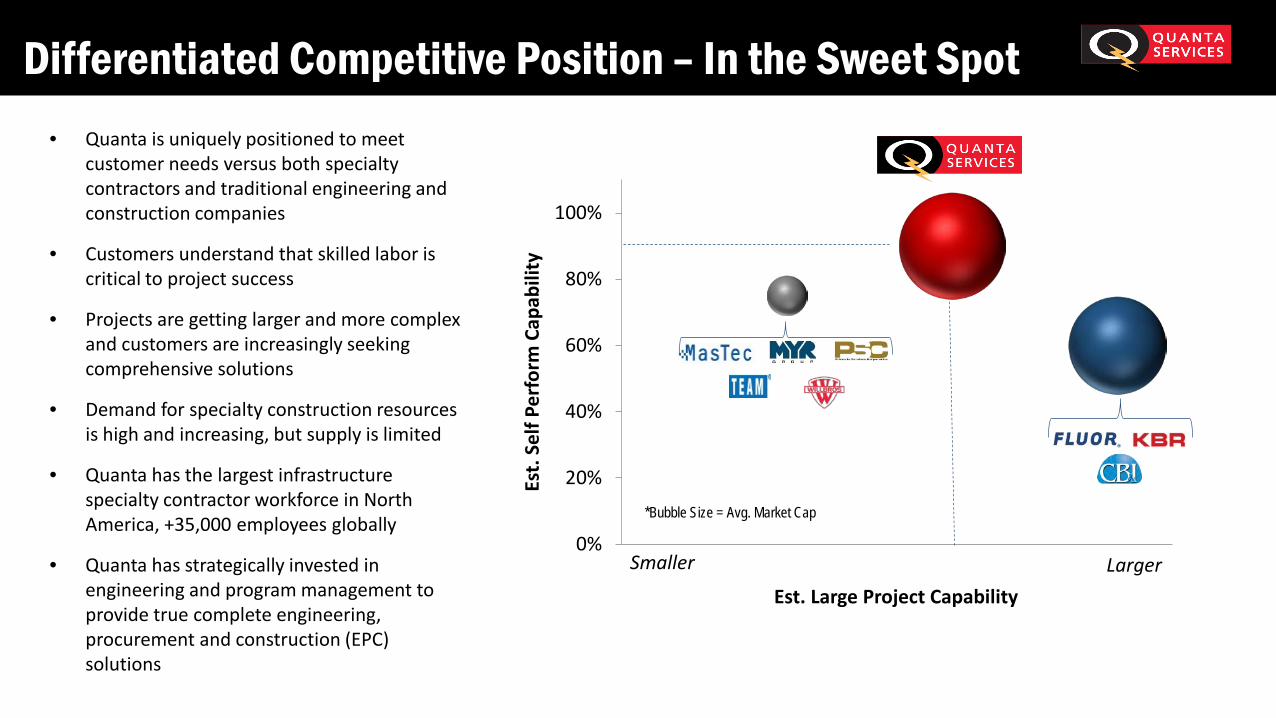
Est Large Project Capability
Bubble Size = Avg Market Cap
0
20
40
60
80
100
Est
Self
Perfo
rm C
apab
ility
Bubble Size = Avg Market Cap
LargerSmaller
Differentiated Competitive Position ndash In the Sweet Spotbull Quanta is uniquely positioned to meet
customer needs versus both specialty contractors and traditional engineering and construction companies
bull Customers understand that skilled labor is critical to project success
bull Projects are getting larger and more complex and customers are increasingly seeking comprehensive solutions
bull Demand for specialty construction resources is high and increasing but supply is limited
bull Quanta has the largest infrastructure specialty contractor workforce in North America +35000 employees globally
bull Quanta has strategically invested in engineering and program management to provide true complete engineering procurement and construction (EPC) solutions
0
20
40
60
80
100
Est
Self
Perf
orm
Cap
abili
ty
Est Large Project Capability
Bubble Size = Avg Market Cap
LargerSmaller
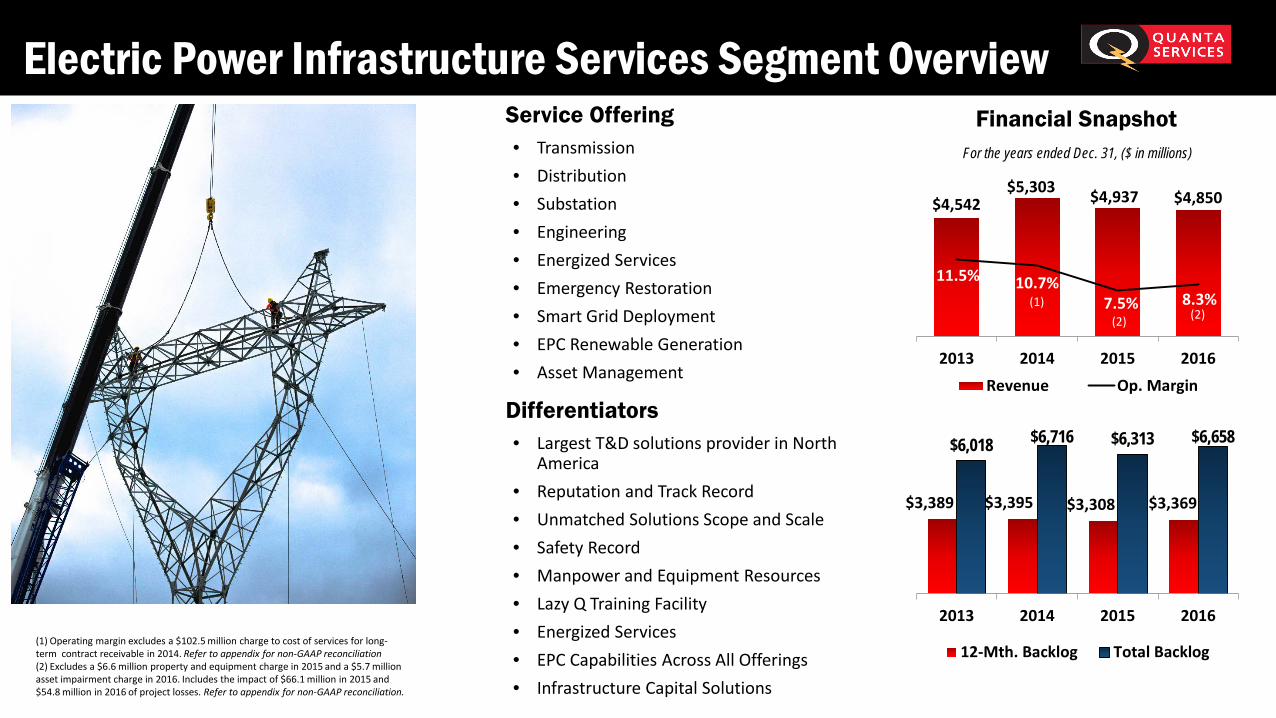
Electric Power Infrastructure Services Segment Overview
$4542$5303 $4937 $4850
115 10775 83
2013 2014 2015 2016Revenue Op Margin
(2)
(1) Operating margin excludes a $1025 million charge to cost of services for long-term contract receivable in 2014 Refer to appendix for non-GAAP reconciliation(2) Excludes a $66 million property and equipment charge in 2015 and a $57 million asset impairment charge in 2016 Includes the impact of $661 million in 2015 and $548 million in 2016 of project losses Refer to appendix for non-GAAP reconciliation
Differentiatorsbull Largest TampD solutions provider in North
Americabull Reputation and Track Recordbull Unmatched Solutions Scope and Scalebull Safety Recordbull Manpower and Equipment Resourcesbull Lazy Q Training Facilitybull Energized Servicesbull EPC Capabilities Across All Offeringsbull Infrastructure Capital Solutions
Market Drivers
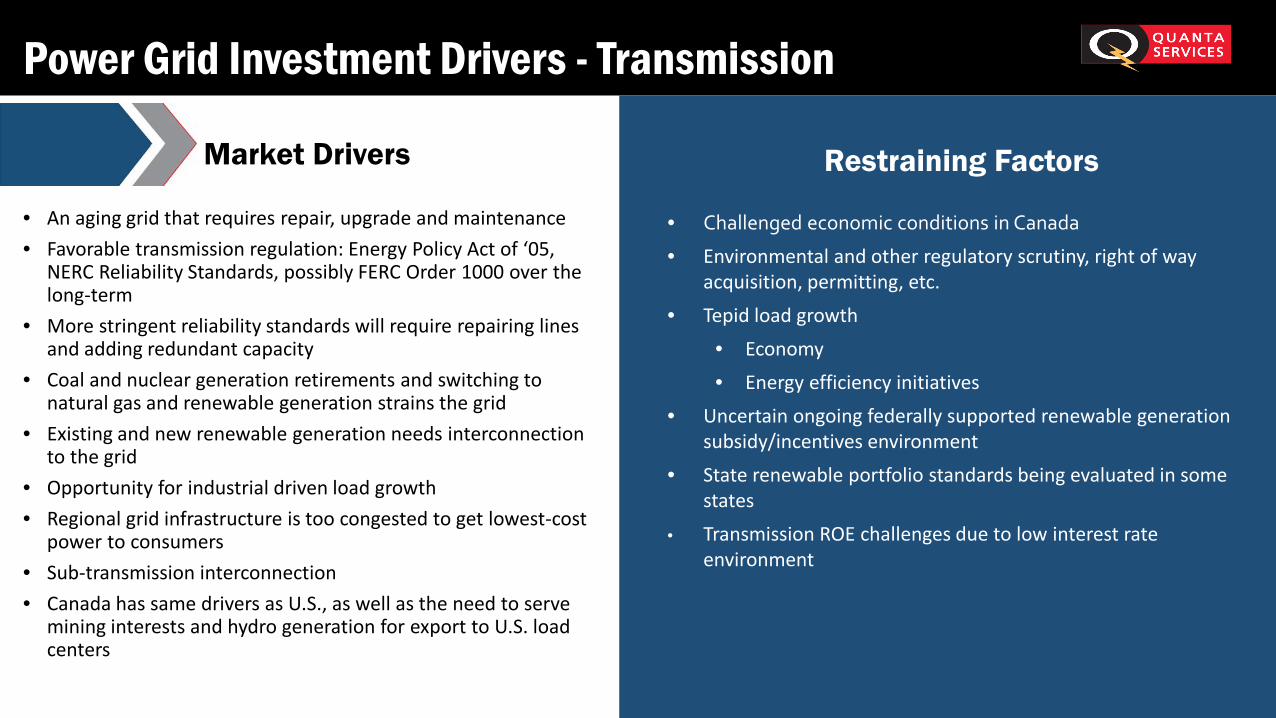
Power Grid Investment Drivers - Transmission
bull An aging grid that requires repair upgrade and maintenancebull Favorable transmission regulation Energy Policy Act of lsquo05
NERC Reliability Standards possibly FERC Order 1000 over the long-term
bull More stringent reliability standards will require repairing lines and adding redundant capacity
bull Coal and nuclear generation retirements and switching to natural gas and renewable generation strains the grid
bull Existing and new renewable generation needs interconnection to the grid
bull Opportunity for industrial driven load growthbull Regional grid infrastructure is too congested to get lowest-cost
power to consumersbull Sub-transmission interconnectionbull Canada has same drivers as US as well as the need to serve
mining interests and hydro generation for export to US load centers
bull Challenged economic conditions in Canada
bull Environmental and other regulatory scrutiny right of way acquisition permitting etc
bull Tepid load growthbull Economybull Energy efficiency initiatives
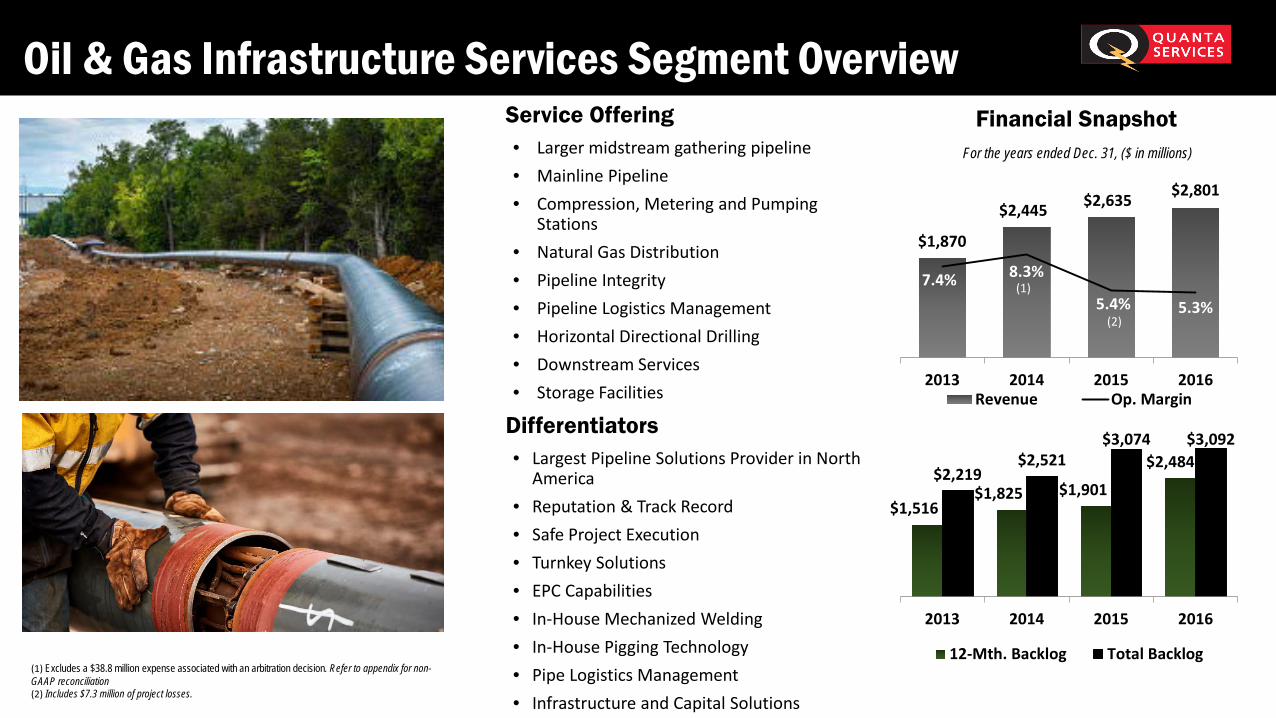
Oil amp Gas Infrastructure Services Segment Overview
$1870
$2445 $2635 $2801
74 83
54 53
2013 2014 2015 2016Revenue Op Margin
(1) Excludes a $388 million expense associated with an arbitration decision Refer to appendix for non-GAAP reconciliation(2) Includes $73 million of project losses
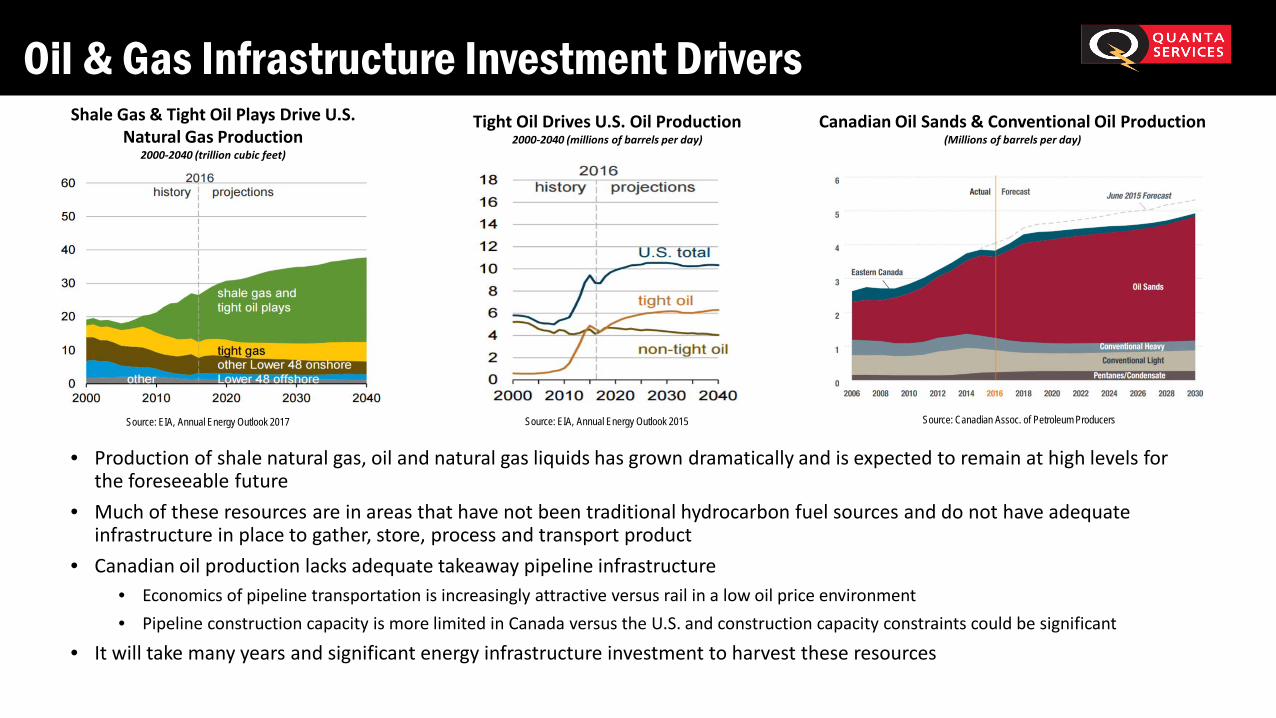
bull Production of shale natural gas oil and natural gas liquids has grown dramatically and is expected to remain at high levels forthe foreseeable future
bull Much of these resources are in areas that have not been traditional hydrocarbon fuel sources and do not have adequate infrastructure in place to gather store process and transport product
bull Canadian oil production lacks adequate takeaway pipeline infrastructurebull Economics of pipeline transportation is increasingly attractive versus rail in a low oil price environmentbull Pipeline construction capacity is more limited in Canada versus the US and construction capacity constraints could be significant
bull It will take many years and significant energy infrastructure investment to harvest these resources
Shale Gas amp Tight Oil Plays Drive US Natural Gas Production
2000-2040 (trillion cubic feet)
Source EIA Annual Energy Outlook 2017
Tight Oil Drives US Oil Production2000-2040 (millions of barrels per day)
Source EIA Annual Energy Outlook 2015
Canadian Oil Sands amp Conventional Oil Production(Millions of barrels per day)
Source Canadian Assoc of Petroleum Producers
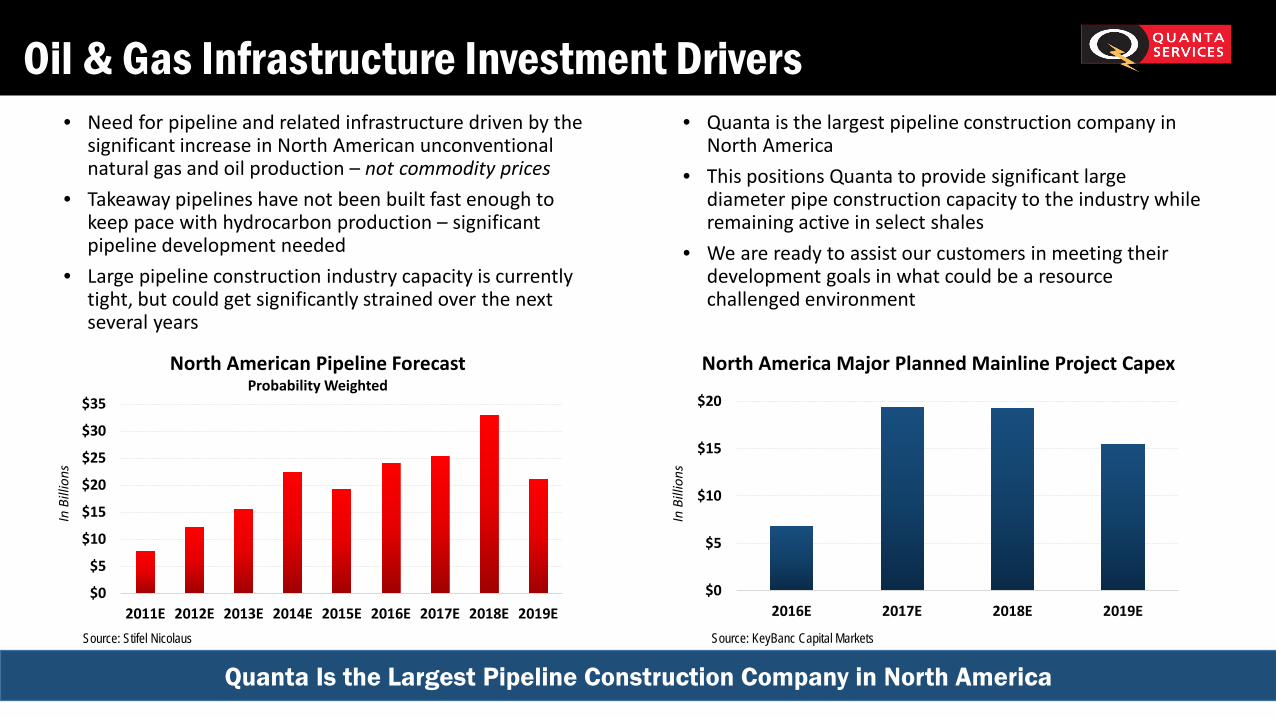
Oil amp Gas Infrastructure Investment Driversbull Need for pipeline and related infrastructure driven by the
significant increase in North American unconventional natural gas and oil production ndash not commodity prices
bull Takeaway pipelines have not been built fast enough to keep pace with hydrocarbon production ndash significant pipeline development needed
bull Large pipeline construction industry capacity is currently tight but could get significantly strained over the next several years
North American Pipeline ForecastProbability Weighted
Quanta Is the Largest Pipeline Construction Company in North America
bull Quanta is the largest pipeline construction company in North America
bull This positions Quanta to provide significant large diameter pipe construction capacity to the industry while remaining active in select shales
bull We are ready to assist our customers in meeting their development goals in what could be a resource challenged environment
North America Major Planned Mainline Project Capex
Source KeyBanc Capital Markets
$0
$5
$10
$15
$20
2016E 2017E 2018E 2019E
In B
illio
ns
In B
illio
ns
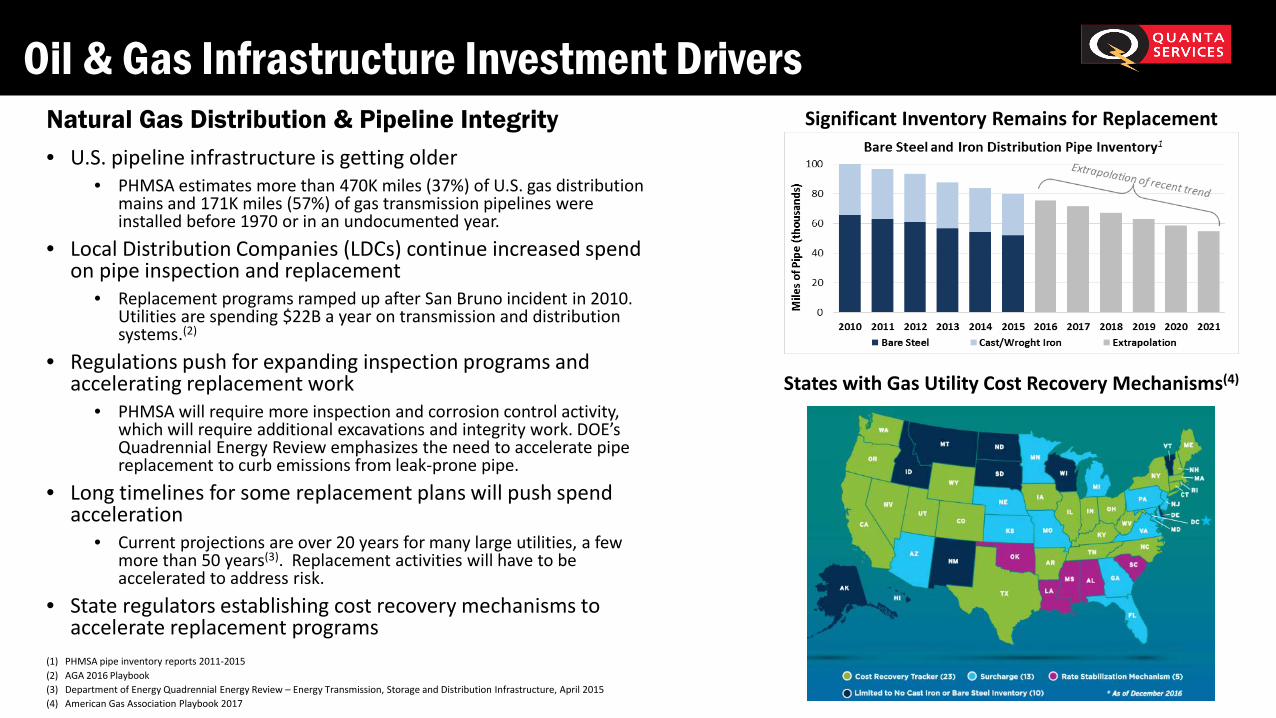
Oil amp Gas Infrastructure Investment DriversNatural Gas Distribution amp Pipeline Integritybull US pipeline infrastructure is getting older
bull PHMSA estimates more than 470K miles (37) of US gas distribution mains and 171K miles (57) of gas transmission pipelines were installed before 1970 or in an undocumented year
bull Local Distribution Companies (LDCs) continue increased spend on pipe inspection and replacement
bull Replacement programs ramped up after San Bruno incident in 2010 Utilities are spending $22B a year on transmission and distribution systems(2)
bull Regulations push for expanding inspection programs and accelerating replacement work
bull PHMSA will require more inspection and corrosion control activity which will require additional excavations and integrity work DOErsquos Quadrennial Energy Review emphasizes the need to accelerate pipe replacement to curb emissions from leak-prone pipe
bull Long timelines for some replacement plans will push spend acceleration
bull Current projections are over 20 years for many large utilities a few more than 50 years(3) Replacement activities will have to be accelerated to address risk
bull State regulators establishing cost recovery mechanisms to accelerate replacement programs
Significant Inventory Remains for Replacement
States with Gas Utility Cost Recovery Mechanisms(4)
(1) PHMSA pipe inventory reports 2011-2015(2) AGA 2016 Playbook (3) Department of Energy Quadrennial Energy Review ndash Energy Transmission Storage and Distribution Infrastructure April 2015 (4) American Gas Association Playbook 2017
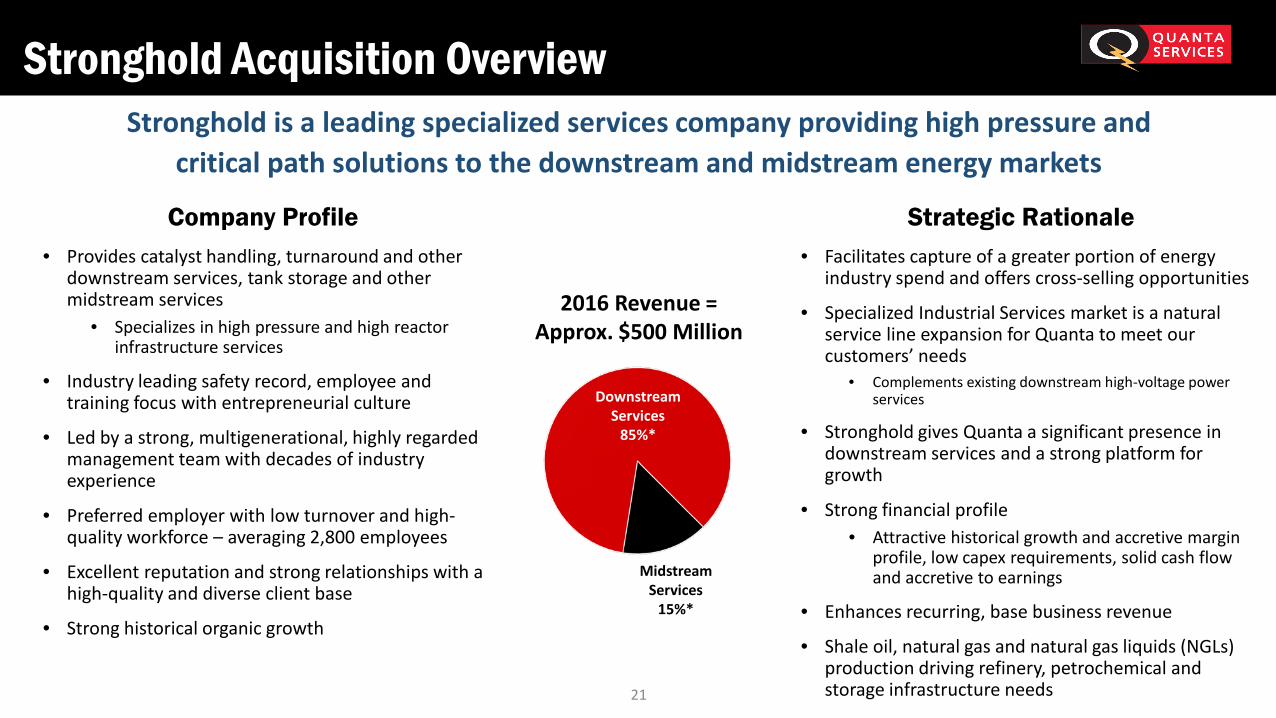
Stronghold Acquisition Overview
bull Provides catalyst handling turnaround and other downstream services tank storage and other midstream services
bull Specializes in high pressure and high reactor infrastructure services
bull Industry leading safety record employee and training focus with entrepreneurial culture
bull Led by a strong multigenerational highly regarded management team with decades of industry experience
bull Preferred employer with low turnover and high-quality workforce ndash averaging 2800 employees
bull Excellent reputation and strong relationships with a high-quality and diverse client base
bull Strong historical organic growth
21
Stronghold is a leading specialized services company providing high pressure and critical path solutions to the downstream and midstream energy markets
Company Profile
2016 Revenue =Approx $500 Million
Downstream Services
85
Midstream Services
15
Strategic Rationalebull Facilitates capture of a greater portion of energy
industry spend and offers cross-selling opportunities
bull Specialized Industrial Services market is a natural service line expansion for Quanta to meet our customersrsquo needs
bull Complements existing downstream high-voltage power services
bull Stronghold gives Quanta a significant presence in downstream services and a strong platform for growth
bull Strong financial profilebull Attractive historical growth and accretive margin
profile low capex requirements solid cash flow and accretive to earnings
bull Enhances recurring base business revenue
bull Shale oil natural gas and natural gas liquids (NGLs) production driving refinery petrochemical and storage infrastructure needs
Telecom Infrastructure Services Overview
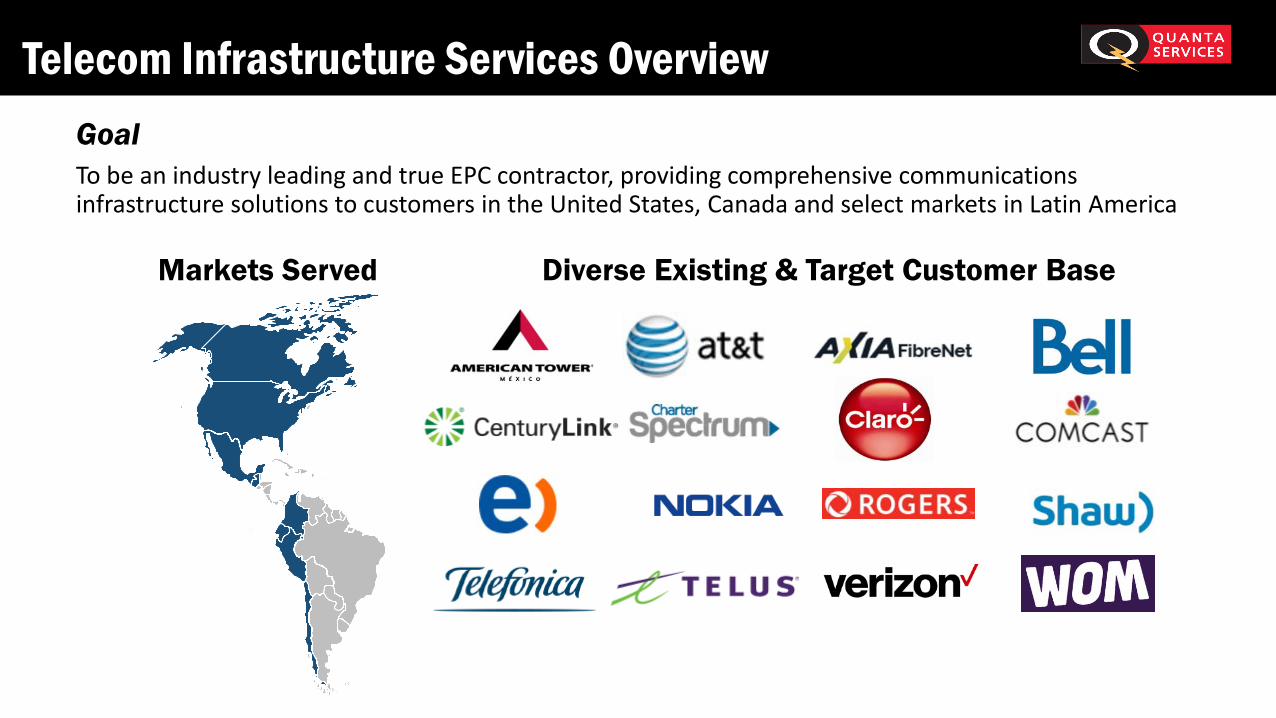
To be an industry leading and true EPC contractor providing comprehensive communications infrastructure solutions to customers in the United States Canada and select markets in Latin America
Goal
Diverse Existing amp Target Customer BaseMarkets Served
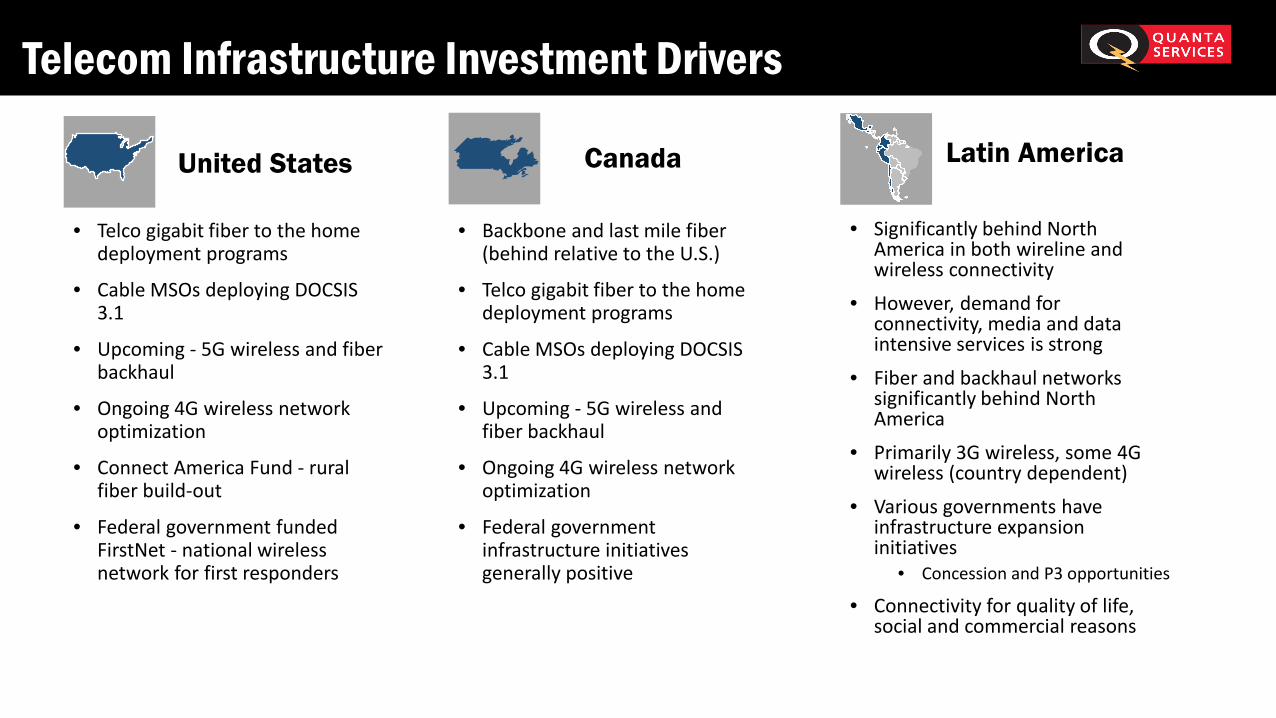
Telecom Infrastructure Investment Drivers
bull Telco gigabit fiber to the home deployment programs
bull Cable MSOs deploying DOCSIS 31
bull Upcoming - 5G wireless and fiber backhaul
bull Ongoing 4G wireless network optimization
bull Connect America Fund - rural fiber build-out
bull Federal government funded FirstNet - national wireless network for first responders
United States
bull Backbone and last mile fiber (behind relative to the US)
bull Telco gigabit fiber to the home deployment programs
bull Cable MSOs deploying DOCSIS 31
bull Upcoming - 5G wireless and fiber backhaul
bull Ongoing 4G wireless network optimization
bull Federal government infrastructure initiatives generally positive
Canada
bull Significantly behind North America in both wireline and wireless connectivity
bull However demand for connectivity media and data intensive services is strong
bull Fiber and backhaul networks significantly behind North America
bull Primarily 3G wireless some 4G wireless (country dependent)
bull Various governments have infrastructure expansion initiatives
bull Concession and P3 opportunities
bull Connectivity for quality of life social and commercial reasons
Latin America
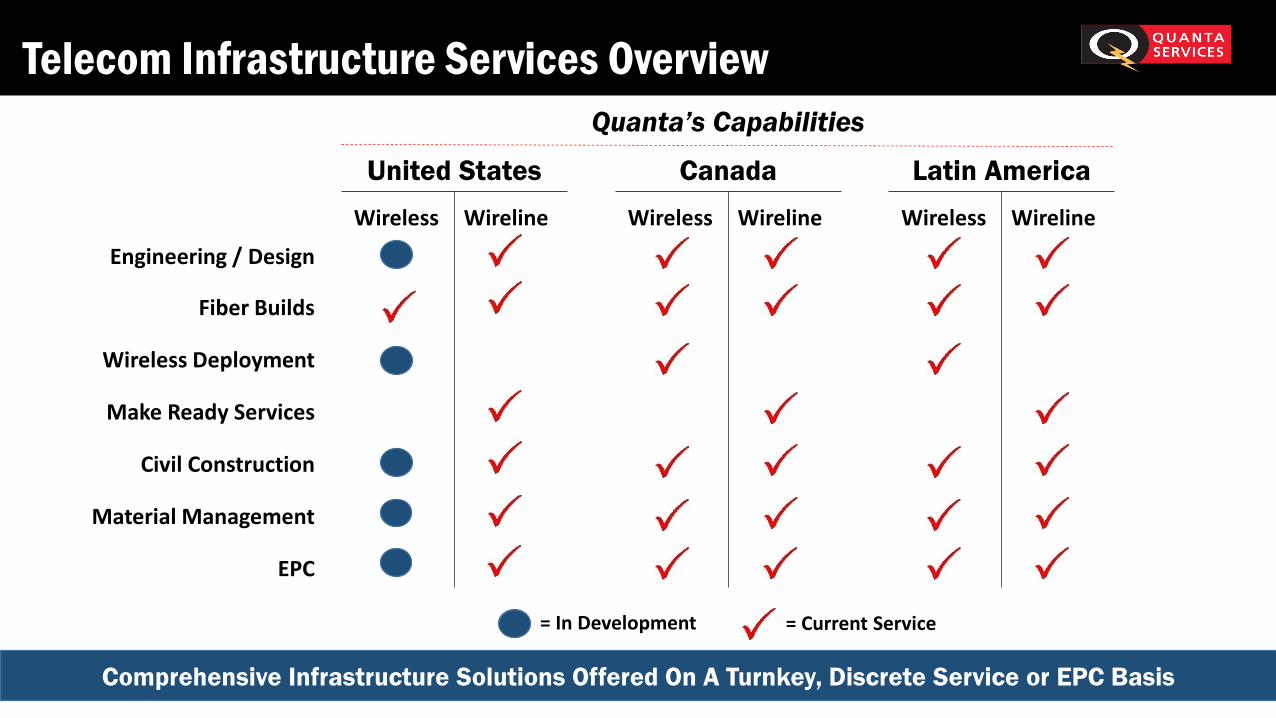
Telecom Infrastructure Services Overview
Fiber Builds
Wireless Deployment
Make Ready Services
Civil Construction
Engineering Design
Material Management
EPC
Wireless Wireline
United StatesWireless Wireline
CanadaWireless Wireline
Latin America
Comprehensive Infrastructure Solutions Offered On A Turnkey Discrete Service or EPC Basis
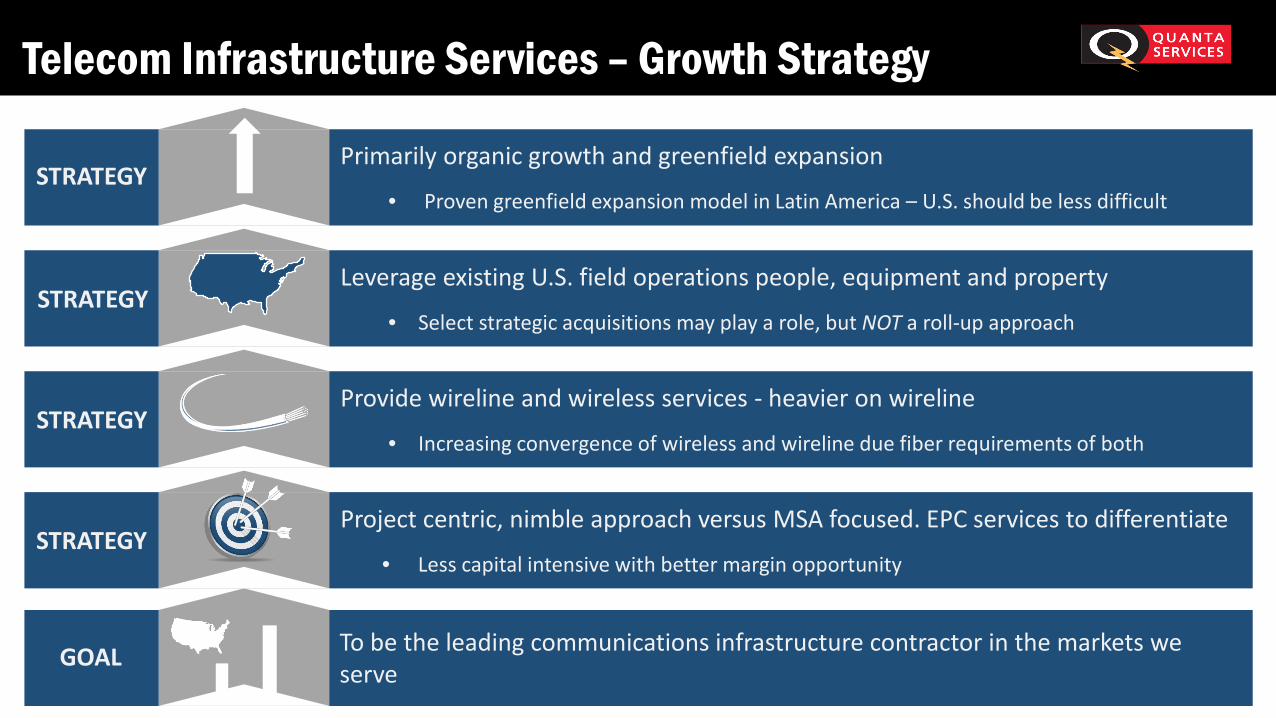
bull Proven greenfield expansion model in Latin America ndash US should be less difficult
Leverage existing US field operations people equipment and property
bull Select strategic acquisitions may play a role but NOT a roll-up approach
Provide wireline and wireless services - heavier on wireline
bull Increasing convergence of wireless and wireline due fiber requirements of both
Project centric nimble approach versus MSA focused EPC services to differentiate
bull Less capital intensive with better margin opportunity
GOAL
STRATEGY
STRATEGY
STRATEGY
STRATEGY
To be the leading communications infrastructure contractor in the markets we serve
Engineer Procure Construct (EPC) Is A Differentiator
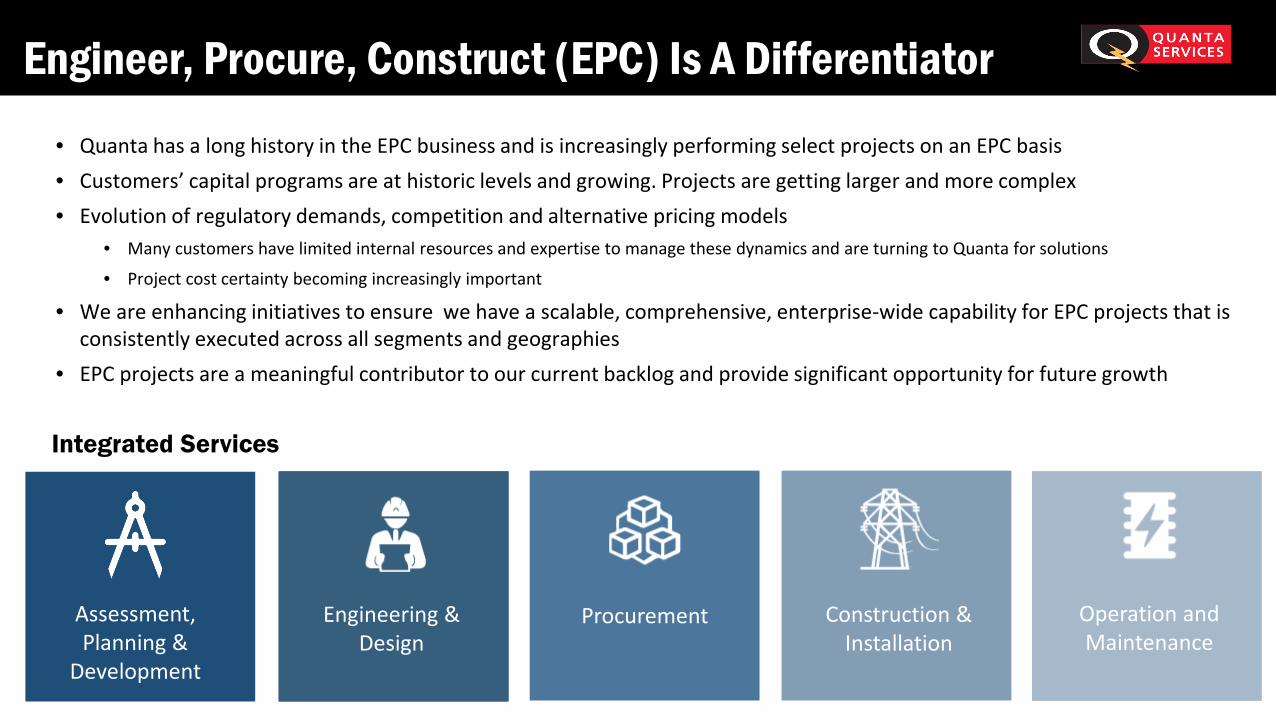
bull Quanta has a long history in the EPC business and is increasingly performing select projects on an EPC basisbull Customersrsquo capital programs are at historic levels and growing Projects are getting larger and more complexbull Evolution of regulatory demands competition and alternative pricing models
bull Many customers have limited internal resources and expertise to manage these dynamics and are turning to Quanta for solutions
bull Project cost certainty becoming increasingly important
bull We are enhancing initiatives to ensure we have a scalable comprehensive enterprise-wide capability for EPC projects that is consistently executed across all segments and geographies
bull EPC projects are a meaningful contributor to our current backlog and provide significant opportunity for future growth
Integrated Services
Construction amp Installation
Assessment Planning amp
Development
Engineering amp Design
Procurement Operation and Maintenance
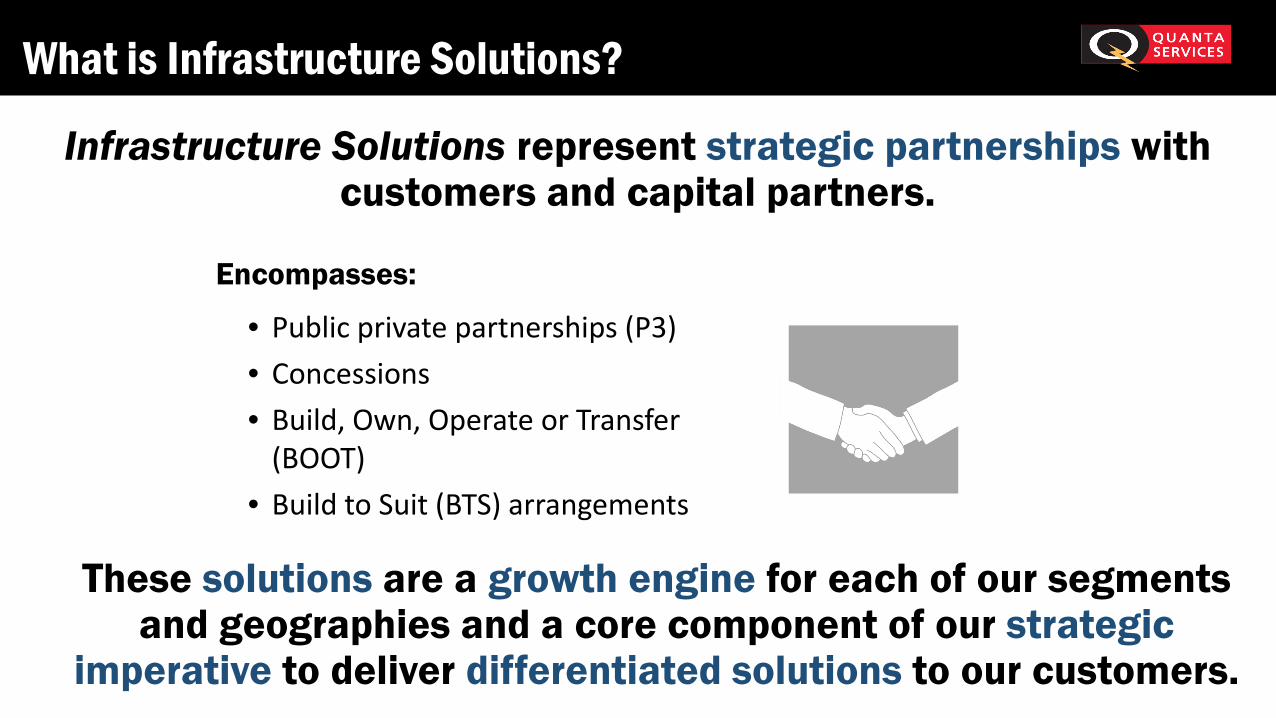
What is Infrastructure Solutions
Infrastructure Solutions represent strategic partnerships with customers and capital partners
bull Public private partnerships (P3)bull Concessionsbull Build Own Operate or Transfer
(BOOT)bull Build to Suit (BTS) arrangements
These solutions are a growth engine for each of our segments and geographies and a core component of our strategic
imperative to deliver differentiated solutions to our customers
Encompasses
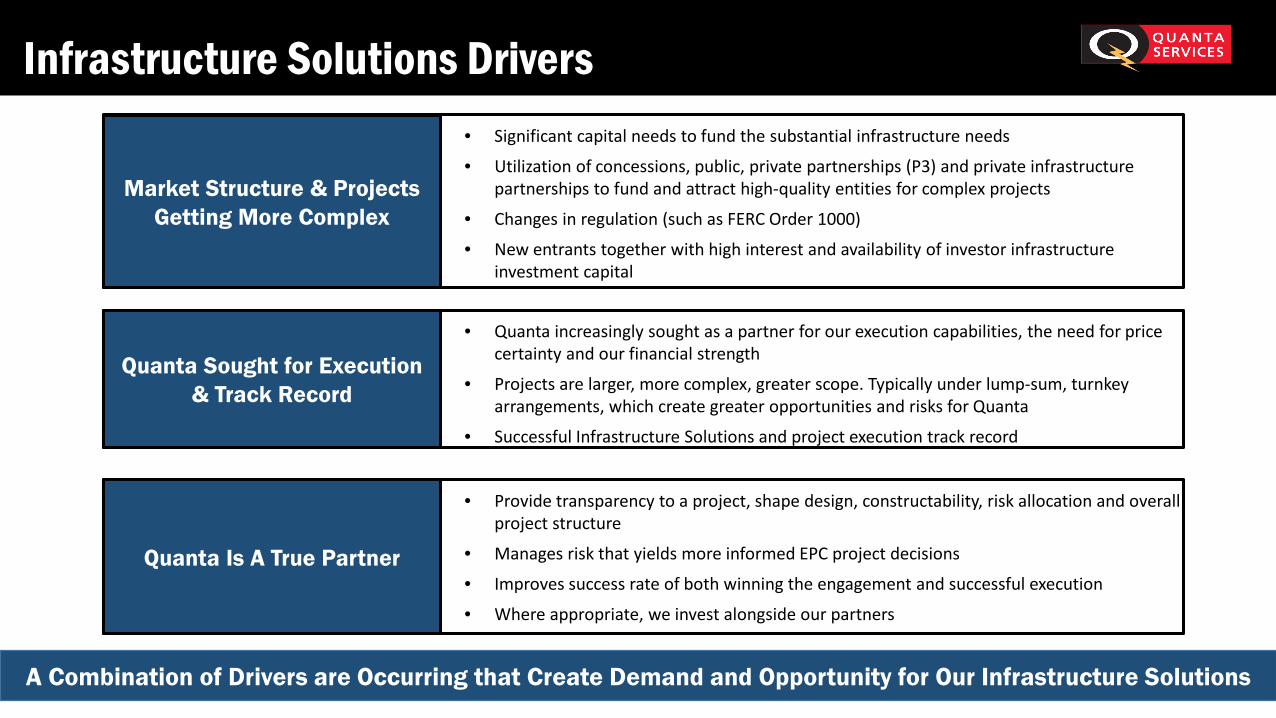
Infrastructure Solutions Drivers
A Combination of Drivers are Occurring that Create Demand and Opportunity for Our Infrastructure Solutions
bull Provide transparency to a project shape design constructability risk allocation and overall project structure
bull Manages risk that yields more informed EPC project decisions
bull Improves success rate of both winning the engagement and successful execution
bull Where appropriate we invest alongside our partners
bull Significant capital needs to fund the substantial infrastructure needs
bull Utilization of concessions public private partnerships (P3) and private infrastructure partnerships to fund and attract high-quality entities for complex projects
bull Changes in regulation (such as FERC Order 1000)
bull New entrants together with high interest and availability of investor infrastructure investment capital
Quanta Is A True Partner
bull Quanta increasingly sought as a partner for our execution capabilities the need for price certainty and our financial strength
bull Projects are larger more complex greater scope Typically under lump-sum turnkey arrangements which create greater opportunities and risks for Quanta
bull Successful Infrastructure Solutions and project execution track record
Quanta Sought for Executionamp Track Record
Market Structure amp Projects Getting More Complex
29
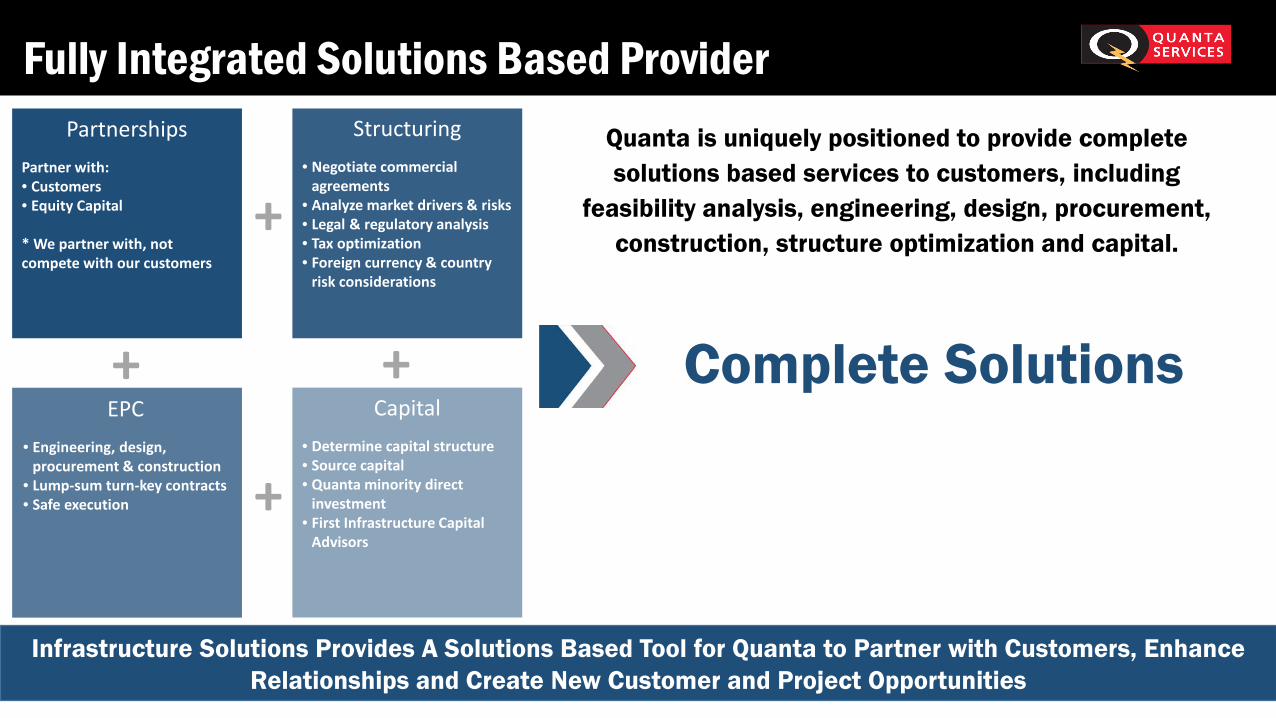
Fully Integrated Solutions Based Provider
Infrastructure Solutions Provides A Solutions Based Tool for Quanta to Partner with Customers Enhance Relationships and Create New Customer and Project Opportunities
EPC
Capitalbull Determine capital structurebull Source capitalbull Quanta minority direct
investmentbull First Infrastructure Capital
Advisors
PartnershipsPartner withbull Customersbull Equity Capital
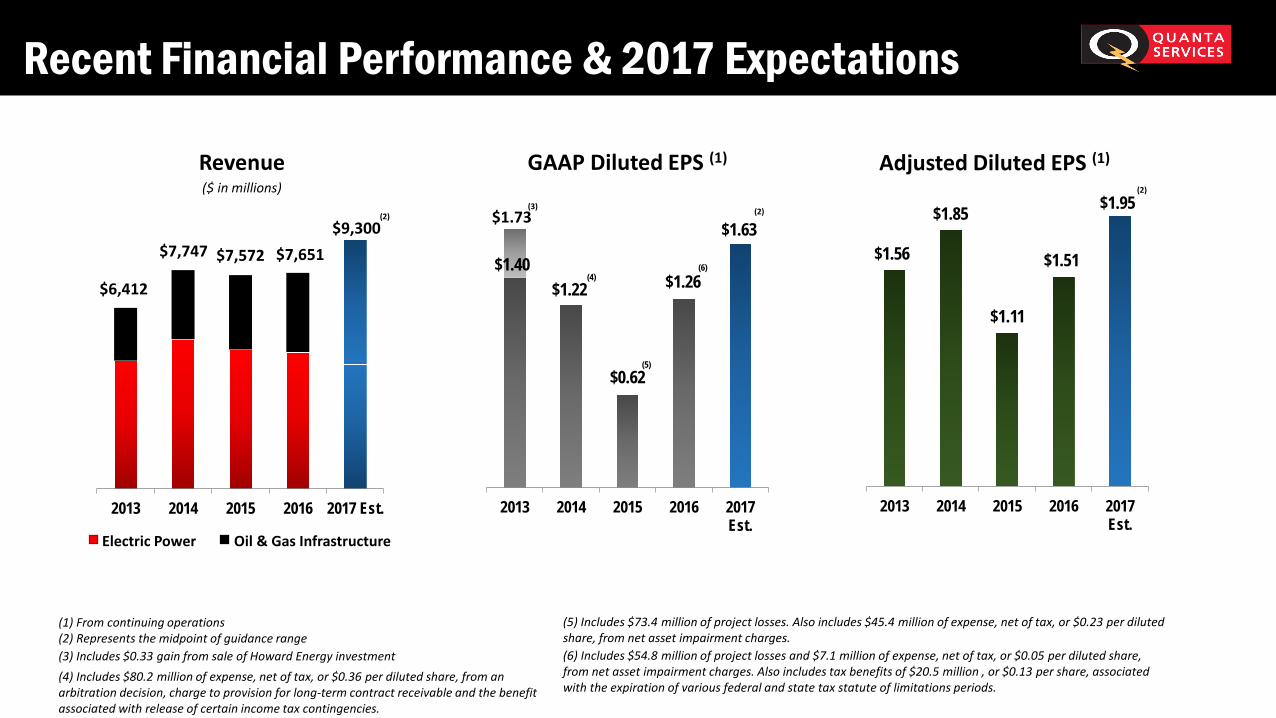
(4) Includes $802 million of expense net of tax or $036 per diluted share from an arbitration decision charge to provision for long-term contract receivable and the benefit associated with release of certain income tax contingencies
2013 2014 2015 2016 2017 Est
($ in millions)Revenue
$140$122
$062
$126
$163
2013 2014 2015 2016 2017Est
(4)
(5)
(6)
Electric Power Oil amp Gas Infrastructure
GAAP Diluted EPS (1)
$156
$185
$111
$151
$195
2013 2014 2015 2016 2017Est
Adjusted Diluted EPS (1)
$6412
(2) Represents the midpoint of guidance range
(2)
$7747
(2) (2) $173
(3) Includes $033 gain from sale of Howard Energy investment
$9300(3)
(1) From continuing operations
$7572
(5) Includes $734 million of project losses Also includes $454 million of expense net of tax or $023 per diluted share from net asset impairment charges
$7651
(6) Includes $548 million of project losses and $71 million of expense net of tax or $005 per diluted share from net asset impairment charges Also includes tax benefits of $205 million or $013 per share associated with the expiration of various federal and state tax statute of limitations periods
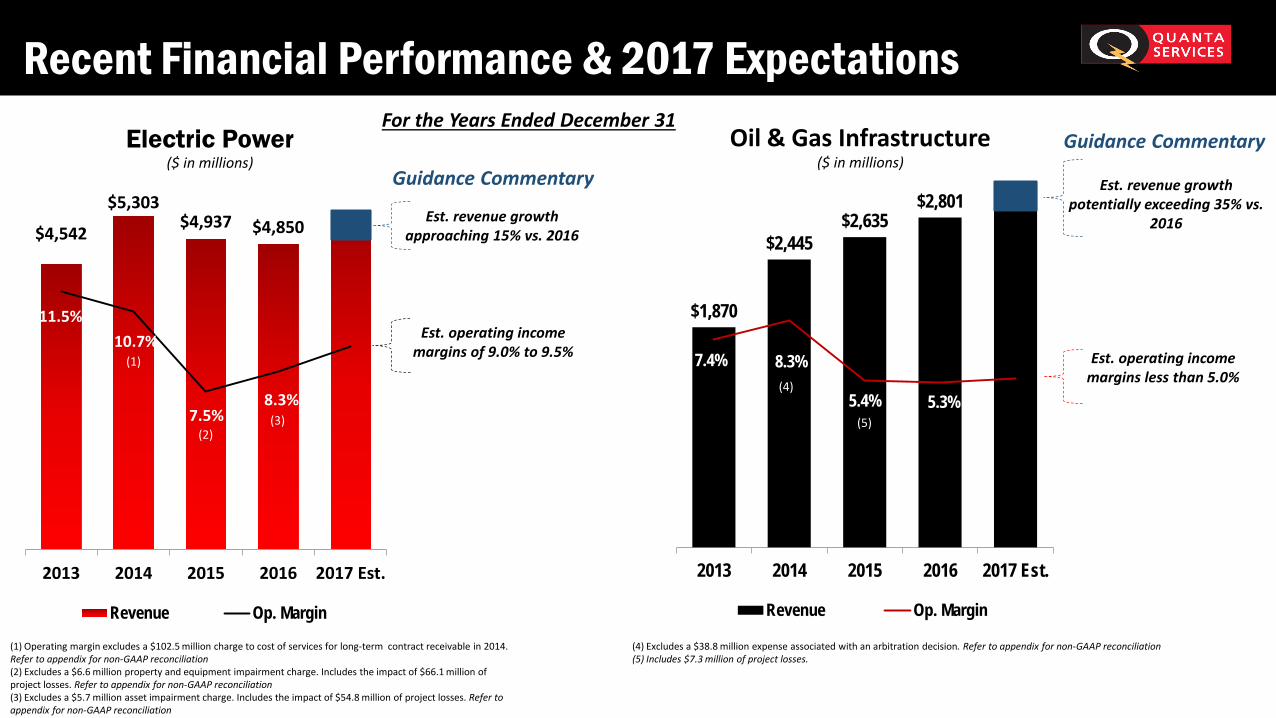
Recent Financial Performance amp 2017 ExpectationsFor the Years Ended December 31
($ in millions)Electric Power
$4542
$5303$4937 $4850
115107
7583
2013 2014 2015 2016 2017 Est
Revenue Op Margin
(2)
(1) Operating margin excludes a $1025 million charge to cost of services for long-term contract receivable in 2014 Refer to appendix for non-GAAP reconciliation(2) Excludes a $66 million property and equipment impairment charge Includes the impact of $661 million of project losses Refer to appendix for non-GAAP reconciliation(3) Excludes a $57 million asset impairment charge Includes the impact of $548 million of project losses Refer to appendix for non-GAAP reconciliation
(1) (1)
(2)(3)
f Est revenue growth approaching 15 vs 2016
Est operating incomemargins of 90 to 95
Guidance Commentary($ in millions)
Oil amp Gas Infrastructure
(4) Excludes a $388 million expense associated with an arbitration decision Refer to appendix for non-GAAP reconciliation(5) Includes $73 million of project losses
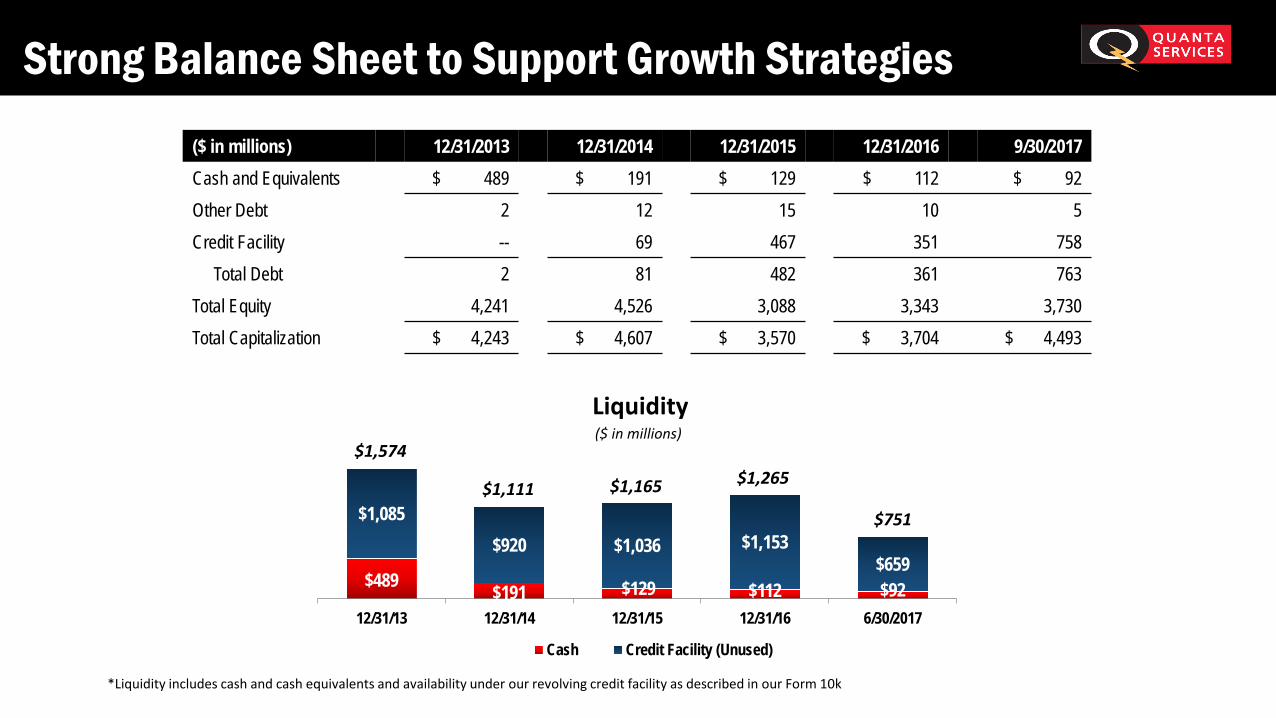
Liquidity includes cash and cash equivalents and availability under our revolving credit facility as described in our Form 10k
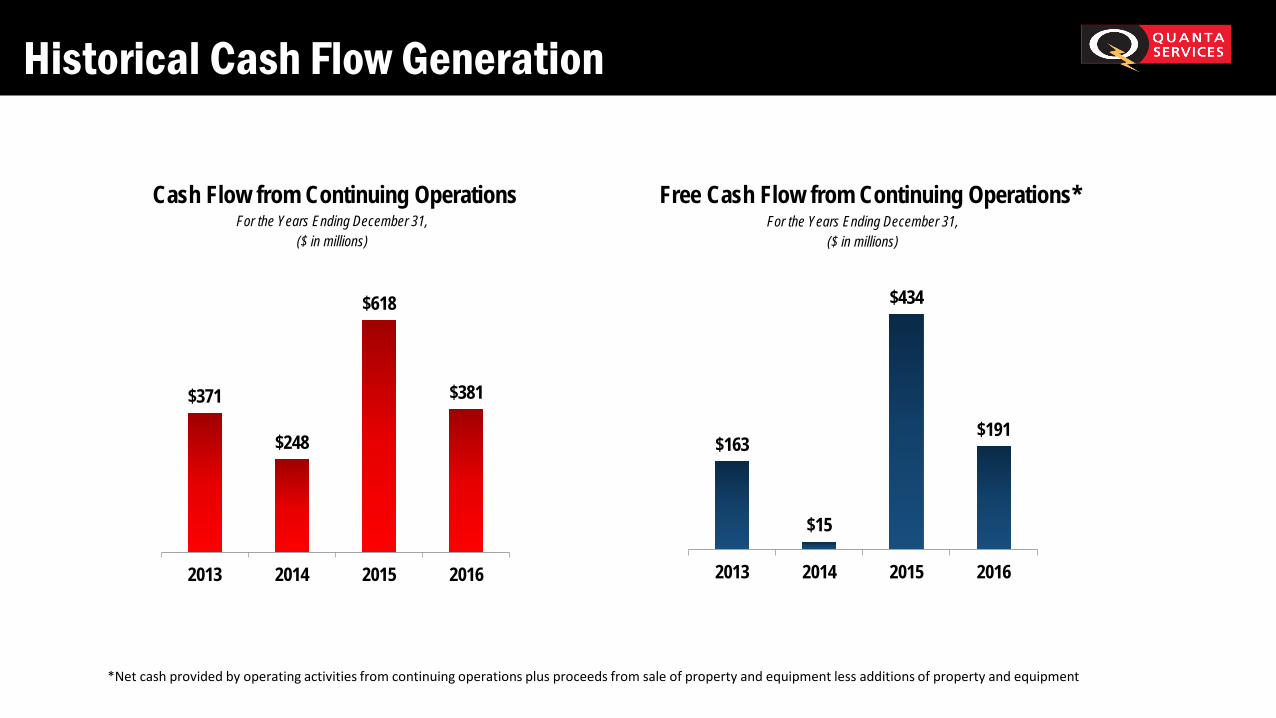
Historical Cash Flow Generation
$163
$15
$434
$191
2013 2014 2015 2016
Cash Flow from Continuing Operations
($ in millions)
Free Cash Flow from Continuing Operations
$371
$248
$618
$381
2013 2014 2015 2016
Net cash provided by operating activities from continuing operations plus proceeds from sale of property and equipment less additions of property and equipment
For the Years Ending December 31($ in millions)
For the Years Ending December 31
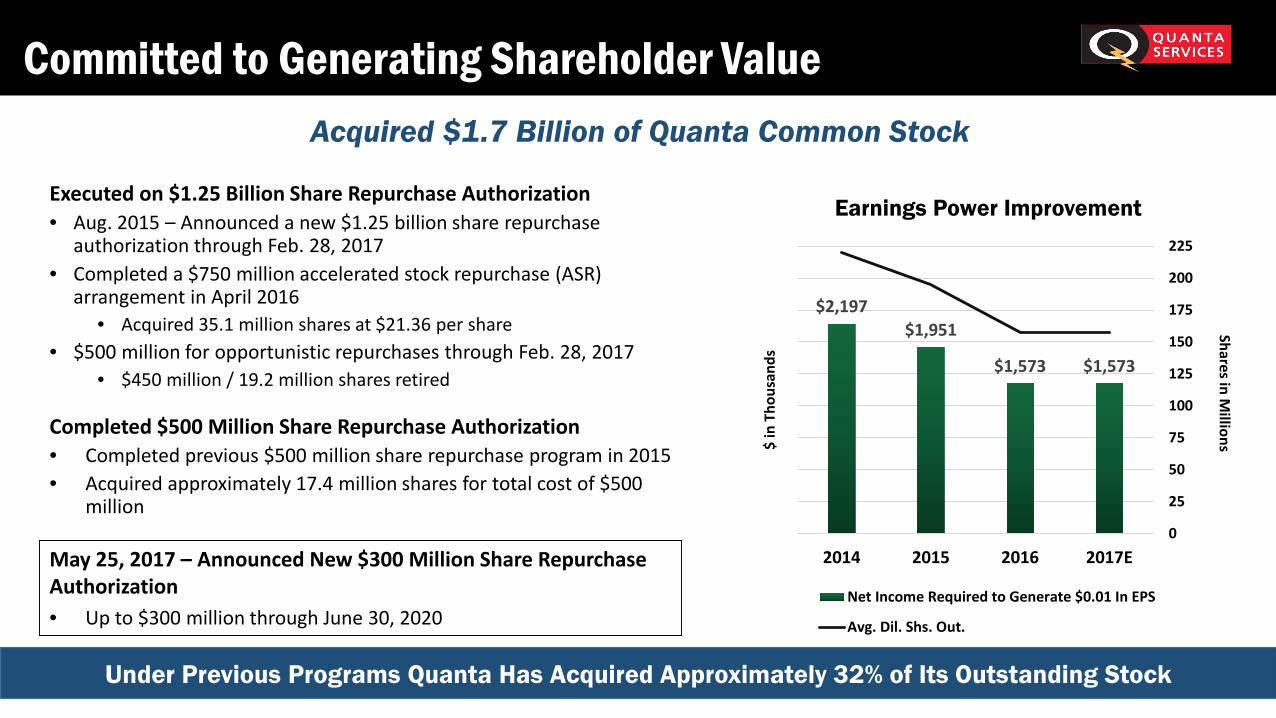
Committed to Generating Shareholder Value
Executed on $125 Billion Share Repurchase Authorizationbull Aug 2015 ndash Announced a new $125 billion share repurchase
authorization through Feb 28 2017bull Completed a $750 million accelerated stock repurchase (ASR)
arrangement in April 2016bull Acquired 351 million shares at $2136 per share
bull $500 million for opportunistic repurchases through Feb 28 2017bull $450 million 192 million shares retired
Completed $500 Million Share Repurchase Authorizationbull Completed previous $500 million share repurchase program in 2015bull Acquired approximately 174 million shares for total cost of $500
million
Acquired $17 Billion of Quanta Common Stock
Under Previous Programs Quanta Has Acquired Approximately 32 of Its Outstanding Stock
$2197$1951
$1573 $1573
0
25
50
75
100
125
150
175
200
225
$0000
$500000
$1000000
$1500000
$2000000
$2500000
$3000000
2014 2015 2016 2017E
Net Income Required to Generate $001 In EPS
Avg Dil Shs Out
Earnings Power Improvement
$ in
Tho
usan
ds
Shares in Millions
May 25 2017 ndash Announced New $300 Million Share Repurchase Authorizationbull Up to $300 million through June 30 2020
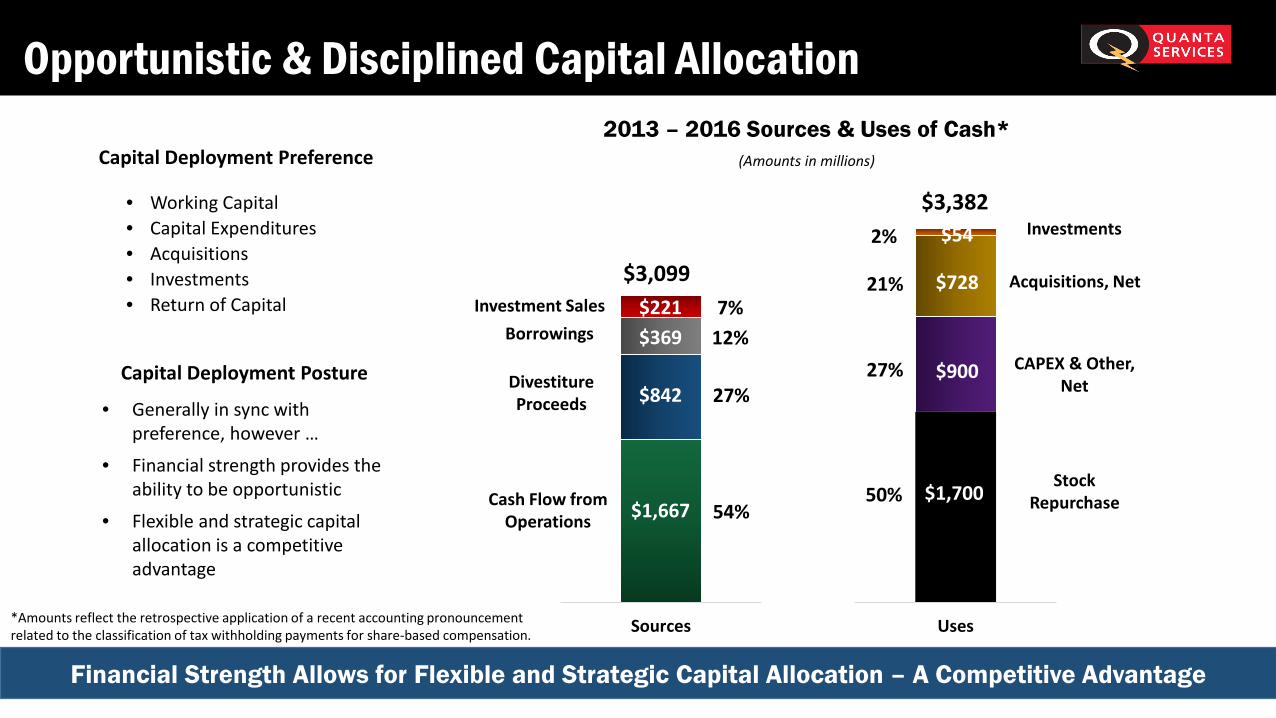
Opportunistic amp Disciplined Capital Allocation
Capital Deployment Preference (Amounts in millions)
bull Working Capitalbull Capital Expendituresbull Acquisitionsbull Investmentsbull Return of Capital
bull Generally in sync with preference however hellip
bull Financial strength provides the ability to be opportunistic
bull Flexible and strategic capital allocation is a competitive advantage
Capital Deployment Posture
Financial Strength Allows for Flexible and Strategic Capital Allocation ndash A Competitive Advantage
2013 ndash 2016 Sources amp Uses of Cash
Sources
Cash Flow fromOperations
DivestitureProceeds
BorrowingsInvestment Sales
$3099
$1667
$842
$369$221
Uses
StockRepurchase
CAPEX amp OtherNet
Acquisitions Net
Investments
$1700
$900
$728
$54$3382
54
27
127
50
27
21
2
Amounts reflect the retrospective application of a recent accounting pronouncement related to the classification of tax withholding payments for share-based compensation
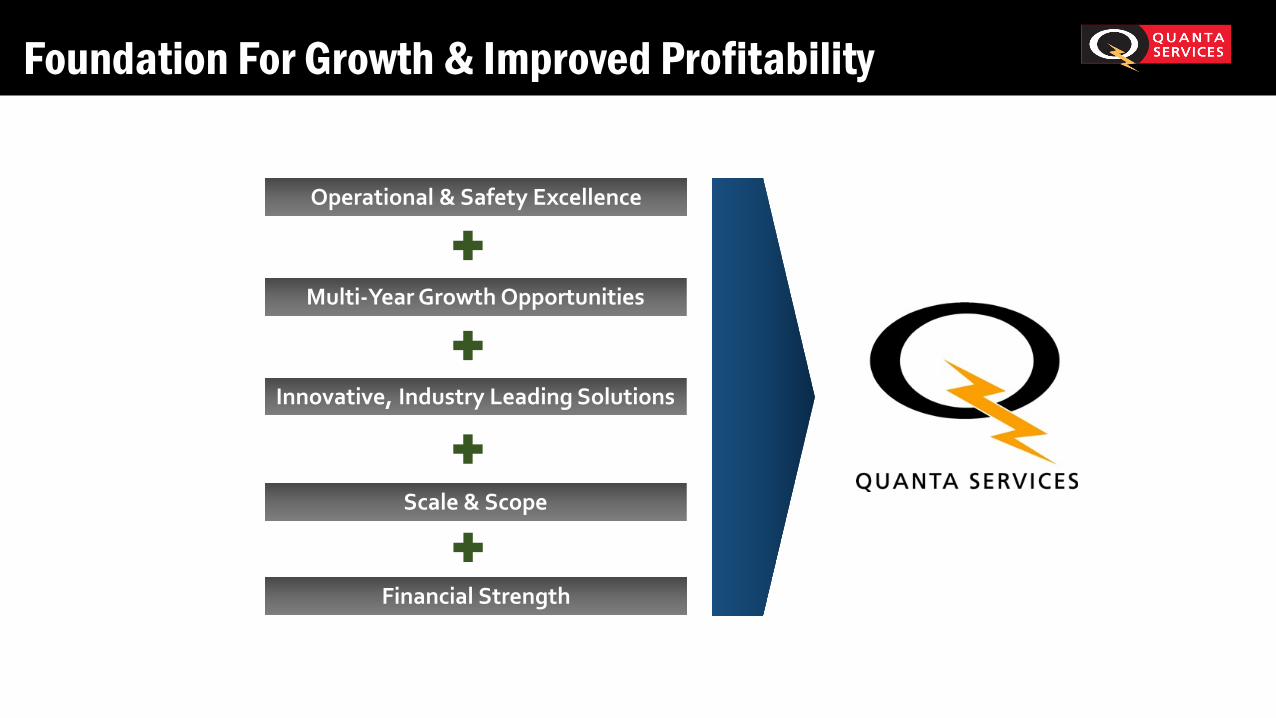
Foundation For Growth amp Improved Profitability
Multi-Year Growth Opportunities
Innovative Industry Leading Solutions
Scale amp Scope
Financial Strength
Operational amp Safety Excellence
QuantaServicesIR
QuantaIR
Connect With Quanta Services Investor Relations
Corporate Office2800 Post Oak Blvd Suite 2600Houston TX 77056713-629-7600wwwquantaservicescom
Investor ContactKip Rupp CFAVice President ndash Investor Relations713-341-7260investorsquantaservicescom
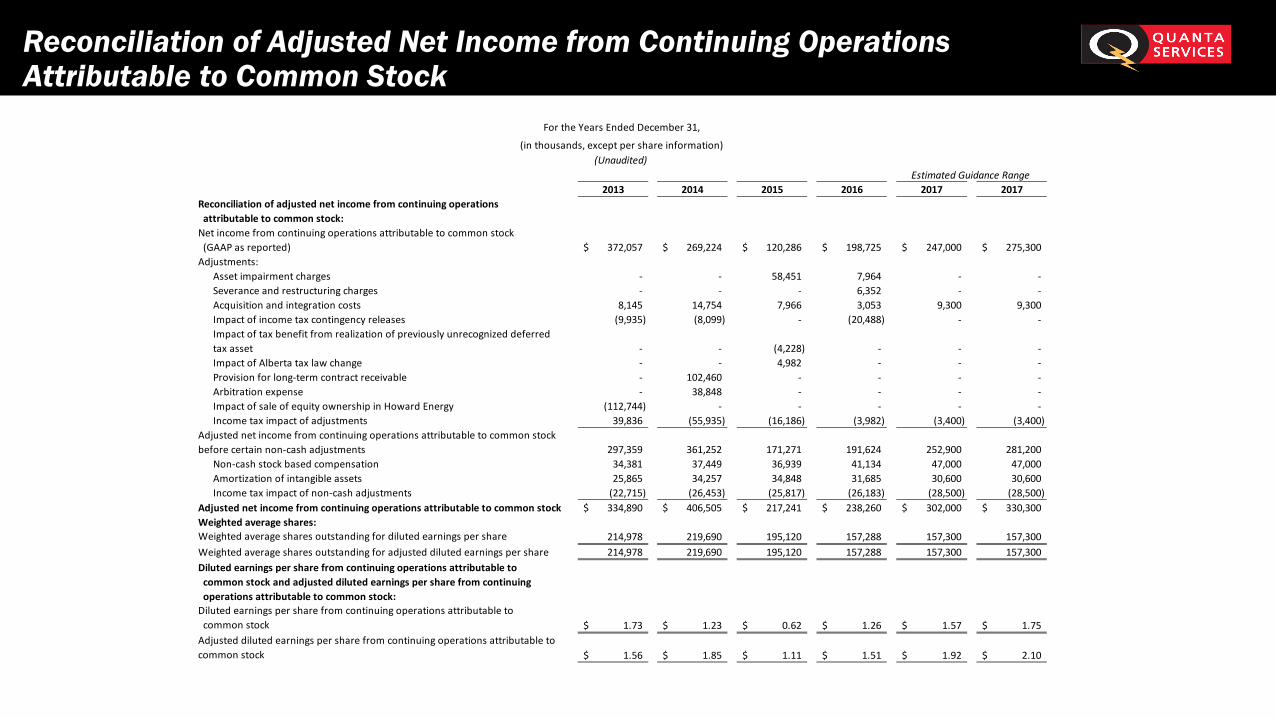
Reconciliation of Adjusted Net Income from Continuing Operations Attributable to Common Stock
2013 2014 2015 2016 2017 2017Reconciliation of adjusted net income from continuing operations attributable to common stockNet income from continuing operations attributable to common stock (GAAP as reported) 372057$ 269224$ 120286$ 198725$ 247000$ 275300$ Adjustments
Asset impairment charges - - 58451 7964 - -Severance and restructuring charges - - - 6352 - -Acquisition and integration costs 8145 14754 7966 3053 9300 9300 Impact of income tax contingency releases (9935) (8099) - (20488) - -Impact of tax benefit from realization of previously unrecognized deferred tax asset - - (4228) - - -Impact of Alberta tax law change - - 4982 - - -Provision for long-term contract receivable - 102460 - - - -Arbitration expense - 38848 - - - -Impact of sale of equity ownership in Howard Energy (112744) - - - - -Income tax impact of adjustments 39836 (55935) (16186) (3982) (3400) (3400)
Adjusted net income from continuing operations attributable to common stock before certain non-cash adjustments 297359 361252 171271 191624 252900 281200
Non-cash stock based compensation 34381 37449 36939 41134 47000 47000 Amortization of intangible assets 25865 34257 34848 31685 30600 30600 Income tax impact of non-cash adjustments (22715) (26453) (25817) (26183) (28500) (28500)
Adjusted net income from continuing operations attributable to common stock 334890$ 406505$ 217241$ 238260$ 302000$ 330300$ Weighted average sharesWeighted average shares outstanding for diluted earnings per share 214978 219690 195120 157288 157300 157300 Weighted average shares outstanding for adjusted diluted earnings per share 214978 219690 195120 157288 157300 157300 Diluted earnings per share from continuing operations attributable to common stock and adjusted diluted earnings per share from continuing operations attributable to common stockDiluted earnings per share from continuing operations attributable to common stock 173$ 123$ 062$ 126$ 157$ 175$ Adjusted diluted earnings per share from continuing operations attributable to common stock 156$ 185$ 111$ 151$ 192$ 210$
Estimated Guidance Range
For the Years Ended December 31
(in thousands except per share information)(Unaudited)
Recast of Adjusted Diluted
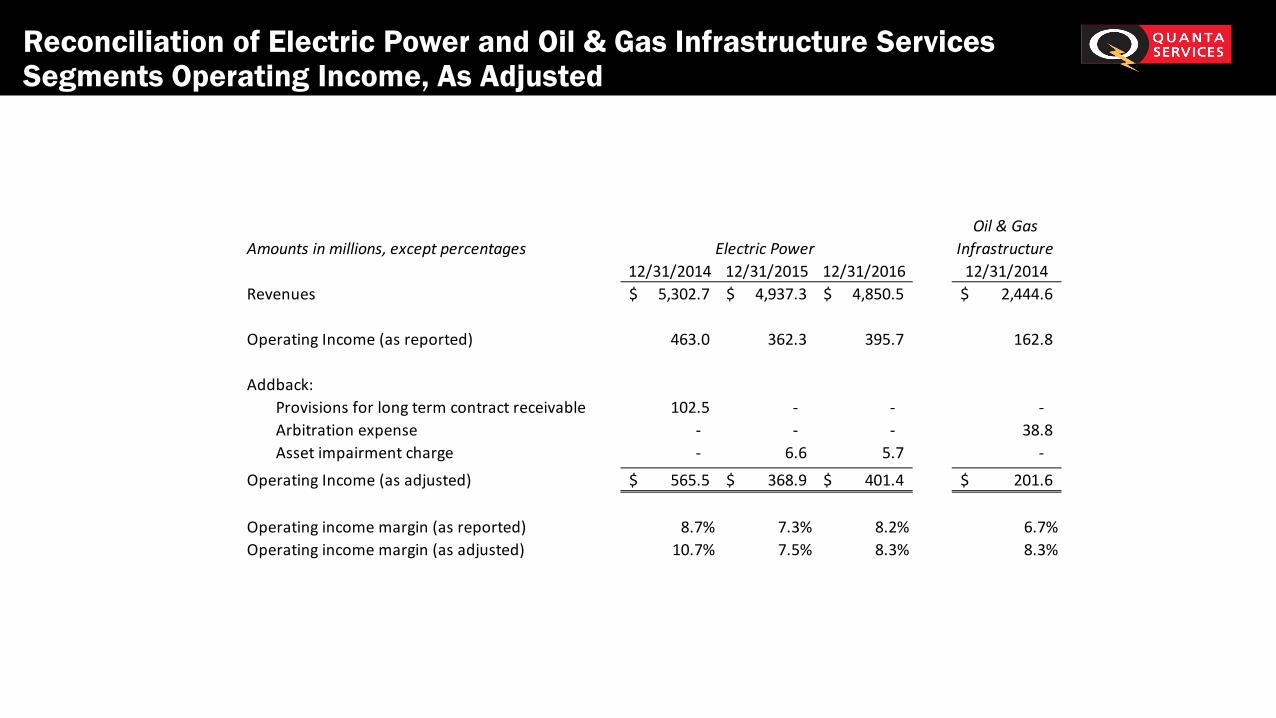
Reconciliation of Electric Power and Oil amp Gas Infrastructure Services Segments Operating Income As Adjusted
Amounts in millions except percentagesOil amp Gas
Infrastructure12312014 12312015 12312016 12312014
Revenues 53027$ 49373$ 48505$ 24446$
Operating Income (as reported) 4630 3623 3957 1628
Addback Provisions for long term contract receivable 1025 - - - Arbitration expense - - - 388 Asset impairment charge - 66 57 -
Operating Income (as adjusted) 5655$ 3689$ 4014$ 2016$
Operating income margin (as reported) 87 73 82 67Operating income margin (as adjusted) 107 75 83 83
Electric Power
Sheet1
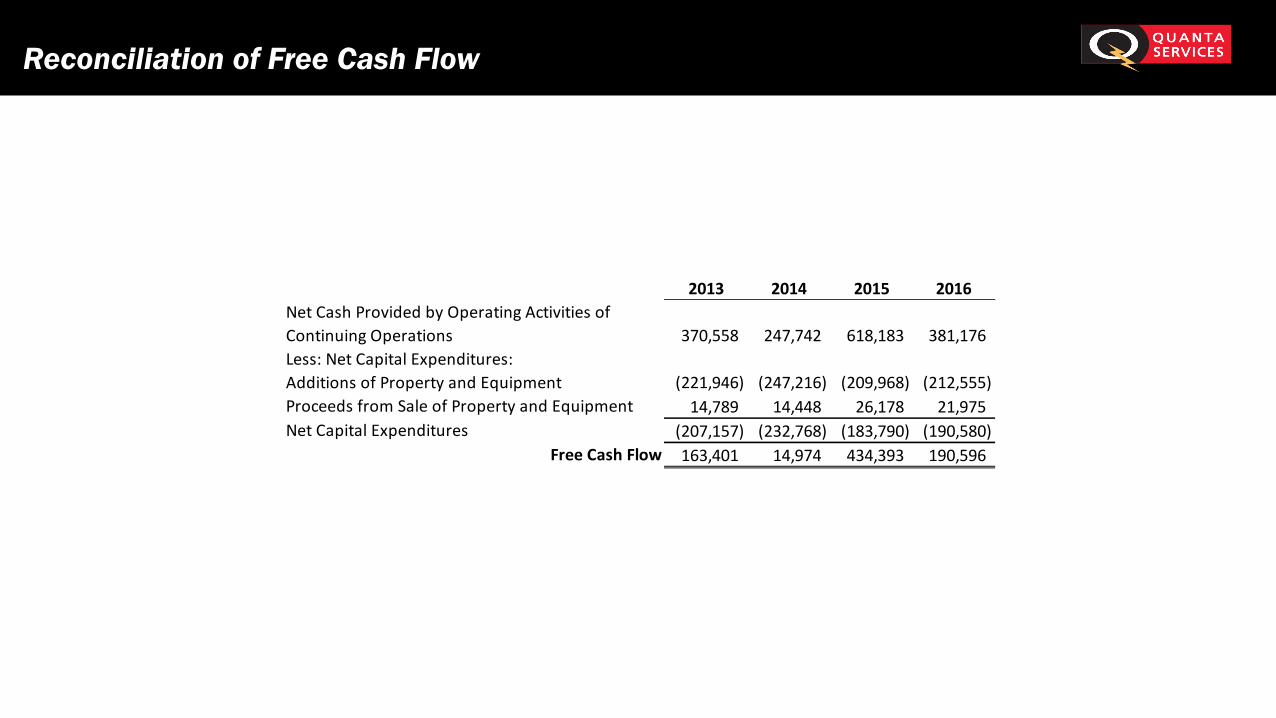
Reconciliation of Free Cash Flow
2013 2014 2015 2016Net Cash Provided by Operating Activities of Continuing Operations 370558 247742 618183 381176 Less Net Capital ExpendituresAdditions of Property and Equipment (221946) (247216) (209968) (212555) Proceeds from Sale of Property and Equipment 14789 14448 26178 21975 Net Capital Expenditures (207157) (232768) (183790) (190580)
Free Cash Flow 163401 14974 434393 190596
Free Cash Flow from Cont Ops
Forward Looking Statement DisclaimerThis presentation (and oral statements regarding the subject matter of this presentation) includes ldquoforward-looking statementsrdquo intended to qualify for the safe harbor from liability established by the Private Securities Litigation Reform Act of 1995 These statements reflect assumptions expectations projections intentions or beliefs about future events and use words such as anticipate estimate project forecast may will should could expect believe plan intend and other words of similar meaning You can identify these statements by the fact that they do not relate strictly to historical or current facts In particular these include but are not limited to statements relating to the following
bull Projected revenues net income earnings per share attributable to common stock backlog margins capital expenditures weighted average shares outstanding tax rates and other projections of operating or financial resultsbull Our business or financial outlook growth or opportunities in particular marketsbull The potential benefits from acquisitions and investmentsbull The expected financial and operational performance of acquired businessesbull Future capital allocation initiativesbull Our ability to deliver increased value and return capital to stockholders bull The strategic use of our balance sheetbull The expected value of contracts or intended contracts with customersbull The scope services term and results of any projects awarded or expected to be awarded for services to be provided by usbull The anticipated commencement and completion dates for any projects awardedbull The development of larger electric transmission and oil and natural gas pipeline projects and the level of oil natural gas and natural gas liquids prices and their impact on our business or the demand for our services bull The impact of existing or potential energy legislation bull Potential opportunities that may be indicated by bidding activity or discussions with customersbull The expected outcome of pending or threatened litigation bull Beliefs and assumptions about the collectability of receivablesbull The business plans or financial condition of our customersbull Our plans and strategies bull The current economic and regulatory conditions and trends in the industries we serve bull Possible recovery on pending or contemplated change orders or affirmative claims against customers or third parties and bull Other statements reflecting expectations intentions assumptions or beliefs about future events and other statements that do not relate strictly to historical or current facts
Although our management believes that the expectations reflected in such forward-looking statements are reasonable it can give no assurance that such expectations will prove to be correct These forward-looking statements are not guarantees of future performance and involve or rely on a number of risks uncertainties and assumptions that are difficult to predict or beyond our control These forward-looking statements reflect our beliefs and assumptions based on information available to our management at the time the statements are made We caution you that actual outcomes and results may differ materially from what is expressed implied or forecasted by our forward-looking statements and that any or all of our forward-looking statements may turn out to be wrong Forward-looking statements can be affected by inaccurate assumptions and by known or unknown risks and uncertainties including the following
bull Market conditionsbull The effects of industry economic financial or political conditions outside our control including weakness in capital marketsbull Quarterly variations in our operating resultsbull Trends and growth opportunities in relevant marketsbull The cost of borrowing availability of credit and cash fluctuations in the price and volume of our common stock debt covenant compliance interest rate fluctuations and other factors affecting our financing and investing activitiesbull Delays reductions in scope or cancellations of anticipated pending or existing projects including as a result of weather regulatory or permitting issues environmental processes project performance issues claimed force majeure events or our customers capital
constraintsbull The successful negotiation execution performance and completion of anticipated pending and existing contracts including the ability to obtain awards of projects on which we bid or are otherwise discussing with customersbull Our ability to retain key personnel and qualified employees
Forward Looking Statement Disclaimerbull Our ability to attract or the potential shortage of skilled labor bull Our dependence on fixed price contracts and the potential to incur losses with respect to the contractsbull Estimates relating to our use of percentage-of-completion accountingbull Adverse weatherbull Our ability to generate internal growthbull Competition in our business including our ability to effectively compete for new projects and market sharebull The effect of natural gas natural gas liquids and oil prices on our operations and growth opportunities and on
our customersrsquo capital programs and demand for our servicesbull The future development of natural resourcesbull The failure of existing or potential legislative actions to result in demand for our servicesbull Liabilities associated with multiemployer pension plans including underfunding of liabilities and termination
or withdrawal liabilitiesbull The possibility of further increases in the liability associated with our withdrawal from a multiemployer
pension planbull Unexpected costs or liabilities that may arise from pending or threatened litigation indemnity obligations or
other claims asserted against us including liabilities for claims that are self-insured or uninsuredbull The outcome of pending or threatened litigationbull Risks relating to the potential unavailability or cancellation of third party insurance the exclusion of coverage
for certain losses and potential increases in premiums for coverage deemed beneficial to usbull Cancellation provisions within our contracts and the risk that contracts expire and are not renewed or are
replaced on less favorable termsbull Loss of customers with whom we have long-standing or significant relationshipsbull The potential that participation in joint ventures or similar structures exposes us to liability andor harm to
our reputation for acts or omissions by our partnersbull Our inability or failure to comply with the terms of our contracts which may result in additional costs
unexcused delays warranty claims failure to meet performance guarantees damages or contract terminations
bull The inability or refusal of our customers to pay for services including the failure to collect outstanding receivables
bull The failure to recover on payment claims against project owners or third party contractors or to obtain adequate compensation for customer-requested change orders
bull The failure of our customers to comply with regulatory requirements applicable to their projects which may result in project delays and cancellations
bull Budgetary or other constraints that may reduce or eliminate tax incentives or government funding for projects which may result in project delays or cancellations
bull Estimates and assumptions in determining our financial results and backlogbull Our ability to realize our backlogbull Risks associated with operating in international markets including instability of foreign governments
currency fluctuations tax and investment strategies as well as compliance with foreign legal systems and cultural practices the US Foreign Corrupt Practices Act and other applicable anti-bribery and anti-corruption laws
bull Our ability to successfully identify complete integrate and realize synergies from acquisitionsbull The potential adverse impact resulting from uncertainty surrounding investments and acquisitions including
the ability to retain key personnel from the acquired businesses and the potential increase in risks already existing in our operations
bull The adverse impact of impairments of goodwill receivables property equipment and other intangible assets or investments
bull Our growth outpacing our decentralized management and infrastructurebull Requirements relating to governmental regulation and changes theretobull Inability to enforce our intellectual property rights or the obsolescence of such rightsbull Risks related to the implementation of an information technology solutionbull The impact of our unionized workforce on our operations including labor stoppages or interruptions due to
strikes or lockoutsbull Potential liabilities and other adverse effects arising from occupational health and safety mattersbull Our dependence on suppliers subcontractors equipment manufacturers and other third party contractorsbull Fluctuations of prices of certain materials used in our businessbull The ability to access sufficient funding to finance desired growth and operationsbull Our ability to obtain performance bondsbull Potential exposure to environmental liabilitiesbull Our ability to continue to meet certain requirements applicable to us and our subsidiariesbull Rapid technological and other structural changes that could reduce the demand for our servicesbull New or changed tax laws treaties or regulationsbull Increased healthcare costs arising from healthcare reform legislation or other governmental actionbull Regulatory changes that result in increased labor costsbull Significant fluctuations in foreign currency exchange rates andbull The other risks and uncertainties as are described elsewhere herein and in our Annual Report on Form 10-K for
the year ended December 31 2016 filed with the SEC and as may be detailed from time to time in our other public filings with the SEC
All of our forward-looking statements whether written or oral are expressly qualified by these cautionary statements and any other cautionary statements that may accompany such forward-looking statements or that are otherwise included in this presentation Should one or more of these risks materialize or should underlying assumptions prove incorrect actual results may vary materially from those expressed or implied in any forward-looking statements Investors are cautioned not to place undue reliance on these forward-looking statements which are current only as of this date We do not undertake and expressly disclaim any obligation to update or revise any forward-looking statements to reflect events or circumstances after the date of this presentation or otherwise and we expressly disclaim any written or oral statements made by any third party regarding the subject matter of this presentation
Slide Number 1
Forward Looking Statement Disclaimer
Key Takeaways
Leading Integrated Infrastructure Solutions Provider
Overview ndash Strategically Focused Operationally Diverse
Overview - Diverse and High Quality Customer Base
Leading Integrated Infrastructure Solutions Provider
Strategic Imperatives
Strategic Imperatives Deliver Profitable Growth
Strategic Acquisitions Criteria and Rationale
Differentiated Competitive Position ndash In the Sweet Spot
Differentiated Competitive Position ndash In the Sweet Spot
Electric Power Infrastructure Services Segment Overview
Power Grid Investment Drivers - Transmission
Power Grid Investment Drivers - Transmission
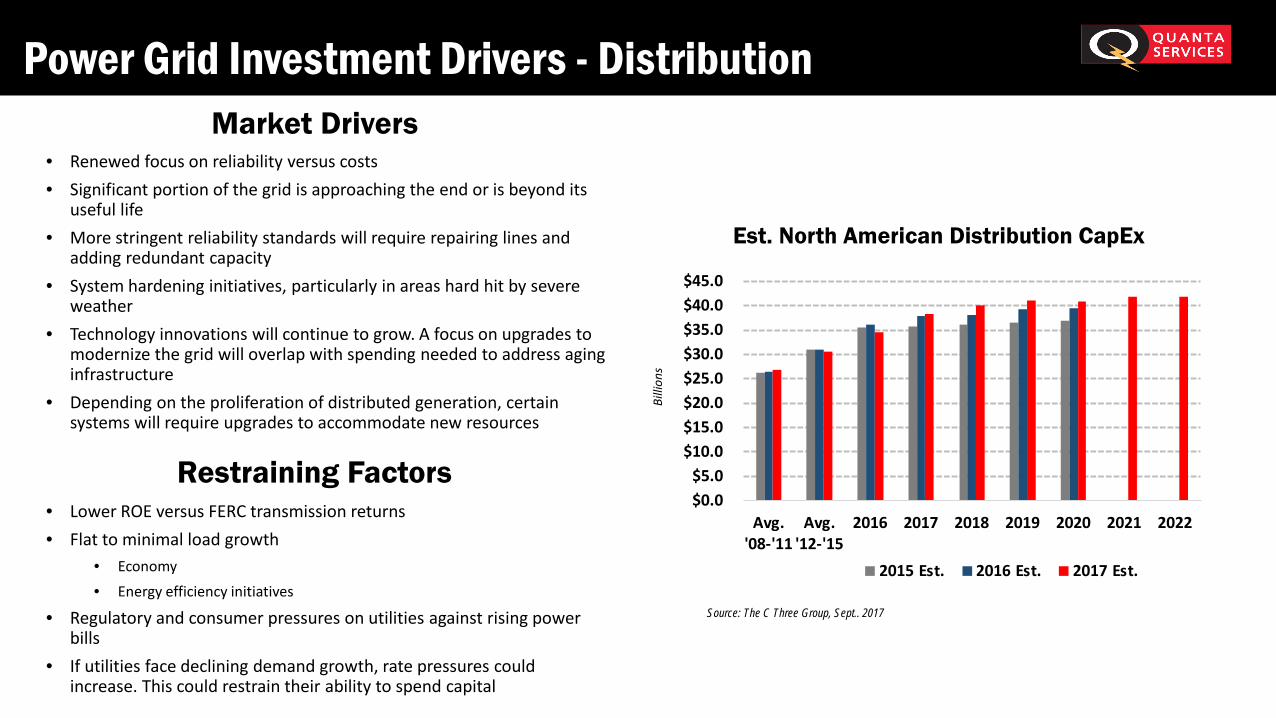
Power Grid Investment Drivers - Distribution
Oil amp Gas Infrastructure Services Segment Overview
Reconciliation of Adjusted Net Income from Continuing Operations Attributable to Common Stock
Reconciliation of Electric Power and Oil amp Gas Infrastructure Services Segments Operating Income As Adjusted
Reconciliation of Free Cash Flow
Forward Looking Statement Disclaimer
Forward Looking Statement Disclaimer
Free Cash Flow From Continuing Operations
Source
2013
2014
2015
2016
(Support Cash Flow Statement)
Net Cash Provided by Operating Activities of Continuing Operations
370558
247742
618183
381176
(Support Cash Flow Statement)
Less Net Capital Expenditures
(Support Cash Flow Statement)
Additions of Property and Equipment
(221946)
(247216)
(209968)
(212555)
(Support Cash Flow Statement)
Proceeds from Sale of Property and Equipment
14789
14448
26178
21975
(Recalculation)
Net Capital Expenditures
(207157)
(232768)
(183790)
(190580)
(Recalculation)
Free Cash Flow
163401
14974
434393
190596
Adjusted Operating Income Margin
$ in millions
Support for slide 23
Amounts in millions except percentages
Electric Power
Oil amp Gas Infrastructure
123114
123115
123116
123114
Revenues
$ 53027
$ 49373
$ 48505
$ 24446
Operating Income (as reported)
4630
3623
3957
1628
Addback
Provisions for long term contract receivable
1025
-0
-0
-0
Arbitration expense
-0
-0
-0
388
Asset impairment charge
-0
66
57
-0
Operating Income (as adjusted)
$ 5655
$ 3689
$ 4014
$ 2016
Operating income margin (as reported)
87
73
82
67
Operating income margin (as adjusted)
107
75
83
83
Quanta Services Inc and Subsidiaries
Reconciliation of Non-GAAP Financial Measures
Adjusted Diluted Earnings Per Share from Continuing Operations
For the Years Ended December 31
(in thousands except per share information)
(Unaudited)
Estimated Guidance Range
2013
2014
2015
2016
2017
2017
Reconciliation of adjusted net income from continuing operations attributable to common stock
Net income from continuing operations attributable to common stock (GAAP as reported)
$ 372057
$ 269224
$ 120286
$ 198725
$ 247000
$ 275300
Adjustments
Asset impairment charges
-
-
58451
7964
-
-
Severance and restructuring charges
-
-
-
6352
-
-
Acquisition and integration costs
8145
14754
7966
3053
9300
9300
Impact of income tax contingency releases
(9935)
(8099)
-
(20488)
-
-
Impact of tax benefit from realization of previously unrecognized deferred tax asset
-
-
(4228)
-
-
-
Impact of Alberta tax law change
-
-
4982
-
-
-
Provision for long-term contract receivable
-
102460
-
-
-
-
Arbitration expense
-
38848
-
-
-
-
Impact of sale of equity ownership in Howard Energy
(112744)
-
-
-
-
-
Income tax impact of adjustments
39836
(55935)
(16186)
(3982)
(3400)
(3400)
Adjusted net income from continuing operations attributable to common stock before certain non-cash adjustments
297359
361252
171271
191624
252900
281200
Non-cash stock based compensation
34381
37449
36939
41134
47000
47000
Amortization of intangible assets
25865
34257
34848
31685
30600
30600
Income tax impact of non-cash adjustments
(22715)
(26453)
(25817)
(26183)
(28500)
(28500)
Adjusted net income from continuing operations attributable to common stock
$ 334890
$ 406505
$ 217241
$ 238260
$ 302000
$ 330300
Weighted average shares
Weighted average shares outstanding for diluted earnings per share
214978
219690
195120
157288
157300
157300
Weighted average shares outstanding for adjusted diluted earnings per share
214978
219690
195120
157288
157300
157300
Diluted earnings per share from continuing operations attributable to common stock and adjusted diluted earnings per share from continuing operations attributable to common stock
Diluted earnings per share from continuing operations attributable to common stock
$ 173
$ 123
$ 062
$ 126
$ 157
$ 175
Adjusted diluted earnings per share from continuing operations attributable to common stock
$ 156
$ 185
$ 111
$ 151
$ 192
$ 210
2017 Forecast
2008
2009
2010
2011
2012
2013
2014
2015
2016
2017
2018
2019
2020
2021
2022
US IOU
17599783395
17375430450
17116821481
17473265629
19719353886
18593206538
21049378470
23210018195
24651006483
28003750000
29530700000
30481300000
30509750000
31231850000
31138000000
Co-ops
3679033739
3613552751
2806195753
3044502916
2639012201
3360515403
3050612075
2834000972
3277074511
3309845256
3342943708
3376373145
3410136877
3444238245
3478680628
MuniGovt Owned
2525145025
2693819865
2624788344
2608815562
2682098477
2938725525
3183015391
3330273309
3454862656
3664198000
3769427295
3778921940
3483677493
3817389338
3817389338
Canadian
3324942988
3202431553
3726264949
4213182949
4228837570
4323705834
4106960884
3465854177
3159852215
3254697600
3381315300
3453964800
3380277450
3406223700
3406223700
Total NA 2017 Market
27128905147
26885234619
26274070528
27339767056
29269302134
29216153300
31389966819
32840146653
34542795864
38232490856
40024386303
41090559885
40783841819
41899701283
41840293665
From August 2015 Report
North American Electric Distribution Spending
2008
2009
2010
2011
2012
2013
2014
2015
2016
2017
2018
2019
2020
US IOUs
$175
$173
$171
$174
$197
$186
$210
$226
$244
$244
$247
$249
$250
US Co-ops
$27
$29
$27
$29
$35
$41
$34
$39
$40
$40
$41
$42
$42
US Muni
$25
$26
$26
$28
$28
$29
$29
$30
$31
$31
$32
$32
$33
Total US
$226
$227
$224
$231
$260
$256
$273
$295
$314
$316
$320
$323
$325
Canada
$33
$33
$34
$39
$38
$39
$39
$38
$41
$41
$42
$43
$43
Total
$260
$261
$259
$269
$298
$294
$312
$333
$354
$357
$362
$365
$368
15 vs 16
$00
$01
$02
$04
($01)
($04)
$06
$04
$08
$21
$19
$28
$26
From August 2016 Report
North American Electric Distribution Spending
2008
2009
2010
2011
2012
2013
2014
2015
2016
2017
2018
2019
2020
US IOUs
$176
$174
$171
$175
$197
$186
$210
$232
$258
$270
$271
$281
$281
US Co-ops
$27
$29
$27
$29
$31
$33
$38
$39
$40
$41
$41
$42
$43
US Muni
$25
$26
$26
$28
$28
$29
$29
$30
$31
$31
$32
$33
$33
Total US
$228
$229
$224
$232
$256
$248
$277
$301
$329
$342
$344
$356
$357
Canada
$32
$32
$37
$41
$41
$42
$41
$36
$33
$36
$37
$37
$37
Total
$260
$261
$261
$273
$297
$290
$318
$337
$362
$378
$381
$393
$394
From September 2017 Report
North American Electric Distribution Spending
2008
2009
2010
2011
2012
2013
2014
2015
2016
2017
2018
2019
2020
2021
2022
US IOUs
$176
$174
$171
$175
$197
$186
$210
$232
$247
$280
$295
$305
$305
$312
$311
US Co-ops
$37
$36
$28
$30
$26
$34
$31
$28
$33
$33
$33
$34
$34
$34
$35
US Muni
$25
$27
$26
$26
$27
$29
$32
$33
$35
$37
$38
$38
$35
$38
$38
Total US
$238
$237
$225
$231
$250
$249
$273
$294
$314
$350
$366
$376
$374
$385
$384
Canada
$33
$32
$37
$42
$42
$43
$41
$35
$32
$33
$34
$35
$34
$34
$34
Total
$271
$269
$263
$273
$293
$292
$314
$328
$345
$382
$400
$411
$408
$419
$418
2015 vs 2016 vs 2017
2015 Est
2016 Est
2017 Est
Avg 08-11
$262
$264
$269
Avg 12-15
$309
$311
$307
2016
$354
$362
$345
2017
$357
$378
$382
2018
$362
$381
$400
2019
$365
$393
$411
2020
$368
$394
$408
2021
$419
2022
$418
2017
Forward Looking Statement Disclaimer
This presentation (and oral statements regarding the subject matter of this presentation) includes forward-looking statements intended to qualifyunder the ldquosafe harborrdquo from liability established by the Private Securities Litigation Reform Act of 1995 These forward-looking statements includeany statements reflecting Quantas expectations intentions strategies assumptions or beliefs about future events or performance or that do notsolely relate to historical or current facts Forward-looking statements involve certain risks uncertainties and assumptions that are difficult topredict or beyond Quantas control and actual results may differ materially from those expected implied or forecasted by our forward-lookingstatements due to inaccurate assumptions and known and unknown risk and uncertainties For additional information concerning some of therisks uncertainties and assumptions that could affect our forward-looking statements please refer to Quantarsquos Annual Report on Form 10-K for theyear ended December 31 2016 and its other documents filed with the Securities and Exchange Commission as well as the risks uncertainties andassumptions identified in this presentation Investors and analysts should not place undue reliance on Quantarsquos forward-looking statements whichare current only as of the date of this presentation Quanta does not undertake and expressly disclaims any obligation to update or revise anyforward-looking statements to reflect events or circumstances after the date of this presentation or otherwise and Quanta expressly disclaims anywritten or oral statements made by any third party regarding the subject matter of this presentation
Key TakeawaysQuanta continues to see opportunities to increase shareholder value through growth in revenues and EPS over a multi-year period
Quanta is the leading integrated infrastructure solutions provider in the markets we serve with unmatched scope and scale
We will maintain a strong financial profile to support our strategic initiatives for near- and long-term profitable growth
There is opportunity for a renewed multi-year growth cycle
Quantarsquos corporate actions demonstrate confidence in our long-term growth prospects and a commitment to generating shareholder value
Leading Integrated Infrastructure Solutions Provider
Quanta Services Is A Leading Integrated Infrastructure Solutions Provider
Who is Quanta Services Committed to the health and safety of our employees customers and community
Recognized market leader in electric power and oil and gas pipeline construction in North America
Entrepreneurial business model and culture
Broad self-performing platform developed through organic growth and acquisitions
Strong scope and scale with deep customer relationships
Revenue as reported by type of work geography contract and project type based on revenues of $7651 million for the twelve months ended Dec 31 2016 Represents the midpoint of guidance range
Estimated Revenue by Geography
United States79
LATAM amp Other3
Canada16
Australia2
Overview - Diverse and High Quality Customer Base
No single customer accounted for more than 4 of revenues in 2016
The ten largest customers accounted for approximately 32 of revenues in 2016
Strong relationships with the majority of US investor owned utilities and Canadian utilities ndash many going back for decades
Top 10
32
4
Leading Integrated Infrastructure Solutions Provider
bull Grow the base business and compliment with larger scale projects
bull Organic growth and strategic acquisitions
bull Pricing discipline and risk management
bull Focus on safe executionbull Cost managementbull Maintain financial strength
TimeRe
venu
es
Coupled with successful implementation of other strategic imperatives hellip
Larger Projects
For illustrative purposes
Strategic Acquisitions Criteria and Rationale
Acquisition Strategic Rationale
bull Acquisitions have and will continue to play a strategic role in differentiating Quanta in the marketplace and positioning the company for profitable long-term growth
bull Seek well respected entrepreneurial leadership with extensive history of operational excellencebull Only interested in companies that bring strategic value to Quanta and provide opportunity for 1+1=3 growth
opportunity over time
bull Brings leadership position in new geographybull Enhances presence and capabilities in an existing
geographybull Brings or enhances customer relationshipsbull Brings leadership position in adjacent or new
marketbull Brings unique service or technology that Quanta
can leverage to further differentiate its turnkey solution offering
Typical Deal Terms
bull Target 4x-5x EBITDA multiplebull 40 of consideration in Quanta stock 60 of
consideration in cashbull Meaningful stock component for operational and
stakeholder alignment
bull Company leadership stays on to run the businessbull Non-compete agreementsbull Stock locked up for period of time
Differentiated Competitive Position ndash In the Sweet Spot
bull Quanta is the largest infrastructure specialty contractor in North America
bull Unmatched scope providing broader solutions to customersbull Unmatched scale as the largest employer of skilled workforce in
the industry ndash more than 35000 employeesbull Track record of safe executionbull Projects are getting larger and more complex customers
increasingly seeking cost certainty and performancebull Quanta has consistently been working on numerous large
projects simultaneously for the past + six yearsbull Significant revenues from strategic relationships recurring work
and an increasing amount of negotiated work
Quanta vs Specialty Contractors Quanta vs Traditional EampCs
bull Today our customers believe skilled construction labor is a finite resource and critical to overall project success where engineering and procurement are more commoditized
bull Quanta has the largest skilled workforce in the industry ndash more than 35000 employees
bull Quanta self-performs its projects ndash controls quality and executionbull EampCs typically provide project management oversight and have
limited self-perform construction capabilitiesbull Quanta derives significant revenues from strategic relationships
recurring work and an increasing amount of negotiated workbull Price is often the primary driver of who wins EampC projects
Est Large Project Capability
Bubble Size = Avg Market Cap
0
20
40
60
80
100
Est
Self
Perfo
rm C
apab
ility
Bubble Size = Avg Market Cap
LargerSmaller
Differentiated Competitive Position ndash In the Sweet Spotbull Quanta is uniquely positioned to meet
customer needs versus both specialty contractors and traditional engineering and construction companies
bull Customers understand that skilled labor is critical to project success
bull Projects are getting larger and more complex and customers are increasingly seeking comprehensive solutions
bull Demand for specialty construction resources is high and increasing but supply is limited
bull Quanta has the largest infrastructure specialty contractor workforce in North America +35000 employees globally
bull Quanta has strategically invested in engineering and program management to provide true complete engineering procurement and construction (EPC) solutions
0
20
40
60
80
100
Est
Self
Perf
orm
Cap
abili
ty
Est Large Project Capability
Bubble Size = Avg Market Cap
LargerSmaller
Electric Power Infrastructure Services Segment Overview
$4542$5303 $4937 $4850
115 10775 83
2013 2014 2015 2016Revenue Op Margin
(2)
(1) Operating margin excludes a $1025 million charge to cost of services for long-term contract receivable in 2014 Refer to appendix for non-GAAP reconciliation(2) Excludes a $66 million property and equipment charge in 2015 and a $57 million asset impairment charge in 2016 Includes the impact of $661 million in 2015 and $548 million in 2016 of project losses Refer to appendix for non-GAAP reconciliation
Differentiatorsbull Largest TampD solutions provider in North
Americabull Reputation and Track Recordbull Unmatched Solutions Scope and Scalebull Safety Recordbull Manpower and Equipment Resourcesbull Lazy Q Training Facilitybull Energized Servicesbull EPC Capabilities Across All Offeringsbull Infrastructure Capital Solutions
Market Drivers
Power Grid Investment Drivers - Transmission
bull An aging grid that requires repair upgrade and maintenancebull Favorable transmission regulation Energy Policy Act of lsquo05
NERC Reliability Standards possibly FERC Order 1000 over the long-term
bull More stringent reliability standards will require repairing lines and adding redundant capacity
bull Coal and nuclear generation retirements and switching to natural gas and renewable generation strains the grid
bull Existing and new renewable generation needs interconnection to the grid
bull Opportunity for industrial driven load growthbull Regional grid infrastructure is too congested to get lowest-cost
power to consumersbull Sub-transmission interconnectionbull Canada has same drivers as US as well as the need to serve
mining interests and hydro generation for export to US load centers
bull Challenged economic conditions in Canada
bull Environmental and other regulatory scrutiny right of way acquisition permitting etc
bull Tepid load growthbull Economybull Energy efficiency initiatives
Oil amp Gas Infrastructure Services Segment Overview
$1870
$2445 $2635 $2801
74 83
54 53
2013 2014 2015 2016Revenue Op Margin
(1) Excludes a $388 million expense associated with an arbitration decision Refer to appendix for non-GAAP reconciliation(2) Includes $73 million of project losses
bull Production of shale natural gas oil and natural gas liquids has grown dramatically and is expected to remain at high levels forthe foreseeable future
bull Much of these resources are in areas that have not been traditional hydrocarbon fuel sources and do not have adequate infrastructure in place to gather store process and transport product
bull Canadian oil production lacks adequate takeaway pipeline infrastructurebull Economics of pipeline transportation is increasingly attractive versus rail in a low oil price environmentbull Pipeline construction capacity is more limited in Canada versus the US and construction capacity constraints could be significant
bull It will take many years and significant energy infrastructure investment to harvest these resources
Shale Gas amp Tight Oil Plays Drive US Natural Gas Production
2000-2040 (trillion cubic feet)
Source EIA Annual Energy Outlook 2017
Tight Oil Drives US Oil Production2000-2040 (millions of barrels per day)
Source EIA Annual Energy Outlook 2015
Canadian Oil Sands amp Conventional Oil Production(Millions of barrels per day)
Source Canadian Assoc of Petroleum Producers
Oil amp Gas Infrastructure Investment Driversbull Need for pipeline and related infrastructure driven by the
significant increase in North American unconventional natural gas and oil production ndash not commodity prices
bull Takeaway pipelines have not been built fast enough to keep pace with hydrocarbon production ndash significant pipeline development needed
bull Large pipeline construction industry capacity is currently tight but could get significantly strained over the next several years
North American Pipeline ForecastProbability Weighted
Quanta Is the Largest Pipeline Construction Company in North America
bull Quanta is the largest pipeline construction company in North America
bull This positions Quanta to provide significant large diameter pipe construction capacity to the industry while remaining active in select shales
bull We are ready to assist our customers in meeting their development goals in what could be a resource challenged environment
North America Major Planned Mainline Project Capex
Source KeyBanc Capital Markets
$0
$5
$10
$15
$20
2016E 2017E 2018E 2019E
In B
illio
ns
In B
illio
ns
Oil amp Gas Infrastructure Investment DriversNatural Gas Distribution amp Pipeline Integritybull US pipeline infrastructure is getting older
bull PHMSA estimates more than 470K miles (37) of US gas distribution mains and 171K miles (57) of gas transmission pipelines were installed before 1970 or in an undocumented year
bull Local Distribution Companies (LDCs) continue increased spend on pipe inspection and replacement
bull Replacement programs ramped up after San Bruno incident in 2010 Utilities are spending $22B a year on transmission and distribution systems(2)
bull Regulations push for expanding inspection programs and accelerating replacement work
bull PHMSA will require more inspection and corrosion control activity which will require additional excavations and integrity work DOErsquos Quadrennial Energy Review emphasizes the need to accelerate pipe replacement to curb emissions from leak-prone pipe
bull Long timelines for some replacement plans will push spend acceleration
bull Current projections are over 20 years for many large utilities a few more than 50 years(3) Replacement activities will have to be accelerated to address risk
bull State regulators establishing cost recovery mechanisms to accelerate replacement programs
Significant Inventory Remains for Replacement
States with Gas Utility Cost Recovery Mechanisms(4)
(1) PHMSA pipe inventory reports 2011-2015(2) AGA 2016 Playbook (3) Department of Energy Quadrennial Energy Review ndash Energy Transmission Storage and Distribution Infrastructure April 2015 (4) American Gas Association Playbook 2017
Stronghold Acquisition Overview
bull Provides catalyst handling turnaround and other downstream services tank storage and other midstream services
bull Specializes in high pressure and high reactor infrastructure services
bull Industry leading safety record employee and training focus with entrepreneurial culture
bull Led by a strong multigenerational highly regarded management team with decades of industry experience
bull Preferred employer with low turnover and high-quality workforce ndash averaging 2800 employees
bull Excellent reputation and strong relationships with a high-quality and diverse client base
bull Strong historical organic growth
21
Stronghold is a leading specialized services company providing high pressure and critical path solutions to the downstream and midstream energy markets
Company Profile
2016 Revenue =Approx $500 Million
Downstream Services
85
Midstream Services
15
Strategic Rationalebull Facilitates capture of a greater portion of energy
industry spend and offers cross-selling opportunities
bull Specialized Industrial Services market is a natural service line expansion for Quanta to meet our customersrsquo needs
bull Complements existing downstream high-voltage power services
bull Stronghold gives Quanta a significant presence in downstream services and a strong platform for growth
bull Strong financial profilebull Attractive historical growth and accretive margin
profile low capex requirements solid cash flow and accretive to earnings
bull Enhances recurring base business revenue
bull Shale oil natural gas and natural gas liquids (NGLs) production driving refinery petrochemical and storage infrastructure needs
Telecom Infrastructure Services Overview
To be an industry leading and true EPC contractor providing comprehensive communications infrastructure solutions to customers in the United States Canada and select markets in Latin America
Goal
Diverse Existing amp Target Customer BaseMarkets Served
Telecom Infrastructure Investment Drivers
bull Telco gigabit fiber to the home deployment programs
bull Cable MSOs deploying DOCSIS 31
bull Upcoming - 5G wireless and fiber backhaul
bull Ongoing 4G wireless network optimization
bull Connect America Fund - rural fiber build-out
bull Federal government funded FirstNet - national wireless network for first responders
United States
bull Backbone and last mile fiber (behind relative to the US)
bull Telco gigabit fiber to the home deployment programs
bull Cable MSOs deploying DOCSIS 31
bull Upcoming - 5G wireless and fiber backhaul
bull Ongoing 4G wireless network optimization
bull Federal government infrastructure initiatives generally positive
Canada
bull Significantly behind North America in both wireline and wireless connectivity
bull However demand for connectivity media and data intensive services is strong
bull Fiber and backhaul networks significantly behind North America
bull Primarily 3G wireless some 4G wireless (country dependent)
bull Various governments have infrastructure expansion initiatives
bull Concession and P3 opportunities
bull Connectivity for quality of life social and commercial reasons
Latin America
Telecom Infrastructure Services Overview
Fiber Builds
Wireless Deployment
Make Ready Services
Civil Construction
Engineering Design
Material Management
EPC
Wireless Wireline
United StatesWireless Wireline
CanadaWireless Wireline
Latin America
Comprehensive Infrastructure Solutions Offered On A Turnkey Discrete Service or EPC Basis
bull Proven greenfield expansion model in Latin America ndash US should be less difficult
Leverage existing US field operations people equipment and property
bull Select strategic acquisitions may play a role but NOT a roll-up approach
Provide wireline and wireless services - heavier on wireline
bull Increasing convergence of wireless and wireline due fiber requirements of both
Project centric nimble approach versus MSA focused EPC services to differentiate
bull Less capital intensive with better margin opportunity
GOAL
STRATEGY
STRATEGY
STRATEGY
STRATEGY
To be the leading communications infrastructure contractor in the markets we serve
Engineer Procure Construct (EPC) Is A Differentiator
bull Quanta has a long history in the EPC business and is increasingly performing select projects on an EPC basisbull Customersrsquo capital programs are at historic levels and growing Projects are getting larger and more complexbull Evolution of regulatory demands competition and alternative pricing models
bull Many customers have limited internal resources and expertise to manage these dynamics and are turning to Quanta for solutions
bull Project cost certainty becoming increasingly important
bull We are enhancing initiatives to ensure we have a scalable comprehensive enterprise-wide capability for EPC projects that is consistently executed across all segments and geographies
bull EPC projects are a meaningful contributor to our current backlog and provide significant opportunity for future growth
Integrated Services
Construction amp Installation
Assessment Planning amp
Development
Engineering amp Design
Procurement Operation and Maintenance
What is Infrastructure Solutions
Infrastructure Solutions represent strategic partnerships with customers and capital partners
bull Public private partnerships (P3)bull Concessionsbull Build Own Operate or Transfer
(BOOT)bull Build to Suit (BTS) arrangements
These solutions are a growth engine for each of our segments and geographies and a core component of our strategic
imperative to deliver differentiated solutions to our customers
Encompasses
Infrastructure Solutions Drivers
A Combination of Drivers are Occurring that Create Demand and Opportunity for Our Infrastructure Solutions
bull Provide transparency to a project shape design constructability risk allocation and overall project structure
bull Manages risk that yields more informed EPC project decisions
bull Improves success rate of both winning the engagement and successful execution
bull Where appropriate we invest alongside our partners
bull Significant capital needs to fund the substantial infrastructure needs
bull Utilization of concessions public private partnerships (P3) and private infrastructure partnerships to fund and attract high-quality entities for complex projects
bull Changes in regulation (such as FERC Order 1000)
bull New entrants together with high interest and availability of investor infrastructure investment capital
Quanta Is A True Partner
bull Quanta increasingly sought as a partner for our execution capabilities the need for price certainty and our financial strength
bull Projects are larger more complex greater scope Typically under lump-sum turnkey arrangements which create greater opportunities and risks for Quanta
bull Successful Infrastructure Solutions and project execution track record
Quanta Sought for Executionamp Track Record
Market Structure amp Projects Getting More Complex
29
Fully Integrated Solutions Based Provider
Infrastructure Solutions Provides A Solutions Based Tool for Quanta to Partner with Customers Enhance Relationships and Create New Customer and Project Opportunities
EPC
Capitalbull Determine capital structurebull Source capitalbull Quanta minority direct
investmentbull First Infrastructure Capital
Advisors
PartnershipsPartner withbull Customersbull Equity Capital
(4) Includes $802 million of expense net of tax or $036 per diluted share from an arbitration decision charge to provision for long-term contract receivable and the benefit associated with release of certain income tax contingencies
2013 2014 2015 2016 2017 Est
($ in millions)Revenue
$140$122
$062
$126
$163
2013 2014 2015 2016 2017Est
(4)
(5)
(6)
Electric Power Oil amp Gas Infrastructure
GAAP Diluted EPS (1)
$156
$185
$111
$151
$195
2013 2014 2015 2016 2017Est
Adjusted Diluted EPS (1)
$6412
(2) Represents the midpoint of guidance range
(2)
$7747
(2) (2) $173
(3) Includes $033 gain from sale of Howard Energy investment
$9300(3)
(1) From continuing operations
$7572
(5) Includes $734 million of project losses Also includes $454 million of expense net of tax or $023 per diluted share from net asset impairment charges
$7651
(6) Includes $548 million of project losses and $71 million of expense net of tax or $005 per diluted share from net asset impairment charges Also includes tax benefits of $205 million or $013 per share associated with the expiration of various federal and state tax statute of limitations periods
Recent Financial Performance amp 2017 ExpectationsFor the Years Ended December 31
($ in millions)Electric Power
$4542
$5303$4937 $4850
115107
7583
2013 2014 2015 2016 2017 Est
Revenue Op Margin
(2)
(1) Operating margin excludes a $1025 million charge to cost of services for long-term contract receivable in 2014 Refer to appendix for non-GAAP reconciliation(2) Excludes a $66 million property and equipment impairment charge Includes the impact of $661 million of project losses Refer to appendix for non-GAAP reconciliation(3) Excludes a $57 million asset impairment charge Includes the impact of $548 million of project losses Refer to appendix for non-GAAP reconciliation
(1) (1)
(2)(3)
f Est revenue growth approaching 15 vs 2016
Est operating incomemargins of 90 to 95
Guidance Commentary($ in millions)
Oil amp Gas Infrastructure
(4) Excludes a $388 million expense associated with an arbitration decision Refer to appendix for non-GAAP reconciliation(5) Includes $73 million of project losses
Liquidity includes cash and cash equivalents and availability under our revolving credit facility as described in our Form 10k
Historical Cash Flow Generation
$163
$15
$434
$191
2013 2014 2015 2016
Cash Flow from Continuing Operations
($ in millions)
Free Cash Flow from Continuing Operations
$371
$248
$618
$381
2013 2014 2015 2016
Net cash provided by operating activities from continuing operations plus proceeds from sale of property and equipment less additions of property and equipment
For the Years Ending December 31($ in millions)
For the Years Ending December 31
Committed to Generating Shareholder Value
Executed on $125 Billion Share Repurchase Authorizationbull Aug 2015 ndash Announced a new $125 billion share repurchase
authorization through Feb 28 2017bull Completed a $750 million accelerated stock repurchase (ASR)
arrangement in April 2016bull Acquired 351 million shares at $2136 per share
bull $500 million for opportunistic repurchases through Feb 28 2017bull $450 million 192 million shares retired
Completed $500 Million Share Repurchase Authorizationbull Completed previous $500 million share repurchase program in 2015bull Acquired approximately 174 million shares for total cost of $500
million
Acquired $17 Billion of Quanta Common Stock
Under Previous Programs Quanta Has Acquired Approximately 32 of Its Outstanding Stock
$2197$1951
$1573 $1573
0
25
50
75
100
125
150
175
200
225
$0000
$500000
$1000000
$1500000
$2000000
$2500000
$3000000
2014 2015 2016 2017E
Net Income Required to Generate $001 In EPS
Avg Dil Shs Out
Earnings Power Improvement
$ in
Tho
usan
ds
Shares in Millions
May 25 2017 ndash Announced New $300 Million Share Repurchase Authorizationbull Up to $300 million through June 30 2020
Opportunistic amp Disciplined Capital Allocation
Capital Deployment Preference (Amounts in millions)
bull Working Capitalbull Capital Expendituresbull Acquisitionsbull Investmentsbull Return of Capital
bull Generally in sync with preference however hellip
bull Financial strength provides the ability to be opportunistic
bull Flexible and strategic capital allocation is a competitive advantage
Capital Deployment Posture
Financial Strength Allows for Flexible and Strategic Capital Allocation ndash A Competitive Advantage
2013 ndash 2016 Sources amp Uses of Cash
Sources
Cash Flow fromOperations
DivestitureProceeds
BorrowingsInvestment Sales
$3099
$1667
$842
$369$221
Uses
StockRepurchase
CAPEX amp OtherNet
Acquisitions Net
Investments
$1700
$900
$728
$54$3382
54
27
127
50
27
21
2
Amounts reflect the retrospective application of a recent accounting pronouncement related to the classification of tax withholding payments for share-based compensation
Foundation For Growth amp Improved Profitability
Multi-Year Growth Opportunities
Innovative Industry Leading Solutions
Scale amp Scope
Financial Strength
Operational amp Safety Excellence
QuantaServicesIR
QuantaIR
Connect With Quanta Services Investor Relations
Corporate Office2800 Post Oak Blvd Suite 2600Houston TX 77056713-629-7600wwwquantaservicescom
Investor ContactKip Rupp CFAVice President ndash Investor Relations713-341-7260investorsquantaservicescom
Reconciliation of Adjusted Net Income from Continuing Operations Attributable to Common Stock
2013 2014 2015 2016 2017 2017Reconciliation of adjusted net income from continuing operations attributable to common stockNet income from continuing operations attributable to common stock (GAAP as reported) 372057$ 269224$ 120286$ 198725$ 247000$ 275300$ Adjustments
Asset impairment charges - - 58451 7964 - -Severance and restructuring charges - - - 6352 - -Acquisition and integration costs 8145 14754 7966 3053 9300 9300 Impact of income tax contingency releases (9935) (8099) - (20488) - -Impact of tax benefit from realization of previously unrecognized deferred tax asset - - (4228) - - -Impact of Alberta tax law change - - 4982 - - -Provision for long-term contract receivable - 102460 - - - -Arbitration expense - 38848 - - - -Impact of sale of equity ownership in Howard Energy (112744) - - - - -Income tax impact of adjustments 39836 (55935) (16186) (3982) (3400) (3400)
Adjusted net income from continuing operations attributable to common stock before certain non-cash adjustments 297359 361252 171271 191624 252900 281200
Non-cash stock based compensation 34381 37449 36939 41134 47000 47000 Amortization of intangible assets 25865 34257 34848 31685 30600 30600 Income tax impact of non-cash adjustments (22715) (26453) (25817) (26183) (28500) (28500)
Adjusted net income from continuing operations attributable to common stock 334890$ 406505$ 217241$ 238260$ 302000$ 330300$ Weighted average sharesWeighted average shares outstanding for diluted earnings per share 214978 219690 195120 157288 157300 157300 Weighted average shares outstanding for adjusted diluted earnings per share 214978 219690 195120 157288 157300 157300 Diluted earnings per share from continuing operations attributable to common stock and adjusted diluted earnings per share from continuing operations attributable to common stockDiluted earnings per share from continuing operations attributable to common stock 173$ 123$ 062$ 126$ 157$ 175$ Adjusted diluted earnings per share from continuing operations attributable to common stock 156$ 185$ 111$ 151$ 192$ 210$
Estimated Guidance Range
For the Years Ended December 31
(in thousands except per share information)(Unaudited)
Recast of Adjusted Diluted
Reconciliation of Electric Power and Oil amp Gas Infrastructure Services Segments Operating Income As Adjusted
Amounts in millions except percentagesOil amp Gas
Infrastructure12312014 12312015 12312016 12312014
Revenues 53027$ 49373$ 48505$ 24446$
Operating Income (as reported) 4630 3623 3957 1628
Addback Provisions for long term contract receivable 1025 - - - Arbitration expense - - - 388 Asset impairment charge - 66 57 -
Operating Income (as adjusted) 5655$ 3689$ 4014$ 2016$
Operating income margin (as reported) 87 73 82 67Operating income margin (as adjusted) 107 75 83 83
Electric Power
Sheet1
Reconciliation of Free Cash Flow
2013 2014 2015 2016Net Cash Provided by Operating Activities of Continuing Operations 370558 247742 618183 381176 Less Net Capital ExpendituresAdditions of Property and Equipment (221946) (247216) (209968) (212555) Proceeds from Sale of Property and Equipment 14789 14448 26178 21975 Net Capital Expenditures (207157) (232768) (183790) (190580)
Free Cash Flow 163401 14974 434393 190596
Free Cash Flow from Cont Ops
Forward Looking Statement DisclaimerThis presentation (and oral statements regarding the subject matter of this presentation) includes ldquoforward-looking statementsrdquo intended to qualify for the safe harbor from liability established by the Private Securities Litigation Reform Act of 1995 These statements reflect assumptions expectations projections intentions or beliefs about future events and use words such as anticipate estimate project forecast may will should could expect believe plan intend and other words of similar meaning You can identify these statements by the fact that they do not relate strictly to historical or current facts In particular these include but are not limited to statements relating to the following
bull Projected revenues net income earnings per share attributable to common stock backlog margins capital expenditures weighted average shares outstanding tax rates and other projections of operating or financial resultsbull Our business or financial outlook growth or opportunities in particular marketsbull The potential benefits from acquisitions and investmentsbull The expected financial and operational performance of acquired businessesbull Future capital allocation initiativesbull Our ability to deliver increased value and return capital to stockholders bull The strategic use of our balance sheetbull The expected value of contracts or intended contracts with customersbull The scope services term and results of any projects awarded or expected to be awarded for services to be provided by usbull The anticipated commencement and completion dates for any projects awardedbull The development of larger electric transmission and oil and natural gas pipeline projects and the level of oil natural gas and natural gas liquids prices and their impact on our business or the demand for our services bull The impact of existing or potential energy legislation bull Potential opportunities that may be indicated by bidding activity or discussions with customersbull The expected outcome of pending or threatened litigation bull Beliefs and assumptions about the collectability of receivablesbull The business plans or financial condition of our customersbull Our plans and strategies bull The current economic and regulatory conditions and trends in the industries we serve bull Possible recovery on pending or contemplated change orders or affirmative claims against customers or third parties and bull Other statements reflecting expectations intentions assumptions or beliefs about future events and other statements that do not relate strictly to historical or current facts
Although our management believes that the expectations reflected in such forward-looking statements are reasonable it can give no assurance that such expectations will prove to be correct These forward-looking statements are not guarantees of future performance and involve or rely on a number of risks uncertainties and assumptions that are difficult to predict or beyond our control These forward-looking statements reflect our beliefs and assumptions based on information available to our management at the time the statements are made We caution you that actual outcomes and results may differ materially from what is expressed implied or forecasted by our forward-looking statements and that any or all of our forward-looking statements may turn out to be wrong Forward-looking statements can be affected by inaccurate assumptions and by known or unknown risks and uncertainties including the following
bull Market conditionsbull The effects of industry economic financial or political conditions outside our control including weakness in capital marketsbull Quarterly variations in our operating resultsbull Trends and growth opportunities in relevant marketsbull The cost of borrowing availability of credit and cash fluctuations in the price and volume of our common stock debt covenant compliance interest rate fluctuations and other factors affecting our financing and investing activitiesbull Delays reductions in scope or cancellations of anticipated pending or existing projects including as a result of weather regulatory or permitting issues environmental processes project performance issues claimed force majeure events or our customers capital
constraintsbull The successful negotiation execution performance and completion of anticipated pending and existing contracts including the ability to obtain awards of projects on which we bid or are otherwise discussing with customersbull Our ability to retain key personnel and qualified employees
Forward Looking Statement Disclaimerbull Our ability to attract or the potential shortage of skilled labor bull Our dependence on fixed price contracts and the potential to incur losses with respect to the contractsbull Estimates relating to our use of percentage-of-completion accountingbull Adverse weatherbull Our ability to generate internal growthbull Competition in our business including our ability to effectively compete for new projects and market sharebull The effect of natural gas natural gas liquids and oil prices on our operations and growth opportunities and on
our customersrsquo capital programs and demand for our servicesbull The future development of natural resourcesbull The failure of existing or potential legislative actions to result in demand for our servicesbull Liabilities associated with multiemployer pension plans including underfunding of liabilities and termination
or withdrawal liabilitiesbull The possibility of further increases in the liability associated with our withdrawal from a multiemployer
pension planbull Unexpected costs or liabilities that may arise from pending or threatened litigation indemnity obligations or
other claims asserted against us including liabilities for claims that are self-insured or uninsuredbull The outcome of pending or threatened litigationbull Risks relating to the potential unavailability or cancellation of third party insurance the exclusion of coverage
for certain losses and potential increases in premiums for coverage deemed beneficial to usbull Cancellation provisions within our contracts and the risk that contracts expire and are not renewed or are
replaced on less favorable termsbull Loss of customers with whom we have long-standing or significant relationshipsbull The potential that participation in joint ventures or similar structures exposes us to liability andor harm to
our reputation for acts or omissions by our partnersbull Our inability or failure to comply with the terms of our contracts which may result in additional costs
unexcused delays warranty claims failure to meet performance guarantees damages or contract terminations
bull The inability or refusal of our customers to pay for services including the failure to collect outstanding receivables
bull The failure to recover on payment claims against project owners or third party contractors or to obtain adequate compensation for customer-requested change orders
bull The failure of our customers to comply with regulatory requirements applicable to their projects which may result in project delays and cancellations
bull Budgetary or other constraints that may reduce or eliminate tax incentives or government funding for projects which may result in project delays or cancellations
bull Estimates and assumptions in determining our financial results and backlogbull Our ability to realize our backlogbull Risks associated with operating in international markets including instability of foreign governments
currency fluctuations tax and investment strategies as well as compliance with foreign legal systems and cultural practices the US Foreign Corrupt Practices Act and other applicable anti-bribery and anti-corruption laws
bull Our ability to successfully identify complete integrate and realize synergies from acquisitionsbull The potential adverse impact resulting from uncertainty surrounding investments and acquisitions including
the ability to retain key personnel from the acquired businesses and the potential increase in risks already existing in our operations
bull The adverse impact of impairments of goodwill receivables property equipment and other intangible assets or investments
bull Our growth outpacing our decentralized management and infrastructurebull Requirements relating to governmental regulation and changes theretobull Inability to enforce our intellectual property rights or the obsolescence of such rightsbull Risks related to the implementation of an information technology solutionbull The impact of our unionized workforce on our operations including labor stoppages or interruptions due to
strikes or lockoutsbull Potential liabilities and other adverse effects arising from occupational health and safety mattersbull Our dependence on suppliers subcontractors equipment manufacturers and other third party contractorsbull Fluctuations of prices of certain materials used in our businessbull The ability to access sufficient funding to finance desired growth and operationsbull Our ability to obtain performance bondsbull Potential exposure to environmental liabilitiesbull Our ability to continue to meet certain requirements applicable to us and our subsidiariesbull Rapid technological and other structural changes that could reduce the demand for our servicesbull New or changed tax laws treaties or regulationsbull Increased healthcare costs arising from healthcare reform legislation or other governmental actionbull Regulatory changes that result in increased labor costsbull Significant fluctuations in foreign currency exchange rates andbull The other risks and uncertainties as are described elsewhere herein and in our Annual Report on Form 10-K for
the year ended December 31 2016 filed with the SEC and as may be detailed from time to time in our other public filings with the SEC
All of our forward-looking statements whether written or oral are expressly qualified by these cautionary statements and any other cautionary statements that may accompany such forward-looking statements or that are otherwise included in this presentation Should one or more of these risks materialize or should underlying assumptions prove incorrect actual results may vary materially from those expressed or implied in any forward-looking statements Investors are cautioned not to place undue reliance on these forward-looking statements which are current only as of this date We do not undertake and expressly disclaim any obligation to update or revise any forward-looking statements to reflect events or circumstances after the date of this presentation or otherwise and we expressly disclaim any written or oral statements made by any third party regarding the subject matter of this presentation
Slide Number 1
Forward Looking Statement Disclaimer
Key Takeaways
Leading Integrated Infrastructure Solutions Provider
Overview ndash Strategically Focused Operationally Diverse
Overview - Diverse and High Quality Customer Base
Leading Integrated Infrastructure Solutions Provider
Strategic Imperatives
Strategic Imperatives Deliver Profitable Growth
Strategic Acquisitions Criteria and Rationale
Differentiated Competitive Position ndash In the Sweet Spot
Differentiated Competitive Position ndash In the Sweet Spot
Electric Power Infrastructure Services Segment Overview
Power Grid Investment Drivers - Transmission
Power Grid Investment Drivers - Transmission
Power Grid Investment Drivers - Distribution
Oil amp Gas Infrastructure Services Segment Overview
Reconciliation of Adjusted Net Income from Continuing Operations Attributable to Common Stock
Reconciliation of Electric Power and Oil amp Gas Infrastructure Services Segments Operating Income As Adjusted
Reconciliation of Free Cash Flow
Forward Looking Statement Disclaimer
Forward Looking Statement Disclaimer
Free Cash Flow From Continuing Operations
Source
2013
2014
2015
2016
(Support Cash Flow Statement)
Net Cash Provided by Operating Activities of Continuing Operations
370558
247742
618183
381176
(Support Cash Flow Statement)
Less Net Capital Expenditures
(Support Cash Flow Statement)
Additions of Property and Equipment
(221946)
(247216)
(209968)
(212555)
(Support Cash Flow Statement)
Proceeds from Sale of Property and Equipment
14789
14448
26178
21975
(Recalculation)
Net Capital Expenditures
(207157)
(232768)
(183790)
(190580)
(Recalculation)
Free Cash Flow
163401
14974
434393
190596
Adjusted Operating Income Margin
$ in millions
Support for slide 23
Amounts in millions except percentages
Electric Power
Oil amp Gas Infrastructure
123114
123115
123116
123114
Revenues
$ 53027
$ 49373
$ 48505
$ 24446
Operating Income (as reported)
4630
3623
3957
1628
Addback
Provisions for long term contract receivable
1025
-0
-0
-0
Arbitration expense
-0
-0
-0
388
Asset impairment charge
-0
66
57
-0
Operating Income (as adjusted)
$ 5655
$ 3689
$ 4014
$ 2016
Operating income margin (as reported)
87
73
82
67
Operating income margin (as adjusted)
107
75
83
83
Quanta Services Inc and Subsidiaries
Reconciliation of Non-GAAP Financial Measures
Adjusted Diluted Earnings Per Share from Continuing Operations
For the Years Ended December 31
(in thousands except per share information)
(Unaudited)
Estimated Guidance Range
2013
2014
2015
2016
2017
2017
Reconciliation of adjusted net income from continuing operations attributable to common stock
Net income from continuing operations attributable to common stock (GAAP as reported)
$ 372057
$ 269224
$ 120286
$ 198725
$ 247000
$ 275300
Adjustments
Asset impairment charges
-
-
58451
7964
-
-
Severance and restructuring charges
-
-
-
6352
-
-
Acquisition and integration costs
8145
14754
7966
3053
9300
9300
Impact of income tax contingency releases
(9935)
(8099)
-
(20488)
-
-
Impact of tax benefit from realization of previously unrecognized deferred tax asset
-
-
(4228)
-
-
-
Impact of Alberta tax law change
-
-
4982
-
-
-
Provision for long-term contract receivable
-
102460
-
-
-
-
Arbitration expense
-
38848
-
-
-
-
Impact of sale of equity ownership in Howard Energy
(112744)
-
-
-
-
-
Income tax impact of adjustments
39836
(55935)
(16186)
(3982)
(3400)
(3400)
Adjusted net income from continuing operations attributable to common stock before certain non-cash adjustments
297359
361252
171271
191624
252900
281200
Non-cash stock based compensation
34381
37449
36939
41134
47000
47000
Amortization of intangible assets
25865
34257
34848
31685
30600
30600
Income tax impact of non-cash adjustments
(22715)
(26453)
(25817)
(26183)
(28500)
(28500)
Adjusted net income from continuing operations attributable to common stock
$ 334890
$ 406505
$ 217241
$ 238260
$ 302000
$ 330300
Weighted average shares
Weighted average shares outstanding for diluted earnings per share
214978
219690
195120
157288
157300
157300
Weighted average shares outstanding for adjusted diluted earnings per share
214978
219690
195120
157288
157300
157300
Diluted earnings per share from continuing operations attributable to common stock and adjusted diluted earnings per share from continuing operations attributable to common stock
Diluted earnings per share from continuing operations attributable to common stock
$ 173
$ 123
$ 062
$ 126
$ 157
$ 175
Adjusted diluted earnings per share from continuing operations attributable to common stock
$ 156
$ 185
$ 111
$ 151
$ 192
$ 210
2017 Forecast
2008
2009
2010
2011
2012
2013
2014
2015
2016
2017
2018
2019
2020
2021
2022
US IOU
17599783395
17375430450
17116821481
17473265629
19719353886
18593206538
21049378470
23210018195
24651006483
28003750000
29530700000
30481300000
30509750000
31231850000
31138000000
Co-ops
3679033739
3613552751
2806195753
3044502916
2639012201
3360515403
3050612075
2834000972
3277074511
3309845256
3342943708
3376373145
3410136877
3444238245
3478680628
MuniGovt Owned
2525145025
2693819865
2624788344
2608815562
2682098477
2938725525
3183015391
3330273309
3454862656
3664198000
3769427295
3778921940
3483677493
3817389338
3817389338
Canadian
3324942988
3202431553
3726264949
4213182949
4228837570
4323705834
4106960884
3465854177
3159852215
3254697600
3381315300
3453964800
3380277450
3406223700
3406223700
Total NA 2017 Market
27128905147
26885234619
26274070528
27339767056
29269302134
29216153300
31389966819
32840146653
34542795864
38232490856
40024386303
41090559885
40783841819
41899701283
41840293665
From August 2015 Report
North American Electric Distribution Spending
2008
2009
2010
2011
2012
2013
2014
2015
2016
2017
2018
2019
2020
US IOUs
$175
$173
$171
$174
$197
$186
$210
$226
$244
$244
$247
$249
$250
US Co-ops
$27
$29
$27
$29
$35
$41
$34
$39
$40
$40
$41
$42
$42
US Muni
$25
$26
$26
$28
$28
$29
$29
$30
$31
$31
$32
$32
$33
Total US
$226
$227
$224
$231
$260
$256
$273
$295
$314
$316
$320
$323
$325
Canada
$33
$33
$34
$39
$38
$39
$39
$38
$41
$41
$42
$43
$43
Total
$260
$261
$259
$269
$298
$294
$312
$333
$354
$357
$362
$365
$368
15 vs 16
$00
$01
$02
$04
($01)
($04)
$06
$04
$08
$21
$19
$28
$26
From August 2016 Report
North American Electric Distribution Spending
2008
2009
2010
2011
2012
2013
2014
2015
2016
2017
2018
2019
2020
US IOUs
$176
$174
$171
$175
$197
$186
$210
$232
$258
$270
$271
$281
$281
US Co-ops
$27
$29
$27
$29
$31
$33
$38
$39
$40
$41
$41
$42
$43
US Muni
$25
$26
$26
$28
$28
$29
$29
$30
$31
$31
$32
$33
$33
Total US
$228
$229
$224
$232
$256
$248
$277
$301
$329
$342
$344
$356
$357
Canada
$32
$32
$37
$41
$41
$42
$41
$36
$33
$36
$37
$37
$37
Total
$260
$261
$261
$273
$297
$290
$318
$337
$362
$378
$381
$393
$394
From September 2017 Report
North American Electric Distribution Spending
2008
2009
2010
2011
2012
2013
2014
2015
2016
2017
2018
2019
2020
2021
2022
US IOUs
$176
$174
$171
$175
$197
$186
$210
$232
$247
$280
$295
$305
$305
$312
$311
US Co-ops
$37
$36
$28
$30
$26
$34
$31
$28
$33
$33
$33
$34
$34
$34
$35
US Muni
$25
$27
$26
$26
$27
$29
$32
$33
$35
$37
$38
$38
$35
$38
$38
Total US
$238
$237
$225
$231
$250
$249
$273
$294
$314
$350
$366
$376
$374
$385
$384
Canada
$33
$32
$37
$42
$42
$43
$41
$35
$32
$33
$34
$35
$34
$34
$34
Total
$271
$269
$263
$273
$293
$292
$314
$328
$345
$382
$400
$411
$408
$419
$418
2015 vs 2016 vs 2017
2015 Est
2016 Est
2017 Est
Avg 08-11
$262
$264
$269
Avg 12-15
$309
$311
$307
2016
$354
$362
$345
2017
$357
$378
$382
2018
$362
$381
$400
2019
$365
$393
$411
2020
$368
$394
$408
2021
$419
2022
$418
2017
Leading Integrated Infrastructure Solutions Provider
Quanta Services Is A Leading Integrated Infrastructure Solutions Provider
Who is Quanta Services Committed to the health and safety of our employees customers and community
Recognized market leader in electric power and oil and gas pipeline construction in North America
Entrepreneurial business model and culture
Broad self-performing platform developed through organic growth and acquisitions
Strong scope and scale with deep customer relationships
Revenue as reported by type of work geography contract and project type based on revenues of $7651 million for the twelve months ended Dec 31 2016 Represents the midpoint of guidance range
Estimated Revenue by Geography
United States79
LATAM amp Other3
Canada16
Australia2
Overview - Diverse and High Quality Customer Base
No single customer accounted for more than 4 of revenues in 2016
The ten largest customers accounted for approximately 32 of revenues in 2016
Strong relationships with the majority of US investor owned utilities and Canadian utilities ndash many going back for decades
Top 10
32
4
Leading Integrated Infrastructure Solutions Provider
bull Grow the base business and compliment with larger scale projects
bull Organic growth and strategic acquisitions
bull Pricing discipline and risk management
bull Focus on safe executionbull Cost managementbull Maintain financial strength
TimeRe
venu
es
Coupled with successful implementation of other strategic imperatives hellip
Larger Projects
For illustrative purposes
Strategic Acquisitions Criteria and Rationale
Acquisition Strategic Rationale
bull Acquisitions have and will continue to play a strategic role in differentiating Quanta in the marketplace and positioning the company for profitable long-term growth
bull Seek well respected entrepreneurial leadership with extensive history of operational excellencebull Only interested in companies that bring strategic value to Quanta and provide opportunity for 1+1=3 growth
opportunity over time
bull Brings leadership position in new geographybull Enhances presence and capabilities in an existing
geographybull Brings or enhances customer relationshipsbull Brings leadership position in adjacent or new
marketbull Brings unique service or technology that Quanta
can leverage to further differentiate its turnkey solution offering
Typical Deal Terms
bull Target 4x-5x EBITDA multiplebull 40 of consideration in Quanta stock 60 of
consideration in cashbull Meaningful stock component for operational and
stakeholder alignment
bull Company leadership stays on to run the businessbull Non-compete agreementsbull Stock locked up for period of time
Differentiated Competitive Position ndash In the Sweet Spot
bull Quanta is the largest infrastructure specialty contractor in North America
bull Unmatched scope providing broader solutions to customersbull Unmatched scale as the largest employer of skilled workforce in
the industry ndash more than 35000 employeesbull Track record of safe executionbull Projects are getting larger and more complex customers
increasingly seeking cost certainty and performancebull Quanta has consistently been working on numerous large
projects simultaneously for the past + six yearsbull Significant revenues from strategic relationships recurring work
and an increasing amount of negotiated work
Quanta vs Specialty Contractors Quanta vs Traditional EampCs
bull Today our customers believe skilled construction labor is a finite resource and critical to overall project success where engineering and procurement are more commoditized
bull Quanta has the largest skilled workforce in the industry ndash more than 35000 employees
bull Quanta self-performs its projects ndash controls quality and executionbull EampCs typically provide project management oversight and have
limited self-perform construction capabilitiesbull Quanta derives significant revenues from strategic relationships
recurring work and an increasing amount of negotiated workbull Price is often the primary driver of who wins EampC projects
Est Large Project Capability
Bubble Size = Avg Market Cap
0
20
40
60
80
100
Est
Self
Perfo
rm C
apab
ility
Bubble Size = Avg Market Cap
LargerSmaller
Differentiated Competitive Position ndash In the Sweet Spotbull Quanta is uniquely positioned to meet
customer needs versus both specialty contractors and traditional engineering and construction companies
bull Customers understand that skilled labor is critical to project success
bull Projects are getting larger and more complex and customers are increasingly seeking comprehensive solutions
bull Demand for specialty construction resources is high and increasing but supply is limited
bull Quanta has the largest infrastructure specialty contractor workforce in North America +35000 employees globally
bull Quanta has strategically invested in engineering and program management to provide true complete engineering procurement and construction (EPC) solutions
0
20
40
60
80
100
Est
Self
Perf
orm
Cap
abili
ty
Est Large Project Capability
Bubble Size = Avg Market Cap
LargerSmaller
Electric Power Infrastructure Services Segment Overview
$4542$5303 $4937 $4850
115 10775 83
2013 2014 2015 2016Revenue Op Margin
(2)
(1) Operating margin excludes a $1025 million charge to cost of services for long-term contract receivable in 2014 Refer to appendix for non-GAAP reconciliation(2) Excludes a $66 million property and equipment charge in 2015 and a $57 million asset impairment charge in 2016 Includes the impact of $661 million in 2015 and $548 million in 2016 of project losses Refer to appendix for non-GAAP reconciliation
Differentiatorsbull Largest TampD solutions provider in North
Americabull Reputation and Track Recordbull Unmatched Solutions Scope and Scalebull Safety Recordbull Manpower and Equipment Resourcesbull Lazy Q Training Facilitybull Energized Servicesbull EPC Capabilities Across All Offeringsbull Infrastructure Capital Solutions
Market Drivers
Power Grid Investment Drivers - Transmission
bull An aging grid that requires repair upgrade and maintenancebull Favorable transmission regulation Energy Policy Act of lsquo05
NERC Reliability Standards possibly FERC Order 1000 over the long-term
bull More stringent reliability standards will require repairing lines and adding redundant capacity
bull Coal and nuclear generation retirements and switching to natural gas and renewable generation strains the grid
bull Existing and new renewable generation needs interconnection to the grid
bull Opportunity for industrial driven load growthbull Regional grid infrastructure is too congested to get lowest-cost
power to consumersbull Sub-transmission interconnectionbull Canada has same drivers as US as well as the need to serve
mining interests and hydro generation for export to US load centers
bull Challenged economic conditions in Canada
bull Environmental and other regulatory scrutiny right of way acquisition permitting etc
bull Tepid load growthbull Economybull Energy efficiency initiatives
Oil amp Gas Infrastructure Services Segment Overview
$1870
$2445 $2635 $2801
74 83
54 53
2013 2014 2015 2016Revenue Op Margin
(1) Excludes a $388 million expense associated with an arbitration decision Refer to appendix for non-GAAP reconciliation(2) Includes $73 million of project losses
bull Production of shale natural gas oil and natural gas liquids has grown dramatically and is expected to remain at high levels forthe foreseeable future
bull Much of these resources are in areas that have not been traditional hydrocarbon fuel sources and do not have adequate infrastructure in place to gather store process and transport product
bull Canadian oil production lacks adequate takeaway pipeline infrastructurebull Economics of pipeline transportation is increasingly attractive versus rail in a low oil price environmentbull Pipeline construction capacity is more limited in Canada versus the US and construction capacity constraints could be significant
bull It will take many years and significant energy infrastructure investment to harvest these resources
Shale Gas amp Tight Oil Plays Drive US Natural Gas Production
2000-2040 (trillion cubic feet)
Source EIA Annual Energy Outlook 2017
Tight Oil Drives US Oil Production2000-2040 (millions of barrels per day)
Source EIA Annual Energy Outlook 2015
Canadian Oil Sands amp Conventional Oil Production(Millions of barrels per day)
Source Canadian Assoc of Petroleum Producers
Oil amp Gas Infrastructure Investment Driversbull Need for pipeline and related infrastructure driven by the
significant increase in North American unconventional natural gas and oil production ndash not commodity prices
bull Takeaway pipelines have not been built fast enough to keep pace with hydrocarbon production ndash significant pipeline development needed
bull Large pipeline construction industry capacity is currently tight but could get significantly strained over the next several years
North American Pipeline ForecastProbability Weighted
Quanta Is the Largest Pipeline Construction Company in North America
bull Quanta is the largest pipeline construction company in North America
bull This positions Quanta to provide significant large diameter pipe construction capacity to the industry while remaining active in select shales
bull We are ready to assist our customers in meeting their development goals in what could be a resource challenged environment
North America Major Planned Mainline Project Capex
Source KeyBanc Capital Markets
$0
$5
$10
$15
$20
2016E 2017E 2018E 2019E
In B
illio
ns
In B
illio
ns
Oil amp Gas Infrastructure Investment DriversNatural Gas Distribution amp Pipeline Integritybull US pipeline infrastructure is getting older
bull PHMSA estimates more than 470K miles (37) of US gas distribution mains and 171K miles (57) of gas transmission pipelines were installed before 1970 or in an undocumented year
bull Local Distribution Companies (LDCs) continue increased spend on pipe inspection and replacement
bull Replacement programs ramped up after San Bruno incident in 2010 Utilities are spending $22B a year on transmission and distribution systems(2)
bull Regulations push for expanding inspection programs and accelerating replacement work
bull PHMSA will require more inspection and corrosion control activity which will require additional excavations and integrity work DOErsquos Quadrennial Energy Review emphasizes the need to accelerate pipe replacement to curb emissions from leak-prone pipe
bull Long timelines for some replacement plans will push spend acceleration
bull Current projections are over 20 years for many large utilities a few more than 50 years(3) Replacement activities will have to be accelerated to address risk
bull State regulators establishing cost recovery mechanisms to accelerate replacement programs
Significant Inventory Remains for Replacement
States with Gas Utility Cost Recovery Mechanisms(4)
(1) PHMSA pipe inventory reports 2011-2015(2) AGA 2016 Playbook (3) Department of Energy Quadrennial Energy Review ndash Energy Transmission Storage and Distribution Infrastructure April 2015 (4) American Gas Association Playbook 2017
Stronghold Acquisition Overview
bull Provides catalyst handling turnaround and other downstream services tank storage and other midstream services
bull Specializes in high pressure and high reactor infrastructure services
bull Industry leading safety record employee and training focus with entrepreneurial culture
bull Led by a strong multigenerational highly regarded management team with decades of industry experience
bull Preferred employer with low turnover and high-quality workforce ndash averaging 2800 employees
bull Excellent reputation and strong relationships with a high-quality and diverse client base
bull Strong historical organic growth
21
Stronghold is a leading specialized services company providing high pressure and critical path solutions to the downstream and midstream energy markets
Company Profile
2016 Revenue =Approx $500 Million
Downstream Services
85
Midstream Services
15
Strategic Rationalebull Facilitates capture of a greater portion of energy
industry spend and offers cross-selling opportunities
bull Specialized Industrial Services market is a natural service line expansion for Quanta to meet our customersrsquo needs
bull Complements existing downstream high-voltage power services
bull Stronghold gives Quanta a significant presence in downstream services and a strong platform for growth
bull Strong financial profilebull Attractive historical growth and accretive margin
profile low capex requirements solid cash flow and accretive to earnings
bull Enhances recurring base business revenue
bull Shale oil natural gas and natural gas liquids (NGLs) production driving refinery petrochemical and storage infrastructure needs
Telecom Infrastructure Services Overview
To be an industry leading and true EPC contractor providing comprehensive communications infrastructure solutions to customers in the United States Canada and select markets in Latin America
Goal
Diverse Existing amp Target Customer BaseMarkets Served
Telecom Infrastructure Investment Drivers
bull Telco gigabit fiber to the home deployment programs
bull Cable MSOs deploying DOCSIS 31
bull Upcoming - 5G wireless and fiber backhaul
bull Ongoing 4G wireless network optimization
bull Connect America Fund - rural fiber build-out
bull Federal government funded FirstNet - national wireless network for first responders
United States
bull Backbone and last mile fiber (behind relative to the US)
bull Telco gigabit fiber to the home deployment programs
bull Cable MSOs deploying DOCSIS 31
bull Upcoming - 5G wireless and fiber backhaul
bull Ongoing 4G wireless network optimization
bull Federal government infrastructure initiatives generally positive
Canada
bull Significantly behind North America in both wireline and wireless connectivity
bull However demand for connectivity media and data intensive services is strong
bull Fiber and backhaul networks significantly behind North America
bull Primarily 3G wireless some 4G wireless (country dependent)
bull Various governments have infrastructure expansion initiatives
bull Concession and P3 opportunities
bull Connectivity for quality of life social and commercial reasons
Latin America
Telecom Infrastructure Services Overview
Fiber Builds
Wireless Deployment
Make Ready Services
Civil Construction
Engineering Design
Material Management
EPC
Wireless Wireline
United StatesWireless Wireline
CanadaWireless Wireline
Latin America
Comprehensive Infrastructure Solutions Offered On A Turnkey Discrete Service or EPC Basis
bull Proven greenfield expansion model in Latin America ndash US should be less difficult
Leverage existing US field operations people equipment and property
bull Select strategic acquisitions may play a role but NOT a roll-up approach
Provide wireline and wireless services - heavier on wireline
bull Increasing convergence of wireless and wireline due fiber requirements of both
Project centric nimble approach versus MSA focused EPC services to differentiate
bull Less capital intensive with better margin opportunity
GOAL
STRATEGY
STRATEGY
STRATEGY
STRATEGY
To be the leading communications infrastructure contractor in the markets we serve
Engineer Procure Construct (EPC) Is A Differentiator
bull Quanta has a long history in the EPC business and is increasingly performing select projects on an EPC basisbull Customersrsquo capital programs are at historic levels and growing Projects are getting larger and more complexbull Evolution of regulatory demands competition and alternative pricing models
bull Many customers have limited internal resources and expertise to manage these dynamics and are turning to Quanta for solutions
bull Project cost certainty becoming increasingly important
bull We are enhancing initiatives to ensure we have a scalable comprehensive enterprise-wide capability for EPC projects that is consistently executed across all segments and geographies
bull EPC projects are a meaningful contributor to our current backlog and provide significant opportunity for future growth
Integrated Services
Construction amp Installation
Assessment Planning amp
Development
Engineering amp Design
Procurement Operation and Maintenance
What is Infrastructure Solutions
Infrastructure Solutions represent strategic partnerships with customers and capital partners
bull Public private partnerships (P3)bull Concessionsbull Build Own Operate or Transfer
(BOOT)bull Build to Suit (BTS) arrangements
These solutions are a growth engine for each of our segments and geographies and a core component of our strategic
imperative to deliver differentiated solutions to our customers
Encompasses
Infrastructure Solutions Drivers
A Combination of Drivers are Occurring that Create Demand and Opportunity for Our Infrastructure Solutions
bull Provide transparency to a project shape design constructability risk allocation and overall project structure
bull Manages risk that yields more informed EPC project decisions
bull Improves success rate of both winning the engagement and successful execution
bull Where appropriate we invest alongside our partners
bull Significant capital needs to fund the substantial infrastructure needs
bull Utilization of concessions public private partnerships (P3) and private infrastructure partnerships to fund and attract high-quality entities for complex projects
bull Changes in regulation (such as FERC Order 1000)
bull New entrants together with high interest and availability of investor infrastructure investment capital
Quanta Is A True Partner
bull Quanta increasingly sought as a partner for our execution capabilities the need for price certainty and our financial strength
bull Projects are larger more complex greater scope Typically under lump-sum turnkey arrangements which create greater opportunities and risks for Quanta
bull Successful Infrastructure Solutions and project execution track record
Quanta Sought for Executionamp Track Record
Market Structure amp Projects Getting More Complex
29
Fully Integrated Solutions Based Provider
Infrastructure Solutions Provides A Solutions Based Tool for Quanta to Partner with Customers Enhance Relationships and Create New Customer and Project Opportunities
EPC
Capitalbull Determine capital structurebull Source capitalbull Quanta minority direct
investmentbull First Infrastructure Capital
Advisors
PartnershipsPartner withbull Customersbull Equity Capital
(4) Includes $802 million of expense net of tax or $036 per diluted share from an arbitration decision charge to provision for long-term contract receivable and the benefit associated with release of certain income tax contingencies
2013 2014 2015 2016 2017 Est
($ in millions)Revenue
$140$122
$062
$126
$163
2013 2014 2015 2016 2017Est
(4)
(5)
(6)
Electric Power Oil amp Gas Infrastructure
GAAP Diluted EPS (1)
$156
$185
$111
$151
$195
2013 2014 2015 2016 2017Est
Adjusted Diluted EPS (1)
$6412
(2) Represents the midpoint of guidance range
(2)
$7747
(2) (2) $173
(3) Includes $033 gain from sale of Howard Energy investment
$9300(3)
(1) From continuing operations
$7572
(5) Includes $734 million of project losses Also includes $454 million of expense net of tax or $023 per diluted share from net asset impairment charges
$7651
(6) Includes $548 million of project losses and $71 million of expense net of tax or $005 per diluted share from net asset impairment charges Also includes tax benefits of $205 million or $013 per share associated with the expiration of various federal and state tax statute of limitations periods
Recent Financial Performance amp 2017 ExpectationsFor the Years Ended December 31
($ in millions)Electric Power
$4542
$5303$4937 $4850
115107
7583
2013 2014 2015 2016 2017 Est
Revenue Op Margin
(2)
(1) Operating margin excludes a $1025 million charge to cost of services for long-term contract receivable in 2014 Refer to appendix for non-GAAP reconciliation(2) Excludes a $66 million property and equipment impairment charge Includes the impact of $661 million of project losses Refer to appendix for non-GAAP reconciliation(3) Excludes a $57 million asset impairment charge Includes the impact of $548 million of project losses Refer to appendix for non-GAAP reconciliation
(1) (1)
(2)(3)
f Est revenue growth approaching 15 vs 2016
Est operating incomemargins of 90 to 95
Guidance Commentary($ in millions)
Oil amp Gas Infrastructure
(4) Excludes a $388 million expense associated with an arbitration decision Refer to appendix for non-GAAP reconciliation(5) Includes $73 million of project losses
Liquidity includes cash and cash equivalents and availability under our revolving credit facility as described in our Form 10k
Historical Cash Flow Generation
$163
$15
$434
$191
2013 2014 2015 2016
Cash Flow from Continuing Operations
($ in millions)
Free Cash Flow from Continuing Operations
$371
$248
$618
$381
2013 2014 2015 2016
Net cash provided by operating activities from continuing operations plus proceeds from sale of property and equipment less additions of property and equipment
For the Years Ending December 31($ in millions)
For the Years Ending December 31
Committed to Generating Shareholder Value
Executed on $125 Billion Share Repurchase Authorizationbull Aug 2015 ndash Announced a new $125 billion share repurchase
authorization through Feb 28 2017bull Completed a $750 million accelerated stock repurchase (ASR)
arrangement in April 2016bull Acquired 351 million shares at $2136 per share
bull $500 million for opportunistic repurchases through Feb 28 2017bull $450 million 192 million shares retired
Completed $500 Million Share Repurchase Authorizationbull Completed previous $500 million share repurchase program in 2015bull Acquired approximately 174 million shares for total cost of $500
million
Acquired $17 Billion of Quanta Common Stock
Under Previous Programs Quanta Has Acquired Approximately 32 of Its Outstanding Stock
$2197$1951
$1573 $1573
0
25
50
75
100
125
150
175
200
225
$0000
$500000
$1000000
$1500000
$2000000
$2500000
$3000000
2014 2015 2016 2017E
Net Income Required to Generate $001 In EPS
Avg Dil Shs Out
Earnings Power Improvement
$ in
Tho
usan
ds
Shares in Millions
May 25 2017 ndash Announced New $300 Million Share Repurchase Authorizationbull Up to $300 million through June 30 2020
Opportunistic amp Disciplined Capital Allocation
Capital Deployment Preference (Amounts in millions)
bull Working Capitalbull Capital Expendituresbull Acquisitionsbull Investmentsbull Return of Capital
bull Generally in sync with preference however hellip
bull Financial strength provides the ability to be opportunistic
bull Flexible and strategic capital allocation is a competitive advantage
Capital Deployment Posture
Financial Strength Allows for Flexible and Strategic Capital Allocation ndash A Competitive Advantage
2013 ndash 2016 Sources amp Uses of Cash
Sources
Cash Flow fromOperations
DivestitureProceeds
BorrowingsInvestment Sales
$3099
$1667
$842
$369$221
Uses
StockRepurchase
CAPEX amp OtherNet
Acquisitions Net
Investments
$1700
$900
$728
$54$3382
54
27
127
50
27
21
2
Amounts reflect the retrospective application of a recent accounting pronouncement related to the classification of tax withholding payments for share-based compensation
Foundation For Growth amp Improved Profitability
Multi-Year Growth Opportunities
Innovative Industry Leading Solutions
Scale amp Scope
Financial Strength
Operational amp Safety Excellence
QuantaServicesIR
QuantaIR
Connect With Quanta Services Investor Relations
Corporate Office2800 Post Oak Blvd Suite 2600Houston TX 77056713-629-7600wwwquantaservicescom
Investor ContactKip Rupp CFAVice President ndash Investor Relations713-341-7260investorsquantaservicescom
Reconciliation of Adjusted Net Income from Continuing Operations Attributable to Common Stock
2013 2014 2015 2016 2017 2017Reconciliation of adjusted net income from continuing operations attributable to common stockNet income from continuing operations attributable to common stock (GAAP as reported) 372057$ 269224$ 120286$ 198725$ 247000$ 275300$ Adjustments
Asset impairment charges - - 58451 7964 - -Severance and restructuring charges - - - 6352 - -Acquisition and integration costs 8145 14754 7966 3053 9300 9300 Impact of income tax contingency releases (9935) (8099) - (20488) - -Impact of tax benefit from realization of previously unrecognized deferred tax asset - - (4228) - - -Impact of Alberta tax law change - - 4982 - - -Provision for long-term contract receivable - 102460 - - - -Arbitration expense - 38848 - - - -Impact of sale of equity ownership in Howard Energy (112744) - - - - -Income tax impact of adjustments 39836 (55935) (16186) (3982) (3400) (3400)
Adjusted net income from continuing operations attributable to common stock before certain non-cash adjustments 297359 361252 171271 191624 252900 281200
Non-cash stock based compensation 34381 37449 36939 41134 47000 47000 Amortization of intangible assets 25865 34257 34848 31685 30600 30600 Income tax impact of non-cash adjustments (22715) (26453) (25817) (26183) (28500) (28500)
Adjusted net income from continuing operations attributable to common stock 334890$ 406505$ 217241$ 238260$ 302000$ 330300$ Weighted average sharesWeighted average shares outstanding for diluted earnings per share 214978 219690 195120 157288 157300 157300 Weighted average shares outstanding for adjusted diluted earnings per share 214978 219690 195120 157288 157300 157300 Diluted earnings per share from continuing operations attributable to common stock and adjusted diluted earnings per share from continuing operations attributable to common stockDiluted earnings per share from continuing operations attributable to common stock 173$ 123$ 062$ 126$ 157$ 175$ Adjusted diluted earnings per share from continuing operations attributable to common stock 156$ 185$ 111$ 151$ 192$ 210$
Estimated Guidance Range
For the Years Ended December 31
(in thousands except per share information)(Unaudited)
Recast of Adjusted Diluted
Reconciliation of Electric Power and Oil amp Gas Infrastructure Services Segments Operating Income As Adjusted
Amounts in millions except percentagesOil amp Gas
Infrastructure12312014 12312015 12312016 12312014
Revenues 53027$ 49373$ 48505$ 24446$
Operating Income (as reported) 4630 3623 3957 1628
Addback Provisions for long term contract receivable 1025 - - - Arbitration expense - - - 388 Asset impairment charge - 66 57 -
Operating Income (as adjusted) 5655$ 3689$ 4014$ 2016$
Operating income margin (as reported) 87 73 82 67Operating income margin (as adjusted) 107 75 83 83
Electric Power
Sheet1
Reconciliation of Free Cash Flow
2013 2014 2015 2016Net Cash Provided by Operating Activities of Continuing Operations 370558 247742 618183 381176 Less Net Capital ExpendituresAdditions of Property and Equipment (221946) (247216) (209968) (212555) Proceeds from Sale of Property and Equipment 14789 14448 26178 21975 Net Capital Expenditures (207157) (232768) (183790) (190580)
Free Cash Flow 163401 14974 434393 190596
Free Cash Flow from Cont Ops
Forward Looking Statement DisclaimerThis presentation (and oral statements regarding the subject matter of this presentation) includes ldquoforward-looking statementsrdquo intended to qualify for the safe harbor from liability established by the Private Securities Litigation Reform Act of 1995 These statements reflect assumptions expectations projections intentions or beliefs about future events and use words such as anticipate estimate project forecast may will should could expect believe plan intend and other words of similar meaning You can identify these statements by the fact that they do not relate strictly to historical or current facts In particular these include but are not limited to statements relating to the following
bull Projected revenues net income earnings per share attributable to common stock backlog margins capital expenditures weighted average shares outstanding tax rates and other projections of operating or financial resultsbull Our business or financial outlook growth or opportunities in particular marketsbull The potential benefits from acquisitions and investmentsbull The expected financial and operational performance of acquired businessesbull Future capital allocation initiativesbull Our ability to deliver increased value and return capital to stockholders bull The strategic use of our balance sheetbull The expected value of contracts or intended contracts with customersbull The scope services term and results of any projects awarded or expected to be awarded for services to be provided by usbull The anticipated commencement and completion dates for any projects awardedbull The development of larger electric transmission and oil and natural gas pipeline projects and the level of oil natural gas and natural gas liquids prices and their impact on our business or the demand for our services bull The impact of existing or potential energy legislation bull Potential opportunities that may be indicated by bidding activity or discussions with customersbull The expected outcome of pending or threatened litigation bull Beliefs and assumptions about the collectability of receivablesbull The business plans or financial condition of our customersbull Our plans and strategies bull The current economic and regulatory conditions and trends in the industries we serve bull Possible recovery on pending or contemplated change orders or affirmative claims against customers or third parties and bull Other statements reflecting expectations intentions assumptions or beliefs about future events and other statements that do not relate strictly to historical or current facts
Although our management believes that the expectations reflected in such forward-looking statements are reasonable it can give no assurance that such expectations will prove to be correct These forward-looking statements are not guarantees of future performance and involve or rely on a number of risks uncertainties and assumptions that are difficult to predict or beyond our control These forward-looking statements reflect our beliefs and assumptions based on information available to our management at the time the statements are made We caution you that actual outcomes and results may differ materially from what is expressed implied or forecasted by our forward-looking statements and that any or all of our forward-looking statements may turn out to be wrong Forward-looking statements can be affected by inaccurate assumptions and by known or unknown risks and uncertainties including the following
bull Market conditionsbull The effects of industry economic financial or political conditions outside our control including weakness in capital marketsbull Quarterly variations in our operating resultsbull Trends and growth opportunities in relevant marketsbull The cost of borrowing availability of credit and cash fluctuations in the price and volume of our common stock debt covenant compliance interest rate fluctuations and other factors affecting our financing and investing activitiesbull Delays reductions in scope or cancellations of anticipated pending or existing projects including as a result of weather regulatory or permitting issues environmental processes project performance issues claimed force majeure events or our customers capital
constraintsbull The successful negotiation execution performance and completion of anticipated pending and existing contracts including the ability to obtain awards of projects on which we bid or are otherwise discussing with customersbull Our ability to retain key personnel and qualified employees
Forward Looking Statement Disclaimerbull Our ability to attract or the potential shortage of skilled labor bull Our dependence on fixed price contracts and the potential to incur losses with respect to the contractsbull Estimates relating to our use of percentage-of-completion accountingbull Adverse weatherbull Our ability to generate internal growthbull Competition in our business including our ability to effectively compete for new projects and market sharebull The effect of natural gas natural gas liquids and oil prices on our operations and growth opportunities and on
our customersrsquo capital programs and demand for our servicesbull The future development of natural resourcesbull The failure of existing or potential legislative actions to result in demand for our servicesbull Liabilities associated with multiemployer pension plans including underfunding of liabilities and termination
or withdrawal liabilitiesbull The possibility of further increases in the liability associated with our withdrawal from a multiemployer
pension planbull Unexpected costs or liabilities that may arise from pending or threatened litigation indemnity obligations or
other claims asserted against us including liabilities for claims that are self-insured or uninsuredbull The outcome of pending or threatened litigationbull Risks relating to the potential unavailability or cancellation of third party insurance the exclusion of coverage
for certain losses and potential increases in premiums for coverage deemed beneficial to usbull Cancellation provisions within our contracts and the risk that contracts expire and are not renewed or are
replaced on less favorable termsbull Loss of customers with whom we have long-standing or significant relationshipsbull The potential that participation in joint ventures or similar structures exposes us to liability andor harm to
our reputation for acts or omissions by our partnersbull Our inability or failure to comply with the terms of our contracts which may result in additional costs
unexcused delays warranty claims failure to meet performance guarantees damages or contract terminations
bull The inability or refusal of our customers to pay for services including the failure to collect outstanding receivables
bull The failure to recover on payment claims against project owners or third party contractors or to obtain adequate compensation for customer-requested change orders
bull The failure of our customers to comply with regulatory requirements applicable to their projects which may result in project delays and cancellations
bull Budgetary or other constraints that may reduce or eliminate tax incentives or government funding for projects which may result in project delays or cancellations
bull Estimates and assumptions in determining our financial results and backlogbull Our ability to realize our backlogbull Risks associated with operating in international markets including instability of foreign governments
currency fluctuations tax and investment strategies as well as compliance with foreign legal systems and cultural practices the US Foreign Corrupt Practices Act and other applicable anti-bribery and anti-corruption laws
bull Our ability to successfully identify complete integrate and realize synergies from acquisitionsbull The potential adverse impact resulting from uncertainty surrounding investments and acquisitions including
the ability to retain key personnel from the acquired businesses and the potential increase in risks already existing in our operations
bull The adverse impact of impairments of goodwill receivables property equipment and other intangible assets or investments
bull Our growth outpacing our decentralized management and infrastructurebull Requirements relating to governmental regulation and changes theretobull Inability to enforce our intellectual property rights or the obsolescence of such rightsbull Risks related to the implementation of an information technology solutionbull The impact of our unionized workforce on our operations including labor stoppages or interruptions due to
strikes or lockoutsbull Potential liabilities and other adverse effects arising from occupational health and safety mattersbull Our dependence on suppliers subcontractors equipment manufacturers and other third party contractorsbull Fluctuations of prices of certain materials used in our businessbull The ability to access sufficient funding to finance desired growth and operationsbull Our ability to obtain performance bondsbull Potential exposure to environmental liabilitiesbull Our ability to continue to meet certain requirements applicable to us and our subsidiariesbull Rapid technological and other structural changes that could reduce the demand for our servicesbull New or changed tax laws treaties or regulationsbull Increased healthcare costs arising from healthcare reform legislation or other governmental actionbull Regulatory changes that result in increased labor costsbull Significant fluctuations in foreign currency exchange rates andbull The other risks and uncertainties as are described elsewhere herein and in our Annual Report on Form 10-K for
the year ended December 31 2016 filed with the SEC and as may be detailed from time to time in our other public filings with the SEC
All of our forward-looking statements whether written or oral are expressly qualified by these cautionary statements and any other cautionary statements that may accompany such forward-looking statements or that are otherwise included in this presentation Should one or more of these risks materialize or should underlying assumptions prove incorrect actual results may vary materially from those expressed or implied in any forward-looking statements Investors are cautioned not to place undue reliance on these forward-looking statements which are current only as of this date We do not undertake and expressly disclaim any obligation to update or revise any forward-looking statements to reflect events or circumstances after the date of this presentation or otherwise and we expressly disclaim any written or oral statements made by any third party regarding the subject matter of this presentation
Slide Number 1
Forward Looking Statement Disclaimer
Key Takeaways
Leading Integrated Infrastructure Solutions Provider
Overview ndash Strategically Focused Operationally Diverse
Overview - Diverse and High Quality Customer Base
Leading Integrated Infrastructure Solutions Provider
Strategic Imperatives
Strategic Imperatives Deliver Profitable Growth
Strategic Acquisitions Criteria and Rationale
Differentiated Competitive Position ndash In the Sweet Spot
Differentiated Competitive Position ndash In the Sweet Spot
Electric Power Infrastructure Services Segment Overview
Power Grid Investment Drivers - Transmission
Power Grid Investment Drivers - Transmission
Power Grid Investment Drivers - Distribution
Oil amp Gas Infrastructure Services Segment Overview
Reconciliation of Adjusted Net Income from Continuing Operations Attributable to Common Stock
Reconciliation of Electric Power and Oil amp Gas Infrastructure Services Segments Operating Income As Adjusted
Reconciliation of Free Cash Flow
Forward Looking Statement Disclaimer
Forward Looking Statement Disclaimer
Free Cash Flow From Continuing Operations
Source
2013
2014
2015
2016
(Support Cash Flow Statement)
Net Cash Provided by Operating Activities of Continuing Operations
370558
247742
618183
381176
(Support Cash Flow Statement)
Less Net Capital Expenditures
(Support Cash Flow Statement)
Additions of Property and Equipment
(221946)
(247216)
(209968)
(212555)
(Support Cash Flow Statement)
Proceeds from Sale of Property and Equipment
14789
14448
26178
21975
(Recalculation)
Net Capital Expenditures
(207157)
(232768)
(183790)
(190580)
(Recalculation)
Free Cash Flow
163401
14974
434393
190596
Adjusted Operating Income Margin
$ in millions
Support for slide 23
Amounts in millions except percentages
Electric Power
Oil amp Gas Infrastructure
123114
123115
123116
123114
Revenues
$ 53027
$ 49373
$ 48505
$ 24446
Operating Income (as reported)
4630
3623
3957
1628
Addback
Provisions for long term contract receivable
1025
-0
-0
-0
Arbitration expense
-0
-0
-0
388
Asset impairment charge
-0
66
57
-0
Operating Income (as adjusted)
$ 5655
$ 3689
$ 4014
$ 2016
Operating income margin (as reported)
87
73
82
67
Operating income margin (as adjusted)
107
75
83
83
Quanta Services Inc and Subsidiaries
Reconciliation of Non-GAAP Financial Measures
Adjusted Diluted Earnings Per Share from Continuing Operations
For the Years Ended December 31
(in thousands except per share information)
(Unaudited)
Estimated Guidance Range
2013
2014
2015
2016
2017
2017
Reconciliation of adjusted net income from continuing operations attributable to common stock
Net income from continuing operations attributable to common stock (GAAP as reported)
$ 372057
$ 269224
$ 120286
$ 198725
$ 247000
$ 275300
Adjustments
Asset impairment charges
-
-
58451
7964
-
-
Severance and restructuring charges
-
-
-
6352
-
-
Acquisition and integration costs
8145
14754
7966
3053
9300
9300
Impact of income tax contingency releases
(9935)
(8099)
-
(20488)
-
-
Impact of tax benefit from realization of previously unrecognized deferred tax asset
-
-
(4228)
-
-
-
Impact of Alberta tax law change
-
-
4982
-
-
-
Provision for long-term contract receivable
-
102460
-
-
-
-
Arbitration expense
-
38848
-
-
-
-
Impact of sale of equity ownership in Howard Energy
(112744)
-
-
-
-
-
Income tax impact of adjustments
39836
(55935)
(16186)
(3982)
(3400)
(3400)
Adjusted net income from continuing operations attributable to common stock before certain non-cash adjustments
297359
361252
171271
191624
252900
281200
Non-cash stock based compensation
34381
37449
36939
41134
47000
47000
Amortization of intangible assets
25865
34257
34848
31685
30600
30600
Income tax impact of non-cash adjustments
(22715)
(26453)
(25817)
(26183)
(28500)
(28500)
Adjusted net income from continuing operations attributable to common stock
$ 334890
$ 406505
$ 217241
$ 238260
$ 302000
$ 330300
Weighted average shares
Weighted average shares outstanding for diluted earnings per share
214978
219690
195120
157288
157300
157300
Weighted average shares outstanding for adjusted diluted earnings per share
214978
219690
195120
157288
157300
157300
Diluted earnings per share from continuing operations attributable to common stock and adjusted diluted earnings per share from continuing operations attributable to common stock
Diluted earnings per share from continuing operations attributable to common stock
$ 173
$ 123
$ 062
$ 126
$ 157
$ 175
Adjusted diluted earnings per share from continuing operations attributable to common stock
$ 156
$ 185
$ 111
$ 151
$ 192
$ 210
2017 Forecast
2008
2009
2010
2011
2012
2013
2014
2015
2016
2017
2018
2019
2020
2021
2022
US IOU
17599783395
17375430450
17116821481
17473265629
19719353886
18593206538
21049378470
23210018195
24651006483
28003750000
29530700000
30481300000
30509750000
31231850000
31138000000
Co-ops
3679033739
3613552751
2806195753
3044502916
2639012201
3360515403
3050612075
2834000972
3277074511
3309845256
3342943708
3376373145
3410136877
3444238245
3478680628
MuniGovt Owned
2525145025
2693819865
2624788344
2608815562
2682098477
2938725525
3183015391
3330273309
3454862656
3664198000
3769427295
3778921940
3483677493
3817389338
3817389338
Canadian
3324942988
3202431553
3726264949
4213182949
4228837570
4323705834
4106960884
3465854177
3159852215
3254697600
3381315300
3453964800
3380277450
3406223700
3406223700
Total NA 2017 Market
27128905147
26885234619
26274070528
27339767056
29269302134
29216153300
31389966819
32840146653
34542795864
38232490856
40024386303
41090559885
40783841819
41899701283
41840293665
From August 2015 Report
North American Electric Distribution Spending
2008
2009
2010
2011
2012
2013
2014
2015
2016
2017
2018
2019
2020
US IOUs
$175
$173
$171
$174
$197
$186
$210
$226
$244
$244
$247
$249
$250
US Co-ops
$27
$29
$27
$29
$35
$41
$34
$39
$40
$40
$41
$42
$42
US Muni
$25
$26
$26
$28
$28
$29
$29
$30
$31
$31
$32
$32
$33
Total US
$226
$227
$224
$231
$260
$256
$273
$295
$314
$316
$320
$323
$325
Canada
$33
$33
$34
$39
$38
$39
$39
$38
$41
$41
$42
$43
$43
Total
$260
$261
$259
$269
$298
$294
$312
$333
$354
$357
$362
$365
$368
15 vs 16
$00
$01
$02
$04
($01)
($04)
$06
$04
$08
$21
$19
$28
$26
From August 2016 Report
North American Electric Distribution Spending
2008
2009
2010
2011
2012
2013
2014
2015
2016
2017
2018
2019
2020
US IOUs
$176
$174
$171
$175
$197
$186
$210
$232
$258
$270
$271
$281
$281
US Co-ops
$27
$29
$27
$29
$31
$33
$38
$39
$40
$41
$41
$42
$43
US Muni
$25
$26
$26
$28
$28
$29
$29
$30
$31
$31
$32
$33
$33
Total US
$228
$229
$224
$232
$256
$248
$277
$301
$329
$342
$344
$356
$357
Canada
$32
$32
$37
$41
$41
$42
$41
$36
$33
$36
$37
$37
$37
Total
$260
$261
$261
$273
$297
$290
$318
$337
$362
$378
$381
$393
$394
From September 2017 Report
North American Electric Distribution Spending
2008
2009
2010
2011
2012
2013
2014
2015
2016
2017
2018
2019
2020
2021
2022
US IOUs
$176
$174
$171
$175
$197
$186
$210
$232
$247
$280
$295
$305
$305
$312
$311
US Co-ops
$37
$36
$28
$30
$26
$34
$31
$28
$33
$33
$33
$34
$34
$34
$35
US Muni
$25
$27
$26
$26
$27
$29
$32
$33
$35
$37
$38
$38
$35
$38
$38
Total US
$238
$237
$225
$231
$250
$249
$273
$294
$314
$350
$366
$376
$374
$385
$384
Canada
$33
$32
$37
$42
$42
$43
$41
$35
$32
$33
$34
$35
$34
$34
$34
Total
$271
$269
$263
$273
$293
$292
$314
$328
$345
$382
$400
$411
$408
$419
$418
2015 vs 2016 vs 2017
2015 Est
2016 Est
2017 Est
Avg 08-11
$262
$264
$269
Avg 12-15
$309
$311
$307
2016
$354
$362
$345
2017
$357
$378
$382
2018
$362
$381
$400
2019
$365
$393
$411
2020
$368
$394
$408
2021
$419
2022
$418
2017
Overview - Diverse and High Quality Customer Base
No single customer accounted for more than 4 of revenues in 2016
The ten largest customers accounted for approximately 32 of revenues in 2016
Strong relationships with the majority of US investor owned utilities and Canadian utilities ndash many going back for decades
Top 10
32
4
Leading Integrated Infrastructure Solutions Provider
bull Grow the base business and compliment with larger scale projects
bull Organic growth and strategic acquisitions
bull Pricing discipline and risk management
bull Focus on safe executionbull Cost managementbull Maintain financial strength
TimeRe
venu
es
Coupled with successful implementation of other strategic imperatives hellip
Larger Projects
For illustrative purposes
Strategic Acquisitions Criteria and Rationale
Acquisition Strategic Rationale
bull Acquisitions have and will continue to play a strategic role in differentiating Quanta in the marketplace and positioning the company for profitable long-term growth
bull Seek well respected entrepreneurial leadership with extensive history of operational excellencebull Only interested in companies that bring strategic value to Quanta and provide opportunity for 1+1=3 growth
opportunity over time
bull Brings leadership position in new geographybull Enhances presence and capabilities in an existing
geographybull Brings or enhances customer relationshipsbull Brings leadership position in adjacent or new
marketbull Brings unique service or technology that Quanta
can leverage to further differentiate its turnkey solution offering
Typical Deal Terms
bull Target 4x-5x EBITDA multiplebull 40 of consideration in Quanta stock 60 of
consideration in cashbull Meaningful stock component for operational and
stakeholder alignment
bull Company leadership stays on to run the businessbull Non-compete agreementsbull Stock locked up for period of time
Differentiated Competitive Position ndash In the Sweet Spot
bull Quanta is the largest infrastructure specialty contractor in North America
bull Unmatched scope providing broader solutions to customersbull Unmatched scale as the largest employer of skilled workforce in
the industry ndash more than 35000 employeesbull Track record of safe executionbull Projects are getting larger and more complex customers
increasingly seeking cost certainty and performancebull Quanta has consistently been working on numerous large
projects simultaneously for the past + six yearsbull Significant revenues from strategic relationships recurring work
and an increasing amount of negotiated work
Quanta vs Specialty Contractors Quanta vs Traditional EampCs
bull Today our customers believe skilled construction labor is a finite resource and critical to overall project success where engineering and procurement are more commoditized
bull Quanta has the largest skilled workforce in the industry ndash more than 35000 employees
bull Quanta self-performs its projects ndash controls quality and executionbull EampCs typically provide project management oversight and have
limited self-perform construction capabilitiesbull Quanta derives significant revenues from strategic relationships
recurring work and an increasing amount of negotiated workbull Price is often the primary driver of who wins EampC projects
Est Large Project Capability
Bubble Size = Avg Market Cap
0
20
40
60
80
100
Est
Self
Perfo
rm C
apab
ility
Bubble Size = Avg Market Cap
LargerSmaller
Differentiated Competitive Position ndash In the Sweet Spotbull Quanta is uniquely positioned to meet
customer needs versus both specialty contractors and traditional engineering and construction companies
bull Customers understand that skilled labor is critical to project success
bull Projects are getting larger and more complex and customers are increasingly seeking comprehensive solutions
bull Demand for specialty construction resources is high and increasing but supply is limited
bull Quanta has the largest infrastructure specialty contractor workforce in North America +35000 employees globally
bull Quanta has strategically invested in engineering and program management to provide true complete engineering procurement and construction (EPC) solutions
0
20
40
60
80
100
Est
Self
Perf
orm
Cap
abili
ty
Est Large Project Capability
Bubble Size = Avg Market Cap
LargerSmaller
Electric Power Infrastructure Services Segment Overview
$4542$5303 $4937 $4850
115 10775 83
2013 2014 2015 2016Revenue Op Margin
(2)
(1) Operating margin excludes a $1025 million charge to cost of services for long-term contract receivable in 2014 Refer to appendix for non-GAAP reconciliation(2) Excludes a $66 million property and equipment charge in 2015 and a $57 million asset impairment charge in 2016 Includes the impact of $661 million in 2015 and $548 million in 2016 of project losses Refer to appendix for non-GAAP reconciliation
Differentiatorsbull Largest TampD solutions provider in North
Americabull Reputation and Track Recordbull Unmatched Solutions Scope and Scalebull Safety Recordbull Manpower and Equipment Resourcesbull Lazy Q Training Facilitybull Energized Servicesbull EPC Capabilities Across All Offeringsbull Infrastructure Capital Solutions
Market Drivers
Power Grid Investment Drivers - Transmission
bull An aging grid that requires repair upgrade and maintenancebull Favorable transmission regulation Energy Policy Act of lsquo05
NERC Reliability Standards possibly FERC Order 1000 over the long-term
bull More stringent reliability standards will require repairing lines and adding redundant capacity
bull Coal and nuclear generation retirements and switching to natural gas and renewable generation strains the grid
bull Existing and new renewable generation needs interconnection to the grid
bull Opportunity for industrial driven load growthbull Regional grid infrastructure is too congested to get lowest-cost
power to consumersbull Sub-transmission interconnectionbull Canada has same drivers as US as well as the need to serve
mining interests and hydro generation for export to US load centers
bull Challenged economic conditions in Canada
bull Environmental and other regulatory scrutiny right of way acquisition permitting etc
bull Tepid load growthbull Economybull Energy efficiency initiatives
Oil amp Gas Infrastructure Services Segment Overview
$1870
$2445 $2635 $2801
74 83
54 53
2013 2014 2015 2016Revenue Op Margin
(1) Excludes a $388 million expense associated with an arbitration decision Refer to appendix for non-GAAP reconciliation(2) Includes $73 million of project losses
bull Production of shale natural gas oil and natural gas liquids has grown dramatically and is expected to remain at high levels forthe foreseeable future
bull Much of these resources are in areas that have not been traditional hydrocarbon fuel sources and do not have adequate infrastructure in place to gather store process and transport product
bull Canadian oil production lacks adequate takeaway pipeline infrastructurebull Economics of pipeline transportation is increasingly attractive versus rail in a low oil price environmentbull Pipeline construction capacity is more limited in Canada versus the US and construction capacity constraints could be significant
bull It will take many years and significant energy infrastructure investment to harvest these resources
Shale Gas amp Tight Oil Plays Drive US Natural Gas Production
2000-2040 (trillion cubic feet)
Source EIA Annual Energy Outlook 2017
Tight Oil Drives US Oil Production2000-2040 (millions of barrels per day)
Source EIA Annual Energy Outlook 2015
Canadian Oil Sands amp Conventional Oil Production(Millions of barrels per day)
Source Canadian Assoc of Petroleum Producers
Oil amp Gas Infrastructure Investment Driversbull Need for pipeline and related infrastructure driven by the
significant increase in North American unconventional natural gas and oil production ndash not commodity prices
bull Takeaway pipelines have not been built fast enough to keep pace with hydrocarbon production ndash significant pipeline development needed
bull Large pipeline construction industry capacity is currently tight but could get significantly strained over the next several years
North American Pipeline ForecastProbability Weighted
Quanta Is the Largest Pipeline Construction Company in North America
bull Quanta is the largest pipeline construction company in North America
bull This positions Quanta to provide significant large diameter pipe construction capacity to the industry while remaining active in select shales
bull We are ready to assist our customers in meeting their development goals in what could be a resource challenged environment
North America Major Planned Mainline Project Capex
Source KeyBanc Capital Markets
$0
$5
$10
$15
$20
2016E 2017E 2018E 2019E
In B
illio
ns
In B
illio
ns
Oil amp Gas Infrastructure Investment DriversNatural Gas Distribution amp Pipeline Integritybull US pipeline infrastructure is getting older
bull PHMSA estimates more than 470K miles (37) of US gas distribution mains and 171K miles (57) of gas transmission pipelines were installed before 1970 or in an undocumented year
bull Local Distribution Companies (LDCs) continue increased spend on pipe inspection and replacement
bull Replacement programs ramped up after San Bruno incident in 2010 Utilities are spending $22B a year on transmission and distribution systems(2)
bull Regulations push for expanding inspection programs and accelerating replacement work
bull PHMSA will require more inspection and corrosion control activity which will require additional excavations and integrity work DOErsquos Quadrennial Energy Review emphasizes the need to accelerate pipe replacement to curb emissions from leak-prone pipe
bull Long timelines for some replacement plans will push spend acceleration
bull Current projections are over 20 years for many large utilities a few more than 50 years(3) Replacement activities will have to be accelerated to address risk
bull State regulators establishing cost recovery mechanisms to accelerate replacement programs
Significant Inventory Remains for Replacement
States with Gas Utility Cost Recovery Mechanisms(4)
(1) PHMSA pipe inventory reports 2011-2015(2) AGA 2016 Playbook (3) Department of Energy Quadrennial Energy Review ndash Energy Transmission Storage and Distribution Infrastructure April 2015 (4) American Gas Association Playbook 2017
Stronghold Acquisition Overview
bull Provides catalyst handling turnaround and other downstream services tank storage and other midstream services
bull Specializes in high pressure and high reactor infrastructure services
bull Industry leading safety record employee and training focus with entrepreneurial culture
bull Led by a strong multigenerational highly regarded management team with decades of industry experience
bull Preferred employer with low turnover and high-quality workforce ndash averaging 2800 employees
bull Excellent reputation and strong relationships with a high-quality and diverse client base
bull Strong historical organic growth
21
Stronghold is a leading specialized services company providing high pressure and critical path solutions to the downstream and midstream energy markets
Company Profile
2016 Revenue =Approx $500 Million
Downstream Services
85
Midstream Services
15
Strategic Rationalebull Facilitates capture of a greater portion of energy
industry spend and offers cross-selling opportunities
bull Specialized Industrial Services market is a natural service line expansion for Quanta to meet our customersrsquo needs
bull Complements existing downstream high-voltage power services
bull Stronghold gives Quanta a significant presence in downstream services and a strong platform for growth
bull Strong financial profilebull Attractive historical growth and accretive margin
profile low capex requirements solid cash flow and accretive to earnings
bull Enhances recurring base business revenue
bull Shale oil natural gas and natural gas liquids (NGLs) production driving refinery petrochemical and storage infrastructure needs
Telecom Infrastructure Services Overview
To be an industry leading and true EPC contractor providing comprehensive communications infrastructure solutions to customers in the United States Canada and select markets in Latin America
Goal
Diverse Existing amp Target Customer BaseMarkets Served
Telecom Infrastructure Investment Drivers
bull Telco gigabit fiber to the home deployment programs
bull Cable MSOs deploying DOCSIS 31
bull Upcoming - 5G wireless and fiber backhaul
bull Ongoing 4G wireless network optimization
bull Connect America Fund - rural fiber build-out
bull Federal government funded FirstNet - national wireless network for first responders
United States
bull Backbone and last mile fiber (behind relative to the US)
bull Telco gigabit fiber to the home deployment programs
bull Cable MSOs deploying DOCSIS 31
bull Upcoming - 5G wireless and fiber backhaul
bull Ongoing 4G wireless network optimization
bull Federal government infrastructure initiatives generally positive
Canada
bull Significantly behind North America in both wireline and wireless connectivity
bull However demand for connectivity media and data intensive services is strong
bull Fiber and backhaul networks significantly behind North America
bull Primarily 3G wireless some 4G wireless (country dependent)
bull Various governments have infrastructure expansion initiatives
bull Concession and P3 opportunities
bull Connectivity for quality of life social and commercial reasons
Latin America
Telecom Infrastructure Services Overview
Fiber Builds
Wireless Deployment
Make Ready Services
Civil Construction
Engineering Design
Material Management
EPC
Wireless Wireline
United StatesWireless Wireline
CanadaWireless Wireline
Latin America
Comprehensive Infrastructure Solutions Offered On A Turnkey Discrete Service or EPC Basis
bull Proven greenfield expansion model in Latin America ndash US should be less difficult
Leverage existing US field operations people equipment and property
bull Select strategic acquisitions may play a role but NOT a roll-up approach
Provide wireline and wireless services - heavier on wireline
bull Increasing convergence of wireless and wireline due fiber requirements of both
Project centric nimble approach versus MSA focused EPC services to differentiate
bull Less capital intensive with better margin opportunity
GOAL
STRATEGY
STRATEGY
STRATEGY
STRATEGY
To be the leading communications infrastructure contractor in the markets we serve
Engineer Procure Construct (EPC) Is A Differentiator
bull Quanta has a long history in the EPC business and is increasingly performing select projects on an EPC basisbull Customersrsquo capital programs are at historic levels and growing Projects are getting larger and more complexbull Evolution of regulatory demands competition and alternative pricing models
bull Many customers have limited internal resources and expertise to manage these dynamics and are turning to Quanta for solutions
bull Project cost certainty becoming increasingly important
bull We are enhancing initiatives to ensure we have a scalable comprehensive enterprise-wide capability for EPC projects that is consistently executed across all segments and geographies
bull EPC projects are a meaningful contributor to our current backlog and provide significant opportunity for future growth
Integrated Services
Construction amp Installation
Assessment Planning amp
Development
Engineering amp Design
Procurement Operation and Maintenance
What is Infrastructure Solutions
Infrastructure Solutions represent strategic partnerships with customers and capital partners
bull Public private partnerships (P3)bull Concessionsbull Build Own Operate or Transfer
(BOOT)bull Build to Suit (BTS) arrangements
These solutions are a growth engine for each of our segments and geographies and a core component of our strategic
imperative to deliver differentiated solutions to our customers
Encompasses
Infrastructure Solutions Drivers
A Combination of Drivers are Occurring that Create Demand and Opportunity for Our Infrastructure Solutions
bull Provide transparency to a project shape design constructability risk allocation and overall project structure
bull Manages risk that yields more informed EPC project decisions
bull Improves success rate of both winning the engagement and successful execution
bull Where appropriate we invest alongside our partners
bull Significant capital needs to fund the substantial infrastructure needs
bull Utilization of concessions public private partnerships (P3) and private infrastructure partnerships to fund and attract high-quality entities for complex projects
bull Changes in regulation (such as FERC Order 1000)
bull New entrants together with high interest and availability of investor infrastructure investment capital
Quanta Is A True Partner
bull Quanta increasingly sought as a partner for our execution capabilities the need for price certainty and our financial strength
bull Projects are larger more complex greater scope Typically under lump-sum turnkey arrangements which create greater opportunities and risks for Quanta
bull Successful Infrastructure Solutions and project execution track record
Quanta Sought for Executionamp Track Record
Market Structure amp Projects Getting More Complex
29
Fully Integrated Solutions Based Provider
Infrastructure Solutions Provides A Solutions Based Tool for Quanta to Partner with Customers Enhance Relationships and Create New Customer and Project Opportunities
EPC
Capitalbull Determine capital structurebull Source capitalbull Quanta minority direct
investmentbull First Infrastructure Capital
Advisors
PartnershipsPartner withbull Customersbull Equity Capital
(4) Includes $802 million of expense net of tax or $036 per diluted share from an arbitration decision charge to provision for long-term contract receivable and the benefit associated with release of certain income tax contingencies
2013 2014 2015 2016 2017 Est
($ in millions)Revenue
$140$122
$062
$126
$163
2013 2014 2015 2016 2017Est
(4)
(5)
(6)
Electric Power Oil amp Gas Infrastructure
GAAP Diluted EPS (1)
$156
$185
$111
$151
$195
2013 2014 2015 2016 2017Est
Adjusted Diluted EPS (1)
$6412
(2) Represents the midpoint of guidance range
(2)
$7747
(2) (2) $173
(3) Includes $033 gain from sale of Howard Energy investment
$9300(3)
(1) From continuing operations
$7572
(5) Includes $734 million of project losses Also includes $454 million of expense net of tax or $023 per diluted share from net asset impairment charges
$7651
(6) Includes $548 million of project losses and $71 million of expense net of tax or $005 per diluted share from net asset impairment charges Also includes tax benefits of $205 million or $013 per share associated with the expiration of various federal and state tax statute of limitations periods
Recent Financial Performance amp 2017 ExpectationsFor the Years Ended December 31
($ in millions)Electric Power
$4542
$5303$4937 $4850
115107
7583
2013 2014 2015 2016 2017 Est
Revenue Op Margin
(2)
(1) Operating margin excludes a $1025 million charge to cost of services for long-term contract receivable in 2014 Refer to appendix for non-GAAP reconciliation(2) Excludes a $66 million property and equipment impairment charge Includes the impact of $661 million of project losses Refer to appendix for non-GAAP reconciliation(3) Excludes a $57 million asset impairment charge Includes the impact of $548 million of project losses Refer to appendix for non-GAAP reconciliation
(1) (1)
(2)(3)
f Est revenue growth approaching 15 vs 2016
Est operating incomemargins of 90 to 95
Guidance Commentary($ in millions)
Oil amp Gas Infrastructure
(4) Excludes a $388 million expense associated with an arbitration decision Refer to appendix for non-GAAP reconciliation(5) Includes $73 million of project losses
Liquidity includes cash and cash equivalents and availability under our revolving credit facility as described in our Form 10k
Historical Cash Flow Generation
$163
$15
$434
$191
2013 2014 2015 2016
Cash Flow from Continuing Operations
($ in millions)
Free Cash Flow from Continuing Operations
$371
$248
$618
$381
2013 2014 2015 2016
Net cash provided by operating activities from continuing operations plus proceeds from sale of property and equipment less additions of property and equipment
For the Years Ending December 31($ in millions)
For the Years Ending December 31
Committed to Generating Shareholder Value
Executed on $125 Billion Share Repurchase Authorizationbull Aug 2015 ndash Announced a new $125 billion share repurchase
authorization through Feb 28 2017bull Completed a $750 million accelerated stock repurchase (ASR)
arrangement in April 2016bull Acquired 351 million shares at $2136 per share
bull $500 million for opportunistic repurchases through Feb 28 2017bull $450 million 192 million shares retired
Completed $500 Million Share Repurchase Authorizationbull Completed previous $500 million share repurchase program in 2015bull Acquired approximately 174 million shares for total cost of $500
million
Acquired $17 Billion of Quanta Common Stock
Under Previous Programs Quanta Has Acquired Approximately 32 of Its Outstanding Stock
$2197$1951
$1573 $1573
0
25
50
75
100
125
150
175
200
225
$0000
$500000
$1000000
$1500000
$2000000
$2500000
$3000000
2014 2015 2016 2017E
Net Income Required to Generate $001 In EPS
Avg Dil Shs Out
Earnings Power Improvement
$ in
Tho
usan
ds
Shares in Millions
May 25 2017 ndash Announced New $300 Million Share Repurchase Authorizationbull Up to $300 million through June 30 2020
Opportunistic amp Disciplined Capital Allocation
Capital Deployment Preference (Amounts in millions)
bull Working Capitalbull Capital Expendituresbull Acquisitionsbull Investmentsbull Return of Capital
bull Generally in sync with preference however hellip
bull Financial strength provides the ability to be opportunistic
bull Flexible and strategic capital allocation is a competitive advantage
Capital Deployment Posture
Financial Strength Allows for Flexible and Strategic Capital Allocation ndash A Competitive Advantage
2013 ndash 2016 Sources amp Uses of Cash
Sources
Cash Flow fromOperations
DivestitureProceeds
BorrowingsInvestment Sales
$3099
$1667
$842
$369$221
Uses
StockRepurchase
CAPEX amp OtherNet
Acquisitions Net
Investments
$1700
$900
$728
$54$3382
54
27
127
50
27
21
2
Amounts reflect the retrospective application of a recent accounting pronouncement related to the classification of tax withholding payments for share-based compensation
Foundation For Growth amp Improved Profitability
Multi-Year Growth Opportunities
Innovative Industry Leading Solutions
Scale amp Scope
Financial Strength
Operational amp Safety Excellence
QuantaServicesIR
QuantaIR
Connect With Quanta Services Investor Relations
Corporate Office2800 Post Oak Blvd Suite 2600Houston TX 77056713-629-7600wwwquantaservicescom
Investor ContactKip Rupp CFAVice President ndash Investor Relations713-341-7260investorsquantaservicescom
Reconciliation of Adjusted Net Income from Continuing Operations Attributable to Common Stock
2013 2014 2015 2016 2017 2017Reconciliation of adjusted net income from continuing operations attributable to common stockNet income from continuing operations attributable to common stock (GAAP as reported) 372057$ 269224$ 120286$ 198725$ 247000$ 275300$ Adjustments
Asset impairment charges - - 58451 7964 - -Severance and restructuring charges - - - 6352 - -Acquisition and integration costs 8145 14754 7966 3053 9300 9300 Impact of income tax contingency releases (9935) (8099) - (20488) - -Impact of tax benefit from realization of previously unrecognized deferred tax asset - - (4228) - - -Impact of Alberta tax law change - - 4982 - - -Provision for long-term contract receivable - 102460 - - - -Arbitration expense - 38848 - - - -Impact of sale of equity ownership in Howard Energy (112744) - - - - -Income tax impact of adjustments 39836 (55935) (16186) (3982) (3400) (3400)
Adjusted net income from continuing operations attributable to common stock before certain non-cash adjustments 297359 361252 171271 191624 252900 281200
Non-cash stock based compensation 34381 37449 36939 41134 47000 47000 Amortization of intangible assets 25865 34257 34848 31685 30600 30600 Income tax impact of non-cash adjustments (22715) (26453) (25817) (26183) (28500) (28500)
Adjusted net income from continuing operations attributable to common stock 334890$ 406505$ 217241$ 238260$ 302000$ 330300$ Weighted average sharesWeighted average shares outstanding for diluted earnings per share 214978 219690 195120 157288 157300 157300 Weighted average shares outstanding for adjusted diluted earnings per share 214978 219690 195120 157288 157300 157300 Diluted earnings per share from continuing operations attributable to common stock and adjusted diluted earnings per share from continuing operations attributable to common stockDiluted earnings per share from continuing operations attributable to common stock 173$ 123$ 062$ 126$ 157$ 175$ Adjusted diluted earnings per share from continuing operations attributable to common stock 156$ 185$ 111$ 151$ 192$ 210$
Estimated Guidance Range
For the Years Ended December 31
(in thousands except per share information)(Unaudited)
Recast of Adjusted Diluted
Reconciliation of Electric Power and Oil amp Gas Infrastructure Services Segments Operating Income As Adjusted
Amounts in millions except percentagesOil amp Gas
Infrastructure12312014 12312015 12312016 12312014
Revenues 53027$ 49373$ 48505$ 24446$
Operating Income (as reported) 4630 3623 3957 1628
Addback Provisions for long term contract receivable 1025 - - - Arbitration expense - - - 388 Asset impairment charge - 66 57 -
Operating Income (as adjusted) 5655$ 3689$ 4014$ 2016$
Operating income margin (as reported) 87 73 82 67Operating income margin (as adjusted) 107 75 83 83
Electric Power
Sheet1
Reconciliation of Free Cash Flow
2013 2014 2015 2016Net Cash Provided by Operating Activities of Continuing Operations 370558 247742 618183 381176 Less Net Capital ExpendituresAdditions of Property and Equipment (221946) (247216) (209968) (212555) Proceeds from Sale of Property and Equipment 14789 14448 26178 21975 Net Capital Expenditures (207157) (232768) (183790) (190580)
Free Cash Flow 163401 14974 434393 190596
Free Cash Flow from Cont Ops
Forward Looking Statement DisclaimerThis presentation (and oral statements regarding the subject matter of this presentation) includes ldquoforward-looking statementsrdquo intended to qualify for the safe harbor from liability established by the Private Securities Litigation Reform Act of 1995 These statements reflect assumptions expectations projections intentions or beliefs about future events and use words such as anticipate estimate project forecast may will should could expect believe plan intend and other words of similar meaning You can identify these statements by the fact that they do not relate strictly to historical or current facts In particular these include but are not limited to statements relating to the following
bull Projected revenues net income earnings per share attributable to common stock backlog margins capital expenditures weighted average shares outstanding tax rates and other projections of operating or financial resultsbull Our business or financial outlook growth or opportunities in particular marketsbull The potential benefits from acquisitions and investmentsbull The expected financial and operational performance of acquired businessesbull Future capital allocation initiativesbull Our ability to deliver increased value and return capital to stockholders bull The strategic use of our balance sheetbull The expected value of contracts or intended contracts with customersbull The scope services term and results of any projects awarded or expected to be awarded for services to be provided by usbull The anticipated commencement and completion dates for any projects awardedbull The development of larger electric transmission and oil and natural gas pipeline projects and the level of oil natural gas and natural gas liquids prices and their impact on our business or the demand for our services bull The impact of existing or potential energy legislation bull Potential opportunities that may be indicated by bidding activity or discussions with customersbull The expected outcome of pending or threatened litigation bull Beliefs and assumptions about the collectability of receivablesbull The business plans or financial condition of our customersbull Our plans and strategies bull The current economic and regulatory conditions and trends in the industries we serve bull Possible recovery on pending or contemplated change orders or affirmative claims against customers or third parties and bull Other statements reflecting expectations intentions assumptions or beliefs about future events and other statements that do not relate strictly to historical or current facts
Although our management believes that the expectations reflected in such forward-looking statements are reasonable it can give no assurance that such expectations will prove to be correct These forward-looking statements are not guarantees of future performance and involve or rely on a number of risks uncertainties and assumptions that are difficult to predict or beyond our control These forward-looking statements reflect our beliefs and assumptions based on information available to our management at the time the statements are made We caution you that actual outcomes and results may differ materially from what is expressed implied or forecasted by our forward-looking statements and that any or all of our forward-looking statements may turn out to be wrong Forward-looking statements can be affected by inaccurate assumptions and by known or unknown risks and uncertainties including the following
bull Market conditionsbull The effects of industry economic financial or political conditions outside our control including weakness in capital marketsbull Quarterly variations in our operating resultsbull Trends and growth opportunities in relevant marketsbull The cost of borrowing availability of credit and cash fluctuations in the price and volume of our common stock debt covenant compliance interest rate fluctuations and other factors affecting our financing and investing activitiesbull Delays reductions in scope or cancellations of anticipated pending or existing projects including as a result of weather regulatory or permitting issues environmental processes project performance issues claimed force majeure events or our customers capital
constraintsbull The successful negotiation execution performance and completion of anticipated pending and existing contracts including the ability to obtain awards of projects on which we bid or are otherwise discussing with customersbull Our ability to retain key personnel and qualified employees
Forward Looking Statement Disclaimerbull Our ability to attract or the potential shortage of skilled labor bull Our dependence on fixed price contracts and the potential to incur losses with respect to the contractsbull Estimates relating to our use of percentage-of-completion accountingbull Adverse weatherbull Our ability to generate internal growthbull Competition in our business including our ability to effectively compete for new projects and market sharebull The effect of natural gas natural gas liquids and oil prices on our operations and growth opportunities and on
our customersrsquo capital programs and demand for our servicesbull The future development of natural resourcesbull The failure of existing or potential legislative actions to result in demand for our servicesbull Liabilities associated with multiemployer pension plans including underfunding of liabilities and termination
or withdrawal liabilitiesbull The possibility of further increases in the liability associated with our withdrawal from a multiemployer
pension planbull Unexpected costs or liabilities that may arise from pending or threatened litigation indemnity obligations or
other claims asserted against us including liabilities for claims that are self-insured or uninsuredbull The outcome of pending or threatened litigationbull Risks relating to the potential unavailability or cancellation of third party insurance the exclusion of coverage
for certain losses and potential increases in premiums for coverage deemed beneficial to usbull Cancellation provisions within our contracts and the risk that contracts expire and are not renewed or are
replaced on less favorable termsbull Loss of customers with whom we have long-standing or significant relationshipsbull The potential that participation in joint ventures or similar structures exposes us to liability andor harm to
our reputation for acts or omissions by our partnersbull Our inability or failure to comply with the terms of our contracts which may result in additional costs
unexcused delays warranty claims failure to meet performance guarantees damages or contract terminations
bull The inability or refusal of our customers to pay for services including the failure to collect outstanding receivables
bull The failure to recover on payment claims against project owners or third party contractors or to obtain adequate compensation for customer-requested change orders
bull The failure of our customers to comply with regulatory requirements applicable to their projects which may result in project delays and cancellations
bull Budgetary or other constraints that may reduce or eliminate tax incentives or government funding for projects which may result in project delays or cancellations
bull Estimates and assumptions in determining our financial results and backlogbull Our ability to realize our backlogbull Risks associated with operating in international markets including instability of foreign governments
currency fluctuations tax and investment strategies as well as compliance with foreign legal systems and cultural practices the US Foreign Corrupt Practices Act and other applicable anti-bribery and anti-corruption laws
bull Our ability to successfully identify complete integrate and realize synergies from acquisitionsbull The potential adverse impact resulting from uncertainty surrounding investments and acquisitions including
the ability to retain key personnel from the acquired businesses and the potential increase in risks already existing in our operations
bull The adverse impact of impairments of goodwill receivables property equipment and other intangible assets or investments
bull Our growth outpacing our decentralized management and infrastructurebull Requirements relating to governmental regulation and changes theretobull Inability to enforce our intellectual property rights or the obsolescence of such rightsbull Risks related to the implementation of an information technology solutionbull The impact of our unionized workforce on our operations including labor stoppages or interruptions due to
strikes or lockoutsbull Potential liabilities and other adverse effects arising from occupational health and safety mattersbull Our dependence on suppliers subcontractors equipment manufacturers and other third party contractorsbull Fluctuations of prices of certain materials used in our businessbull The ability to access sufficient funding to finance desired growth and operationsbull Our ability to obtain performance bondsbull Potential exposure to environmental liabilitiesbull Our ability to continue to meet certain requirements applicable to us and our subsidiariesbull Rapid technological and other structural changes that could reduce the demand for our servicesbull New or changed tax laws treaties or regulationsbull Increased healthcare costs arising from healthcare reform legislation or other governmental actionbull Regulatory changes that result in increased labor costsbull Significant fluctuations in foreign currency exchange rates andbull The other risks and uncertainties as are described elsewhere herein and in our Annual Report on Form 10-K for
the year ended December 31 2016 filed with the SEC and as may be detailed from time to time in our other public filings with the SEC
All of our forward-looking statements whether written or oral are expressly qualified by these cautionary statements and any other cautionary statements that may accompany such forward-looking statements or that are otherwise included in this presentation Should one or more of these risks materialize or should underlying assumptions prove incorrect actual results may vary materially from those expressed or implied in any forward-looking statements Investors are cautioned not to place undue reliance on these forward-looking statements which are current only as of this date We do not undertake and expressly disclaim any obligation to update or revise any forward-looking statements to reflect events or circumstances after the date of this presentation or otherwise and we expressly disclaim any written or oral statements made by any third party regarding the subject matter of this presentation
Slide Number 1
Forward Looking Statement Disclaimer
Key Takeaways
Leading Integrated Infrastructure Solutions Provider
Overview ndash Strategically Focused Operationally Diverse
Overview - Diverse and High Quality Customer Base
Leading Integrated Infrastructure Solutions Provider
Strategic Imperatives
Strategic Imperatives Deliver Profitable Growth
Strategic Acquisitions Criteria and Rationale
Differentiated Competitive Position ndash In the Sweet Spot
Differentiated Competitive Position ndash In the Sweet Spot
Electric Power Infrastructure Services Segment Overview
Power Grid Investment Drivers - Transmission
Power Grid Investment Drivers - Transmission
Power Grid Investment Drivers - Distribution
Oil amp Gas Infrastructure Services Segment Overview
Reconciliation of Adjusted Net Income from Continuing Operations Attributable to Common Stock
Reconciliation of Electric Power and Oil amp Gas Infrastructure Services Segments Operating Income As Adjusted
Reconciliation of Free Cash Flow
Forward Looking Statement Disclaimer
Forward Looking Statement Disclaimer
Free Cash Flow From Continuing Operations
Source
2013
2014
2015
2016
(Support Cash Flow Statement)
Net Cash Provided by Operating Activities of Continuing Operations
370558
247742
618183
381176
(Support Cash Flow Statement)
Less Net Capital Expenditures
(Support Cash Flow Statement)
Additions of Property and Equipment
(221946)
(247216)
(209968)
(212555)
(Support Cash Flow Statement)
Proceeds from Sale of Property and Equipment
14789
14448
26178
21975
(Recalculation)
Net Capital Expenditures
(207157)
(232768)
(183790)
(190580)
(Recalculation)
Free Cash Flow
163401
14974
434393
190596
Adjusted Operating Income Margin
$ in millions
Support for slide 23
Amounts in millions except percentages
Electric Power
Oil amp Gas Infrastructure
123114
123115
123116
123114
Revenues
$ 53027
$ 49373
$ 48505
$ 24446
Operating Income (as reported)
4630
3623
3957
1628
Addback
Provisions for long term contract receivable
1025
-0
-0
-0
Arbitration expense
-0
-0
-0
388
Asset impairment charge
-0
66
57
-0
Operating Income (as adjusted)
$ 5655
$ 3689
$ 4014
$ 2016
Operating income margin (as reported)
87
73
82
67
Operating income margin (as adjusted)
107
75
83
83
Quanta Services Inc and Subsidiaries
Reconciliation of Non-GAAP Financial Measures
Adjusted Diluted Earnings Per Share from Continuing Operations
For the Years Ended December 31
(in thousands except per share information)
(Unaudited)
Estimated Guidance Range
2013
2014
2015
2016
2017
2017
Reconciliation of adjusted net income from continuing operations attributable to common stock
Net income from continuing operations attributable to common stock (GAAP as reported)
$ 372057
$ 269224
$ 120286
$ 198725
$ 247000
$ 275300
Adjustments
Asset impairment charges
-
-
58451
7964
-
-
Severance and restructuring charges
-
-
-
6352
-
-
Acquisition and integration costs
8145
14754
7966
3053
9300
9300
Impact of income tax contingency releases
(9935)
(8099)
-
(20488)
-
-
Impact of tax benefit from realization of previously unrecognized deferred tax asset
-
-
(4228)
-
-
-
Impact of Alberta tax law change
-
-
4982
-
-
-
Provision for long-term contract receivable
-
102460
-
-
-
-
Arbitration expense
-
38848
-
-
-
-
Impact of sale of equity ownership in Howard Energy
(112744)
-
-
-
-
-
Income tax impact of adjustments
39836
(55935)
(16186)
(3982)
(3400)
(3400)
Adjusted net income from continuing operations attributable to common stock before certain non-cash adjustments
297359
361252
171271
191624
252900
281200
Non-cash stock based compensation
34381
37449
36939
41134
47000
47000
Amortization of intangible assets
25865
34257
34848
31685
30600
30600
Income tax impact of non-cash adjustments
(22715)
(26453)
(25817)
(26183)
(28500)
(28500)
Adjusted net income from continuing operations attributable to common stock
$ 334890
$ 406505
$ 217241
$ 238260
$ 302000
$ 330300
Weighted average shares
Weighted average shares outstanding for diluted earnings per share
214978
219690
195120
157288
157300
157300
Weighted average shares outstanding for adjusted diluted earnings per share
214978
219690
195120
157288
157300
157300
Diluted earnings per share from continuing operations attributable to common stock and adjusted diluted earnings per share from continuing operations attributable to common stock
Diluted earnings per share from continuing operations attributable to common stock
$ 173
$ 123
$ 062
$ 126
$ 157
$ 175
Adjusted diluted earnings per share from continuing operations attributable to common stock
$ 156
$ 185
$ 111
$ 151
$ 192
$ 210
2017 Forecast
2008
2009
2010
2011
2012
2013
2014
2015
2016
2017
2018
2019
2020
2021
2022
US IOU
17599783395
17375430450
17116821481
17473265629
19719353886
18593206538
21049378470
23210018195
24651006483
28003750000
29530700000
30481300000
30509750000
31231850000
31138000000
Co-ops
3679033739
3613552751
2806195753
3044502916
2639012201
3360515403
3050612075
2834000972
3277074511
3309845256
3342943708
3376373145
3410136877
3444238245
3478680628
MuniGovt Owned
2525145025
2693819865
2624788344
2608815562
2682098477
2938725525
3183015391
3330273309
3454862656
3664198000
3769427295
3778921940
3483677493
3817389338
3817389338
Canadian
3324942988
3202431553
3726264949
4213182949
4228837570
4323705834
4106960884
3465854177
3159852215
3254697600
3381315300
3453964800
3380277450
3406223700
3406223700
Total NA 2017 Market
27128905147
26885234619
26274070528
27339767056
29269302134
29216153300
31389966819
32840146653
34542795864
38232490856
40024386303
41090559885
40783841819
41899701283
41840293665
From August 2015 Report
North American Electric Distribution Spending
2008
2009
2010
2011
2012
2013
2014
2015
2016
2017
2018
2019
2020
US IOUs
$175
$173
$171
$174
$197
$186
$210
$226
$244
$244
$247
$249
$250
US Co-ops
$27
$29
$27
$29
$35
$41
$34
$39
$40
$40
$41
$42
$42
US Muni
$25
$26
$26
$28
$28
$29
$29
$30
$31
$31
$32
$32
$33
Total US
$226
$227
$224
$231
$260
$256
$273
$295
$314
$316
$320
$323
$325
Canada
$33
$33
$34
$39
$38
$39
$39
$38
$41
$41
$42
$43
$43
Total
$260
$261
$259
$269
$298
$294
$312
$333
$354
$357
$362
$365
$368
15 vs 16
$00
$01
$02
$04
($01)
($04)
$06
$04
$08
$21
$19
$28
$26
From August 2016 Report
North American Electric Distribution Spending
2008
2009
2010
2011
2012
2013
2014
2015
2016
2017
2018
2019
2020
US IOUs
$176
$174
$171
$175
$197
$186
$210
$232
$258
$270
$271
$281
$281
US Co-ops
$27
$29
$27
$29
$31
$33
$38
$39
$40
$41
$41
$42
$43
US Muni
$25
$26
$26
$28
$28
$29
$29
$30
$31
$31
$32
$33
$33
Total US
$228
$229
$224
$232
$256
$248
$277
$301
$329
$342
$344
$356
$357
Canada
$32
$32
$37
$41
$41
$42
$41
$36
$33
$36
$37
$37
$37
Total
$260
$261
$261
$273
$297
$290
$318
$337
$362
$378
$381
$393
$394
From September 2017 Report
North American Electric Distribution Spending
2008
2009
2010
2011
2012
2013
2014
2015
2016
2017
2018
2019
2020
2021
2022
US IOUs
$176
$174
$171
$175
$197
$186
$210
$232
$247
$280
$295
$305
$305
$312
$311
US Co-ops
$37
$36
$28
$30
$26
$34
$31
$28
$33
$33
$33
$34
$34
$34
$35
US Muni
$25
$27
$26
$26
$27
$29
$32
$33
$35
$37
$38
$38
$35
$38
$38
Total US
$238
$237
$225
$231
$250
$249
$273
$294
$314
$350
$366
$376
$374
$385
$384
Canada
$33
$32
$37
$42
$42
$43
$41
$35
$32
$33
$34
$35
$34
$34
$34
Total
$271
$269
$263
$273
$293
$292
$314
$328
$345
$382
$400
$411
$408
$419
$418
2015 vs 2016 vs 2017
2015 Est
2016 Est
2017 Est
Avg 08-11
$262
$264
$269
Avg 12-15
$309
$311
$307
2016
$354
$362
$345
2017
$357
$378
$382
2018
$362
$381
$400
2019
$365
$393
$411
2020
$368
$394
$408
2021
$419
2022
$418
2017
Leading Integrated Infrastructure Solutions Provider
bull Grow the base business and compliment with larger scale projects
bull Organic growth and strategic acquisitions
bull Pricing discipline and risk management
bull Focus on safe executionbull Cost managementbull Maintain financial strength
TimeRe
venu
es
Coupled with successful implementation of other strategic imperatives hellip
Larger Projects
For illustrative purposes
Strategic Acquisitions Criteria and Rationale
Acquisition Strategic Rationale
bull Acquisitions have and will continue to play a strategic role in differentiating Quanta in the marketplace and positioning the company for profitable long-term growth
bull Seek well respected entrepreneurial leadership with extensive history of operational excellencebull Only interested in companies that bring strategic value to Quanta and provide opportunity for 1+1=3 growth
opportunity over time
bull Brings leadership position in new geographybull Enhances presence and capabilities in an existing
geographybull Brings or enhances customer relationshipsbull Brings leadership position in adjacent or new
marketbull Brings unique service or technology that Quanta
can leverage to further differentiate its turnkey solution offering
Typical Deal Terms
bull Target 4x-5x EBITDA multiplebull 40 of consideration in Quanta stock 60 of
consideration in cashbull Meaningful stock component for operational and
stakeholder alignment
bull Company leadership stays on to run the businessbull Non-compete agreementsbull Stock locked up for period of time
Differentiated Competitive Position ndash In the Sweet Spot
bull Quanta is the largest infrastructure specialty contractor in North America
bull Unmatched scope providing broader solutions to customersbull Unmatched scale as the largest employer of skilled workforce in
the industry ndash more than 35000 employeesbull Track record of safe executionbull Projects are getting larger and more complex customers
increasingly seeking cost certainty and performancebull Quanta has consistently been working on numerous large
projects simultaneously for the past + six yearsbull Significant revenues from strategic relationships recurring work
and an increasing amount of negotiated work
Quanta vs Specialty Contractors Quanta vs Traditional EampCs
bull Today our customers believe skilled construction labor is a finite resource and critical to overall project success where engineering and procurement are more commoditized
bull Quanta has the largest skilled workforce in the industry ndash more than 35000 employees
bull Quanta self-performs its projects ndash controls quality and executionbull EampCs typically provide project management oversight and have
limited self-perform construction capabilitiesbull Quanta derives significant revenues from strategic relationships
recurring work and an increasing amount of negotiated workbull Price is often the primary driver of who wins EampC projects
Est Large Project Capability
Bubble Size = Avg Market Cap
0
20
40
60
80
100
Est
Self
Perfo
rm C
apab
ility
Bubble Size = Avg Market Cap
LargerSmaller
Differentiated Competitive Position ndash In the Sweet Spotbull Quanta is uniquely positioned to meet
customer needs versus both specialty contractors and traditional engineering and construction companies
bull Customers understand that skilled labor is critical to project success
bull Projects are getting larger and more complex and customers are increasingly seeking comprehensive solutions
bull Demand for specialty construction resources is high and increasing but supply is limited
bull Quanta has the largest infrastructure specialty contractor workforce in North America +35000 employees globally
bull Quanta has strategically invested in engineering and program management to provide true complete engineering procurement and construction (EPC) solutions
0
20
40
60
80
100
Est
Self
Perf
orm
Cap
abili
ty
Est Large Project Capability
Bubble Size = Avg Market Cap
LargerSmaller
Electric Power Infrastructure Services Segment Overview
$4542$5303 $4937 $4850
115 10775 83
2013 2014 2015 2016Revenue Op Margin
(2)
(1) Operating margin excludes a $1025 million charge to cost of services for long-term contract receivable in 2014 Refer to appendix for non-GAAP reconciliation(2) Excludes a $66 million property and equipment charge in 2015 and a $57 million asset impairment charge in 2016 Includes the impact of $661 million in 2015 and $548 million in 2016 of project losses Refer to appendix for non-GAAP reconciliation
Differentiatorsbull Largest TampD solutions provider in North
Americabull Reputation and Track Recordbull Unmatched Solutions Scope and Scalebull Safety Recordbull Manpower and Equipment Resourcesbull Lazy Q Training Facilitybull Energized Servicesbull EPC Capabilities Across All Offeringsbull Infrastructure Capital Solutions
Market Drivers
Power Grid Investment Drivers - Transmission
bull An aging grid that requires repair upgrade and maintenancebull Favorable transmission regulation Energy Policy Act of lsquo05
NERC Reliability Standards possibly FERC Order 1000 over the long-term
bull More stringent reliability standards will require repairing lines and adding redundant capacity
bull Coal and nuclear generation retirements and switching to natural gas and renewable generation strains the grid
bull Existing and new renewable generation needs interconnection to the grid
bull Opportunity for industrial driven load growthbull Regional grid infrastructure is too congested to get lowest-cost
power to consumersbull Sub-transmission interconnectionbull Canada has same drivers as US as well as the need to serve
mining interests and hydro generation for export to US load centers
bull Challenged economic conditions in Canada
bull Environmental and other regulatory scrutiny right of way acquisition permitting etc
bull Tepid load growthbull Economybull Energy efficiency initiatives
Oil amp Gas Infrastructure Services Segment Overview
$1870
$2445 $2635 $2801
74 83
54 53
2013 2014 2015 2016Revenue Op Margin
(1) Excludes a $388 million expense associated with an arbitration decision Refer to appendix for non-GAAP reconciliation(2) Includes $73 million of project losses
bull Production of shale natural gas oil and natural gas liquids has grown dramatically and is expected to remain at high levels forthe foreseeable future
bull Much of these resources are in areas that have not been traditional hydrocarbon fuel sources and do not have adequate infrastructure in place to gather store process and transport product
bull Canadian oil production lacks adequate takeaway pipeline infrastructurebull Economics of pipeline transportation is increasingly attractive versus rail in a low oil price environmentbull Pipeline construction capacity is more limited in Canada versus the US and construction capacity constraints could be significant
bull It will take many years and significant energy infrastructure investment to harvest these resources
Shale Gas amp Tight Oil Plays Drive US Natural Gas Production
2000-2040 (trillion cubic feet)
Source EIA Annual Energy Outlook 2017
Tight Oil Drives US Oil Production2000-2040 (millions of barrels per day)
Source EIA Annual Energy Outlook 2015
Canadian Oil Sands amp Conventional Oil Production(Millions of barrels per day)
Source Canadian Assoc of Petroleum Producers
Oil amp Gas Infrastructure Investment Driversbull Need for pipeline and related infrastructure driven by the
significant increase in North American unconventional natural gas and oil production ndash not commodity prices
bull Takeaway pipelines have not been built fast enough to keep pace with hydrocarbon production ndash significant pipeline development needed
bull Large pipeline construction industry capacity is currently tight but could get significantly strained over the next several years
North American Pipeline ForecastProbability Weighted
Quanta Is the Largest Pipeline Construction Company in North America
bull Quanta is the largest pipeline construction company in North America
bull This positions Quanta to provide significant large diameter pipe construction capacity to the industry while remaining active in select shales
bull We are ready to assist our customers in meeting their development goals in what could be a resource challenged environment
North America Major Planned Mainline Project Capex
Source KeyBanc Capital Markets
$0
$5
$10
$15
$20
2016E 2017E 2018E 2019E
In B
illio
ns
In B
illio
ns
Oil amp Gas Infrastructure Investment DriversNatural Gas Distribution amp Pipeline Integritybull US pipeline infrastructure is getting older
bull PHMSA estimates more than 470K miles (37) of US gas distribution mains and 171K miles (57) of gas transmission pipelines were installed before 1970 or in an undocumented year
bull Local Distribution Companies (LDCs) continue increased spend on pipe inspection and replacement
bull Replacement programs ramped up after San Bruno incident in 2010 Utilities are spending $22B a year on transmission and distribution systems(2)
bull Regulations push for expanding inspection programs and accelerating replacement work
bull PHMSA will require more inspection and corrosion control activity which will require additional excavations and integrity work DOErsquos Quadrennial Energy Review emphasizes the need to accelerate pipe replacement to curb emissions from leak-prone pipe
bull Long timelines for some replacement plans will push spend acceleration
bull Current projections are over 20 years for many large utilities a few more than 50 years(3) Replacement activities will have to be accelerated to address risk
bull State regulators establishing cost recovery mechanisms to accelerate replacement programs
Significant Inventory Remains for Replacement
States with Gas Utility Cost Recovery Mechanisms(4)
(1) PHMSA pipe inventory reports 2011-2015(2) AGA 2016 Playbook (3) Department of Energy Quadrennial Energy Review ndash Energy Transmission Storage and Distribution Infrastructure April 2015 (4) American Gas Association Playbook 2017
Stronghold Acquisition Overview
bull Provides catalyst handling turnaround and other downstream services tank storage and other midstream services
bull Specializes in high pressure and high reactor infrastructure services
bull Industry leading safety record employee and training focus with entrepreneurial culture
bull Led by a strong multigenerational highly regarded management team with decades of industry experience
bull Preferred employer with low turnover and high-quality workforce ndash averaging 2800 employees
bull Excellent reputation and strong relationships with a high-quality and diverse client base
bull Strong historical organic growth
21
Stronghold is a leading specialized services company providing high pressure and critical path solutions to the downstream and midstream energy markets
Company Profile
2016 Revenue =Approx $500 Million
Downstream Services
85
Midstream Services
15
Strategic Rationalebull Facilitates capture of a greater portion of energy
industry spend and offers cross-selling opportunities
bull Specialized Industrial Services market is a natural service line expansion for Quanta to meet our customersrsquo needs
bull Complements existing downstream high-voltage power services
bull Stronghold gives Quanta a significant presence in downstream services and a strong platform for growth
bull Strong financial profilebull Attractive historical growth and accretive margin
profile low capex requirements solid cash flow and accretive to earnings
bull Enhances recurring base business revenue
bull Shale oil natural gas and natural gas liquids (NGLs) production driving refinery petrochemical and storage infrastructure needs
Telecom Infrastructure Services Overview
To be an industry leading and true EPC contractor providing comprehensive communications infrastructure solutions to customers in the United States Canada and select markets in Latin America
Goal
Diverse Existing amp Target Customer BaseMarkets Served
Telecom Infrastructure Investment Drivers
bull Telco gigabit fiber to the home deployment programs
bull Cable MSOs deploying DOCSIS 31
bull Upcoming - 5G wireless and fiber backhaul
bull Ongoing 4G wireless network optimization
bull Connect America Fund - rural fiber build-out
bull Federal government funded FirstNet - national wireless network for first responders
United States
bull Backbone and last mile fiber (behind relative to the US)
bull Telco gigabit fiber to the home deployment programs
bull Cable MSOs deploying DOCSIS 31
bull Upcoming - 5G wireless and fiber backhaul
bull Ongoing 4G wireless network optimization
bull Federal government infrastructure initiatives generally positive
Canada
bull Significantly behind North America in both wireline and wireless connectivity
bull However demand for connectivity media and data intensive services is strong
bull Fiber and backhaul networks significantly behind North America
bull Primarily 3G wireless some 4G wireless (country dependent)
bull Various governments have infrastructure expansion initiatives
bull Concession and P3 opportunities
bull Connectivity for quality of life social and commercial reasons
Latin America
Telecom Infrastructure Services Overview
Fiber Builds
Wireless Deployment
Make Ready Services
Civil Construction
Engineering Design
Material Management
EPC
Wireless Wireline
United StatesWireless Wireline
CanadaWireless Wireline
Latin America
Comprehensive Infrastructure Solutions Offered On A Turnkey Discrete Service or EPC Basis
bull Proven greenfield expansion model in Latin America ndash US should be less difficult
Leverage existing US field operations people equipment and property
bull Select strategic acquisitions may play a role but NOT a roll-up approach
Provide wireline and wireless services - heavier on wireline
bull Increasing convergence of wireless and wireline due fiber requirements of both
Project centric nimble approach versus MSA focused EPC services to differentiate
bull Less capital intensive with better margin opportunity
GOAL
STRATEGY
STRATEGY
STRATEGY
STRATEGY
To be the leading communications infrastructure contractor in the markets we serve
Engineer Procure Construct (EPC) Is A Differentiator
bull Quanta has a long history in the EPC business and is increasingly performing select projects on an EPC basisbull Customersrsquo capital programs are at historic levels and growing Projects are getting larger and more complexbull Evolution of regulatory demands competition and alternative pricing models
bull Many customers have limited internal resources and expertise to manage these dynamics and are turning to Quanta for solutions
bull Project cost certainty becoming increasingly important
bull We are enhancing initiatives to ensure we have a scalable comprehensive enterprise-wide capability for EPC projects that is consistently executed across all segments and geographies
bull EPC projects are a meaningful contributor to our current backlog and provide significant opportunity for future growth
Integrated Services
Construction amp Installation
Assessment Planning amp
Development
Engineering amp Design
Procurement Operation and Maintenance
What is Infrastructure Solutions
Infrastructure Solutions represent strategic partnerships with customers and capital partners
bull Public private partnerships (P3)bull Concessionsbull Build Own Operate or Transfer
(BOOT)bull Build to Suit (BTS) arrangements
These solutions are a growth engine for each of our segments and geographies and a core component of our strategic
imperative to deliver differentiated solutions to our customers
Encompasses
Infrastructure Solutions Drivers
A Combination of Drivers are Occurring that Create Demand and Opportunity for Our Infrastructure Solutions
bull Provide transparency to a project shape design constructability risk allocation and overall project structure
bull Manages risk that yields more informed EPC project decisions
bull Improves success rate of both winning the engagement and successful execution
bull Where appropriate we invest alongside our partners
bull Significant capital needs to fund the substantial infrastructure needs
bull Utilization of concessions public private partnerships (P3) and private infrastructure partnerships to fund and attract high-quality entities for complex projects
bull Changes in regulation (such as FERC Order 1000)
bull New entrants together with high interest and availability of investor infrastructure investment capital
Quanta Is A True Partner
bull Quanta increasingly sought as a partner for our execution capabilities the need for price certainty and our financial strength
bull Projects are larger more complex greater scope Typically under lump-sum turnkey arrangements which create greater opportunities and risks for Quanta
bull Successful Infrastructure Solutions and project execution track record
Quanta Sought for Executionamp Track Record
Market Structure amp Projects Getting More Complex
29
Fully Integrated Solutions Based Provider
Infrastructure Solutions Provides A Solutions Based Tool for Quanta to Partner with Customers Enhance Relationships and Create New Customer and Project Opportunities
EPC
Capitalbull Determine capital structurebull Source capitalbull Quanta minority direct
investmentbull First Infrastructure Capital
Advisors
PartnershipsPartner withbull Customersbull Equity Capital
(4) Includes $802 million of expense net of tax or $036 per diluted share from an arbitration decision charge to provision for long-term contract receivable and the benefit associated with release of certain income tax contingencies
2013 2014 2015 2016 2017 Est
($ in millions)Revenue
$140$122
$062
$126
$163
2013 2014 2015 2016 2017Est
(4)
(5)
(6)
Electric Power Oil amp Gas Infrastructure
GAAP Diluted EPS (1)
$156
$185
$111
$151
$195
2013 2014 2015 2016 2017Est
Adjusted Diluted EPS (1)
$6412
(2) Represents the midpoint of guidance range
(2)
$7747
(2) (2) $173
(3) Includes $033 gain from sale of Howard Energy investment
$9300(3)
(1) From continuing operations
$7572
(5) Includes $734 million of project losses Also includes $454 million of expense net of tax or $023 per diluted share from net asset impairment charges
$7651
(6) Includes $548 million of project losses and $71 million of expense net of tax or $005 per diluted share from net asset impairment charges Also includes tax benefits of $205 million or $013 per share associated with the expiration of various federal and state tax statute of limitations periods
Recent Financial Performance amp 2017 ExpectationsFor the Years Ended December 31
($ in millions)Electric Power
$4542
$5303$4937 $4850
115107
7583
2013 2014 2015 2016 2017 Est
Revenue Op Margin
(2)
(1) Operating margin excludes a $1025 million charge to cost of services for long-term contract receivable in 2014 Refer to appendix for non-GAAP reconciliation(2) Excludes a $66 million property and equipment impairment charge Includes the impact of $661 million of project losses Refer to appendix for non-GAAP reconciliation(3) Excludes a $57 million asset impairment charge Includes the impact of $548 million of project losses Refer to appendix for non-GAAP reconciliation
(1) (1)
(2)(3)
f Est revenue growth approaching 15 vs 2016
Est operating incomemargins of 90 to 95
Guidance Commentary($ in millions)
Oil amp Gas Infrastructure
(4) Excludes a $388 million expense associated with an arbitration decision Refer to appendix for non-GAAP reconciliation(5) Includes $73 million of project losses
Liquidity includes cash and cash equivalents and availability under our revolving credit facility as described in our Form 10k
Historical Cash Flow Generation
$163
$15
$434
$191
2013 2014 2015 2016
Cash Flow from Continuing Operations
($ in millions)
Free Cash Flow from Continuing Operations
$371
$248
$618
$381
2013 2014 2015 2016
Net cash provided by operating activities from continuing operations plus proceeds from sale of property and equipment less additions of property and equipment
For the Years Ending December 31($ in millions)
For the Years Ending December 31
Committed to Generating Shareholder Value
Executed on $125 Billion Share Repurchase Authorizationbull Aug 2015 ndash Announced a new $125 billion share repurchase
authorization through Feb 28 2017bull Completed a $750 million accelerated stock repurchase (ASR)
arrangement in April 2016bull Acquired 351 million shares at $2136 per share
bull $500 million for opportunistic repurchases through Feb 28 2017bull $450 million 192 million shares retired
Completed $500 Million Share Repurchase Authorizationbull Completed previous $500 million share repurchase program in 2015bull Acquired approximately 174 million shares for total cost of $500
million
Acquired $17 Billion of Quanta Common Stock
Under Previous Programs Quanta Has Acquired Approximately 32 of Its Outstanding Stock
$2197$1951
$1573 $1573
0
25
50
75
100
125
150
175
200
225
$0000
$500000
$1000000
$1500000
$2000000
$2500000
$3000000
2014 2015 2016 2017E
Net Income Required to Generate $001 In EPS
Avg Dil Shs Out
Earnings Power Improvement
$ in
Tho
usan
ds
Shares in Millions
May 25 2017 ndash Announced New $300 Million Share Repurchase Authorizationbull Up to $300 million through June 30 2020
Opportunistic amp Disciplined Capital Allocation
Capital Deployment Preference (Amounts in millions)
bull Working Capitalbull Capital Expendituresbull Acquisitionsbull Investmentsbull Return of Capital
bull Generally in sync with preference however hellip
bull Financial strength provides the ability to be opportunistic
bull Flexible and strategic capital allocation is a competitive advantage
Capital Deployment Posture
Financial Strength Allows for Flexible and Strategic Capital Allocation ndash A Competitive Advantage
2013 ndash 2016 Sources amp Uses of Cash
Sources
Cash Flow fromOperations
DivestitureProceeds
BorrowingsInvestment Sales
$3099
$1667
$842
$369$221
Uses
StockRepurchase
CAPEX amp OtherNet
Acquisitions Net
Investments
$1700
$900
$728
$54$3382
54
27
127
50
27
21
2
Amounts reflect the retrospective application of a recent accounting pronouncement related to the classification of tax withholding payments for share-based compensation
Foundation For Growth amp Improved Profitability
Multi-Year Growth Opportunities
Innovative Industry Leading Solutions
Scale amp Scope
Financial Strength
Operational amp Safety Excellence
QuantaServicesIR
QuantaIR
Connect With Quanta Services Investor Relations
Corporate Office2800 Post Oak Blvd Suite 2600Houston TX 77056713-629-7600wwwquantaservicescom
Investor ContactKip Rupp CFAVice President ndash Investor Relations713-341-7260investorsquantaservicescom
Reconciliation of Adjusted Net Income from Continuing Operations Attributable to Common Stock
2013 2014 2015 2016 2017 2017Reconciliation of adjusted net income from continuing operations attributable to common stockNet income from continuing operations attributable to common stock (GAAP as reported) 372057$ 269224$ 120286$ 198725$ 247000$ 275300$ Adjustments
Asset impairment charges - - 58451 7964 - -Severance and restructuring charges - - - 6352 - -Acquisition and integration costs 8145 14754 7966 3053 9300 9300 Impact of income tax contingency releases (9935) (8099) - (20488) - -Impact of tax benefit from realization of previously unrecognized deferred tax asset - - (4228) - - -Impact of Alberta tax law change - - 4982 - - -Provision for long-term contract receivable - 102460 - - - -Arbitration expense - 38848 - - - -Impact of sale of equity ownership in Howard Energy (112744) - - - - -Income tax impact of adjustments 39836 (55935) (16186) (3982) (3400) (3400)
Adjusted net income from continuing operations attributable to common stock before certain non-cash adjustments 297359 361252 171271 191624 252900 281200
Non-cash stock based compensation 34381 37449 36939 41134 47000 47000 Amortization of intangible assets 25865 34257 34848 31685 30600 30600 Income tax impact of non-cash adjustments (22715) (26453) (25817) (26183) (28500) (28500)
Adjusted net income from continuing operations attributable to common stock 334890$ 406505$ 217241$ 238260$ 302000$ 330300$ Weighted average sharesWeighted average shares outstanding for diluted earnings per share 214978 219690 195120 157288 157300 157300 Weighted average shares outstanding for adjusted diluted earnings per share 214978 219690 195120 157288 157300 157300 Diluted earnings per share from continuing operations attributable to common stock and adjusted diluted earnings per share from continuing operations attributable to common stockDiluted earnings per share from continuing operations attributable to common stock 173$ 123$ 062$ 126$ 157$ 175$ Adjusted diluted earnings per share from continuing operations attributable to common stock 156$ 185$ 111$ 151$ 192$ 210$
Estimated Guidance Range
For the Years Ended December 31
(in thousands except per share information)(Unaudited)
Recast of Adjusted Diluted
Reconciliation of Electric Power and Oil amp Gas Infrastructure Services Segments Operating Income As Adjusted
Amounts in millions except percentagesOil amp Gas
Infrastructure12312014 12312015 12312016 12312014
Revenues 53027$ 49373$ 48505$ 24446$
Operating Income (as reported) 4630 3623 3957 1628
Addback Provisions for long term contract receivable 1025 - - - Arbitration expense - - - 388 Asset impairment charge - 66 57 -
Operating Income (as adjusted) 5655$ 3689$ 4014$ 2016$
Operating income margin (as reported) 87 73 82 67Operating income margin (as adjusted) 107 75 83 83
Electric Power
Sheet1
Reconciliation of Free Cash Flow
2013 2014 2015 2016Net Cash Provided by Operating Activities of Continuing Operations 370558 247742 618183 381176 Less Net Capital ExpendituresAdditions of Property and Equipment (221946) (247216) (209968) (212555) Proceeds from Sale of Property and Equipment 14789 14448 26178 21975 Net Capital Expenditures (207157) (232768) (183790) (190580)
Free Cash Flow 163401 14974 434393 190596
Free Cash Flow from Cont Ops
Forward Looking Statement DisclaimerThis presentation (and oral statements regarding the subject matter of this presentation) includes ldquoforward-looking statementsrdquo intended to qualify for the safe harbor from liability established by the Private Securities Litigation Reform Act of 1995 These statements reflect assumptions expectations projections intentions or beliefs about future events and use words such as anticipate estimate project forecast may will should could expect believe plan intend and other words of similar meaning You can identify these statements by the fact that they do not relate strictly to historical or current facts In particular these include but are not limited to statements relating to the following
bull Projected revenues net income earnings per share attributable to common stock backlog margins capital expenditures weighted average shares outstanding tax rates and other projections of operating or financial resultsbull Our business or financial outlook growth or opportunities in particular marketsbull The potential benefits from acquisitions and investmentsbull The expected financial and operational performance of acquired businessesbull Future capital allocation initiativesbull Our ability to deliver increased value and return capital to stockholders bull The strategic use of our balance sheetbull The expected value of contracts or intended contracts with customersbull The scope services term and results of any projects awarded or expected to be awarded for services to be provided by usbull The anticipated commencement and completion dates for any projects awardedbull The development of larger electric transmission and oil and natural gas pipeline projects and the level of oil natural gas and natural gas liquids prices and their impact on our business or the demand for our services bull The impact of existing or potential energy legislation bull Potential opportunities that may be indicated by bidding activity or discussions with customersbull The expected outcome of pending or threatened litigation bull Beliefs and assumptions about the collectability of receivablesbull The business plans or financial condition of our customersbull Our plans and strategies bull The current economic and regulatory conditions and trends in the industries we serve bull Possible recovery on pending or contemplated change orders or affirmative claims against customers or third parties and bull Other statements reflecting expectations intentions assumptions or beliefs about future events and other statements that do not relate strictly to historical or current facts
Although our management believes that the expectations reflected in such forward-looking statements are reasonable it can give no assurance that such expectations will prove to be correct These forward-looking statements are not guarantees of future performance and involve or rely on a number of risks uncertainties and assumptions that are difficult to predict or beyond our control These forward-looking statements reflect our beliefs and assumptions based on information available to our management at the time the statements are made We caution you that actual outcomes and results may differ materially from what is expressed implied or forecasted by our forward-looking statements and that any or all of our forward-looking statements may turn out to be wrong Forward-looking statements can be affected by inaccurate assumptions and by known or unknown risks and uncertainties including the following
bull Market conditionsbull The effects of industry economic financial or political conditions outside our control including weakness in capital marketsbull Quarterly variations in our operating resultsbull Trends and growth opportunities in relevant marketsbull The cost of borrowing availability of credit and cash fluctuations in the price and volume of our common stock debt covenant compliance interest rate fluctuations and other factors affecting our financing and investing activitiesbull Delays reductions in scope or cancellations of anticipated pending or existing projects including as a result of weather regulatory or permitting issues environmental processes project performance issues claimed force majeure events or our customers capital
constraintsbull The successful negotiation execution performance and completion of anticipated pending and existing contracts including the ability to obtain awards of projects on which we bid or are otherwise discussing with customersbull Our ability to retain key personnel and qualified employees
Forward Looking Statement Disclaimerbull Our ability to attract or the potential shortage of skilled labor bull Our dependence on fixed price contracts and the potential to incur losses with respect to the contractsbull Estimates relating to our use of percentage-of-completion accountingbull Adverse weatherbull Our ability to generate internal growthbull Competition in our business including our ability to effectively compete for new projects and market sharebull The effect of natural gas natural gas liquids and oil prices on our operations and growth opportunities and on
our customersrsquo capital programs and demand for our servicesbull The future development of natural resourcesbull The failure of existing or potential legislative actions to result in demand for our servicesbull Liabilities associated with multiemployer pension plans including underfunding of liabilities and termination
or withdrawal liabilitiesbull The possibility of further increases in the liability associated with our withdrawal from a multiemployer
pension planbull Unexpected costs or liabilities that may arise from pending or threatened litigation indemnity obligations or
other claims asserted against us including liabilities for claims that are self-insured or uninsuredbull The outcome of pending or threatened litigationbull Risks relating to the potential unavailability or cancellation of third party insurance the exclusion of coverage
for certain losses and potential increases in premiums for coverage deemed beneficial to usbull Cancellation provisions within our contracts and the risk that contracts expire and are not renewed or are
replaced on less favorable termsbull Loss of customers with whom we have long-standing or significant relationshipsbull The potential that participation in joint ventures or similar structures exposes us to liability andor harm to
our reputation for acts or omissions by our partnersbull Our inability or failure to comply with the terms of our contracts which may result in additional costs
unexcused delays warranty claims failure to meet performance guarantees damages or contract terminations
bull The inability or refusal of our customers to pay for services including the failure to collect outstanding receivables
bull The failure to recover on payment claims against project owners or third party contractors or to obtain adequate compensation for customer-requested change orders
bull The failure of our customers to comply with regulatory requirements applicable to their projects which may result in project delays and cancellations
bull Budgetary or other constraints that may reduce or eliminate tax incentives or government funding for projects which may result in project delays or cancellations
bull Estimates and assumptions in determining our financial results and backlogbull Our ability to realize our backlogbull Risks associated with operating in international markets including instability of foreign governments
currency fluctuations tax and investment strategies as well as compliance with foreign legal systems and cultural practices the US Foreign Corrupt Practices Act and other applicable anti-bribery and anti-corruption laws
bull Our ability to successfully identify complete integrate and realize synergies from acquisitionsbull The potential adverse impact resulting from uncertainty surrounding investments and acquisitions including
the ability to retain key personnel from the acquired businesses and the potential increase in risks already existing in our operations
bull The adverse impact of impairments of goodwill receivables property equipment and other intangible assets or investments
bull Our growth outpacing our decentralized management and infrastructurebull Requirements relating to governmental regulation and changes theretobull Inability to enforce our intellectual property rights or the obsolescence of such rightsbull Risks related to the implementation of an information technology solutionbull The impact of our unionized workforce on our operations including labor stoppages or interruptions due to
strikes or lockoutsbull Potential liabilities and other adverse effects arising from occupational health and safety mattersbull Our dependence on suppliers subcontractors equipment manufacturers and other third party contractorsbull Fluctuations of prices of certain materials used in our businessbull The ability to access sufficient funding to finance desired growth and operationsbull Our ability to obtain performance bondsbull Potential exposure to environmental liabilitiesbull Our ability to continue to meet certain requirements applicable to us and our subsidiariesbull Rapid technological and other structural changes that could reduce the demand for our servicesbull New or changed tax laws treaties or regulationsbull Increased healthcare costs arising from healthcare reform legislation or other governmental actionbull Regulatory changes that result in increased labor costsbull Significant fluctuations in foreign currency exchange rates andbull The other risks and uncertainties as are described elsewhere herein and in our Annual Report on Form 10-K for
the year ended December 31 2016 filed with the SEC and as may be detailed from time to time in our other public filings with the SEC
All of our forward-looking statements whether written or oral are expressly qualified by these cautionary statements and any other cautionary statements that may accompany such forward-looking statements or that are otherwise included in this presentation Should one or more of these risks materialize or should underlying assumptions prove incorrect actual results may vary materially from those expressed or implied in any forward-looking statements Investors are cautioned not to place undue reliance on these forward-looking statements which are current only as of this date We do not undertake and expressly disclaim any obligation to update or revise any forward-looking statements to reflect events or circumstances after the date of this presentation or otherwise and we expressly disclaim any written or oral statements made by any third party regarding the subject matter of this presentation
Slide Number 1
Forward Looking Statement Disclaimer
Key Takeaways
Leading Integrated Infrastructure Solutions Provider
Overview ndash Strategically Focused Operationally Diverse
Overview - Diverse and High Quality Customer Base
Leading Integrated Infrastructure Solutions Provider
Strategic Imperatives
Strategic Imperatives Deliver Profitable Growth
Strategic Acquisitions Criteria and Rationale
Differentiated Competitive Position ndash In the Sweet Spot
Differentiated Competitive Position ndash In the Sweet Spot
Electric Power Infrastructure Services Segment Overview
Power Grid Investment Drivers - Transmission
Power Grid Investment Drivers - Transmission
Power Grid Investment Drivers - Distribution
Oil amp Gas Infrastructure Services Segment Overview
Reconciliation of Adjusted Net Income from Continuing Operations Attributable to Common Stock
Reconciliation of Electric Power and Oil amp Gas Infrastructure Services Segments Operating Income As Adjusted
Reconciliation of Free Cash Flow
Forward Looking Statement Disclaimer
Forward Looking Statement Disclaimer
Free Cash Flow From Continuing Operations
Source
2013
2014
2015
2016
(Support Cash Flow Statement)
Net Cash Provided by Operating Activities of Continuing Operations
370558
247742
618183
381176
(Support Cash Flow Statement)
Less Net Capital Expenditures
(Support Cash Flow Statement)
Additions of Property and Equipment
(221946)
(247216)
(209968)
(212555)
(Support Cash Flow Statement)
Proceeds from Sale of Property and Equipment
14789
14448
26178
21975
(Recalculation)
Net Capital Expenditures
(207157)
(232768)
(183790)
(190580)
(Recalculation)
Free Cash Flow
163401
14974
434393
190596
Adjusted Operating Income Margin
$ in millions
Support for slide 23
Amounts in millions except percentages
Electric Power
Oil amp Gas Infrastructure
123114
123115
123116
123114
Revenues
$ 53027
$ 49373
$ 48505
$ 24446
Operating Income (as reported)
4630
3623
3957
1628
Addback
Provisions for long term contract receivable
1025
-0
-0
-0
Arbitration expense
-0
-0
-0
388
Asset impairment charge
-0
66
57
-0
Operating Income (as adjusted)
$ 5655
$ 3689
$ 4014
$ 2016
Operating income margin (as reported)
87
73
82
67
Operating income margin (as adjusted)
107
75
83
83
Quanta Services Inc and Subsidiaries
Reconciliation of Non-GAAP Financial Measures
Adjusted Diluted Earnings Per Share from Continuing Operations
For the Years Ended December 31
(in thousands except per share information)
(Unaudited)
Estimated Guidance Range
2013
2014
2015
2016
2017
2017
Reconciliation of adjusted net income from continuing operations attributable to common stock
Net income from continuing operations attributable to common stock (GAAP as reported)
$ 372057
$ 269224
$ 120286
$ 198725
$ 247000
$ 275300
Adjustments
Asset impairment charges
-
-
58451
7964
-
-
Severance and restructuring charges
-
-
-
6352
-
-
Acquisition and integration costs
8145
14754
7966
3053
9300
9300
Impact of income tax contingency releases
(9935)
(8099)
-
(20488)
-
-
Impact of tax benefit from realization of previously unrecognized deferred tax asset
-
-
(4228)
-
-
-
Impact of Alberta tax law change
-
-
4982
-
-
-
Provision for long-term contract receivable
-
102460
-
-
-
-
Arbitration expense
-
38848
-
-
-
-
Impact of sale of equity ownership in Howard Energy
(112744)
-
-
-
-
-
Income tax impact of adjustments
39836
(55935)
(16186)
(3982)
(3400)
(3400)
Adjusted net income from continuing operations attributable to common stock before certain non-cash adjustments
297359
361252
171271
191624
252900
281200
Non-cash stock based compensation
34381
37449
36939
41134
47000
47000
Amortization of intangible assets
25865
34257
34848
31685
30600
30600
Income tax impact of non-cash adjustments
(22715)
(26453)
(25817)
(26183)
(28500)
(28500)
Adjusted net income from continuing operations attributable to common stock
$ 334890
$ 406505
$ 217241
$ 238260
$ 302000
$ 330300
Weighted average shares
Weighted average shares outstanding for diluted earnings per share
214978
219690
195120
157288
157300
157300
Weighted average shares outstanding for adjusted diluted earnings per share
214978
219690
195120
157288
157300
157300
Diluted earnings per share from continuing operations attributable to common stock and adjusted diluted earnings per share from continuing operations attributable to common stock
Diluted earnings per share from continuing operations attributable to common stock
$ 173
$ 123
$ 062
$ 126
$ 157
$ 175
Adjusted diluted earnings per share from continuing operations attributable to common stock
$ 156
$ 185
$ 111
$ 151
$ 192
$ 210
2017 Forecast
2008
2009
2010
2011
2012
2013
2014
2015
2016
2017
2018
2019
2020
2021
2022
US IOU
17599783395
17375430450
17116821481
17473265629
19719353886
18593206538
21049378470
23210018195
24651006483
28003750000
29530700000
30481300000
30509750000
31231850000
31138000000
Co-ops
3679033739
3613552751
2806195753
3044502916
2639012201
3360515403
3050612075
2834000972
3277074511
3309845256
3342943708
3376373145
3410136877
3444238245
3478680628
MuniGovt Owned
2525145025
2693819865
2624788344
2608815562
2682098477
2938725525
3183015391
3330273309
3454862656
3664198000
3769427295
3778921940
3483677493
3817389338
3817389338
Canadian
3324942988
3202431553
3726264949
4213182949
4228837570
4323705834
4106960884
3465854177
3159852215
3254697600
3381315300
3453964800
3380277450
3406223700
3406223700
Total NA 2017 Market
27128905147
26885234619
26274070528
27339767056
29269302134
29216153300
31389966819
32840146653
34542795864
38232490856
40024386303
41090559885
40783841819
41899701283
41840293665
From August 2015 Report
North American Electric Distribution Spending
2008
2009
2010
2011
2012
2013
2014
2015
2016
2017
2018
2019
2020
US IOUs
$175
$173
$171
$174
$197
$186
$210
$226
$244
$244
$247
$249
$250
US Co-ops
$27
$29
$27
$29
$35
$41
$34
$39
$40
$40
$41
$42
$42
US Muni
$25
$26
$26
$28
$28
$29
$29
$30
$31
$31
$32
$32
$33
Total US
$226
$227
$224
$231
$260
$256
$273
$295
$314
$316
$320
$323
$325
Canada
$33
$33
$34
$39
$38
$39
$39
$38
$41
$41
$42
$43
$43
Total
$260
$261
$259
$269
$298
$294
$312
$333
$354
$357
$362
$365
$368
15 vs 16
$00
$01
$02
$04
($01)
($04)
$06
$04
$08
$21
$19
$28
$26
From August 2016 Report
North American Electric Distribution Spending
2008
2009
2010
2011
2012
2013
2014
2015
2016
2017
2018
2019
2020
US IOUs
$176
$174
$171
$175
$197
$186
$210
$232
$258
$270
$271
$281
$281
US Co-ops
$27
$29
$27
$29
$31
$33
$38
$39
$40
$41
$41
$42
$43
US Muni
$25
$26
$26
$28
$28
$29
$29
$30
$31
$31
$32
$33
$33
Total US
$228
$229
$224
$232
$256
$248
$277
$301
$329
$342
$344
$356
$357
Canada
$32
$32
$37
$41
$41
$42
$41
$36
$33
$36
$37
$37
$37
Total
$260
$261
$261
$273
$297
$290
$318
$337
$362
$378
$381
$393
$394
From September 2017 Report
North American Electric Distribution Spending
2008
2009
2010
2011
2012
2013
2014
2015
2016
2017
2018
2019
2020
2021
2022
US IOUs
$176
$174
$171
$175
$197
$186
$210
$232
$247
$280
$295
$305
$305
$312
$311
US Co-ops
$37
$36
$28
$30
$26
$34
$31
$28
$33
$33
$33
$34
$34
$34
$35
US Muni
$25
$27
$26
$26
$27
$29
$32
$33
$35
$37
$38
$38
$35
$38
$38
Total US
$238
$237
$225
$231
$250
$249
$273
$294
$314
$350
$366
$376
$374
$385
$384
Canada
$33
$32
$37
$42
$42
$43
$41
$35
$32
$33
$34
$35
$34
$34
$34
Total
$271
$269
$263
$273
$293
$292
$314
$328
$345
$382
$400
$411
$408
$419
$418
2015 vs 2016 vs 2017
2015 Est
2016 Est
2017 Est
Avg 08-11
$262
$264
$269
Avg 12-15
$309
$311
$307
2016
$354
$362
$345
2017
$357
$378
$382
2018
$362
$381
$400
2019
$365
$393
$411
2020
$368
$394
$408
2021
$419
2022
$418
2017
Strategic Imperatives
Strengthen and Grow Our Core
Maintain High Performance
Culture
Continue to Innovate
Focus On Safety Excellence
Profitable Growth
Organic GrowthStrategic Acquisitions
Strategic Imperatives Deliver Profitable Growth
Base Business
bull Grow the base business and compliment with larger scale projects
bull Organic growth and strategic acquisitions
bull Pricing discipline and risk management
bull Focus on safe executionbull Cost managementbull Maintain financial strength
TimeRe
venu
es
Coupled with successful implementation of other strategic imperatives hellip
Larger Projects
For illustrative purposes
Strategic Acquisitions Criteria and Rationale
Acquisition Strategic Rationale
bull Acquisitions have and will continue to play a strategic role in differentiating Quanta in the marketplace and positioning the company for profitable long-term growth
bull Seek well respected entrepreneurial leadership with extensive history of operational excellencebull Only interested in companies that bring strategic value to Quanta and provide opportunity for 1+1=3 growth
opportunity over time
bull Brings leadership position in new geographybull Enhances presence and capabilities in an existing
geographybull Brings or enhances customer relationshipsbull Brings leadership position in adjacent or new
marketbull Brings unique service or technology that Quanta
can leverage to further differentiate its turnkey solution offering
Typical Deal Terms
bull Target 4x-5x EBITDA multiplebull 40 of consideration in Quanta stock 60 of
consideration in cashbull Meaningful stock component for operational and
stakeholder alignment
bull Company leadership stays on to run the businessbull Non-compete agreementsbull Stock locked up for period of time
Differentiated Competitive Position ndash In the Sweet Spot
bull Quanta is the largest infrastructure specialty contractor in North America
bull Unmatched scope providing broader solutions to customersbull Unmatched scale as the largest employer of skilled workforce in
the industry ndash more than 35000 employeesbull Track record of safe executionbull Projects are getting larger and more complex customers
increasingly seeking cost certainty and performancebull Quanta has consistently been working on numerous large
projects simultaneously for the past + six yearsbull Significant revenues from strategic relationships recurring work
and an increasing amount of negotiated work
Quanta vs Specialty Contractors Quanta vs Traditional EampCs
bull Today our customers believe skilled construction labor is a finite resource and critical to overall project success where engineering and procurement are more commoditized
bull Quanta has the largest skilled workforce in the industry ndash more than 35000 employees
bull Quanta self-performs its projects ndash controls quality and executionbull EampCs typically provide project management oversight and have
limited self-perform construction capabilitiesbull Quanta derives significant revenues from strategic relationships
recurring work and an increasing amount of negotiated workbull Price is often the primary driver of who wins EampC projects
Est Large Project Capability
Bubble Size = Avg Market Cap
0
20
40
60
80
100
Est
Self
Perfo
rm C
apab
ility
Bubble Size = Avg Market Cap
LargerSmaller
Differentiated Competitive Position ndash In the Sweet Spotbull Quanta is uniquely positioned to meet
customer needs versus both specialty contractors and traditional engineering and construction companies
bull Customers understand that skilled labor is critical to project success
bull Projects are getting larger and more complex and customers are increasingly seeking comprehensive solutions
bull Demand for specialty construction resources is high and increasing but supply is limited
bull Quanta has the largest infrastructure specialty contractor workforce in North America +35000 employees globally
bull Quanta has strategically invested in engineering and program management to provide true complete engineering procurement and construction (EPC) solutions
0
20
40
60
80
100
Est
Self
Perf
orm
Cap
abili
ty
Est Large Project Capability
Bubble Size = Avg Market Cap
LargerSmaller
Electric Power Infrastructure Services Segment Overview
$4542$5303 $4937 $4850
115 10775 83
2013 2014 2015 2016Revenue Op Margin
(2)
(1) Operating margin excludes a $1025 million charge to cost of services for long-term contract receivable in 2014 Refer to appendix for non-GAAP reconciliation(2) Excludes a $66 million property and equipment charge in 2015 and a $57 million asset impairment charge in 2016 Includes the impact of $661 million in 2015 and $548 million in 2016 of project losses Refer to appendix for non-GAAP reconciliation
Differentiatorsbull Largest TampD solutions provider in North
Americabull Reputation and Track Recordbull Unmatched Solutions Scope and Scalebull Safety Recordbull Manpower and Equipment Resourcesbull Lazy Q Training Facilitybull Energized Servicesbull EPC Capabilities Across All Offeringsbull Infrastructure Capital Solutions
Market Drivers
Power Grid Investment Drivers - Transmission
bull An aging grid that requires repair upgrade and maintenancebull Favorable transmission regulation Energy Policy Act of lsquo05
NERC Reliability Standards possibly FERC Order 1000 over the long-term
bull More stringent reliability standards will require repairing lines and adding redundant capacity
bull Coal and nuclear generation retirements and switching to natural gas and renewable generation strains the grid
bull Existing and new renewable generation needs interconnection to the grid
bull Opportunity for industrial driven load growthbull Regional grid infrastructure is too congested to get lowest-cost
power to consumersbull Sub-transmission interconnectionbull Canada has same drivers as US as well as the need to serve
mining interests and hydro generation for export to US load centers
bull Challenged economic conditions in Canada
bull Environmental and other regulatory scrutiny right of way acquisition permitting etc
bull Tepid load growthbull Economybull Energy efficiency initiatives
Oil amp Gas Infrastructure Services Segment Overview
$1870
$2445 $2635 $2801
74 83
54 53
2013 2014 2015 2016Revenue Op Margin
(1) Excludes a $388 million expense associated with an arbitration decision Refer to appendix for non-GAAP reconciliation(2) Includes $73 million of project losses
bull Production of shale natural gas oil and natural gas liquids has grown dramatically and is expected to remain at high levels forthe foreseeable future
bull Much of these resources are in areas that have not been traditional hydrocarbon fuel sources and do not have adequate infrastructure in place to gather store process and transport product
bull Canadian oil production lacks adequate takeaway pipeline infrastructurebull Economics of pipeline transportation is increasingly attractive versus rail in a low oil price environmentbull Pipeline construction capacity is more limited in Canada versus the US and construction capacity constraints could be significant
bull It will take many years and significant energy infrastructure investment to harvest these resources
Shale Gas amp Tight Oil Plays Drive US Natural Gas Production
2000-2040 (trillion cubic feet)
Source EIA Annual Energy Outlook 2017
Tight Oil Drives US Oil Production2000-2040 (millions of barrels per day)
Source EIA Annual Energy Outlook 2015
Canadian Oil Sands amp Conventional Oil Production(Millions of barrels per day)
Source Canadian Assoc of Petroleum Producers
Oil amp Gas Infrastructure Investment Driversbull Need for pipeline and related infrastructure driven by the
significant increase in North American unconventional natural gas and oil production ndash not commodity prices
bull Takeaway pipelines have not been built fast enough to keep pace with hydrocarbon production ndash significant pipeline development needed
bull Large pipeline construction industry capacity is currently tight but could get significantly strained over the next several years
North American Pipeline ForecastProbability Weighted
Quanta Is the Largest Pipeline Construction Company in North America
bull Quanta is the largest pipeline construction company in North America
bull This positions Quanta to provide significant large diameter pipe construction capacity to the industry while remaining active in select shales
bull We are ready to assist our customers in meeting their development goals in what could be a resource challenged environment
North America Major Planned Mainline Project Capex
Source KeyBanc Capital Markets
$0
$5
$10
$15
$20
2016E 2017E 2018E 2019E
In B
illio
ns
In B
illio
ns
Oil amp Gas Infrastructure Investment DriversNatural Gas Distribution amp Pipeline Integritybull US pipeline infrastructure is getting older
bull PHMSA estimates more than 470K miles (37) of US gas distribution mains and 171K miles (57) of gas transmission pipelines were installed before 1970 or in an undocumented year
bull Local Distribution Companies (LDCs) continue increased spend on pipe inspection and replacement
bull Replacement programs ramped up after San Bruno incident in 2010 Utilities are spending $22B a year on transmission and distribution systems(2)
bull Regulations push for expanding inspection programs and accelerating replacement work
bull PHMSA will require more inspection and corrosion control activity which will require additional excavations and integrity work DOErsquos Quadrennial Energy Review emphasizes the need to accelerate pipe replacement to curb emissions from leak-prone pipe
bull Long timelines for some replacement plans will push spend acceleration
bull Current projections are over 20 years for many large utilities a few more than 50 years(3) Replacement activities will have to be accelerated to address risk
bull State regulators establishing cost recovery mechanisms to accelerate replacement programs
Significant Inventory Remains for Replacement
States with Gas Utility Cost Recovery Mechanisms(4)
(1) PHMSA pipe inventory reports 2011-2015(2) AGA 2016 Playbook (3) Department of Energy Quadrennial Energy Review ndash Energy Transmission Storage and Distribution Infrastructure April 2015 (4) American Gas Association Playbook 2017
Stronghold Acquisition Overview
bull Provides catalyst handling turnaround and other downstream services tank storage and other midstream services
bull Specializes in high pressure and high reactor infrastructure services
bull Industry leading safety record employee and training focus with entrepreneurial culture
bull Led by a strong multigenerational highly regarded management team with decades of industry experience
bull Preferred employer with low turnover and high-quality workforce ndash averaging 2800 employees
bull Excellent reputation and strong relationships with a high-quality and diverse client base
bull Strong historical organic growth
21
Stronghold is a leading specialized services company providing high pressure and critical path solutions to the downstream and midstream energy markets
Company Profile
2016 Revenue =Approx $500 Million
Downstream Services
85
Midstream Services
15
Strategic Rationalebull Facilitates capture of a greater portion of energy
industry spend and offers cross-selling opportunities
bull Specialized Industrial Services market is a natural service line expansion for Quanta to meet our customersrsquo needs
bull Complements existing downstream high-voltage power services
bull Stronghold gives Quanta a significant presence in downstream services and a strong platform for growth
bull Strong financial profilebull Attractive historical growth and accretive margin
profile low capex requirements solid cash flow and accretive to earnings
bull Enhances recurring base business revenue
bull Shale oil natural gas and natural gas liquids (NGLs) production driving refinery petrochemical and storage infrastructure needs
Telecom Infrastructure Services Overview
To be an industry leading and true EPC contractor providing comprehensive communications infrastructure solutions to customers in the United States Canada and select markets in Latin America
Goal
Diverse Existing amp Target Customer BaseMarkets Served
Telecom Infrastructure Investment Drivers
bull Telco gigabit fiber to the home deployment programs
bull Cable MSOs deploying DOCSIS 31
bull Upcoming - 5G wireless and fiber backhaul
bull Ongoing 4G wireless network optimization
bull Connect America Fund - rural fiber build-out
bull Federal government funded FirstNet - national wireless network for first responders
United States
bull Backbone and last mile fiber (behind relative to the US)
bull Telco gigabit fiber to the home deployment programs
bull Cable MSOs deploying DOCSIS 31
bull Upcoming - 5G wireless and fiber backhaul
bull Ongoing 4G wireless network optimization
bull Federal government infrastructure initiatives generally positive
Canada
bull Significantly behind North America in both wireline and wireless connectivity
bull However demand for connectivity media and data intensive services is strong
bull Fiber and backhaul networks significantly behind North America
bull Primarily 3G wireless some 4G wireless (country dependent)
bull Various governments have infrastructure expansion initiatives
bull Concession and P3 opportunities
bull Connectivity for quality of life social and commercial reasons
Latin America
Telecom Infrastructure Services Overview
Fiber Builds
Wireless Deployment
Make Ready Services
Civil Construction
Engineering Design
Material Management
EPC
Wireless Wireline
United StatesWireless Wireline
CanadaWireless Wireline
Latin America
Comprehensive Infrastructure Solutions Offered On A Turnkey Discrete Service or EPC Basis
bull Proven greenfield expansion model in Latin America ndash US should be less difficult
Leverage existing US field operations people equipment and property
bull Select strategic acquisitions may play a role but NOT a roll-up approach
Provide wireline and wireless services - heavier on wireline
bull Increasing convergence of wireless and wireline due fiber requirements of both
Project centric nimble approach versus MSA focused EPC services to differentiate
bull Less capital intensive with better margin opportunity
GOAL
STRATEGY
STRATEGY
STRATEGY
STRATEGY
To be the leading communications infrastructure contractor in the markets we serve
Engineer Procure Construct (EPC) Is A Differentiator
bull Quanta has a long history in the EPC business and is increasingly performing select projects on an EPC basisbull Customersrsquo capital programs are at historic levels and growing Projects are getting larger and more complexbull Evolution of regulatory demands competition and alternative pricing models
bull Many customers have limited internal resources and expertise to manage these dynamics and are turning to Quanta for solutions
bull Project cost certainty becoming increasingly important
bull We are enhancing initiatives to ensure we have a scalable comprehensive enterprise-wide capability for EPC projects that is consistently executed across all segments and geographies
bull EPC projects are a meaningful contributor to our current backlog and provide significant opportunity for future growth
Integrated Services
Construction amp Installation
Assessment Planning amp
Development
Engineering amp Design
Procurement Operation and Maintenance
What is Infrastructure Solutions
Infrastructure Solutions represent strategic partnerships with customers and capital partners
bull Public private partnerships (P3)bull Concessionsbull Build Own Operate or Transfer
(BOOT)bull Build to Suit (BTS) arrangements
These solutions are a growth engine for each of our segments and geographies and a core component of our strategic
imperative to deliver differentiated solutions to our customers
Encompasses
Infrastructure Solutions Drivers
A Combination of Drivers are Occurring that Create Demand and Opportunity for Our Infrastructure Solutions
bull Provide transparency to a project shape design constructability risk allocation and overall project structure
bull Manages risk that yields more informed EPC project decisions
bull Improves success rate of both winning the engagement and successful execution
bull Where appropriate we invest alongside our partners
bull Significant capital needs to fund the substantial infrastructure needs
bull Utilization of concessions public private partnerships (P3) and private infrastructure partnerships to fund and attract high-quality entities for complex projects
bull Changes in regulation (such as FERC Order 1000)
bull New entrants together with high interest and availability of investor infrastructure investment capital
Quanta Is A True Partner
bull Quanta increasingly sought as a partner for our execution capabilities the need for price certainty and our financial strength
bull Projects are larger more complex greater scope Typically under lump-sum turnkey arrangements which create greater opportunities and risks for Quanta
bull Successful Infrastructure Solutions and project execution track record
Quanta Sought for Executionamp Track Record
Market Structure amp Projects Getting More Complex
29
Fully Integrated Solutions Based Provider
Infrastructure Solutions Provides A Solutions Based Tool for Quanta to Partner with Customers Enhance Relationships and Create New Customer and Project Opportunities
EPC
Capitalbull Determine capital structurebull Source capitalbull Quanta minority direct
investmentbull First Infrastructure Capital
Advisors
PartnershipsPartner withbull Customersbull Equity Capital
(4) Includes $802 million of expense net of tax or $036 per diluted share from an arbitration decision charge to provision for long-term contract receivable and the benefit associated with release of certain income tax contingencies
2013 2014 2015 2016 2017 Est
($ in millions)Revenue
$140$122
$062
$126
$163
2013 2014 2015 2016 2017Est
(4)
(5)
(6)
Electric Power Oil amp Gas Infrastructure
GAAP Diluted EPS (1)
$156
$185
$111
$151
$195
2013 2014 2015 2016 2017Est
Adjusted Diluted EPS (1)
$6412
(2) Represents the midpoint of guidance range
(2)
$7747
(2) (2) $173
(3) Includes $033 gain from sale of Howard Energy investment
$9300(3)
(1) From continuing operations
$7572
(5) Includes $734 million of project losses Also includes $454 million of expense net of tax or $023 per diluted share from net asset impairment charges
$7651
(6) Includes $548 million of project losses and $71 million of expense net of tax or $005 per diluted share from net asset impairment charges Also includes tax benefits of $205 million or $013 per share associated with the expiration of various federal and state tax statute of limitations periods
Recent Financial Performance amp 2017 ExpectationsFor the Years Ended December 31
($ in millions)Electric Power
$4542
$5303$4937 $4850
115107
7583
2013 2014 2015 2016 2017 Est
Revenue Op Margin
(2)
(1) Operating margin excludes a $1025 million charge to cost of services for long-term contract receivable in 2014 Refer to appendix for non-GAAP reconciliation(2) Excludes a $66 million property and equipment impairment charge Includes the impact of $661 million of project losses Refer to appendix for non-GAAP reconciliation(3) Excludes a $57 million asset impairment charge Includes the impact of $548 million of project losses Refer to appendix for non-GAAP reconciliation
(1) (1)
(2)(3)
f Est revenue growth approaching 15 vs 2016
Est operating incomemargins of 90 to 95
Guidance Commentary($ in millions)
Oil amp Gas Infrastructure
(4) Excludes a $388 million expense associated with an arbitration decision Refer to appendix for non-GAAP reconciliation(5) Includes $73 million of project losses
Liquidity includes cash and cash equivalents and availability under our revolving credit facility as described in our Form 10k
Historical Cash Flow Generation
$163
$15
$434
$191
2013 2014 2015 2016
Cash Flow from Continuing Operations
($ in millions)
Free Cash Flow from Continuing Operations
$371
$248
$618
$381
2013 2014 2015 2016
Net cash provided by operating activities from continuing operations plus proceeds from sale of property and equipment less additions of property and equipment
For the Years Ending December 31($ in millions)
For the Years Ending December 31
Committed to Generating Shareholder Value
Executed on $125 Billion Share Repurchase Authorizationbull Aug 2015 ndash Announced a new $125 billion share repurchase
authorization through Feb 28 2017bull Completed a $750 million accelerated stock repurchase (ASR)
arrangement in April 2016bull Acquired 351 million shares at $2136 per share
bull $500 million for opportunistic repurchases through Feb 28 2017bull $450 million 192 million shares retired
Completed $500 Million Share Repurchase Authorizationbull Completed previous $500 million share repurchase program in 2015bull Acquired approximately 174 million shares for total cost of $500
million
Acquired $17 Billion of Quanta Common Stock
Under Previous Programs Quanta Has Acquired Approximately 32 of Its Outstanding Stock
$2197$1951
$1573 $1573
0
25
50
75
100
125
150
175
200
225
$0000
$500000
$1000000
$1500000
$2000000
$2500000
$3000000
2014 2015 2016 2017E
Net Income Required to Generate $001 In EPS
Avg Dil Shs Out
Earnings Power Improvement
$ in
Tho
usan
ds
Shares in Millions
May 25 2017 ndash Announced New $300 Million Share Repurchase Authorizationbull Up to $300 million through June 30 2020
Opportunistic amp Disciplined Capital Allocation
Capital Deployment Preference (Amounts in millions)
bull Working Capitalbull Capital Expendituresbull Acquisitionsbull Investmentsbull Return of Capital
bull Generally in sync with preference however hellip
bull Financial strength provides the ability to be opportunistic
bull Flexible and strategic capital allocation is a competitive advantage
Capital Deployment Posture
Financial Strength Allows for Flexible and Strategic Capital Allocation ndash A Competitive Advantage
2013 ndash 2016 Sources amp Uses of Cash
Sources
Cash Flow fromOperations
DivestitureProceeds
BorrowingsInvestment Sales
$3099
$1667
$842
$369$221
Uses
StockRepurchase
CAPEX amp OtherNet
Acquisitions Net
Investments
$1700
$900
$728
$54$3382
54
27
127
50
27
21
2
Amounts reflect the retrospective application of a recent accounting pronouncement related to the classification of tax withholding payments for share-based compensation
Foundation For Growth amp Improved Profitability
Multi-Year Growth Opportunities
Innovative Industry Leading Solutions
Scale amp Scope
Financial Strength
Operational amp Safety Excellence
QuantaServicesIR
QuantaIR
Connect With Quanta Services Investor Relations
Corporate Office2800 Post Oak Blvd Suite 2600Houston TX 77056713-629-7600wwwquantaservicescom
Investor ContactKip Rupp CFAVice President ndash Investor Relations713-341-7260investorsquantaservicescom
Reconciliation of Adjusted Net Income from Continuing Operations Attributable to Common Stock
2013 2014 2015 2016 2017 2017Reconciliation of adjusted net income from continuing operations attributable to common stockNet income from continuing operations attributable to common stock (GAAP as reported) 372057$ 269224$ 120286$ 198725$ 247000$ 275300$ Adjustments
Asset impairment charges - - 58451 7964 - -Severance and restructuring charges - - - 6352 - -Acquisition and integration costs 8145 14754 7966 3053 9300 9300 Impact of income tax contingency releases (9935) (8099) - (20488) - -Impact of tax benefit from realization of previously unrecognized deferred tax asset - - (4228) - - -Impact of Alberta tax law change - - 4982 - - -Provision for long-term contract receivable - 102460 - - - -Arbitration expense - 38848 - - - -Impact of sale of equity ownership in Howard Energy (112744) - - - - -Income tax impact of adjustments 39836 (55935) (16186) (3982) (3400) (3400)
Adjusted net income from continuing operations attributable to common stock before certain non-cash adjustments 297359 361252 171271 191624 252900 281200
Non-cash stock based compensation 34381 37449 36939 41134 47000 47000 Amortization of intangible assets 25865 34257 34848 31685 30600 30600 Income tax impact of non-cash adjustments (22715) (26453) (25817) (26183) (28500) (28500)
Adjusted net income from continuing operations attributable to common stock 334890$ 406505$ 217241$ 238260$ 302000$ 330300$ Weighted average sharesWeighted average shares outstanding for diluted earnings per share 214978 219690 195120 157288 157300 157300 Weighted average shares outstanding for adjusted diluted earnings per share 214978 219690 195120 157288 157300 157300 Diluted earnings per share from continuing operations attributable to common stock and adjusted diluted earnings per share from continuing operations attributable to common stockDiluted earnings per share from continuing operations attributable to common stock 173$ 123$ 062$ 126$ 157$ 175$ Adjusted diluted earnings per share from continuing operations attributable to common stock 156$ 185$ 111$ 151$ 192$ 210$
Estimated Guidance Range
For the Years Ended December 31
(in thousands except per share information)(Unaudited)
Recast of Adjusted Diluted
Reconciliation of Electric Power and Oil amp Gas Infrastructure Services Segments Operating Income As Adjusted
Amounts in millions except percentagesOil amp Gas
Infrastructure12312014 12312015 12312016 12312014
Revenues 53027$ 49373$ 48505$ 24446$
Operating Income (as reported) 4630 3623 3957 1628
Addback Provisions for long term contract receivable 1025 - - - Arbitration expense - - - 388 Asset impairment charge - 66 57 -
Operating Income (as adjusted) 5655$ 3689$ 4014$ 2016$
Operating income margin (as reported) 87 73 82 67Operating income margin (as adjusted) 107 75 83 83
Electric Power
Sheet1
Reconciliation of Free Cash Flow
2013 2014 2015 2016Net Cash Provided by Operating Activities of Continuing Operations 370558 247742 618183 381176 Less Net Capital ExpendituresAdditions of Property and Equipment (221946) (247216) (209968) (212555) Proceeds from Sale of Property and Equipment 14789 14448 26178 21975 Net Capital Expenditures (207157) (232768) (183790) (190580)
Free Cash Flow 163401 14974 434393 190596
Free Cash Flow from Cont Ops
Forward Looking Statement DisclaimerThis presentation (and oral statements regarding the subject matter of this presentation) includes ldquoforward-looking statementsrdquo intended to qualify for the safe harbor from liability established by the Private Securities Litigation Reform Act of 1995 These statements reflect assumptions expectations projections intentions or beliefs about future events and use words such as anticipate estimate project forecast may will should could expect believe plan intend and other words of similar meaning You can identify these statements by the fact that they do not relate strictly to historical or current facts In particular these include but are not limited to statements relating to the following
bull Projected revenues net income earnings per share attributable to common stock backlog margins capital expenditures weighted average shares outstanding tax rates and other projections of operating or financial resultsbull Our business or financial outlook growth or opportunities in particular marketsbull The potential benefits from acquisitions and investmentsbull The expected financial and operational performance of acquired businessesbull Future capital allocation initiativesbull Our ability to deliver increased value and return capital to stockholders bull The strategic use of our balance sheetbull The expected value of contracts or intended contracts with customersbull The scope services term and results of any projects awarded or expected to be awarded for services to be provided by usbull The anticipated commencement and completion dates for any projects awardedbull The development of larger electric transmission and oil and natural gas pipeline projects and the level of oil natural gas and natural gas liquids prices and their impact on our business or the demand for our services bull The impact of existing or potential energy legislation bull Potential opportunities that may be indicated by bidding activity or discussions with customersbull The expected outcome of pending or threatened litigation bull Beliefs and assumptions about the collectability of receivablesbull The business plans or financial condition of our customersbull Our plans and strategies bull The current economic and regulatory conditions and trends in the industries we serve bull Possible recovery on pending or contemplated change orders or affirmative claims against customers or third parties and bull Other statements reflecting expectations intentions assumptions or beliefs about future events and other statements that do not relate strictly to historical or current facts
Although our management believes that the expectations reflected in such forward-looking statements are reasonable it can give no assurance that such expectations will prove to be correct These forward-looking statements are not guarantees of future performance and involve or rely on a number of risks uncertainties and assumptions that are difficult to predict or beyond our control These forward-looking statements reflect our beliefs and assumptions based on information available to our management at the time the statements are made We caution you that actual outcomes and results may differ materially from what is expressed implied or forecasted by our forward-looking statements and that any or all of our forward-looking statements may turn out to be wrong Forward-looking statements can be affected by inaccurate assumptions and by known or unknown risks and uncertainties including the following
bull Market conditionsbull The effects of industry economic financial or political conditions outside our control including weakness in capital marketsbull Quarterly variations in our operating resultsbull Trends and growth opportunities in relevant marketsbull The cost of borrowing availability of credit and cash fluctuations in the price and volume of our common stock debt covenant compliance interest rate fluctuations and other factors affecting our financing and investing activitiesbull Delays reductions in scope or cancellations of anticipated pending or existing projects including as a result of weather regulatory or permitting issues environmental processes project performance issues claimed force majeure events or our customers capital
constraintsbull The successful negotiation execution performance and completion of anticipated pending and existing contracts including the ability to obtain awards of projects on which we bid or are otherwise discussing with customersbull Our ability to retain key personnel and qualified employees
Forward Looking Statement Disclaimerbull Our ability to attract or the potential shortage of skilled labor bull Our dependence on fixed price contracts and the potential to incur losses with respect to the contractsbull Estimates relating to our use of percentage-of-completion accountingbull Adverse weatherbull Our ability to generate internal growthbull Competition in our business including our ability to effectively compete for new projects and market sharebull The effect of natural gas natural gas liquids and oil prices on our operations and growth opportunities and on
our customersrsquo capital programs and demand for our servicesbull The future development of natural resourcesbull The failure of existing or potential legislative actions to result in demand for our servicesbull Liabilities associated with multiemployer pension plans including underfunding of liabilities and termination
or withdrawal liabilitiesbull The possibility of further increases in the liability associated with our withdrawal from a multiemployer
pension planbull Unexpected costs or liabilities that may arise from pending or threatened litigation indemnity obligations or
other claims asserted against us including liabilities for claims that are self-insured or uninsuredbull The outcome of pending or threatened litigationbull Risks relating to the potential unavailability or cancellation of third party insurance the exclusion of coverage
for certain losses and potential increases in premiums for coverage deemed beneficial to usbull Cancellation provisions within our contracts and the risk that contracts expire and are not renewed or are
replaced on less favorable termsbull Loss of customers with whom we have long-standing or significant relationshipsbull The potential that participation in joint ventures or similar structures exposes us to liability andor harm to
our reputation for acts or omissions by our partnersbull Our inability or failure to comply with the terms of our contracts which may result in additional costs
unexcused delays warranty claims failure to meet performance guarantees damages or contract terminations
bull The inability or refusal of our customers to pay for services including the failure to collect outstanding receivables
bull The failure to recover on payment claims against project owners or third party contractors or to obtain adequate compensation for customer-requested change orders
bull The failure of our customers to comply with regulatory requirements applicable to their projects which may result in project delays and cancellations
bull Budgetary or other constraints that may reduce or eliminate tax incentives or government funding for projects which may result in project delays or cancellations
bull Estimates and assumptions in determining our financial results and backlogbull Our ability to realize our backlogbull Risks associated with operating in international markets including instability of foreign governments
currency fluctuations tax and investment strategies as well as compliance with foreign legal systems and cultural practices the US Foreign Corrupt Practices Act and other applicable anti-bribery and anti-corruption laws
bull Our ability to successfully identify complete integrate and realize synergies from acquisitionsbull The potential adverse impact resulting from uncertainty surrounding investments and acquisitions including
the ability to retain key personnel from the acquired businesses and the potential increase in risks already existing in our operations
bull The adverse impact of impairments of goodwill receivables property equipment and other intangible assets or investments
bull Our growth outpacing our decentralized management and infrastructurebull Requirements relating to governmental regulation and changes theretobull Inability to enforce our intellectual property rights or the obsolescence of such rightsbull Risks related to the implementation of an information technology solutionbull The impact of our unionized workforce on our operations including labor stoppages or interruptions due to
strikes or lockoutsbull Potential liabilities and other adverse effects arising from occupational health and safety mattersbull Our dependence on suppliers subcontractors equipment manufacturers and other third party contractorsbull Fluctuations of prices of certain materials used in our businessbull The ability to access sufficient funding to finance desired growth and operationsbull Our ability to obtain performance bondsbull Potential exposure to environmental liabilitiesbull Our ability to continue to meet certain requirements applicable to us and our subsidiariesbull Rapid technological and other structural changes that could reduce the demand for our servicesbull New or changed tax laws treaties or regulationsbull Increased healthcare costs arising from healthcare reform legislation or other governmental actionbull Regulatory changes that result in increased labor costsbull Significant fluctuations in foreign currency exchange rates andbull The other risks and uncertainties as are described elsewhere herein and in our Annual Report on Form 10-K for
the year ended December 31 2016 filed with the SEC and as may be detailed from time to time in our other public filings with the SEC
All of our forward-looking statements whether written or oral are expressly qualified by these cautionary statements and any other cautionary statements that may accompany such forward-looking statements or that are otherwise included in this presentation Should one or more of these risks materialize or should underlying assumptions prove incorrect actual results may vary materially from those expressed or implied in any forward-looking statements Investors are cautioned not to place undue reliance on these forward-looking statements which are current only as of this date We do not undertake and expressly disclaim any obligation to update or revise any forward-looking statements to reflect events or circumstances after the date of this presentation or otherwise and we expressly disclaim any written or oral statements made by any third party regarding the subject matter of this presentation
Slide Number 1
Forward Looking Statement Disclaimer
Key Takeaways
Leading Integrated Infrastructure Solutions Provider
Overview ndash Strategically Focused Operationally Diverse
Overview - Diverse and High Quality Customer Base
Leading Integrated Infrastructure Solutions Provider
Strategic Imperatives
Strategic Imperatives Deliver Profitable Growth
Strategic Acquisitions Criteria and Rationale
Differentiated Competitive Position ndash In the Sweet Spot
Differentiated Competitive Position ndash In the Sweet Spot
Electric Power Infrastructure Services Segment Overview
Power Grid Investment Drivers - Transmission
Power Grid Investment Drivers - Transmission
Power Grid Investment Drivers - Distribution
Oil amp Gas Infrastructure Services Segment Overview
Reconciliation of Adjusted Net Income from Continuing Operations Attributable to Common Stock
Reconciliation of Electric Power and Oil amp Gas Infrastructure Services Segments Operating Income As Adjusted
Reconciliation of Free Cash Flow
Forward Looking Statement Disclaimer
Forward Looking Statement Disclaimer
Free Cash Flow From Continuing Operations
Source
2013
2014
2015
2016
(Support Cash Flow Statement)
Net Cash Provided by Operating Activities of Continuing Operations
370558
247742
618183
381176
(Support Cash Flow Statement)
Less Net Capital Expenditures
(Support Cash Flow Statement)
Additions of Property and Equipment
(221946)
(247216)
(209968)
(212555)
(Support Cash Flow Statement)
Proceeds from Sale of Property and Equipment
14789
14448
26178
21975
(Recalculation)
Net Capital Expenditures
(207157)
(232768)
(183790)
(190580)
(Recalculation)
Free Cash Flow
163401
14974
434393
190596
Adjusted Operating Income Margin
$ in millions
Support for slide 23
Amounts in millions except percentages
Electric Power
Oil amp Gas Infrastructure
123114
123115
123116
123114
Revenues
$ 53027
$ 49373
$ 48505
$ 24446
Operating Income (as reported)
4630
3623
3957
1628
Addback
Provisions for long term contract receivable
1025
-0
-0
-0
Arbitration expense
-0
-0
-0
388
Asset impairment charge
-0
66
57
-0
Operating Income (as adjusted)
$ 5655
$ 3689
$ 4014
$ 2016
Operating income margin (as reported)
87
73
82
67
Operating income margin (as adjusted)
107
75
83
83
Quanta Services Inc and Subsidiaries
Reconciliation of Non-GAAP Financial Measures
Adjusted Diluted Earnings Per Share from Continuing Operations
For the Years Ended December 31
(in thousands except per share information)
(Unaudited)
Estimated Guidance Range
2013
2014
2015
2016
2017
2017
Reconciliation of adjusted net income from continuing operations attributable to common stock
Net income from continuing operations attributable to common stock (GAAP as reported)
$ 372057
$ 269224
$ 120286
$ 198725
$ 247000
$ 275300
Adjustments
Asset impairment charges
-
-
58451
7964
-
-
Severance and restructuring charges
-
-
-
6352
-
-
Acquisition and integration costs
8145
14754
7966
3053
9300
9300
Impact of income tax contingency releases
(9935)
(8099)
-
(20488)
-
-
Impact of tax benefit from realization of previously unrecognized deferred tax asset
-
-
(4228)
-
-
-
Impact of Alberta tax law change
-
-
4982
-
-
-
Provision for long-term contract receivable
-
102460
-
-
-
-
Arbitration expense
-
38848
-
-
-
-
Impact of sale of equity ownership in Howard Energy
(112744)
-
-
-
-
-
Income tax impact of adjustments
39836
(55935)
(16186)
(3982)
(3400)
(3400)
Adjusted net income from continuing operations attributable to common stock before certain non-cash adjustments
297359
361252
171271
191624
252900
281200
Non-cash stock based compensation
34381
37449
36939
41134
47000
47000
Amortization of intangible assets
25865
34257
34848
31685
30600
30600
Income tax impact of non-cash adjustments
(22715)
(26453)
(25817)
(26183)
(28500)
(28500)
Adjusted net income from continuing operations attributable to common stock
$ 334890
$ 406505
$ 217241
$ 238260
$ 302000
$ 330300
Weighted average shares
Weighted average shares outstanding for diluted earnings per share
214978
219690
195120
157288
157300
157300
Weighted average shares outstanding for adjusted diluted earnings per share
214978
219690
195120
157288
157300
157300
Diluted earnings per share from continuing operations attributable to common stock and adjusted diluted earnings per share from continuing operations attributable to common stock
Diluted earnings per share from continuing operations attributable to common stock
$ 173
$ 123
$ 062
$ 126
$ 157
$ 175
Adjusted diluted earnings per share from continuing operations attributable to common stock
$ 156
$ 185
$ 111
$ 151
$ 192
$ 210
2017 Forecast
2008
2009
2010
2011
2012
2013
2014
2015
2016
2017
2018
2019
2020
2021
2022
US IOU
17599783395
17375430450
17116821481
17473265629
19719353886
18593206538
21049378470
23210018195
24651006483
28003750000
29530700000
30481300000
30509750000
31231850000
31138000000
Co-ops
3679033739
3613552751
2806195753
3044502916
2639012201
3360515403
3050612075
2834000972
3277074511
3309845256
3342943708
3376373145
3410136877
3444238245
3478680628
MuniGovt Owned
2525145025
2693819865
2624788344
2608815562
2682098477
2938725525
3183015391
3330273309
3454862656
3664198000
3769427295
3778921940
3483677493
3817389338
3817389338
Canadian
3324942988
3202431553
3726264949
4213182949
4228837570
4323705834
4106960884
3465854177
3159852215
3254697600
3381315300
3453964800
3380277450
3406223700
3406223700
Total NA 2017 Market
27128905147
26885234619
26274070528
27339767056
29269302134
29216153300
31389966819
32840146653
34542795864
38232490856
40024386303
41090559885
40783841819
41899701283
41840293665
From August 2015 Report
North American Electric Distribution Spending
2008
2009
2010
2011
2012
2013
2014
2015
2016
2017
2018
2019
2020
US IOUs
$175
$173
$171
$174
$197
$186
$210
$226
$244
$244
$247
$249
$250
US Co-ops
$27
$29
$27
$29
$35
$41
$34
$39
$40
$40
$41
$42
$42
US Muni
$25
$26
$26
$28
$28
$29
$29
$30
$31
$31
$32
$32
$33
Total US
$226
$227
$224
$231
$260
$256
$273
$295
$314
$316
$320
$323
$325
Canada
$33
$33
$34
$39
$38
$39
$39
$38
$41
$41
$42
$43
$43
Total
$260
$261
$259
$269
$298
$294
$312
$333
$354
$357
$362
$365
$368
15 vs 16
$00
$01
$02
$04
($01)
($04)
$06
$04
$08
$21
$19
$28
$26
From August 2016 Report
North American Electric Distribution Spending
2008
2009
2010
2011
2012
2013
2014
2015
2016
2017
2018
2019
2020
US IOUs
$176
$174
$171
$175
$197
$186
$210
$232
$258
$270
$271
$281
$281
US Co-ops
$27
$29
$27
$29
$31
$33
$38
$39
$40
$41
$41
$42
$43
US Muni
$25
$26
$26
$28
$28
$29
$29
$30
$31
$31
$32
$33
$33
Total US
$228
$229
$224
$232
$256
$248
$277
$301
$329
$342
$344
$356
$357
Canada
$32
$32
$37
$41
$41
$42
$41
$36
$33
$36
$37
$37
$37
Total
$260
$261
$261
$273
$297
$290
$318
$337
$362
$378
$381
$393
$394
From September 2017 Report
North American Electric Distribution Spending
2008
2009
2010
2011
2012
2013
2014
2015
2016
2017
2018
2019
2020
2021
2022
US IOUs
$176
$174
$171
$175
$197
$186
$210
$232
$247
$280
$295
$305
$305
$312
$311
US Co-ops
$37
$36
$28
$30
$26
$34
$31
$28
$33
$33
$33
$34
$34
$34
$35
US Muni
$25
$27
$26
$26
$27
$29
$32
$33
$35
$37
$38
$38
$35
$38
$38
Total US
$238
$237
$225
$231
$250
$249
$273
$294
$314
$350
$366
$376
$374
$385
$384
Canada
$33
$32
$37
$42
$42
$43
$41
$35
$32
$33
$34
$35
$34
$34
$34
Total
$271
$269
$263
$273
$293
$292
$314
$328
$345
$382
$400
$411
$408
$419
$418
2015 vs 2016 vs 2017
2015 Est
2016 Est
2017 Est
Avg 08-11
$262
$264
$269
Avg 12-15
$309
$311
$307
2016
$354
$362
$345
2017
$357
$378
$382
2018
$362
$381
$400
2019
$365
$393
$411
2020
$368
$394
$408
2021
$419
2022
$418
2017
Strategic Imperatives Deliver Profitable Growth
Base Business
bull Grow the base business and compliment with larger scale projects
bull Organic growth and strategic acquisitions
bull Pricing discipline and risk management
bull Focus on safe executionbull Cost managementbull Maintain financial strength
TimeRe
venu
es
Coupled with successful implementation of other strategic imperatives hellip
Larger Projects
For illustrative purposes
Strategic Acquisitions Criteria and Rationale
Acquisition Strategic Rationale
bull Acquisitions have and will continue to play a strategic role in differentiating Quanta in the marketplace and positioning the company for profitable long-term growth
bull Seek well respected entrepreneurial leadership with extensive history of operational excellencebull Only interested in companies that bring strategic value to Quanta and provide opportunity for 1+1=3 growth
opportunity over time
bull Brings leadership position in new geographybull Enhances presence and capabilities in an existing
geographybull Brings or enhances customer relationshipsbull Brings leadership position in adjacent or new
marketbull Brings unique service or technology that Quanta
can leverage to further differentiate its turnkey solution offering
Typical Deal Terms
bull Target 4x-5x EBITDA multiplebull 40 of consideration in Quanta stock 60 of
consideration in cashbull Meaningful stock component for operational and
stakeholder alignment
bull Company leadership stays on to run the businessbull Non-compete agreementsbull Stock locked up for period of time
Differentiated Competitive Position ndash In the Sweet Spot
bull Quanta is the largest infrastructure specialty contractor in North America
bull Unmatched scope providing broader solutions to customersbull Unmatched scale as the largest employer of skilled workforce in
the industry ndash more than 35000 employeesbull Track record of safe executionbull Projects are getting larger and more complex customers
increasingly seeking cost certainty and performancebull Quanta has consistently been working on numerous large
projects simultaneously for the past + six yearsbull Significant revenues from strategic relationships recurring work
and an increasing amount of negotiated work
Quanta vs Specialty Contractors Quanta vs Traditional EampCs
bull Today our customers believe skilled construction labor is a finite resource and critical to overall project success where engineering and procurement are more commoditized
bull Quanta has the largest skilled workforce in the industry ndash more than 35000 employees
bull Quanta self-performs its projects ndash controls quality and executionbull EampCs typically provide project management oversight and have
limited self-perform construction capabilitiesbull Quanta derives significant revenues from strategic relationships
recurring work and an increasing amount of negotiated workbull Price is often the primary driver of who wins EampC projects
Est Large Project Capability
Bubble Size = Avg Market Cap
0
20
40
60
80
100
Est
Self
Perfo
rm C
apab
ility
Bubble Size = Avg Market Cap
LargerSmaller
Differentiated Competitive Position ndash In the Sweet Spotbull Quanta is uniquely positioned to meet
customer needs versus both specialty contractors and traditional engineering and construction companies
bull Customers understand that skilled labor is critical to project success
bull Projects are getting larger and more complex and customers are increasingly seeking comprehensive solutions
bull Demand for specialty construction resources is high and increasing but supply is limited
bull Quanta has the largest infrastructure specialty contractor workforce in North America +35000 employees globally
bull Quanta has strategically invested in engineering and program management to provide true complete engineering procurement and construction (EPC) solutions
0
20
40
60
80
100
Est
Self
Perf
orm
Cap
abili
ty
Est Large Project Capability
Bubble Size = Avg Market Cap
LargerSmaller
Electric Power Infrastructure Services Segment Overview
$4542$5303 $4937 $4850
115 10775 83
2013 2014 2015 2016Revenue Op Margin
(2)
(1) Operating margin excludes a $1025 million charge to cost of services for long-term contract receivable in 2014 Refer to appendix for non-GAAP reconciliation(2) Excludes a $66 million property and equipment charge in 2015 and a $57 million asset impairment charge in 2016 Includes the impact of $661 million in 2015 and $548 million in 2016 of project losses Refer to appendix for non-GAAP reconciliation
Differentiatorsbull Largest TampD solutions provider in North
Americabull Reputation and Track Recordbull Unmatched Solutions Scope and Scalebull Safety Recordbull Manpower and Equipment Resourcesbull Lazy Q Training Facilitybull Energized Servicesbull EPC Capabilities Across All Offeringsbull Infrastructure Capital Solutions
Market Drivers
Power Grid Investment Drivers - Transmission
bull An aging grid that requires repair upgrade and maintenancebull Favorable transmission regulation Energy Policy Act of lsquo05
NERC Reliability Standards possibly FERC Order 1000 over the long-term
bull More stringent reliability standards will require repairing lines and adding redundant capacity
bull Coal and nuclear generation retirements and switching to natural gas and renewable generation strains the grid
bull Existing and new renewable generation needs interconnection to the grid
bull Opportunity for industrial driven load growthbull Regional grid infrastructure is too congested to get lowest-cost
power to consumersbull Sub-transmission interconnectionbull Canada has same drivers as US as well as the need to serve
mining interests and hydro generation for export to US load centers
bull Challenged economic conditions in Canada
bull Environmental and other regulatory scrutiny right of way acquisition permitting etc
bull Tepid load growthbull Economybull Energy efficiency initiatives
Oil amp Gas Infrastructure Services Segment Overview
$1870
$2445 $2635 $2801
74 83
54 53
2013 2014 2015 2016Revenue Op Margin
(1) Excludes a $388 million expense associated with an arbitration decision Refer to appendix for non-GAAP reconciliation(2) Includes $73 million of project losses
bull Production of shale natural gas oil and natural gas liquids has grown dramatically and is expected to remain at high levels forthe foreseeable future
bull Much of these resources are in areas that have not been traditional hydrocarbon fuel sources and do not have adequate infrastructure in place to gather store process and transport product
bull Canadian oil production lacks adequate takeaway pipeline infrastructurebull Economics of pipeline transportation is increasingly attractive versus rail in a low oil price environmentbull Pipeline construction capacity is more limited in Canada versus the US and construction capacity constraints could be significant
bull It will take many years and significant energy infrastructure investment to harvest these resources
Shale Gas amp Tight Oil Plays Drive US Natural Gas Production
2000-2040 (trillion cubic feet)
Source EIA Annual Energy Outlook 2017
Tight Oil Drives US Oil Production2000-2040 (millions of barrels per day)
Source EIA Annual Energy Outlook 2015
Canadian Oil Sands amp Conventional Oil Production(Millions of barrels per day)
Source Canadian Assoc of Petroleum Producers
Oil amp Gas Infrastructure Investment Driversbull Need for pipeline and related infrastructure driven by the
significant increase in North American unconventional natural gas and oil production ndash not commodity prices
bull Takeaway pipelines have not been built fast enough to keep pace with hydrocarbon production ndash significant pipeline development needed
bull Large pipeline construction industry capacity is currently tight but could get significantly strained over the next several years
North American Pipeline ForecastProbability Weighted
Quanta Is the Largest Pipeline Construction Company in North America
bull Quanta is the largest pipeline construction company in North America
bull This positions Quanta to provide significant large diameter pipe construction capacity to the industry while remaining active in select shales
bull We are ready to assist our customers in meeting their development goals in what could be a resource challenged environment
North America Major Planned Mainline Project Capex
Source KeyBanc Capital Markets
$0
$5
$10
$15
$20
2016E 2017E 2018E 2019E
In B
illio
ns
In B
illio
ns
Oil amp Gas Infrastructure Investment DriversNatural Gas Distribution amp Pipeline Integritybull US pipeline infrastructure is getting older
bull PHMSA estimates more than 470K miles (37) of US gas distribution mains and 171K miles (57) of gas transmission pipelines were installed before 1970 or in an undocumented year
bull Local Distribution Companies (LDCs) continue increased spend on pipe inspection and replacement
bull Replacement programs ramped up after San Bruno incident in 2010 Utilities are spending $22B a year on transmission and distribution systems(2)
bull Regulations push for expanding inspection programs and accelerating replacement work
bull PHMSA will require more inspection and corrosion control activity which will require additional excavations and integrity work DOErsquos Quadrennial Energy Review emphasizes the need to accelerate pipe replacement to curb emissions from leak-prone pipe
bull Long timelines for some replacement plans will push spend acceleration
bull Current projections are over 20 years for many large utilities a few more than 50 years(3) Replacement activities will have to be accelerated to address risk
bull State regulators establishing cost recovery mechanisms to accelerate replacement programs
Significant Inventory Remains for Replacement
States with Gas Utility Cost Recovery Mechanisms(4)
(1) PHMSA pipe inventory reports 2011-2015(2) AGA 2016 Playbook (3) Department of Energy Quadrennial Energy Review ndash Energy Transmission Storage and Distribution Infrastructure April 2015 (4) American Gas Association Playbook 2017
Stronghold Acquisition Overview
bull Provides catalyst handling turnaround and other downstream services tank storage and other midstream services
bull Specializes in high pressure and high reactor infrastructure services
bull Industry leading safety record employee and training focus with entrepreneurial culture
bull Led by a strong multigenerational highly regarded management team with decades of industry experience
bull Preferred employer with low turnover and high-quality workforce ndash averaging 2800 employees
bull Excellent reputation and strong relationships with a high-quality and diverse client base
bull Strong historical organic growth
21
Stronghold is a leading specialized services company providing high pressure and critical path solutions to the downstream and midstream energy markets
Company Profile
2016 Revenue =Approx $500 Million
Downstream Services
85
Midstream Services
15
Strategic Rationalebull Facilitates capture of a greater portion of energy
industry spend and offers cross-selling opportunities
bull Specialized Industrial Services market is a natural service line expansion for Quanta to meet our customersrsquo needs
bull Complements existing downstream high-voltage power services
bull Stronghold gives Quanta a significant presence in downstream services and a strong platform for growth
bull Strong financial profilebull Attractive historical growth and accretive margin
profile low capex requirements solid cash flow and accretive to earnings
bull Enhances recurring base business revenue
bull Shale oil natural gas and natural gas liquids (NGLs) production driving refinery petrochemical and storage infrastructure needs
Telecom Infrastructure Services Overview
To be an industry leading and true EPC contractor providing comprehensive communications infrastructure solutions to customers in the United States Canada and select markets in Latin America
Goal
Diverse Existing amp Target Customer BaseMarkets Served
Telecom Infrastructure Investment Drivers
bull Telco gigabit fiber to the home deployment programs
bull Cable MSOs deploying DOCSIS 31
bull Upcoming - 5G wireless and fiber backhaul
bull Ongoing 4G wireless network optimization
bull Connect America Fund - rural fiber build-out
bull Federal government funded FirstNet - national wireless network for first responders
United States
bull Backbone and last mile fiber (behind relative to the US)
bull Telco gigabit fiber to the home deployment programs
bull Cable MSOs deploying DOCSIS 31
bull Upcoming - 5G wireless and fiber backhaul
bull Ongoing 4G wireless network optimization
bull Federal government infrastructure initiatives generally positive
Canada
bull Significantly behind North America in both wireline and wireless connectivity
bull However demand for connectivity media and data intensive services is strong
bull Fiber and backhaul networks significantly behind North America
bull Primarily 3G wireless some 4G wireless (country dependent)
bull Various governments have infrastructure expansion initiatives
bull Concession and P3 opportunities
bull Connectivity for quality of life social and commercial reasons
Latin America
Telecom Infrastructure Services Overview
Fiber Builds
Wireless Deployment
Make Ready Services
Civil Construction
Engineering Design
Material Management
EPC
Wireless Wireline
United StatesWireless Wireline
CanadaWireless Wireline
Latin America
Comprehensive Infrastructure Solutions Offered On A Turnkey Discrete Service or EPC Basis
bull Proven greenfield expansion model in Latin America ndash US should be less difficult
Leverage existing US field operations people equipment and property
bull Select strategic acquisitions may play a role but NOT a roll-up approach
Provide wireline and wireless services - heavier on wireline
bull Increasing convergence of wireless and wireline due fiber requirements of both
Project centric nimble approach versus MSA focused EPC services to differentiate
bull Less capital intensive with better margin opportunity
GOAL
STRATEGY
STRATEGY
STRATEGY
STRATEGY
To be the leading communications infrastructure contractor in the markets we serve
Engineer Procure Construct (EPC) Is A Differentiator
bull Quanta has a long history in the EPC business and is increasingly performing select projects on an EPC basisbull Customersrsquo capital programs are at historic levels and growing Projects are getting larger and more complexbull Evolution of regulatory demands competition and alternative pricing models
bull Many customers have limited internal resources and expertise to manage these dynamics and are turning to Quanta for solutions
bull Project cost certainty becoming increasingly important
bull We are enhancing initiatives to ensure we have a scalable comprehensive enterprise-wide capability for EPC projects that is consistently executed across all segments and geographies
bull EPC projects are a meaningful contributor to our current backlog and provide significant opportunity for future growth
Integrated Services
Construction amp Installation
Assessment Planning amp
Development
Engineering amp Design
Procurement Operation and Maintenance
What is Infrastructure Solutions
Infrastructure Solutions represent strategic partnerships with customers and capital partners
bull Public private partnerships (P3)bull Concessionsbull Build Own Operate or Transfer
(BOOT)bull Build to Suit (BTS) arrangements
These solutions are a growth engine for each of our segments and geographies and a core component of our strategic
imperative to deliver differentiated solutions to our customers
Encompasses
Infrastructure Solutions Drivers
A Combination of Drivers are Occurring that Create Demand and Opportunity for Our Infrastructure Solutions
bull Provide transparency to a project shape design constructability risk allocation and overall project structure
bull Manages risk that yields more informed EPC project decisions
bull Improves success rate of both winning the engagement and successful execution
bull Where appropriate we invest alongside our partners
bull Significant capital needs to fund the substantial infrastructure needs
bull Utilization of concessions public private partnerships (P3) and private infrastructure partnerships to fund and attract high-quality entities for complex projects
bull Changes in regulation (such as FERC Order 1000)
bull New entrants together with high interest and availability of investor infrastructure investment capital
Quanta Is A True Partner
bull Quanta increasingly sought as a partner for our execution capabilities the need for price certainty and our financial strength
bull Projects are larger more complex greater scope Typically under lump-sum turnkey arrangements which create greater opportunities and risks for Quanta
bull Successful Infrastructure Solutions and project execution track record
Quanta Sought for Executionamp Track Record
Market Structure amp Projects Getting More Complex
29
Fully Integrated Solutions Based Provider
Infrastructure Solutions Provides A Solutions Based Tool for Quanta to Partner with Customers Enhance Relationships and Create New Customer and Project Opportunities
EPC
Capitalbull Determine capital structurebull Source capitalbull Quanta minority direct
investmentbull First Infrastructure Capital
Advisors
PartnershipsPartner withbull Customersbull Equity Capital
(4) Includes $802 million of expense net of tax or $036 per diluted share from an arbitration decision charge to provision for long-term contract receivable and the benefit associated with release of certain income tax contingencies
2013 2014 2015 2016 2017 Est
($ in millions)Revenue
$140$122
$062
$126
$163
2013 2014 2015 2016 2017Est
(4)
(5)
(6)
Electric Power Oil amp Gas Infrastructure
GAAP Diluted EPS (1)
$156
$185
$111
$151
$195
2013 2014 2015 2016 2017Est
Adjusted Diluted EPS (1)
$6412
(2) Represents the midpoint of guidance range
(2)
$7747
(2) (2) $173
(3) Includes $033 gain from sale of Howard Energy investment
$9300(3)
(1) From continuing operations
$7572
(5) Includes $734 million of project losses Also includes $454 million of expense net of tax or $023 per diluted share from net asset impairment charges
$7651
(6) Includes $548 million of project losses and $71 million of expense net of tax or $005 per diluted share from net asset impairment charges Also includes tax benefits of $205 million or $013 per share associated with the expiration of various federal and state tax statute of limitations periods
Recent Financial Performance amp 2017 ExpectationsFor the Years Ended December 31
($ in millions)Electric Power
$4542
$5303$4937 $4850
115107
7583
2013 2014 2015 2016 2017 Est
Revenue Op Margin
(2)
(1) Operating margin excludes a $1025 million charge to cost of services for long-term contract receivable in 2014 Refer to appendix for non-GAAP reconciliation(2) Excludes a $66 million property and equipment impairment charge Includes the impact of $661 million of project losses Refer to appendix for non-GAAP reconciliation(3) Excludes a $57 million asset impairment charge Includes the impact of $548 million of project losses Refer to appendix for non-GAAP reconciliation
(1) (1)
(2)(3)
f Est revenue growth approaching 15 vs 2016
Est operating incomemargins of 90 to 95
Guidance Commentary($ in millions)
Oil amp Gas Infrastructure
(4) Excludes a $388 million expense associated with an arbitration decision Refer to appendix for non-GAAP reconciliation(5) Includes $73 million of project losses
Liquidity includes cash and cash equivalents and availability under our revolving credit facility as described in our Form 10k
Historical Cash Flow Generation
$163
$15
$434
$191
2013 2014 2015 2016
Cash Flow from Continuing Operations
($ in millions)
Free Cash Flow from Continuing Operations
$371
$248
$618
$381
2013 2014 2015 2016
Net cash provided by operating activities from continuing operations plus proceeds from sale of property and equipment less additions of property and equipment
For the Years Ending December 31($ in millions)
For the Years Ending December 31
Committed to Generating Shareholder Value
Executed on $125 Billion Share Repurchase Authorizationbull Aug 2015 ndash Announced a new $125 billion share repurchase
authorization through Feb 28 2017bull Completed a $750 million accelerated stock repurchase (ASR)
arrangement in April 2016bull Acquired 351 million shares at $2136 per share
bull $500 million for opportunistic repurchases through Feb 28 2017bull $450 million 192 million shares retired
Completed $500 Million Share Repurchase Authorizationbull Completed previous $500 million share repurchase program in 2015bull Acquired approximately 174 million shares for total cost of $500
million
Acquired $17 Billion of Quanta Common Stock
Under Previous Programs Quanta Has Acquired Approximately 32 of Its Outstanding Stock
$2197$1951
$1573 $1573
0
25
50
75
100
125
150
175
200
225
$0000
$500000
$1000000
$1500000
$2000000
$2500000
$3000000
2014 2015 2016 2017E
Net Income Required to Generate $001 In EPS
Avg Dil Shs Out
Earnings Power Improvement
$ in
Tho
usan
ds
Shares in Millions
May 25 2017 ndash Announced New $300 Million Share Repurchase Authorizationbull Up to $300 million through June 30 2020
Opportunistic amp Disciplined Capital Allocation
Capital Deployment Preference (Amounts in millions)
bull Working Capitalbull Capital Expendituresbull Acquisitionsbull Investmentsbull Return of Capital
bull Generally in sync with preference however hellip
bull Financial strength provides the ability to be opportunistic
bull Flexible and strategic capital allocation is a competitive advantage
Capital Deployment Posture
Financial Strength Allows for Flexible and Strategic Capital Allocation ndash A Competitive Advantage
2013 ndash 2016 Sources amp Uses of Cash
Sources
Cash Flow fromOperations
DivestitureProceeds
BorrowingsInvestment Sales
$3099
$1667
$842
$369$221
Uses
StockRepurchase
CAPEX amp OtherNet
Acquisitions Net
Investments
$1700
$900
$728
$54$3382
54
27
127
50
27
21
2
Amounts reflect the retrospective application of a recent accounting pronouncement related to the classification of tax withholding payments for share-based compensation
Foundation For Growth amp Improved Profitability
Multi-Year Growth Opportunities
Innovative Industry Leading Solutions
Scale amp Scope
Financial Strength
Operational amp Safety Excellence
QuantaServicesIR
QuantaIR
Connect With Quanta Services Investor Relations
Corporate Office2800 Post Oak Blvd Suite 2600Houston TX 77056713-629-7600wwwquantaservicescom
Investor ContactKip Rupp CFAVice President ndash Investor Relations713-341-7260investorsquantaservicescom
Reconciliation of Adjusted Net Income from Continuing Operations Attributable to Common Stock
2013 2014 2015 2016 2017 2017Reconciliation of adjusted net income from continuing operations attributable to common stockNet income from continuing operations attributable to common stock (GAAP as reported) 372057$ 269224$ 120286$ 198725$ 247000$ 275300$ Adjustments
Asset impairment charges - - 58451 7964 - -Severance and restructuring charges - - - 6352 - -Acquisition and integration costs 8145 14754 7966 3053 9300 9300 Impact of income tax contingency releases (9935) (8099) - (20488) - -Impact of tax benefit from realization of previously unrecognized deferred tax asset - - (4228) - - -Impact of Alberta tax law change - - 4982 - - -Provision for long-term contract receivable - 102460 - - - -Arbitration expense - 38848 - - - -Impact of sale of equity ownership in Howard Energy (112744) - - - - -Income tax impact of adjustments 39836 (55935) (16186) (3982) (3400) (3400)
Adjusted net income from continuing operations attributable to common stock before certain non-cash adjustments 297359 361252 171271 191624 252900 281200
Non-cash stock based compensation 34381 37449 36939 41134 47000 47000 Amortization of intangible assets 25865 34257 34848 31685 30600 30600 Income tax impact of non-cash adjustments (22715) (26453) (25817) (26183) (28500) (28500)
Adjusted net income from continuing operations attributable to common stock 334890$ 406505$ 217241$ 238260$ 302000$ 330300$ Weighted average sharesWeighted average shares outstanding for diluted earnings per share 214978 219690 195120 157288 157300 157300 Weighted average shares outstanding for adjusted diluted earnings per share 214978 219690 195120 157288 157300 157300 Diluted earnings per share from continuing operations attributable to common stock and adjusted diluted earnings per share from continuing operations attributable to common stockDiluted earnings per share from continuing operations attributable to common stock 173$ 123$ 062$ 126$ 157$ 175$ Adjusted diluted earnings per share from continuing operations attributable to common stock 156$ 185$ 111$ 151$ 192$ 210$
Estimated Guidance Range
For the Years Ended December 31
(in thousands except per share information)(Unaudited)
Recast of Adjusted Diluted
Reconciliation of Electric Power and Oil amp Gas Infrastructure Services Segments Operating Income As Adjusted
Amounts in millions except percentagesOil amp Gas
Infrastructure12312014 12312015 12312016 12312014
Revenues 53027$ 49373$ 48505$ 24446$
Operating Income (as reported) 4630 3623 3957 1628
Addback Provisions for long term contract receivable 1025 - - - Arbitration expense - - - 388 Asset impairment charge - 66 57 -
Operating Income (as adjusted) 5655$ 3689$ 4014$ 2016$
Operating income margin (as reported) 87 73 82 67Operating income margin (as adjusted) 107 75 83 83
Electric Power
Sheet1
Reconciliation of Free Cash Flow
2013 2014 2015 2016Net Cash Provided by Operating Activities of Continuing Operations 370558 247742 618183 381176 Less Net Capital ExpendituresAdditions of Property and Equipment (221946) (247216) (209968) (212555) Proceeds from Sale of Property and Equipment 14789 14448 26178 21975 Net Capital Expenditures (207157) (232768) (183790) (190580)
Free Cash Flow 163401 14974 434393 190596
Free Cash Flow from Cont Ops
Forward Looking Statement DisclaimerThis presentation (and oral statements regarding the subject matter of this presentation) includes ldquoforward-looking statementsrdquo intended to qualify for the safe harbor from liability established by the Private Securities Litigation Reform Act of 1995 These statements reflect assumptions expectations projections intentions or beliefs about future events and use words such as anticipate estimate project forecast may will should could expect believe plan intend and other words of similar meaning You can identify these statements by the fact that they do not relate strictly to historical or current facts In particular these include but are not limited to statements relating to the following
bull Projected revenues net income earnings per share attributable to common stock backlog margins capital expenditures weighted average shares outstanding tax rates and other projections of operating or financial resultsbull Our business or financial outlook growth or opportunities in particular marketsbull The potential benefits from acquisitions and investmentsbull The expected financial and operational performance of acquired businessesbull Future capital allocation initiativesbull Our ability to deliver increased value and return capital to stockholders bull The strategic use of our balance sheetbull The expected value of contracts or intended contracts with customersbull The scope services term and results of any projects awarded or expected to be awarded for services to be provided by usbull The anticipated commencement and completion dates for any projects awardedbull The development of larger electric transmission and oil and natural gas pipeline projects and the level of oil natural gas and natural gas liquids prices and their impact on our business or the demand for our services bull The impact of existing or potential energy legislation bull Potential opportunities that may be indicated by bidding activity or discussions with customersbull The expected outcome of pending or threatened litigation bull Beliefs and assumptions about the collectability of receivablesbull The business plans or financial condition of our customersbull Our plans and strategies bull The current economic and regulatory conditions and trends in the industries we serve bull Possible recovery on pending or contemplated change orders or affirmative claims against customers or third parties and bull Other statements reflecting expectations intentions assumptions or beliefs about future events and other statements that do not relate strictly to historical or current facts
Although our management believes that the expectations reflected in such forward-looking statements are reasonable it can give no assurance that such expectations will prove to be correct These forward-looking statements are not guarantees of future performance and involve or rely on a number of risks uncertainties and assumptions that are difficult to predict or beyond our control These forward-looking statements reflect our beliefs and assumptions based on information available to our management at the time the statements are made We caution you that actual outcomes and results may differ materially from what is expressed implied or forecasted by our forward-looking statements and that any or all of our forward-looking statements may turn out to be wrong Forward-looking statements can be affected by inaccurate assumptions and by known or unknown risks and uncertainties including the following
bull Market conditionsbull The effects of industry economic financial or political conditions outside our control including weakness in capital marketsbull Quarterly variations in our operating resultsbull Trends and growth opportunities in relevant marketsbull The cost of borrowing availability of credit and cash fluctuations in the price and volume of our common stock debt covenant compliance interest rate fluctuations and other factors affecting our financing and investing activitiesbull Delays reductions in scope or cancellations of anticipated pending or existing projects including as a result of weather regulatory or permitting issues environmental processes project performance issues claimed force majeure events or our customers capital
constraintsbull The successful negotiation execution performance and completion of anticipated pending and existing contracts including the ability to obtain awards of projects on which we bid or are otherwise discussing with customersbull Our ability to retain key personnel and qualified employees
Forward Looking Statement Disclaimerbull Our ability to attract or the potential shortage of skilled labor bull Our dependence on fixed price contracts and the potential to incur losses with respect to the contractsbull Estimates relating to our use of percentage-of-completion accountingbull Adverse weatherbull Our ability to generate internal growthbull Competition in our business including our ability to effectively compete for new projects and market sharebull The effect of natural gas natural gas liquids and oil prices on our operations and growth opportunities and on
our customersrsquo capital programs and demand for our servicesbull The future development of natural resourcesbull The failure of existing or potential legislative actions to result in demand for our servicesbull Liabilities associated with multiemployer pension plans including underfunding of liabilities and termination
or withdrawal liabilitiesbull The possibility of further increases in the liability associated with our withdrawal from a multiemployer
pension planbull Unexpected costs or liabilities that may arise from pending or threatened litigation indemnity obligations or
other claims asserted against us including liabilities for claims that are self-insured or uninsuredbull The outcome of pending or threatened litigationbull Risks relating to the potential unavailability or cancellation of third party insurance the exclusion of coverage
for certain losses and potential increases in premiums for coverage deemed beneficial to usbull Cancellation provisions within our contracts and the risk that contracts expire and are not renewed or are
replaced on less favorable termsbull Loss of customers with whom we have long-standing or significant relationshipsbull The potential that participation in joint ventures or similar structures exposes us to liability andor harm to
our reputation for acts or omissions by our partnersbull Our inability or failure to comply with the terms of our contracts which may result in additional costs
unexcused delays warranty claims failure to meet performance guarantees damages or contract terminations
bull The inability or refusal of our customers to pay for services including the failure to collect outstanding receivables
bull The failure to recover on payment claims against project owners or third party contractors or to obtain adequate compensation for customer-requested change orders
bull The failure of our customers to comply with regulatory requirements applicable to their projects which may result in project delays and cancellations
bull Budgetary or other constraints that may reduce or eliminate tax incentives or government funding for projects which may result in project delays or cancellations
bull Estimates and assumptions in determining our financial results and backlogbull Our ability to realize our backlogbull Risks associated with operating in international markets including instability of foreign governments
currency fluctuations tax and investment strategies as well as compliance with foreign legal systems and cultural practices the US Foreign Corrupt Practices Act and other applicable anti-bribery and anti-corruption laws
bull Our ability to successfully identify complete integrate and realize synergies from acquisitionsbull The potential adverse impact resulting from uncertainty surrounding investments and acquisitions including
the ability to retain key personnel from the acquired businesses and the potential increase in risks already existing in our operations
bull The adverse impact of impairments of goodwill receivables property equipment and other intangible assets or investments
bull Our growth outpacing our decentralized management and infrastructurebull Requirements relating to governmental regulation and changes theretobull Inability to enforce our intellectual property rights or the obsolescence of such rightsbull Risks related to the implementation of an information technology solutionbull The impact of our unionized workforce on our operations including labor stoppages or interruptions due to
strikes or lockoutsbull Potential liabilities and other adverse effects arising from occupational health and safety mattersbull Our dependence on suppliers subcontractors equipment manufacturers and other third party contractorsbull Fluctuations of prices of certain materials used in our businessbull The ability to access sufficient funding to finance desired growth and operationsbull Our ability to obtain performance bondsbull Potential exposure to environmental liabilitiesbull Our ability to continue to meet certain requirements applicable to us and our subsidiariesbull Rapid technological and other structural changes that could reduce the demand for our servicesbull New or changed tax laws treaties or regulationsbull Increased healthcare costs arising from healthcare reform legislation or other governmental actionbull Regulatory changes that result in increased labor costsbull Significant fluctuations in foreign currency exchange rates andbull The other risks and uncertainties as are described elsewhere herein and in our Annual Report on Form 10-K for
the year ended December 31 2016 filed with the SEC and as may be detailed from time to time in our other public filings with the SEC
All of our forward-looking statements whether written or oral are expressly qualified by these cautionary statements and any other cautionary statements that may accompany such forward-looking statements or that are otherwise included in this presentation Should one or more of these risks materialize or should underlying assumptions prove incorrect actual results may vary materially from those expressed or implied in any forward-looking statements Investors are cautioned not to place undue reliance on these forward-looking statements which are current only as of this date We do not undertake and expressly disclaim any obligation to update or revise any forward-looking statements to reflect events or circumstances after the date of this presentation or otherwise and we expressly disclaim any written or oral statements made by any third party regarding the subject matter of this presentation
Slide Number 1
Forward Looking Statement Disclaimer
Key Takeaways
Leading Integrated Infrastructure Solutions Provider
Overview ndash Strategically Focused Operationally Diverse
Overview - Diverse and High Quality Customer Base
Leading Integrated Infrastructure Solutions Provider
Strategic Imperatives
Strategic Imperatives Deliver Profitable Growth
Strategic Acquisitions Criteria and Rationale
Differentiated Competitive Position ndash In the Sweet Spot
Differentiated Competitive Position ndash In the Sweet Spot
Electric Power Infrastructure Services Segment Overview
Power Grid Investment Drivers - Transmission
Power Grid Investment Drivers - Transmission
Power Grid Investment Drivers - Distribution
Oil amp Gas Infrastructure Services Segment Overview
Reconciliation of Adjusted Net Income from Continuing Operations Attributable to Common Stock
Reconciliation of Electric Power and Oil amp Gas Infrastructure Services Segments Operating Income As Adjusted
Reconciliation of Free Cash Flow
Forward Looking Statement Disclaimer
Forward Looking Statement Disclaimer
Free Cash Flow From Continuing Operations
Source
2013
2014
2015
2016
(Support Cash Flow Statement)
Net Cash Provided by Operating Activities of Continuing Operations
370558
247742
618183
381176
(Support Cash Flow Statement)
Less Net Capital Expenditures
(Support Cash Flow Statement)
Additions of Property and Equipment
(221946)
(247216)
(209968)
(212555)
(Support Cash Flow Statement)
Proceeds from Sale of Property and Equipment
14789
14448
26178
21975
(Recalculation)
Net Capital Expenditures
(207157)
(232768)
(183790)
(190580)
(Recalculation)
Free Cash Flow
163401
14974
434393
190596
Adjusted Operating Income Margin
$ in millions
Support for slide 23
Amounts in millions except percentages
Electric Power
Oil amp Gas Infrastructure
123114
123115
123116
123114
Revenues
$ 53027
$ 49373
$ 48505
$ 24446
Operating Income (as reported)
4630
3623
3957
1628
Addback
Provisions for long term contract receivable
1025
-0
-0
-0
Arbitration expense
-0
-0
-0
388
Asset impairment charge
-0
66
57
-0
Operating Income (as adjusted)
$ 5655
$ 3689
$ 4014
$ 2016
Operating income margin (as reported)
87
73
82
67
Operating income margin (as adjusted)
107
75
83
83
Quanta Services Inc and Subsidiaries
Reconciliation of Non-GAAP Financial Measures
Adjusted Diluted Earnings Per Share from Continuing Operations
For the Years Ended December 31
(in thousands except per share information)
(Unaudited)
Estimated Guidance Range
2013
2014
2015
2016
2017
2017
Reconciliation of adjusted net income from continuing operations attributable to common stock
Net income from continuing operations attributable to common stock (GAAP as reported)
$ 372057
$ 269224
$ 120286
$ 198725
$ 247000
$ 275300
Adjustments
Asset impairment charges
-
-
58451
7964
-
-
Severance and restructuring charges
-
-
-
6352
-
-
Acquisition and integration costs
8145
14754
7966
3053
9300
9300
Impact of income tax contingency releases
(9935)
(8099)
-
(20488)
-
-
Impact of tax benefit from realization of previously unrecognized deferred tax asset
-
-
(4228)
-
-
-
Impact of Alberta tax law change
-
-
4982
-
-
-
Provision for long-term contract receivable
-
102460
-
-
-
-
Arbitration expense
-
38848
-
-
-
-
Impact of sale of equity ownership in Howard Energy
(112744)
-
-
-
-
-
Income tax impact of adjustments
39836
(55935)
(16186)
(3982)
(3400)
(3400)
Adjusted net income from continuing operations attributable to common stock before certain non-cash adjustments
297359
361252
171271
191624
252900
281200
Non-cash stock based compensation
34381
37449
36939
41134
47000
47000
Amortization of intangible assets
25865
34257
34848
31685
30600
30600
Income tax impact of non-cash adjustments
(22715)
(26453)
(25817)
(26183)
(28500)
(28500)
Adjusted net income from continuing operations attributable to common stock
$ 334890
$ 406505
$ 217241
$ 238260
$ 302000
$ 330300
Weighted average shares
Weighted average shares outstanding for diluted earnings per share
214978
219690
195120
157288
157300
157300
Weighted average shares outstanding for adjusted diluted earnings per share
214978
219690
195120
157288
157300
157300
Diluted earnings per share from continuing operations attributable to common stock and adjusted diluted earnings per share from continuing operations attributable to common stock
Diluted earnings per share from continuing operations attributable to common stock
$ 173
$ 123
$ 062
$ 126
$ 157
$ 175
Adjusted diluted earnings per share from continuing operations attributable to common stock
$ 156
$ 185
$ 111
$ 151
$ 192
$ 210
2017 Forecast
2008
2009
2010
2011
2012
2013
2014
2015
2016
2017
2018
2019
2020
2021
2022
US IOU
17599783395
17375430450
17116821481
17473265629
19719353886
18593206538
21049378470
23210018195
24651006483
28003750000
29530700000
30481300000
30509750000
31231850000
31138000000
Co-ops
3679033739
3613552751
2806195753
3044502916
2639012201
3360515403
3050612075
2834000972
3277074511
3309845256
3342943708
3376373145
3410136877
3444238245
3478680628
MuniGovt Owned
2525145025
2693819865
2624788344
2608815562
2682098477
2938725525
3183015391
3330273309
3454862656
3664198000
3769427295
3778921940
3483677493
3817389338
3817389338
Canadian
3324942988
3202431553
3726264949
4213182949
4228837570
4323705834
4106960884
3465854177
3159852215
3254697600
3381315300
3453964800
3380277450
3406223700
3406223700
Total NA 2017 Market
27128905147
26885234619
26274070528
27339767056
29269302134
29216153300
31389966819
32840146653
34542795864
38232490856
40024386303
41090559885
40783841819
41899701283
41840293665
From August 2015 Report
North American Electric Distribution Spending
2008
2009
2010
2011
2012
2013
2014
2015
2016
2017
2018
2019
2020
US IOUs
$175
$173
$171
$174
$197
$186
$210
$226
$244
$244
$247
$249
$250
US Co-ops
$27
$29
$27
$29
$35
$41
$34
$39
$40
$40
$41
$42
$42
US Muni
$25
$26
$26
$28
$28
$29
$29
$30
$31
$31
$32
$32
$33
Total US
$226
$227
$224
$231
$260
$256
$273
$295
$314
$316
$320
$323
$325
Canada
$33
$33
$34
$39
$38
$39
$39
$38
$41
$41
$42
$43
$43
Total
$260
$261
$259
$269
$298
$294
$312
$333
$354
$357
$362
$365
$368
15 vs 16
$00
$01
$02
$04
($01)
($04)
$06
$04
$08
$21
$19
$28
$26
From August 2016 Report
North American Electric Distribution Spending
2008
2009
2010
2011
2012
2013
2014
2015
2016
2017
2018
2019
2020
US IOUs
$176
$174
$171
$175
$197
$186
$210
$232
$258
$270
$271
$281
$281
US Co-ops
$27
$29
$27
$29
$31
$33
$38
$39
$40
$41
$41
$42
$43
US Muni
$25
$26
$26
$28
$28
$29
$29
$30
$31
$31
$32
$33
$33
Total US
$228
$229
$224
$232
$256
$248
$277
$301
$329
$342
$344
$356
$357
Canada
$32
$32
$37
$41
$41
$42
$41
$36
$33
$36
$37
$37
$37
Total
$260
$261
$261
$273
$297
$290
$318
$337
$362
$378
$381
$393
$394
From September 2017 Report
North American Electric Distribution Spending
2008
2009
2010
2011
2012
2013
2014
2015
2016
2017
2018
2019
2020
2021
2022
US IOUs
$176
$174
$171
$175
$197
$186
$210
$232
$247
$280
$295
$305
$305
$312
$311
US Co-ops
$37
$36
$28
$30
$26
$34
$31
$28
$33
$33
$33
$34
$34
$34
$35
US Muni
$25
$27
$26
$26
$27
$29
$32
$33
$35
$37
$38
$38
$35
$38
$38
Total US
$238
$237
$225
$231
$250
$249
$273
$294
$314
$350
$366
$376
$374
$385
$384
Canada
$33
$32
$37
$42
$42
$43
$41
$35
$32
$33
$34
$35
$34
$34
$34
Total
$271
$269
$263
$273
$293
$292
$314
$328
$345
$382
$400
$411
$408
$419
$418
2015 vs 2016 vs 2017
2015 Est
2016 Est
2017 Est
Avg 08-11
$262
$264
$269
Avg 12-15
$309
$311
$307
2016
$354
$362
$345
2017
$357
$378
$382
2018
$362
$381
$400
2019
$365
$393
$411
2020
$368
$394
$408
2021
$419
2022
$418
2017
Strategic Acquisitions Criteria and Rationale
Acquisition Strategic Rationale
bull Acquisitions have and will continue to play a strategic role in differentiating Quanta in the marketplace and positioning the company for profitable long-term growth
bull Seek well respected entrepreneurial leadership with extensive history of operational excellencebull Only interested in companies that bring strategic value to Quanta and provide opportunity for 1+1=3 growth
opportunity over time
bull Brings leadership position in new geographybull Enhances presence and capabilities in an existing
geographybull Brings or enhances customer relationshipsbull Brings leadership position in adjacent or new
marketbull Brings unique service or technology that Quanta
can leverage to further differentiate its turnkey solution offering
Typical Deal Terms
bull Target 4x-5x EBITDA multiplebull 40 of consideration in Quanta stock 60 of
consideration in cashbull Meaningful stock component for operational and
stakeholder alignment
bull Company leadership stays on to run the businessbull Non-compete agreementsbull Stock locked up for period of time
Differentiated Competitive Position ndash In the Sweet Spot
bull Quanta is the largest infrastructure specialty contractor in North America
bull Unmatched scope providing broader solutions to customersbull Unmatched scale as the largest employer of skilled workforce in
the industry ndash more than 35000 employeesbull Track record of safe executionbull Projects are getting larger and more complex customers
increasingly seeking cost certainty and performancebull Quanta has consistently been working on numerous large
projects simultaneously for the past + six yearsbull Significant revenues from strategic relationships recurring work
and an increasing amount of negotiated work
Quanta vs Specialty Contractors Quanta vs Traditional EampCs
bull Today our customers believe skilled construction labor is a finite resource and critical to overall project success where engineering and procurement are more commoditized
bull Quanta has the largest skilled workforce in the industry ndash more than 35000 employees
bull Quanta self-performs its projects ndash controls quality and executionbull EampCs typically provide project management oversight and have
limited self-perform construction capabilitiesbull Quanta derives significant revenues from strategic relationships
recurring work and an increasing amount of negotiated workbull Price is often the primary driver of who wins EampC projects
Est Large Project Capability
Bubble Size = Avg Market Cap
0
20
40
60
80
100
Est
Self
Perfo
rm C
apab
ility
Bubble Size = Avg Market Cap
LargerSmaller
Differentiated Competitive Position ndash In the Sweet Spotbull Quanta is uniquely positioned to meet
customer needs versus both specialty contractors and traditional engineering and construction companies
bull Customers understand that skilled labor is critical to project success
bull Projects are getting larger and more complex and customers are increasingly seeking comprehensive solutions
bull Demand for specialty construction resources is high and increasing but supply is limited
bull Quanta has the largest infrastructure specialty contractor workforce in North America +35000 employees globally
bull Quanta has strategically invested in engineering and program management to provide true complete engineering procurement and construction (EPC) solutions
0
20
40
60
80
100
Est
Self
Perf
orm
Cap
abili
ty
Est Large Project Capability
Bubble Size = Avg Market Cap
LargerSmaller
Electric Power Infrastructure Services Segment Overview
$4542$5303 $4937 $4850
115 10775 83
2013 2014 2015 2016Revenue Op Margin
(2)
(1) Operating margin excludes a $1025 million charge to cost of services for long-term contract receivable in 2014 Refer to appendix for non-GAAP reconciliation(2) Excludes a $66 million property and equipment charge in 2015 and a $57 million asset impairment charge in 2016 Includes the impact of $661 million in 2015 and $548 million in 2016 of project losses Refer to appendix for non-GAAP reconciliation
Differentiatorsbull Largest TampD solutions provider in North
Americabull Reputation and Track Recordbull Unmatched Solutions Scope and Scalebull Safety Recordbull Manpower and Equipment Resourcesbull Lazy Q Training Facilitybull Energized Servicesbull EPC Capabilities Across All Offeringsbull Infrastructure Capital Solutions
Market Drivers
Power Grid Investment Drivers - Transmission
bull An aging grid that requires repair upgrade and maintenancebull Favorable transmission regulation Energy Policy Act of lsquo05
NERC Reliability Standards possibly FERC Order 1000 over the long-term
bull More stringent reliability standards will require repairing lines and adding redundant capacity
bull Coal and nuclear generation retirements and switching to natural gas and renewable generation strains the grid
bull Existing and new renewable generation needs interconnection to the grid
bull Opportunity for industrial driven load growthbull Regional grid infrastructure is too congested to get lowest-cost
power to consumersbull Sub-transmission interconnectionbull Canada has same drivers as US as well as the need to serve
mining interests and hydro generation for export to US load centers
bull Challenged economic conditions in Canada
bull Environmental and other regulatory scrutiny right of way acquisition permitting etc
bull Tepid load growthbull Economybull Energy efficiency initiatives
Oil amp Gas Infrastructure Services Segment Overview
$1870
$2445 $2635 $2801
74 83
54 53
2013 2014 2015 2016Revenue Op Margin
(1) Excludes a $388 million expense associated with an arbitration decision Refer to appendix for non-GAAP reconciliation(2) Includes $73 million of project losses
bull Production of shale natural gas oil and natural gas liquids has grown dramatically and is expected to remain at high levels forthe foreseeable future
bull Much of these resources are in areas that have not been traditional hydrocarbon fuel sources and do not have adequate infrastructure in place to gather store process and transport product
bull Canadian oil production lacks adequate takeaway pipeline infrastructurebull Economics of pipeline transportation is increasingly attractive versus rail in a low oil price environmentbull Pipeline construction capacity is more limited in Canada versus the US and construction capacity constraints could be significant
bull It will take many years and significant energy infrastructure investment to harvest these resources
Shale Gas amp Tight Oil Plays Drive US Natural Gas Production
2000-2040 (trillion cubic feet)
Source EIA Annual Energy Outlook 2017
Tight Oil Drives US Oil Production2000-2040 (millions of barrels per day)
Source EIA Annual Energy Outlook 2015
Canadian Oil Sands amp Conventional Oil Production(Millions of barrels per day)
Source Canadian Assoc of Petroleum Producers
Oil amp Gas Infrastructure Investment Driversbull Need for pipeline and related infrastructure driven by the
significant increase in North American unconventional natural gas and oil production ndash not commodity prices
bull Takeaway pipelines have not been built fast enough to keep pace with hydrocarbon production ndash significant pipeline development needed
bull Large pipeline construction industry capacity is currently tight but could get significantly strained over the next several years
North American Pipeline ForecastProbability Weighted
Quanta Is the Largest Pipeline Construction Company in North America
bull Quanta is the largest pipeline construction company in North America
bull This positions Quanta to provide significant large diameter pipe construction capacity to the industry while remaining active in select shales
bull We are ready to assist our customers in meeting their development goals in what could be a resource challenged environment
North America Major Planned Mainline Project Capex
Source KeyBanc Capital Markets
$0
$5
$10
$15
$20
2016E 2017E 2018E 2019E
In B
illio
ns
In B
illio
ns
Oil amp Gas Infrastructure Investment DriversNatural Gas Distribution amp Pipeline Integritybull US pipeline infrastructure is getting older
bull PHMSA estimates more than 470K miles (37) of US gas distribution mains and 171K miles (57) of gas transmission pipelines were installed before 1970 or in an undocumented year
bull Local Distribution Companies (LDCs) continue increased spend on pipe inspection and replacement
bull Replacement programs ramped up after San Bruno incident in 2010 Utilities are spending $22B a year on transmission and distribution systems(2)
bull Regulations push for expanding inspection programs and accelerating replacement work
bull PHMSA will require more inspection and corrosion control activity which will require additional excavations and integrity work DOErsquos Quadrennial Energy Review emphasizes the need to accelerate pipe replacement to curb emissions from leak-prone pipe
bull Long timelines for some replacement plans will push spend acceleration
bull Current projections are over 20 years for many large utilities a few more than 50 years(3) Replacement activities will have to be accelerated to address risk
bull State regulators establishing cost recovery mechanisms to accelerate replacement programs
Significant Inventory Remains for Replacement
States with Gas Utility Cost Recovery Mechanisms(4)
(1) PHMSA pipe inventory reports 2011-2015(2) AGA 2016 Playbook (3) Department of Energy Quadrennial Energy Review ndash Energy Transmission Storage and Distribution Infrastructure April 2015 (4) American Gas Association Playbook 2017
Stronghold Acquisition Overview
bull Provides catalyst handling turnaround and other downstream services tank storage and other midstream services
bull Specializes in high pressure and high reactor infrastructure services
bull Industry leading safety record employee and training focus with entrepreneurial culture
bull Led by a strong multigenerational highly regarded management team with decades of industry experience
bull Preferred employer with low turnover and high-quality workforce ndash averaging 2800 employees
bull Excellent reputation and strong relationships with a high-quality and diverse client base
bull Strong historical organic growth
21
Stronghold is a leading specialized services company providing high pressure and critical path solutions to the downstream and midstream energy markets
Company Profile
2016 Revenue =Approx $500 Million
Downstream Services
85
Midstream Services
15
Strategic Rationalebull Facilitates capture of a greater portion of energy
industry spend and offers cross-selling opportunities
bull Specialized Industrial Services market is a natural service line expansion for Quanta to meet our customersrsquo needs
bull Complements existing downstream high-voltage power services
bull Stronghold gives Quanta a significant presence in downstream services and a strong platform for growth
bull Strong financial profilebull Attractive historical growth and accretive margin
profile low capex requirements solid cash flow and accretive to earnings
bull Enhances recurring base business revenue
bull Shale oil natural gas and natural gas liquids (NGLs) production driving refinery petrochemical and storage infrastructure needs
Telecom Infrastructure Services Overview
To be an industry leading and true EPC contractor providing comprehensive communications infrastructure solutions to customers in the United States Canada and select markets in Latin America
Goal
Diverse Existing amp Target Customer BaseMarkets Served
Telecom Infrastructure Investment Drivers
bull Telco gigabit fiber to the home deployment programs
bull Cable MSOs deploying DOCSIS 31
bull Upcoming - 5G wireless and fiber backhaul
bull Ongoing 4G wireless network optimization
bull Connect America Fund - rural fiber build-out
bull Federal government funded FirstNet - national wireless network for first responders
United States
bull Backbone and last mile fiber (behind relative to the US)
bull Telco gigabit fiber to the home deployment programs
bull Cable MSOs deploying DOCSIS 31
bull Upcoming - 5G wireless and fiber backhaul
bull Ongoing 4G wireless network optimization
bull Federal government infrastructure initiatives generally positive
Canada
bull Significantly behind North America in both wireline and wireless connectivity
bull However demand for connectivity media and data intensive services is strong
bull Fiber and backhaul networks significantly behind North America
bull Primarily 3G wireless some 4G wireless (country dependent)
bull Various governments have infrastructure expansion initiatives
bull Concession and P3 opportunities
bull Connectivity for quality of life social and commercial reasons
Latin America
Telecom Infrastructure Services Overview
Fiber Builds
Wireless Deployment
Make Ready Services
Civil Construction
Engineering Design
Material Management
EPC
Wireless Wireline
United StatesWireless Wireline
CanadaWireless Wireline
Latin America
Comprehensive Infrastructure Solutions Offered On A Turnkey Discrete Service or EPC Basis
bull Proven greenfield expansion model in Latin America ndash US should be less difficult
Leverage existing US field operations people equipment and property
bull Select strategic acquisitions may play a role but NOT a roll-up approach
Provide wireline and wireless services - heavier on wireline
bull Increasing convergence of wireless and wireline due fiber requirements of both
Project centric nimble approach versus MSA focused EPC services to differentiate
bull Less capital intensive with better margin opportunity
GOAL
STRATEGY
STRATEGY
STRATEGY
STRATEGY
To be the leading communications infrastructure contractor in the markets we serve
Engineer Procure Construct (EPC) Is A Differentiator
bull Quanta has a long history in the EPC business and is increasingly performing select projects on an EPC basisbull Customersrsquo capital programs are at historic levels and growing Projects are getting larger and more complexbull Evolution of regulatory demands competition and alternative pricing models
bull Many customers have limited internal resources and expertise to manage these dynamics and are turning to Quanta for solutions
bull Project cost certainty becoming increasingly important
bull We are enhancing initiatives to ensure we have a scalable comprehensive enterprise-wide capability for EPC projects that is consistently executed across all segments and geographies
bull EPC projects are a meaningful contributor to our current backlog and provide significant opportunity for future growth
Integrated Services
Construction amp Installation
Assessment Planning amp
Development
Engineering amp Design
Procurement Operation and Maintenance
What is Infrastructure Solutions
Infrastructure Solutions represent strategic partnerships with customers and capital partners
bull Public private partnerships (P3)bull Concessionsbull Build Own Operate or Transfer
(BOOT)bull Build to Suit (BTS) arrangements
These solutions are a growth engine for each of our segments and geographies and a core component of our strategic
imperative to deliver differentiated solutions to our customers
Encompasses
Infrastructure Solutions Drivers
A Combination of Drivers are Occurring that Create Demand and Opportunity for Our Infrastructure Solutions
bull Provide transparency to a project shape design constructability risk allocation and overall project structure
bull Manages risk that yields more informed EPC project decisions
bull Improves success rate of both winning the engagement and successful execution
bull Where appropriate we invest alongside our partners
bull Significant capital needs to fund the substantial infrastructure needs
bull Utilization of concessions public private partnerships (P3) and private infrastructure partnerships to fund and attract high-quality entities for complex projects
bull Changes in regulation (such as FERC Order 1000)
bull New entrants together with high interest and availability of investor infrastructure investment capital
Quanta Is A True Partner
bull Quanta increasingly sought as a partner for our execution capabilities the need for price certainty and our financial strength
bull Projects are larger more complex greater scope Typically under lump-sum turnkey arrangements which create greater opportunities and risks for Quanta
bull Successful Infrastructure Solutions and project execution track record
Quanta Sought for Executionamp Track Record
Market Structure amp Projects Getting More Complex
29
Fully Integrated Solutions Based Provider
Infrastructure Solutions Provides A Solutions Based Tool for Quanta to Partner with Customers Enhance Relationships and Create New Customer and Project Opportunities
EPC
Capitalbull Determine capital structurebull Source capitalbull Quanta minority direct
investmentbull First Infrastructure Capital
Advisors
PartnershipsPartner withbull Customersbull Equity Capital
(4) Includes $802 million of expense net of tax or $036 per diluted share from an arbitration decision charge to provision for long-term contract receivable and the benefit associated with release of certain income tax contingencies
2013 2014 2015 2016 2017 Est
($ in millions)Revenue
$140$122
$062
$126
$163
2013 2014 2015 2016 2017Est
(4)
(5)
(6)
Electric Power Oil amp Gas Infrastructure
GAAP Diluted EPS (1)
$156
$185
$111
$151
$195
2013 2014 2015 2016 2017Est
Adjusted Diluted EPS (1)
$6412
(2) Represents the midpoint of guidance range
(2)
$7747
(2) (2) $173
(3) Includes $033 gain from sale of Howard Energy investment
$9300(3)
(1) From continuing operations
$7572
(5) Includes $734 million of project losses Also includes $454 million of expense net of tax or $023 per diluted share from net asset impairment charges
$7651
(6) Includes $548 million of project losses and $71 million of expense net of tax or $005 per diluted share from net asset impairment charges Also includes tax benefits of $205 million or $013 per share associated with the expiration of various federal and state tax statute of limitations periods
Recent Financial Performance amp 2017 ExpectationsFor the Years Ended December 31
($ in millions)Electric Power
$4542
$5303$4937 $4850
115107
7583
2013 2014 2015 2016 2017 Est
Revenue Op Margin
(2)
(1) Operating margin excludes a $1025 million charge to cost of services for long-term contract receivable in 2014 Refer to appendix for non-GAAP reconciliation(2) Excludes a $66 million property and equipment impairment charge Includes the impact of $661 million of project losses Refer to appendix for non-GAAP reconciliation(3) Excludes a $57 million asset impairment charge Includes the impact of $548 million of project losses Refer to appendix for non-GAAP reconciliation
(1) (1)
(2)(3)
f Est revenue growth approaching 15 vs 2016
Est operating incomemargins of 90 to 95
Guidance Commentary($ in millions)
Oil amp Gas Infrastructure
(4) Excludes a $388 million expense associated with an arbitration decision Refer to appendix for non-GAAP reconciliation(5) Includes $73 million of project losses
Liquidity includes cash and cash equivalents and availability under our revolving credit facility as described in our Form 10k
Historical Cash Flow Generation
$163
$15
$434
$191
2013 2014 2015 2016
Cash Flow from Continuing Operations
($ in millions)
Free Cash Flow from Continuing Operations
$371
$248
$618
$381
2013 2014 2015 2016
Net cash provided by operating activities from continuing operations plus proceeds from sale of property and equipment less additions of property and equipment
For the Years Ending December 31($ in millions)
For the Years Ending December 31
Committed to Generating Shareholder Value
Executed on $125 Billion Share Repurchase Authorizationbull Aug 2015 ndash Announced a new $125 billion share repurchase
authorization through Feb 28 2017bull Completed a $750 million accelerated stock repurchase (ASR)
arrangement in April 2016bull Acquired 351 million shares at $2136 per share
bull $500 million for opportunistic repurchases through Feb 28 2017bull $450 million 192 million shares retired
Completed $500 Million Share Repurchase Authorizationbull Completed previous $500 million share repurchase program in 2015bull Acquired approximately 174 million shares for total cost of $500
million
Acquired $17 Billion of Quanta Common Stock
Under Previous Programs Quanta Has Acquired Approximately 32 of Its Outstanding Stock
$2197$1951
$1573 $1573
0
25
50
75
100
125
150
175
200
225
$0000
$500000
$1000000
$1500000
$2000000
$2500000
$3000000
2014 2015 2016 2017E
Net Income Required to Generate $001 In EPS
Avg Dil Shs Out
Earnings Power Improvement
$ in
Tho
usan
ds
Shares in Millions
May 25 2017 ndash Announced New $300 Million Share Repurchase Authorizationbull Up to $300 million through June 30 2020
Opportunistic amp Disciplined Capital Allocation
Capital Deployment Preference (Amounts in millions)
bull Working Capitalbull Capital Expendituresbull Acquisitionsbull Investmentsbull Return of Capital
bull Generally in sync with preference however hellip
bull Financial strength provides the ability to be opportunistic
bull Flexible and strategic capital allocation is a competitive advantage
Capital Deployment Posture
Financial Strength Allows for Flexible and Strategic Capital Allocation ndash A Competitive Advantage
2013 ndash 2016 Sources amp Uses of Cash
Sources
Cash Flow fromOperations
DivestitureProceeds
BorrowingsInvestment Sales
$3099
$1667
$842
$369$221
Uses
StockRepurchase
CAPEX amp OtherNet
Acquisitions Net
Investments
$1700
$900
$728
$54$3382
54
27
127
50
27
21
2
Amounts reflect the retrospective application of a recent accounting pronouncement related to the classification of tax withholding payments for share-based compensation
Foundation For Growth amp Improved Profitability
Multi-Year Growth Opportunities
Innovative Industry Leading Solutions
Scale amp Scope
Financial Strength
Operational amp Safety Excellence
QuantaServicesIR
QuantaIR
Connect With Quanta Services Investor Relations
Corporate Office2800 Post Oak Blvd Suite 2600Houston TX 77056713-629-7600wwwquantaservicescom
Investor ContactKip Rupp CFAVice President ndash Investor Relations713-341-7260investorsquantaservicescom
Reconciliation of Adjusted Net Income from Continuing Operations Attributable to Common Stock
2013 2014 2015 2016 2017 2017Reconciliation of adjusted net income from continuing operations attributable to common stockNet income from continuing operations attributable to common stock (GAAP as reported) 372057$ 269224$ 120286$ 198725$ 247000$ 275300$ Adjustments
Asset impairment charges - - 58451 7964 - -Severance and restructuring charges - - - 6352 - -Acquisition and integration costs 8145 14754 7966 3053 9300 9300 Impact of income tax contingency releases (9935) (8099) - (20488) - -Impact of tax benefit from realization of previously unrecognized deferred tax asset - - (4228) - - -Impact of Alberta tax law change - - 4982 - - -Provision for long-term contract receivable - 102460 - - - -Arbitration expense - 38848 - - - -Impact of sale of equity ownership in Howard Energy (112744) - - - - -Income tax impact of adjustments 39836 (55935) (16186) (3982) (3400) (3400)
Adjusted net income from continuing operations attributable to common stock before certain non-cash adjustments 297359 361252 171271 191624 252900 281200
Non-cash stock based compensation 34381 37449 36939 41134 47000 47000 Amortization of intangible assets 25865 34257 34848 31685 30600 30600 Income tax impact of non-cash adjustments (22715) (26453) (25817) (26183) (28500) (28500)
Adjusted net income from continuing operations attributable to common stock 334890$ 406505$ 217241$ 238260$ 302000$ 330300$ Weighted average sharesWeighted average shares outstanding for diluted earnings per share 214978 219690 195120 157288 157300 157300 Weighted average shares outstanding for adjusted diluted earnings per share 214978 219690 195120 157288 157300 157300 Diluted earnings per share from continuing operations attributable to common stock and adjusted diluted earnings per share from continuing operations attributable to common stockDiluted earnings per share from continuing operations attributable to common stock 173$ 123$ 062$ 126$ 157$ 175$ Adjusted diluted earnings per share from continuing operations attributable to common stock 156$ 185$ 111$ 151$ 192$ 210$
Estimated Guidance Range
For the Years Ended December 31
(in thousands except per share information)(Unaudited)
Recast of Adjusted Diluted
Reconciliation of Electric Power and Oil amp Gas Infrastructure Services Segments Operating Income As Adjusted
Amounts in millions except percentagesOil amp Gas
Infrastructure12312014 12312015 12312016 12312014
Revenues 53027$ 49373$ 48505$ 24446$
Operating Income (as reported) 4630 3623 3957 1628
Addback Provisions for long term contract receivable 1025 - - - Arbitration expense - - - 388 Asset impairment charge - 66 57 -
Operating Income (as adjusted) 5655$ 3689$ 4014$ 2016$
Operating income margin (as reported) 87 73 82 67Operating income margin (as adjusted) 107 75 83 83
Electric Power
Sheet1
Reconciliation of Free Cash Flow
2013 2014 2015 2016Net Cash Provided by Operating Activities of Continuing Operations 370558 247742 618183 381176 Less Net Capital ExpendituresAdditions of Property and Equipment (221946) (247216) (209968) (212555) Proceeds from Sale of Property and Equipment 14789 14448 26178 21975 Net Capital Expenditures (207157) (232768) (183790) (190580)
Free Cash Flow 163401 14974 434393 190596
Free Cash Flow from Cont Ops
Forward Looking Statement DisclaimerThis presentation (and oral statements regarding the subject matter of this presentation) includes ldquoforward-looking statementsrdquo intended to qualify for the safe harbor from liability established by the Private Securities Litigation Reform Act of 1995 These statements reflect assumptions expectations projections intentions or beliefs about future events and use words such as anticipate estimate project forecast may will should could expect believe plan intend and other words of similar meaning You can identify these statements by the fact that they do not relate strictly to historical or current facts In particular these include but are not limited to statements relating to the following
bull Projected revenues net income earnings per share attributable to common stock backlog margins capital expenditures weighted average shares outstanding tax rates and other projections of operating or financial resultsbull Our business or financial outlook growth or opportunities in particular marketsbull The potential benefits from acquisitions and investmentsbull The expected financial and operational performance of acquired businessesbull Future capital allocation initiativesbull Our ability to deliver increased value and return capital to stockholders bull The strategic use of our balance sheetbull The expected value of contracts or intended contracts with customersbull The scope services term and results of any projects awarded or expected to be awarded for services to be provided by usbull The anticipated commencement and completion dates for any projects awardedbull The development of larger electric transmission and oil and natural gas pipeline projects and the level of oil natural gas and natural gas liquids prices and their impact on our business or the demand for our services bull The impact of existing or potential energy legislation bull Potential opportunities that may be indicated by bidding activity or discussions with customersbull The expected outcome of pending or threatened litigation bull Beliefs and assumptions about the collectability of receivablesbull The business plans or financial condition of our customersbull Our plans and strategies bull The current economic and regulatory conditions and trends in the industries we serve bull Possible recovery on pending or contemplated change orders or affirmative claims against customers or third parties and bull Other statements reflecting expectations intentions assumptions or beliefs about future events and other statements that do not relate strictly to historical or current facts
Although our management believes that the expectations reflected in such forward-looking statements are reasonable it can give no assurance that such expectations will prove to be correct These forward-looking statements are not guarantees of future performance and involve or rely on a number of risks uncertainties and assumptions that are difficult to predict or beyond our control These forward-looking statements reflect our beliefs and assumptions based on information available to our management at the time the statements are made We caution you that actual outcomes and results may differ materially from what is expressed implied or forecasted by our forward-looking statements and that any or all of our forward-looking statements may turn out to be wrong Forward-looking statements can be affected by inaccurate assumptions and by known or unknown risks and uncertainties including the following
bull Market conditionsbull The effects of industry economic financial or political conditions outside our control including weakness in capital marketsbull Quarterly variations in our operating resultsbull Trends and growth opportunities in relevant marketsbull The cost of borrowing availability of credit and cash fluctuations in the price and volume of our common stock debt covenant compliance interest rate fluctuations and other factors affecting our financing and investing activitiesbull Delays reductions in scope or cancellations of anticipated pending or existing projects including as a result of weather regulatory or permitting issues environmental processes project performance issues claimed force majeure events or our customers capital
constraintsbull The successful negotiation execution performance and completion of anticipated pending and existing contracts including the ability to obtain awards of projects on which we bid or are otherwise discussing with customersbull Our ability to retain key personnel and qualified employees
Forward Looking Statement Disclaimerbull Our ability to attract or the potential shortage of skilled labor bull Our dependence on fixed price contracts and the potential to incur losses with respect to the contractsbull Estimates relating to our use of percentage-of-completion accountingbull Adverse weatherbull Our ability to generate internal growthbull Competition in our business including our ability to effectively compete for new projects and market sharebull The effect of natural gas natural gas liquids and oil prices on our operations and growth opportunities and on
our customersrsquo capital programs and demand for our servicesbull The future development of natural resourcesbull The failure of existing or potential legislative actions to result in demand for our servicesbull Liabilities associated with multiemployer pension plans including underfunding of liabilities and termination
or withdrawal liabilitiesbull The possibility of further increases in the liability associated with our withdrawal from a multiemployer
pension planbull Unexpected costs or liabilities that may arise from pending or threatened litigation indemnity obligations or
other claims asserted against us including liabilities for claims that are self-insured or uninsuredbull The outcome of pending or threatened litigationbull Risks relating to the potential unavailability or cancellation of third party insurance the exclusion of coverage
for certain losses and potential increases in premiums for coverage deemed beneficial to usbull Cancellation provisions within our contracts and the risk that contracts expire and are not renewed or are
replaced on less favorable termsbull Loss of customers with whom we have long-standing or significant relationshipsbull The potential that participation in joint ventures or similar structures exposes us to liability andor harm to
our reputation for acts or omissions by our partnersbull Our inability or failure to comply with the terms of our contracts which may result in additional costs
unexcused delays warranty claims failure to meet performance guarantees damages or contract terminations
bull The inability or refusal of our customers to pay for services including the failure to collect outstanding receivables
bull The failure to recover on payment claims against project owners or third party contractors or to obtain adequate compensation for customer-requested change orders
bull The failure of our customers to comply with regulatory requirements applicable to their projects which may result in project delays and cancellations
bull Budgetary or other constraints that may reduce or eliminate tax incentives or government funding for projects which may result in project delays or cancellations
bull Estimates and assumptions in determining our financial results and backlogbull Our ability to realize our backlogbull Risks associated with operating in international markets including instability of foreign governments
currency fluctuations tax and investment strategies as well as compliance with foreign legal systems and cultural practices the US Foreign Corrupt Practices Act and other applicable anti-bribery and anti-corruption laws
bull Our ability to successfully identify complete integrate and realize synergies from acquisitionsbull The potential adverse impact resulting from uncertainty surrounding investments and acquisitions including
the ability to retain key personnel from the acquired businesses and the potential increase in risks already existing in our operations
bull The adverse impact of impairments of goodwill receivables property equipment and other intangible assets or investments
bull Our growth outpacing our decentralized management and infrastructurebull Requirements relating to governmental regulation and changes theretobull Inability to enforce our intellectual property rights or the obsolescence of such rightsbull Risks related to the implementation of an information technology solutionbull The impact of our unionized workforce on our operations including labor stoppages or interruptions due to
strikes or lockoutsbull Potential liabilities and other adverse effects arising from occupational health and safety mattersbull Our dependence on suppliers subcontractors equipment manufacturers and other third party contractorsbull Fluctuations of prices of certain materials used in our businessbull The ability to access sufficient funding to finance desired growth and operationsbull Our ability to obtain performance bondsbull Potential exposure to environmental liabilitiesbull Our ability to continue to meet certain requirements applicable to us and our subsidiariesbull Rapid technological and other structural changes that could reduce the demand for our servicesbull New or changed tax laws treaties or regulationsbull Increased healthcare costs arising from healthcare reform legislation or other governmental actionbull Regulatory changes that result in increased labor costsbull Significant fluctuations in foreign currency exchange rates andbull The other risks and uncertainties as are described elsewhere herein and in our Annual Report on Form 10-K for
the year ended December 31 2016 filed with the SEC and as may be detailed from time to time in our other public filings with the SEC
All of our forward-looking statements whether written or oral are expressly qualified by these cautionary statements and any other cautionary statements that may accompany such forward-looking statements or that are otherwise included in this presentation Should one or more of these risks materialize or should underlying assumptions prove incorrect actual results may vary materially from those expressed or implied in any forward-looking statements Investors are cautioned not to place undue reliance on these forward-looking statements which are current only as of this date We do not undertake and expressly disclaim any obligation to update or revise any forward-looking statements to reflect events or circumstances after the date of this presentation or otherwise and we expressly disclaim any written or oral statements made by any third party regarding the subject matter of this presentation
Slide Number 1
Forward Looking Statement Disclaimer
Key Takeaways
Leading Integrated Infrastructure Solutions Provider
Overview ndash Strategically Focused Operationally Diverse
Overview - Diverse and High Quality Customer Base
Leading Integrated Infrastructure Solutions Provider
Strategic Imperatives
Strategic Imperatives Deliver Profitable Growth
Strategic Acquisitions Criteria and Rationale
Differentiated Competitive Position ndash In the Sweet Spot
Differentiated Competitive Position ndash In the Sweet Spot
Electric Power Infrastructure Services Segment Overview
Power Grid Investment Drivers - Transmission
Power Grid Investment Drivers - Transmission
Power Grid Investment Drivers - Distribution
Oil amp Gas Infrastructure Services Segment Overview
Reconciliation of Adjusted Net Income from Continuing Operations Attributable to Common Stock
Reconciliation of Electric Power and Oil amp Gas Infrastructure Services Segments Operating Income As Adjusted
Reconciliation of Free Cash Flow
Forward Looking Statement Disclaimer
Forward Looking Statement Disclaimer
Free Cash Flow From Continuing Operations
Source
2013
2014
2015
2016
(Support Cash Flow Statement)
Net Cash Provided by Operating Activities of Continuing Operations
370558
247742
618183
381176
(Support Cash Flow Statement)
Less Net Capital Expenditures
(Support Cash Flow Statement)
Additions of Property and Equipment
(221946)
(247216)
(209968)
(212555)
(Support Cash Flow Statement)
Proceeds from Sale of Property and Equipment
14789
14448
26178
21975
(Recalculation)
Net Capital Expenditures
(207157)
(232768)
(183790)
(190580)
(Recalculation)
Free Cash Flow
163401
14974
434393
190596
Adjusted Operating Income Margin
$ in millions
Support for slide 23
Amounts in millions except percentages
Electric Power
Oil amp Gas Infrastructure
123114
123115
123116
123114
Revenues
$ 53027
$ 49373
$ 48505
$ 24446
Operating Income (as reported)
4630
3623
3957
1628
Addback
Provisions for long term contract receivable
1025
-0
-0
-0
Arbitration expense
-0
-0
-0
388
Asset impairment charge
-0
66
57
-0
Operating Income (as adjusted)
$ 5655
$ 3689
$ 4014
$ 2016
Operating income margin (as reported)
87
73
82
67
Operating income margin (as adjusted)
107
75
83
83
Quanta Services Inc and Subsidiaries
Reconciliation of Non-GAAP Financial Measures
Adjusted Diluted Earnings Per Share from Continuing Operations
For the Years Ended December 31
(in thousands except per share information)
(Unaudited)
Estimated Guidance Range
2013
2014
2015
2016
2017
2017
Reconciliation of adjusted net income from continuing operations attributable to common stock
Net income from continuing operations attributable to common stock (GAAP as reported)
$ 372057
$ 269224
$ 120286
$ 198725
$ 247000
$ 275300
Adjustments
Asset impairment charges
-
-
58451
7964
-
-
Severance and restructuring charges
-
-
-
6352
-
-
Acquisition and integration costs
8145
14754
7966
3053
9300
9300
Impact of income tax contingency releases
(9935)
(8099)
-
(20488)
-
-
Impact of tax benefit from realization of previously unrecognized deferred tax asset
-
-
(4228)
-
-
-
Impact of Alberta tax law change
-
-
4982
-
-
-
Provision for long-term contract receivable
-
102460
-
-
-
-
Arbitration expense
-
38848
-
-
-
-
Impact of sale of equity ownership in Howard Energy
(112744)
-
-
-
-
-
Income tax impact of adjustments
39836
(55935)
(16186)
(3982)
(3400)
(3400)
Adjusted net income from continuing operations attributable to common stock before certain non-cash adjustments
297359
361252
171271
191624
252900
281200
Non-cash stock based compensation
34381
37449
36939
41134
47000
47000
Amortization of intangible assets
25865
34257
34848
31685
30600
30600
Income tax impact of non-cash adjustments
(22715)
(26453)
(25817)
(26183)
(28500)
(28500)
Adjusted net income from continuing operations attributable to common stock
$ 334890
$ 406505
$ 217241
$ 238260
$ 302000
$ 330300
Weighted average shares
Weighted average shares outstanding for diluted earnings per share
214978
219690
195120
157288
157300
157300
Weighted average shares outstanding for adjusted diluted earnings per share
214978
219690
195120
157288
157300
157300
Diluted earnings per share from continuing operations attributable to common stock and adjusted diluted earnings per share from continuing operations attributable to common stock
Diluted earnings per share from continuing operations attributable to common stock
$ 173
$ 123
$ 062
$ 126
$ 157
$ 175
Adjusted diluted earnings per share from continuing operations attributable to common stock
$ 156
$ 185
$ 111
$ 151
$ 192
$ 210
2017 Forecast
2008
2009
2010
2011
2012
2013
2014
2015
2016
2017
2018
2019
2020
2021
2022
US IOU
17599783395
17375430450
17116821481
17473265629
19719353886
18593206538
21049378470
23210018195
24651006483
28003750000
29530700000
30481300000
30509750000
31231850000
31138000000
Co-ops
3679033739
3613552751
2806195753
3044502916
2639012201
3360515403
3050612075
2834000972
3277074511
3309845256
3342943708
3376373145
3410136877
3444238245
3478680628
MuniGovt Owned
2525145025
2693819865
2624788344
2608815562
2682098477
2938725525
3183015391
3330273309
3454862656
3664198000
3769427295
3778921940
3483677493
3817389338
3817389338
Canadian
3324942988
3202431553
3726264949
4213182949
4228837570
4323705834
4106960884
3465854177
3159852215
3254697600
3381315300
3453964800
3380277450
3406223700
3406223700
Total NA 2017 Market
27128905147
26885234619
26274070528
27339767056
29269302134
29216153300
31389966819
32840146653
34542795864
38232490856
40024386303
41090559885
40783841819
41899701283
41840293665
From August 2015 Report
North American Electric Distribution Spending
2008
2009
2010
2011
2012
2013
2014
2015
2016
2017
2018
2019
2020
US IOUs
$175
$173
$171
$174
$197
$186
$210
$226
$244
$244
$247
$249
$250
US Co-ops
$27
$29
$27
$29
$35
$41
$34
$39
$40
$40
$41
$42
$42
US Muni
$25
$26
$26
$28
$28
$29
$29
$30
$31
$31
$32
$32
$33
Total US
$226
$227
$224
$231
$260
$256
$273
$295
$314
$316
$320
$323
$325
Canada
$33
$33
$34
$39
$38
$39
$39
$38
$41
$41
$42
$43
$43
Total
$260
$261
$259
$269
$298
$294
$312
$333
$354
$357
$362
$365
$368
15 vs 16
$00
$01
$02
$04
($01)
($04)
$06
$04
$08
$21
$19
$28
$26
From August 2016 Report
North American Electric Distribution Spending
2008
2009
2010
2011
2012
2013
2014
2015
2016
2017
2018
2019
2020
US IOUs
$176
$174
$171
$175
$197
$186
$210
$232
$258
$270
$271
$281
$281
US Co-ops
$27
$29
$27
$29
$31
$33
$38
$39
$40
$41
$41
$42
$43
US Muni
$25
$26
$26
$28
$28
$29
$29
$30
$31
$31
$32
$33
$33
Total US
$228
$229
$224
$232
$256
$248
$277
$301
$329
$342
$344
$356
$357
Canada
$32
$32
$37
$41
$41
$42
$41
$36
$33
$36
$37
$37
$37
Total
$260
$261
$261
$273
$297
$290
$318
$337
$362
$378
$381
$393
$394
From September 2017 Report
North American Electric Distribution Spending
2008
2009
2010
2011
2012
2013
2014
2015
2016
2017
2018
2019
2020
2021
2022
US IOUs
$176
$174
$171
$175
$197
$186
$210
$232
$247
$280
$295
$305
$305
$312
$311
US Co-ops
$37
$36
$28
$30
$26
$34
$31
$28
$33
$33
$33
$34
$34
$34
$35
US Muni
$25
$27
$26
$26
$27
$29
$32
$33
$35
$37
$38
$38
$35
$38
$38
Total US
$238
$237
$225
$231
$250
$249
$273
$294
$314
$350
$366
$376
$374
$385
$384
Canada
$33
$32
$37
$42
$42
$43
$41
$35
$32
$33
$34
$35
$34
$34
$34
Total
$271
$269
$263
$273
$293
$292
$314
$328
$345
$382
$400
$411
$408
$419
$418
2015 vs 2016 vs 2017
2015 Est
2016 Est
2017 Est
Avg 08-11
$262
$264
$269
Avg 12-15
$309
$311
$307
2016
$354
$362
$345
2017
$357
$378
$382
2018
$362
$381
$400
2019
$365
$393
$411
2020
$368
$394
$408
2021
$419
2022
$418
2017
Differentiated Competitive Position ndash In the Sweet Spot
bull Quanta is the largest infrastructure specialty contractor in North America
bull Unmatched scope providing broader solutions to customersbull Unmatched scale as the largest employer of skilled workforce in
the industry ndash more than 35000 employeesbull Track record of safe executionbull Projects are getting larger and more complex customers
increasingly seeking cost certainty and performancebull Quanta has consistently been working on numerous large
projects simultaneously for the past + six yearsbull Significant revenues from strategic relationships recurring work
and an increasing amount of negotiated work
Quanta vs Specialty Contractors Quanta vs Traditional EampCs
bull Today our customers believe skilled construction labor is a finite resource and critical to overall project success where engineering and procurement are more commoditized
bull Quanta has the largest skilled workforce in the industry ndash more than 35000 employees
bull Quanta self-performs its projects ndash controls quality and executionbull EampCs typically provide project management oversight and have
limited self-perform construction capabilitiesbull Quanta derives significant revenues from strategic relationships
recurring work and an increasing amount of negotiated workbull Price is often the primary driver of who wins EampC projects
Est Large Project Capability
Bubble Size = Avg Market Cap
0
20
40
60
80
100
Est
Self
Perfo
rm C
apab
ility
Bubble Size = Avg Market Cap
LargerSmaller
Differentiated Competitive Position ndash In the Sweet Spotbull Quanta is uniquely positioned to meet
customer needs versus both specialty contractors and traditional engineering and construction companies
bull Customers understand that skilled labor is critical to project success
bull Projects are getting larger and more complex and customers are increasingly seeking comprehensive solutions
bull Demand for specialty construction resources is high and increasing but supply is limited
bull Quanta has the largest infrastructure specialty contractor workforce in North America +35000 employees globally
bull Quanta has strategically invested in engineering and program management to provide true complete engineering procurement and construction (EPC) solutions
0
20
40
60
80
100
Est
Self
Perf
orm
Cap
abili
ty
Est Large Project Capability
Bubble Size = Avg Market Cap
LargerSmaller
Electric Power Infrastructure Services Segment Overview
$4542$5303 $4937 $4850
115 10775 83
2013 2014 2015 2016Revenue Op Margin
(2)
(1) Operating margin excludes a $1025 million charge to cost of services for long-term contract receivable in 2014 Refer to appendix for non-GAAP reconciliation(2) Excludes a $66 million property and equipment charge in 2015 and a $57 million asset impairment charge in 2016 Includes the impact of $661 million in 2015 and $548 million in 2016 of project losses Refer to appendix for non-GAAP reconciliation
Differentiatorsbull Largest TampD solutions provider in North
Americabull Reputation and Track Recordbull Unmatched Solutions Scope and Scalebull Safety Recordbull Manpower and Equipment Resourcesbull Lazy Q Training Facilitybull Energized Servicesbull EPC Capabilities Across All Offeringsbull Infrastructure Capital Solutions
Market Drivers
Power Grid Investment Drivers - Transmission
bull An aging grid that requires repair upgrade and maintenancebull Favorable transmission regulation Energy Policy Act of lsquo05
NERC Reliability Standards possibly FERC Order 1000 over the long-term
bull More stringent reliability standards will require repairing lines and adding redundant capacity
bull Coal and nuclear generation retirements and switching to natural gas and renewable generation strains the grid
bull Existing and new renewable generation needs interconnection to the grid
bull Opportunity for industrial driven load growthbull Regional grid infrastructure is too congested to get lowest-cost
power to consumersbull Sub-transmission interconnectionbull Canada has same drivers as US as well as the need to serve
mining interests and hydro generation for export to US load centers
bull Challenged economic conditions in Canada
bull Environmental and other regulatory scrutiny right of way acquisition permitting etc
bull Tepid load growthbull Economybull Energy efficiency initiatives
Oil amp Gas Infrastructure Services Segment Overview
$1870
$2445 $2635 $2801
74 83
54 53
2013 2014 2015 2016Revenue Op Margin
(1) Excludes a $388 million expense associated with an arbitration decision Refer to appendix for non-GAAP reconciliation(2) Includes $73 million of project losses
bull Production of shale natural gas oil and natural gas liquids has grown dramatically and is expected to remain at high levels forthe foreseeable future
bull Much of these resources are in areas that have not been traditional hydrocarbon fuel sources and do not have adequate infrastructure in place to gather store process and transport product
bull Canadian oil production lacks adequate takeaway pipeline infrastructurebull Economics of pipeline transportation is increasingly attractive versus rail in a low oil price environmentbull Pipeline construction capacity is more limited in Canada versus the US and construction capacity constraints could be significant
bull It will take many years and significant energy infrastructure investment to harvest these resources
Shale Gas amp Tight Oil Plays Drive US Natural Gas Production
2000-2040 (trillion cubic feet)
Source EIA Annual Energy Outlook 2017
Tight Oil Drives US Oil Production2000-2040 (millions of barrels per day)
Source EIA Annual Energy Outlook 2015
Canadian Oil Sands amp Conventional Oil Production(Millions of barrels per day)
Source Canadian Assoc of Petroleum Producers
Oil amp Gas Infrastructure Investment Driversbull Need for pipeline and related infrastructure driven by the
significant increase in North American unconventional natural gas and oil production ndash not commodity prices
bull Takeaway pipelines have not been built fast enough to keep pace with hydrocarbon production ndash significant pipeline development needed
bull Large pipeline construction industry capacity is currently tight but could get significantly strained over the next several years
North American Pipeline ForecastProbability Weighted
Quanta Is the Largest Pipeline Construction Company in North America
bull Quanta is the largest pipeline construction company in North America
bull This positions Quanta to provide significant large diameter pipe construction capacity to the industry while remaining active in select shales
bull We are ready to assist our customers in meeting their development goals in what could be a resource challenged environment
North America Major Planned Mainline Project Capex
Source KeyBanc Capital Markets
$0
$5
$10
$15
$20
2016E 2017E 2018E 2019E
In B
illio
ns
In B
illio
ns
Oil amp Gas Infrastructure Investment DriversNatural Gas Distribution amp Pipeline Integritybull US pipeline infrastructure is getting older
bull PHMSA estimates more than 470K miles (37) of US gas distribution mains and 171K miles (57) of gas transmission pipelines were installed before 1970 or in an undocumented year
bull Local Distribution Companies (LDCs) continue increased spend on pipe inspection and replacement
bull Replacement programs ramped up after San Bruno incident in 2010 Utilities are spending $22B a year on transmission and distribution systems(2)
bull Regulations push for expanding inspection programs and accelerating replacement work
bull PHMSA will require more inspection and corrosion control activity which will require additional excavations and integrity work DOErsquos Quadrennial Energy Review emphasizes the need to accelerate pipe replacement to curb emissions from leak-prone pipe
bull Long timelines for some replacement plans will push spend acceleration
bull Current projections are over 20 years for many large utilities a few more than 50 years(3) Replacement activities will have to be accelerated to address risk
bull State regulators establishing cost recovery mechanisms to accelerate replacement programs
Significant Inventory Remains for Replacement
States with Gas Utility Cost Recovery Mechanisms(4)
(1) PHMSA pipe inventory reports 2011-2015(2) AGA 2016 Playbook (3) Department of Energy Quadrennial Energy Review ndash Energy Transmission Storage and Distribution Infrastructure April 2015 (4) American Gas Association Playbook 2017
Stronghold Acquisition Overview
bull Provides catalyst handling turnaround and other downstream services tank storage and other midstream services
bull Specializes in high pressure and high reactor infrastructure services
bull Industry leading safety record employee and training focus with entrepreneurial culture
bull Led by a strong multigenerational highly regarded management team with decades of industry experience
bull Preferred employer with low turnover and high-quality workforce ndash averaging 2800 employees
bull Excellent reputation and strong relationships with a high-quality and diverse client base
bull Strong historical organic growth
21
Stronghold is a leading specialized services company providing high pressure and critical path solutions to the downstream and midstream energy markets
Company Profile
2016 Revenue =Approx $500 Million
Downstream Services
85
Midstream Services
15
Strategic Rationalebull Facilitates capture of a greater portion of energy
industry spend and offers cross-selling opportunities
bull Specialized Industrial Services market is a natural service line expansion for Quanta to meet our customersrsquo needs
bull Complements existing downstream high-voltage power services
bull Stronghold gives Quanta a significant presence in downstream services and a strong platform for growth
bull Strong financial profilebull Attractive historical growth and accretive margin
profile low capex requirements solid cash flow and accretive to earnings
bull Enhances recurring base business revenue
bull Shale oil natural gas and natural gas liquids (NGLs) production driving refinery petrochemical and storage infrastructure needs
Telecom Infrastructure Services Overview
To be an industry leading and true EPC contractor providing comprehensive communications infrastructure solutions to customers in the United States Canada and select markets in Latin America
Goal
Diverse Existing amp Target Customer BaseMarkets Served
Telecom Infrastructure Investment Drivers
bull Telco gigabit fiber to the home deployment programs
bull Cable MSOs deploying DOCSIS 31
bull Upcoming - 5G wireless and fiber backhaul
bull Ongoing 4G wireless network optimization
bull Connect America Fund - rural fiber build-out
bull Federal government funded FirstNet - national wireless network for first responders
United States
bull Backbone and last mile fiber (behind relative to the US)
bull Telco gigabit fiber to the home deployment programs
bull Cable MSOs deploying DOCSIS 31
bull Upcoming - 5G wireless and fiber backhaul
bull Ongoing 4G wireless network optimization
bull Federal government infrastructure initiatives generally positive
Canada
bull Significantly behind North America in both wireline and wireless connectivity
bull However demand for connectivity media and data intensive services is strong
bull Fiber and backhaul networks significantly behind North America
bull Primarily 3G wireless some 4G wireless (country dependent)
bull Various governments have infrastructure expansion initiatives
bull Concession and P3 opportunities
bull Connectivity for quality of life social and commercial reasons
Latin America
Telecom Infrastructure Services Overview
Fiber Builds
Wireless Deployment
Make Ready Services
Civil Construction
Engineering Design
Material Management
EPC
Wireless Wireline
United StatesWireless Wireline
CanadaWireless Wireline
Latin America
Comprehensive Infrastructure Solutions Offered On A Turnkey Discrete Service or EPC Basis
bull Proven greenfield expansion model in Latin America ndash US should be less difficult
Leverage existing US field operations people equipment and property
bull Select strategic acquisitions may play a role but NOT a roll-up approach
Provide wireline and wireless services - heavier on wireline
bull Increasing convergence of wireless and wireline due fiber requirements of both
Project centric nimble approach versus MSA focused EPC services to differentiate
bull Less capital intensive with better margin opportunity
GOAL
STRATEGY
STRATEGY
STRATEGY
STRATEGY
To be the leading communications infrastructure contractor in the markets we serve
Engineer Procure Construct (EPC) Is A Differentiator
bull Quanta has a long history in the EPC business and is increasingly performing select projects on an EPC basisbull Customersrsquo capital programs are at historic levels and growing Projects are getting larger and more complexbull Evolution of regulatory demands competition and alternative pricing models
bull Many customers have limited internal resources and expertise to manage these dynamics and are turning to Quanta for solutions
bull Project cost certainty becoming increasingly important
bull We are enhancing initiatives to ensure we have a scalable comprehensive enterprise-wide capability for EPC projects that is consistently executed across all segments and geographies
bull EPC projects are a meaningful contributor to our current backlog and provide significant opportunity for future growth
Integrated Services
Construction amp Installation
Assessment Planning amp
Development
Engineering amp Design
Procurement Operation and Maintenance
What is Infrastructure Solutions
Infrastructure Solutions represent strategic partnerships with customers and capital partners
bull Public private partnerships (P3)bull Concessionsbull Build Own Operate or Transfer
(BOOT)bull Build to Suit (BTS) arrangements
These solutions are a growth engine for each of our segments and geographies and a core component of our strategic
imperative to deliver differentiated solutions to our customers
Encompasses
Infrastructure Solutions Drivers
A Combination of Drivers are Occurring that Create Demand and Opportunity for Our Infrastructure Solutions
bull Provide transparency to a project shape design constructability risk allocation and overall project structure
bull Manages risk that yields more informed EPC project decisions
bull Improves success rate of both winning the engagement and successful execution
bull Where appropriate we invest alongside our partners
bull Significant capital needs to fund the substantial infrastructure needs
bull Utilization of concessions public private partnerships (P3) and private infrastructure partnerships to fund and attract high-quality entities for complex projects
bull Changes in regulation (such as FERC Order 1000)
bull New entrants together with high interest and availability of investor infrastructure investment capital
Quanta Is A True Partner
bull Quanta increasingly sought as a partner for our execution capabilities the need for price certainty and our financial strength
bull Projects are larger more complex greater scope Typically under lump-sum turnkey arrangements which create greater opportunities and risks for Quanta
bull Successful Infrastructure Solutions and project execution track record
Quanta Sought for Executionamp Track Record
Market Structure amp Projects Getting More Complex
29
Fully Integrated Solutions Based Provider
Infrastructure Solutions Provides A Solutions Based Tool for Quanta to Partner with Customers Enhance Relationships and Create New Customer and Project Opportunities
EPC
Capitalbull Determine capital structurebull Source capitalbull Quanta minority direct
investmentbull First Infrastructure Capital
Advisors
PartnershipsPartner withbull Customersbull Equity Capital
(4) Includes $802 million of expense net of tax or $036 per diluted share from an arbitration decision charge to provision for long-term contract receivable and the benefit associated with release of certain income tax contingencies
2013 2014 2015 2016 2017 Est
($ in millions)Revenue
$140$122
$062
$126
$163
2013 2014 2015 2016 2017Est
(4)
(5)
(6)
Electric Power Oil amp Gas Infrastructure
GAAP Diluted EPS (1)
$156
$185
$111
$151
$195
2013 2014 2015 2016 2017Est
Adjusted Diluted EPS (1)
$6412
(2) Represents the midpoint of guidance range
(2)
$7747
(2) (2) $173
(3) Includes $033 gain from sale of Howard Energy investment
$9300(3)
(1) From continuing operations
$7572
(5) Includes $734 million of project losses Also includes $454 million of expense net of tax or $023 per diluted share from net asset impairment charges
$7651
(6) Includes $548 million of project losses and $71 million of expense net of tax or $005 per diluted share from net asset impairment charges Also includes tax benefits of $205 million or $013 per share associated with the expiration of various federal and state tax statute of limitations periods
Recent Financial Performance amp 2017 ExpectationsFor the Years Ended December 31
($ in millions)Electric Power
$4542
$5303$4937 $4850
115107
7583
2013 2014 2015 2016 2017 Est
Revenue Op Margin
(2)
(1) Operating margin excludes a $1025 million charge to cost of services for long-term contract receivable in 2014 Refer to appendix for non-GAAP reconciliation(2) Excludes a $66 million property and equipment impairment charge Includes the impact of $661 million of project losses Refer to appendix for non-GAAP reconciliation(3) Excludes a $57 million asset impairment charge Includes the impact of $548 million of project losses Refer to appendix for non-GAAP reconciliation
(1) (1)
(2)(3)
f Est revenue growth approaching 15 vs 2016
Est operating incomemargins of 90 to 95
Guidance Commentary($ in millions)
Oil amp Gas Infrastructure
(4) Excludes a $388 million expense associated with an arbitration decision Refer to appendix for non-GAAP reconciliation(5) Includes $73 million of project losses
Liquidity includes cash and cash equivalents and availability under our revolving credit facility as described in our Form 10k
Historical Cash Flow Generation
$163
$15
$434
$191
2013 2014 2015 2016
Cash Flow from Continuing Operations
($ in millions)
Free Cash Flow from Continuing Operations
$371
$248
$618
$381
2013 2014 2015 2016
Net cash provided by operating activities from continuing operations plus proceeds from sale of property and equipment less additions of property and equipment
For the Years Ending December 31($ in millions)
For the Years Ending December 31
Committed to Generating Shareholder Value
Executed on $125 Billion Share Repurchase Authorizationbull Aug 2015 ndash Announced a new $125 billion share repurchase
authorization through Feb 28 2017bull Completed a $750 million accelerated stock repurchase (ASR)
arrangement in April 2016bull Acquired 351 million shares at $2136 per share
bull $500 million for opportunistic repurchases through Feb 28 2017bull $450 million 192 million shares retired
Completed $500 Million Share Repurchase Authorizationbull Completed previous $500 million share repurchase program in 2015bull Acquired approximately 174 million shares for total cost of $500
million
Acquired $17 Billion of Quanta Common Stock
Under Previous Programs Quanta Has Acquired Approximately 32 of Its Outstanding Stock
$2197$1951
$1573 $1573
0
25
50
75
100
125
150
175
200
225
$0000
$500000
$1000000
$1500000
$2000000
$2500000
$3000000
2014 2015 2016 2017E
Net Income Required to Generate $001 In EPS
Avg Dil Shs Out
Earnings Power Improvement
$ in
Tho
usan
ds
Shares in Millions
May 25 2017 ndash Announced New $300 Million Share Repurchase Authorizationbull Up to $300 million through June 30 2020
Opportunistic amp Disciplined Capital Allocation
Capital Deployment Preference (Amounts in millions)
bull Working Capitalbull Capital Expendituresbull Acquisitionsbull Investmentsbull Return of Capital
bull Generally in sync with preference however hellip
bull Financial strength provides the ability to be opportunistic
bull Flexible and strategic capital allocation is a competitive advantage
Capital Deployment Posture
Financial Strength Allows for Flexible and Strategic Capital Allocation ndash A Competitive Advantage
2013 ndash 2016 Sources amp Uses of Cash
Sources
Cash Flow fromOperations
DivestitureProceeds
BorrowingsInvestment Sales
$3099
$1667
$842
$369$221
Uses
StockRepurchase
CAPEX amp OtherNet
Acquisitions Net
Investments
$1700
$900
$728
$54$3382
54
27
127
50
27
21
2
Amounts reflect the retrospective application of a recent accounting pronouncement related to the classification of tax withholding payments for share-based compensation
Foundation For Growth amp Improved Profitability
Multi-Year Growth Opportunities
Innovative Industry Leading Solutions
Scale amp Scope
Financial Strength
Operational amp Safety Excellence
QuantaServicesIR
QuantaIR
Connect With Quanta Services Investor Relations
Corporate Office2800 Post Oak Blvd Suite 2600Houston TX 77056713-629-7600wwwquantaservicescom
Investor ContactKip Rupp CFAVice President ndash Investor Relations713-341-7260investorsquantaservicescom
Reconciliation of Adjusted Net Income from Continuing Operations Attributable to Common Stock
2013 2014 2015 2016 2017 2017Reconciliation of adjusted net income from continuing operations attributable to common stockNet income from continuing operations attributable to common stock (GAAP as reported) 372057$ 269224$ 120286$ 198725$ 247000$ 275300$ Adjustments
Asset impairment charges - - 58451 7964 - -Severance and restructuring charges - - - 6352 - -Acquisition and integration costs 8145 14754 7966 3053 9300 9300 Impact of income tax contingency releases (9935) (8099) - (20488) - -Impact of tax benefit from realization of previously unrecognized deferred tax asset - - (4228) - - -Impact of Alberta tax law change - - 4982 - - -Provision for long-term contract receivable - 102460 - - - -Arbitration expense - 38848 - - - -Impact of sale of equity ownership in Howard Energy (112744) - - - - -Income tax impact of adjustments 39836 (55935) (16186) (3982) (3400) (3400)
Adjusted net income from continuing operations attributable to common stock before certain non-cash adjustments 297359 361252 171271 191624 252900 281200
Non-cash stock based compensation 34381 37449 36939 41134 47000 47000 Amortization of intangible assets 25865 34257 34848 31685 30600 30600 Income tax impact of non-cash adjustments (22715) (26453) (25817) (26183) (28500) (28500)
Adjusted net income from continuing operations attributable to common stock 334890$ 406505$ 217241$ 238260$ 302000$ 330300$ Weighted average sharesWeighted average shares outstanding for diluted earnings per share 214978 219690 195120 157288 157300 157300 Weighted average shares outstanding for adjusted diluted earnings per share 214978 219690 195120 157288 157300 157300 Diluted earnings per share from continuing operations attributable to common stock and adjusted diluted earnings per share from continuing operations attributable to common stockDiluted earnings per share from continuing operations attributable to common stock 173$ 123$ 062$ 126$ 157$ 175$ Adjusted diluted earnings per share from continuing operations attributable to common stock 156$ 185$ 111$ 151$ 192$ 210$
Estimated Guidance Range
For the Years Ended December 31
(in thousands except per share information)(Unaudited)
Recast of Adjusted Diluted
Reconciliation of Electric Power and Oil amp Gas Infrastructure Services Segments Operating Income As Adjusted
Amounts in millions except percentagesOil amp Gas
Infrastructure12312014 12312015 12312016 12312014
Revenues 53027$ 49373$ 48505$ 24446$
Operating Income (as reported) 4630 3623 3957 1628
Addback Provisions for long term contract receivable 1025 - - - Arbitration expense - - - 388 Asset impairment charge - 66 57 -
Operating Income (as adjusted) 5655$ 3689$ 4014$ 2016$
Operating income margin (as reported) 87 73 82 67Operating income margin (as adjusted) 107 75 83 83
Electric Power
Sheet1
Reconciliation of Free Cash Flow
2013 2014 2015 2016Net Cash Provided by Operating Activities of Continuing Operations 370558 247742 618183 381176 Less Net Capital ExpendituresAdditions of Property and Equipment (221946) (247216) (209968) (212555) Proceeds from Sale of Property and Equipment 14789 14448 26178 21975 Net Capital Expenditures (207157) (232768) (183790) (190580)
Free Cash Flow 163401 14974 434393 190596
Free Cash Flow from Cont Ops
Forward Looking Statement DisclaimerThis presentation (and oral statements regarding the subject matter of this presentation) includes ldquoforward-looking statementsrdquo intended to qualify for the safe harbor from liability established by the Private Securities Litigation Reform Act of 1995 These statements reflect assumptions expectations projections intentions or beliefs about future events and use words such as anticipate estimate project forecast may will should could expect believe plan intend and other words of similar meaning You can identify these statements by the fact that they do not relate strictly to historical or current facts In particular these include but are not limited to statements relating to the following
bull Projected revenues net income earnings per share attributable to common stock backlog margins capital expenditures weighted average shares outstanding tax rates and other projections of operating or financial resultsbull Our business or financial outlook growth or opportunities in particular marketsbull The potential benefits from acquisitions and investmentsbull The expected financial and operational performance of acquired businessesbull Future capital allocation initiativesbull Our ability to deliver increased value and return capital to stockholders bull The strategic use of our balance sheetbull The expected value of contracts or intended contracts with customersbull The scope services term and results of any projects awarded or expected to be awarded for services to be provided by usbull The anticipated commencement and completion dates for any projects awardedbull The development of larger electric transmission and oil and natural gas pipeline projects and the level of oil natural gas and natural gas liquids prices and their impact on our business or the demand for our services bull The impact of existing or potential energy legislation bull Potential opportunities that may be indicated by bidding activity or discussions with customersbull The expected outcome of pending or threatened litigation bull Beliefs and assumptions about the collectability of receivablesbull The business plans or financial condition of our customersbull Our plans and strategies bull The current economic and regulatory conditions and trends in the industries we serve bull Possible recovery on pending or contemplated change orders or affirmative claims against customers or third parties and bull Other statements reflecting expectations intentions assumptions or beliefs about future events and other statements that do not relate strictly to historical or current facts
Although our management believes that the expectations reflected in such forward-looking statements are reasonable it can give no assurance that such expectations will prove to be correct These forward-looking statements are not guarantees of future performance and involve or rely on a number of risks uncertainties and assumptions that are difficult to predict or beyond our control These forward-looking statements reflect our beliefs and assumptions based on information available to our management at the time the statements are made We caution you that actual outcomes and results may differ materially from what is expressed implied or forecasted by our forward-looking statements and that any or all of our forward-looking statements may turn out to be wrong Forward-looking statements can be affected by inaccurate assumptions and by known or unknown risks and uncertainties including the following
bull Market conditionsbull The effects of industry economic financial or political conditions outside our control including weakness in capital marketsbull Quarterly variations in our operating resultsbull Trends and growth opportunities in relevant marketsbull The cost of borrowing availability of credit and cash fluctuations in the price and volume of our common stock debt covenant compliance interest rate fluctuations and other factors affecting our financing and investing activitiesbull Delays reductions in scope or cancellations of anticipated pending or existing projects including as a result of weather regulatory or permitting issues environmental processes project performance issues claimed force majeure events or our customers capital
constraintsbull The successful negotiation execution performance and completion of anticipated pending and existing contracts including the ability to obtain awards of projects on which we bid or are otherwise discussing with customersbull Our ability to retain key personnel and qualified employees
Forward Looking Statement Disclaimerbull Our ability to attract or the potential shortage of skilled labor bull Our dependence on fixed price contracts and the potential to incur losses with respect to the contractsbull Estimates relating to our use of percentage-of-completion accountingbull Adverse weatherbull Our ability to generate internal growthbull Competition in our business including our ability to effectively compete for new projects and market sharebull The effect of natural gas natural gas liquids and oil prices on our operations and growth opportunities and on
our customersrsquo capital programs and demand for our servicesbull The future development of natural resourcesbull The failure of existing or potential legislative actions to result in demand for our servicesbull Liabilities associated with multiemployer pension plans including underfunding of liabilities and termination
or withdrawal liabilitiesbull The possibility of further increases in the liability associated with our withdrawal from a multiemployer
pension planbull Unexpected costs or liabilities that may arise from pending or threatened litigation indemnity obligations or
other claims asserted against us including liabilities for claims that are self-insured or uninsuredbull The outcome of pending or threatened litigationbull Risks relating to the potential unavailability or cancellation of third party insurance the exclusion of coverage
for certain losses and potential increases in premiums for coverage deemed beneficial to usbull Cancellation provisions within our contracts and the risk that contracts expire and are not renewed or are
replaced on less favorable termsbull Loss of customers with whom we have long-standing or significant relationshipsbull The potential that participation in joint ventures or similar structures exposes us to liability andor harm to
our reputation for acts or omissions by our partnersbull Our inability or failure to comply with the terms of our contracts which may result in additional costs
unexcused delays warranty claims failure to meet performance guarantees damages or contract terminations
bull The inability or refusal of our customers to pay for services including the failure to collect outstanding receivables
bull The failure to recover on payment claims against project owners or third party contractors or to obtain adequate compensation for customer-requested change orders
bull The failure of our customers to comply with regulatory requirements applicable to their projects which may result in project delays and cancellations
bull Budgetary or other constraints that may reduce or eliminate tax incentives or government funding for projects which may result in project delays or cancellations
bull Estimates and assumptions in determining our financial results and backlogbull Our ability to realize our backlogbull Risks associated with operating in international markets including instability of foreign governments
currency fluctuations tax and investment strategies as well as compliance with foreign legal systems and cultural practices the US Foreign Corrupt Practices Act and other applicable anti-bribery and anti-corruption laws
bull Our ability to successfully identify complete integrate and realize synergies from acquisitionsbull The potential adverse impact resulting from uncertainty surrounding investments and acquisitions including
the ability to retain key personnel from the acquired businesses and the potential increase in risks already existing in our operations
bull The adverse impact of impairments of goodwill receivables property equipment and other intangible assets or investments
bull Our growth outpacing our decentralized management and infrastructurebull Requirements relating to governmental regulation and changes theretobull Inability to enforce our intellectual property rights or the obsolescence of such rightsbull Risks related to the implementation of an information technology solutionbull The impact of our unionized workforce on our operations including labor stoppages or interruptions due to
strikes or lockoutsbull Potential liabilities and other adverse effects arising from occupational health and safety mattersbull Our dependence on suppliers subcontractors equipment manufacturers and other third party contractorsbull Fluctuations of prices of certain materials used in our businessbull The ability to access sufficient funding to finance desired growth and operationsbull Our ability to obtain performance bondsbull Potential exposure to environmental liabilitiesbull Our ability to continue to meet certain requirements applicable to us and our subsidiariesbull Rapid technological and other structural changes that could reduce the demand for our servicesbull New or changed tax laws treaties or regulationsbull Increased healthcare costs arising from healthcare reform legislation or other governmental actionbull Regulatory changes that result in increased labor costsbull Significant fluctuations in foreign currency exchange rates andbull The other risks and uncertainties as are described elsewhere herein and in our Annual Report on Form 10-K for
the year ended December 31 2016 filed with the SEC and as may be detailed from time to time in our other public filings with the SEC
All of our forward-looking statements whether written or oral are expressly qualified by these cautionary statements and any other cautionary statements that may accompany such forward-looking statements or that are otherwise included in this presentation Should one or more of these risks materialize or should underlying assumptions prove incorrect actual results may vary materially from those expressed or implied in any forward-looking statements Investors are cautioned not to place undue reliance on these forward-looking statements which are current only as of this date We do not undertake and expressly disclaim any obligation to update or revise any forward-looking statements to reflect events or circumstances after the date of this presentation or otherwise and we expressly disclaim any written or oral statements made by any third party regarding the subject matter of this presentation
Slide Number 1
Forward Looking Statement Disclaimer
Key Takeaways
Leading Integrated Infrastructure Solutions Provider
Overview ndash Strategically Focused Operationally Diverse
Overview - Diverse and High Quality Customer Base
Leading Integrated Infrastructure Solutions Provider
Strategic Imperatives
Strategic Imperatives Deliver Profitable Growth
Strategic Acquisitions Criteria and Rationale
Differentiated Competitive Position ndash In the Sweet Spot
Differentiated Competitive Position ndash In the Sweet Spot
Electric Power Infrastructure Services Segment Overview
Power Grid Investment Drivers - Transmission
Power Grid Investment Drivers - Transmission
Power Grid Investment Drivers - Distribution
Oil amp Gas Infrastructure Services Segment Overview
Reconciliation of Adjusted Net Income from Continuing Operations Attributable to Common Stock
Reconciliation of Electric Power and Oil amp Gas Infrastructure Services Segments Operating Income As Adjusted
Reconciliation of Free Cash Flow
Forward Looking Statement Disclaimer
Forward Looking Statement Disclaimer
Free Cash Flow From Continuing Operations
Source
2013
2014
2015
2016
(Support Cash Flow Statement)
Net Cash Provided by Operating Activities of Continuing Operations
370558
247742
618183
381176
(Support Cash Flow Statement)
Less Net Capital Expenditures
(Support Cash Flow Statement)
Additions of Property and Equipment
(221946)
(247216)
(209968)
(212555)
(Support Cash Flow Statement)
Proceeds from Sale of Property and Equipment
14789
14448
26178
21975
(Recalculation)
Net Capital Expenditures
(207157)
(232768)
(183790)
(190580)
(Recalculation)
Free Cash Flow
163401
14974
434393
190596
Adjusted Operating Income Margin
$ in millions
Support for slide 23
Amounts in millions except percentages
Electric Power
Oil amp Gas Infrastructure
123114
123115
123116
123114
Revenues
$ 53027
$ 49373
$ 48505
$ 24446
Operating Income (as reported)
4630
3623
3957
1628
Addback
Provisions for long term contract receivable
1025
-0
-0
-0
Arbitration expense
-0
-0
-0
388
Asset impairment charge
-0
66
57
-0
Operating Income (as adjusted)
$ 5655
$ 3689
$ 4014
$ 2016
Operating income margin (as reported)
87
73
82
67
Operating income margin (as adjusted)
107
75
83
83
Quanta Services Inc and Subsidiaries
Reconciliation of Non-GAAP Financial Measures
Adjusted Diluted Earnings Per Share from Continuing Operations
For the Years Ended December 31
(in thousands except per share information)
(Unaudited)
Estimated Guidance Range
2013
2014
2015
2016
2017
2017
Reconciliation of adjusted net income from continuing operations attributable to common stock
Net income from continuing operations attributable to common stock (GAAP as reported)
$ 372057
$ 269224
$ 120286
$ 198725
$ 247000
$ 275300
Adjustments
Asset impairment charges
-
-
58451
7964
-
-
Severance and restructuring charges
-
-
-
6352
-
-
Acquisition and integration costs
8145
14754
7966
3053
9300
9300
Impact of income tax contingency releases
(9935)
(8099)
-
(20488)
-
-
Impact of tax benefit from realization of previously unrecognized deferred tax asset
-
-
(4228)
-
-
-
Impact of Alberta tax law change
-
-
4982
-
-
-
Provision for long-term contract receivable
-
102460
-
-
-
-
Arbitration expense
-
38848
-
-
-
-
Impact of sale of equity ownership in Howard Energy
(112744)
-
-
-
-
-
Income tax impact of adjustments
39836
(55935)
(16186)
(3982)
(3400)
(3400)
Adjusted net income from continuing operations attributable to common stock before certain non-cash adjustments
297359
361252
171271
191624
252900
281200
Non-cash stock based compensation
34381
37449
36939
41134
47000
47000
Amortization of intangible assets
25865
34257
34848
31685
30600
30600
Income tax impact of non-cash adjustments
(22715)
(26453)
(25817)
(26183)
(28500)
(28500)
Adjusted net income from continuing operations attributable to common stock
$ 334890
$ 406505
$ 217241
$ 238260
$ 302000
$ 330300
Weighted average shares
Weighted average shares outstanding for diluted earnings per share
214978
219690
195120
157288
157300
157300
Weighted average shares outstanding for adjusted diluted earnings per share
214978
219690
195120
157288
157300
157300
Diluted earnings per share from continuing operations attributable to common stock and adjusted diluted earnings per share from continuing operations attributable to common stock
Diluted earnings per share from continuing operations attributable to common stock
$ 173
$ 123
$ 062
$ 126
$ 157
$ 175
Adjusted diluted earnings per share from continuing operations attributable to common stock
$ 156
$ 185
$ 111
$ 151
$ 192
$ 210
2017 Forecast
2008
2009
2010
2011
2012
2013
2014
2015
2016
2017
2018
2019
2020
2021
2022
US IOU
17599783395
17375430450
17116821481
17473265629
19719353886
18593206538
21049378470
23210018195
24651006483
28003750000
29530700000
30481300000
30509750000
31231850000
31138000000
Co-ops
3679033739
3613552751
2806195753
3044502916
2639012201
3360515403
3050612075
2834000972
3277074511
3309845256
3342943708
3376373145
3410136877
3444238245
3478680628
MuniGovt Owned
2525145025
2693819865
2624788344
2608815562
2682098477
2938725525
3183015391
3330273309
3454862656
3664198000
3769427295
3778921940
3483677493
3817389338
3817389338
Canadian
3324942988
3202431553
3726264949
4213182949
4228837570
4323705834
4106960884
3465854177
3159852215
3254697600
3381315300
3453964800
3380277450
3406223700
3406223700
Total NA 2017 Market
27128905147
26885234619
26274070528
27339767056
29269302134
29216153300
31389966819
32840146653
34542795864
38232490856
40024386303
41090559885
40783841819
41899701283
41840293665
From August 2015 Report
North American Electric Distribution Spending
2008
2009
2010
2011
2012
2013
2014
2015
2016
2017
2018
2019
2020
US IOUs
$175
$173
$171
$174
$197
$186
$210
$226
$244
$244
$247
$249
$250
US Co-ops
$27
$29
$27
$29
$35
$41
$34
$39
$40
$40
$41
$42
$42
US Muni
$25
$26
$26
$28
$28
$29
$29
$30
$31
$31
$32
$32
$33
Total US
$226
$227
$224
$231
$260
$256
$273
$295
$314
$316
$320
$323
$325
Canada
$33
$33
$34
$39
$38
$39
$39
$38
$41
$41
$42
$43
$43
Total
$260
$261
$259
$269
$298
$294
$312
$333
$354
$357
$362
$365
$368
15 vs 16
$00
$01
$02
$04
($01)
($04)
$06
$04
$08
$21
$19
$28
$26
From August 2016 Report
North American Electric Distribution Spending
2008
2009
2010
2011
2012
2013
2014
2015
2016
2017
2018
2019
2020
US IOUs
$176
$174
$171
$175
$197
$186
$210
$232
$258
$270
$271
$281
$281
US Co-ops
$27
$29
$27
$29
$31
$33
$38
$39
$40
$41
$41
$42
$43
US Muni
$25
$26
$26
$28
$28
$29
$29
$30
$31
$31
$32
$33
$33
Total US
$228
$229
$224
$232
$256
$248
$277
$301
$329
$342
$344
$356
$357
Canada
$32
$32
$37
$41
$41
$42
$41
$36
$33
$36
$37
$37
$37
Total
$260
$261
$261
$273
$297
$290
$318
$337
$362
$378
$381
$393
$394
From September 2017 Report
North American Electric Distribution Spending
2008
2009
2010
2011
2012
2013
2014
2015
2016
2017
2018
2019
2020
2021
2022
US IOUs
$176
$174
$171
$175
$197
$186
$210
$232
$247
$280
$295
$305
$305
$312
$311
US Co-ops
$37
$36
$28
$30
$26
$34
$31
$28
$33
$33
$33
$34
$34
$34
$35
US Muni
$25
$27
$26
$26
$27
$29
$32
$33
$35
$37
$38
$38
$35
$38
$38
Total US
$238
$237
$225
$231
$250
$249
$273
$294
$314
$350
$366
$376
$374
$385
$384
Canada
$33
$32
$37
$42
$42
$43
$41
$35
$32
$33
$34
$35
$34
$34
$34
Total
$271
$269
$263
$273
$293
$292
$314
$328
$345
$382
$400
$411
$408
$419
$418
2015 vs 2016 vs 2017
2015 Est
2016 Est
2017 Est
Avg 08-11
$262
$264
$269
Avg 12-15
$309
$311
$307
2016
$354
$362
$345
2017
$357
$378
$382
2018
$362
$381
$400
2019
$365
$393
$411
2020
$368
$394
$408
2021
$419
2022
$418
2017
Electric Power Infrastructure Services Segment Overview
$4542$5303 $4937 $4850
115 10775 83
2013 2014 2015 2016Revenue Op Margin
(2)
(1) Operating margin excludes a $1025 million charge to cost of services for long-term contract receivable in 2014 Refer to appendix for non-GAAP reconciliation(2) Excludes a $66 million property and equipment charge in 2015 and a $57 million asset impairment charge in 2016 Includes the impact of $661 million in 2015 and $548 million in 2016 of project losses Refer to appendix for non-GAAP reconciliation
Differentiatorsbull Largest TampD solutions provider in North
Americabull Reputation and Track Recordbull Unmatched Solutions Scope and Scalebull Safety Recordbull Manpower and Equipment Resourcesbull Lazy Q Training Facilitybull Energized Servicesbull EPC Capabilities Across All Offeringsbull Infrastructure Capital Solutions
Market Drivers
Power Grid Investment Drivers - Transmission
bull An aging grid that requires repair upgrade and maintenancebull Favorable transmission regulation Energy Policy Act of lsquo05
NERC Reliability Standards possibly FERC Order 1000 over the long-term
bull More stringent reliability standards will require repairing lines and adding redundant capacity
bull Coal and nuclear generation retirements and switching to natural gas and renewable generation strains the grid
bull Existing and new renewable generation needs interconnection to the grid
bull Opportunity for industrial driven load growthbull Regional grid infrastructure is too congested to get lowest-cost
power to consumersbull Sub-transmission interconnectionbull Canada has same drivers as US as well as the need to serve
mining interests and hydro generation for export to US load centers
bull Challenged economic conditions in Canada
bull Environmental and other regulatory scrutiny right of way acquisition permitting etc
bull Tepid load growthbull Economybull Energy efficiency initiatives
Oil amp Gas Infrastructure Services Segment Overview
$1870
$2445 $2635 $2801
74 83
54 53
2013 2014 2015 2016Revenue Op Margin
(1) Excludes a $388 million expense associated with an arbitration decision Refer to appendix for non-GAAP reconciliation(2) Includes $73 million of project losses
bull Production of shale natural gas oil and natural gas liquids has grown dramatically and is expected to remain at high levels forthe foreseeable future
bull Much of these resources are in areas that have not been traditional hydrocarbon fuel sources and do not have adequate infrastructure in place to gather store process and transport product
bull Canadian oil production lacks adequate takeaway pipeline infrastructurebull Economics of pipeline transportation is increasingly attractive versus rail in a low oil price environmentbull Pipeline construction capacity is more limited in Canada versus the US and construction capacity constraints could be significant
bull It will take many years and significant energy infrastructure investment to harvest these resources
Shale Gas amp Tight Oil Plays Drive US Natural Gas Production
2000-2040 (trillion cubic feet)
Source EIA Annual Energy Outlook 2017
Tight Oil Drives US Oil Production2000-2040 (millions of barrels per day)
Source EIA Annual Energy Outlook 2015
Canadian Oil Sands amp Conventional Oil Production(Millions of barrels per day)
Source Canadian Assoc of Petroleum Producers
Oil amp Gas Infrastructure Investment Driversbull Need for pipeline and related infrastructure driven by the
significant increase in North American unconventional natural gas and oil production ndash not commodity prices
bull Takeaway pipelines have not been built fast enough to keep pace with hydrocarbon production ndash significant pipeline development needed
bull Large pipeline construction industry capacity is currently tight but could get significantly strained over the next several years
North American Pipeline ForecastProbability Weighted
Quanta Is the Largest Pipeline Construction Company in North America
bull Quanta is the largest pipeline construction company in North America
bull This positions Quanta to provide significant large diameter pipe construction capacity to the industry while remaining active in select shales
bull We are ready to assist our customers in meeting their development goals in what could be a resource challenged environment
North America Major Planned Mainline Project Capex
Source KeyBanc Capital Markets
$0
$5
$10
$15
$20
2016E 2017E 2018E 2019E
In B
illio
ns
In B
illio
ns
Oil amp Gas Infrastructure Investment DriversNatural Gas Distribution amp Pipeline Integritybull US pipeline infrastructure is getting older
bull PHMSA estimates more than 470K miles (37) of US gas distribution mains and 171K miles (57) of gas transmission pipelines were installed before 1970 or in an undocumented year
bull Local Distribution Companies (LDCs) continue increased spend on pipe inspection and replacement
bull Replacement programs ramped up after San Bruno incident in 2010 Utilities are spending $22B a year on transmission and distribution systems(2)
bull Regulations push for expanding inspection programs and accelerating replacement work
bull PHMSA will require more inspection and corrosion control activity which will require additional excavations and integrity work DOErsquos Quadrennial Energy Review emphasizes the need to accelerate pipe replacement to curb emissions from leak-prone pipe
bull Long timelines for some replacement plans will push spend acceleration
bull Current projections are over 20 years for many large utilities a few more than 50 years(3) Replacement activities will have to be accelerated to address risk
bull State regulators establishing cost recovery mechanisms to accelerate replacement programs
Significant Inventory Remains for Replacement
States with Gas Utility Cost Recovery Mechanisms(4)
(1) PHMSA pipe inventory reports 2011-2015(2) AGA 2016 Playbook (3) Department of Energy Quadrennial Energy Review ndash Energy Transmission Storage and Distribution Infrastructure April 2015 (4) American Gas Association Playbook 2017
Stronghold Acquisition Overview
bull Provides catalyst handling turnaround and other downstream services tank storage and other midstream services
bull Specializes in high pressure and high reactor infrastructure services
bull Industry leading safety record employee and training focus with entrepreneurial culture
bull Led by a strong multigenerational highly regarded management team with decades of industry experience
bull Preferred employer with low turnover and high-quality workforce ndash averaging 2800 employees
bull Excellent reputation and strong relationships with a high-quality and diverse client base
bull Strong historical organic growth
21
Stronghold is a leading specialized services company providing high pressure and critical path solutions to the downstream and midstream energy markets
Company Profile
2016 Revenue =Approx $500 Million
Downstream Services
85
Midstream Services
15
Strategic Rationalebull Facilitates capture of a greater portion of energy
industry spend and offers cross-selling opportunities
bull Specialized Industrial Services market is a natural service line expansion for Quanta to meet our customersrsquo needs
bull Complements existing downstream high-voltage power services
bull Stronghold gives Quanta a significant presence in downstream services and a strong platform for growth
bull Strong financial profilebull Attractive historical growth and accretive margin
profile low capex requirements solid cash flow and accretive to earnings
bull Enhances recurring base business revenue
bull Shale oil natural gas and natural gas liquids (NGLs) production driving refinery petrochemical and storage infrastructure needs
Telecom Infrastructure Services Overview
To be an industry leading and true EPC contractor providing comprehensive communications infrastructure solutions to customers in the United States Canada and select markets in Latin America
Goal
Diverse Existing amp Target Customer BaseMarkets Served
Telecom Infrastructure Investment Drivers
bull Telco gigabit fiber to the home deployment programs
bull Cable MSOs deploying DOCSIS 31
bull Upcoming - 5G wireless and fiber backhaul
bull Ongoing 4G wireless network optimization
bull Connect America Fund - rural fiber build-out
bull Federal government funded FirstNet - national wireless network for first responders
United States
bull Backbone and last mile fiber (behind relative to the US)
bull Telco gigabit fiber to the home deployment programs
bull Cable MSOs deploying DOCSIS 31
bull Upcoming - 5G wireless and fiber backhaul
bull Ongoing 4G wireless network optimization
bull Federal government infrastructure initiatives generally positive
Canada
bull Significantly behind North America in both wireline and wireless connectivity
bull However demand for connectivity media and data intensive services is strong
bull Fiber and backhaul networks significantly behind North America
bull Primarily 3G wireless some 4G wireless (country dependent)
bull Various governments have infrastructure expansion initiatives
bull Concession and P3 opportunities
bull Connectivity for quality of life social and commercial reasons
Latin America
Telecom Infrastructure Services Overview
Fiber Builds
Wireless Deployment
Make Ready Services
Civil Construction
Engineering Design
Material Management
EPC
Wireless Wireline
United StatesWireless Wireline
CanadaWireless Wireline
Latin America
Comprehensive Infrastructure Solutions Offered On A Turnkey Discrete Service or EPC Basis
bull Proven greenfield expansion model in Latin America ndash US should be less difficult
Leverage existing US field operations people equipment and property
bull Select strategic acquisitions may play a role but NOT a roll-up approach
Provide wireline and wireless services - heavier on wireline
bull Increasing convergence of wireless and wireline due fiber requirements of both
Project centric nimble approach versus MSA focused EPC services to differentiate
bull Less capital intensive with better margin opportunity
GOAL
STRATEGY
STRATEGY
STRATEGY
STRATEGY
To be the leading communications infrastructure contractor in the markets we serve
Engineer Procure Construct (EPC) Is A Differentiator
bull Quanta has a long history in the EPC business and is increasingly performing select projects on an EPC basisbull Customersrsquo capital programs are at historic levels and growing Projects are getting larger and more complexbull Evolution of regulatory demands competition and alternative pricing models
bull Many customers have limited internal resources and expertise to manage these dynamics and are turning to Quanta for solutions
bull Project cost certainty becoming increasingly important
bull We are enhancing initiatives to ensure we have a scalable comprehensive enterprise-wide capability for EPC projects that is consistently executed across all segments and geographies
bull EPC projects are a meaningful contributor to our current backlog and provide significant opportunity for future growth
Integrated Services
Construction amp Installation
Assessment Planning amp
Development
Engineering amp Design
Procurement Operation and Maintenance
What is Infrastructure Solutions
Infrastructure Solutions represent strategic partnerships with customers and capital partners
bull Public private partnerships (P3)bull Concessionsbull Build Own Operate or Transfer
(BOOT)bull Build to Suit (BTS) arrangements
These solutions are a growth engine for each of our segments and geographies and a core component of our strategic
imperative to deliver differentiated solutions to our customers
Encompasses
Infrastructure Solutions Drivers
A Combination of Drivers are Occurring that Create Demand and Opportunity for Our Infrastructure Solutions
bull Provide transparency to a project shape design constructability risk allocation and overall project structure
bull Manages risk that yields more informed EPC project decisions
bull Improves success rate of both winning the engagement and successful execution
bull Where appropriate we invest alongside our partners
bull Significant capital needs to fund the substantial infrastructure needs
bull Utilization of concessions public private partnerships (P3) and private infrastructure partnerships to fund and attract high-quality entities for complex projects
bull Changes in regulation (such as FERC Order 1000)
bull New entrants together with high interest and availability of investor infrastructure investment capital
Quanta Is A True Partner
bull Quanta increasingly sought as a partner for our execution capabilities the need for price certainty and our financial strength
bull Projects are larger more complex greater scope Typically under lump-sum turnkey arrangements which create greater opportunities and risks for Quanta
bull Successful Infrastructure Solutions and project execution track record
Quanta Sought for Executionamp Track Record
Market Structure amp Projects Getting More Complex
29
Fully Integrated Solutions Based Provider
Infrastructure Solutions Provides A Solutions Based Tool for Quanta to Partner with Customers Enhance Relationships and Create New Customer and Project Opportunities
EPC
Capitalbull Determine capital structurebull Source capitalbull Quanta minority direct
investmentbull First Infrastructure Capital
Advisors
PartnershipsPartner withbull Customersbull Equity Capital
(4) Includes $802 million of expense net of tax or $036 per diluted share from an arbitration decision charge to provision for long-term contract receivable and the benefit associated with release of certain income tax contingencies
2013 2014 2015 2016 2017 Est
($ in millions)Revenue
$140$122
$062
$126
$163
2013 2014 2015 2016 2017Est
(4)
(5)
(6)
Electric Power Oil amp Gas Infrastructure
GAAP Diluted EPS (1)
$156
$185
$111
$151
$195
2013 2014 2015 2016 2017Est
Adjusted Diluted EPS (1)
$6412
(2) Represents the midpoint of guidance range
(2)
$7747
(2) (2) $173
(3) Includes $033 gain from sale of Howard Energy investment
$9300(3)
(1) From continuing operations
$7572
(5) Includes $734 million of project losses Also includes $454 million of expense net of tax or $023 per diluted share from net asset impairment charges
$7651
(6) Includes $548 million of project losses and $71 million of expense net of tax or $005 per diluted share from net asset impairment charges Also includes tax benefits of $205 million or $013 per share associated with the expiration of various federal and state tax statute of limitations periods
Recent Financial Performance amp 2017 ExpectationsFor the Years Ended December 31
($ in millions)Electric Power
$4542
$5303$4937 $4850
115107
7583
2013 2014 2015 2016 2017 Est
Revenue Op Margin
(2)
(1) Operating margin excludes a $1025 million charge to cost of services for long-term contract receivable in 2014 Refer to appendix for non-GAAP reconciliation(2) Excludes a $66 million property and equipment impairment charge Includes the impact of $661 million of project losses Refer to appendix for non-GAAP reconciliation(3) Excludes a $57 million asset impairment charge Includes the impact of $548 million of project losses Refer to appendix for non-GAAP reconciliation
(1) (1)
(2)(3)
f Est revenue growth approaching 15 vs 2016
Est operating incomemargins of 90 to 95
Guidance Commentary($ in millions)
Oil amp Gas Infrastructure
(4) Excludes a $388 million expense associated with an arbitration decision Refer to appendix for non-GAAP reconciliation(5) Includes $73 million of project losses
Liquidity includes cash and cash equivalents and availability under our revolving credit facility as described in our Form 10k
Historical Cash Flow Generation
$163
$15
$434
$191
2013 2014 2015 2016
Cash Flow from Continuing Operations
($ in millions)
Free Cash Flow from Continuing Operations
$371
$248
$618
$381
2013 2014 2015 2016
Net cash provided by operating activities from continuing operations plus proceeds from sale of property and equipment less additions of property and equipment
For the Years Ending December 31($ in millions)
For the Years Ending December 31
Committed to Generating Shareholder Value
Executed on $125 Billion Share Repurchase Authorizationbull Aug 2015 ndash Announced a new $125 billion share repurchase
authorization through Feb 28 2017bull Completed a $750 million accelerated stock repurchase (ASR)
arrangement in April 2016bull Acquired 351 million shares at $2136 per share
bull $500 million for opportunistic repurchases through Feb 28 2017bull $450 million 192 million shares retired
Completed $500 Million Share Repurchase Authorizationbull Completed previous $500 million share repurchase program in 2015bull Acquired approximately 174 million shares for total cost of $500
million
Acquired $17 Billion of Quanta Common Stock
Under Previous Programs Quanta Has Acquired Approximately 32 of Its Outstanding Stock
$2197$1951
$1573 $1573
0
25
50
75
100
125
150
175
200
225
$0000
$500000
$1000000
$1500000
$2000000
$2500000
$3000000
2014 2015 2016 2017E
Net Income Required to Generate $001 In EPS
Avg Dil Shs Out
Earnings Power Improvement
$ in
Tho
usan
ds
Shares in Millions
May 25 2017 ndash Announced New $300 Million Share Repurchase Authorizationbull Up to $300 million through June 30 2020
Opportunistic amp Disciplined Capital Allocation
Capital Deployment Preference (Amounts in millions)
bull Working Capitalbull Capital Expendituresbull Acquisitionsbull Investmentsbull Return of Capital
bull Generally in sync with preference however hellip
bull Financial strength provides the ability to be opportunistic
bull Flexible and strategic capital allocation is a competitive advantage
Capital Deployment Posture
Financial Strength Allows for Flexible and Strategic Capital Allocation ndash A Competitive Advantage
2013 ndash 2016 Sources amp Uses of Cash
Sources
Cash Flow fromOperations
DivestitureProceeds
BorrowingsInvestment Sales
$3099
$1667
$842
$369$221
Uses
StockRepurchase
CAPEX amp OtherNet
Acquisitions Net
Investments
$1700
$900
$728
$54$3382
54
27
127
50
27
21
2
Amounts reflect the retrospective application of a recent accounting pronouncement related to the classification of tax withholding payments for share-based compensation
Foundation For Growth amp Improved Profitability
Multi-Year Growth Opportunities
Innovative Industry Leading Solutions
Scale amp Scope
Financial Strength
Operational amp Safety Excellence
QuantaServicesIR
QuantaIR
Connect With Quanta Services Investor Relations
Corporate Office2800 Post Oak Blvd Suite 2600Houston TX 77056713-629-7600wwwquantaservicescom
Investor ContactKip Rupp CFAVice President ndash Investor Relations713-341-7260investorsquantaservicescom
Reconciliation of Adjusted Net Income from Continuing Operations Attributable to Common Stock
2013 2014 2015 2016 2017 2017Reconciliation of adjusted net income from continuing operations attributable to common stockNet income from continuing operations attributable to common stock (GAAP as reported) 372057$ 269224$ 120286$ 198725$ 247000$ 275300$ Adjustments
Asset impairment charges - - 58451 7964 - -Severance and restructuring charges - - - 6352 - -Acquisition and integration costs 8145 14754 7966 3053 9300 9300 Impact of income tax contingency releases (9935) (8099) - (20488) - -Impact of tax benefit from realization of previously unrecognized deferred tax asset - - (4228) - - -Impact of Alberta tax law change - - 4982 - - -Provision for long-term contract receivable - 102460 - - - -Arbitration expense - 38848 - - - -Impact of sale of equity ownership in Howard Energy (112744) - - - - -Income tax impact of adjustments 39836 (55935) (16186) (3982) (3400) (3400)
Adjusted net income from continuing operations attributable to common stock before certain non-cash adjustments 297359 361252 171271 191624 252900 281200
Non-cash stock based compensation 34381 37449 36939 41134 47000 47000 Amortization of intangible assets 25865 34257 34848 31685 30600 30600 Income tax impact of non-cash adjustments (22715) (26453) (25817) (26183) (28500) (28500)
Adjusted net income from continuing operations attributable to common stock 334890$ 406505$ 217241$ 238260$ 302000$ 330300$ Weighted average sharesWeighted average shares outstanding for diluted earnings per share 214978 219690 195120 157288 157300 157300 Weighted average shares outstanding for adjusted diluted earnings per share 214978 219690 195120 157288 157300 157300 Diluted earnings per share from continuing operations attributable to common stock and adjusted diluted earnings per share from continuing operations attributable to common stockDiluted earnings per share from continuing operations attributable to common stock 173$ 123$ 062$ 126$ 157$ 175$ Adjusted diluted earnings per share from continuing operations attributable to common stock 156$ 185$ 111$ 151$ 192$ 210$
Estimated Guidance Range
For the Years Ended December 31
(in thousands except per share information)(Unaudited)
Recast of Adjusted Diluted
Reconciliation of Electric Power and Oil amp Gas Infrastructure Services Segments Operating Income As Adjusted
Amounts in millions except percentagesOil amp Gas
Infrastructure12312014 12312015 12312016 12312014
Revenues 53027$ 49373$ 48505$ 24446$
Operating Income (as reported) 4630 3623 3957 1628
Addback Provisions for long term contract receivable 1025 - - - Arbitration expense - - - 388 Asset impairment charge - 66 57 -
Operating Income (as adjusted) 5655$ 3689$ 4014$ 2016$
Operating income margin (as reported) 87 73 82 67Operating income margin (as adjusted) 107 75 83 83
Electric Power
Sheet1
Reconciliation of Free Cash Flow
2013 2014 2015 2016Net Cash Provided by Operating Activities of Continuing Operations 370558 247742 618183 381176 Less Net Capital ExpendituresAdditions of Property and Equipment (221946) (247216) (209968) (212555) Proceeds from Sale of Property and Equipment 14789 14448 26178 21975 Net Capital Expenditures (207157) (232768) (183790) (190580)
Free Cash Flow 163401 14974 434393 190596
Free Cash Flow from Cont Ops
Forward Looking Statement DisclaimerThis presentation (and oral statements regarding the subject matter of this presentation) includes ldquoforward-looking statementsrdquo intended to qualify for the safe harbor from liability established by the Private Securities Litigation Reform Act of 1995 These statements reflect assumptions expectations projections intentions or beliefs about future events and use words such as anticipate estimate project forecast may will should could expect believe plan intend and other words of similar meaning You can identify these statements by the fact that they do not relate strictly to historical or current facts In particular these include but are not limited to statements relating to the following
bull Projected revenues net income earnings per share attributable to common stock backlog margins capital expenditures weighted average shares outstanding tax rates and other projections of operating or financial resultsbull Our business or financial outlook growth or opportunities in particular marketsbull The potential benefits from acquisitions and investmentsbull The expected financial and operational performance of acquired businessesbull Future capital allocation initiativesbull Our ability to deliver increased value and return capital to stockholders bull The strategic use of our balance sheetbull The expected value of contracts or intended contracts with customersbull The scope services term and results of any projects awarded or expected to be awarded for services to be provided by usbull The anticipated commencement and completion dates for any projects awardedbull The development of larger electric transmission and oil and natural gas pipeline projects and the level of oil natural gas and natural gas liquids prices and their impact on our business or the demand for our services bull The impact of existing or potential energy legislation bull Potential opportunities that may be indicated by bidding activity or discussions with customersbull The expected outcome of pending or threatened litigation bull Beliefs and assumptions about the collectability of receivablesbull The business plans or financial condition of our customersbull Our plans and strategies bull The current economic and regulatory conditions and trends in the industries we serve bull Possible recovery on pending or contemplated change orders or affirmative claims against customers or third parties and bull Other statements reflecting expectations intentions assumptions or beliefs about future events and other statements that do not relate strictly to historical or current facts
Although our management believes that the expectations reflected in such forward-looking statements are reasonable it can give no assurance that such expectations will prove to be correct These forward-looking statements are not guarantees of future performance and involve or rely on a number of risks uncertainties and assumptions that are difficult to predict or beyond our control These forward-looking statements reflect our beliefs and assumptions based on information available to our management at the time the statements are made We caution you that actual outcomes and results may differ materially from what is expressed implied or forecasted by our forward-looking statements and that any or all of our forward-looking statements may turn out to be wrong Forward-looking statements can be affected by inaccurate assumptions and by known or unknown risks and uncertainties including the following
bull Market conditionsbull The effects of industry economic financial or political conditions outside our control including weakness in capital marketsbull Quarterly variations in our operating resultsbull Trends and growth opportunities in relevant marketsbull The cost of borrowing availability of credit and cash fluctuations in the price and volume of our common stock debt covenant compliance interest rate fluctuations and other factors affecting our financing and investing activitiesbull Delays reductions in scope or cancellations of anticipated pending or existing projects including as a result of weather regulatory or permitting issues environmental processes project performance issues claimed force majeure events or our customers capital
constraintsbull The successful negotiation execution performance and completion of anticipated pending and existing contracts including the ability to obtain awards of projects on which we bid or are otherwise discussing with customersbull Our ability to retain key personnel and qualified employees
Forward Looking Statement Disclaimerbull Our ability to attract or the potential shortage of skilled labor bull Our dependence on fixed price contracts and the potential to incur losses with respect to the contractsbull Estimates relating to our use of percentage-of-completion accountingbull Adverse weatherbull Our ability to generate internal growthbull Competition in our business including our ability to effectively compete for new projects and market sharebull The effect of natural gas natural gas liquids and oil prices on our operations and growth opportunities and on
our customersrsquo capital programs and demand for our servicesbull The future development of natural resourcesbull The failure of existing or potential legislative actions to result in demand for our servicesbull Liabilities associated with multiemployer pension plans including underfunding of liabilities and termination
or withdrawal liabilitiesbull The possibility of further increases in the liability associated with our withdrawal from a multiemployer
pension planbull Unexpected costs or liabilities that may arise from pending or threatened litigation indemnity obligations or
other claims asserted against us including liabilities for claims that are self-insured or uninsuredbull The outcome of pending or threatened litigationbull Risks relating to the potential unavailability or cancellation of third party insurance the exclusion of coverage
for certain losses and potential increases in premiums for coverage deemed beneficial to usbull Cancellation provisions within our contracts and the risk that contracts expire and are not renewed or are
replaced on less favorable termsbull Loss of customers with whom we have long-standing or significant relationshipsbull The potential that participation in joint ventures or similar structures exposes us to liability andor harm to
our reputation for acts or omissions by our partnersbull Our inability or failure to comply with the terms of our contracts which may result in additional costs
unexcused delays warranty claims failure to meet performance guarantees damages or contract terminations
bull The inability or refusal of our customers to pay for services including the failure to collect outstanding receivables
bull The failure to recover on payment claims against project owners or third party contractors or to obtain adequate compensation for customer-requested change orders
bull The failure of our customers to comply with regulatory requirements applicable to their projects which may result in project delays and cancellations
bull Budgetary or other constraints that may reduce or eliminate tax incentives or government funding for projects which may result in project delays or cancellations
bull Estimates and assumptions in determining our financial results and backlogbull Our ability to realize our backlogbull Risks associated with operating in international markets including instability of foreign governments
currency fluctuations tax and investment strategies as well as compliance with foreign legal systems and cultural practices the US Foreign Corrupt Practices Act and other applicable anti-bribery and anti-corruption laws
bull Our ability to successfully identify complete integrate and realize synergies from acquisitionsbull The potential adverse impact resulting from uncertainty surrounding investments and acquisitions including
the ability to retain key personnel from the acquired businesses and the potential increase in risks already existing in our operations
bull The adverse impact of impairments of goodwill receivables property equipment and other intangible assets or investments
bull Our growth outpacing our decentralized management and infrastructurebull Requirements relating to governmental regulation and changes theretobull Inability to enforce our intellectual property rights or the obsolescence of such rightsbull Risks related to the implementation of an information technology solutionbull The impact of our unionized workforce on our operations including labor stoppages or interruptions due to
strikes or lockoutsbull Potential liabilities and other adverse effects arising from occupational health and safety mattersbull Our dependence on suppliers subcontractors equipment manufacturers and other third party contractorsbull Fluctuations of prices of certain materials used in our businessbull The ability to access sufficient funding to finance desired growth and operationsbull Our ability to obtain performance bondsbull Potential exposure to environmental liabilitiesbull Our ability to continue to meet certain requirements applicable to us and our subsidiariesbull Rapid technological and other structural changes that could reduce the demand for our servicesbull New or changed tax laws treaties or regulationsbull Increased healthcare costs arising from healthcare reform legislation or other governmental actionbull Regulatory changes that result in increased labor costsbull Significant fluctuations in foreign currency exchange rates andbull The other risks and uncertainties as are described elsewhere herein and in our Annual Report on Form 10-K for
the year ended December 31 2016 filed with the SEC and as may be detailed from time to time in our other public filings with the SEC
All of our forward-looking statements whether written or oral are expressly qualified by these cautionary statements and any other cautionary statements that may accompany such forward-looking statements or that are otherwise included in this presentation Should one or more of these risks materialize or should underlying assumptions prove incorrect actual results may vary materially from those expressed or implied in any forward-looking statements Investors are cautioned not to place undue reliance on these forward-looking statements which are current only as of this date We do not undertake and expressly disclaim any obligation to update or revise any forward-looking statements to reflect events or circumstances after the date of this presentation or otherwise and we expressly disclaim any written or oral statements made by any third party regarding the subject matter of this presentation
Slide Number 1
Forward Looking Statement Disclaimer
Key Takeaways
Leading Integrated Infrastructure Solutions Provider
Overview ndash Strategically Focused Operationally Diverse
Overview - Diverse and High Quality Customer Base
Leading Integrated Infrastructure Solutions Provider
Strategic Imperatives
Strategic Imperatives Deliver Profitable Growth
Strategic Acquisitions Criteria and Rationale
Differentiated Competitive Position ndash In the Sweet Spot
Differentiated Competitive Position ndash In the Sweet Spot
Electric Power Infrastructure Services Segment Overview
Power Grid Investment Drivers - Transmission
Power Grid Investment Drivers - Transmission
Power Grid Investment Drivers - Distribution
Oil amp Gas Infrastructure Services Segment Overview
Reconciliation of Adjusted Net Income from Continuing Operations Attributable to Common Stock
Reconciliation of Electric Power and Oil amp Gas Infrastructure Services Segments Operating Income As Adjusted
Reconciliation of Free Cash Flow
Forward Looking Statement Disclaimer
Forward Looking Statement Disclaimer
Free Cash Flow From Continuing Operations
Source
2013
2014
2015
2016
(Support Cash Flow Statement)
Net Cash Provided by Operating Activities of Continuing Operations
370558
247742
618183
381176
(Support Cash Flow Statement)
Less Net Capital Expenditures
(Support Cash Flow Statement)
Additions of Property and Equipment
(221946)
(247216)
(209968)
(212555)
(Support Cash Flow Statement)
Proceeds from Sale of Property and Equipment
14789
14448
26178
21975
(Recalculation)
Net Capital Expenditures
(207157)
(232768)
(183790)
(190580)
(Recalculation)
Free Cash Flow
163401
14974
434393
190596
Adjusted Operating Income Margin
$ in millions
Support for slide 23
Amounts in millions except percentages
Electric Power
Oil amp Gas Infrastructure
123114
123115
123116
123114
Revenues
$ 53027
$ 49373
$ 48505
$ 24446
Operating Income (as reported)
4630
3623
3957
1628
Addback
Provisions for long term contract receivable
1025
-0
-0
-0
Arbitration expense
-0
-0
-0
388
Asset impairment charge
-0
66
57
-0
Operating Income (as adjusted)
$ 5655
$ 3689
$ 4014
$ 2016
Operating income margin (as reported)
87
73
82
67
Operating income margin (as adjusted)
107
75
83
83
Quanta Services Inc and Subsidiaries
Reconciliation of Non-GAAP Financial Measures
Adjusted Diluted Earnings Per Share from Continuing Operations
For the Years Ended December 31
(in thousands except per share information)
(Unaudited)
Estimated Guidance Range
2013
2014
2015
2016
2017
2017
Reconciliation of adjusted net income from continuing operations attributable to common stock
Net income from continuing operations attributable to common stock (GAAP as reported)
$ 372057
$ 269224
$ 120286
$ 198725
$ 247000
$ 275300
Adjustments
Asset impairment charges
-
-
58451
7964
-
-
Severance and restructuring charges
-
-
-
6352
-
-
Acquisition and integration costs
8145
14754
7966
3053
9300
9300
Impact of income tax contingency releases
(9935)
(8099)
-
(20488)
-
-
Impact of tax benefit from realization of previously unrecognized deferred tax asset
-
-
(4228)
-
-
-
Impact of Alberta tax law change
-
-
4982
-
-
-
Provision for long-term contract receivable
-
102460
-
-
-
-
Arbitration expense
-
38848
-
-
-
-
Impact of sale of equity ownership in Howard Energy
(112744)
-
-
-
-
-
Income tax impact of adjustments
39836
(55935)
(16186)
(3982)
(3400)
(3400)
Adjusted net income from continuing operations attributable to common stock before certain non-cash adjustments
297359
361252
171271
191624
252900
281200
Non-cash stock based compensation
34381
37449
36939
41134
47000
47000
Amortization of intangible assets
25865
34257
34848
31685
30600
30600
Income tax impact of non-cash adjustments
(22715)
(26453)
(25817)
(26183)
(28500)
(28500)
Adjusted net income from continuing operations attributable to common stock
$ 334890
$ 406505
$ 217241
$ 238260
$ 302000
$ 330300
Weighted average shares
Weighted average shares outstanding for diluted earnings per share
214978
219690
195120
157288
157300
157300
Weighted average shares outstanding for adjusted diluted earnings per share
214978
219690
195120
157288
157300
157300
Diluted earnings per share from continuing operations attributable to common stock and adjusted diluted earnings per share from continuing operations attributable to common stock
Diluted earnings per share from continuing operations attributable to common stock
$ 173
$ 123
$ 062
$ 126
$ 157
$ 175
Adjusted diluted earnings per share from continuing operations attributable to common stock
$ 156
$ 185
$ 111
$ 151
$ 192
$ 210
2017 Forecast
2008
2009
2010
2011
2012
2013
2014
2015
2016
2017
2018
2019
2020
2021
2022
US IOU
17599783395
17375430450
17116821481
17473265629
19719353886
18593206538
21049378470
23210018195
24651006483
28003750000
29530700000
30481300000
30509750000
31231850000
31138000000
Co-ops
3679033739
3613552751
2806195753
3044502916
2639012201
3360515403
3050612075
2834000972
3277074511
3309845256
3342943708
3376373145
3410136877
3444238245
3478680628
MuniGovt Owned
2525145025
2693819865
2624788344
2608815562
2682098477
2938725525
3183015391
3330273309
3454862656
3664198000
3769427295
3778921940
3483677493
3817389338
3817389338
Canadian
3324942988
3202431553
3726264949
4213182949
4228837570
4323705834
4106960884
3465854177
3159852215
3254697600
3381315300
3453964800
3380277450
3406223700
3406223700
Total NA 2017 Market
27128905147
26885234619
26274070528
27339767056
29269302134
29216153300
31389966819
32840146653
34542795864
38232490856
40024386303
41090559885
40783841819
41899701283
41840293665
From August 2015 Report
North American Electric Distribution Spending
2008
2009
2010
2011
2012
2013
2014
2015
2016
2017
2018
2019
2020
US IOUs
$175
$173
$171
$174
$197
$186
$210
$226
$244
$244
$247
$249
$250
US Co-ops
$27
$29
$27
$29
$35
$41
$34
$39
$40
$40
$41
$42
$42
US Muni
$25
$26
$26
$28
$28
$29
$29
$30
$31
$31
$32
$32
$33
Total US
$226
$227
$224
$231
$260
$256
$273
$295
$314
$316
$320
$323
$325
Canada
$33
$33
$34
$39
$38
$39
$39
$38
$41
$41
$42
$43
$43
Total
$260
$261
$259
$269
$298
$294
$312
$333
$354
$357
$362
$365
$368
15 vs 16
$00
$01
$02
$04
($01)
($04)
$06
$04
$08
$21
$19
$28
$26
From August 2016 Report
North American Electric Distribution Spending
2008
2009
2010
2011
2012
2013
2014
2015
2016
2017
2018
2019
2020
US IOUs
$176
$174
$171
$175
$197
$186
$210
$232
$258
$270
$271
$281
$281
US Co-ops
$27
$29
$27
$29
$31
$33
$38
$39
$40
$41
$41
$42
$43
US Muni
$25
$26
$26
$28
$28
$29
$29
$30
$31
$31
$32
$33
$33
Total US
$228
$229
$224
$232
$256
$248
$277
$301
$329
$342
$344
$356
$357
Canada
$32
$32
$37
$41
$41
$42
$41
$36
$33
$36
$37
$37
$37
Total
$260
$261
$261
$273
$297
$290
$318
$337
$362
$378
$381
$393
$394
From September 2017 Report
North American Electric Distribution Spending
2008
2009
2010
2011
2012
2013
2014
2015
2016
2017
2018
2019
2020
2021
2022
US IOUs
$176
$174
$171
$175
$197
$186
$210
$232
$247
$280
$295
$305
$305
$312
$311
US Co-ops
$37
$36
$28
$30
$26
$34
$31
$28
$33
$33
$33
$34
$34
$34
$35
US Muni
$25
$27
$26
$26
$27
$29
$32
$33
$35
$37
$38
$38
$35
$38
$38
Total US
$238
$237
$225
$231
$250
$249
$273
$294
$314
$350
$366
$376
$374
$385
$384
Canada
$33
$32
$37
$42
$42
$43
$41
$35
$32
$33
$34
$35
$34
$34
$34
Total
$271
$269
$263
$273
$293
$292
$314
$328
$345
$382
$400
$411
$408
$419
$418
2015 vs 2016 vs 2017
2015 Est
2016 Est
2017 Est
Avg 08-11
$262
$264
$269
Avg 12-15
$309
$311
$307
2016
$354
$362
$345
2017
$357
$378
$382
2018
$362
$381
$400
2019
$365
$393
$411
2020
$368
$394
$408
2021
$419
2022
$418
2017
$0
$5
$10
$15
$20
$25
$30
$35
Avg 08-11
Avg 12-15
16 17 18 19 20 21 22
2015 Est 2016 Est 2017 Est
Market Trendsbull Transmission spending continues to reach all time highs and forecasts point towards sustained robust spending as
large transmission projects are expected to move forward
bull North American transmission spending estimated to average approx $30 billion per year between 2017-2020
bull Utility spending continues to shift from generation to transmission and distribution
bull Previously delayed larger transmission projects are expected to move forward over next several years
Power Grid Investment Drivers - Transmission
The C3 Group August 2017
Est North American Transmission SpendingOut-year estimates tend tohave upward revision bias
Billi
ons
Primary Drivers of New Transmission Projects
Reliability59Renewable
Integration18
Other12
Economic or Congestion
11
Source NERC 2013 Long-Term Reliability Assessment
Power Grid Investment Drivers - Distribution
bull Renewed focus on reliability versus costsbull Significant portion of the grid is approaching the end or is beyond its
useful lifebull More stringent reliability standards will require repairing lines and
adding redundant capacitybull System hardening initiatives particularly in areas hard hit by severe
weatherbull Technology innovations will continue to grow A focus on upgrades to
modernize the grid will overlap with spending needed to address aging infrastructure
bull Depending on the proliferation of distributed generation certain systems will require upgrades to accommodate new resources
Source The C Three Group Sept 2017
Billi
ons
Est North American Distribution CapEx
bull Lower ROE versus FERC transmission returnsbull Flat to minimal load growth
bull Economy
bull Energy efficiency initiatives
bull Regulatory and consumer pressures on utilities against rising power bills
bull If utilities face declining demand growth rate pressures could increase This could restrain their ability to spend capital
Oil amp Gas Infrastructure Services Segment Overview
$1870
$2445 $2635 $2801
74 83
54 53
2013 2014 2015 2016Revenue Op Margin
(1) Excludes a $388 million expense associated with an arbitration decision Refer to appendix for non-GAAP reconciliation(2) Includes $73 million of project losses
bull Production of shale natural gas oil and natural gas liquids has grown dramatically and is expected to remain at high levels forthe foreseeable future
bull Much of these resources are in areas that have not been traditional hydrocarbon fuel sources and do not have adequate infrastructure in place to gather store process and transport product
bull Canadian oil production lacks adequate takeaway pipeline infrastructurebull Economics of pipeline transportation is increasingly attractive versus rail in a low oil price environmentbull Pipeline construction capacity is more limited in Canada versus the US and construction capacity constraints could be significant
bull It will take many years and significant energy infrastructure investment to harvest these resources
Shale Gas amp Tight Oil Plays Drive US Natural Gas Production
2000-2040 (trillion cubic feet)
Source EIA Annual Energy Outlook 2017
Tight Oil Drives US Oil Production2000-2040 (millions of barrels per day)
Source EIA Annual Energy Outlook 2015
Canadian Oil Sands amp Conventional Oil Production(Millions of barrels per day)
Source Canadian Assoc of Petroleum Producers
Oil amp Gas Infrastructure Investment Driversbull Need for pipeline and related infrastructure driven by the
significant increase in North American unconventional natural gas and oil production ndash not commodity prices
bull Takeaway pipelines have not been built fast enough to keep pace with hydrocarbon production ndash significant pipeline development needed
bull Large pipeline construction industry capacity is currently tight but could get significantly strained over the next several years
North American Pipeline ForecastProbability Weighted
Quanta Is the Largest Pipeline Construction Company in North America
bull Quanta is the largest pipeline construction company in North America
bull This positions Quanta to provide significant large diameter pipe construction capacity to the industry while remaining active in select shales
bull We are ready to assist our customers in meeting their development goals in what could be a resource challenged environment
North America Major Planned Mainline Project Capex
Source KeyBanc Capital Markets
$0
$5
$10
$15
$20
2016E 2017E 2018E 2019E
In B
illio
ns
In B
illio
ns
Oil amp Gas Infrastructure Investment DriversNatural Gas Distribution amp Pipeline Integritybull US pipeline infrastructure is getting older
bull PHMSA estimates more than 470K miles (37) of US gas distribution mains and 171K miles (57) of gas transmission pipelines were installed before 1970 or in an undocumented year
bull Local Distribution Companies (LDCs) continue increased spend on pipe inspection and replacement
bull Replacement programs ramped up after San Bruno incident in 2010 Utilities are spending $22B a year on transmission and distribution systems(2)
bull Regulations push for expanding inspection programs and accelerating replacement work
bull PHMSA will require more inspection and corrosion control activity which will require additional excavations and integrity work DOErsquos Quadrennial Energy Review emphasizes the need to accelerate pipe replacement to curb emissions from leak-prone pipe
bull Long timelines for some replacement plans will push spend acceleration
bull Current projections are over 20 years for many large utilities a few more than 50 years(3) Replacement activities will have to be accelerated to address risk
bull State regulators establishing cost recovery mechanisms to accelerate replacement programs
Significant Inventory Remains for Replacement
States with Gas Utility Cost Recovery Mechanisms(4)
(1) PHMSA pipe inventory reports 2011-2015(2) AGA 2016 Playbook (3) Department of Energy Quadrennial Energy Review ndash Energy Transmission Storage and Distribution Infrastructure April 2015 (4) American Gas Association Playbook 2017
Stronghold Acquisition Overview
bull Provides catalyst handling turnaround and other downstream services tank storage and other midstream services
bull Specializes in high pressure and high reactor infrastructure services
bull Industry leading safety record employee and training focus with entrepreneurial culture
bull Led by a strong multigenerational highly regarded management team with decades of industry experience
bull Preferred employer with low turnover and high-quality workforce ndash averaging 2800 employees
bull Excellent reputation and strong relationships with a high-quality and diverse client base
bull Strong historical organic growth
21
Stronghold is a leading specialized services company providing high pressure and critical path solutions to the downstream and midstream energy markets
Company Profile
2016 Revenue =Approx $500 Million
Downstream Services
85
Midstream Services
15
Strategic Rationalebull Facilitates capture of a greater portion of energy
industry spend and offers cross-selling opportunities
bull Specialized Industrial Services market is a natural service line expansion for Quanta to meet our customersrsquo needs
bull Complements existing downstream high-voltage power services
bull Stronghold gives Quanta a significant presence in downstream services and a strong platform for growth
bull Strong financial profilebull Attractive historical growth and accretive margin
profile low capex requirements solid cash flow and accretive to earnings
bull Enhances recurring base business revenue
bull Shale oil natural gas and natural gas liquids (NGLs) production driving refinery petrochemical and storage infrastructure needs
Telecom Infrastructure Services Overview
To be an industry leading and true EPC contractor providing comprehensive communications infrastructure solutions to customers in the United States Canada and select markets in Latin America
Goal
Diverse Existing amp Target Customer BaseMarkets Served
Telecom Infrastructure Investment Drivers
bull Telco gigabit fiber to the home deployment programs
bull Cable MSOs deploying DOCSIS 31
bull Upcoming - 5G wireless and fiber backhaul
bull Ongoing 4G wireless network optimization
bull Connect America Fund - rural fiber build-out
bull Federal government funded FirstNet - national wireless network for first responders
United States
bull Backbone and last mile fiber (behind relative to the US)
bull Telco gigabit fiber to the home deployment programs
bull Cable MSOs deploying DOCSIS 31
bull Upcoming - 5G wireless and fiber backhaul
bull Ongoing 4G wireless network optimization
bull Federal government infrastructure initiatives generally positive
Canada
bull Significantly behind North America in both wireline and wireless connectivity
bull However demand for connectivity media and data intensive services is strong
bull Fiber and backhaul networks significantly behind North America
bull Primarily 3G wireless some 4G wireless (country dependent)
bull Various governments have infrastructure expansion initiatives
bull Concession and P3 opportunities
bull Connectivity for quality of life social and commercial reasons
Latin America
Telecom Infrastructure Services Overview
Fiber Builds
Wireless Deployment
Make Ready Services
Civil Construction
Engineering Design
Material Management
EPC
Wireless Wireline
United StatesWireless Wireline
CanadaWireless Wireline
Latin America
Comprehensive Infrastructure Solutions Offered On A Turnkey Discrete Service or EPC Basis
bull Proven greenfield expansion model in Latin America ndash US should be less difficult
Leverage existing US field operations people equipment and property
bull Select strategic acquisitions may play a role but NOT a roll-up approach
Provide wireline and wireless services - heavier on wireline
bull Increasing convergence of wireless and wireline due fiber requirements of both
Project centric nimble approach versus MSA focused EPC services to differentiate
bull Less capital intensive with better margin opportunity
GOAL
STRATEGY
STRATEGY
STRATEGY
STRATEGY
To be the leading communications infrastructure contractor in the markets we serve
Engineer Procure Construct (EPC) Is A Differentiator
bull Quanta has a long history in the EPC business and is increasingly performing select projects on an EPC basisbull Customersrsquo capital programs are at historic levels and growing Projects are getting larger and more complexbull Evolution of regulatory demands competition and alternative pricing models
bull Many customers have limited internal resources and expertise to manage these dynamics and are turning to Quanta for solutions
bull Project cost certainty becoming increasingly important
bull We are enhancing initiatives to ensure we have a scalable comprehensive enterprise-wide capability for EPC projects that is consistently executed across all segments and geographies
bull EPC projects are a meaningful contributor to our current backlog and provide significant opportunity for future growth
Integrated Services
Construction amp Installation
Assessment Planning amp
Development
Engineering amp Design
Procurement Operation and Maintenance
What is Infrastructure Solutions
Infrastructure Solutions represent strategic partnerships with customers and capital partners
bull Public private partnerships (P3)bull Concessionsbull Build Own Operate or Transfer
(BOOT)bull Build to Suit (BTS) arrangements
These solutions are a growth engine for each of our segments and geographies and a core component of our strategic
imperative to deliver differentiated solutions to our customers
Encompasses
Infrastructure Solutions Drivers
A Combination of Drivers are Occurring that Create Demand and Opportunity for Our Infrastructure Solutions
bull Provide transparency to a project shape design constructability risk allocation and overall project structure
bull Manages risk that yields more informed EPC project decisions
bull Improves success rate of both winning the engagement and successful execution
bull Where appropriate we invest alongside our partners
bull Significant capital needs to fund the substantial infrastructure needs
bull Utilization of concessions public private partnerships (P3) and private infrastructure partnerships to fund and attract high-quality entities for complex projects
bull Changes in regulation (such as FERC Order 1000)
bull New entrants together with high interest and availability of investor infrastructure investment capital
Quanta Is A True Partner
bull Quanta increasingly sought as a partner for our execution capabilities the need for price certainty and our financial strength
bull Projects are larger more complex greater scope Typically under lump-sum turnkey arrangements which create greater opportunities and risks for Quanta
bull Successful Infrastructure Solutions and project execution track record
Quanta Sought for Executionamp Track Record
Market Structure amp Projects Getting More Complex
29
Fully Integrated Solutions Based Provider
Infrastructure Solutions Provides A Solutions Based Tool for Quanta to Partner with Customers Enhance Relationships and Create New Customer and Project Opportunities
EPC
Capitalbull Determine capital structurebull Source capitalbull Quanta minority direct
investmentbull First Infrastructure Capital
Advisors
PartnershipsPartner withbull Customersbull Equity Capital
(4) Includes $802 million of expense net of tax or $036 per diluted share from an arbitration decision charge to provision for long-term contract receivable and the benefit associated with release of certain income tax contingencies
2013 2014 2015 2016 2017 Est
($ in millions)Revenue
$140$122
$062
$126
$163
2013 2014 2015 2016 2017Est
(4)
(5)
(6)
Electric Power Oil amp Gas Infrastructure
GAAP Diluted EPS (1)
$156
$185
$111
$151
$195
2013 2014 2015 2016 2017Est
Adjusted Diluted EPS (1)
$6412
(2) Represents the midpoint of guidance range
(2)
$7747
(2) (2) $173
(3) Includes $033 gain from sale of Howard Energy investment
$9300(3)
(1) From continuing operations
$7572
(5) Includes $734 million of project losses Also includes $454 million of expense net of tax or $023 per diluted share from net asset impairment charges
$7651
(6) Includes $548 million of project losses and $71 million of expense net of tax or $005 per diluted share from net asset impairment charges Also includes tax benefits of $205 million or $013 per share associated with the expiration of various federal and state tax statute of limitations periods
Recent Financial Performance amp 2017 ExpectationsFor the Years Ended December 31
($ in millions)Electric Power
$4542
$5303$4937 $4850
115107
7583
2013 2014 2015 2016 2017 Est
Revenue Op Margin
(2)
(1) Operating margin excludes a $1025 million charge to cost of services for long-term contract receivable in 2014 Refer to appendix for non-GAAP reconciliation(2) Excludes a $66 million property and equipment impairment charge Includes the impact of $661 million of project losses Refer to appendix for non-GAAP reconciliation(3) Excludes a $57 million asset impairment charge Includes the impact of $548 million of project losses Refer to appendix for non-GAAP reconciliation
(1) (1)
(2)(3)
f Est revenue growth approaching 15 vs 2016
Est operating incomemargins of 90 to 95
Guidance Commentary($ in millions)
Oil amp Gas Infrastructure
(4) Excludes a $388 million expense associated with an arbitration decision Refer to appendix for non-GAAP reconciliation(5) Includes $73 million of project losses
Liquidity includes cash and cash equivalents and availability under our revolving credit facility as described in our Form 10k
Historical Cash Flow Generation
$163
$15
$434
$191
2013 2014 2015 2016
Cash Flow from Continuing Operations
($ in millions)
Free Cash Flow from Continuing Operations
$371
$248
$618
$381
2013 2014 2015 2016
Net cash provided by operating activities from continuing operations plus proceeds from sale of property and equipment less additions of property and equipment
For the Years Ending December 31($ in millions)
For the Years Ending December 31
Committed to Generating Shareholder Value
Executed on $125 Billion Share Repurchase Authorizationbull Aug 2015 ndash Announced a new $125 billion share repurchase
authorization through Feb 28 2017bull Completed a $750 million accelerated stock repurchase (ASR)
arrangement in April 2016bull Acquired 351 million shares at $2136 per share
bull $500 million for opportunistic repurchases through Feb 28 2017bull $450 million 192 million shares retired
Completed $500 Million Share Repurchase Authorizationbull Completed previous $500 million share repurchase program in 2015bull Acquired approximately 174 million shares for total cost of $500
million
Acquired $17 Billion of Quanta Common Stock
Under Previous Programs Quanta Has Acquired Approximately 32 of Its Outstanding Stock
$2197$1951
$1573 $1573
0
25
50
75
100
125
150
175
200
225
$0000
$500000
$1000000
$1500000
$2000000
$2500000
$3000000
2014 2015 2016 2017E
Net Income Required to Generate $001 In EPS
Avg Dil Shs Out
Earnings Power Improvement
$ in
Tho
usan
ds
Shares in Millions
May 25 2017 ndash Announced New $300 Million Share Repurchase Authorizationbull Up to $300 million through June 30 2020
Opportunistic amp Disciplined Capital Allocation
Capital Deployment Preference (Amounts in millions)
bull Working Capitalbull Capital Expendituresbull Acquisitionsbull Investmentsbull Return of Capital
bull Generally in sync with preference however hellip
bull Financial strength provides the ability to be opportunistic
bull Flexible and strategic capital allocation is a competitive advantage
Capital Deployment Posture
Financial Strength Allows for Flexible and Strategic Capital Allocation ndash A Competitive Advantage
2013 ndash 2016 Sources amp Uses of Cash
Sources
Cash Flow fromOperations
DivestitureProceeds
BorrowingsInvestment Sales
$3099
$1667
$842
$369$221
Uses
StockRepurchase
CAPEX amp OtherNet
Acquisitions Net
Investments
$1700
$900
$728
$54$3382
54
27
127
50
27
21
2
Amounts reflect the retrospective application of a recent accounting pronouncement related to the classification of tax withholding payments for share-based compensation
Foundation For Growth amp Improved Profitability
Multi-Year Growth Opportunities
Innovative Industry Leading Solutions
Scale amp Scope
Financial Strength
Operational amp Safety Excellence
QuantaServicesIR
QuantaIR
Connect With Quanta Services Investor Relations
Corporate Office2800 Post Oak Blvd Suite 2600Houston TX 77056713-629-7600wwwquantaservicescom
Investor ContactKip Rupp CFAVice President ndash Investor Relations713-341-7260investorsquantaservicescom
Reconciliation of Adjusted Net Income from Continuing Operations Attributable to Common Stock
2013 2014 2015 2016 2017 2017Reconciliation of adjusted net income from continuing operations attributable to common stockNet income from continuing operations attributable to common stock (GAAP as reported) 372057$ 269224$ 120286$ 198725$ 247000$ 275300$ Adjustments
Asset impairment charges - - 58451 7964 - -Severance and restructuring charges - - - 6352 - -Acquisition and integration costs 8145 14754 7966 3053 9300 9300 Impact of income tax contingency releases (9935) (8099) - (20488) - -Impact of tax benefit from realization of previously unrecognized deferred tax asset - - (4228) - - -Impact of Alberta tax law change - - 4982 - - -Provision for long-term contract receivable - 102460 - - - -Arbitration expense - 38848 - - - -Impact of sale of equity ownership in Howard Energy (112744) - - - - -Income tax impact of adjustments 39836 (55935) (16186) (3982) (3400) (3400)
Adjusted net income from continuing operations attributable to common stock before certain non-cash adjustments 297359 361252 171271 191624 252900 281200
Non-cash stock based compensation 34381 37449 36939 41134 47000 47000 Amortization of intangible assets 25865 34257 34848 31685 30600 30600 Income tax impact of non-cash adjustments (22715) (26453) (25817) (26183) (28500) (28500)
Adjusted net income from continuing operations attributable to common stock 334890$ 406505$ 217241$ 238260$ 302000$ 330300$ Weighted average sharesWeighted average shares outstanding for diluted earnings per share 214978 219690 195120 157288 157300 157300 Weighted average shares outstanding for adjusted diluted earnings per share 214978 219690 195120 157288 157300 157300 Diluted earnings per share from continuing operations attributable to common stock and adjusted diluted earnings per share from continuing operations attributable to common stockDiluted earnings per share from continuing operations attributable to common stock 173$ 123$ 062$ 126$ 157$ 175$ Adjusted diluted earnings per share from continuing operations attributable to common stock 156$ 185$ 111$ 151$ 192$ 210$
Estimated Guidance Range
For the Years Ended December 31
(in thousands except per share information)(Unaudited)
Recast of Adjusted Diluted
Reconciliation of Electric Power and Oil amp Gas Infrastructure Services Segments Operating Income As Adjusted
Amounts in millions except percentagesOil amp Gas
Infrastructure12312014 12312015 12312016 12312014
Revenues 53027$ 49373$ 48505$ 24446$
Operating Income (as reported) 4630 3623 3957 1628
Addback Provisions for long term contract receivable 1025 - - - Arbitration expense - - - 388 Asset impairment charge - 66 57 -
Operating Income (as adjusted) 5655$ 3689$ 4014$ 2016$
Operating income margin (as reported) 87 73 82 67Operating income margin (as adjusted) 107 75 83 83
Electric Power
Sheet1
Reconciliation of Free Cash Flow
2013 2014 2015 2016Net Cash Provided by Operating Activities of Continuing Operations 370558 247742 618183 381176 Less Net Capital ExpendituresAdditions of Property and Equipment (221946) (247216) (209968) (212555) Proceeds from Sale of Property and Equipment 14789 14448 26178 21975 Net Capital Expenditures (207157) (232768) (183790) (190580)
Free Cash Flow 163401 14974 434393 190596
Free Cash Flow from Cont Ops
Forward Looking Statement DisclaimerThis presentation (and oral statements regarding the subject matter of this presentation) includes ldquoforward-looking statementsrdquo intended to qualify for the safe harbor from liability established by the Private Securities Litigation Reform Act of 1995 These statements reflect assumptions expectations projections intentions or beliefs about future events and use words such as anticipate estimate project forecast may will should could expect believe plan intend and other words of similar meaning You can identify these statements by the fact that they do not relate strictly to historical or current facts In particular these include but are not limited to statements relating to the following
bull Projected revenues net income earnings per share attributable to common stock backlog margins capital expenditures weighted average shares outstanding tax rates and other projections of operating or financial resultsbull Our business or financial outlook growth or opportunities in particular marketsbull The potential benefits from acquisitions and investmentsbull The expected financial and operational performance of acquired businessesbull Future capital allocation initiativesbull Our ability to deliver increased value and return capital to stockholders bull The strategic use of our balance sheetbull The expected value of contracts or intended contracts with customersbull The scope services term and results of any projects awarded or expected to be awarded for services to be provided by usbull The anticipated commencement and completion dates for any projects awardedbull The development of larger electric transmission and oil and natural gas pipeline projects and the level of oil natural gas and natural gas liquids prices and their impact on our business or the demand for our services bull The impact of existing or potential energy legislation bull Potential opportunities that may be indicated by bidding activity or discussions with customersbull The expected outcome of pending or threatened litigation bull Beliefs and assumptions about the collectability of receivablesbull The business plans or financial condition of our customersbull Our plans and strategies bull The current economic and regulatory conditions and trends in the industries we serve bull Possible recovery on pending or contemplated change orders or affirmative claims against customers or third parties and bull Other statements reflecting expectations intentions assumptions or beliefs about future events and other statements that do not relate strictly to historical or current facts
Although our management believes that the expectations reflected in such forward-looking statements are reasonable it can give no assurance that such expectations will prove to be correct These forward-looking statements are not guarantees of future performance and involve or rely on a number of risks uncertainties and assumptions that are difficult to predict or beyond our control These forward-looking statements reflect our beliefs and assumptions based on information available to our management at the time the statements are made We caution you that actual outcomes and results may differ materially from what is expressed implied or forecasted by our forward-looking statements and that any or all of our forward-looking statements may turn out to be wrong Forward-looking statements can be affected by inaccurate assumptions and by known or unknown risks and uncertainties including the following
bull Market conditionsbull The effects of industry economic financial or political conditions outside our control including weakness in capital marketsbull Quarterly variations in our operating resultsbull Trends and growth opportunities in relevant marketsbull The cost of borrowing availability of credit and cash fluctuations in the price and volume of our common stock debt covenant compliance interest rate fluctuations and other factors affecting our financing and investing activitiesbull Delays reductions in scope or cancellations of anticipated pending or existing projects including as a result of weather regulatory or permitting issues environmental processes project performance issues claimed force majeure events or our customers capital
constraintsbull The successful negotiation execution performance and completion of anticipated pending and existing contracts including the ability to obtain awards of projects on which we bid or are otherwise discussing with customersbull Our ability to retain key personnel and qualified employees
Forward Looking Statement Disclaimerbull Our ability to attract or the potential shortage of skilled labor bull Our dependence on fixed price contracts and the potential to incur losses with respect to the contractsbull Estimates relating to our use of percentage-of-completion accountingbull Adverse weatherbull Our ability to generate internal growthbull Competition in our business including our ability to effectively compete for new projects and market sharebull The effect of natural gas natural gas liquids and oil prices on our operations and growth opportunities and on
our customersrsquo capital programs and demand for our servicesbull The future development of natural resourcesbull The failure of existing or potential legislative actions to result in demand for our servicesbull Liabilities associated with multiemployer pension plans including underfunding of liabilities and termination
or withdrawal liabilitiesbull The possibility of further increases in the liability associated with our withdrawal from a multiemployer
pension planbull Unexpected costs or liabilities that may arise from pending or threatened litigation indemnity obligations or
other claims asserted against us including liabilities for claims that are self-insured or uninsuredbull The outcome of pending or threatened litigationbull Risks relating to the potential unavailability or cancellation of third party insurance the exclusion of coverage
for certain losses and potential increases in premiums for coverage deemed beneficial to usbull Cancellation provisions within our contracts and the risk that contracts expire and are not renewed or are
replaced on less favorable termsbull Loss of customers with whom we have long-standing or significant relationshipsbull The potential that participation in joint ventures or similar structures exposes us to liability andor harm to
our reputation for acts or omissions by our partnersbull Our inability or failure to comply with the terms of our contracts which may result in additional costs
unexcused delays warranty claims failure to meet performance guarantees damages or contract terminations
bull The inability or refusal of our customers to pay for services including the failure to collect outstanding receivables
bull The failure to recover on payment claims against project owners or third party contractors or to obtain adequate compensation for customer-requested change orders
bull The failure of our customers to comply with regulatory requirements applicable to their projects which may result in project delays and cancellations
bull Budgetary or other constraints that may reduce or eliminate tax incentives or government funding for projects which may result in project delays or cancellations
bull Estimates and assumptions in determining our financial results and backlogbull Our ability to realize our backlogbull Risks associated with operating in international markets including instability of foreign governments
currency fluctuations tax and investment strategies as well as compliance with foreign legal systems and cultural practices the US Foreign Corrupt Practices Act and other applicable anti-bribery and anti-corruption laws
bull Our ability to successfully identify complete integrate and realize synergies from acquisitionsbull The potential adverse impact resulting from uncertainty surrounding investments and acquisitions including
the ability to retain key personnel from the acquired businesses and the potential increase in risks already existing in our operations
bull The adverse impact of impairments of goodwill receivables property equipment and other intangible assets or investments
bull Our growth outpacing our decentralized management and infrastructurebull Requirements relating to governmental regulation and changes theretobull Inability to enforce our intellectual property rights or the obsolescence of such rightsbull Risks related to the implementation of an information technology solutionbull The impact of our unionized workforce on our operations including labor stoppages or interruptions due to
strikes or lockoutsbull Potential liabilities and other adverse effects arising from occupational health and safety mattersbull Our dependence on suppliers subcontractors equipment manufacturers and other third party contractorsbull Fluctuations of prices of certain materials used in our businessbull The ability to access sufficient funding to finance desired growth and operationsbull Our ability to obtain performance bondsbull Potential exposure to environmental liabilitiesbull Our ability to continue to meet certain requirements applicable to us and our subsidiariesbull Rapid technological and other structural changes that could reduce the demand for our servicesbull New or changed tax laws treaties or regulationsbull Increased healthcare costs arising from healthcare reform legislation or other governmental actionbull Regulatory changes that result in increased labor costsbull Significant fluctuations in foreign currency exchange rates andbull The other risks and uncertainties as are described elsewhere herein and in our Annual Report on Form 10-K for
the year ended December 31 2016 filed with the SEC and as may be detailed from time to time in our other public filings with the SEC
All of our forward-looking statements whether written or oral are expressly qualified by these cautionary statements and any other cautionary statements that may accompany such forward-looking statements or that are otherwise included in this presentation Should one or more of these risks materialize or should underlying assumptions prove incorrect actual results may vary materially from those expressed or implied in any forward-looking statements Investors are cautioned not to place undue reliance on these forward-looking statements which are current only as of this date We do not undertake and expressly disclaim any obligation to update or revise any forward-looking statements to reflect events or circumstances after the date of this presentation or otherwise and we expressly disclaim any written or oral statements made by any third party regarding the subject matter of this presentation
Slide Number 1
Forward Looking Statement Disclaimer
Key Takeaways
Leading Integrated Infrastructure Solutions Provider
Overview ndash Strategically Focused Operationally Diverse
Overview - Diverse and High Quality Customer Base
Leading Integrated Infrastructure Solutions Provider
Strategic Imperatives
Strategic Imperatives Deliver Profitable Growth
Strategic Acquisitions Criteria and Rationale
Differentiated Competitive Position ndash In the Sweet Spot
Differentiated Competitive Position ndash In the Sweet Spot
Electric Power Infrastructure Services Segment Overview
Power Grid Investment Drivers - Transmission
Power Grid Investment Drivers - Transmission
Power Grid Investment Drivers - Distribution
Oil amp Gas Infrastructure Services Segment Overview
Reconciliation of Adjusted Net Income from Continuing Operations Attributable to Common Stock
Reconciliation of Electric Power and Oil amp Gas Infrastructure Services Segments Operating Income As Adjusted
Reconciliation of Free Cash Flow
Forward Looking Statement Disclaimer
Forward Looking Statement Disclaimer
Free Cash Flow From Continuing Operations
Source
2013
2014
2015
2016
(Support Cash Flow Statement)
Net Cash Provided by Operating Activities of Continuing Operations
370558
247742
618183
381176
(Support Cash Flow Statement)
Less Net Capital Expenditures
(Support Cash Flow Statement)
Additions of Property and Equipment
(221946)
(247216)
(209968)
(212555)
(Support Cash Flow Statement)
Proceeds from Sale of Property and Equipment
14789
14448
26178
21975
(Recalculation)
Net Capital Expenditures
(207157)
(232768)
(183790)
(190580)
(Recalculation)
Free Cash Flow
163401
14974
434393
190596
Adjusted Operating Income Margin
$ in millions
Support for slide 23
Amounts in millions except percentages
Electric Power
Oil amp Gas Infrastructure
123114
123115
123116
123114
Revenues
$ 53027
$ 49373
$ 48505
$ 24446
Operating Income (as reported)
4630
3623
3957
1628
Addback
Provisions for long term contract receivable
1025
-0
-0
-0
Arbitration expense
-0
-0
-0
388
Asset impairment charge
-0
66
57
-0
Operating Income (as adjusted)
$ 5655
$ 3689
$ 4014
$ 2016
Operating income margin (as reported)
87
73
82
67
Operating income margin (as adjusted)
107
75
83
83
Quanta Services Inc and Subsidiaries
Reconciliation of Non-GAAP Financial Measures
Adjusted Diluted Earnings Per Share from Continuing Operations
For the Years Ended December 31
(in thousands except per share information)
(Unaudited)
Estimated Guidance Range
2013
2014
2015
2016
2017
2017
Reconciliation of adjusted net income from continuing operations attributable to common stock
Net income from continuing operations attributable to common stock (GAAP as reported)
$ 372057
$ 269224
$ 120286
$ 198725
$ 247000
$ 275300
Adjustments
Asset impairment charges
-
-
58451
7964
-
-
Severance and restructuring charges
-
-
-
6352
-
-
Acquisition and integration costs
8145
14754
7966
3053
9300
9300
Impact of income tax contingency releases
(9935)
(8099)
-
(20488)
-
-
Impact of tax benefit from realization of previously unrecognized deferred tax asset
-
-
(4228)
-
-
-
Impact of Alberta tax law change
-
-
4982
-
-
-
Provision for long-term contract receivable
-
102460
-
-
-
-
Arbitration expense
-
38848
-
-
-
-
Impact of sale of equity ownership in Howard Energy
(112744)
-
-
-
-
-
Income tax impact of adjustments
39836
(55935)
(16186)
(3982)
(3400)
(3400)
Adjusted net income from continuing operations attributable to common stock before certain non-cash adjustments
297359
361252
171271
191624
252900
281200
Non-cash stock based compensation
34381
37449
36939
41134
47000
47000
Amortization of intangible assets
25865
34257
34848
31685
30600
30600
Income tax impact of non-cash adjustments
(22715)
(26453)
(25817)
(26183)
(28500)
(28500)
Adjusted net income from continuing operations attributable to common stock
$ 334890
$ 406505
$ 217241
$ 238260
$ 302000
$ 330300
Weighted average shares
Weighted average shares outstanding for diluted earnings per share
214978
219690
195120
157288
157300
157300
Weighted average shares outstanding for adjusted diluted earnings per share
214978
219690
195120
157288
157300
157300
Diluted earnings per share from continuing operations attributable to common stock and adjusted diluted earnings per share from continuing operations attributable to common stock
Diluted earnings per share from continuing operations attributable to common stock
$ 173
$ 123
$ 062
$ 126
$ 157
$ 175
Adjusted diluted earnings per share from continuing operations attributable to common stock
$ 156
$ 185
$ 111
$ 151
$ 192
$ 210
2017 Forecast
2008
2009
2010
2011
2012
2013
2014
2015
2016
2017
2018
2019
2020
2021
2022
US IOU
17599783395
17375430450
17116821481
17473265629
19719353886
18593206538
21049378470
23210018195
24651006483
28003750000
29530700000
30481300000
30509750000
31231850000
31138000000
Co-ops
3679033739
3613552751
2806195753
3044502916
2639012201
3360515403
3050612075
2834000972
3277074511
3309845256
3342943708
3376373145
3410136877
3444238245
3478680628
MuniGovt Owned
2525145025
2693819865
2624788344
2608815562
2682098477
2938725525
3183015391
3330273309
3454862656
3664198000
3769427295
3778921940
3483677493
3817389338
3817389338
Canadian
3324942988
3202431553
3726264949
4213182949
4228837570
4323705834
4106960884
3465854177
3159852215
3254697600
3381315300
3453964800
3380277450
3406223700
3406223700
Total NA 2017 Market
27128905147
26885234619
26274070528
27339767056
29269302134
29216153300
31389966819
32840146653
34542795864
38232490856
40024386303
41090559885
40783841819
41899701283
41840293665
From August 2015 Report
North American Electric Distribution Spending
2008
2009
2010
2011
2012
2013
2014
2015
2016
2017
2018
2019
2020
US IOUs
$175
$173
$171
$174
$197
$186
$210
$226
$244
$244
$247
$249
$250
US Co-ops
$27
$29
$27
$29
$35
$41
$34
$39
$40
$40
$41
$42
$42
US Muni
$25
$26
$26
$28
$28
$29
$29
$30
$31
$31
$32
$32
$33
Total US
$226
$227
$224
$231
$260
$256
$273
$295
$314
$316
$320
$323
$325
Canada
$33
$33
$34
$39
$38
$39
$39
$38
$41
$41
$42
$43
$43
Total
$260
$261
$259
$269
$298
$294
$312
$333
$354
$357
$362
$365
$368
15 vs 16
$00
$01
$02
$04
($01)
($04)
$06
$04
$08
$21
$19
$28
$26
From August 2016 Report
North American Electric Distribution Spending
2008
2009
2010
2011
2012
2013
2014
2015
2016
2017
2018
2019
2020
US IOUs
$176
$174
$171
$175
$197
$186
$210
$232
$258
$270
$271
$281
$281
US Co-ops
$27
$29
$27
$29
$31
$33
$38
$39
$40
$41
$41
$42
$43
US Muni
$25
$26
$26
$28
$28
$29
$29
$30
$31
$31
$32
$33
$33
Total US
$228
$229
$224
$232
$256
$248
$277
$301
$329
$342
$344
$356
$357
Canada
$32
$32
$37
$41
$41
$42
$41
$36
$33
$36
$37
$37
$37
Total
$260
$261
$261
$273
$297
$290
$318
$337
$362
$378
$381
$393
$394
From September 2017 Report
North American Electric Distribution Spending
2008
2009
2010
2011
2012
2013
2014
2015
2016
2017
2018
2019
2020
2021
2022
US IOUs
$176
$174
$171
$175
$197
$186
$210
$232
$247
$280
$295
$305
$305
$312
$311
US Co-ops
$37
$36
$28
$30
$26
$34
$31
$28
$33
$33
$33
$34
$34
$34
$35
US Muni
$25
$27
$26
$26
$27
$29
$32
$33
$35
$37
$38
$38
$35
$38
$38
Total US
$238
$237
$225
$231
$250
$249
$273
$294
$314
$350
$366
$376
$374
$385
$384
Canada
$33
$32
$37
$42
$42
$43
$41
$35
$32
$33
$34
$35
$34
$34
$34
Total
$271
$269
$263
$273
$293
$292
$314
$328
$345
$382
$400
$411
$408
$419
$418
2015 vs 2016 vs 2017
2015 Est
2016 Est
2017 Est
Avg 08-11
$262
$264
$269
Avg 12-15
$309
$311
$307
2016
$354
$362
$345
2017
$357
$378
$382
2018
$362
$381
$400
2019
$365
$393
$411
2020
$368
$394
$408
2021
$419
2022
$418
2017
Power Grid Investment Drivers - Distribution
bull Renewed focus on reliability versus costsbull Significant portion of the grid is approaching the end or is beyond its
useful lifebull More stringent reliability standards will require repairing lines and
adding redundant capacitybull System hardening initiatives particularly in areas hard hit by severe
weatherbull Technology innovations will continue to grow A focus on upgrades to
modernize the grid will overlap with spending needed to address aging infrastructure
bull Depending on the proliferation of distributed generation certain systems will require upgrades to accommodate new resources
Source The C Three Group Sept 2017
Billi
ons
Est North American Distribution CapEx
bull Lower ROE versus FERC transmission returnsbull Flat to minimal load growth
bull Economy
bull Energy efficiency initiatives
bull Regulatory and consumer pressures on utilities against rising power bills
bull If utilities face declining demand growth rate pressures could increase This could restrain their ability to spend capital
Oil amp Gas Infrastructure Services Segment Overview
$1870
$2445 $2635 $2801
74 83
54 53
2013 2014 2015 2016Revenue Op Margin
(1) Excludes a $388 million expense associated with an arbitration decision Refer to appendix for non-GAAP reconciliation(2) Includes $73 million of project losses
bull Production of shale natural gas oil and natural gas liquids has grown dramatically and is expected to remain at high levels forthe foreseeable future
bull Much of these resources are in areas that have not been traditional hydrocarbon fuel sources and do not have adequate infrastructure in place to gather store process and transport product
bull Canadian oil production lacks adequate takeaway pipeline infrastructurebull Economics of pipeline transportation is increasingly attractive versus rail in a low oil price environmentbull Pipeline construction capacity is more limited in Canada versus the US and construction capacity constraints could be significant
bull It will take many years and significant energy infrastructure investment to harvest these resources
Shale Gas amp Tight Oil Plays Drive US Natural Gas Production
2000-2040 (trillion cubic feet)
Source EIA Annual Energy Outlook 2017
Tight Oil Drives US Oil Production2000-2040 (millions of barrels per day)
Source EIA Annual Energy Outlook 2015
Canadian Oil Sands amp Conventional Oil Production(Millions of barrels per day)
Source Canadian Assoc of Petroleum Producers
Oil amp Gas Infrastructure Investment Driversbull Need for pipeline and related infrastructure driven by the
significant increase in North American unconventional natural gas and oil production ndash not commodity prices
bull Takeaway pipelines have not been built fast enough to keep pace with hydrocarbon production ndash significant pipeline development needed
bull Large pipeline construction industry capacity is currently tight but could get significantly strained over the next several years
North American Pipeline ForecastProbability Weighted
Quanta Is the Largest Pipeline Construction Company in North America
bull Quanta is the largest pipeline construction company in North America
bull This positions Quanta to provide significant large diameter pipe construction capacity to the industry while remaining active in select shales
bull We are ready to assist our customers in meeting their development goals in what could be a resource challenged environment
North America Major Planned Mainline Project Capex
Source KeyBanc Capital Markets
$0
$5
$10
$15
$20
2016E 2017E 2018E 2019E
In B
illio
ns
In B
illio
ns
Oil amp Gas Infrastructure Investment DriversNatural Gas Distribution amp Pipeline Integritybull US pipeline infrastructure is getting older
bull PHMSA estimates more than 470K miles (37) of US gas distribution mains and 171K miles (57) of gas transmission pipelines were installed before 1970 or in an undocumented year
bull Local Distribution Companies (LDCs) continue increased spend on pipe inspection and replacement
bull Replacement programs ramped up after San Bruno incident in 2010 Utilities are spending $22B a year on transmission and distribution systems(2)
bull Regulations push for expanding inspection programs and accelerating replacement work
bull PHMSA will require more inspection and corrosion control activity which will require additional excavations and integrity work DOErsquos Quadrennial Energy Review emphasizes the need to accelerate pipe replacement to curb emissions from leak-prone pipe
bull Long timelines for some replacement plans will push spend acceleration
bull Current projections are over 20 years for many large utilities a few more than 50 years(3) Replacement activities will have to be accelerated to address risk
bull State regulators establishing cost recovery mechanisms to accelerate replacement programs
Significant Inventory Remains for Replacement
States with Gas Utility Cost Recovery Mechanisms(4)
(1) PHMSA pipe inventory reports 2011-2015(2) AGA 2016 Playbook (3) Department of Energy Quadrennial Energy Review ndash Energy Transmission Storage and Distribution Infrastructure April 2015 (4) American Gas Association Playbook 2017
Stronghold Acquisition Overview
bull Provides catalyst handling turnaround and other downstream services tank storage and other midstream services
bull Specializes in high pressure and high reactor infrastructure services
bull Industry leading safety record employee and training focus with entrepreneurial culture
bull Led by a strong multigenerational highly regarded management team with decades of industry experience
bull Preferred employer with low turnover and high-quality workforce ndash averaging 2800 employees
bull Excellent reputation and strong relationships with a high-quality and diverse client base
bull Strong historical organic growth
21
Stronghold is a leading specialized services company providing high pressure and critical path solutions to the downstream and midstream energy markets
Company Profile
2016 Revenue =Approx $500 Million
Downstream Services
85
Midstream Services
15
Strategic Rationalebull Facilitates capture of a greater portion of energy
industry spend and offers cross-selling opportunities
bull Specialized Industrial Services market is a natural service line expansion for Quanta to meet our customersrsquo needs
bull Complements existing downstream high-voltage power services
bull Stronghold gives Quanta a significant presence in downstream services and a strong platform for growth
bull Strong financial profilebull Attractive historical growth and accretive margin
profile low capex requirements solid cash flow and accretive to earnings
bull Enhances recurring base business revenue
bull Shale oil natural gas and natural gas liquids (NGLs) production driving refinery petrochemical and storage infrastructure needs
Telecom Infrastructure Services Overview
To be an industry leading and true EPC contractor providing comprehensive communications infrastructure solutions to customers in the United States Canada and select markets in Latin America
Goal
Diverse Existing amp Target Customer BaseMarkets Served
Telecom Infrastructure Investment Drivers
bull Telco gigabit fiber to the home deployment programs
bull Cable MSOs deploying DOCSIS 31
bull Upcoming - 5G wireless and fiber backhaul
bull Ongoing 4G wireless network optimization
bull Connect America Fund - rural fiber build-out
bull Federal government funded FirstNet - national wireless network for first responders
United States
bull Backbone and last mile fiber (behind relative to the US)
bull Telco gigabit fiber to the home deployment programs
bull Cable MSOs deploying DOCSIS 31
bull Upcoming - 5G wireless and fiber backhaul
bull Ongoing 4G wireless network optimization
bull Federal government infrastructure initiatives generally positive
Canada
bull Significantly behind North America in both wireline and wireless connectivity
bull However demand for connectivity media and data intensive services is strong
bull Fiber and backhaul networks significantly behind North America
bull Primarily 3G wireless some 4G wireless (country dependent)
bull Various governments have infrastructure expansion initiatives
bull Concession and P3 opportunities
bull Connectivity for quality of life social and commercial reasons
Latin America
Telecom Infrastructure Services Overview
Fiber Builds
Wireless Deployment
Make Ready Services
Civil Construction
Engineering Design
Material Management
EPC
Wireless Wireline
United StatesWireless Wireline
CanadaWireless Wireline
Latin America
Comprehensive Infrastructure Solutions Offered On A Turnkey Discrete Service or EPC Basis
bull Proven greenfield expansion model in Latin America ndash US should be less difficult
Leverage existing US field operations people equipment and property
bull Select strategic acquisitions may play a role but NOT a roll-up approach
Provide wireline and wireless services - heavier on wireline
bull Increasing convergence of wireless and wireline due fiber requirements of both
Project centric nimble approach versus MSA focused EPC services to differentiate
bull Less capital intensive with better margin opportunity
GOAL
STRATEGY
STRATEGY
STRATEGY
STRATEGY
To be the leading communications infrastructure contractor in the markets we serve
Engineer Procure Construct (EPC) Is A Differentiator
bull Quanta has a long history in the EPC business and is increasingly performing select projects on an EPC basisbull Customersrsquo capital programs are at historic levels and growing Projects are getting larger and more complexbull Evolution of regulatory demands competition and alternative pricing models
bull Many customers have limited internal resources and expertise to manage these dynamics and are turning to Quanta for solutions
bull Project cost certainty becoming increasingly important
bull We are enhancing initiatives to ensure we have a scalable comprehensive enterprise-wide capability for EPC projects that is consistently executed across all segments and geographies
bull EPC projects are a meaningful contributor to our current backlog and provide significant opportunity for future growth
Integrated Services
Construction amp Installation
Assessment Planning amp
Development
Engineering amp Design
Procurement Operation and Maintenance
What is Infrastructure Solutions
Infrastructure Solutions represent strategic partnerships with customers and capital partners
bull Public private partnerships (P3)bull Concessionsbull Build Own Operate or Transfer
(BOOT)bull Build to Suit (BTS) arrangements
These solutions are a growth engine for each of our segments and geographies and a core component of our strategic
imperative to deliver differentiated solutions to our customers
Encompasses
Infrastructure Solutions Drivers
A Combination of Drivers are Occurring that Create Demand and Opportunity for Our Infrastructure Solutions
bull Provide transparency to a project shape design constructability risk allocation and overall project structure
bull Manages risk that yields more informed EPC project decisions
bull Improves success rate of both winning the engagement and successful execution
bull Where appropriate we invest alongside our partners
bull Significant capital needs to fund the substantial infrastructure needs
bull Utilization of concessions public private partnerships (P3) and private infrastructure partnerships to fund and attract high-quality entities for complex projects
bull Changes in regulation (such as FERC Order 1000)
bull New entrants together with high interest and availability of investor infrastructure investment capital
Quanta Is A True Partner
bull Quanta increasingly sought as a partner for our execution capabilities the need for price certainty and our financial strength
bull Projects are larger more complex greater scope Typically under lump-sum turnkey arrangements which create greater opportunities and risks for Quanta
bull Successful Infrastructure Solutions and project execution track record
Quanta Sought for Executionamp Track Record
Market Structure amp Projects Getting More Complex
29
Fully Integrated Solutions Based Provider
Infrastructure Solutions Provides A Solutions Based Tool for Quanta to Partner with Customers Enhance Relationships and Create New Customer and Project Opportunities
EPC
Capitalbull Determine capital structurebull Source capitalbull Quanta minority direct
investmentbull First Infrastructure Capital
Advisors
PartnershipsPartner withbull Customersbull Equity Capital
(4) Includes $802 million of expense net of tax or $036 per diluted share from an arbitration decision charge to provision for long-term contract receivable and the benefit associated with release of certain income tax contingencies
2013 2014 2015 2016 2017 Est
($ in millions)Revenue
$140$122
$062
$126
$163
2013 2014 2015 2016 2017Est
(4)
(5)
(6)
Electric Power Oil amp Gas Infrastructure
GAAP Diluted EPS (1)
$156
$185
$111
$151
$195
2013 2014 2015 2016 2017Est
Adjusted Diluted EPS (1)
$6412
(2) Represents the midpoint of guidance range
(2)
$7747
(2) (2) $173
(3) Includes $033 gain from sale of Howard Energy investment
$9300(3)
(1) From continuing operations
$7572
(5) Includes $734 million of project losses Also includes $454 million of expense net of tax or $023 per diluted share from net asset impairment charges
$7651
(6) Includes $548 million of project losses and $71 million of expense net of tax or $005 per diluted share from net asset impairment charges Also includes tax benefits of $205 million or $013 per share associated with the expiration of various federal and state tax statute of limitations periods
Recent Financial Performance amp 2017 ExpectationsFor the Years Ended December 31
($ in millions)Electric Power
$4542
$5303$4937 $4850
115107
7583
2013 2014 2015 2016 2017 Est
Revenue Op Margin
(2)
(1) Operating margin excludes a $1025 million charge to cost of services for long-term contract receivable in 2014 Refer to appendix for non-GAAP reconciliation(2) Excludes a $66 million property and equipment impairment charge Includes the impact of $661 million of project losses Refer to appendix for non-GAAP reconciliation(3) Excludes a $57 million asset impairment charge Includes the impact of $548 million of project losses Refer to appendix for non-GAAP reconciliation
(1) (1)
(2)(3)
f Est revenue growth approaching 15 vs 2016
Est operating incomemargins of 90 to 95
Guidance Commentary($ in millions)
Oil amp Gas Infrastructure
(4) Excludes a $388 million expense associated with an arbitration decision Refer to appendix for non-GAAP reconciliation(5) Includes $73 million of project losses
Liquidity includes cash and cash equivalents and availability under our revolving credit facility as described in our Form 10k
Historical Cash Flow Generation
$163
$15
$434
$191
2013 2014 2015 2016
Cash Flow from Continuing Operations
($ in millions)
Free Cash Flow from Continuing Operations
$371
$248
$618
$381
2013 2014 2015 2016
Net cash provided by operating activities from continuing operations plus proceeds from sale of property and equipment less additions of property and equipment
For the Years Ending December 31($ in millions)
For the Years Ending December 31
Committed to Generating Shareholder Value
Executed on $125 Billion Share Repurchase Authorizationbull Aug 2015 ndash Announced a new $125 billion share repurchase
authorization through Feb 28 2017bull Completed a $750 million accelerated stock repurchase (ASR)
arrangement in April 2016bull Acquired 351 million shares at $2136 per share
bull $500 million for opportunistic repurchases through Feb 28 2017bull $450 million 192 million shares retired
Completed $500 Million Share Repurchase Authorizationbull Completed previous $500 million share repurchase program in 2015bull Acquired approximately 174 million shares for total cost of $500
million
Acquired $17 Billion of Quanta Common Stock
Under Previous Programs Quanta Has Acquired Approximately 32 of Its Outstanding Stock
$2197$1951
$1573 $1573
0
25
50
75
100
125
150
175
200
225
$0000
$500000
$1000000
$1500000
$2000000
$2500000
$3000000
2014 2015 2016 2017E
Net Income Required to Generate $001 In EPS
Avg Dil Shs Out
Earnings Power Improvement
$ in
Tho
usan
ds
Shares in Millions
May 25 2017 ndash Announced New $300 Million Share Repurchase Authorizationbull Up to $300 million through June 30 2020
Opportunistic amp Disciplined Capital Allocation
Capital Deployment Preference (Amounts in millions)
bull Working Capitalbull Capital Expendituresbull Acquisitionsbull Investmentsbull Return of Capital
bull Generally in sync with preference however hellip
bull Financial strength provides the ability to be opportunistic
bull Flexible and strategic capital allocation is a competitive advantage
Capital Deployment Posture
Financial Strength Allows for Flexible and Strategic Capital Allocation ndash A Competitive Advantage
2013 ndash 2016 Sources amp Uses of Cash
Sources
Cash Flow fromOperations
DivestitureProceeds
BorrowingsInvestment Sales
$3099
$1667
$842
$369$221
Uses
StockRepurchase
CAPEX amp OtherNet
Acquisitions Net
Investments
$1700
$900
$728
$54$3382
54
27
127
50
27
21
2
Amounts reflect the retrospective application of a recent accounting pronouncement related to the classification of tax withholding payments for share-based compensation
Foundation For Growth amp Improved Profitability
Multi-Year Growth Opportunities
Innovative Industry Leading Solutions
Scale amp Scope
Financial Strength
Operational amp Safety Excellence
QuantaServicesIR
QuantaIR
Connect With Quanta Services Investor Relations
Corporate Office2800 Post Oak Blvd Suite 2600Houston TX 77056713-629-7600wwwquantaservicescom
Investor ContactKip Rupp CFAVice President ndash Investor Relations713-341-7260investorsquantaservicescom
Reconciliation of Adjusted Net Income from Continuing Operations Attributable to Common Stock
2013 2014 2015 2016 2017 2017Reconciliation of adjusted net income from continuing operations attributable to common stockNet income from continuing operations attributable to common stock (GAAP as reported) 372057$ 269224$ 120286$ 198725$ 247000$ 275300$ Adjustments
Asset impairment charges - - 58451 7964 - -Severance and restructuring charges - - - 6352 - -Acquisition and integration costs 8145 14754 7966 3053 9300 9300 Impact of income tax contingency releases (9935) (8099) - (20488) - -Impact of tax benefit from realization of previously unrecognized deferred tax asset - - (4228) - - -Impact of Alberta tax law change - - 4982 - - -Provision for long-term contract receivable - 102460 - - - -Arbitration expense - 38848 - - - -Impact of sale of equity ownership in Howard Energy (112744) - - - - -Income tax impact of adjustments 39836 (55935) (16186) (3982) (3400) (3400)
Adjusted net income from continuing operations attributable to common stock before certain non-cash adjustments 297359 361252 171271 191624 252900 281200
Non-cash stock based compensation 34381 37449 36939 41134 47000 47000 Amortization of intangible assets 25865 34257 34848 31685 30600 30600 Income tax impact of non-cash adjustments (22715) (26453) (25817) (26183) (28500) (28500)
Adjusted net income from continuing operations attributable to common stock 334890$ 406505$ 217241$ 238260$ 302000$ 330300$ Weighted average sharesWeighted average shares outstanding for diluted earnings per share 214978 219690 195120 157288 157300 157300 Weighted average shares outstanding for adjusted diluted earnings per share 214978 219690 195120 157288 157300 157300 Diluted earnings per share from continuing operations attributable to common stock and adjusted diluted earnings per share from continuing operations attributable to common stockDiluted earnings per share from continuing operations attributable to common stock 173$ 123$ 062$ 126$ 157$ 175$ Adjusted diluted earnings per share from continuing operations attributable to common stock 156$ 185$ 111$ 151$ 192$ 210$
Estimated Guidance Range
For the Years Ended December 31
(in thousands except per share information)(Unaudited)
Recast of Adjusted Diluted
Reconciliation of Electric Power and Oil amp Gas Infrastructure Services Segments Operating Income As Adjusted
Amounts in millions except percentagesOil amp Gas
Infrastructure12312014 12312015 12312016 12312014
Revenues 53027$ 49373$ 48505$ 24446$
Operating Income (as reported) 4630 3623 3957 1628
Addback Provisions for long term contract receivable 1025 - - - Arbitration expense - - - 388 Asset impairment charge - 66 57 -
Operating Income (as adjusted) 5655$ 3689$ 4014$ 2016$
Operating income margin (as reported) 87 73 82 67Operating income margin (as adjusted) 107 75 83 83
Electric Power
Sheet1
Reconciliation of Free Cash Flow
2013 2014 2015 2016Net Cash Provided by Operating Activities of Continuing Operations 370558 247742 618183 381176 Less Net Capital ExpendituresAdditions of Property and Equipment (221946) (247216) (209968) (212555) Proceeds from Sale of Property and Equipment 14789 14448 26178 21975 Net Capital Expenditures (207157) (232768) (183790) (190580)
Free Cash Flow 163401 14974 434393 190596
Free Cash Flow from Cont Ops
Forward Looking Statement DisclaimerThis presentation (and oral statements regarding the subject matter of this presentation) includes ldquoforward-looking statementsrdquo intended to qualify for the safe harbor from liability established by the Private Securities Litigation Reform Act of 1995 These statements reflect assumptions expectations projections intentions or beliefs about future events and use words such as anticipate estimate project forecast may will should could expect believe plan intend and other words of similar meaning You can identify these statements by the fact that they do not relate strictly to historical or current facts In particular these include but are not limited to statements relating to the following
bull Projected revenues net income earnings per share attributable to common stock backlog margins capital expenditures weighted average shares outstanding tax rates and other projections of operating or financial resultsbull Our business or financial outlook growth or opportunities in particular marketsbull The potential benefits from acquisitions and investmentsbull The expected financial and operational performance of acquired businessesbull Future capital allocation initiativesbull Our ability to deliver increased value and return capital to stockholders bull The strategic use of our balance sheetbull The expected value of contracts or intended contracts with customersbull The scope services term and results of any projects awarded or expected to be awarded for services to be provided by usbull The anticipated commencement and completion dates for any projects awardedbull The development of larger electric transmission and oil and natural gas pipeline projects and the level of oil natural gas and natural gas liquids prices and their impact on our business or the demand for our services bull The impact of existing or potential energy legislation bull Potential opportunities that may be indicated by bidding activity or discussions with customersbull The expected outcome of pending or threatened litigation bull Beliefs and assumptions about the collectability of receivablesbull The business plans or financial condition of our customersbull Our plans and strategies bull The current economic and regulatory conditions and trends in the industries we serve bull Possible recovery on pending or contemplated change orders or affirmative claims against customers or third parties and bull Other statements reflecting expectations intentions assumptions or beliefs about future events and other statements that do not relate strictly to historical or current facts
Although our management believes that the expectations reflected in such forward-looking statements are reasonable it can give no assurance that such expectations will prove to be correct These forward-looking statements are not guarantees of future performance and involve or rely on a number of risks uncertainties and assumptions that are difficult to predict or beyond our control These forward-looking statements reflect our beliefs and assumptions based on information available to our management at the time the statements are made We caution you that actual outcomes and results may differ materially from what is expressed implied or forecasted by our forward-looking statements and that any or all of our forward-looking statements may turn out to be wrong Forward-looking statements can be affected by inaccurate assumptions and by known or unknown risks and uncertainties including the following
bull Market conditionsbull The effects of industry economic financial or political conditions outside our control including weakness in capital marketsbull Quarterly variations in our operating resultsbull Trends and growth opportunities in relevant marketsbull The cost of borrowing availability of credit and cash fluctuations in the price and volume of our common stock debt covenant compliance interest rate fluctuations and other factors affecting our financing and investing activitiesbull Delays reductions in scope or cancellations of anticipated pending or existing projects including as a result of weather regulatory or permitting issues environmental processes project performance issues claimed force majeure events or our customers capital
constraintsbull The successful negotiation execution performance and completion of anticipated pending and existing contracts including the ability to obtain awards of projects on which we bid or are otherwise discussing with customersbull Our ability to retain key personnel and qualified employees
Forward Looking Statement Disclaimerbull Our ability to attract or the potential shortage of skilled labor bull Our dependence on fixed price contracts and the potential to incur losses with respect to the contractsbull Estimates relating to our use of percentage-of-completion accountingbull Adverse weatherbull Our ability to generate internal growthbull Competition in our business including our ability to effectively compete for new projects and market sharebull The effect of natural gas natural gas liquids and oil prices on our operations and growth opportunities and on
our customersrsquo capital programs and demand for our servicesbull The future development of natural resourcesbull The failure of existing or potential legislative actions to result in demand for our servicesbull Liabilities associated with multiemployer pension plans including underfunding of liabilities and termination
or withdrawal liabilitiesbull The possibility of further increases in the liability associated with our withdrawal from a multiemployer
pension planbull Unexpected costs or liabilities that may arise from pending or threatened litigation indemnity obligations or
other claims asserted against us including liabilities for claims that are self-insured or uninsuredbull The outcome of pending or threatened litigationbull Risks relating to the potential unavailability or cancellation of third party insurance the exclusion of coverage
for certain losses and potential increases in premiums for coverage deemed beneficial to usbull Cancellation provisions within our contracts and the risk that contracts expire and are not renewed or are
replaced on less favorable termsbull Loss of customers with whom we have long-standing or significant relationshipsbull The potential that participation in joint ventures or similar structures exposes us to liability andor harm to
our reputation for acts or omissions by our partnersbull Our inability or failure to comply with the terms of our contracts which may result in additional costs
unexcused delays warranty claims failure to meet performance guarantees damages or contract terminations
bull The inability or refusal of our customers to pay for services including the failure to collect outstanding receivables
bull The failure to recover on payment claims against project owners or third party contractors or to obtain adequate compensation for customer-requested change orders
bull The failure of our customers to comply with regulatory requirements applicable to their projects which may result in project delays and cancellations
bull Budgetary or other constraints that may reduce or eliminate tax incentives or government funding for projects which may result in project delays or cancellations
bull Estimates and assumptions in determining our financial results and backlogbull Our ability to realize our backlogbull Risks associated with operating in international markets including instability of foreign governments
currency fluctuations tax and investment strategies as well as compliance with foreign legal systems and cultural practices the US Foreign Corrupt Practices Act and other applicable anti-bribery and anti-corruption laws
bull Our ability to successfully identify complete integrate and realize synergies from acquisitionsbull The potential adverse impact resulting from uncertainty surrounding investments and acquisitions including
the ability to retain key personnel from the acquired businesses and the potential increase in risks already existing in our operations
bull The adverse impact of impairments of goodwill receivables property equipment and other intangible assets or investments
bull Our growth outpacing our decentralized management and infrastructurebull Requirements relating to governmental regulation and changes theretobull Inability to enforce our intellectual property rights or the obsolescence of such rightsbull Risks related to the implementation of an information technology solutionbull The impact of our unionized workforce on our operations including labor stoppages or interruptions due to
strikes or lockoutsbull Potential liabilities and other adverse effects arising from occupational health and safety mattersbull Our dependence on suppliers subcontractors equipment manufacturers and other third party contractorsbull Fluctuations of prices of certain materials used in our businessbull The ability to access sufficient funding to finance desired growth and operationsbull Our ability to obtain performance bondsbull Potential exposure to environmental liabilitiesbull Our ability to continue to meet certain requirements applicable to us and our subsidiariesbull Rapid technological and other structural changes that could reduce the demand for our servicesbull New or changed tax laws treaties or regulationsbull Increased healthcare costs arising from healthcare reform legislation or other governmental actionbull Regulatory changes that result in increased labor costsbull Significant fluctuations in foreign currency exchange rates andbull The other risks and uncertainties as are described elsewhere herein and in our Annual Report on Form 10-K for
the year ended December 31 2016 filed with the SEC and as may be detailed from time to time in our other public filings with the SEC
All of our forward-looking statements whether written or oral are expressly qualified by these cautionary statements and any other cautionary statements that may accompany such forward-looking statements or that are otherwise included in this presentation Should one or more of these risks materialize or should underlying assumptions prove incorrect actual results may vary materially from those expressed or implied in any forward-looking statements Investors are cautioned not to place undue reliance on these forward-looking statements which are current only as of this date We do not undertake and expressly disclaim any obligation to update or revise any forward-looking statements to reflect events or circumstances after the date of this presentation or otherwise and we expressly disclaim any written or oral statements made by any third party regarding the subject matter of this presentation
Slide Number 1
Forward Looking Statement Disclaimer
Key Takeaways
Leading Integrated Infrastructure Solutions Provider
Overview ndash Strategically Focused Operationally Diverse
Overview - Diverse and High Quality Customer Base
Leading Integrated Infrastructure Solutions Provider
Strategic Imperatives
Strategic Imperatives Deliver Profitable Growth
Strategic Acquisitions Criteria and Rationale
Differentiated Competitive Position ndash In the Sweet Spot
Differentiated Competitive Position ndash In the Sweet Spot
Electric Power Infrastructure Services Segment Overview
Power Grid Investment Drivers - Transmission
Power Grid Investment Drivers - Transmission
Power Grid Investment Drivers - Distribution
Oil amp Gas Infrastructure Services Segment Overview
Reconciliation of Adjusted Net Income from Continuing Operations Attributable to Common Stock
Reconciliation of Electric Power and Oil amp Gas Infrastructure Services Segments Operating Income As Adjusted
Reconciliation of Free Cash Flow
Forward Looking Statement Disclaimer
Forward Looking Statement Disclaimer
Free Cash Flow From Continuing Operations
Source
2013
2014
2015
2016
(Support Cash Flow Statement)
Net Cash Provided by Operating Activities of Continuing Operations
370558
247742
618183
381176
(Support Cash Flow Statement)
Less Net Capital Expenditures
(Support Cash Flow Statement)
Additions of Property and Equipment
(221946)
(247216)
(209968)
(212555)
(Support Cash Flow Statement)
Proceeds from Sale of Property and Equipment
14789
14448
26178
21975
(Recalculation)
Net Capital Expenditures
(207157)
(232768)
(183790)
(190580)
(Recalculation)
Free Cash Flow
163401
14974
434393
190596
Adjusted Operating Income Margin
$ in millions
Support for slide 23
Amounts in millions except percentages
Electric Power
Oil amp Gas Infrastructure
123114
123115
123116
123114
Revenues
$ 53027
$ 49373
$ 48505
$ 24446
Operating Income (as reported)
4630
3623
3957
1628
Addback
Provisions for long term contract receivable
1025
-0
-0
-0
Arbitration expense
-0
-0
-0
388
Asset impairment charge
-0
66
57
-0
Operating Income (as adjusted)
$ 5655
$ 3689
$ 4014
$ 2016
Operating income margin (as reported)
87
73
82
67
Operating income margin (as adjusted)
107
75
83
83
Quanta Services Inc and Subsidiaries
Reconciliation of Non-GAAP Financial Measures
Adjusted Diluted Earnings Per Share from Continuing Operations
For the Years Ended December 31
(in thousands except per share information)
(Unaudited)
Estimated Guidance Range
2013
2014
2015
2016
2017
2017
Reconciliation of adjusted net income from continuing operations attributable to common stock
Net income from continuing operations attributable to common stock (GAAP as reported)
$ 372057
$ 269224
$ 120286
$ 198725
$ 247000
$ 275300
Adjustments
Asset impairment charges
-
-
58451
7964
-
-
Severance and restructuring charges
-
-
-
6352
-
-
Acquisition and integration costs
8145
14754
7966
3053
9300
9300
Impact of income tax contingency releases
(9935)
(8099)
-
(20488)
-
-
Impact of tax benefit from realization of previously unrecognized deferred tax asset
-
-
(4228)
-
-
-
Impact of Alberta tax law change
-
-
4982
-
-
-
Provision for long-term contract receivable
-
102460
-
-
-
-
Arbitration expense
-
38848
-
-
-
-
Impact of sale of equity ownership in Howard Energy
(112744)
-
-
-
-
-
Income tax impact of adjustments
39836
(55935)
(16186)
(3982)
(3400)
(3400)
Adjusted net income from continuing operations attributable to common stock before certain non-cash adjustments
297359
361252
171271
191624
252900
281200
Non-cash stock based compensation
34381
37449
36939
41134
47000
47000
Amortization of intangible assets
25865
34257
34848
31685
30600
30600
Income tax impact of non-cash adjustments
(22715)
(26453)
(25817)
(26183)
(28500)
(28500)
Adjusted net income from continuing operations attributable to common stock
$ 334890
$ 406505
$ 217241
$ 238260
$ 302000
$ 330300
Weighted average shares
Weighted average shares outstanding for diluted earnings per share
214978
219690
195120
157288
157300
157300
Weighted average shares outstanding for adjusted diluted earnings per share
214978
219690
195120
157288
157300
157300
Diluted earnings per share from continuing operations attributable to common stock and adjusted diluted earnings per share from continuing operations attributable to common stock
Diluted earnings per share from continuing operations attributable to common stock
$ 173
$ 123
$ 062
$ 126
$ 157
$ 175
Adjusted diluted earnings per share from continuing operations attributable to common stock
$ 156
$ 185
$ 111
$ 151
$ 192
$ 210
2017 Forecast
2008
2009
2010
2011
2012
2013
2014
2015
2016
2017
2018
2019
2020
2021
2022
US IOU
17599783395
17375430450
17116821481
17473265629
19719353886
18593206538
21049378470
23210018195
24651006483
28003750000
29530700000
30481300000
30509750000
31231850000
31138000000
Co-ops
3679033739
3613552751
2806195753
3044502916
2639012201
3360515403
3050612075
2834000972
3277074511
3309845256
3342943708
3376373145
3410136877
3444238245
3478680628
MuniGovt Owned
2525145025
2693819865
2624788344
2608815562
2682098477
2938725525
3183015391
3330273309
3454862656
3664198000
3769427295
3778921940
3483677493
3817389338
3817389338
Canadian
3324942988
3202431553
3726264949
4213182949
4228837570
4323705834
4106960884
3465854177
3159852215
3254697600
3381315300
3453964800
3380277450
3406223700
3406223700
Total NA 2017 Market
27128905147
26885234619
26274070528
27339767056
29269302134
29216153300
31389966819
32840146653
34542795864
38232490856
40024386303
41090559885
40783841819
41899701283
41840293665
From August 2015 Report
North American Electric Distribution Spending
2008
2009
2010
2011
2012
2013
2014
2015
2016
2017
2018
2019
2020
US IOUs
$175
$173
$171
$174
$197
$186
$210
$226
$244
$244
$247
$249
$250
US Co-ops
$27
$29
$27
$29
$35
$41
$34
$39
$40
$40
$41
$42
$42
US Muni
$25
$26
$26
$28
$28
$29
$29
$30
$31
$31
$32
$32
$33
Total US
$226
$227
$224
$231
$260
$256
$273
$295
$314
$316
$320
$323
$325
Canada
$33
$33
$34
$39
$38
$39
$39
$38
$41
$41
$42
$43
$43
Total
$260
$261
$259
$269
$298
$294
$312
$333
$354
$357
$362
$365
$368
15 vs 16
$00
$01
$02
$04
($01)
($04)
$06
$04
$08
$21
$19
$28
$26
From August 2016 Report
North American Electric Distribution Spending
2008
2009
2010
2011
2012
2013
2014
2015
2016
2017
2018
2019
2020
US IOUs
$176
$174
$171
$175
$197
$186
$210
$232
$258
$270
$271
$281
$281
US Co-ops
$27
$29
$27
$29
$31
$33
$38
$39
$40
$41
$41
$42
$43
US Muni
$25
$26
$26
$28
$28
$29
$29
$30
$31
$31
$32
$33
$33
Total US
$228
$229
$224
$232
$256
$248
$277
$301
$329
$342
$344
$356
$357
Canada
$32
$32
$37
$41
$41
$42
$41
$36
$33
$36
$37
$37
$37
Total
$260
$261
$261
$273
$297
$290
$318
$337
$362
$378
$381
$393
$394
From September 2017 Report
North American Electric Distribution Spending
2008
2009
2010
2011
2012
2013
2014
2015
2016
2017
2018
2019
2020
2021
2022
US IOUs
$176
$174
$171
$175
$197
$186
$210
$232
$247
$280
$295
$305
$305
$312
$311
US Co-ops
$37
$36
$28
$30
$26
$34
$31
$28
$33
$33
$33
$34
$34
$34
$35
US Muni
$25
$27
$26
$26
$27
$29
$32
$33
$35
$37
$38
$38
$35
$38
$38
Total US
$238
$237
$225
$231
$250
$249
$273
$294
$314
$350
$366
$376
$374
$385
$384
Canada
$33
$32
$37
$42
$42
$43
$41
$35
$32
$33
$34
$35
$34
$34
$34
Total
$271
$269
$263
$273
$293
$292
$314
$328
$345
$382
$400
$411
$408
$419
$418
2015 vs 2016 vs 2017
2015 Est
2016 Est
2017 Est
Avg 08-11
$262
$264
$269
Avg 12-15
$309
$311
$307
2016
$354
$362
$345
2017
$357
$378
$382
2018
$362
$381
$400
2019
$365
$393
$411
2020
$368
$394
$408
2021
$419
2022
$418
2017
Oil amp Gas Infrastructure Services Segment Overview
$1870
$2445 $2635 $2801
74 83
54 53
2013 2014 2015 2016Revenue Op Margin
(1) Excludes a $388 million expense associated with an arbitration decision Refer to appendix for non-GAAP reconciliation(2) Includes $73 million of project losses
bull Production of shale natural gas oil and natural gas liquids has grown dramatically and is expected to remain at high levels forthe foreseeable future
bull Much of these resources are in areas that have not been traditional hydrocarbon fuel sources and do not have adequate infrastructure in place to gather store process and transport product
bull Canadian oil production lacks adequate takeaway pipeline infrastructurebull Economics of pipeline transportation is increasingly attractive versus rail in a low oil price environmentbull Pipeline construction capacity is more limited in Canada versus the US and construction capacity constraints could be significant
bull It will take many years and significant energy infrastructure investment to harvest these resources
Shale Gas amp Tight Oil Plays Drive US Natural Gas Production
2000-2040 (trillion cubic feet)
Source EIA Annual Energy Outlook 2017
Tight Oil Drives US Oil Production2000-2040 (millions of barrels per day)
Source EIA Annual Energy Outlook 2015
Canadian Oil Sands amp Conventional Oil Production(Millions of barrels per day)
Source Canadian Assoc of Petroleum Producers
Oil amp Gas Infrastructure Investment Driversbull Need for pipeline and related infrastructure driven by the
significant increase in North American unconventional natural gas and oil production ndash not commodity prices
bull Takeaway pipelines have not been built fast enough to keep pace with hydrocarbon production ndash significant pipeline development needed
bull Large pipeline construction industry capacity is currently tight but could get significantly strained over the next several years
North American Pipeline ForecastProbability Weighted
Quanta Is the Largest Pipeline Construction Company in North America
bull Quanta is the largest pipeline construction company in North America
bull This positions Quanta to provide significant large diameter pipe construction capacity to the industry while remaining active in select shales
bull We are ready to assist our customers in meeting their development goals in what could be a resource challenged environment
North America Major Planned Mainline Project Capex
Source KeyBanc Capital Markets
$0
$5
$10
$15
$20
2016E 2017E 2018E 2019E
In B
illio
ns
In B
illio
ns
Oil amp Gas Infrastructure Investment DriversNatural Gas Distribution amp Pipeline Integritybull US pipeline infrastructure is getting older
bull PHMSA estimates more than 470K miles (37) of US gas distribution mains and 171K miles (57) of gas transmission pipelines were installed before 1970 or in an undocumented year
bull Local Distribution Companies (LDCs) continue increased spend on pipe inspection and replacement
bull Replacement programs ramped up after San Bruno incident in 2010 Utilities are spending $22B a year on transmission and distribution systems(2)
bull Regulations push for expanding inspection programs and accelerating replacement work
bull PHMSA will require more inspection and corrosion control activity which will require additional excavations and integrity work DOErsquos Quadrennial Energy Review emphasizes the need to accelerate pipe replacement to curb emissions from leak-prone pipe
bull Long timelines for some replacement plans will push spend acceleration
bull Current projections are over 20 years for many large utilities a few more than 50 years(3) Replacement activities will have to be accelerated to address risk
bull State regulators establishing cost recovery mechanisms to accelerate replacement programs
Significant Inventory Remains for Replacement
States with Gas Utility Cost Recovery Mechanisms(4)
(1) PHMSA pipe inventory reports 2011-2015(2) AGA 2016 Playbook (3) Department of Energy Quadrennial Energy Review ndash Energy Transmission Storage and Distribution Infrastructure April 2015 (4) American Gas Association Playbook 2017
Stronghold Acquisition Overview
bull Provides catalyst handling turnaround and other downstream services tank storage and other midstream services
bull Specializes in high pressure and high reactor infrastructure services
bull Industry leading safety record employee and training focus with entrepreneurial culture
bull Led by a strong multigenerational highly regarded management team with decades of industry experience
bull Preferred employer with low turnover and high-quality workforce ndash averaging 2800 employees
bull Excellent reputation and strong relationships with a high-quality and diverse client base
bull Strong historical organic growth
21
Stronghold is a leading specialized services company providing high pressure and critical path solutions to the downstream and midstream energy markets
Company Profile
2016 Revenue =Approx $500 Million
Downstream Services
85
Midstream Services
15
Strategic Rationalebull Facilitates capture of a greater portion of energy
industry spend and offers cross-selling opportunities
bull Specialized Industrial Services market is a natural service line expansion for Quanta to meet our customersrsquo needs
bull Complements existing downstream high-voltage power services
bull Stronghold gives Quanta a significant presence in downstream services and a strong platform for growth
bull Strong financial profilebull Attractive historical growth and accretive margin
profile low capex requirements solid cash flow and accretive to earnings
bull Enhances recurring base business revenue
bull Shale oil natural gas and natural gas liquids (NGLs) production driving refinery petrochemical and storage infrastructure needs
Telecom Infrastructure Services Overview
To be an industry leading and true EPC contractor providing comprehensive communications infrastructure solutions to customers in the United States Canada and select markets in Latin America
Goal
Diverse Existing amp Target Customer BaseMarkets Served
Telecom Infrastructure Investment Drivers
bull Telco gigabit fiber to the home deployment programs
bull Cable MSOs deploying DOCSIS 31
bull Upcoming - 5G wireless and fiber backhaul
bull Ongoing 4G wireless network optimization
bull Connect America Fund - rural fiber build-out
bull Federal government funded FirstNet - national wireless network for first responders
United States
bull Backbone and last mile fiber (behind relative to the US)
bull Telco gigabit fiber to the home deployment programs
bull Cable MSOs deploying DOCSIS 31
bull Upcoming - 5G wireless and fiber backhaul
bull Ongoing 4G wireless network optimization
bull Federal government infrastructure initiatives generally positive
Canada
bull Significantly behind North America in both wireline and wireless connectivity
bull However demand for connectivity media and data intensive services is strong
bull Fiber and backhaul networks significantly behind North America
bull Primarily 3G wireless some 4G wireless (country dependent)
bull Various governments have infrastructure expansion initiatives
bull Concession and P3 opportunities
bull Connectivity for quality of life social and commercial reasons
Latin America
Telecom Infrastructure Services Overview
Fiber Builds
Wireless Deployment
Make Ready Services
Civil Construction
Engineering Design
Material Management
EPC
Wireless Wireline
United StatesWireless Wireline
CanadaWireless Wireline
Latin America
Comprehensive Infrastructure Solutions Offered On A Turnkey Discrete Service or EPC Basis
bull Proven greenfield expansion model in Latin America ndash US should be less difficult
Leverage existing US field operations people equipment and property
bull Select strategic acquisitions may play a role but NOT a roll-up approach
Provide wireline and wireless services - heavier on wireline
bull Increasing convergence of wireless and wireline due fiber requirements of both
Project centric nimble approach versus MSA focused EPC services to differentiate
bull Less capital intensive with better margin opportunity
GOAL
STRATEGY
STRATEGY
STRATEGY
STRATEGY
To be the leading communications infrastructure contractor in the markets we serve
Engineer Procure Construct (EPC) Is A Differentiator
bull Quanta has a long history in the EPC business and is increasingly performing select projects on an EPC basisbull Customersrsquo capital programs are at historic levels and growing Projects are getting larger and more complexbull Evolution of regulatory demands competition and alternative pricing models
bull Many customers have limited internal resources and expertise to manage these dynamics and are turning to Quanta for solutions
bull Project cost certainty becoming increasingly important
bull We are enhancing initiatives to ensure we have a scalable comprehensive enterprise-wide capability for EPC projects that is consistently executed across all segments and geographies
bull EPC projects are a meaningful contributor to our current backlog and provide significant opportunity for future growth
Integrated Services
Construction amp Installation
Assessment Planning amp
Development
Engineering amp Design
Procurement Operation and Maintenance
What is Infrastructure Solutions
Infrastructure Solutions represent strategic partnerships with customers and capital partners
bull Public private partnerships (P3)bull Concessionsbull Build Own Operate or Transfer
(BOOT)bull Build to Suit (BTS) arrangements
These solutions are a growth engine for each of our segments and geographies and a core component of our strategic
imperative to deliver differentiated solutions to our customers
Encompasses
Infrastructure Solutions Drivers
A Combination of Drivers are Occurring that Create Demand and Opportunity for Our Infrastructure Solutions
bull Provide transparency to a project shape design constructability risk allocation and overall project structure
bull Manages risk that yields more informed EPC project decisions
bull Improves success rate of both winning the engagement and successful execution
bull Where appropriate we invest alongside our partners
bull Significant capital needs to fund the substantial infrastructure needs
bull Utilization of concessions public private partnerships (P3) and private infrastructure partnerships to fund and attract high-quality entities for complex projects
bull Changes in regulation (such as FERC Order 1000)
bull New entrants together with high interest and availability of investor infrastructure investment capital
Quanta Is A True Partner
bull Quanta increasingly sought as a partner for our execution capabilities the need for price certainty and our financial strength
bull Projects are larger more complex greater scope Typically under lump-sum turnkey arrangements which create greater opportunities and risks for Quanta
bull Successful Infrastructure Solutions and project execution track record
Quanta Sought for Executionamp Track Record
Market Structure amp Projects Getting More Complex
29
Fully Integrated Solutions Based Provider
Infrastructure Solutions Provides A Solutions Based Tool for Quanta to Partner with Customers Enhance Relationships and Create New Customer and Project Opportunities
EPC
Capitalbull Determine capital structurebull Source capitalbull Quanta minority direct
investmentbull First Infrastructure Capital
Advisors
PartnershipsPartner withbull Customersbull Equity Capital
(4) Includes $802 million of expense net of tax or $036 per diluted share from an arbitration decision charge to provision for long-term contract receivable and the benefit associated with release of certain income tax contingencies
2013 2014 2015 2016 2017 Est
($ in millions)Revenue
$140$122
$062
$126
$163
2013 2014 2015 2016 2017Est
(4)
(5)
(6)
Electric Power Oil amp Gas Infrastructure
GAAP Diluted EPS (1)
$156
$185
$111
$151
$195
2013 2014 2015 2016 2017Est
Adjusted Diluted EPS (1)
$6412
(2) Represents the midpoint of guidance range
(2)
$7747
(2) (2) $173
(3) Includes $033 gain from sale of Howard Energy investment
$9300(3)
(1) From continuing operations
$7572
(5) Includes $734 million of project losses Also includes $454 million of expense net of tax or $023 per diluted share from net asset impairment charges
$7651
(6) Includes $548 million of project losses and $71 million of expense net of tax or $005 per diluted share from net asset impairment charges Also includes tax benefits of $205 million or $013 per share associated with the expiration of various federal and state tax statute of limitations periods
Recent Financial Performance amp 2017 ExpectationsFor the Years Ended December 31
($ in millions)Electric Power
$4542
$5303$4937 $4850
115107
7583
2013 2014 2015 2016 2017 Est
Revenue Op Margin
(2)
(1) Operating margin excludes a $1025 million charge to cost of services for long-term contract receivable in 2014 Refer to appendix for non-GAAP reconciliation(2) Excludes a $66 million property and equipment impairment charge Includes the impact of $661 million of project losses Refer to appendix for non-GAAP reconciliation(3) Excludes a $57 million asset impairment charge Includes the impact of $548 million of project losses Refer to appendix for non-GAAP reconciliation
(1) (1)
(2)(3)
f Est revenue growth approaching 15 vs 2016
Est operating incomemargins of 90 to 95
Guidance Commentary($ in millions)
Oil amp Gas Infrastructure
(4) Excludes a $388 million expense associated with an arbitration decision Refer to appendix for non-GAAP reconciliation(5) Includes $73 million of project losses
Liquidity includes cash and cash equivalents and availability under our revolving credit facility as described in our Form 10k
Historical Cash Flow Generation
$163
$15
$434
$191
2013 2014 2015 2016
Cash Flow from Continuing Operations
($ in millions)
Free Cash Flow from Continuing Operations
$371
$248
$618
$381
2013 2014 2015 2016
Net cash provided by operating activities from continuing operations plus proceeds from sale of property and equipment less additions of property and equipment
For the Years Ending December 31($ in millions)
For the Years Ending December 31
Committed to Generating Shareholder Value
Executed on $125 Billion Share Repurchase Authorizationbull Aug 2015 ndash Announced a new $125 billion share repurchase
authorization through Feb 28 2017bull Completed a $750 million accelerated stock repurchase (ASR)
arrangement in April 2016bull Acquired 351 million shares at $2136 per share
bull $500 million for opportunistic repurchases through Feb 28 2017bull $450 million 192 million shares retired
Completed $500 Million Share Repurchase Authorizationbull Completed previous $500 million share repurchase program in 2015bull Acquired approximately 174 million shares for total cost of $500
million
Acquired $17 Billion of Quanta Common Stock
Under Previous Programs Quanta Has Acquired Approximately 32 of Its Outstanding Stock
$2197$1951
$1573 $1573
0
25
50
75
100
125
150
175
200
225
$0000
$500000
$1000000
$1500000
$2000000
$2500000
$3000000
2014 2015 2016 2017E
Net Income Required to Generate $001 In EPS
Avg Dil Shs Out
Earnings Power Improvement
$ in
Tho
usan
ds
Shares in Millions
May 25 2017 ndash Announced New $300 Million Share Repurchase Authorizationbull Up to $300 million through June 30 2020
Opportunistic amp Disciplined Capital Allocation
Capital Deployment Preference (Amounts in millions)
bull Working Capitalbull Capital Expendituresbull Acquisitionsbull Investmentsbull Return of Capital
bull Generally in sync with preference however hellip
bull Financial strength provides the ability to be opportunistic
bull Flexible and strategic capital allocation is a competitive advantage
Capital Deployment Posture
Financial Strength Allows for Flexible and Strategic Capital Allocation ndash A Competitive Advantage
2013 ndash 2016 Sources amp Uses of Cash
Sources
Cash Flow fromOperations
DivestitureProceeds
BorrowingsInvestment Sales
$3099
$1667
$842
$369$221
Uses
StockRepurchase
CAPEX amp OtherNet
Acquisitions Net
Investments
$1700
$900
$728
$54$3382
54
27
127
50
27
21
2
Amounts reflect the retrospective application of a recent accounting pronouncement related to the classification of tax withholding payments for share-based compensation
Foundation For Growth amp Improved Profitability
Multi-Year Growth Opportunities
Innovative Industry Leading Solutions
Scale amp Scope
Financial Strength
Operational amp Safety Excellence
QuantaServicesIR
QuantaIR
Connect With Quanta Services Investor Relations
Corporate Office2800 Post Oak Blvd Suite 2600Houston TX 77056713-629-7600wwwquantaservicescom
Investor ContactKip Rupp CFAVice President ndash Investor Relations713-341-7260investorsquantaservicescom
Reconciliation of Adjusted Net Income from Continuing Operations Attributable to Common Stock
2013 2014 2015 2016 2017 2017Reconciliation of adjusted net income from continuing operations attributable to common stockNet income from continuing operations attributable to common stock (GAAP as reported) 372057$ 269224$ 120286$ 198725$ 247000$ 275300$ Adjustments
Asset impairment charges - - 58451 7964 - -Severance and restructuring charges - - - 6352 - -Acquisition and integration costs 8145 14754 7966 3053 9300 9300 Impact of income tax contingency releases (9935) (8099) - (20488) - -Impact of tax benefit from realization of previously unrecognized deferred tax asset - - (4228) - - -Impact of Alberta tax law change - - 4982 - - -Provision for long-term contract receivable - 102460 - - - -Arbitration expense - 38848 - - - -Impact of sale of equity ownership in Howard Energy (112744) - - - - -Income tax impact of adjustments 39836 (55935) (16186) (3982) (3400) (3400)
Adjusted net income from continuing operations attributable to common stock before certain non-cash adjustments 297359 361252 171271 191624 252900 281200
Non-cash stock based compensation 34381 37449 36939 41134 47000 47000 Amortization of intangible assets 25865 34257 34848 31685 30600 30600 Income tax impact of non-cash adjustments (22715) (26453) (25817) (26183) (28500) (28500)
Adjusted net income from continuing operations attributable to common stock 334890$ 406505$ 217241$ 238260$ 302000$ 330300$ Weighted average sharesWeighted average shares outstanding for diluted earnings per share 214978 219690 195120 157288 157300 157300 Weighted average shares outstanding for adjusted diluted earnings per share 214978 219690 195120 157288 157300 157300 Diluted earnings per share from continuing operations attributable to common stock and adjusted diluted earnings per share from continuing operations attributable to common stockDiluted earnings per share from continuing operations attributable to common stock 173$ 123$ 062$ 126$ 157$ 175$ Adjusted diluted earnings per share from continuing operations attributable to common stock 156$ 185$ 111$ 151$ 192$ 210$
Estimated Guidance Range
For the Years Ended December 31
(in thousands except per share information)(Unaudited)
Recast of Adjusted Diluted
Reconciliation of Electric Power and Oil amp Gas Infrastructure Services Segments Operating Income As Adjusted
Amounts in millions except percentagesOil amp Gas
Infrastructure12312014 12312015 12312016 12312014
Revenues 53027$ 49373$ 48505$ 24446$
Operating Income (as reported) 4630 3623 3957 1628
Addback Provisions for long term contract receivable 1025 - - - Arbitration expense - - - 388 Asset impairment charge - 66 57 -
Operating Income (as adjusted) 5655$ 3689$ 4014$ 2016$
Operating income margin (as reported) 87 73 82 67Operating income margin (as adjusted) 107 75 83 83
Electric Power
Sheet1
Reconciliation of Free Cash Flow
2013 2014 2015 2016Net Cash Provided by Operating Activities of Continuing Operations 370558 247742 618183 381176 Less Net Capital ExpendituresAdditions of Property and Equipment (221946) (247216) (209968) (212555) Proceeds from Sale of Property and Equipment 14789 14448 26178 21975 Net Capital Expenditures (207157) (232768) (183790) (190580)
Free Cash Flow 163401 14974 434393 190596
Free Cash Flow from Cont Ops
Forward Looking Statement DisclaimerThis presentation (and oral statements regarding the subject matter of this presentation) includes ldquoforward-looking statementsrdquo intended to qualify for the safe harbor from liability established by the Private Securities Litigation Reform Act of 1995 These statements reflect assumptions expectations projections intentions or beliefs about future events and use words such as anticipate estimate project forecast may will should could expect believe plan intend and other words of similar meaning You can identify these statements by the fact that they do not relate strictly to historical or current facts In particular these include but are not limited to statements relating to the following
bull Projected revenues net income earnings per share attributable to common stock backlog margins capital expenditures weighted average shares outstanding tax rates and other projections of operating or financial resultsbull Our business or financial outlook growth or opportunities in particular marketsbull The potential benefits from acquisitions and investmentsbull The expected financial and operational performance of acquired businessesbull Future capital allocation initiativesbull Our ability to deliver increased value and return capital to stockholders bull The strategic use of our balance sheetbull The expected value of contracts or intended contracts with customersbull The scope services term and results of any projects awarded or expected to be awarded for services to be provided by usbull The anticipated commencement and completion dates for any projects awardedbull The development of larger electric transmission and oil and natural gas pipeline projects and the level of oil natural gas and natural gas liquids prices and their impact on our business or the demand for our services bull The impact of existing or potential energy legislation bull Potential opportunities that may be indicated by bidding activity or discussions with customersbull The expected outcome of pending or threatened litigation bull Beliefs and assumptions about the collectability of receivablesbull The business plans or financial condition of our customersbull Our plans and strategies bull The current economic and regulatory conditions and trends in the industries we serve bull Possible recovery on pending or contemplated change orders or affirmative claims against customers or third parties and bull Other statements reflecting expectations intentions assumptions or beliefs about future events and other statements that do not relate strictly to historical or current facts
Although our management believes that the expectations reflected in such forward-looking statements are reasonable it can give no assurance that such expectations will prove to be correct These forward-looking statements are not guarantees of future performance and involve or rely on a number of risks uncertainties and assumptions that are difficult to predict or beyond our control These forward-looking statements reflect our beliefs and assumptions based on information available to our management at the time the statements are made We caution you that actual outcomes and results may differ materially from what is expressed implied or forecasted by our forward-looking statements and that any or all of our forward-looking statements may turn out to be wrong Forward-looking statements can be affected by inaccurate assumptions and by known or unknown risks and uncertainties including the following
bull Market conditionsbull The effects of industry economic financial or political conditions outside our control including weakness in capital marketsbull Quarterly variations in our operating resultsbull Trends and growth opportunities in relevant marketsbull The cost of borrowing availability of credit and cash fluctuations in the price and volume of our common stock debt covenant compliance interest rate fluctuations and other factors affecting our financing and investing activitiesbull Delays reductions in scope or cancellations of anticipated pending or existing projects including as a result of weather regulatory or permitting issues environmental processes project performance issues claimed force majeure events or our customers capital
constraintsbull The successful negotiation execution performance and completion of anticipated pending and existing contracts including the ability to obtain awards of projects on which we bid or are otherwise discussing with customersbull Our ability to retain key personnel and qualified employees
Forward Looking Statement Disclaimerbull Our ability to attract or the potential shortage of skilled labor bull Our dependence on fixed price contracts and the potential to incur losses with respect to the contractsbull Estimates relating to our use of percentage-of-completion accountingbull Adverse weatherbull Our ability to generate internal growthbull Competition in our business including our ability to effectively compete for new projects and market sharebull The effect of natural gas natural gas liquids and oil prices on our operations and growth opportunities and on
our customersrsquo capital programs and demand for our servicesbull The future development of natural resourcesbull The failure of existing or potential legislative actions to result in demand for our servicesbull Liabilities associated with multiemployer pension plans including underfunding of liabilities and termination
or withdrawal liabilitiesbull The possibility of further increases in the liability associated with our withdrawal from a multiemployer
pension planbull Unexpected costs or liabilities that may arise from pending or threatened litigation indemnity obligations or
other claims asserted against us including liabilities for claims that are self-insured or uninsuredbull The outcome of pending or threatened litigationbull Risks relating to the potential unavailability or cancellation of third party insurance the exclusion of coverage
for certain losses and potential increases in premiums for coverage deemed beneficial to usbull Cancellation provisions within our contracts and the risk that contracts expire and are not renewed or are
replaced on less favorable termsbull Loss of customers with whom we have long-standing or significant relationshipsbull The potential that participation in joint ventures or similar structures exposes us to liability andor harm to
our reputation for acts or omissions by our partnersbull Our inability or failure to comply with the terms of our contracts which may result in additional costs
unexcused delays warranty claims failure to meet performance guarantees damages or contract terminations
bull The inability or refusal of our customers to pay for services including the failure to collect outstanding receivables
bull The failure to recover on payment claims against project owners or third party contractors or to obtain adequate compensation for customer-requested change orders
bull The failure of our customers to comply with regulatory requirements applicable to their projects which may result in project delays and cancellations
bull Budgetary or other constraints that may reduce or eliminate tax incentives or government funding for projects which may result in project delays or cancellations
bull Estimates and assumptions in determining our financial results and backlogbull Our ability to realize our backlogbull Risks associated with operating in international markets including instability of foreign governments
currency fluctuations tax and investment strategies as well as compliance with foreign legal systems and cultural practices the US Foreign Corrupt Practices Act and other applicable anti-bribery and anti-corruption laws
bull Our ability to successfully identify complete integrate and realize synergies from acquisitionsbull The potential adverse impact resulting from uncertainty surrounding investments and acquisitions including
the ability to retain key personnel from the acquired businesses and the potential increase in risks already existing in our operations
bull The adverse impact of impairments of goodwill receivables property equipment and other intangible assets or investments
bull Our growth outpacing our decentralized management and infrastructurebull Requirements relating to governmental regulation and changes theretobull Inability to enforce our intellectual property rights or the obsolescence of such rightsbull Risks related to the implementation of an information technology solutionbull The impact of our unionized workforce on our operations including labor stoppages or interruptions due to
strikes or lockoutsbull Potential liabilities and other adverse effects arising from occupational health and safety mattersbull Our dependence on suppliers subcontractors equipment manufacturers and other third party contractorsbull Fluctuations of prices of certain materials used in our businessbull The ability to access sufficient funding to finance desired growth and operationsbull Our ability to obtain performance bondsbull Potential exposure to environmental liabilitiesbull Our ability to continue to meet certain requirements applicable to us and our subsidiariesbull Rapid technological and other structural changes that could reduce the demand for our servicesbull New or changed tax laws treaties or regulationsbull Increased healthcare costs arising from healthcare reform legislation or other governmental actionbull Regulatory changes that result in increased labor costsbull Significant fluctuations in foreign currency exchange rates andbull The other risks and uncertainties as are described elsewhere herein and in our Annual Report on Form 10-K for
the year ended December 31 2016 filed with the SEC and as may be detailed from time to time in our other public filings with the SEC
All of our forward-looking statements whether written or oral are expressly qualified by these cautionary statements and any other cautionary statements that may accompany such forward-looking statements or that are otherwise included in this presentation Should one or more of these risks materialize or should underlying assumptions prove incorrect actual results may vary materially from those expressed or implied in any forward-looking statements Investors are cautioned not to place undue reliance on these forward-looking statements which are current only as of this date We do not undertake and expressly disclaim any obligation to update or revise any forward-looking statements to reflect events or circumstances after the date of this presentation or otherwise and we expressly disclaim any written or oral statements made by any third party regarding the subject matter of this presentation
Slide Number 1
Forward Looking Statement Disclaimer
Key Takeaways
Leading Integrated Infrastructure Solutions Provider
Overview ndash Strategically Focused Operationally Diverse
Overview - Diverse and High Quality Customer Base
Leading Integrated Infrastructure Solutions Provider
Strategic Imperatives
Strategic Imperatives Deliver Profitable Growth
Strategic Acquisitions Criteria and Rationale
Differentiated Competitive Position ndash In the Sweet Spot
Differentiated Competitive Position ndash In the Sweet Spot
Electric Power Infrastructure Services Segment Overview
Power Grid Investment Drivers - Transmission
Power Grid Investment Drivers - Transmission
Power Grid Investment Drivers - Distribution
Oil amp Gas Infrastructure Services Segment Overview
Reconciliation of Adjusted Net Income from Continuing Operations Attributable to Common Stock
Reconciliation of Electric Power and Oil amp Gas Infrastructure Services Segments Operating Income As Adjusted
Reconciliation of Free Cash Flow
Forward Looking Statement Disclaimer
Forward Looking Statement Disclaimer
Free Cash Flow From Continuing Operations
Source
2013
2014
2015
2016
(Support Cash Flow Statement)
Net Cash Provided by Operating Activities of Continuing Operations
370558
247742
618183
381176
(Support Cash Flow Statement)
Less Net Capital Expenditures
(Support Cash Flow Statement)
Additions of Property and Equipment
(221946)
(247216)
(209968)
(212555)
(Support Cash Flow Statement)
Proceeds from Sale of Property and Equipment
14789
14448
26178
21975
(Recalculation)
Net Capital Expenditures
(207157)
(232768)
(183790)
(190580)
(Recalculation)
Free Cash Flow
163401
14974
434393
190596
Adjusted Operating Income Margin
$ in millions
Support for slide 23
Amounts in millions except percentages
Electric Power
Oil amp Gas Infrastructure
123114
123115
123116
123114
Revenues
$ 53027
$ 49373
$ 48505
$ 24446
Operating Income (as reported)
4630
3623
3957
1628
Addback
Provisions for long term contract receivable
1025
-0
-0
-0
Arbitration expense
-0
-0
-0
388
Asset impairment charge
-0
66
57
-0
Operating Income (as adjusted)
$ 5655
$ 3689
$ 4014
$ 2016
Operating income margin (as reported)
87
73
82
67
Operating income margin (as adjusted)
107
75
83
83
Quanta Services Inc and Subsidiaries
Reconciliation of Non-GAAP Financial Measures
Adjusted Diluted Earnings Per Share from Continuing Operations
For the Years Ended December 31
(in thousands except per share information)
(Unaudited)
Estimated Guidance Range
2013
2014
2015
2016
2017
2017
Reconciliation of adjusted net income from continuing operations attributable to common stock
Net income from continuing operations attributable to common stock (GAAP as reported)
$ 372057
$ 269224
$ 120286
$ 198725
$ 247000
$ 275300
Adjustments
Asset impairment charges
-
-
58451
7964
-
-
Severance and restructuring charges
-
-
-
6352
-
-
Acquisition and integration costs
8145
14754
7966
3053
9300
9300
Impact of income tax contingency releases
(9935)
(8099)
-
(20488)
-
-
Impact of tax benefit from realization of previously unrecognized deferred tax asset
-
-
(4228)
-
-
-
Impact of Alberta tax law change
-
-
4982
-
-
-
Provision for long-term contract receivable
-
102460
-
-
-
-
Arbitration expense
-
38848
-
-
-
-
Impact of sale of equity ownership in Howard Energy
(112744)
-
-
-
-
-
Income tax impact of adjustments
39836
(55935)
(16186)
(3982)
(3400)
(3400)
Adjusted net income from continuing operations attributable to common stock before certain non-cash adjustments
297359
361252
171271
191624
252900
281200
Non-cash stock based compensation
34381
37449
36939
41134
47000
47000
Amortization of intangible assets
25865
34257
34848
31685
30600
30600
Income tax impact of non-cash adjustments
(22715)
(26453)
(25817)
(26183)
(28500)
(28500)
Adjusted net income from continuing operations attributable to common stock
$ 334890
$ 406505
$ 217241
$ 238260
$ 302000
$ 330300
Weighted average shares
Weighted average shares outstanding for diluted earnings per share
214978
219690
195120
157288
157300
157300
Weighted average shares outstanding for adjusted diluted earnings per share
214978
219690
195120
157288
157300
157300
Diluted earnings per share from continuing operations attributable to common stock and adjusted diluted earnings per share from continuing operations attributable to common stock
Diluted earnings per share from continuing operations attributable to common stock
$ 173
$ 123
$ 062
$ 126
$ 157
$ 175
Adjusted diluted earnings per share from continuing operations attributable to common stock
$ 156
$ 185
$ 111
$ 151
$ 192
$ 210
Oil amp Gas Infrastructure Investment Drivers
bull Production of shale natural gas oil and natural gas liquids has grown dramatically and is expected to remain at high levels forthe foreseeable future
bull Much of these resources are in areas that have not been traditional hydrocarbon fuel sources and do not have adequate infrastructure in place to gather store process and transport product
bull Canadian oil production lacks adequate takeaway pipeline infrastructurebull Economics of pipeline transportation is increasingly attractive versus rail in a low oil price environmentbull Pipeline construction capacity is more limited in Canada versus the US and construction capacity constraints could be significant
bull It will take many years and significant energy infrastructure investment to harvest these resources
Shale Gas amp Tight Oil Plays Drive US Natural Gas Production
2000-2040 (trillion cubic feet)
Source EIA Annual Energy Outlook 2017
Tight Oil Drives US Oil Production2000-2040 (millions of barrels per day)
Source EIA Annual Energy Outlook 2015
Canadian Oil Sands amp Conventional Oil Production(Millions of barrels per day)
Source Canadian Assoc of Petroleum Producers
Oil amp Gas Infrastructure Investment Driversbull Need for pipeline and related infrastructure driven by the
significant increase in North American unconventional natural gas and oil production ndash not commodity prices
bull Takeaway pipelines have not been built fast enough to keep pace with hydrocarbon production ndash significant pipeline development needed
bull Large pipeline construction industry capacity is currently tight but could get significantly strained over the next several years
North American Pipeline ForecastProbability Weighted
Quanta Is the Largest Pipeline Construction Company in North America
bull Quanta is the largest pipeline construction company in North America
bull This positions Quanta to provide significant large diameter pipe construction capacity to the industry while remaining active in select shales
bull We are ready to assist our customers in meeting their development goals in what could be a resource challenged environment
North America Major Planned Mainline Project Capex
Source KeyBanc Capital Markets
$0
$5
$10
$15
$20
2016E 2017E 2018E 2019E
In B
illio
ns
In B
illio
ns
Oil amp Gas Infrastructure Investment DriversNatural Gas Distribution amp Pipeline Integritybull US pipeline infrastructure is getting older
bull PHMSA estimates more than 470K miles (37) of US gas distribution mains and 171K miles (57) of gas transmission pipelines were installed before 1970 or in an undocumented year
bull Local Distribution Companies (LDCs) continue increased spend on pipe inspection and replacement
bull Replacement programs ramped up after San Bruno incident in 2010 Utilities are spending $22B a year on transmission and distribution systems(2)
bull Regulations push for expanding inspection programs and accelerating replacement work
bull PHMSA will require more inspection and corrosion control activity which will require additional excavations and integrity work DOErsquos Quadrennial Energy Review emphasizes the need to accelerate pipe replacement to curb emissions from leak-prone pipe
bull Long timelines for some replacement plans will push spend acceleration
bull Current projections are over 20 years for many large utilities a few more than 50 years(3) Replacement activities will have to be accelerated to address risk
bull State regulators establishing cost recovery mechanisms to accelerate replacement programs
Significant Inventory Remains for Replacement
States with Gas Utility Cost Recovery Mechanisms(4)
(1) PHMSA pipe inventory reports 2011-2015(2) AGA 2016 Playbook (3) Department of Energy Quadrennial Energy Review ndash Energy Transmission Storage and Distribution Infrastructure April 2015 (4) American Gas Association Playbook 2017
Stronghold Acquisition Overview
bull Provides catalyst handling turnaround and other downstream services tank storage and other midstream services
bull Specializes in high pressure and high reactor infrastructure services
bull Industry leading safety record employee and training focus with entrepreneurial culture
bull Led by a strong multigenerational highly regarded management team with decades of industry experience
bull Preferred employer with low turnover and high-quality workforce ndash averaging 2800 employees
bull Excellent reputation and strong relationships with a high-quality and diverse client base
bull Strong historical organic growth
21
Stronghold is a leading specialized services company providing high pressure and critical path solutions to the downstream and midstream energy markets
Company Profile
2016 Revenue =Approx $500 Million
Downstream Services
85
Midstream Services
15
Strategic Rationalebull Facilitates capture of a greater portion of energy
industry spend and offers cross-selling opportunities
bull Specialized Industrial Services market is a natural service line expansion for Quanta to meet our customersrsquo needs
bull Complements existing downstream high-voltage power services
bull Stronghold gives Quanta a significant presence in downstream services and a strong platform for growth
bull Strong financial profilebull Attractive historical growth and accretive margin
profile low capex requirements solid cash flow and accretive to earnings
bull Enhances recurring base business revenue
bull Shale oil natural gas and natural gas liquids (NGLs) production driving refinery petrochemical and storage infrastructure needs
Telecom Infrastructure Services Overview
To be an industry leading and true EPC contractor providing comprehensive communications infrastructure solutions to customers in the United States Canada and select markets in Latin America
Goal
Diverse Existing amp Target Customer BaseMarkets Served
Telecom Infrastructure Investment Drivers
bull Telco gigabit fiber to the home deployment programs
bull Cable MSOs deploying DOCSIS 31
bull Upcoming - 5G wireless and fiber backhaul
bull Ongoing 4G wireless network optimization
bull Connect America Fund - rural fiber build-out
bull Federal government funded FirstNet - national wireless network for first responders
United States
bull Backbone and last mile fiber (behind relative to the US)
bull Telco gigabit fiber to the home deployment programs
bull Cable MSOs deploying DOCSIS 31
bull Upcoming - 5G wireless and fiber backhaul
bull Ongoing 4G wireless network optimization
bull Federal government infrastructure initiatives generally positive
Canada
bull Significantly behind North America in both wireline and wireless connectivity
bull However demand for connectivity media and data intensive services is strong
bull Fiber and backhaul networks significantly behind North America
bull Primarily 3G wireless some 4G wireless (country dependent)
bull Various governments have infrastructure expansion initiatives
bull Concession and P3 opportunities
bull Connectivity for quality of life social and commercial reasons
Latin America
Telecom Infrastructure Services Overview
Fiber Builds
Wireless Deployment
Make Ready Services
Civil Construction
Engineering Design
Material Management
EPC
Wireless Wireline
United StatesWireless Wireline
CanadaWireless Wireline
Latin America
Comprehensive Infrastructure Solutions Offered On A Turnkey Discrete Service or EPC Basis
bull Proven greenfield expansion model in Latin America ndash US should be less difficult
Leverage existing US field operations people equipment and property
bull Select strategic acquisitions may play a role but NOT a roll-up approach
Provide wireline and wireless services - heavier on wireline
bull Increasing convergence of wireless and wireline due fiber requirements of both
Project centric nimble approach versus MSA focused EPC services to differentiate
bull Less capital intensive with better margin opportunity
GOAL
STRATEGY
STRATEGY
STRATEGY
STRATEGY
To be the leading communications infrastructure contractor in the markets we serve
Engineer Procure Construct (EPC) Is A Differentiator
bull Quanta has a long history in the EPC business and is increasingly performing select projects on an EPC basisbull Customersrsquo capital programs are at historic levels and growing Projects are getting larger and more complexbull Evolution of regulatory demands competition and alternative pricing models
bull Many customers have limited internal resources and expertise to manage these dynamics and are turning to Quanta for solutions
bull Project cost certainty becoming increasingly important
bull We are enhancing initiatives to ensure we have a scalable comprehensive enterprise-wide capability for EPC projects that is consistently executed across all segments and geographies
bull EPC projects are a meaningful contributor to our current backlog and provide significant opportunity for future growth
Integrated Services
Construction amp Installation
Assessment Planning amp
Development
Engineering amp Design
Procurement Operation and Maintenance
What is Infrastructure Solutions
Infrastructure Solutions represent strategic partnerships with customers and capital partners
bull Public private partnerships (P3)bull Concessionsbull Build Own Operate or Transfer
(BOOT)bull Build to Suit (BTS) arrangements
These solutions are a growth engine for each of our segments and geographies and a core component of our strategic
imperative to deliver differentiated solutions to our customers
Encompasses
Infrastructure Solutions Drivers
A Combination of Drivers are Occurring that Create Demand and Opportunity for Our Infrastructure Solutions
bull Provide transparency to a project shape design constructability risk allocation and overall project structure
bull Manages risk that yields more informed EPC project decisions
bull Improves success rate of both winning the engagement and successful execution
bull Where appropriate we invest alongside our partners
bull Significant capital needs to fund the substantial infrastructure needs
bull Utilization of concessions public private partnerships (P3) and private infrastructure partnerships to fund and attract high-quality entities for complex projects
bull Changes in regulation (such as FERC Order 1000)
bull New entrants together with high interest and availability of investor infrastructure investment capital
Quanta Is A True Partner
bull Quanta increasingly sought as a partner for our execution capabilities the need for price certainty and our financial strength
bull Projects are larger more complex greater scope Typically under lump-sum turnkey arrangements which create greater opportunities and risks for Quanta
bull Successful Infrastructure Solutions and project execution track record
Quanta Sought for Executionamp Track Record
Market Structure amp Projects Getting More Complex
29
Fully Integrated Solutions Based Provider
Infrastructure Solutions Provides A Solutions Based Tool for Quanta to Partner with Customers Enhance Relationships and Create New Customer and Project Opportunities
EPC
Capitalbull Determine capital structurebull Source capitalbull Quanta minority direct
investmentbull First Infrastructure Capital
Advisors
PartnershipsPartner withbull Customersbull Equity Capital
(4) Includes $802 million of expense net of tax or $036 per diluted share from an arbitration decision charge to provision for long-term contract receivable and the benefit associated with release of certain income tax contingencies
2013 2014 2015 2016 2017 Est
($ in millions)Revenue
$140$122
$062
$126
$163
2013 2014 2015 2016 2017Est
(4)
(5)
(6)
Electric Power Oil amp Gas Infrastructure
GAAP Diluted EPS (1)
$156
$185
$111
$151
$195
2013 2014 2015 2016 2017Est
Adjusted Diluted EPS (1)
$6412
(2) Represents the midpoint of guidance range
(2)
$7747
(2) (2) $173
(3) Includes $033 gain from sale of Howard Energy investment
$9300(3)
(1) From continuing operations
$7572
(5) Includes $734 million of project losses Also includes $454 million of expense net of tax or $023 per diluted share from net asset impairment charges
$7651
(6) Includes $548 million of project losses and $71 million of expense net of tax or $005 per diluted share from net asset impairment charges Also includes tax benefits of $205 million or $013 per share associated with the expiration of various federal and state tax statute of limitations periods
Recent Financial Performance amp 2017 ExpectationsFor the Years Ended December 31
($ in millions)Electric Power
$4542
$5303$4937 $4850
115107
7583
2013 2014 2015 2016 2017 Est
Revenue Op Margin
(2)
(1) Operating margin excludes a $1025 million charge to cost of services for long-term contract receivable in 2014 Refer to appendix for non-GAAP reconciliation(2) Excludes a $66 million property and equipment impairment charge Includes the impact of $661 million of project losses Refer to appendix for non-GAAP reconciliation(3) Excludes a $57 million asset impairment charge Includes the impact of $548 million of project losses Refer to appendix for non-GAAP reconciliation
(1) (1)
(2)(3)
f Est revenue growth approaching 15 vs 2016
Est operating incomemargins of 90 to 95
Guidance Commentary($ in millions)
Oil amp Gas Infrastructure
(4) Excludes a $388 million expense associated with an arbitration decision Refer to appendix for non-GAAP reconciliation(5) Includes $73 million of project losses
Liquidity includes cash and cash equivalents and availability under our revolving credit facility as described in our Form 10k
Historical Cash Flow Generation
$163
$15
$434
$191
2013 2014 2015 2016
Cash Flow from Continuing Operations
($ in millions)
Free Cash Flow from Continuing Operations
$371
$248
$618
$381
2013 2014 2015 2016
Net cash provided by operating activities from continuing operations plus proceeds from sale of property and equipment less additions of property and equipment
For the Years Ending December 31($ in millions)
For the Years Ending December 31
Committed to Generating Shareholder Value
Executed on $125 Billion Share Repurchase Authorizationbull Aug 2015 ndash Announced a new $125 billion share repurchase
authorization through Feb 28 2017bull Completed a $750 million accelerated stock repurchase (ASR)
arrangement in April 2016bull Acquired 351 million shares at $2136 per share
bull $500 million for opportunistic repurchases through Feb 28 2017bull $450 million 192 million shares retired
Completed $500 Million Share Repurchase Authorizationbull Completed previous $500 million share repurchase program in 2015bull Acquired approximately 174 million shares for total cost of $500
million
Acquired $17 Billion of Quanta Common Stock
Under Previous Programs Quanta Has Acquired Approximately 32 of Its Outstanding Stock
$2197$1951
$1573 $1573
0
25
50
75
100
125
150
175
200
225
$0000
$500000
$1000000
$1500000
$2000000
$2500000
$3000000
2014 2015 2016 2017E
Net Income Required to Generate $001 In EPS
Avg Dil Shs Out
Earnings Power Improvement
$ in
Tho
usan
ds
Shares in Millions
May 25 2017 ndash Announced New $300 Million Share Repurchase Authorizationbull Up to $300 million through June 30 2020
Opportunistic amp Disciplined Capital Allocation
Capital Deployment Preference (Amounts in millions)
bull Working Capitalbull Capital Expendituresbull Acquisitionsbull Investmentsbull Return of Capital
bull Generally in sync with preference however hellip
bull Financial strength provides the ability to be opportunistic
bull Flexible and strategic capital allocation is a competitive advantage
Capital Deployment Posture
Financial Strength Allows for Flexible and Strategic Capital Allocation ndash A Competitive Advantage
2013 ndash 2016 Sources amp Uses of Cash
Sources
Cash Flow fromOperations
DivestitureProceeds
BorrowingsInvestment Sales
$3099
$1667
$842
$369$221
Uses
StockRepurchase
CAPEX amp OtherNet
Acquisitions Net
Investments
$1700
$900
$728
$54$3382
54
27
127
50
27
21
2
Amounts reflect the retrospective application of a recent accounting pronouncement related to the classification of tax withholding payments for share-based compensation
Foundation For Growth amp Improved Profitability
Multi-Year Growth Opportunities
Innovative Industry Leading Solutions
Scale amp Scope
Financial Strength
Operational amp Safety Excellence
QuantaServicesIR
QuantaIR
Connect With Quanta Services Investor Relations
Corporate Office2800 Post Oak Blvd Suite 2600Houston TX 77056713-629-7600wwwquantaservicescom
Investor ContactKip Rupp CFAVice President ndash Investor Relations713-341-7260investorsquantaservicescom
Reconciliation of Adjusted Net Income from Continuing Operations Attributable to Common Stock
2013 2014 2015 2016 2017 2017Reconciliation of adjusted net income from continuing operations attributable to common stockNet income from continuing operations attributable to common stock (GAAP as reported) 372057$ 269224$ 120286$ 198725$ 247000$ 275300$ Adjustments
Asset impairment charges - - 58451 7964 - -Severance and restructuring charges - - - 6352 - -Acquisition and integration costs 8145 14754 7966 3053 9300 9300 Impact of income tax contingency releases (9935) (8099) - (20488) - -Impact of tax benefit from realization of previously unrecognized deferred tax asset - - (4228) - - -Impact of Alberta tax law change - - 4982 - - -Provision for long-term contract receivable - 102460 - - - -Arbitration expense - 38848 - - - -Impact of sale of equity ownership in Howard Energy (112744) - - - - -Income tax impact of adjustments 39836 (55935) (16186) (3982) (3400) (3400)
Adjusted net income from continuing operations attributable to common stock before certain non-cash adjustments 297359 361252 171271 191624 252900 281200
Non-cash stock based compensation 34381 37449 36939 41134 47000 47000 Amortization of intangible assets 25865 34257 34848 31685 30600 30600 Income tax impact of non-cash adjustments (22715) (26453) (25817) (26183) (28500) (28500)
Adjusted net income from continuing operations attributable to common stock 334890$ 406505$ 217241$ 238260$ 302000$ 330300$ Weighted average sharesWeighted average shares outstanding for diluted earnings per share 214978 219690 195120 157288 157300 157300 Weighted average shares outstanding for adjusted diluted earnings per share 214978 219690 195120 157288 157300 157300 Diluted earnings per share from continuing operations attributable to common stock and adjusted diluted earnings per share from continuing operations attributable to common stockDiluted earnings per share from continuing operations attributable to common stock 173$ 123$ 062$ 126$ 157$ 175$ Adjusted diluted earnings per share from continuing operations attributable to common stock 156$ 185$ 111$ 151$ 192$ 210$
Estimated Guidance Range
For the Years Ended December 31
(in thousands except per share information)(Unaudited)
Recast of Adjusted Diluted
Reconciliation of Electric Power and Oil amp Gas Infrastructure Services Segments Operating Income As Adjusted
Amounts in millions except percentagesOil amp Gas
Infrastructure12312014 12312015 12312016 12312014
Revenues 53027$ 49373$ 48505$ 24446$
Operating Income (as reported) 4630 3623 3957 1628
Addback Provisions for long term contract receivable 1025 - - - Arbitration expense - - - 388 Asset impairment charge - 66 57 -
Operating Income (as adjusted) 5655$ 3689$ 4014$ 2016$
Operating income margin (as reported) 87 73 82 67Operating income margin (as adjusted) 107 75 83 83
Electric Power
Sheet1
Reconciliation of Free Cash Flow
2013 2014 2015 2016Net Cash Provided by Operating Activities of Continuing Operations 370558 247742 618183 381176 Less Net Capital ExpendituresAdditions of Property and Equipment (221946) (247216) (209968) (212555) Proceeds from Sale of Property and Equipment 14789 14448 26178 21975 Net Capital Expenditures (207157) (232768) (183790) (190580)
Free Cash Flow 163401 14974 434393 190596
Free Cash Flow from Cont Ops
Forward Looking Statement DisclaimerThis presentation (and oral statements regarding the subject matter of this presentation) includes ldquoforward-looking statementsrdquo intended to qualify for the safe harbor from liability established by the Private Securities Litigation Reform Act of 1995 These statements reflect assumptions expectations projections intentions or beliefs about future events and use words such as anticipate estimate project forecast may will should could expect believe plan intend and other words of similar meaning You can identify these statements by the fact that they do not relate strictly to historical or current facts In particular these include but are not limited to statements relating to the following
bull Projected revenues net income earnings per share attributable to common stock backlog margins capital expenditures weighted average shares outstanding tax rates and other projections of operating or financial resultsbull Our business or financial outlook growth or opportunities in particular marketsbull The potential benefits from acquisitions and investmentsbull The expected financial and operational performance of acquired businessesbull Future capital allocation initiativesbull Our ability to deliver increased value and return capital to stockholders bull The strategic use of our balance sheetbull The expected value of contracts or intended contracts with customersbull The scope services term and results of any projects awarded or expected to be awarded for services to be provided by usbull The anticipated commencement and completion dates for any projects awardedbull The development of larger electric transmission and oil and natural gas pipeline projects and the level of oil natural gas and natural gas liquids prices and their impact on our business or the demand for our services bull The impact of existing or potential energy legislation bull Potential opportunities that may be indicated by bidding activity or discussions with customersbull The expected outcome of pending or threatened litigation bull Beliefs and assumptions about the collectability of receivablesbull The business plans or financial condition of our customersbull Our plans and strategies bull The current economic and regulatory conditions and trends in the industries we serve bull Possible recovery on pending or contemplated change orders or affirmative claims against customers or third parties and bull Other statements reflecting expectations intentions assumptions or beliefs about future events and other statements that do not relate strictly to historical or current facts
Although our management believes that the expectations reflected in such forward-looking statements are reasonable it can give no assurance that such expectations will prove to be correct These forward-looking statements are not guarantees of future performance and involve or rely on a number of risks uncertainties and assumptions that are difficult to predict or beyond our control These forward-looking statements reflect our beliefs and assumptions based on information available to our management at the time the statements are made We caution you that actual outcomes and results may differ materially from what is expressed implied or forecasted by our forward-looking statements and that any or all of our forward-looking statements may turn out to be wrong Forward-looking statements can be affected by inaccurate assumptions and by known or unknown risks and uncertainties including the following
bull Market conditionsbull The effects of industry economic financial or political conditions outside our control including weakness in capital marketsbull Quarterly variations in our operating resultsbull Trends and growth opportunities in relevant marketsbull The cost of borrowing availability of credit and cash fluctuations in the price and volume of our common stock debt covenant compliance interest rate fluctuations and other factors affecting our financing and investing activitiesbull Delays reductions in scope or cancellations of anticipated pending or existing projects including as a result of weather regulatory or permitting issues environmental processes project performance issues claimed force majeure events or our customers capital
constraintsbull The successful negotiation execution performance and completion of anticipated pending and existing contracts including the ability to obtain awards of projects on which we bid or are otherwise discussing with customersbull Our ability to retain key personnel and qualified employees
Forward Looking Statement Disclaimerbull Our ability to attract or the potential shortage of skilled labor bull Our dependence on fixed price contracts and the potential to incur losses with respect to the contractsbull Estimates relating to our use of percentage-of-completion accountingbull Adverse weatherbull Our ability to generate internal growthbull Competition in our business including our ability to effectively compete for new projects and market sharebull The effect of natural gas natural gas liquids and oil prices on our operations and growth opportunities and on
our customersrsquo capital programs and demand for our servicesbull The future development of natural resourcesbull The failure of existing or potential legislative actions to result in demand for our servicesbull Liabilities associated with multiemployer pension plans including underfunding of liabilities and termination
or withdrawal liabilitiesbull The possibility of further increases in the liability associated with our withdrawal from a multiemployer
pension planbull Unexpected costs or liabilities that may arise from pending or threatened litigation indemnity obligations or
other claims asserted against us including liabilities for claims that are self-insured or uninsuredbull The outcome of pending or threatened litigationbull Risks relating to the potential unavailability or cancellation of third party insurance the exclusion of coverage
for certain losses and potential increases in premiums for coverage deemed beneficial to usbull Cancellation provisions within our contracts and the risk that contracts expire and are not renewed or are
replaced on less favorable termsbull Loss of customers with whom we have long-standing or significant relationshipsbull The potential that participation in joint ventures or similar structures exposes us to liability andor harm to
our reputation for acts or omissions by our partnersbull Our inability or failure to comply with the terms of our contracts which may result in additional costs
unexcused delays warranty claims failure to meet performance guarantees damages or contract terminations
bull The inability or refusal of our customers to pay for services including the failure to collect outstanding receivables
bull The failure to recover on payment claims against project owners or third party contractors or to obtain adequate compensation for customer-requested change orders
bull The failure of our customers to comply with regulatory requirements applicable to their projects which may result in project delays and cancellations
bull Budgetary or other constraints that may reduce or eliminate tax incentives or government funding for projects which may result in project delays or cancellations
bull Estimates and assumptions in determining our financial results and backlogbull Our ability to realize our backlogbull Risks associated with operating in international markets including instability of foreign governments
currency fluctuations tax and investment strategies as well as compliance with foreign legal systems and cultural practices the US Foreign Corrupt Practices Act and other applicable anti-bribery and anti-corruption laws
bull Our ability to successfully identify complete integrate and realize synergies from acquisitionsbull The potential adverse impact resulting from uncertainty surrounding investments and acquisitions including
the ability to retain key personnel from the acquired businesses and the potential increase in risks already existing in our operations
bull The adverse impact of impairments of goodwill receivables property equipment and other intangible assets or investments
bull Our growth outpacing our decentralized management and infrastructurebull Requirements relating to governmental regulation and changes theretobull Inability to enforce our intellectual property rights or the obsolescence of such rightsbull Risks related to the implementation of an information technology solutionbull The impact of our unionized workforce on our operations including labor stoppages or interruptions due to
strikes or lockoutsbull Potential liabilities and other adverse effects arising from occupational health and safety mattersbull Our dependence on suppliers subcontractors equipment manufacturers and other third party contractorsbull Fluctuations of prices of certain materials used in our businessbull The ability to access sufficient funding to finance desired growth and operationsbull Our ability to obtain performance bondsbull Potential exposure to environmental liabilitiesbull Our ability to continue to meet certain requirements applicable to us and our subsidiariesbull Rapid technological and other structural changes that could reduce the demand for our servicesbull New or changed tax laws treaties or regulationsbull Increased healthcare costs arising from healthcare reform legislation or other governmental actionbull Regulatory changes that result in increased labor costsbull Significant fluctuations in foreign currency exchange rates andbull The other risks and uncertainties as are described elsewhere herein and in our Annual Report on Form 10-K for
the year ended December 31 2016 filed with the SEC and as may be detailed from time to time in our other public filings with the SEC
All of our forward-looking statements whether written or oral are expressly qualified by these cautionary statements and any other cautionary statements that may accompany such forward-looking statements or that are otherwise included in this presentation Should one or more of these risks materialize or should underlying assumptions prove incorrect actual results may vary materially from those expressed or implied in any forward-looking statements Investors are cautioned not to place undue reliance on these forward-looking statements which are current only as of this date We do not undertake and expressly disclaim any obligation to update or revise any forward-looking statements to reflect events or circumstances after the date of this presentation or otherwise and we expressly disclaim any written or oral statements made by any third party regarding the subject matter of this presentation
Slide Number 1
Forward Looking Statement Disclaimer
Key Takeaways
Leading Integrated Infrastructure Solutions Provider
Overview ndash Strategically Focused Operationally Diverse
Overview - Diverse and High Quality Customer Base
Leading Integrated Infrastructure Solutions Provider
Strategic Imperatives
Strategic Imperatives Deliver Profitable Growth
Strategic Acquisitions Criteria and Rationale
Differentiated Competitive Position ndash In the Sweet Spot
Differentiated Competitive Position ndash In the Sweet Spot
Electric Power Infrastructure Services Segment Overview
Power Grid Investment Drivers - Transmission
Power Grid Investment Drivers - Transmission
Power Grid Investment Drivers - Distribution
Oil amp Gas Infrastructure Services Segment Overview
Reconciliation of Adjusted Net Income from Continuing Operations Attributable to Common Stock
Reconciliation of Electric Power and Oil amp Gas Infrastructure Services Segments Operating Income As Adjusted
Reconciliation of Free Cash Flow
Forward Looking Statement Disclaimer
Forward Looking Statement Disclaimer
Free Cash Flow From Continuing Operations
Source
2013
2014
2015
2016
(Support Cash Flow Statement)
Net Cash Provided by Operating Activities of Continuing Operations
370558
247742
618183
381176
(Support Cash Flow Statement)
Less Net Capital Expenditures
(Support Cash Flow Statement)
Additions of Property and Equipment
(221946)
(247216)
(209968)
(212555)
(Support Cash Flow Statement)
Proceeds from Sale of Property and Equipment
14789
14448
26178
21975
(Recalculation)
Net Capital Expenditures
(207157)
(232768)
(183790)
(190580)
(Recalculation)
Free Cash Flow
163401
14974
434393
190596
Adjusted Operating Income Margin
$ in millions
Support for slide 23
Amounts in millions except percentages
Electric Power
Oil amp Gas Infrastructure
123114
123115
123116
123114
Revenues
$ 53027
$ 49373
$ 48505
$ 24446
Operating Income (as reported)
4630
3623
3957
1628
Addback
Provisions for long term contract receivable
1025
-0
-0
-0
Arbitration expense
-0
-0
-0
388
Asset impairment charge
-0
66
57
-0
Operating Income (as adjusted)
$ 5655
$ 3689
$ 4014
$ 2016
Operating income margin (as reported)
87
73
82
67
Operating income margin (as adjusted)
107
75
83
83
Quanta Services Inc and Subsidiaries
Reconciliation of Non-GAAP Financial Measures
Adjusted Diluted Earnings Per Share from Continuing Operations
For the Years Ended December 31
(in thousands except per share information)
(Unaudited)
Estimated Guidance Range
2013
2014
2015
2016
2017
2017
Reconciliation of adjusted net income from continuing operations attributable to common stock
Net income from continuing operations attributable to common stock (GAAP as reported)
$ 372057
$ 269224
$ 120286
$ 198725
$ 247000
$ 275300
Adjustments
Asset impairment charges
-
-
58451
7964
-
-
Severance and restructuring charges
-
-
-
6352
-
-
Acquisition and integration costs
8145
14754
7966
3053
9300
9300
Impact of income tax contingency releases
(9935)
(8099)
-
(20488)
-
-
Impact of tax benefit from realization of previously unrecognized deferred tax asset
-
-
(4228)
-
-
-
Impact of Alberta tax law change
-
-
4982
-
-
-
Provision for long-term contract receivable
-
102460
-
-
-
-
Arbitration expense
-
38848
-
-
-
-
Impact of sale of equity ownership in Howard Energy
(112744)
-
-
-
-
-
Income tax impact of adjustments
39836
(55935)
(16186)
(3982)
(3400)
(3400)
Adjusted net income from continuing operations attributable to common stock before certain non-cash adjustments
297359
361252
171271
191624
252900
281200
Non-cash stock based compensation
34381
37449
36939
41134
47000
47000
Amortization of intangible assets
25865
34257
34848
31685
30600
30600
Income tax impact of non-cash adjustments
(22715)
(26453)
(25817)
(26183)
(28500)
(28500)
Adjusted net income from continuing operations attributable to common stock
$ 334890
$ 406505
$ 217241
$ 238260
$ 302000
$ 330300
Weighted average shares
Weighted average shares outstanding for diluted earnings per share
214978
219690
195120
157288
157300
157300
Weighted average shares outstanding for adjusted diluted earnings per share
214978
219690
195120
157288
157300
157300
Diluted earnings per share from continuing operations attributable to common stock and adjusted diluted earnings per share from continuing operations attributable to common stock
Diluted earnings per share from continuing operations attributable to common stock
$ 173
$ 123
$ 062
$ 126
$ 157
$ 175
Adjusted diluted earnings per share from continuing operations attributable to common stock
$ 156
$ 185
$ 111
$ 151
$ 192
$ 210
Telecom Infrastructure Services Overview
To be an industry leading and true EPC contractor providing comprehensive communications infrastructure solutions to customers in the United States Canada and select markets in Latin America
Goal
Diverse Existing amp Target Customer BaseMarkets Served
Telecom Infrastructure Investment Drivers
bull Telco gigabit fiber to the home deployment programs
bull Cable MSOs deploying DOCSIS 31
bull Upcoming - 5G wireless and fiber backhaul
bull Ongoing 4G wireless network optimization
bull Connect America Fund - rural fiber build-out
bull Federal government funded FirstNet - national wireless network for first responders
United States
bull Backbone and last mile fiber (behind relative to the US)
bull Telco gigabit fiber to the home deployment programs
bull Cable MSOs deploying DOCSIS 31
bull Upcoming - 5G wireless and fiber backhaul
bull Ongoing 4G wireless network optimization
bull Federal government infrastructure initiatives generally positive
Canada
bull Significantly behind North America in both wireline and wireless connectivity
bull However demand for connectivity media and data intensive services is strong
bull Fiber and backhaul networks significantly behind North America
bull Primarily 3G wireless some 4G wireless (country dependent)
bull Various governments have infrastructure expansion initiatives
bull Concession and P3 opportunities
bull Connectivity for quality of life social and commercial reasons
Latin America
Telecom Infrastructure Services Overview
Fiber Builds
Wireless Deployment
Make Ready Services
Civil Construction
Engineering Design
Material Management
EPC
Wireless Wireline
United StatesWireless Wireline
CanadaWireless Wireline
Latin America
Comprehensive Infrastructure Solutions Offered On A Turnkey Discrete Service or EPC Basis
bull Proven greenfield expansion model in Latin America ndash US should be less difficult
Leverage existing US field operations people equipment and property
bull Select strategic acquisitions may play a role but NOT a roll-up approach
Provide wireline and wireless services - heavier on wireline
bull Increasing convergence of wireless and wireline due fiber requirements of both
Project centric nimble approach versus MSA focused EPC services to differentiate
bull Less capital intensive with better margin opportunity
GOAL
STRATEGY
STRATEGY
STRATEGY
STRATEGY
To be the leading communications infrastructure contractor in the markets we serve
Engineer Procure Construct (EPC) Is A Differentiator
bull Quanta has a long history in the EPC business and is increasingly performing select projects on an EPC basisbull Customersrsquo capital programs are at historic levels and growing Projects are getting larger and more complexbull Evolution of regulatory demands competition and alternative pricing models
bull Many customers have limited internal resources and expertise to manage these dynamics and are turning to Quanta for solutions
bull Project cost certainty becoming increasingly important
bull We are enhancing initiatives to ensure we have a scalable comprehensive enterprise-wide capability for EPC projects that is consistently executed across all segments and geographies
bull EPC projects are a meaningful contributor to our current backlog and provide significant opportunity for future growth
Integrated Services
Construction amp Installation
Assessment Planning amp
Development
Engineering amp Design
Procurement Operation and Maintenance
What is Infrastructure Solutions
Infrastructure Solutions represent strategic partnerships with customers and capital partners
bull Public private partnerships (P3)bull Concessionsbull Build Own Operate or Transfer
(BOOT)bull Build to Suit (BTS) arrangements
These solutions are a growth engine for each of our segments and geographies and a core component of our strategic
imperative to deliver differentiated solutions to our customers
Encompasses
Infrastructure Solutions Drivers
A Combination of Drivers are Occurring that Create Demand and Opportunity for Our Infrastructure Solutions
bull Provide transparency to a project shape design constructability risk allocation and overall project structure
bull Manages risk that yields more informed EPC project decisions
bull Improves success rate of both winning the engagement and successful execution
bull Where appropriate we invest alongside our partners
bull Significant capital needs to fund the substantial infrastructure needs
bull Utilization of concessions public private partnerships (P3) and private infrastructure partnerships to fund and attract high-quality entities for complex projects
bull Changes in regulation (such as FERC Order 1000)
bull New entrants together with high interest and availability of investor infrastructure investment capital
Quanta Is A True Partner
bull Quanta increasingly sought as a partner for our execution capabilities the need for price certainty and our financial strength
bull Projects are larger more complex greater scope Typically under lump-sum turnkey arrangements which create greater opportunities and risks for Quanta
bull Successful Infrastructure Solutions and project execution track record
Quanta Sought for Executionamp Track Record
Market Structure amp Projects Getting More Complex
29
Fully Integrated Solutions Based Provider
Infrastructure Solutions Provides A Solutions Based Tool for Quanta to Partner with Customers Enhance Relationships and Create New Customer and Project Opportunities
EPC
Capitalbull Determine capital structurebull Source capitalbull Quanta minority direct
investmentbull First Infrastructure Capital
Advisors
PartnershipsPartner withbull Customersbull Equity Capital
(4) Includes $802 million of expense net of tax or $036 per diluted share from an arbitration decision charge to provision for long-term contract receivable and the benefit associated with release of certain income tax contingencies
2013 2014 2015 2016 2017 Est
($ in millions)Revenue
$140$122
$062
$126
$163
2013 2014 2015 2016 2017Est
(4)
(5)
(6)
Electric Power Oil amp Gas Infrastructure
GAAP Diluted EPS (1)
$156
$185
$111
$151
$195
2013 2014 2015 2016 2017Est
Adjusted Diluted EPS (1)
$6412
(2) Represents the midpoint of guidance range
(2)
$7747
(2) (2) $173
(3) Includes $033 gain from sale of Howard Energy investment
$9300(3)
(1) From continuing operations
$7572
(5) Includes $734 million of project losses Also includes $454 million of expense net of tax or $023 per diluted share from net asset impairment charges
$7651
(6) Includes $548 million of project losses and $71 million of expense net of tax or $005 per diluted share from net asset impairment charges Also includes tax benefits of $205 million or $013 per share associated with the expiration of various federal and state tax statute of limitations periods
Recent Financial Performance amp 2017 ExpectationsFor the Years Ended December 31
($ in millions)Electric Power
$4542
$5303$4937 $4850
115107
7583
2013 2014 2015 2016 2017 Est
Revenue Op Margin
(2)
(1) Operating margin excludes a $1025 million charge to cost of services for long-term contract receivable in 2014 Refer to appendix for non-GAAP reconciliation(2) Excludes a $66 million property and equipment impairment charge Includes the impact of $661 million of project losses Refer to appendix for non-GAAP reconciliation(3) Excludes a $57 million asset impairment charge Includes the impact of $548 million of project losses Refer to appendix for non-GAAP reconciliation
(1) (1)
(2)(3)
f Est revenue growth approaching 15 vs 2016
Est operating incomemargins of 90 to 95
Guidance Commentary($ in millions)
Oil amp Gas Infrastructure
(4) Excludes a $388 million expense associated with an arbitration decision Refer to appendix for non-GAAP reconciliation(5) Includes $73 million of project losses
Liquidity includes cash and cash equivalents and availability under our revolving credit facility as described in our Form 10k
Historical Cash Flow Generation
$163
$15
$434
$191
2013 2014 2015 2016
Cash Flow from Continuing Operations
($ in millions)
Free Cash Flow from Continuing Operations
$371
$248
$618
$381
2013 2014 2015 2016
Net cash provided by operating activities from continuing operations plus proceeds from sale of property and equipment less additions of property and equipment
For the Years Ending December 31($ in millions)
For the Years Ending December 31
Committed to Generating Shareholder Value
Executed on $125 Billion Share Repurchase Authorizationbull Aug 2015 ndash Announced a new $125 billion share repurchase
authorization through Feb 28 2017bull Completed a $750 million accelerated stock repurchase (ASR)
arrangement in April 2016bull Acquired 351 million shares at $2136 per share
bull $500 million for opportunistic repurchases through Feb 28 2017bull $450 million 192 million shares retired
Completed $500 Million Share Repurchase Authorizationbull Completed previous $500 million share repurchase program in 2015bull Acquired approximately 174 million shares for total cost of $500
million
Acquired $17 Billion of Quanta Common Stock
Under Previous Programs Quanta Has Acquired Approximately 32 of Its Outstanding Stock
$2197$1951
$1573 $1573
0
25
50
75
100
125
150
175
200
225
$0000
$500000
$1000000
$1500000
$2000000
$2500000
$3000000
2014 2015 2016 2017E
Net Income Required to Generate $001 In EPS
Avg Dil Shs Out
Earnings Power Improvement
$ in
Tho
usan
ds
Shares in Millions
May 25 2017 ndash Announced New $300 Million Share Repurchase Authorizationbull Up to $300 million through June 30 2020
Opportunistic amp Disciplined Capital Allocation
Capital Deployment Preference (Amounts in millions)
bull Working Capitalbull Capital Expendituresbull Acquisitionsbull Investmentsbull Return of Capital
bull Generally in sync with preference however hellip
bull Financial strength provides the ability to be opportunistic
bull Flexible and strategic capital allocation is a competitive advantage
Capital Deployment Posture
Financial Strength Allows for Flexible and Strategic Capital Allocation ndash A Competitive Advantage
2013 ndash 2016 Sources amp Uses of Cash
Sources
Cash Flow fromOperations
DivestitureProceeds
BorrowingsInvestment Sales
$3099
$1667
$842
$369$221
Uses
StockRepurchase
CAPEX amp OtherNet
Acquisitions Net
Investments
$1700
$900
$728
$54$3382
54
27
127
50
27
21
2
Amounts reflect the retrospective application of a recent accounting pronouncement related to the classification of tax withholding payments for share-based compensation
Foundation For Growth amp Improved Profitability
Multi-Year Growth Opportunities
Innovative Industry Leading Solutions
Scale amp Scope
Financial Strength
Operational amp Safety Excellence
QuantaServicesIR
QuantaIR
Connect With Quanta Services Investor Relations
Corporate Office2800 Post Oak Blvd Suite 2600Houston TX 77056713-629-7600wwwquantaservicescom
Investor ContactKip Rupp CFAVice President ndash Investor Relations713-341-7260investorsquantaservicescom
Reconciliation of Adjusted Net Income from Continuing Operations Attributable to Common Stock
2013 2014 2015 2016 2017 2017Reconciliation of adjusted net income from continuing operations attributable to common stockNet income from continuing operations attributable to common stock (GAAP as reported) 372057$ 269224$ 120286$ 198725$ 247000$ 275300$ Adjustments
Asset impairment charges - - 58451 7964 - -Severance and restructuring charges - - - 6352 - -Acquisition and integration costs 8145 14754 7966 3053 9300 9300 Impact of income tax contingency releases (9935) (8099) - (20488) - -Impact of tax benefit from realization of previously unrecognized deferred tax asset - - (4228) - - -Impact of Alberta tax law change - - 4982 - - -Provision for long-term contract receivable - 102460 - - - -Arbitration expense - 38848 - - - -Impact of sale of equity ownership in Howard Energy (112744) - - - - -Income tax impact of adjustments 39836 (55935) (16186) (3982) (3400) (3400)
Adjusted net income from continuing operations attributable to common stock before certain non-cash adjustments 297359 361252 171271 191624 252900 281200
Non-cash stock based compensation 34381 37449 36939 41134 47000 47000 Amortization of intangible assets 25865 34257 34848 31685 30600 30600 Income tax impact of non-cash adjustments (22715) (26453) (25817) (26183) (28500) (28500)
Adjusted net income from continuing operations attributable to common stock 334890$ 406505$ 217241$ 238260$ 302000$ 330300$ Weighted average sharesWeighted average shares outstanding for diluted earnings per share 214978 219690 195120 157288 157300 157300 Weighted average shares outstanding for adjusted diluted earnings per share 214978 219690 195120 157288 157300 157300 Diluted earnings per share from continuing operations attributable to common stock and adjusted diluted earnings per share from continuing operations attributable to common stockDiluted earnings per share from continuing operations attributable to common stock 173$ 123$ 062$ 126$ 157$ 175$ Adjusted diluted earnings per share from continuing operations attributable to common stock 156$ 185$ 111$ 151$ 192$ 210$
Estimated Guidance Range
For the Years Ended December 31
(in thousands except per share information)(Unaudited)
Recast of Adjusted Diluted
Reconciliation of Electric Power and Oil amp Gas Infrastructure Services Segments Operating Income As Adjusted
Amounts in millions except percentagesOil amp Gas
Infrastructure12312014 12312015 12312016 12312014
Revenues 53027$ 49373$ 48505$ 24446$
Operating Income (as reported) 4630 3623 3957 1628
Addback Provisions for long term contract receivable 1025 - - - Arbitration expense - - - 388 Asset impairment charge - 66 57 -
Operating Income (as adjusted) 5655$ 3689$ 4014$ 2016$
Operating income margin (as reported) 87 73 82 67Operating income margin (as adjusted) 107 75 83 83
Electric Power
Sheet1
Reconciliation of Free Cash Flow
2013 2014 2015 2016Net Cash Provided by Operating Activities of Continuing Operations 370558 247742 618183 381176 Less Net Capital ExpendituresAdditions of Property and Equipment (221946) (247216) (209968) (212555) Proceeds from Sale of Property and Equipment 14789 14448 26178 21975 Net Capital Expenditures (207157) (232768) (183790) (190580)
Free Cash Flow 163401 14974 434393 190596
Free Cash Flow from Cont Ops
Forward Looking Statement DisclaimerThis presentation (and oral statements regarding the subject matter of this presentation) includes ldquoforward-looking statementsrdquo intended to qualify for the safe harbor from liability established by the Private Securities Litigation Reform Act of 1995 These statements reflect assumptions expectations projections intentions or beliefs about future events and use words such as anticipate estimate project forecast may will should could expect believe plan intend and other words of similar meaning You can identify these statements by the fact that they do not relate strictly to historical or current facts In particular these include but are not limited to statements relating to the following
bull Projected revenues net income earnings per share attributable to common stock backlog margins capital expenditures weighted average shares outstanding tax rates and other projections of operating or financial resultsbull Our business or financial outlook growth or opportunities in particular marketsbull The potential benefits from acquisitions and investmentsbull The expected financial and operational performance of acquired businessesbull Future capital allocation initiativesbull Our ability to deliver increased value and return capital to stockholders bull The strategic use of our balance sheetbull The expected value of contracts or intended contracts with customersbull The scope services term and results of any projects awarded or expected to be awarded for services to be provided by usbull The anticipated commencement and completion dates for any projects awardedbull The development of larger electric transmission and oil and natural gas pipeline projects and the level of oil natural gas and natural gas liquids prices and their impact on our business or the demand for our services bull The impact of existing or potential energy legislation bull Potential opportunities that may be indicated by bidding activity or discussions with customersbull The expected outcome of pending or threatened litigation bull Beliefs and assumptions about the collectability of receivablesbull The business plans or financial condition of our customersbull Our plans and strategies bull The current economic and regulatory conditions and trends in the industries we serve bull Possible recovery on pending or contemplated change orders or affirmative claims against customers or third parties and bull Other statements reflecting expectations intentions assumptions or beliefs about future events and other statements that do not relate strictly to historical or current facts
Although our management believes that the expectations reflected in such forward-looking statements are reasonable it can give no assurance that such expectations will prove to be correct These forward-looking statements are not guarantees of future performance and involve or rely on a number of risks uncertainties and assumptions that are difficult to predict or beyond our control These forward-looking statements reflect our beliefs and assumptions based on information available to our management at the time the statements are made We caution you that actual outcomes and results may differ materially from what is expressed implied or forecasted by our forward-looking statements and that any or all of our forward-looking statements may turn out to be wrong Forward-looking statements can be affected by inaccurate assumptions and by known or unknown risks and uncertainties including the following
bull Market conditionsbull The effects of industry economic financial or political conditions outside our control including weakness in capital marketsbull Quarterly variations in our operating resultsbull Trends and growth opportunities in relevant marketsbull The cost of borrowing availability of credit and cash fluctuations in the price and volume of our common stock debt covenant compliance interest rate fluctuations and other factors affecting our financing and investing activitiesbull Delays reductions in scope or cancellations of anticipated pending or existing projects including as a result of weather regulatory or permitting issues environmental processes project performance issues claimed force majeure events or our customers capital
constraintsbull The successful negotiation execution performance and completion of anticipated pending and existing contracts including the ability to obtain awards of projects on which we bid or are otherwise discussing with customersbull Our ability to retain key personnel and qualified employees
Forward Looking Statement Disclaimerbull Our ability to attract or the potential shortage of skilled labor bull Our dependence on fixed price contracts and the potential to incur losses with respect to the contractsbull Estimates relating to our use of percentage-of-completion accountingbull Adverse weatherbull Our ability to generate internal growthbull Competition in our business including our ability to effectively compete for new projects and market sharebull The effect of natural gas natural gas liquids and oil prices on our operations and growth opportunities and on
our customersrsquo capital programs and demand for our servicesbull The future development of natural resourcesbull The failure of existing or potential legislative actions to result in demand for our servicesbull Liabilities associated with multiemployer pension plans including underfunding of liabilities and termination
or withdrawal liabilitiesbull The possibility of further increases in the liability associated with our withdrawal from a multiemployer
pension planbull Unexpected costs or liabilities that may arise from pending or threatened litigation indemnity obligations or
other claims asserted against us including liabilities for claims that are self-insured or uninsuredbull The outcome of pending or threatened litigationbull Risks relating to the potential unavailability or cancellation of third party insurance the exclusion of coverage
for certain losses and potential increases in premiums for coverage deemed beneficial to usbull Cancellation provisions within our contracts and the risk that contracts expire and are not renewed or are
replaced on less favorable termsbull Loss of customers with whom we have long-standing or significant relationshipsbull The potential that participation in joint ventures or similar structures exposes us to liability andor harm to
our reputation for acts or omissions by our partnersbull Our inability or failure to comply with the terms of our contracts which may result in additional costs
unexcused delays warranty claims failure to meet performance guarantees damages or contract terminations
bull The inability or refusal of our customers to pay for services including the failure to collect outstanding receivables
bull The failure to recover on payment claims against project owners or third party contractors or to obtain adequate compensation for customer-requested change orders
bull The failure of our customers to comply with regulatory requirements applicable to their projects which may result in project delays and cancellations
bull Budgetary or other constraints that may reduce or eliminate tax incentives or government funding for projects which may result in project delays or cancellations
bull Estimates and assumptions in determining our financial results and backlogbull Our ability to realize our backlogbull Risks associated with operating in international markets including instability of foreign governments
currency fluctuations tax and investment strategies as well as compliance with foreign legal systems and cultural practices the US Foreign Corrupt Practices Act and other applicable anti-bribery and anti-corruption laws
bull Our ability to successfully identify complete integrate and realize synergies from acquisitionsbull The potential adverse impact resulting from uncertainty surrounding investments and acquisitions including
the ability to retain key personnel from the acquired businesses and the potential increase in risks already existing in our operations
bull The adverse impact of impairments of goodwill receivables property equipment and other intangible assets or investments
bull Our growth outpacing our decentralized management and infrastructurebull Requirements relating to governmental regulation and changes theretobull Inability to enforce our intellectual property rights or the obsolescence of such rightsbull Risks related to the implementation of an information technology solutionbull The impact of our unionized workforce on our operations including labor stoppages or interruptions due to
strikes or lockoutsbull Potential liabilities and other adverse effects arising from occupational health and safety mattersbull Our dependence on suppliers subcontractors equipment manufacturers and other third party contractorsbull Fluctuations of prices of certain materials used in our businessbull The ability to access sufficient funding to finance desired growth and operationsbull Our ability to obtain performance bondsbull Potential exposure to environmental liabilitiesbull Our ability to continue to meet certain requirements applicable to us and our subsidiariesbull Rapid technological and other structural changes that could reduce the demand for our servicesbull New or changed tax laws treaties or regulationsbull Increased healthcare costs arising from healthcare reform legislation or other governmental actionbull Regulatory changes that result in increased labor costsbull Significant fluctuations in foreign currency exchange rates andbull The other risks and uncertainties as are described elsewhere herein and in our Annual Report on Form 10-K for
the year ended December 31 2016 filed with the SEC and as may be detailed from time to time in our other public filings with the SEC
All of our forward-looking statements whether written or oral are expressly qualified by these cautionary statements and any other cautionary statements that may accompany such forward-looking statements or that are otherwise included in this presentation Should one or more of these risks materialize or should underlying assumptions prove incorrect actual results may vary materially from those expressed or implied in any forward-looking statements Investors are cautioned not to place undue reliance on these forward-looking statements which are current only as of this date We do not undertake and expressly disclaim any obligation to update or revise any forward-looking statements to reflect events or circumstances after the date of this presentation or otherwise and we expressly disclaim any written or oral statements made by any third party regarding the subject matter of this presentation
Slide Number 1
Forward Looking Statement Disclaimer
Key Takeaways
Leading Integrated Infrastructure Solutions Provider
Overview ndash Strategically Focused Operationally Diverse
Overview - Diverse and High Quality Customer Base
Leading Integrated Infrastructure Solutions Provider
Strategic Imperatives
Strategic Imperatives Deliver Profitable Growth
Strategic Acquisitions Criteria and Rationale
Differentiated Competitive Position ndash In the Sweet Spot
Differentiated Competitive Position ndash In the Sweet Spot
Electric Power Infrastructure Services Segment Overview
Power Grid Investment Drivers - Transmission
Power Grid Investment Drivers - Transmission
Power Grid Investment Drivers - Distribution
Oil amp Gas Infrastructure Services Segment Overview
Reconciliation of Adjusted Net Income from Continuing Operations Attributable to Common Stock
Reconciliation of Electric Power and Oil amp Gas Infrastructure Services Segments Operating Income As Adjusted
Reconciliation of Free Cash Flow
Forward Looking Statement Disclaimer
Forward Looking Statement Disclaimer
Free Cash Flow From Continuing Operations
Source
2013
2014
2015
2016
(Support Cash Flow Statement)
Net Cash Provided by Operating Activities of Continuing Operations
370558
247742
618183
381176
(Support Cash Flow Statement)
Less Net Capital Expenditures
(Support Cash Flow Statement)
Additions of Property and Equipment
(221946)
(247216)
(209968)
(212555)
(Support Cash Flow Statement)
Proceeds from Sale of Property and Equipment
14789
14448
26178
21975
(Recalculation)
Net Capital Expenditures
(207157)
(232768)
(183790)
(190580)
(Recalculation)
Free Cash Flow
163401
14974
434393
190596
Adjusted Operating Income Margin
$ in millions
Support for slide 23
Amounts in millions except percentages
Electric Power
Oil amp Gas Infrastructure
123114
123115
123116
123114
Revenues
$ 53027
$ 49373
$ 48505
$ 24446
Operating Income (as reported)
4630
3623
3957
1628
Addback
Provisions for long term contract receivable
1025
-0
-0
-0
Arbitration expense
-0
-0
-0
388
Asset impairment charge
-0
66
57
-0
Operating Income (as adjusted)
$ 5655
$ 3689
$ 4014
$ 2016
Operating income margin (as reported)
87
73
82
67
Operating income margin (as adjusted)
107
75
83
83
Quanta Services Inc and Subsidiaries
Reconciliation of Non-GAAP Financial Measures
Adjusted Diluted Earnings Per Share from Continuing Operations
For the Years Ended December 31
(in thousands except per share information)
(Unaudited)
Estimated Guidance Range
2013
2014
2015
2016
2017
2017
Reconciliation of adjusted net income from continuing operations attributable to common stock
Net income from continuing operations attributable to common stock (GAAP as reported)
$ 372057
$ 269224
$ 120286
$ 198725
$ 247000
$ 275300
Adjustments
Asset impairment charges
-
-
58451
7964
-
-
Severance and restructuring charges
-
-
-
6352
-
-
Acquisition and integration costs
8145
14754
7966
3053
9300
9300
Impact of income tax contingency releases
(9935)
(8099)
-
(20488)
-
-
Impact of tax benefit from realization of previously unrecognized deferred tax asset
-
-
(4228)
-
-
-
Impact of Alberta tax law change
-
-
4982
-
-
-
Provision for long-term contract receivable
-
102460
-
-
-
-
Arbitration expense
-
38848
-
-
-
-
Impact of sale of equity ownership in Howard Energy
(112744)
-
-
-
-
-
Income tax impact of adjustments
39836
(55935)
(16186)
(3982)
(3400)
(3400)
Adjusted net income from continuing operations attributable to common stock before certain non-cash adjustments
297359
361252
171271
191624
252900
281200
Non-cash stock based compensation
34381
37449
36939
41134
47000
47000
Amortization of intangible assets
25865
34257
34848
31685
30600
30600
Income tax impact of non-cash adjustments
(22715)
(26453)
(25817)
(26183)
(28500)
(28500)
Adjusted net income from continuing operations attributable to common stock
$ 334890
$ 406505
$ 217241
$ 238260
$ 302000
$ 330300
Weighted average shares
Weighted average shares outstanding for diluted earnings per share
214978
219690
195120
157288
157300
157300
Weighted average shares outstanding for adjusted diluted earnings per share
214978
219690
195120
157288
157300
157300
Diluted earnings per share from continuing operations attributable to common stock and adjusted diluted earnings per share from continuing operations attributable to common stock
Diluted earnings per share from continuing operations attributable to common stock
$ 173
$ 123
$ 062
$ 126
$ 157
$ 175
Adjusted diluted earnings per share from continuing operations attributable to common stock
$ 156
$ 185
$ 111
$ 151
$ 192
$ 210
Telecom Infrastructure Services Overview
Fiber Builds
Wireless Deployment
Make Ready Services
Civil Construction
Engineering Design
Material Management
EPC
Wireless Wireline
United StatesWireless Wireline
CanadaWireless Wireline
Latin America
Comprehensive Infrastructure Solutions Offered On A Turnkey Discrete Service or EPC Basis
bull Proven greenfield expansion model in Latin America ndash US should be less difficult
Leverage existing US field operations people equipment and property
bull Select strategic acquisitions may play a role but NOT a roll-up approach
Provide wireline and wireless services - heavier on wireline
bull Increasing convergence of wireless and wireline due fiber requirements of both
Project centric nimble approach versus MSA focused EPC services to differentiate
bull Less capital intensive with better margin opportunity
GOAL
STRATEGY
STRATEGY
STRATEGY
STRATEGY
To be the leading communications infrastructure contractor in the markets we serve
Engineer Procure Construct (EPC) Is A Differentiator
bull Quanta has a long history in the EPC business and is increasingly performing select projects on an EPC basisbull Customersrsquo capital programs are at historic levels and growing Projects are getting larger and more complexbull Evolution of regulatory demands competition and alternative pricing models
bull Many customers have limited internal resources and expertise to manage these dynamics and are turning to Quanta for solutions
bull Project cost certainty becoming increasingly important
bull We are enhancing initiatives to ensure we have a scalable comprehensive enterprise-wide capability for EPC projects that is consistently executed across all segments and geographies
bull EPC projects are a meaningful contributor to our current backlog and provide significant opportunity for future growth
Integrated Services
Construction amp Installation
Assessment Planning amp
Development
Engineering amp Design
Procurement Operation and Maintenance
What is Infrastructure Solutions
Infrastructure Solutions represent strategic partnerships with customers and capital partners
bull Public private partnerships (P3)bull Concessionsbull Build Own Operate or Transfer
(BOOT)bull Build to Suit (BTS) arrangements
These solutions are a growth engine for each of our segments and geographies and a core component of our strategic
imperative to deliver differentiated solutions to our customers
Encompasses
Infrastructure Solutions Drivers
A Combination of Drivers are Occurring that Create Demand and Opportunity for Our Infrastructure Solutions
bull Provide transparency to a project shape design constructability risk allocation and overall project structure
bull Manages risk that yields more informed EPC project decisions
bull Improves success rate of both winning the engagement and successful execution
bull Where appropriate we invest alongside our partners
bull Significant capital needs to fund the substantial infrastructure needs
bull Utilization of concessions public private partnerships (P3) and private infrastructure partnerships to fund and attract high-quality entities for complex projects
bull Changes in regulation (such as FERC Order 1000)
bull New entrants together with high interest and availability of investor infrastructure investment capital
Quanta Is A True Partner
bull Quanta increasingly sought as a partner for our execution capabilities the need for price certainty and our financial strength
bull Projects are larger more complex greater scope Typically under lump-sum turnkey arrangements which create greater opportunities and risks for Quanta
bull Successful Infrastructure Solutions and project execution track record
Quanta Sought for Executionamp Track Record
Market Structure amp Projects Getting More Complex
29
Fully Integrated Solutions Based Provider
Infrastructure Solutions Provides A Solutions Based Tool for Quanta to Partner with Customers Enhance Relationships and Create New Customer and Project Opportunities
EPC
Capitalbull Determine capital structurebull Source capitalbull Quanta minority direct
investmentbull First Infrastructure Capital
Advisors
PartnershipsPartner withbull Customersbull Equity Capital
(4) Includes $802 million of expense net of tax or $036 per diluted share from an arbitration decision charge to provision for long-term contract receivable and the benefit associated with release of certain income tax contingencies
2013 2014 2015 2016 2017 Est
($ in millions)Revenue
$140$122
$062
$126
$163
2013 2014 2015 2016 2017Est
(4)
(5)
(6)
Electric Power Oil amp Gas Infrastructure
GAAP Diluted EPS (1)
$156
$185
$111
$151
$195
2013 2014 2015 2016 2017Est
Adjusted Diluted EPS (1)
$6412
(2) Represents the midpoint of guidance range
(2)
$7747
(2) (2) $173
(3) Includes $033 gain from sale of Howard Energy investment
$9300(3)
(1) From continuing operations
$7572
(5) Includes $734 million of project losses Also includes $454 million of expense net of tax or $023 per diluted share from net asset impairment charges
$7651
(6) Includes $548 million of project losses and $71 million of expense net of tax or $005 per diluted share from net asset impairment charges Also includes tax benefits of $205 million or $013 per share associated with the expiration of various federal and state tax statute of limitations periods
Recent Financial Performance amp 2017 ExpectationsFor the Years Ended December 31
($ in millions)Electric Power
$4542
$5303$4937 $4850
115107
7583
2013 2014 2015 2016 2017 Est
Revenue Op Margin
(2)
(1) Operating margin excludes a $1025 million charge to cost of services for long-term contract receivable in 2014 Refer to appendix for non-GAAP reconciliation(2) Excludes a $66 million property and equipment impairment charge Includes the impact of $661 million of project losses Refer to appendix for non-GAAP reconciliation(3) Excludes a $57 million asset impairment charge Includes the impact of $548 million of project losses Refer to appendix for non-GAAP reconciliation
(1) (1)
(2)(3)
f Est revenue growth approaching 15 vs 2016
Est operating incomemargins of 90 to 95
Guidance Commentary($ in millions)
Oil amp Gas Infrastructure
(4) Excludes a $388 million expense associated with an arbitration decision Refer to appendix for non-GAAP reconciliation(5) Includes $73 million of project losses
Liquidity includes cash and cash equivalents and availability under our revolving credit facility as described in our Form 10k
Historical Cash Flow Generation
$163
$15
$434
$191
2013 2014 2015 2016
Cash Flow from Continuing Operations
($ in millions)
Free Cash Flow from Continuing Operations
$371
$248
$618
$381
2013 2014 2015 2016
Net cash provided by operating activities from continuing operations plus proceeds from sale of property and equipment less additions of property and equipment
For the Years Ending December 31($ in millions)
For the Years Ending December 31
Committed to Generating Shareholder Value
Executed on $125 Billion Share Repurchase Authorizationbull Aug 2015 ndash Announced a new $125 billion share repurchase
authorization through Feb 28 2017bull Completed a $750 million accelerated stock repurchase (ASR)
arrangement in April 2016bull Acquired 351 million shares at $2136 per share
bull $500 million for opportunistic repurchases through Feb 28 2017bull $450 million 192 million shares retired
Completed $500 Million Share Repurchase Authorizationbull Completed previous $500 million share repurchase program in 2015bull Acquired approximately 174 million shares for total cost of $500
million
Acquired $17 Billion of Quanta Common Stock
Under Previous Programs Quanta Has Acquired Approximately 32 of Its Outstanding Stock
$2197$1951
$1573 $1573
0
25
50
75
100
125
150
175
200
225
$0000
$500000
$1000000
$1500000
$2000000
$2500000
$3000000
2014 2015 2016 2017E
Net Income Required to Generate $001 In EPS
Avg Dil Shs Out
Earnings Power Improvement
$ in
Tho
usan
ds
Shares in Millions
May 25 2017 ndash Announced New $300 Million Share Repurchase Authorizationbull Up to $300 million through June 30 2020
Opportunistic amp Disciplined Capital Allocation
Capital Deployment Preference (Amounts in millions)
bull Working Capitalbull Capital Expendituresbull Acquisitionsbull Investmentsbull Return of Capital
bull Generally in sync with preference however hellip
bull Financial strength provides the ability to be opportunistic
bull Flexible and strategic capital allocation is a competitive advantage
Capital Deployment Posture
Financial Strength Allows for Flexible and Strategic Capital Allocation ndash A Competitive Advantage
2013 ndash 2016 Sources amp Uses of Cash
Sources
Cash Flow fromOperations
DivestitureProceeds
BorrowingsInvestment Sales
$3099
$1667
$842
$369$221
Uses
StockRepurchase
CAPEX amp OtherNet
Acquisitions Net
Investments
$1700
$900
$728
$54$3382
54
27
127
50
27
21
2
Amounts reflect the retrospective application of a recent accounting pronouncement related to the classification of tax withholding payments for share-based compensation
Foundation For Growth amp Improved Profitability
Multi-Year Growth Opportunities
Innovative Industry Leading Solutions
Scale amp Scope
Financial Strength
Operational amp Safety Excellence
QuantaServicesIR
QuantaIR
Connect With Quanta Services Investor Relations
Corporate Office2800 Post Oak Blvd Suite 2600Houston TX 77056713-629-7600wwwquantaservicescom
Investor ContactKip Rupp CFAVice President ndash Investor Relations713-341-7260investorsquantaservicescom
Reconciliation of Adjusted Net Income from Continuing Operations Attributable to Common Stock
2013 2014 2015 2016 2017 2017Reconciliation of adjusted net income from continuing operations attributable to common stockNet income from continuing operations attributable to common stock (GAAP as reported) 372057$ 269224$ 120286$ 198725$ 247000$ 275300$ Adjustments
Asset impairment charges - - 58451 7964 - -Severance and restructuring charges - - - 6352 - -Acquisition and integration costs 8145 14754 7966 3053 9300 9300 Impact of income tax contingency releases (9935) (8099) - (20488) - -Impact of tax benefit from realization of previously unrecognized deferred tax asset - - (4228) - - -Impact of Alberta tax law change - - 4982 - - -Provision for long-term contract receivable - 102460 - - - -Arbitration expense - 38848 - - - -Impact of sale of equity ownership in Howard Energy (112744) - - - - -Income tax impact of adjustments 39836 (55935) (16186) (3982) (3400) (3400)
Adjusted net income from continuing operations attributable to common stock before certain non-cash adjustments 297359 361252 171271 191624 252900 281200
Non-cash stock based compensation 34381 37449 36939 41134 47000 47000 Amortization of intangible assets 25865 34257 34848 31685 30600 30600 Income tax impact of non-cash adjustments (22715) (26453) (25817) (26183) (28500) (28500)
Adjusted net income from continuing operations attributable to common stock 334890$ 406505$ 217241$ 238260$ 302000$ 330300$ Weighted average sharesWeighted average shares outstanding for diluted earnings per share 214978 219690 195120 157288 157300 157300 Weighted average shares outstanding for adjusted diluted earnings per share 214978 219690 195120 157288 157300 157300 Diluted earnings per share from continuing operations attributable to common stock and adjusted diluted earnings per share from continuing operations attributable to common stockDiluted earnings per share from continuing operations attributable to common stock 173$ 123$ 062$ 126$ 157$ 175$ Adjusted diluted earnings per share from continuing operations attributable to common stock 156$ 185$ 111$ 151$ 192$ 210$
Estimated Guidance Range
For the Years Ended December 31
(in thousands except per share information)(Unaudited)
Recast of Adjusted Diluted
Reconciliation of Electric Power and Oil amp Gas Infrastructure Services Segments Operating Income As Adjusted
Amounts in millions except percentagesOil amp Gas
Infrastructure12312014 12312015 12312016 12312014
Revenues 53027$ 49373$ 48505$ 24446$
Operating Income (as reported) 4630 3623 3957 1628
Addback Provisions for long term contract receivable 1025 - - - Arbitration expense - - - 388 Asset impairment charge - 66 57 -
Operating Income (as adjusted) 5655$ 3689$ 4014$ 2016$
Operating income margin (as reported) 87 73 82 67Operating income margin (as adjusted) 107 75 83 83
Electric Power
Sheet1
Reconciliation of Free Cash Flow
2013 2014 2015 2016Net Cash Provided by Operating Activities of Continuing Operations 370558 247742 618183 381176 Less Net Capital ExpendituresAdditions of Property and Equipment (221946) (247216) (209968) (212555) Proceeds from Sale of Property and Equipment 14789 14448 26178 21975 Net Capital Expenditures (207157) (232768) (183790) (190580)
Free Cash Flow 163401 14974 434393 190596
Free Cash Flow from Cont Ops
Forward Looking Statement DisclaimerThis presentation (and oral statements regarding the subject matter of this presentation) includes ldquoforward-looking statementsrdquo intended to qualify for the safe harbor from liability established by the Private Securities Litigation Reform Act of 1995 These statements reflect assumptions expectations projections intentions or beliefs about future events and use words such as anticipate estimate project forecast may will should could expect believe plan intend and other words of similar meaning You can identify these statements by the fact that they do not relate strictly to historical or current facts In particular these include but are not limited to statements relating to the following
bull Projected revenues net income earnings per share attributable to common stock backlog margins capital expenditures weighted average shares outstanding tax rates and other projections of operating or financial resultsbull Our business or financial outlook growth or opportunities in particular marketsbull The potential benefits from acquisitions and investmentsbull The expected financial and operational performance of acquired businessesbull Future capital allocation initiativesbull Our ability to deliver increased value and return capital to stockholders bull The strategic use of our balance sheetbull The expected value of contracts or intended contracts with customersbull The scope services term and results of any projects awarded or expected to be awarded for services to be provided by usbull The anticipated commencement and completion dates for any projects awardedbull The development of larger electric transmission and oil and natural gas pipeline projects and the level of oil natural gas and natural gas liquids prices and their impact on our business or the demand for our services bull The impact of existing or potential energy legislation bull Potential opportunities that may be indicated by bidding activity or discussions with customersbull The expected outcome of pending or threatened litigation bull Beliefs and assumptions about the collectability of receivablesbull The business plans or financial condition of our customersbull Our plans and strategies bull The current economic and regulatory conditions and trends in the industries we serve bull Possible recovery on pending or contemplated change orders or affirmative claims against customers or third parties and bull Other statements reflecting expectations intentions assumptions or beliefs about future events and other statements that do not relate strictly to historical or current facts
Although our management believes that the expectations reflected in such forward-looking statements are reasonable it can give no assurance that such expectations will prove to be correct These forward-looking statements are not guarantees of future performance and involve or rely on a number of risks uncertainties and assumptions that are difficult to predict or beyond our control These forward-looking statements reflect our beliefs and assumptions based on information available to our management at the time the statements are made We caution you that actual outcomes and results may differ materially from what is expressed implied or forecasted by our forward-looking statements and that any or all of our forward-looking statements may turn out to be wrong Forward-looking statements can be affected by inaccurate assumptions and by known or unknown risks and uncertainties including the following
bull Market conditionsbull The effects of industry economic financial or political conditions outside our control including weakness in capital marketsbull Quarterly variations in our operating resultsbull Trends and growth opportunities in relevant marketsbull The cost of borrowing availability of credit and cash fluctuations in the price and volume of our common stock debt covenant compliance interest rate fluctuations and other factors affecting our financing and investing activitiesbull Delays reductions in scope or cancellations of anticipated pending or existing projects including as a result of weather regulatory or permitting issues environmental processes project performance issues claimed force majeure events or our customers capital
constraintsbull The successful negotiation execution performance and completion of anticipated pending and existing contracts including the ability to obtain awards of projects on which we bid or are otherwise discussing with customersbull Our ability to retain key personnel and qualified employees
Forward Looking Statement Disclaimerbull Our ability to attract or the potential shortage of skilled labor bull Our dependence on fixed price contracts and the potential to incur losses with respect to the contractsbull Estimates relating to our use of percentage-of-completion accountingbull Adverse weatherbull Our ability to generate internal growthbull Competition in our business including our ability to effectively compete for new projects and market sharebull The effect of natural gas natural gas liquids and oil prices on our operations and growth opportunities and on
our customersrsquo capital programs and demand for our servicesbull The future development of natural resourcesbull The failure of existing or potential legislative actions to result in demand for our servicesbull Liabilities associated with multiemployer pension plans including underfunding of liabilities and termination
or withdrawal liabilitiesbull The possibility of further increases in the liability associated with our withdrawal from a multiemployer
pension planbull Unexpected costs or liabilities that may arise from pending or threatened litigation indemnity obligations or
other claims asserted against us including liabilities for claims that are self-insured or uninsuredbull The outcome of pending or threatened litigationbull Risks relating to the potential unavailability or cancellation of third party insurance the exclusion of coverage
for certain losses and potential increases in premiums for coverage deemed beneficial to usbull Cancellation provisions within our contracts and the risk that contracts expire and are not renewed or are
replaced on less favorable termsbull Loss of customers with whom we have long-standing or significant relationshipsbull The potential that participation in joint ventures or similar structures exposes us to liability andor harm to
our reputation for acts or omissions by our partnersbull Our inability or failure to comply with the terms of our contracts which may result in additional costs
unexcused delays warranty claims failure to meet performance guarantees damages or contract terminations
bull The inability or refusal of our customers to pay for services including the failure to collect outstanding receivables
bull The failure to recover on payment claims against project owners or third party contractors or to obtain adequate compensation for customer-requested change orders
bull The failure of our customers to comply with regulatory requirements applicable to their projects which may result in project delays and cancellations
bull Budgetary or other constraints that may reduce or eliminate tax incentives or government funding for projects which may result in project delays or cancellations
bull Estimates and assumptions in determining our financial results and backlogbull Our ability to realize our backlogbull Risks associated with operating in international markets including instability of foreign governments
currency fluctuations tax and investment strategies as well as compliance with foreign legal systems and cultural practices the US Foreign Corrupt Practices Act and other applicable anti-bribery and anti-corruption laws
bull Our ability to successfully identify complete integrate and realize synergies from acquisitionsbull The potential adverse impact resulting from uncertainty surrounding investments and acquisitions including
the ability to retain key personnel from the acquired businesses and the potential increase in risks already existing in our operations
bull The adverse impact of impairments of goodwill receivables property equipment and other intangible assets or investments
bull Our growth outpacing our decentralized management and infrastructurebull Requirements relating to governmental regulation and changes theretobull Inability to enforce our intellectual property rights or the obsolescence of such rightsbull Risks related to the implementation of an information technology solutionbull The impact of our unionized workforce on our operations including labor stoppages or interruptions due to
strikes or lockoutsbull Potential liabilities and other adverse effects arising from occupational health and safety mattersbull Our dependence on suppliers subcontractors equipment manufacturers and other third party contractorsbull Fluctuations of prices of certain materials used in our businessbull The ability to access sufficient funding to finance desired growth and operationsbull Our ability to obtain performance bondsbull Potential exposure to environmental liabilitiesbull Our ability to continue to meet certain requirements applicable to us and our subsidiariesbull Rapid technological and other structural changes that could reduce the demand for our servicesbull New or changed tax laws treaties or regulationsbull Increased healthcare costs arising from healthcare reform legislation or other governmental actionbull Regulatory changes that result in increased labor costsbull Significant fluctuations in foreign currency exchange rates andbull The other risks and uncertainties as are described elsewhere herein and in our Annual Report on Form 10-K for
the year ended December 31 2016 filed with the SEC and as may be detailed from time to time in our other public filings with the SEC
All of our forward-looking statements whether written or oral are expressly qualified by these cautionary statements and any other cautionary statements that may accompany such forward-looking statements or that are otherwise included in this presentation Should one or more of these risks materialize or should underlying assumptions prove incorrect actual results may vary materially from those expressed or implied in any forward-looking statements Investors are cautioned not to place undue reliance on these forward-looking statements which are current only as of this date We do not undertake and expressly disclaim any obligation to update or revise any forward-looking statements to reflect events or circumstances after the date of this presentation or otherwise and we expressly disclaim any written or oral statements made by any third party regarding the subject matter of this presentation
Slide Number 1
Forward Looking Statement Disclaimer
Key Takeaways
Leading Integrated Infrastructure Solutions Provider
Overview ndash Strategically Focused Operationally Diverse
Overview - Diverse and High Quality Customer Base
Leading Integrated Infrastructure Solutions Provider
Strategic Imperatives
Strategic Imperatives Deliver Profitable Growth
Strategic Acquisitions Criteria and Rationale
Differentiated Competitive Position ndash In the Sweet Spot
Differentiated Competitive Position ndash In the Sweet Spot
Electric Power Infrastructure Services Segment Overview
Power Grid Investment Drivers - Transmission
Power Grid Investment Drivers - Transmission
Power Grid Investment Drivers - Distribution
Oil amp Gas Infrastructure Services Segment Overview
Reconciliation of Adjusted Net Income from Continuing Operations Attributable to Common Stock
Reconciliation of Electric Power and Oil amp Gas Infrastructure Services Segments Operating Income As Adjusted
Reconciliation of Free Cash Flow
Forward Looking Statement Disclaimer
Forward Looking Statement Disclaimer
Free Cash Flow From Continuing Operations
Source
2013
2014
2015
2016
(Support Cash Flow Statement)
Net Cash Provided by Operating Activities of Continuing Operations
370558
247742
618183
381176
(Support Cash Flow Statement)
Less Net Capital Expenditures
(Support Cash Flow Statement)
Additions of Property and Equipment
(221946)
(247216)
(209968)
(212555)
(Support Cash Flow Statement)
Proceeds from Sale of Property and Equipment
14789
14448
26178
21975
(Recalculation)
Net Capital Expenditures
(207157)
(232768)
(183790)
(190580)
(Recalculation)
Free Cash Flow
163401
14974
434393
190596
Adjusted Operating Income Margin
$ in millions
Support for slide 23
Amounts in millions except percentages
Electric Power
Oil amp Gas Infrastructure
123114
123115
123116
123114
Revenues
$ 53027
$ 49373
$ 48505
$ 24446
Operating Income (as reported)
4630
3623
3957
1628
Addback
Provisions for long term contract receivable
1025
-0
-0
-0
Arbitration expense
-0
-0
-0
388
Asset impairment charge
-0
66
57
-0
Operating Income (as adjusted)
$ 5655
$ 3689
$ 4014
$ 2016
Operating income margin (as reported)
87
73
82
67
Operating income margin (as adjusted)
107
75
83
83
Quanta Services Inc and Subsidiaries
Reconciliation of Non-GAAP Financial Measures
Adjusted Diluted Earnings Per Share from Continuing Operations
For the Years Ended December 31
(in thousands except per share information)
(Unaudited)
Estimated Guidance Range
2013
2014
2015
2016
2017
2017
Reconciliation of adjusted net income from continuing operations attributable to common stock
Net income from continuing operations attributable to common stock (GAAP as reported)
$ 372057
$ 269224
$ 120286
$ 198725
$ 247000
$ 275300
Adjustments
Asset impairment charges
-
-
58451
7964
-
-
Severance and restructuring charges
-
-
-
6352
-
-
Acquisition and integration costs
8145
14754
7966
3053
9300
9300
Impact of income tax contingency releases
(9935)
(8099)
-
(20488)
-
-
Impact of tax benefit from realization of previously unrecognized deferred tax asset
-
-
(4228)
-
-
-
Impact of Alberta tax law change
-
-
4982
-
-
-
Provision for long-term contract receivable
-
102460
-
-
-
-
Arbitration expense
-
38848
-
-
-
-
Impact of sale of equity ownership in Howard Energy
(112744)
-
-
-
-
-
Income tax impact of adjustments
39836
(55935)
(16186)
(3982)
(3400)
(3400)
Adjusted net income from continuing operations attributable to common stock before certain non-cash adjustments
297359
361252
171271
191624
252900
281200
Non-cash stock based compensation
34381
37449
36939
41134
47000
47000
Amortization of intangible assets
25865
34257
34848
31685
30600
30600
Income tax impact of non-cash adjustments
(22715)
(26453)
(25817)
(26183)
(28500)
(28500)
Adjusted net income from continuing operations attributable to common stock
$ 334890
$ 406505
$ 217241
$ 238260
$ 302000
$ 330300
Weighted average shares
Weighted average shares outstanding for diluted earnings per share
214978
219690
195120
157288
157300
157300
Weighted average shares outstanding for adjusted diluted earnings per share
214978
219690
195120
157288
157300
157300
Diluted earnings per share from continuing operations attributable to common stock and adjusted diluted earnings per share from continuing operations attributable to common stock
Diluted earnings per share from continuing operations attributable to common stock
$ 173
$ 123
$ 062
$ 126
$ 157
$ 175
Adjusted diluted earnings per share from continuing operations attributable to common stock
$ 156
$ 185
$ 111
$ 151
$ 192
$ 210
29
Fully Integrated Solutions Based Provider
Infrastructure Solutions Provides A Solutions Based Tool for Quanta to Partner with Customers Enhance Relationships and Create New Customer and Project Opportunities
EPC
Capitalbull Determine capital structurebull Source capitalbull Quanta minority direct
investmentbull First Infrastructure Capital
Advisors
PartnershipsPartner withbull Customersbull Equity Capital
(4) Includes $802 million of expense net of tax or $036 per diluted share from an arbitration decision charge to provision for long-term contract receivable and the benefit associated with release of certain income tax contingencies
2013 2014 2015 2016 2017 Est
($ in millions)Revenue
$140$122
$062
$126
$163
2013 2014 2015 2016 2017Est
(4)
(5)
(6)
Electric Power Oil amp Gas Infrastructure
GAAP Diluted EPS (1)
$156
$185
$111
$151
$195
2013 2014 2015 2016 2017Est
Adjusted Diluted EPS (1)
$6412
(2) Represents the midpoint of guidance range
(2)
$7747
(2) (2) $173
(3) Includes $033 gain from sale of Howard Energy investment
$9300(3)
(1) From continuing operations
$7572
(5) Includes $734 million of project losses Also includes $454 million of expense net of tax or $023 per diluted share from net asset impairment charges
$7651
(6) Includes $548 million of project losses and $71 million of expense net of tax or $005 per diluted share from net asset impairment charges Also includes tax benefits of $205 million or $013 per share associated with the expiration of various federal and state tax statute of limitations periods
Recent Financial Performance amp 2017 ExpectationsFor the Years Ended December 31
($ in millions)Electric Power
$4542
$5303$4937 $4850
115107
7583
2013 2014 2015 2016 2017 Est
Revenue Op Margin
(2)
(1) Operating margin excludes a $1025 million charge to cost of services for long-term contract receivable in 2014 Refer to appendix for non-GAAP reconciliation(2) Excludes a $66 million property and equipment impairment charge Includes the impact of $661 million of project losses Refer to appendix for non-GAAP reconciliation(3) Excludes a $57 million asset impairment charge Includes the impact of $548 million of project losses Refer to appendix for non-GAAP reconciliation
(1) (1)
(2)(3)
f Est revenue growth approaching 15 vs 2016
Est operating incomemargins of 90 to 95
Guidance Commentary($ in millions)
Oil amp Gas Infrastructure
(4) Excludes a $388 million expense associated with an arbitration decision Refer to appendix for non-GAAP reconciliation(5) Includes $73 million of project losses
Liquidity includes cash and cash equivalents and availability under our revolving credit facility as described in our Form 10k
Historical Cash Flow Generation
$163
$15
$434
$191
2013 2014 2015 2016
Cash Flow from Continuing Operations
($ in millions)
Free Cash Flow from Continuing Operations
$371
$248
$618
$381
2013 2014 2015 2016
Net cash provided by operating activities from continuing operations plus proceeds from sale of property and equipment less additions of property and equipment
For the Years Ending December 31($ in millions)
For the Years Ending December 31
Committed to Generating Shareholder Value
Executed on $125 Billion Share Repurchase Authorizationbull Aug 2015 ndash Announced a new $125 billion share repurchase
authorization through Feb 28 2017bull Completed a $750 million accelerated stock repurchase (ASR)
arrangement in April 2016bull Acquired 351 million shares at $2136 per share
bull $500 million for opportunistic repurchases through Feb 28 2017bull $450 million 192 million shares retired
Completed $500 Million Share Repurchase Authorizationbull Completed previous $500 million share repurchase program in 2015bull Acquired approximately 174 million shares for total cost of $500
million
Acquired $17 Billion of Quanta Common Stock
Under Previous Programs Quanta Has Acquired Approximately 32 of Its Outstanding Stock
$2197$1951
$1573 $1573
0
25
50
75
100
125
150
175
200
225
$0000
$500000
$1000000
$1500000
$2000000
$2500000
$3000000
2014 2015 2016 2017E
Net Income Required to Generate $001 In EPS
Avg Dil Shs Out
Earnings Power Improvement
$ in
Tho
usan
ds
Shares in Millions
May 25 2017 ndash Announced New $300 Million Share Repurchase Authorizationbull Up to $300 million through June 30 2020
Opportunistic amp Disciplined Capital Allocation
Capital Deployment Preference (Amounts in millions)
bull Working Capitalbull Capital Expendituresbull Acquisitionsbull Investmentsbull Return of Capital
bull Generally in sync with preference however hellip
bull Financial strength provides the ability to be opportunistic
bull Flexible and strategic capital allocation is a competitive advantage
Capital Deployment Posture
Financial Strength Allows for Flexible and Strategic Capital Allocation ndash A Competitive Advantage
2013 ndash 2016 Sources amp Uses of Cash
Sources
Cash Flow fromOperations
DivestitureProceeds
BorrowingsInvestment Sales
$3099
$1667
$842
$369$221
Uses
StockRepurchase
CAPEX amp OtherNet
Acquisitions Net
Investments
$1700
$900
$728
$54$3382
54
27
127
50
27
21
2
Amounts reflect the retrospective application of a recent accounting pronouncement related to the classification of tax withholding payments for share-based compensation
Foundation For Growth amp Improved Profitability
Multi-Year Growth Opportunities
Innovative Industry Leading Solutions
Scale amp Scope
Financial Strength
Operational amp Safety Excellence
QuantaServicesIR
QuantaIR
Connect With Quanta Services Investor Relations
Corporate Office2800 Post Oak Blvd Suite 2600Houston TX 77056713-629-7600wwwquantaservicescom
Investor ContactKip Rupp CFAVice President ndash Investor Relations713-341-7260investorsquantaservicescom
Reconciliation of Adjusted Net Income from Continuing Operations Attributable to Common Stock
2013 2014 2015 2016 2017 2017Reconciliation of adjusted net income from continuing operations attributable to common stockNet income from continuing operations attributable to common stock (GAAP as reported) 372057$ 269224$ 120286$ 198725$ 247000$ 275300$ Adjustments
Asset impairment charges - - 58451 7964 - -Severance and restructuring charges - - - 6352 - -Acquisition and integration costs 8145 14754 7966 3053 9300 9300 Impact of income tax contingency releases (9935) (8099) - (20488) - -Impact of tax benefit from realization of previously unrecognized deferred tax asset - - (4228) - - -Impact of Alberta tax law change - - 4982 - - -Provision for long-term contract receivable - 102460 - - - -Arbitration expense - 38848 - - - -Impact of sale of equity ownership in Howard Energy (112744) - - - - -Income tax impact of adjustments 39836 (55935) (16186) (3982) (3400) (3400)
Adjusted net income from continuing operations attributable to common stock before certain non-cash adjustments 297359 361252 171271 191624 252900 281200
Non-cash stock based compensation 34381 37449 36939 41134 47000 47000 Amortization of intangible assets 25865 34257 34848 31685 30600 30600 Income tax impact of non-cash adjustments (22715) (26453) (25817) (26183) (28500) (28500)
Adjusted net income from continuing operations attributable to common stock 334890$ 406505$ 217241$ 238260$ 302000$ 330300$ Weighted average sharesWeighted average shares outstanding for diluted earnings per share 214978 219690 195120 157288 157300 157300 Weighted average shares outstanding for adjusted diluted earnings per share 214978 219690 195120 157288 157300 157300 Diluted earnings per share from continuing operations attributable to common stock and adjusted diluted earnings per share from continuing operations attributable to common stockDiluted earnings per share from continuing operations attributable to common stock 173$ 123$ 062$ 126$ 157$ 175$ Adjusted diluted earnings per share from continuing operations attributable to common stock 156$ 185$ 111$ 151$ 192$ 210$
Estimated Guidance Range
For the Years Ended December 31
(in thousands except per share information)(Unaudited)
Recast of Adjusted Diluted
Reconciliation of Electric Power and Oil amp Gas Infrastructure Services Segments Operating Income As Adjusted
Amounts in millions except percentagesOil amp Gas
Infrastructure12312014 12312015 12312016 12312014
Revenues 53027$ 49373$ 48505$ 24446$
Operating Income (as reported) 4630 3623 3957 1628
Addback Provisions for long term contract receivable 1025 - - - Arbitration expense - - - 388 Asset impairment charge - 66 57 -
Operating Income (as adjusted) 5655$ 3689$ 4014$ 2016$
Operating income margin (as reported) 87 73 82 67Operating income margin (as adjusted) 107 75 83 83
Electric Power
Sheet1
Reconciliation of Free Cash Flow
2013 2014 2015 2016Net Cash Provided by Operating Activities of Continuing Operations 370558 247742 618183 381176 Less Net Capital ExpendituresAdditions of Property and Equipment (221946) (247216) (209968) (212555) Proceeds from Sale of Property and Equipment 14789 14448 26178 21975 Net Capital Expenditures (207157) (232768) (183790) (190580)
Free Cash Flow 163401 14974 434393 190596
Free Cash Flow from Cont Ops
Forward Looking Statement DisclaimerThis presentation (and oral statements regarding the subject matter of this presentation) includes ldquoforward-looking statementsrdquo intended to qualify for the safe harbor from liability established by the Private Securities Litigation Reform Act of 1995 These statements reflect assumptions expectations projections intentions or beliefs about future events and use words such as anticipate estimate project forecast may will should could expect believe plan intend and other words of similar meaning You can identify these statements by the fact that they do not relate strictly to historical or current facts In particular these include but are not limited to statements relating to the following
bull Projected revenues net income earnings per share attributable to common stock backlog margins capital expenditures weighted average shares outstanding tax rates and other projections of operating or financial resultsbull Our business or financial outlook growth or opportunities in particular marketsbull The potential benefits from acquisitions and investmentsbull The expected financial and operational performance of acquired businessesbull Future capital allocation initiativesbull Our ability to deliver increased value and return capital to stockholders bull The strategic use of our balance sheetbull The expected value of contracts or intended contracts with customersbull The scope services term and results of any projects awarded or expected to be awarded for services to be provided by usbull The anticipated commencement and completion dates for any projects awardedbull The development of larger electric transmission and oil and natural gas pipeline projects and the level of oil natural gas and natural gas liquids prices and their impact on our business or the demand for our services bull The impact of existing or potential energy legislation bull Potential opportunities that may be indicated by bidding activity or discussions with customersbull The expected outcome of pending or threatened litigation bull Beliefs and assumptions about the collectability of receivablesbull The business plans or financial condition of our customersbull Our plans and strategies bull The current economic and regulatory conditions and trends in the industries we serve bull Possible recovery on pending or contemplated change orders or affirmative claims against customers or third parties and bull Other statements reflecting expectations intentions assumptions or beliefs about future events and other statements that do not relate strictly to historical or current facts
Although our management believes that the expectations reflected in such forward-looking statements are reasonable it can give no assurance that such expectations will prove to be correct These forward-looking statements are not guarantees of future performance and involve or rely on a number of risks uncertainties and assumptions that are difficult to predict or beyond our control These forward-looking statements reflect our beliefs and assumptions based on information available to our management at the time the statements are made We caution you that actual outcomes and results may differ materially from what is expressed implied or forecasted by our forward-looking statements and that any or all of our forward-looking statements may turn out to be wrong Forward-looking statements can be affected by inaccurate assumptions and by known or unknown risks and uncertainties including the following
bull Market conditionsbull The effects of industry economic financial or political conditions outside our control including weakness in capital marketsbull Quarterly variations in our operating resultsbull Trends and growth opportunities in relevant marketsbull The cost of borrowing availability of credit and cash fluctuations in the price and volume of our common stock debt covenant compliance interest rate fluctuations and other factors affecting our financing and investing activitiesbull Delays reductions in scope or cancellations of anticipated pending or existing projects including as a result of weather regulatory or permitting issues environmental processes project performance issues claimed force majeure events or our customers capital
constraintsbull The successful negotiation execution performance and completion of anticipated pending and existing contracts including the ability to obtain awards of projects on which we bid or are otherwise discussing with customersbull Our ability to retain key personnel and qualified employees
Forward Looking Statement Disclaimerbull Our ability to attract or the potential shortage of skilled labor bull Our dependence on fixed price contracts and the potential to incur losses with respect to the contractsbull Estimates relating to our use of percentage-of-completion accountingbull Adverse weatherbull Our ability to generate internal growthbull Competition in our business including our ability to effectively compete for new projects and market sharebull The effect of natural gas natural gas liquids and oil prices on our operations and growth opportunities and on
our customersrsquo capital programs and demand for our servicesbull The future development of natural resourcesbull The failure of existing or potential legislative actions to result in demand for our servicesbull Liabilities associated with multiemployer pension plans including underfunding of liabilities and termination
or withdrawal liabilitiesbull The possibility of further increases in the liability associated with our withdrawal from a multiemployer
pension planbull Unexpected costs or liabilities that may arise from pending or threatened litigation indemnity obligations or
other claims asserted against us including liabilities for claims that are self-insured or uninsuredbull The outcome of pending or threatened litigationbull Risks relating to the potential unavailability or cancellation of third party insurance the exclusion of coverage
for certain losses and potential increases in premiums for coverage deemed beneficial to usbull Cancellation provisions within our contracts and the risk that contracts expire and are not renewed or are
replaced on less favorable termsbull Loss of customers with whom we have long-standing or significant relationshipsbull The potential that participation in joint ventures or similar structures exposes us to liability andor harm to
our reputation for acts or omissions by our partnersbull Our inability or failure to comply with the terms of our contracts which may result in additional costs
unexcused delays warranty claims failure to meet performance guarantees damages or contract terminations
bull The inability or refusal of our customers to pay for services including the failure to collect outstanding receivables
bull The failure to recover on payment claims against project owners or third party contractors or to obtain adequate compensation for customer-requested change orders
bull The failure of our customers to comply with regulatory requirements applicable to their projects which may result in project delays and cancellations
bull Budgetary or other constraints that may reduce or eliminate tax incentives or government funding for projects which may result in project delays or cancellations
bull Estimates and assumptions in determining our financial results and backlogbull Our ability to realize our backlogbull Risks associated with operating in international markets including instability of foreign governments
currency fluctuations tax and investment strategies as well as compliance with foreign legal systems and cultural practices the US Foreign Corrupt Practices Act and other applicable anti-bribery and anti-corruption laws
bull Our ability to successfully identify complete integrate and realize synergies from acquisitionsbull The potential adverse impact resulting from uncertainty surrounding investments and acquisitions including
the ability to retain key personnel from the acquired businesses and the potential increase in risks already existing in our operations
bull The adverse impact of impairments of goodwill receivables property equipment and other intangible assets or investments
bull Our growth outpacing our decentralized management and infrastructurebull Requirements relating to governmental regulation and changes theretobull Inability to enforce our intellectual property rights or the obsolescence of such rightsbull Risks related to the implementation of an information technology solutionbull The impact of our unionized workforce on our operations including labor stoppages or interruptions due to
strikes or lockoutsbull Potential liabilities and other adverse effects arising from occupational health and safety mattersbull Our dependence on suppliers subcontractors equipment manufacturers and other third party contractorsbull Fluctuations of prices of certain materials used in our businessbull The ability to access sufficient funding to finance desired growth and operationsbull Our ability to obtain performance bondsbull Potential exposure to environmental liabilitiesbull Our ability to continue to meet certain requirements applicable to us and our subsidiariesbull Rapid technological and other structural changes that could reduce the demand for our servicesbull New or changed tax laws treaties or regulationsbull Increased healthcare costs arising from healthcare reform legislation or other governmental actionbull Regulatory changes that result in increased labor costsbull Significant fluctuations in foreign currency exchange rates andbull The other risks and uncertainties as are described elsewhere herein and in our Annual Report on Form 10-K for
the year ended December 31 2016 filed with the SEC and as may be detailed from time to time in our other public filings with the SEC
All of our forward-looking statements whether written or oral are expressly qualified by these cautionary statements and any other cautionary statements that may accompany such forward-looking statements or that are otherwise included in this presentation Should one or more of these risks materialize or should underlying assumptions prove incorrect actual results may vary materially from those expressed or implied in any forward-looking statements Investors are cautioned not to place undue reliance on these forward-looking statements which are current only as of this date We do not undertake and expressly disclaim any obligation to update or revise any forward-looking statements to reflect events or circumstances after the date of this presentation or otherwise and we expressly disclaim any written or oral statements made by any third party regarding the subject matter of this presentation
Slide Number 1
Forward Looking Statement Disclaimer
Key Takeaways
Leading Integrated Infrastructure Solutions Provider
Overview ndash Strategically Focused Operationally Diverse
Overview - Diverse and High Quality Customer Base
Leading Integrated Infrastructure Solutions Provider
Strategic Imperatives
Strategic Imperatives Deliver Profitable Growth
Strategic Acquisitions Criteria and Rationale
Differentiated Competitive Position ndash In the Sweet Spot
Differentiated Competitive Position ndash In the Sweet Spot
Electric Power Infrastructure Services Segment Overview
Power Grid Investment Drivers - Transmission
Power Grid Investment Drivers - Transmission
Power Grid Investment Drivers - Distribution
Oil amp Gas Infrastructure Services Segment Overview
Reconciliation of Adjusted Net Income from Continuing Operations Attributable to Common Stock
Reconciliation of Electric Power and Oil amp Gas Infrastructure Services Segments Operating Income As Adjusted
Reconciliation of Free Cash Flow
Forward Looking Statement Disclaimer
Forward Looking Statement Disclaimer
Free Cash Flow From Continuing Operations
Source
2013
2014
2015
2016
(Support Cash Flow Statement)
Net Cash Provided by Operating Activities of Continuing Operations
370558
247742
618183
381176
(Support Cash Flow Statement)
Less Net Capital Expenditures
(Support Cash Flow Statement)
Additions of Property and Equipment
(221946)
(247216)
(209968)
(212555)
(Support Cash Flow Statement)
Proceeds from Sale of Property and Equipment
14789
14448
26178
21975
(Recalculation)
Net Capital Expenditures
(207157)
(232768)
(183790)
(190580)
(Recalculation)
Free Cash Flow
163401
14974
434393
190596
Adjusted Operating Income Margin
$ in millions
Support for slide 23
Amounts in millions except percentages
Electric Power
Oil amp Gas Infrastructure
123114
123115
123116
123114
Revenues
$ 53027
$ 49373
$ 48505
$ 24446
Operating Income (as reported)
4630
3623
3957
1628
Addback
Provisions for long term contract receivable
1025
-0
-0
-0
Arbitration expense
-0
-0
-0
388
Asset impairment charge
-0
66
57
-0
Operating Income (as adjusted)
$ 5655
$ 3689
$ 4014
$ 2016
Operating income margin (as reported)
87
73
82
67
Operating income margin (as adjusted)
107
75
83
83
Quanta Services Inc and Subsidiaries
Reconciliation of Non-GAAP Financial Measures
Adjusted Diluted Earnings Per Share from Continuing Operations
For the Years Ended December 31
(in thousands except per share information)
(Unaudited)
Estimated Guidance Range
2013
2014
2015
2016
2017
2017
Reconciliation of adjusted net income from continuing operations attributable to common stock
Net income from continuing operations attributable to common stock (GAAP as reported)
$ 372057
$ 269224
$ 120286
$ 198725
$ 247000
$ 275300
Adjustments
Asset impairment charges
-
-
58451
7964
-
-
Severance and restructuring charges
-
-
-
6352
-
-
Acquisition and integration costs
8145
14754
7966
3053
9300
9300
Impact of income tax contingency releases
(9935)
(8099)
-
(20488)
-
-
Impact of tax benefit from realization of previously unrecognized deferred tax asset
-
-
(4228)
-
-
-
Impact of Alberta tax law change
-
-
4982
-
-
-
Provision for long-term contract receivable
-
102460
-
-
-
-
Arbitration expense
-
38848
-
-
-
-
Impact of sale of equity ownership in Howard Energy
(112744)
-
-
-
-
-
Income tax impact of adjustments
39836
(55935)
(16186)
(3982)
(3400)
(3400)
Adjusted net income from continuing operations attributable to common stock before certain non-cash adjustments
297359
361252
171271
191624
252900
281200
Non-cash stock based compensation
34381
37449
36939
41134
47000
47000
Amortization of intangible assets
25865
34257
34848
31685
30600
30600
Income tax impact of non-cash adjustments
(22715)
(26453)
(25817)
(26183)
(28500)
(28500)
Adjusted net income from continuing operations attributable to common stock
$ 334890
$ 406505
$ 217241
$ 238260
$ 302000
$ 330300
Weighted average shares
Weighted average shares outstanding for diluted earnings per share
214978
219690
195120
157288
157300
157300
Weighted average shares outstanding for adjusted diluted earnings per share
214978
219690
195120
157288
157300
157300
Diluted earnings per share from continuing operations attributable to common stock and adjusted diluted earnings per share from continuing operations attributable to common stock
Diluted earnings per share from continuing operations attributable to common stock
$ 173
$ 123
$ 062
$ 126
$ 157
$ 175
Adjusted diluted earnings per share from continuing operations attributable to common stock
$ 156
$ 185
$ 111
$ 151
$ 192
$ 210
Recent Financial Performance amp 2017 ExpectationsFor the Years Ended December 31
($ in millions)Electric Power
$4542
$5303$4937 $4850
115107
7583
2013 2014 2015 2016 2017 Est
Revenue Op Margin
(2)
(1) Operating margin excludes a $1025 million charge to cost of services for long-term contract receivable in 2014 Refer to appendix for non-GAAP reconciliation(2) Excludes a $66 million property and equipment impairment charge Includes the impact of $661 million of project losses Refer to appendix for non-GAAP reconciliation(3) Excludes a $57 million asset impairment charge Includes the impact of $548 million of project losses Refer to appendix for non-GAAP reconciliation
(1) (1)
(2)(3)
f Est revenue growth approaching 15 vs 2016
Est operating incomemargins of 90 to 95
Guidance Commentary($ in millions)
Oil amp Gas Infrastructure
(4) Excludes a $388 million expense associated with an arbitration decision Refer to appendix for non-GAAP reconciliation(5) Includes $73 million of project losses
Liquidity includes cash and cash equivalents and availability under our revolving credit facility as described in our Form 10k
Historical Cash Flow Generation
$163
$15
$434
$191
2013 2014 2015 2016
Cash Flow from Continuing Operations
($ in millions)
Free Cash Flow from Continuing Operations
$371
$248
$618
$381
2013 2014 2015 2016
Net cash provided by operating activities from continuing operations plus proceeds from sale of property and equipment less additions of property and equipment
For the Years Ending December 31($ in millions)
For the Years Ending December 31
Committed to Generating Shareholder Value
Executed on $125 Billion Share Repurchase Authorizationbull Aug 2015 ndash Announced a new $125 billion share repurchase
authorization through Feb 28 2017bull Completed a $750 million accelerated stock repurchase (ASR)
arrangement in April 2016bull Acquired 351 million shares at $2136 per share
bull $500 million for opportunistic repurchases through Feb 28 2017bull $450 million 192 million shares retired
Completed $500 Million Share Repurchase Authorizationbull Completed previous $500 million share repurchase program in 2015bull Acquired approximately 174 million shares for total cost of $500
million
Acquired $17 Billion of Quanta Common Stock
Under Previous Programs Quanta Has Acquired Approximately 32 of Its Outstanding Stock
$2197$1951
$1573 $1573
0
25
50
75
100
125
150
175
200
225
$0000
$500000
$1000000
$1500000
$2000000
$2500000
$3000000
2014 2015 2016 2017E
Net Income Required to Generate $001 In EPS
Avg Dil Shs Out
Earnings Power Improvement
$ in
Tho
usan
ds
Shares in Millions
May 25 2017 ndash Announced New $300 Million Share Repurchase Authorizationbull Up to $300 million through June 30 2020
Opportunistic amp Disciplined Capital Allocation
Capital Deployment Preference (Amounts in millions)
bull Working Capitalbull Capital Expendituresbull Acquisitionsbull Investmentsbull Return of Capital
bull Generally in sync with preference however hellip
bull Financial strength provides the ability to be opportunistic
bull Flexible and strategic capital allocation is a competitive advantage
Capital Deployment Posture
Financial Strength Allows for Flexible and Strategic Capital Allocation ndash A Competitive Advantage
2013 ndash 2016 Sources amp Uses of Cash
Sources
Cash Flow fromOperations
DivestitureProceeds
BorrowingsInvestment Sales
$3099
$1667
$842
$369$221
Uses
StockRepurchase
CAPEX amp OtherNet
Acquisitions Net
Investments
$1700
$900
$728
$54$3382
54
27
127
50
27
21
2
Amounts reflect the retrospective application of a recent accounting pronouncement related to the classification of tax withholding payments for share-based compensation
Foundation For Growth amp Improved Profitability
Multi-Year Growth Opportunities
Innovative Industry Leading Solutions
Scale amp Scope
Financial Strength
Operational amp Safety Excellence
QuantaServicesIR
QuantaIR
Connect With Quanta Services Investor Relations
Corporate Office2800 Post Oak Blvd Suite 2600Houston TX 77056713-629-7600wwwquantaservicescom
Investor ContactKip Rupp CFAVice President ndash Investor Relations713-341-7260investorsquantaservicescom
Reconciliation of Adjusted Net Income from Continuing Operations Attributable to Common Stock
2013 2014 2015 2016 2017 2017Reconciliation of adjusted net income from continuing operations attributable to common stockNet income from continuing operations attributable to common stock (GAAP as reported) 372057$ 269224$ 120286$ 198725$ 247000$ 275300$ Adjustments
Asset impairment charges - - 58451 7964 - -Severance and restructuring charges - - - 6352 - -Acquisition and integration costs 8145 14754 7966 3053 9300 9300 Impact of income tax contingency releases (9935) (8099) - (20488) - -Impact of tax benefit from realization of previously unrecognized deferred tax asset - - (4228) - - -Impact of Alberta tax law change - - 4982 - - -Provision for long-term contract receivable - 102460 - - - -Arbitration expense - 38848 - - - -Impact of sale of equity ownership in Howard Energy (112744) - - - - -Income tax impact of adjustments 39836 (55935) (16186) (3982) (3400) (3400)
Adjusted net income from continuing operations attributable to common stock before certain non-cash adjustments 297359 361252 171271 191624 252900 281200
Non-cash stock based compensation 34381 37449 36939 41134 47000 47000 Amortization of intangible assets 25865 34257 34848 31685 30600 30600 Income tax impact of non-cash adjustments (22715) (26453) (25817) (26183) (28500) (28500)
Adjusted net income from continuing operations attributable to common stock 334890$ 406505$ 217241$ 238260$ 302000$ 330300$ Weighted average sharesWeighted average shares outstanding for diluted earnings per share 214978 219690 195120 157288 157300 157300 Weighted average shares outstanding for adjusted diluted earnings per share 214978 219690 195120 157288 157300 157300 Diluted earnings per share from continuing operations attributable to common stock and adjusted diluted earnings per share from continuing operations attributable to common stockDiluted earnings per share from continuing operations attributable to common stock 173$ 123$ 062$ 126$ 157$ 175$ Adjusted diluted earnings per share from continuing operations attributable to common stock 156$ 185$ 111$ 151$ 192$ 210$
Estimated Guidance Range
For the Years Ended December 31
(in thousands except per share information)(Unaudited)
Recast of Adjusted Diluted
Reconciliation of Electric Power and Oil amp Gas Infrastructure Services Segments Operating Income As Adjusted
Amounts in millions except percentagesOil amp Gas
Infrastructure12312014 12312015 12312016 12312014
Revenues 53027$ 49373$ 48505$ 24446$
Operating Income (as reported) 4630 3623 3957 1628
Addback Provisions for long term contract receivable 1025 - - - Arbitration expense - - - 388 Asset impairment charge - 66 57 -
Operating Income (as adjusted) 5655$ 3689$ 4014$ 2016$
Operating income margin (as reported) 87 73 82 67Operating income margin (as adjusted) 107 75 83 83
Electric Power
Sheet1
Reconciliation of Free Cash Flow
2013 2014 2015 2016Net Cash Provided by Operating Activities of Continuing Operations 370558 247742 618183 381176 Less Net Capital ExpendituresAdditions of Property and Equipment (221946) (247216) (209968) (212555) Proceeds from Sale of Property and Equipment 14789 14448 26178 21975 Net Capital Expenditures (207157) (232768) (183790) (190580)
Free Cash Flow 163401 14974 434393 190596
Free Cash Flow from Cont Ops
Forward Looking Statement DisclaimerThis presentation (and oral statements regarding the subject matter of this presentation) includes ldquoforward-looking statementsrdquo intended to qualify for the safe harbor from liability established by the Private Securities Litigation Reform Act of 1995 These statements reflect assumptions expectations projections intentions or beliefs about future events and use words such as anticipate estimate project forecast may will should could expect believe plan intend and other words of similar meaning You can identify these statements by the fact that they do not relate strictly to historical or current facts In particular these include but are not limited to statements relating to the following
bull Projected revenues net income earnings per share attributable to common stock backlog margins capital expenditures weighted average shares outstanding tax rates and other projections of operating or financial resultsbull Our business or financial outlook growth or opportunities in particular marketsbull The potential benefits from acquisitions and investmentsbull The expected financial and operational performance of acquired businessesbull Future capital allocation initiativesbull Our ability to deliver increased value and return capital to stockholders bull The strategic use of our balance sheetbull The expected value of contracts or intended contracts with customersbull The scope services term and results of any projects awarded or expected to be awarded for services to be provided by usbull The anticipated commencement and completion dates for any projects awardedbull The development of larger electric transmission and oil and natural gas pipeline projects and the level of oil natural gas and natural gas liquids prices and their impact on our business or the demand for our services bull The impact of existing or potential energy legislation bull Potential opportunities that may be indicated by bidding activity or discussions with customersbull The expected outcome of pending or threatened litigation bull Beliefs and assumptions about the collectability of receivablesbull The business plans or financial condition of our customersbull Our plans and strategies bull The current economic and regulatory conditions and trends in the industries we serve bull Possible recovery on pending or contemplated change orders or affirmative claims against customers or third parties and bull Other statements reflecting expectations intentions assumptions or beliefs about future events and other statements that do not relate strictly to historical or current facts
Although our management believes that the expectations reflected in such forward-looking statements are reasonable it can give no assurance that such expectations will prove to be correct These forward-looking statements are not guarantees of future performance and involve or rely on a number of risks uncertainties and assumptions that are difficult to predict or beyond our control These forward-looking statements reflect our beliefs and assumptions based on information available to our management at the time the statements are made We caution you that actual outcomes and results may differ materially from what is expressed implied or forecasted by our forward-looking statements and that any or all of our forward-looking statements may turn out to be wrong Forward-looking statements can be affected by inaccurate assumptions and by known or unknown risks and uncertainties including the following
bull Market conditionsbull The effects of industry economic financial or political conditions outside our control including weakness in capital marketsbull Quarterly variations in our operating resultsbull Trends and growth opportunities in relevant marketsbull The cost of borrowing availability of credit and cash fluctuations in the price and volume of our common stock debt covenant compliance interest rate fluctuations and other factors affecting our financing and investing activitiesbull Delays reductions in scope or cancellations of anticipated pending or existing projects including as a result of weather regulatory or permitting issues environmental processes project performance issues claimed force majeure events or our customers capital
constraintsbull The successful negotiation execution performance and completion of anticipated pending and existing contracts including the ability to obtain awards of projects on which we bid or are otherwise discussing with customersbull Our ability to retain key personnel and qualified employees
Forward Looking Statement Disclaimerbull Our ability to attract or the potential shortage of skilled labor bull Our dependence on fixed price contracts and the potential to incur losses with respect to the contractsbull Estimates relating to our use of percentage-of-completion accountingbull Adverse weatherbull Our ability to generate internal growthbull Competition in our business including our ability to effectively compete for new projects and market sharebull The effect of natural gas natural gas liquids and oil prices on our operations and growth opportunities and on
our customersrsquo capital programs and demand for our servicesbull The future development of natural resourcesbull The failure of existing or potential legislative actions to result in demand for our servicesbull Liabilities associated with multiemployer pension plans including underfunding of liabilities and termination
or withdrawal liabilitiesbull The possibility of further increases in the liability associated with our withdrawal from a multiemployer
pension planbull Unexpected costs or liabilities that may arise from pending or threatened litigation indemnity obligations or
other claims asserted against us including liabilities for claims that are self-insured or uninsuredbull The outcome of pending or threatened litigationbull Risks relating to the potential unavailability or cancellation of third party insurance the exclusion of coverage
for certain losses and potential increases in premiums for coverage deemed beneficial to usbull Cancellation provisions within our contracts and the risk that contracts expire and are not renewed or are
replaced on less favorable termsbull Loss of customers with whom we have long-standing or significant relationshipsbull The potential that participation in joint ventures or similar structures exposes us to liability andor harm to
our reputation for acts or omissions by our partnersbull Our inability or failure to comply with the terms of our contracts which may result in additional costs
unexcused delays warranty claims failure to meet performance guarantees damages or contract terminations
bull The inability or refusal of our customers to pay for services including the failure to collect outstanding receivables
bull The failure to recover on payment claims against project owners or third party contractors or to obtain adequate compensation for customer-requested change orders
bull The failure of our customers to comply with regulatory requirements applicable to their projects which may result in project delays and cancellations
bull Budgetary or other constraints that may reduce or eliminate tax incentives or government funding for projects which may result in project delays or cancellations
bull Estimates and assumptions in determining our financial results and backlogbull Our ability to realize our backlogbull Risks associated with operating in international markets including instability of foreign governments
currency fluctuations tax and investment strategies as well as compliance with foreign legal systems and cultural practices the US Foreign Corrupt Practices Act and other applicable anti-bribery and anti-corruption laws
bull Our ability to successfully identify complete integrate and realize synergies from acquisitionsbull The potential adverse impact resulting from uncertainty surrounding investments and acquisitions including
the ability to retain key personnel from the acquired businesses and the potential increase in risks already existing in our operations
bull The adverse impact of impairments of goodwill receivables property equipment and other intangible assets or investments
bull Our growth outpacing our decentralized management and infrastructurebull Requirements relating to governmental regulation and changes theretobull Inability to enforce our intellectual property rights or the obsolescence of such rightsbull Risks related to the implementation of an information technology solutionbull The impact of our unionized workforce on our operations including labor stoppages or interruptions due to
strikes or lockoutsbull Potential liabilities and other adverse effects arising from occupational health and safety mattersbull Our dependence on suppliers subcontractors equipment manufacturers and other third party contractorsbull Fluctuations of prices of certain materials used in our businessbull The ability to access sufficient funding to finance desired growth and operationsbull Our ability to obtain performance bondsbull Potential exposure to environmental liabilitiesbull Our ability to continue to meet certain requirements applicable to us and our subsidiariesbull Rapid technological and other structural changes that could reduce the demand for our servicesbull New or changed tax laws treaties or regulationsbull Increased healthcare costs arising from healthcare reform legislation or other governmental actionbull Regulatory changes that result in increased labor costsbull Significant fluctuations in foreign currency exchange rates andbull The other risks and uncertainties as are described elsewhere herein and in our Annual Report on Form 10-K for
the year ended December 31 2016 filed with the SEC and as may be detailed from time to time in our other public filings with the SEC
All of our forward-looking statements whether written or oral are expressly qualified by these cautionary statements and any other cautionary statements that may accompany such forward-looking statements or that are otherwise included in this presentation Should one or more of these risks materialize or should underlying assumptions prove incorrect actual results may vary materially from those expressed or implied in any forward-looking statements Investors are cautioned not to place undue reliance on these forward-looking statements which are current only as of this date We do not undertake and expressly disclaim any obligation to update or revise any forward-looking statements to reflect events or circumstances after the date of this presentation or otherwise and we expressly disclaim any written or oral statements made by any third party regarding the subject matter of this presentation
Slide Number 1
Forward Looking Statement Disclaimer
Key Takeaways
Leading Integrated Infrastructure Solutions Provider
Overview ndash Strategically Focused Operationally Diverse
Overview - Diverse and High Quality Customer Base
Leading Integrated Infrastructure Solutions Provider
Strategic Imperatives
Strategic Imperatives Deliver Profitable Growth
Strategic Acquisitions Criteria and Rationale
Differentiated Competitive Position ndash In the Sweet Spot
Differentiated Competitive Position ndash In the Sweet Spot
Electric Power Infrastructure Services Segment Overview
Power Grid Investment Drivers - Transmission
Power Grid Investment Drivers - Transmission
Power Grid Investment Drivers - Distribution
Oil amp Gas Infrastructure Services Segment Overview
Reconciliation of Adjusted Net Income from Continuing Operations Attributable to Common Stock
Reconciliation of Electric Power and Oil amp Gas Infrastructure Services Segments Operating Income As Adjusted
Reconciliation of Free Cash Flow
Forward Looking Statement Disclaimer
Forward Looking Statement Disclaimer
Free Cash Flow From Continuing Operations
Source
2013
2014
2015
2016
(Support Cash Flow Statement)
Net Cash Provided by Operating Activities of Continuing Operations
370558
247742
618183
381176
(Support Cash Flow Statement)
Less Net Capital Expenditures
(Support Cash Flow Statement)
Additions of Property and Equipment
(221946)
(247216)
(209968)
(212555)
(Support Cash Flow Statement)
Proceeds from Sale of Property and Equipment
14789
14448
26178
21975
(Recalculation)
Net Capital Expenditures
(207157)
(232768)
(183790)
(190580)
(Recalculation)
Free Cash Flow
163401
14974
434393
190596
Adjusted Operating Income Margin
$ in millions
Support for slide 23
Amounts in millions except percentages
Electric Power
Oil amp Gas Infrastructure
123114
123115
123116
123114
Revenues
$ 53027
$ 49373
$ 48505
$ 24446
Operating Income (as reported)
4630
3623
3957
1628
Addback
Provisions for long term contract receivable
1025
-0
-0
-0
Arbitration expense
-0
-0
-0
388
Asset impairment charge
-0
66
57
-0
Operating Income (as adjusted)
$ 5655
$ 3689
$ 4014
$ 2016
Operating income margin (as reported)
87
73
82
67
Operating income margin (as adjusted)
107
75
83
83
Quanta Services Inc and Subsidiaries
Reconciliation of Non-GAAP Financial Measures
Adjusted Diluted Earnings Per Share from Continuing Operations
For the Years Ended December 31
(in thousands except per share information)
(Unaudited)
Estimated Guidance Range
2013
2014
2015
2016
2017
2017
Reconciliation of adjusted net income from continuing operations attributable to common stock
Net income from continuing operations attributable to common stock (GAAP as reported)
$ 372057
$ 269224
$ 120286
$ 198725
$ 247000
$ 275300
Adjustments
Asset impairment charges
-
-
58451
7964
-
-
Severance and restructuring charges
-
-
-
6352
-
-
Acquisition and integration costs
8145
14754
7966
3053
9300
9300
Impact of income tax contingency releases
(9935)
(8099)
-
(20488)
-
-
Impact of tax benefit from realization of previously unrecognized deferred tax asset
-
-
(4228)
-
-
-
Impact of Alberta tax law change
-
-
4982
-
-
-
Provision for long-term contract receivable
-
102460
-
-
-
-
Arbitration expense
-
38848
-
-
-
-
Impact of sale of equity ownership in Howard Energy
(112744)
-
-
-
-
-
Income tax impact of adjustments
39836
(55935)
(16186)
(3982)
(3400)
(3400)
Adjusted net income from continuing operations attributable to common stock before certain non-cash adjustments
297359
361252
171271
191624
252900
281200
Non-cash stock based compensation
34381
37449
36939
41134
47000
47000
Amortization of intangible assets
25865
34257
34848
31685
30600
30600
Income tax impact of non-cash adjustments
(22715)
(26453)
(25817)
(26183)
(28500)
(28500)
Adjusted net income from continuing operations attributable to common stock
$ 334890
$ 406505
$ 217241
$ 238260
$ 302000
$ 330300
Weighted average shares
Weighted average shares outstanding for diluted earnings per share
214978
219690
195120
157288
157300
157300
Weighted average shares outstanding for adjusted diluted earnings per share
214978
219690
195120
157288
157300
157300
Diluted earnings per share from continuing operations attributable to common stock and adjusted diluted earnings per share from continuing operations attributable to common stock
Diluted earnings per share from continuing operations attributable to common stock
$ 173
$ 123
$ 062
$ 126
$ 157
$ 175
Adjusted diluted earnings per share from continuing operations attributable to common stock
$ 156
$ 185
$ 111
$ 151
$ 192
$ 210
Reconciliation of Adjusted Net Income from Continuing Operations Attributable to Common Stock
2013 2014 2015 2016 2017 2017Reconciliation of adjusted net income from continuing operations attributable to common stockNet income from continuing operations attributable to common stock (GAAP as reported) 372057$ 269224$ 120286$ 198725$ 247000$ 275300$ Adjustments
Asset impairment charges - - 58451 7964 - -Severance and restructuring charges - - - 6352 - -Acquisition and integration costs 8145 14754 7966 3053 9300 9300 Impact of income tax contingency releases (9935) (8099) - (20488) - -Impact of tax benefit from realization of previously unrecognized deferred tax asset - - (4228) - - -Impact of Alberta tax law change - - 4982 - - -Provision for long-term contract receivable - 102460 - - - -Arbitration expense - 38848 - - - -Impact of sale of equity ownership in Howard Energy (112744) - - - - -Income tax impact of adjustments 39836 (55935) (16186) (3982) (3400) (3400)
Adjusted net income from continuing operations attributable to common stock before certain non-cash adjustments 297359 361252 171271 191624 252900 281200
Non-cash stock based compensation 34381 37449 36939 41134 47000 47000 Amortization of intangible assets 25865 34257 34848 31685 30600 30600 Income tax impact of non-cash adjustments (22715) (26453) (25817) (26183) (28500) (28500)
Adjusted net income from continuing operations attributable to common stock 334890$ 406505$ 217241$ 238260$ 302000$ 330300$ Weighted average sharesWeighted average shares outstanding for diluted earnings per share 214978 219690 195120 157288 157300 157300 Weighted average shares outstanding for adjusted diluted earnings per share 214978 219690 195120 157288 157300 157300 Diluted earnings per share from continuing operations attributable to common stock and adjusted diluted earnings per share from continuing operations attributable to common stockDiluted earnings per share from continuing operations attributable to common stock 173$ 123$ 062$ 126$ 157$ 175$ Adjusted diluted earnings per share from continuing operations attributable to common stock 156$ 185$ 111$ 151$ 192$ 210$
Estimated Guidance Range
For the Years Ended December 31
(in thousands except per share information)(Unaudited)
Recast of Adjusted Diluted
Reconciliation of Electric Power and Oil amp Gas Infrastructure Services Segments Operating Income As Adjusted
Amounts in millions except percentagesOil amp Gas
Infrastructure12312014 12312015 12312016 12312014
Revenues 53027$ 49373$ 48505$ 24446$
Operating Income (as reported) 4630 3623 3957 1628
Addback Provisions for long term contract receivable 1025 - - - Arbitration expense - - - 388 Asset impairment charge - 66 57 -
Operating Income (as adjusted) 5655$ 3689$ 4014$ 2016$
Operating income margin (as reported) 87 73 82 67Operating income margin (as adjusted) 107 75 83 83
Electric Power
Sheet1
Reconciliation of Free Cash Flow
2013 2014 2015 2016Net Cash Provided by Operating Activities of Continuing Operations 370558 247742 618183 381176 Less Net Capital ExpendituresAdditions of Property and Equipment (221946) (247216) (209968) (212555) Proceeds from Sale of Property and Equipment 14789 14448 26178 21975 Net Capital Expenditures (207157) (232768) (183790) (190580)
Free Cash Flow 163401 14974 434393 190596
Free Cash Flow from Cont Ops
Forward Looking Statement DisclaimerThis presentation (and oral statements regarding the subject matter of this presentation) includes ldquoforward-looking statementsrdquo intended to qualify for the safe harbor from liability established by the Private Securities Litigation Reform Act of 1995 These statements reflect assumptions expectations projections intentions or beliefs about future events and use words such as anticipate estimate project forecast may will should could expect believe plan intend and other words of similar meaning You can identify these statements by the fact that they do not relate strictly to historical or current facts In particular these include but are not limited to statements relating to the following
bull Projected revenues net income earnings per share attributable to common stock backlog margins capital expenditures weighted average shares outstanding tax rates and other projections of operating or financial resultsbull Our business or financial outlook growth or opportunities in particular marketsbull The potential benefits from acquisitions and investmentsbull The expected financial and operational performance of acquired businessesbull Future capital allocation initiativesbull Our ability to deliver increased value and return capital to stockholders bull The strategic use of our balance sheetbull The expected value of contracts or intended contracts with customersbull The scope services term and results of any projects awarded or expected to be awarded for services to be provided by usbull The anticipated commencement and completion dates for any projects awardedbull The development of larger electric transmission and oil and natural gas pipeline projects and the level of oil natural gas and natural gas liquids prices and their impact on our business or the demand for our services bull The impact of existing or potential energy legislation bull Potential opportunities that may be indicated by bidding activity or discussions with customersbull The expected outcome of pending or threatened litigation bull Beliefs and assumptions about the collectability of receivablesbull The business plans or financial condition of our customersbull Our plans and strategies bull The current economic and regulatory conditions and trends in the industries we serve bull Possible recovery on pending or contemplated change orders or affirmative claims against customers or third parties and bull Other statements reflecting expectations intentions assumptions or beliefs about future events and other statements that do not relate strictly to historical or current facts
Although our management believes that the expectations reflected in such forward-looking statements are reasonable it can give no assurance that such expectations will prove to be correct These forward-looking statements are not guarantees of future performance and involve or rely on a number of risks uncertainties and assumptions that are difficult to predict or beyond our control These forward-looking statements reflect our beliefs and assumptions based on information available to our management at the time the statements are made We caution you that actual outcomes and results may differ materially from what is expressed implied or forecasted by our forward-looking statements and that any or all of our forward-looking statements may turn out to be wrong Forward-looking statements can be affected by inaccurate assumptions and by known or unknown risks and uncertainties including the following
bull Market conditionsbull The effects of industry economic financial or political conditions outside our control including weakness in capital marketsbull Quarterly variations in our operating resultsbull Trends and growth opportunities in relevant marketsbull The cost of borrowing availability of credit and cash fluctuations in the price and volume of our common stock debt covenant compliance interest rate fluctuations and other factors affecting our financing and investing activitiesbull Delays reductions in scope or cancellations of anticipated pending or existing projects including as a result of weather regulatory or permitting issues environmental processes project performance issues claimed force majeure events or our customers capital
constraintsbull The successful negotiation execution performance and completion of anticipated pending and existing contracts including the ability to obtain awards of projects on which we bid or are otherwise discussing with customersbull Our ability to retain key personnel and qualified employees
Forward Looking Statement Disclaimerbull Our ability to attract or the potential shortage of skilled labor bull Our dependence on fixed price contracts and the potential to incur losses with respect to the contractsbull Estimates relating to our use of percentage-of-completion accountingbull Adverse weatherbull Our ability to generate internal growthbull Competition in our business including our ability to effectively compete for new projects and market sharebull The effect of natural gas natural gas liquids and oil prices on our operations and growth opportunities and on
our customersrsquo capital programs and demand for our servicesbull The future development of natural resourcesbull The failure of existing or potential legislative actions to result in demand for our servicesbull Liabilities associated with multiemployer pension plans including underfunding of liabilities and termination
or withdrawal liabilitiesbull The possibility of further increases in the liability associated with our withdrawal from a multiemployer
pension planbull Unexpected costs or liabilities that may arise from pending or threatened litigation indemnity obligations or
other claims asserted against us including liabilities for claims that are self-insured or uninsuredbull The outcome of pending or threatened litigationbull Risks relating to the potential unavailability or cancellation of third party insurance the exclusion of coverage
for certain losses and potential increases in premiums for coverage deemed beneficial to usbull Cancellation provisions within our contracts and the risk that contracts expire and are not renewed or are
replaced on less favorable termsbull Loss of customers with whom we have long-standing or significant relationshipsbull The potential that participation in joint ventures or similar structures exposes us to liability andor harm to
our reputation for acts or omissions by our partnersbull Our inability or failure to comply with the terms of our contracts which may result in additional costs
unexcused delays warranty claims failure to meet performance guarantees damages or contract terminations
bull The inability or refusal of our customers to pay for services including the failure to collect outstanding receivables
bull The failure to recover on payment claims against project owners or third party contractors or to obtain adequate compensation for customer-requested change orders
bull The failure of our customers to comply with regulatory requirements applicable to their projects which may result in project delays and cancellations
bull Budgetary or other constraints that may reduce or eliminate tax incentives or government funding for projects which may result in project delays or cancellations
bull Estimates and assumptions in determining our financial results and backlogbull Our ability to realize our backlogbull Risks associated with operating in international markets including instability of foreign governments
currency fluctuations tax and investment strategies as well as compliance with foreign legal systems and cultural practices the US Foreign Corrupt Practices Act and other applicable anti-bribery and anti-corruption laws
bull Our ability to successfully identify complete integrate and realize synergies from acquisitionsbull The potential adverse impact resulting from uncertainty surrounding investments and acquisitions including
the ability to retain key personnel from the acquired businesses and the potential increase in risks already existing in our operations
bull The adverse impact of impairments of goodwill receivables property equipment and other intangible assets or investments
bull Our growth outpacing our decentralized management and infrastructurebull Requirements relating to governmental regulation and changes theretobull Inability to enforce our intellectual property rights or the obsolescence of such rightsbull Risks related to the implementation of an information technology solutionbull The impact of our unionized workforce on our operations including labor stoppages or interruptions due to
strikes or lockoutsbull Potential liabilities and other adverse effects arising from occupational health and safety mattersbull Our dependence on suppliers subcontractors equipment manufacturers and other third party contractorsbull Fluctuations of prices of certain materials used in our businessbull The ability to access sufficient funding to finance desired growth and operationsbull Our ability to obtain performance bondsbull Potential exposure to environmental liabilitiesbull Our ability to continue to meet certain requirements applicable to us and our subsidiariesbull Rapid technological and other structural changes that could reduce the demand for our servicesbull New or changed tax laws treaties or regulationsbull Increased healthcare costs arising from healthcare reform legislation or other governmental actionbull Regulatory changes that result in increased labor costsbull Significant fluctuations in foreign currency exchange rates andbull The other risks and uncertainties as are described elsewhere herein and in our Annual Report on Form 10-K for
the year ended December 31 2016 filed with the SEC and as may be detailed from time to time in our other public filings with the SEC
All of our forward-looking statements whether written or oral are expressly qualified by these cautionary statements and any other cautionary statements that may accompany such forward-looking statements or that are otherwise included in this presentation Should one or more of these risks materialize or should underlying assumptions prove incorrect actual results may vary materially from those expressed or implied in any forward-looking statements Investors are cautioned not to place undue reliance on these forward-looking statements which are current only as of this date We do not undertake and expressly disclaim any obligation to update or revise any forward-looking statements to reflect events or circumstances after the date of this presentation or otherwise and we expressly disclaim any written or oral statements made by any third party regarding the subject matter of this presentation
Slide Number 1
Forward Looking Statement Disclaimer
Key Takeaways
Leading Integrated Infrastructure Solutions Provider
Overview ndash Strategically Focused Operationally Diverse
Overview - Diverse and High Quality Customer Base
Leading Integrated Infrastructure Solutions Provider
Strategic Imperatives
Strategic Imperatives Deliver Profitable Growth
Strategic Acquisitions Criteria and Rationale
Differentiated Competitive Position ndash In the Sweet Spot
Differentiated Competitive Position ndash In the Sweet Spot
Electric Power Infrastructure Services Segment Overview
Power Grid Investment Drivers - Transmission
Power Grid Investment Drivers - Transmission
Power Grid Investment Drivers - Distribution
Oil amp Gas Infrastructure Services Segment Overview
Reconciliation of Adjusted Net Income from Continuing Operations Attributable to Common Stock
Reconciliation of Electric Power and Oil amp Gas Infrastructure Services Segments Operating Income As Adjusted
Reconciliation of Free Cash Flow
Forward Looking Statement Disclaimer
Forward Looking Statement Disclaimer
Free Cash Flow From Continuing Operations
Source
2013
2014
2015
2016
(Support Cash Flow Statement)
Net Cash Provided by Operating Activities of Continuing Operations
370558
247742
618183
381176
(Support Cash Flow Statement)
Less Net Capital Expenditures
(Support Cash Flow Statement)
Additions of Property and Equipment
(221946)
(247216)
(209968)
(212555)
(Support Cash Flow Statement)
Proceeds from Sale of Property and Equipment
14789
14448
26178
21975
(Recalculation)
Net Capital Expenditures
(207157)
(232768)
(183790)
(190580)
(Recalculation)
Free Cash Flow
163401
14974
434393
190596
Adjusted Operating Income Margin
$ in millions
Support for slide 23
Amounts in millions except percentages
Electric Power
Oil amp Gas Infrastructure
123114
123115
123116
123114
Revenues
$ 53027
$ 49373
$ 48505
$ 24446
Operating Income (as reported)
4630
3623
3957
1628
Addback
Provisions for long term contract receivable
1025
-0
-0
-0
Arbitration expense
-0
-0
-0
388
Asset impairment charge
-0
66
57
-0
Operating Income (as adjusted)
$ 5655
$ 3689
$ 4014
$ 2016
Operating income margin (as reported)
87
73
82
67
Operating income margin (as adjusted)
107
75
83
83
Quanta Services Inc and Subsidiaries
Reconciliation of Non-GAAP Financial Measures
Adjusted Diluted Earnings Per Share from Continuing Operations
For the Years Ended December 31
(in thousands except per share information)
(Unaudited)
Estimated Guidance Range
2013
2014
2015
2016
2017
2017
Reconciliation of adjusted net income from continuing operations attributable to common stock
Net income from continuing operations attributable to common stock (GAAP as reported)
$ 372057
$ 269224
$ 120286
$ 198725
$ 247000
$ 275300
Adjustments
Asset impairment charges
-
-
58451
7964
-
-
Severance and restructuring charges
-
-
-
6352
-
-
Acquisition and integration costs
8145
14754
7966
3053
9300
9300
Impact of income tax contingency releases
(9935)
(8099)
-
(20488)
-
-
Impact of tax benefit from realization of previously unrecognized deferred tax asset
-
-
(4228)
-
-
-
Impact of Alberta tax law change
-
-
4982
-
-
-
Provision for long-term contract receivable
-
102460
-
-
-
-
Arbitration expense
-
38848
-
-
-
-
Impact of sale of equity ownership in Howard Energy
(112744)
-
-
-
-
-
Income tax impact of adjustments
39836
(55935)
(16186)
(3982)
(3400)
(3400)
Adjusted net income from continuing operations attributable to common stock before certain non-cash adjustments
297359
361252
171271
191624
252900
281200
Non-cash stock based compensation
34381
37449
36939
41134
47000
47000
Amortization of intangible assets
25865
34257
34848
31685
30600
30600
Income tax impact of non-cash adjustments
(22715)
(26453)
(25817)
(26183)
(28500)
(28500)
Adjusted net income from continuing operations attributable to common stock
$ 334890
$ 406505
$ 217241
$ 238260
$ 302000
$ 330300
Weighted average shares
Weighted average shares outstanding for diluted earnings per share
214978
219690
195120
157288
157300
157300
Weighted average shares outstanding for adjusted diluted earnings per share
214978
219690
195120
157288
157300
157300
Diluted earnings per share from continuing operations attributable to common stock and adjusted diluted earnings per share from continuing operations attributable to common stock
Diluted earnings per share from continuing operations attributable to common stock
$ 173
$ 123
$ 062
$ 126
$ 157
$ 175
Adjusted diluted earnings per share from continuing operations attributable to common stock
$ 156
$ 185
$ 111
$ 151
$ 192
$ 210
Reconciliation of Electric Power and Oil amp Gas Infrastructure Services Segments Operating Income As Adjusted
Amounts in millions except percentagesOil amp Gas
Infrastructure12312014 12312015 12312016 12312014
Revenues 53027$ 49373$ 48505$ 24446$
Operating Income (as reported) 4630 3623 3957 1628
Addback Provisions for long term contract receivable 1025 - - - Arbitration expense - - - 388 Asset impairment charge - 66 57 -
Operating Income (as adjusted) 5655$ 3689$ 4014$ 2016$
Operating income margin (as reported) 87 73 82 67Operating income margin (as adjusted) 107 75 83 83
Electric Power
Sheet1
Reconciliation of Free Cash Flow
2013 2014 2015 2016Net Cash Provided by Operating Activities of Continuing Operations 370558 247742 618183 381176 Less Net Capital ExpendituresAdditions of Property and Equipment (221946) (247216) (209968) (212555) Proceeds from Sale of Property and Equipment 14789 14448 26178 21975 Net Capital Expenditures (207157) (232768) (183790) (190580)
Free Cash Flow 163401 14974 434393 190596
Free Cash Flow from Cont Ops
Forward Looking Statement DisclaimerThis presentation (and oral statements regarding the subject matter of this presentation) includes ldquoforward-looking statementsrdquo intended to qualify for the safe harbor from liability established by the Private Securities Litigation Reform Act of 1995 These statements reflect assumptions expectations projections intentions or beliefs about future events and use words such as anticipate estimate project forecast may will should could expect believe plan intend and other words of similar meaning You can identify these statements by the fact that they do not relate strictly to historical or current facts In particular these include but are not limited to statements relating to the following
bull Projected revenues net income earnings per share attributable to common stock backlog margins capital expenditures weighted average shares outstanding tax rates and other projections of operating or financial resultsbull Our business or financial outlook growth or opportunities in particular marketsbull The potential benefits from acquisitions and investmentsbull The expected financial and operational performance of acquired businessesbull Future capital allocation initiativesbull Our ability to deliver increased value and return capital to stockholders bull The strategic use of our balance sheetbull The expected value of contracts or intended contracts with customersbull The scope services term and results of any projects awarded or expected to be awarded for services to be provided by usbull The anticipated commencement and completion dates for any projects awardedbull The development of larger electric transmission and oil and natural gas pipeline projects and the level of oil natural gas and natural gas liquids prices and their impact on our business or the demand for our services bull The impact of existing or potential energy legislation bull Potential opportunities that may be indicated by bidding activity or discussions with customersbull The expected outcome of pending or threatened litigation bull Beliefs and assumptions about the collectability of receivablesbull The business plans or financial condition of our customersbull Our plans and strategies bull The current economic and regulatory conditions and trends in the industries we serve bull Possible recovery on pending or contemplated change orders or affirmative claims against customers or third parties and bull Other statements reflecting expectations intentions assumptions or beliefs about future events and other statements that do not relate strictly to historical or current facts
Although our management believes that the expectations reflected in such forward-looking statements are reasonable it can give no assurance that such expectations will prove to be correct These forward-looking statements are not guarantees of future performance and involve or rely on a number of risks uncertainties and assumptions that are difficult to predict or beyond our control These forward-looking statements reflect our beliefs and assumptions based on information available to our management at the time the statements are made We caution you that actual outcomes and results may differ materially from what is expressed implied or forecasted by our forward-looking statements and that any or all of our forward-looking statements may turn out to be wrong Forward-looking statements can be affected by inaccurate assumptions and by known or unknown risks and uncertainties including the following
bull Market conditionsbull The effects of industry economic financial or political conditions outside our control including weakness in capital marketsbull Quarterly variations in our operating resultsbull Trends and growth opportunities in relevant marketsbull The cost of borrowing availability of credit and cash fluctuations in the price and volume of our common stock debt covenant compliance interest rate fluctuations and other factors affecting our financing and investing activitiesbull Delays reductions in scope or cancellations of anticipated pending or existing projects including as a result of weather regulatory or permitting issues environmental processes project performance issues claimed force majeure events or our customers capital
constraintsbull The successful negotiation execution performance and completion of anticipated pending and existing contracts including the ability to obtain awards of projects on which we bid or are otherwise discussing with customersbull Our ability to retain key personnel and qualified employees
Forward Looking Statement Disclaimerbull Our ability to attract or the potential shortage of skilled labor bull Our dependence on fixed price contracts and the potential to incur losses with respect to the contractsbull Estimates relating to our use of percentage-of-completion accountingbull Adverse weatherbull Our ability to generate internal growthbull Competition in our business including our ability to effectively compete for new projects and market sharebull The effect of natural gas natural gas liquids and oil prices on our operations and growth opportunities and on
our customersrsquo capital programs and demand for our servicesbull The future development of natural resourcesbull The failure of existing or potential legislative actions to result in demand for our servicesbull Liabilities associated with multiemployer pension plans including underfunding of liabilities and termination
or withdrawal liabilitiesbull The possibility of further increases in the liability associated with our withdrawal from a multiemployer
pension planbull Unexpected costs or liabilities that may arise from pending or threatened litigation indemnity obligations or
other claims asserted against us including liabilities for claims that are self-insured or uninsuredbull The outcome of pending or threatened litigationbull Risks relating to the potential unavailability or cancellation of third party insurance the exclusion of coverage
for certain losses and potential increases in premiums for coverage deemed beneficial to usbull Cancellation provisions within our contracts and the risk that contracts expire and are not renewed or are
replaced on less favorable termsbull Loss of customers with whom we have long-standing or significant relationshipsbull The potential that participation in joint ventures or similar structures exposes us to liability andor harm to
our reputation for acts or omissions by our partnersbull Our inability or failure to comply with the terms of our contracts which may result in additional costs
unexcused delays warranty claims failure to meet performance guarantees damages or contract terminations
bull The inability or refusal of our customers to pay for services including the failure to collect outstanding receivables
bull The failure to recover on payment claims against project owners or third party contractors or to obtain adequate compensation for customer-requested change orders
bull The failure of our customers to comply with regulatory requirements applicable to their projects which may result in project delays and cancellations
bull Budgetary or other constraints that may reduce or eliminate tax incentives or government funding for projects which may result in project delays or cancellations
bull Estimates and assumptions in determining our financial results and backlogbull Our ability to realize our backlogbull Risks associated with operating in international markets including instability of foreign governments
currency fluctuations tax and investment strategies as well as compliance with foreign legal systems and cultural practices the US Foreign Corrupt Practices Act and other applicable anti-bribery and anti-corruption laws
bull Our ability to successfully identify complete integrate and realize synergies from acquisitionsbull The potential adverse impact resulting from uncertainty surrounding investments and acquisitions including
the ability to retain key personnel from the acquired businesses and the potential increase in risks already existing in our operations
bull The adverse impact of impairments of goodwill receivables property equipment and other intangible assets or investments
bull Our growth outpacing our decentralized management and infrastructurebull Requirements relating to governmental regulation and changes theretobull Inability to enforce our intellectual property rights or the obsolescence of such rightsbull Risks related to the implementation of an information technology solutionbull The impact of our unionized workforce on our operations including labor stoppages or interruptions due to
strikes or lockoutsbull Potential liabilities and other adverse effects arising from occupational health and safety mattersbull Our dependence on suppliers subcontractors equipment manufacturers and other third party contractorsbull Fluctuations of prices of certain materials used in our businessbull The ability to access sufficient funding to finance desired growth and operationsbull Our ability to obtain performance bondsbull Potential exposure to environmental liabilitiesbull Our ability to continue to meet certain requirements applicable to us and our subsidiariesbull Rapid technological and other structural changes that could reduce the demand for our servicesbull New or changed tax laws treaties or regulationsbull Increased healthcare costs arising from healthcare reform legislation or other governmental actionbull Regulatory changes that result in increased labor costsbull Significant fluctuations in foreign currency exchange rates andbull The other risks and uncertainties as are described elsewhere herein and in our Annual Report on Form 10-K for
the year ended December 31 2016 filed with the SEC and as may be detailed from time to time in our other public filings with the SEC
All of our forward-looking statements whether written or oral are expressly qualified by these cautionary statements and any other cautionary statements that may accompany such forward-looking statements or that are otherwise included in this presentation Should one or more of these risks materialize or should underlying assumptions prove incorrect actual results may vary materially from those expressed or implied in any forward-looking statements Investors are cautioned not to place undue reliance on these forward-looking statements which are current only as of this date We do not undertake and expressly disclaim any obligation to update or revise any forward-looking statements to reflect events or circumstances after the date of this presentation or otherwise and we expressly disclaim any written or oral statements made by any third party regarding the subject matter of this presentation
Slide Number 1
Forward Looking Statement Disclaimer
Key Takeaways
Leading Integrated Infrastructure Solutions Provider
Overview ndash Strategically Focused Operationally Diverse
Overview - Diverse and High Quality Customer Base
Leading Integrated Infrastructure Solutions Provider
Strategic Imperatives
Strategic Imperatives Deliver Profitable Growth
Strategic Acquisitions Criteria and Rationale
Differentiated Competitive Position ndash In the Sweet Spot
Differentiated Competitive Position ndash In the Sweet Spot
Electric Power Infrastructure Services Segment Overview
Power Grid Investment Drivers - Transmission
Power Grid Investment Drivers - Transmission
Power Grid Investment Drivers - Distribution
Oil amp Gas Infrastructure Services Segment Overview
Reconciliation of Adjusted Net Income from Continuing Operations Attributable to Common Stock
Reconciliation of Electric Power and Oil amp Gas Infrastructure Services Segments Operating Income As Adjusted
Reconciliation of Free Cash Flow
Forward Looking Statement Disclaimer
Forward Looking Statement Disclaimer
Free Cash Flow From Continuing Operations
Source
2013
2014
2015
2016
(Support Cash Flow Statement)
Net Cash Provided by Operating Activities of Continuing Operations
370558
247742
618183
381176
(Support Cash Flow Statement)
Less Net Capital Expenditures
(Support Cash Flow Statement)
Additions of Property and Equipment
(221946)
(247216)
(209968)
(212555)
(Support Cash Flow Statement)
Proceeds from Sale of Property and Equipment
14789
14448
26178
21975
(Recalculation)
Net Capital Expenditures
(207157)
(232768)
(183790)
(190580)
(Recalculation)
Free Cash Flow
163401
14974
434393
190596
Adjusted Operating Income Margin
$ in millions
Support for slide 23
Amounts in millions except percentages
Electric Power
Oil amp Gas Infrastructure
123114
123115
123116
123114
Revenues
$ 53027
$ 49373
$ 48505
$ 24446
Operating Income (as reported)
4630
3623
3957
1628
Addback
Provisions for long term contract receivable
1025
-0
-0
-0
Arbitration expense
-0
-0
-0
388
Asset impairment charge
-0
66
57
-0
Operating Income (as adjusted)
$ 5655
$ 3689
$ 4014
$ 2016
Operating income margin (as reported)
87
73
82
67
Operating income margin (as adjusted)
107
75
83
83
Reconciliation of Free Cash Flow
2013 2014 2015 2016Net Cash Provided by Operating Activities of Continuing Operations 370558 247742 618183 381176 Less Net Capital ExpendituresAdditions of Property and Equipment (221946) (247216) (209968) (212555) Proceeds from Sale of Property and Equipment 14789 14448 26178 21975 Net Capital Expenditures (207157) (232768) (183790) (190580)
Free Cash Flow 163401 14974 434393 190596
Free Cash Flow from Cont Ops
Forward Looking Statement DisclaimerThis presentation (and oral statements regarding the subject matter of this presentation) includes ldquoforward-looking statementsrdquo intended to qualify for the safe harbor from liability established by the Private Securities Litigation Reform Act of 1995 These statements reflect assumptions expectations projections intentions or beliefs about future events and use words such as anticipate estimate project forecast may will should could expect believe plan intend and other words of similar meaning You can identify these statements by the fact that they do not relate strictly to historical or current facts In particular these include but are not limited to statements relating to the following
bull Projected revenues net income earnings per share attributable to common stock backlog margins capital expenditures weighted average shares outstanding tax rates and other projections of operating or financial resultsbull Our business or financial outlook growth or opportunities in particular marketsbull The potential benefits from acquisitions and investmentsbull The expected financial and operational performance of acquired businessesbull Future capital allocation initiativesbull Our ability to deliver increased value and return capital to stockholders bull The strategic use of our balance sheetbull The expected value of contracts or intended contracts with customersbull The scope services term and results of any projects awarded or expected to be awarded for services to be provided by usbull The anticipated commencement and completion dates for any projects awardedbull The development of larger electric transmission and oil and natural gas pipeline projects and the level of oil natural gas and natural gas liquids prices and their impact on our business or the demand for our services bull The impact of existing or potential energy legislation bull Potential opportunities that may be indicated by bidding activity or discussions with customersbull The expected outcome of pending or threatened litigation bull Beliefs and assumptions about the collectability of receivablesbull The business plans or financial condition of our customersbull Our plans and strategies bull The current economic and regulatory conditions and trends in the industries we serve bull Possible recovery on pending or contemplated change orders or affirmative claims against customers or third parties and bull Other statements reflecting expectations intentions assumptions or beliefs about future events and other statements that do not relate strictly to historical or current facts
Although our management believes that the expectations reflected in such forward-looking statements are reasonable it can give no assurance that such expectations will prove to be correct These forward-looking statements are not guarantees of future performance and involve or rely on a number of risks uncertainties and assumptions that are difficult to predict or beyond our control These forward-looking statements reflect our beliefs and assumptions based on information available to our management at the time the statements are made We caution you that actual outcomes and results may differ materially from what is expressed implied or forecasted by our forward-looking statements and that any or all of our forward-looking statements may turn out to be wrong Forward-looking statements can be affected by inaccurate assumptions and by known or unknown risks and uncertainties including the following
bull Market conditionsbull The effects of industry economic financial or political conditions outside our control including weakness in capital marketsbull Quarterly variations in our operating resultsbull Trends and growth opportunities in relevant marketsbull The cost of borrowing availability of credit and cash fluctuations in the price and volume of our common stock debt covenant compliance interest rate fluctuations and other factors affecting our financing and investing activitiesbull Delays reductions in scope or cancellations of anticipated pending or existing projects including as a result of weather regulatory or permitting issues environmental processes project performance issues claimed force majeure events or our customers capital
constraintsbull The successful negotiation execution performance and completion of anticipated pending and existing contracts including the ability to obtain awards of projects on which we bid or are otherwise discussing with customersbull Our ability to retain key personnel and qualified employees
Forward Looking Statement Disclaimerbull Our ability to attract or the potential shortage of skilled labor bull Our dependence on fixed price contracts and the potential to incur losses with respect to the contractsbull Estimates relating to our use of percentage-of-completion accountingbull Adverse weatherbull Our ability to generate internal growthbull Competition in our business including our ability to effectively compete for new projects and market sharebull The effect of natural gas natural gas liquids and oil prices on our operations and growth opportunities and on
our customersrsquo capital programs and demand for our servicesbull The future development of natural resourcesbull The failure of existing or potential legislative actions to result in demand for our servicesbull Liabilities associated with multiemployer pension plans including underfunding of liabilities and termination
or withdrawal liabilitiesbull The possibility of further increases in the liability associated with our withdrawal from a multiemployer
pension planbull Unexpected costs or liabilities that may arise from pending or threatened litigation indemnity obligations or
other claims asserted against us including liabilities for claims that are self-insured or uninsuredbull The outcome of pending or threatened litigationbull Risks relating to the potential unavailability or cancellation of third party insurance the exclusion of coverage
for certain losses and potential increases in premiums for coverage deemed beneficial to usbull Cancellation provisions within our contracts and the risk that contracts expire and are not renewed or are
replaced on less favorable termsbull Loss of customers with whom we have long-standing or significant relationshipsbull The potential that participation in joint ventures or similar structures exposes us to liability andor harm to
our reputation for acts or omissions by our partnersbull Our inability or failure to comply with the terms of our contracts which may result in additional costs
unexcused delays warranty claims failure to meet performance guarantees damages or contract terminations
bull The inability or refusal of our customers to pay for services including the failure to collect outstanding receivables
bull The failure to recover on payment claims against project owners or third party contractors or to obtain adequate compensation for customer-requested change orders
bull The failure of our customers to comply with regulatory requirements applicable to their projects which may result in project delays and cancellations
bull Budgetary or other constraints that may reduce or eliminate tax incentives or government funding for projects which may result in project delays or cancellations
bull Estimates and assumptions in determining our financial results and backlogbull Our ability to realize our backlogbull Risks associated with operating in international markets including instability of foreign governments
currency fluctuations tax and investment strategies as well as compliance with foreign legal systems and cultural practices the US Foreign Corrupt Practices Act and other applicable anti-bribery and anti-corruption laws
bull Our ability to successfully identify complete integrate and realize synergies from acquisitionsbull The potential adverse impact resulting from uncertainty surrounding investments and acquisitions including
the ability to retain key personnel from the acquired businesses and the potential increase in risks already existing in our operations
bull The adverse impact of impairments of goodwill receivables property equipment and other intangible assets or investments
bull Our growth outpacing our decentralized management and infrastructurebull Requirements relating to governmental regulation and changes theretobull Inability to enforce our intellectual property rights or the obsolescence of such rightsbull Risks related to the implementation of an information technology solutionbull The impact of our unionized workforce on our operations including labor stoppages or interruptions due to
strikes or lockoutsbull Potential liabilities and other adverse effects arising from occupational health and safety mattersbull Our dependence on suppliers subcontractors equipment manufacturers and other third party contractorsbull Fluctuations of prices of certain materials used in our businessbull The ability to access sufficient funding to finance desired growth and operationsbull Our ability to obtain performance bondsbull Potential exposure to environmental liabilitiesbull Our ability to continue to meet certain requirements applicable to us and our subsidiariesbull Rapid technological and other structural changes that could reduce the demand for our servicesbull New or changed tax laws treaties or regulationsbull Increased healthcare costs arising from healthcare reform legislation or other governmental actionbull Regulatory changes that result in increased labor costsbull Significant fluctuations in foreign currency exchange rates andbull The other risks and uncertainties as are described elsewhere herein and in our Annual Report on Form 10-K for
the year ended December 31 2016 filed with the SEC and as may be detailed from time to time in our other public filings with the SEC
All of our forward-looking statements whether written or oral are expressly qualified by these cautionary statements and any other cautionary statements that may accompany such forward-looking statements or that are otherwise included in this presentation Should one or more of these risks materialize or should underlying assumptions prove incorrect actual results may vary materially from those expressed or implied in any forward-looking statements Investors are cautioned not to place undue reliance on these forward-looking statements which are current only as of this date We do not undertake and expressly disclaim any obligation to update or revise any forward-looking statements to reflect events or circumstances after the date of this presentation or otherwise and we expressly disclaim any written or oral statements made by any third party regarding the subject matter of this presentation
Slide Number 1
Forward Looking Statement Disclaimer
Key Takeaways
Leading Integrated Infrastructure Solutions Provider
Overview ndash Strategically Focused Operationally Diverse
Overview - Diverse and High Quality Customer Base
Leading Integrated Infrastructure Solutions Provider
Strategic Imperatives
Strategic Imperatives Deliver Profitable Growth
Strategic Acquisitions Criteria and Rationale
Differentiated Competitive Position ndash In the Sweet Spot
Differentiated Competitive Position ndash In the Sweet Spot
Electric Power Infrastructure Services Segment Overview
Power Grid Investment Drivers - Transmission
Power Grid Investment Drivers - Transmission
Power Grid Investment Drivers - Distribution
Oil amp Gas Infrastructure Services Segment Overview
Reconciliation of Adjusted Net Income from Continuing Operations Attributable to Common Stock
Reconciliation of Electric Power and Oil amp Gas Infrastructure Services Segments Operating Income As Adjusted
Reconciliation of Free Cash Flow
Forward Looking Statement Disclaimer
Forward Looking Statement Disclaimer
Free Cash Flow From Continuing Operations
Source
2013
2014
2015
2016
(Support Cash Flow Statement)
Net Cash Provided by Operating Activities of Continuing Operations
370558
247742
618183
381176
(Support Cash Flow Statement)
Less Net Capital Expenditures
(Support Cash Flow Statement)
Additions of Property and Equipment
(221946)
(247216)
(209968)
(212555)
(Support Cash Flow Statement)
Proceeds from Sale of Property and Equipment
14789
14448
26178
21975
(Recalculation)
Net Capital Expenditures
(207157)
(232768)
(183790)
(190580)
(Recalculation)
Free Cash Flow
163401
14974
434393
190596
Forward Looking Statement DisclaimerThis presentation (and oral statements regarding the subject matter of this presentation) includes ldquoforward-looking statementsrdquo intended to qualify for the safe harbor from liability established by the Private Securities Litigation Reform Act of 1995 These statements reflect assumptions expectations projections intentions or beliefs about future events and use words such as anticipate estimate project forecast may will should could expect believe plan intend and other words of similar meaning You can identify these statements by the fact that they do not relate strictly to historical or current facts In particular these include but are not limited to statements relating to the following
bull Projected revenues net income earnings per share attributable to common stock backlog margins capital expenditures weighted average shares outstanding tax rates and other projections of operating or financial resultsbull Our business or financial outlook growth or opportunities in particular marketsbull The potential benefits from acquisitions and investmentsbull The expected financial and operational performance of acquired businessesbull Future capital allocation initiativesbull Our ability to deliver increased value and return capital to stockholders bull The strategic use of our balance sheetbull The expected value of contracts or intended contracts with customersbull The scope services term and results of any projects awarded or expected to be awarded for services to be provided by usbull The anticipated commencement and completion dates for any projects awardedbull The development of larger electric transmission and oil and natural gas pipeline projects and the level of oil natural gas and natural gas liquids prices and their impact on our business or the demand for our services bull The impact of existing or potential energy legislation bull Potential opportunities that may be indicated by bidding activity or discussions with customersbull The expected outcome of pending or threatened litigation bull Beliefs and assumptions about the collectability of receivablesbull The business plans or financial condition of our customersbull Our plans and strategies bull The current economic and regulatory conditions and trends in the industries we serve bull Possible recovery on pending or contemplated change orders or affirmative claims against customers or third parties and bull Other statements reflecting expectations intentions assumptions or beliefs about future events and other statements that do not relate strictly to historical or current facts
Although our management believes that the expectations reflected in such forward-looking statements are reasonable it can give no assurance that such expectations will prove to be correct These forward-looking statements are not guarantees of future performance and involve or rely on a number of risks uncertainties and assumptions that are difficult to predict or beyond our control These forward-looking statements reflect our beliefs and assumptions based on information available to our management at the time the statements are made We caution you that actual outcomes and results may differ materially from what is expressed implied or forecasted by our forward-looking statements and that any or all of our forward-looking statements may turn out to be wrong Forward-looking statements can be affected by inaccurate assumptions and by known or unknown risks and uncertainties including the following
bull Market conditionsbull The effects of industry economic financial or political conditions outside our control including weakness in capital marketsbull Quarterly variations in our operating resultsbull Trends and growth opportunities in relevant marketsbull The cost of borrowing availability of credit and cash fluctuations in the price and volume of our common stock debt covenant compliance interest rate fluctuations and other factors affecting our financing and investing activitiesbull Delays reductions in scope or cancellations of anticipated pending or existing projects including as a result of weather regulatory or permitting issues environmental processes project performance issues claimed force majeure events or our customers capital
constraintsbull The successful negotiation execution performance and completion of anticipated pending and existing contracts including the ability to obtain awards of projects on which we bid or are otherwise discussing with customersbull Our ability to retain key personnel and qualified employees
Forward Looking Statement Disclaimerbull Our ability to attract or the potential shortage of skilled labor bull Our dependence on fixed price contracts and the potential to incur losses with respect to the contractsbull Estimates relating to our use of percentage-of-completion accountingbull Adverse weatherbull Our ability to generate internal growthbull Competition in our business including our ability to effectively compete for new projects and market sharebull The effect of natural gas natural gas liquids and oil prices on our operations and growth opportunities and on
our customersrsquo capital programs and demand for our servicesbull The future development of natural resourcesbull The failure of existing or potential legislative actions to result in demand for our servicesbull Liabilities associated with multiemployer pension plans including underfunding of liabilities and termination
or withdrawal liabilitiesbull The possibility of further increases in the liability associated with our withdrawal from a multiemployer
pension planbull Unexpected costs or liabilities that may arise from pending or threatened litigation indemnity obligations or
other claims asserted against us including liabilities for claims that are self-insured or uninsuredbull The outcome of pending or threatened litigationbull Risks relating to the potential unavailability or cancellation of third party insurance the exclusion of coverage
for certain losses and potential increases in premiums for coverage deemed beneficial to usbull Cancellation provisions within our contracts and the risk that contracts expire and are not renewed or are
replaced on less favorable termsbull Loss of customers with whom we have long-standing or significant relationshipsbull The potential that participation in joint ventures or similar structures exposes us to liability andor harm to
our reputation for acts or omissions by our partnersbull Our inability or failure to comply with the terms of our contracts which may result in additional costs
unexcused delays warranty claims failure to meet performance guarantees damages or contract terminations
bull The inability or refusal of our customers to pay for services including the failure to collect outstanding receivables
bull The failure to recover on payment claims against project owners or third party contractors or to obtain adequate compensation for customer-requested change orders
bull The failure of our customers to comply with regulatory requirements applicable to their projects which may result in project delays and cancellations
bull Budgetary or other constraints that may reduce or eliminate tax incentives or government funding for projects which may result in project delays or cancellations
bull Estimates and assumptions in determining our financial results and backlogbull Our ability to realize our backlogbull Risks associated with operating in international markets including instability of foreign governments
currency fluctuations tax and investment strategies as well as compliance with foreign legal systems and cultural practices the US Foreign Corrupt Practices Act and other applicable anti-bribery and anti-corruption laws
bull Our ability to successfully identify complete integrate and realize synergies from acquisitionsbull The potential adverse impact resulting from uncertainty surrounding investments and acquisitions including
the ability to retain key personnel from the acquired businesses and the potential increase in risks already existing in our operations
bull The adverse impact of impairments of goodwill receivables property equipment and other intangible assets or investments
bull Our growth outpacing our decentralized management and infrastructurebull Requirements relating to governmental regulation and changes theretobull Inability to enforce our intellectual property rights or the obsolescence of such rightsbull Risks related to the implementation of an information technology solutionbull The impact of our unionized workforce on our operations including labor stoppages or interruptions due to
strikes or lockoutsbull Potential liabilities and other adverse effects arising from occupational health and safety mattersbull Our dependence on suppliers subcontractors equipment manufacturers and other third party contractorsbull Fluctuations of prices of certain materials used in our businessbull The ability to access sufficient funding to finance desired growth and operationsbull Our ability to obtain performance bondsbull Potential exposure to environmental liabilitiesbull Our ability to continue to meet certain requirements applicable to us and our subsidiariesbull Rapid technological and other structural changes that could reduce the demand for our servicesbull New or changed tax laws treaties or regulationsbull Increased healthcare costs arising from healthcare reform legislation or other governmental actionbull Regulatory changes that result in increased labor costsbull Significant fluctuations in foreign currency exchange rates andbull The other risks and uncertainties as are described elsewhere herein and in our Annual Report on Form 10-K for
the year ended December 31 2016 filed with the SEC and as may be detailed from time to time in our other public filings with the SEC
All of our forward-looking statements whether written or oral are expressly qualified by these cautionary statements and any other cautionary statements that may accompany such forward-looking statements or that are otherwise included in this presentation Should one or more of these risks materialize or should underlying assumptions prove incorrect actual results may vary materially from those expressed or implied in any forward-looking statements Investors are cautioned not to place undue reliance on these forward-looking statements which are current only as of this date We do not undertake and expressly disclaim any obligation to update or revise any forward-looking statements to reflect events or circumstances after the date of this presentation or otherwise and we expressly disclaim any written or oral statements made by any third party regarding the subject matter of this presentation
Slide Number 1
Forward Looking Statement Disclaimer
Key Takeaways
Leading Integrated Infrastructure Solutions Provider
Overview ndash Strategically Focused Operationally Diverse
Overview - Diverse and High Quality Customer Base
Leading Integrated Infrastructure Solutions Provider
Strategic Imperatives
Strategic Imperatives Deliver Profitable Growth
Strategic Acquisitions Criteria and Rationale
Differentiated Competitive Position ndash In the Sweet Spot
Differentiated Competitive Position ndash In the Sweet Spot
Electric Power Infrastructure Services Segment Overview
Power Grid Investment Drivers - Transmission
Power Grid Investment Drivers - Transmission
Power Grid Investment Drivers - Distribution
Oil amp Gas Infrastructure Services Segment Overview
Reconciliation of Adjusted Net Income from Continuing Operations Attributable to Common Stock
Reconciliation of Electric Power and Oil amp Gas Infrastructure Services Segments Operating Income As Adjusted
Reconciliation of Free Cash Flow
Forward Looking Statement Disclaimer
Forward Looking Statement Disclaimer
Forward Looking Statement Disclaimerbull Our ability to attract or the potential shortage of skilled labor bull Our dependence on fixed price contracts and the potential to incur losses with respect to the contractsbull Estimates relating to our use of percentage-of-completion accountingbull Adverse weatherbull Our ability to generate internal growthbull Competition in our business including our ability to effectively compete for new projects and market sharebull The effect of natural gas natural gas liquids and oil prices on our operations and growth opportunities and on
our customersrsquo capital programs and demand for our servicesbull The future development of natural resourcesbull The failure of existing or potential legislative actions to result in demand for our servicesbull Liabilities associated with multiemployer pension plans including underfunding of liabilities and termination
or withdrawal liabilitiesbull The possibility of further increases in the liability associated with our withdrawal from a multiemployer
pension planbull Unexpected costs or liabilities that may arise from pending or threatened litigation indemnity obligations or
other claims asserted against us including liabilities for claims that are self-insured or uninsuredbull The outcome of pending or threatened litigationbull Risks relating to the potential unavailability or cancellation of third party insurance the exclusion of coverage
for certain losses and potential increases in premiums for coverage deemed beneficial to usbull Cancellation provisions within our contracts and the risk that contracts expire and are not renewed or are
replaced on less favorable termsbull Loss of customers with whom we have long-standing or significant relationshipsbull The potential that participation in joint ventures or similar structures exposes us to liability andor harm to
our reputation for acts or omissions by our partnersbull Our inability or failure to comply with the terms of our contracts which may result in additional costs
unexcused delays warranty claims failure to meet performance guarantees damages or contract terminations
bull The inability or refusal of our customers to pay for services including the failure to collect outstanding receivables
bull The failure to recover on payment claims against project owners or third party contractors or to obtain adequate compensation for customer-requested change orders
bull The failure of our customers to comply with regulatory requirements applicable to their projects which may result in project delays and cancellations
bull Budgetary or other constraints that may reduce or eliminate tax incentives or government funding for projects which may result in project delays or cancellations
bull Estimates and assumptions in determining our financial results and backlogbull Our ability to realize our backlogbull Risks associated with operating in international markets including instability of foreign governments
currency fluctuations tax and investment strategies as well as compliance with foreign legal systems and cultural practices the US Foreign Corrupt Practices Act and other applicable anti-bribery and anti-corruption laws
bull Our ability to successfully identify complete integrate and realize synergies from acquisitionsbull The potential adverse impact resulting from uncertainty surrounding investments and acquisitions including
the ability to retain key personnel from the acquired businesses and the potential increase in risks already existing in our operations
bull The adverse impact of impairments of goodwill receivables property equipment and other intangible assets or investments
bull Our growth outpacing our decentralized management and infrastructurebull Requirements relating to governmental regulation and changes theretobull Inability to enforce our intellectual property rights or the obsolescence of such rightsbull Risks related to the implementation of an information technology solutionbull The impact of our unionized workforce on our operations including labor stoppages or interruptions due to
strikes or lockoutsbull Potential liabilities and other adverse effects arising from occupational health and safety mattersbull Our dependence on suppliers subcontractors equipment manufacturers and other third party contractorsbull Fluctuations of prices of certain materials used in our businessbull The ability to access sufficient funding to finance desired growth and operationsbull Our ability to obtain performance bondsbull Potential exposure to environmental liabilitiesbull Our ability to continue to meet certain requirements applicable to us and our subsidiariesbull Rapid technological and other structural changes that could reduce the demand for our servicesbull New or changed tax laws treaties or regulationsbull Increased healthcare costs arising from healthcare reform legislation or other governmental actionbull Regulatory changes that result in increased labor costsbull Significant fluctuations in foreign currency exchange rates andbull The other risks and uncertainties as are described elsewhere herein and in our Annual Report on Form 10-K for
the year ended December 31 2016 filed with the SEC and as may be detailed from time to time in our other public filings with the SEC
All of our forward-looking statements whether written or oral are expressly qualified by these cautionary statements and any other cautionary statements that may accompany such forward-looking statements or that are otherwise included in this presentation Should one or more of these risks materialize or should underlying assumptions prove incorrect actual results may vary materially from those expressed or implied in any forward-looking statements Investors are cautioned not to place undue reliance on these forward-looking statements which are current only as of this date We do not undertake and expressly disclaim any obligation to update or revise any forward-looking statements to reflect events or circumstances after the date of this presentation or otherwise and we expressly disclaim any written or oral statements made by any third party regarding the subject matter of this presentation
Slide Number 1
Forward Looking Statement Disclaimer
Key Takeaways
Leading Integrated Infrastructure Solutions Provider
Overview ndash Strategically Focused Operationally Diverse
Overview - Diverse and High Quality Customer Base
Leading Integrated Infrastructure Solutions Provider
Strategic Imperatives
Strategic Imperatives Deliver Profitable Growth
Strategic Acquisitions Criteria and Rationale
Differentiated Competitive Position ndash In the Sweet Spot
Differentiated Competitive Position ndash In the Sweet Spot
Electric Power Infrastructure Services Segment Overview
Power Grid Investment Drivers - Transmission
Power Grid Investment Drivers - Transmission
Power Grid Investment Drivers - Distribution
Oil amp Gas Infrastructure Services Segment Overview