November 2015
28
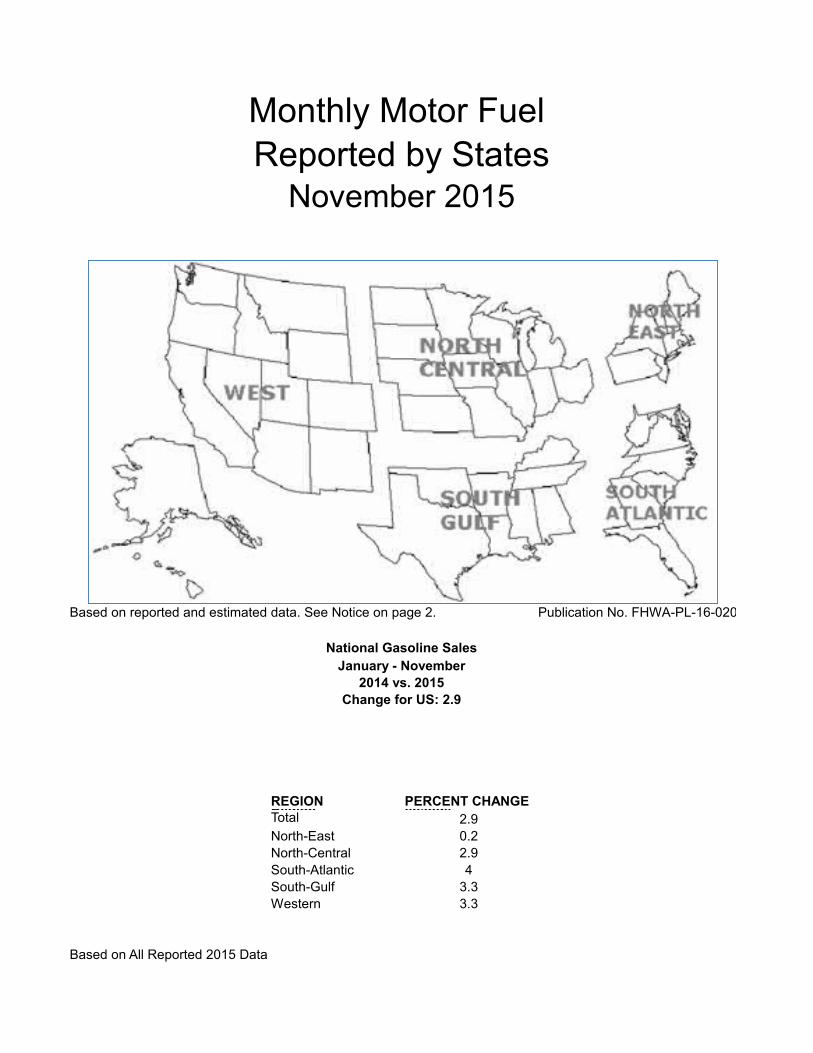
Monthly Motor Fuel Reported by States November 2015 Based on reported and estimated data. See Notice on page 2. Publication No. FHWA-PL-16-020 National Gasoline Sales MonthRange StartEnd January - November 2014 vs. 2015 Change for US: 2.9 REGION PERCENT CHANGE Region change Total 2.9 North-East 0.2 North-Central 2.9 South-Atlantic 4 South-Gulf 3.3 Western 3.3 Based on All Reported 2015 Data
description
Fuel Related
Transcript of November 2015
Monthly Motor Fuel Reported by States
November 2015
Based on reported and estimated data. See Notice on page 2. Publication No. FHWA-PL-16-020
National Gasoline SalesMonthRange StartEnd
January - November2014 vs. 2015
Change for US: 2.9
REGION PERCENT CHANGERegion changeTotal 2.9North-East 0.2North-Central 2.9South-Atlantic 4South-Gulf 3.3Western 3.3
Based on All Reported 2015 Data

Publication No. FHWA-PL-16-020

Electronic Tables Available on the Internet
The web address is as follows:
Questions about this Report
If you have questions concerning this report, contact;
Bryant L. GrossFederal Highway AdministrationOffice of Highway Policy Information (OHPI)1200 New Jersey Avenue SEWashington, DC 20590
Telephone: 202 366-5026Facsimile: 202 366-7742
Important Notice
The web address is as follows:
The tables in this report can be found each month on the Office of Highway Policy Information webpage under Products and Publications. The publication is titled "Monthly Motor Fuel Reported by States."
https://www.fhwa.dot.gov/ohim/mmfr/mmfrpage.htm
The Monthly Motor Fuel Reported by States report is only available on the FHWA Office of Highway Policy Information website.
https://www.fhwa.dot.gov/ohim/mmfr/mmfrpage.htm
Data in the tables are subject to change because the States may revise and update their data. Effective with the May 2005 report, the table MF-121T will no longer show tax rate changes during the year. The table only shows
the most current tax rate and the effective date.
In the event that a State has not yet reported data, the tables MF33G, MF33GA, MF33SF, and the Cover Sheet will show estimates based on the State's previous year's data and that State's region percent change. If the
previous year's data is unavailable, a dash (-) will be displayed. Estimated data for the States are in bold fonts.

Motor Fuel TrendsCreated On: 04/05/2016
November 2015 Reporting Period
Gasoline Sales
Motor Fuel Taxation
Based on State-reported data (43 entries) and estimated data where States did not report, gasoline consumption for January - November 2015 changed by 2.9 percent compared to the same period in 2014. (1)
The gasoline volume shown in this report is a cumulative tabulation of gross volume reported by wholesale distributors to State motor fuel tax agencies. It includes highway use, non-highway use, and losses. There is a
lag of up to six weeks between the wholesale transactions reported and retail sales to consumers. Travel trends are reported monthly in Traffic Volume Trends based on actual traffic counts at permanent traffic recorders
operated by the State highway agencies and reflect highway use of fuel. The vehicle-miles reported includes all vehicles, regardless of fuel type. While data in both reports reflect changes in trends, large monthly changes can
be caused by exceptional weather conditions, variations in timing of holidays, or processing delays.
All States levy volume taxes on gasoline and diesel fuel. The rates in effect for 2015 are shown in the table MF-121T. The gasoline rates vary from a low of 0.346 cents per gallon to 50.5 cents with an average of 24.9 cents.Five States provide for full or partial exemptions for gasohol, a blend of 90 percent gasoline and 10
percent fuel alcohol. Diesel rates vary from 0.346 cents to 64.2 cents per gallon.
Traditionally, State fuel tax rates could only be changed with legislation, but 10 States now have variable rate motor fuel taxes. These taxes are adjusted at specified intervals annually, semi-annually, or quarterly--usually on
the table, MF-121T. Adjustments to variable tax rates are announced by State tax agencies shortly before the effective date of the change.
(1) This percentage change is a comparison for those States for which data are available for the report month. However, the percentage change on the national mapis a comparison of cumulative data for all States--reported and estimated--for which both 2014 and 2015 data
are available.


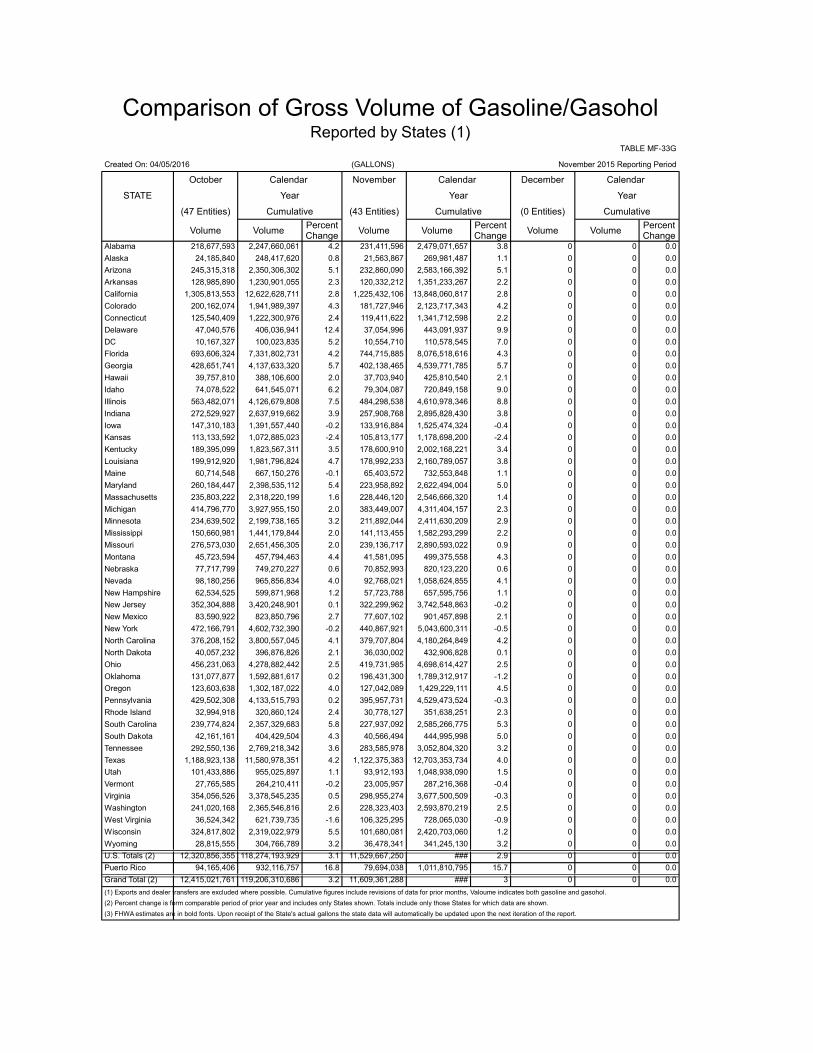
Comparison of Gross Volume of Gasoline/GasoholReported by States (1)
TABLE MF-33G
Created On: 04/05/2016 (GALLONS) November 2015 Reporting Period
January Calendar February Calendar March Calendar
STATE 52 Year 52 Year 52 Year
(52 Entities) Cumulative (52 Entities) Cumulative (52 Entities) Cumulative
Volume (3) Volume Volume (3) Volume Volume (3) Volume
Alabama 220,312,563 220,312,563 4.9 212,674,964 432,987,527 5.3 198,683,901 631,671,428 4.7
Alaska 21,547,349 21,547,349 5.0 20,364,604 41,911,953 2.4 22,545,552 64,457,505 1.7
Arizona 231,912,645 231,912,645 7.5 215,661,073 447,573,718 5.2 249,614,725 697,188,443 5.1
Arkansas 117,392,240 117,392,240 2.9 101,291,425 218,683,665 0.2 116,943,815 335,627,480 -0.5
California 1,217,054,940 1,217,054,940 3.6 1,148,825,043 2,365,879,983 3.5 1,288,573,351 3,654,453,334 3.5
Colorado 183,396,778 183,396,778 4.1 164,075,143 347,471,921 2.7 192,000,081 539,472,002 3.8
Connecticut 116,441,085 116,441,085 2.0 106,729,819 223,170,904 2.6 121,583,283 344,754,187 2.1
Delaware 36,024,878 36,024,878 7.5 32,796,171 68,821,049 5.0 37,754,642 106,575,691 4.8
DC 9,014,706 9,014,706 0.0 9,367,669 18,382,375 2.1 10,936,662 29,319,037 0.8
Florida 712,351,560 712,351,560 1.5 723,322,281 1,435,673,841 2.6 684,603,143 2,120,276,984 3.0
Georgia 394,610,747 394,610,747 8.1 366,119,009 760,729,756 7.9 420,860,629 1,181,590,385 4.6
Hawaii 36,739,889 36,739,889 -6.3 35,875,882 72,615,771 0.8 39,099,281 111,715,052 -1.1
Idaho 55,306,349 55,306,349 0.2 60,109,929 115,416,278 0.3 58,480,717 173,896,995 1.4
Illinois 386,736,943 386,736,943 5.8 364,184,378 750,921,321 9.9 393,492,692 1,144,414,013 8.8
Indiana 247,129,932 247,129,932 8.9 228,910,247 476,040,179 6.3 256,619,902 732,660,081 5.2
Iowa 132,588,606 132,588,606 3.9 126,682,450 259,271,056 6.2 129,862,942 389,133,998 2.9
Kansas 105,268,076 105,268,076 0.2 99,582,564 204,850,640 2.4 107,343,457 312,194,097 1.5
Kentucky 171,172,691 171,172,691 4.9 152,059,861 323,232,552 2.4 176,134,805 499,367,357 2.3
Louisiana 190,056,139 190,056,139 4.5 178,395,820 368,451,959 4.8 206,413,071 574,865,030 6.5
Maine 62,713,836 62,713,836 -1.8 19,892,120 82,605,956 -33.8 86,680,126 169,286,082 -9.1
Maryland 208,795,934 208,795,934 -5.7 206,241,109 415,037,043 -1.2 229,788,149 644,825,192 0.9
Massachusetts 237,997,959 237,997,959 8.9 203,285,678 441,283,637 5.4 231,192,209 672,475,846 4.4
Michigan 409,798,988 409,798,988 16.1 287,365,130 697,164,118 -1.2 397,997,007 1,095,161,125 1.9
Minnesota 208,610,761 208,610,761 2.6 196,605,108 405,215,869 3.1 203,382,246 608,598,115 2.8
Mississippi 136,751,870 136,751,870 9.5 154,138,130 290,890,000 16.1 146,688,960 437,578,960 11.1
Missouri 250,606,436 250,606,436 3.4 228,329,021 478,935,457 3.0 257,457,922 736,393,379 2.7
Montana 38,796,293 38,796,293 6.6 37,945,558 76,741,851 7.5 40,584,601 117,326,452 7.3
Nebraska 69,289,801 69,289,801 2.1 64,087,773 133,377,574 0.0 71,895,871 205,273,445 -6.1
Nevada 91,921,114 91,921,114 5.1 84,576,673 176,497,787 4.5 97,859,045 274,356,832 4.6
New Hampshire 58,120,537 58,120,537 2.9 53,115,450 111,235,987 1.5 58,523,302 169,759,289 1.5
New Jersey 325,319,317 325,319,317 2.2 302,473,649 627,792,966 3.1 341,504,945 969,297,911 2.2
New Mexico 81,276,374 81,276,374 -2.2 70,414,028 151,690,402 -3.3 82,140,984 233,831,386 -10.4
New York 472,097,983 472,097,983 1.1 405,664,515 877,762,498 3.1 444,324,315 1,322,086,813 -0.4
North Carolina 354,241,953 354,241,953 5.9 321,584,153 675,826,106 4.1 373,555,173 1,049,381,279 4.0
North Dakota 36,939,198 36,939,198 7.5 38,602,252 75,541,450 7.5 34,742,326 110,283,776 5.3
Ohio 403,219,242 403,219,242 4.8 371,471,257 774,690,499 3.1 417,206,451 1,191,896,950 3.0
Oklahoma 121,590,445 121,590,445 -5.5 178,342,597 299,933,042 4.0 159,037,722 458,970,764 3.3
Oregon 92,822,608 92,822,608 -19.0 139,413,145 232,235,753 7.0 125,826,306 358,062,059 5.7
Pennsylvania 396,904,000 396,904,000 3.0 365,943,989 762,847,989 2.6 397,731,511 1,160,579,500 1.0
Rhode Island 31,826,978 31,826,978 7.3 28,631,346 60,458,324 4.9 32,556,377 93,014,701 5.2
South Carolina 219,872,727 219,872,727 7.8 194,770,320 414,643,047 5.9 236,893,661 651,536,708 5.0
South Dakota 39,911,551 39,911,551 3.5 37,034,153 76,945,704 7.7 33,704,443 110,650,147 7.2
Tennessee 273,378,096 273,378,096 10.0 232,344,587 505,722,683 4.0 240,710,566 746,433,249 2.2
Texas 1,105,723,186 1,105,723,186 4.7 1,021,393,165 2,127,116,351 3.3 1,170,016,940 3,297,133,291 3.5
Utah 91,900,737 91,900,737 4.5 85,198,740 177,099,477 5.1 96,806,403 273,905,880 4.8
Vermont 26,057,900 26,057,900 1.6 23,825,860 49,883,760 1.0 26,187,781 76,071,541 1.3
Virginia 265,936,110 265,936,110 -23.6 286,423,144 552,359,254 -4.9 349,631,050 901,990,304 -12.7
Washington 218,548,666 218,548,666 0.6 204,980,949 423,529,615 1.9 234,584,543 658,114,158 2.4
West Virginia 49,824,404 49,824,404 -11.2 53,692,601 103,517,005 -13.2 60,215,362 163,732,367 -8.4
Wisconsin 206,306,760 206,306,760 10.2 196,033,835 402,340,595 13.2 208,946,507 611,287,102 11.1
Wyoming 24,822,506 24,822,506 11.8 29,276,135 54,098,641 7.3 30,976,028 85,074,669 14.6
U.S. Totals (2) 11,196,982,386 11,196,982,386 3.2 10,470,124,502 21,667,106,888 3.4 11,630,895,483 33,298,002,371 2.7
Puerto Rico 87,549,577 87,549,577 6.7 84,214,553 171,764,130 1.3 96,434,134 268,198,264 7.7
Grand Total (2) 11,284,531,963 11,284,531,963 3.3 10,554,339,055 21,838,871,018 3.4 11,727,329,617 33,566,200,635 2.8
(1) Exports and dealer transfers are excluded where possible. Cumulative figures include revisions of data for prior months, Valoume indicates both gasoline and gasohol.
(2) Percent change is form comparable period of prior year and includes only States shown. Totals include only those States for which data are shown.
(3) FHWA estimates are in bold fonts. Upon receipt of the State's actual gallons the state data will automatically be updated upon the next iteration of the report.
Pct Chg(2)
Pct Chg(2)
Pct Chg(2)

Comparison of Gross Volume of Gasoline/GasoholReported by States (1)
TABLE MF-33G
Created On: 04/05/2016 (GALLONS) November 2015 Reporting Period
April Calendar May Calendar June Calendar
STATE 52 Year 51 Year 51 Year
(52 Entities) Cumulative (51 Entities) Cumulative (51 Entities) Cumulative
Volume (3) Volume Volume (3) Volume Volume (3) Volume
Alabama 223,757,563 855,428,991 4.2 226,028,971 1,081,457,962 4.0 232,883,489 1,314,341,451 3.6
Alaska 21,899,890 86,357,395 1.2 26,136,468 112,493,863 1.3 27,493,257 139,987,120 1.9
Arizona 238,001,558 935,190,001 4.7 232,077,464 1,167,267,465 4.0 229,549,119 1,396,816,584 4.4
Arkansas 122,826,762 458,454,242 0.2 127,758,236 586,212,478 0.3 127,064,977 713,277,455 1.0
California 1,256,810,725 4,911,264,059 3.5 1,279,627,229 6,190,891,288 2.9 1,264,319,882 7,455,211,170 3.0
Colorado 184,466,870 723,938,872 3.8 194,896,095 918,834,967 3.7 199,658,243 1,118,493,210 4.0
Connecticut 120,039,283 464,793,470 2.2 129,493,337 594,286,807 2.3 126,049,057 720,335,864 2.5
Delaware 38,384,304 144,959,995 4.1 45,345,537 190,305,532 6.4 40,231,787 230,537,319 12.5
DC 8,407,349 37,726,386 -2.3 10,577,826 48,304,212 0.1 10,163,260 58,467,472 0.2
Florida 773,709,776 2,893,986,760 3.0 768,808,800 3,662,795,560 3.8 756,113,590 4,418,909,150 3.7
Georgia 411,710,219 1,593,300,604 4.7 431,796,470 2,025,097,074 4.5 417,675,073 2,442,772,147 4.8
Hawaii 38,586,870 150,301,922 -0.5 39,402,603 189,704,525 -0.3 38,645,451 228,349,976 1.9
Idaho 54,547,192 228,444,187 3.0 60,027,145 288,471,332 4.7 61,116,982 349,588,314 4.5
Illinois 389,905,847 1,534,319,860 5.6 408,963,925 1,943,283,785 2.2 404,980,326 2,348,264,111 2.3
Indiana 261,591,519 994,251,600 5.1 276,738,852 1,270,990,452 4.7 265,196,316 1,536,186,768 4.0
Iowa 136,549,997 525,683,995 2.2 146,322,431 672,006,426 0.3 142,981,103 814,987,529 0.0
Kansas 108,350,902 420,544,999 0.9 113,593,172 534,138,171 -0.1 113,225,021 647,363,192 -0.1
Kentucky 183,315,344 682,682,701 2.6 191,733,450 874,416,151 2.5 187,241,062 1,061,657,213 2.6
Louisiana 197,432,230 772,297,260 5.3 202,550,164 974,847,424 4.2 198,256,090 1,173,103,514 6.2
Maine 72,156,331 241,442,413 -2.5 72,608,013 314,050,426 11.1 55,307,761 369,358,187 -1.3
Maryland 236,343,104 881,168,296 1.8 251,289,326 1,132,457,622 2.5 252,064,751 1,384,522,373 2.5
Massachusetts 220,380,418 892,856,264 3.3 241,458,837 1,134,315,101 2.8 236,781,149 1,371,096,250 2.5
Michigan 370,810,644 1,465,971,769 2.5 329,531,951 1,795,503,720 -2.7 428,490,006 2,223,993,726 -0.8
Minnesota 209,393,527 817,991,642 3.9 226,502,526 1,044,494,168 3.1 230,879,303 1,275,373,471 3.3
Mississippi 152,405,317 589,984,277 11.1 152,820,469 742,804,746 7.9 134,184,958 876,989,704 5.1
Missouri 262,229,288 998,622,667 2.3 234,448,047 1,233,070,714 -1.6 294,454,211 1,527,524,925 0.6
Montana 41,706,834 159,033,286 6.4 46,117,954 205,151,240 5.4 50,295,779 255,447,019 5.8
Nebraska 73,579,507 278,852,952 -3.7 76,163,741 355,016,693 -3.1 79,732,968 434,749,661 -1.6
Nevada 94,691,716 369,048,548 4.2 97,743,890 466,792,438 3.9 98,912,608 565,705,046 4.1
New Hampshire 55,437,212 225,196,501 1.2 60,146,158 285,342,659 1.0 61,133,769 346,476,428 0.8
New Jersey 338,523,016 1,307,820,927 1.5 351,999,386 1,659,820,313 0.8 348,552,708 2,008,373,021 0.4
New Mexico 81,591,744 315,423,130 -1.8 81,126,870 396,550,000 -0.5 88,683,077 485,233,077 0.8
New York 451,246,750 1,773,333,563 0.2 455,601,213 2,228,934,776 0.1 461,697,686 2,690,632,462 0.0
North Carolina 376,181,077 1,425,562,356 3.4 368,982,419 1,794,544,775 1.8 433,650,235 2,228,195,010 4.2
North Dakota 38,369,383 148,653,159 4.2 42,188,498 190,841,657 3.9 40,837,478 231,679,135 3.3
Ohio 417,607,219 1,609,504,169 3.0 450,392,091 2,059,896,260 2.9 432,066,120 2,491,962,380 2.5
Oklahoma 159,295,552 618,266,316 1.2 138,258,921 756,525,237 0.3 200,673,341 957,198,578 2.2
Oregon 121,712,640 479,774,699 3.9 140,773,464 620,548,163 5.1 130,121,100 750,669,263 4.3
Pennsylvania 407,501,467 1,568,080,967 0.7 434,928,313 2,003,009,280 0.6 419,810,628 2,422,819,908 0.4
Rhode Island 30,858,840 123,873,541 4.3 33,564,468 157,438,009 1.6 31,258,488 188,696,497 1.4
South Carolina 241,381,453 892,918,161 7.3 245,381,943 1,138,300,104 5.3 243,512,356 1,381,812,460 4.6
South Dakota 36,620,321 147,270,468 6.4 36,138,670 183,409,138 5.8 39,972,417 223,381,555 4.1
Tennessee 274,807,467 1,021,240,716 0.6 289,430,525 1,310,671,241 0.2 308,957,063 1,619,628,304 1.8
Texas 1,157,190,569 4,454,323,860 3.6 1,173,958,196 5,628,282,056 3.3 1,167,706,942 6,795,988,998 3.6
Utah 92,648,240 366,554,120 3.9 91,774,015 458,328,135 1.9 91,531,956 549,860,091 0.8
Vermont 24,590,458 100,661,999 1.9 26,385,727 127,047,726 1.3 26,987,685 154,035,411 0.2
Virginia 316,338,605 1,218,328,909 -3.9 303,933,171 1,522,262,080 2.0 457,611,134 1,979,873,214 2.5
Washington 231,118,230 889,232,388 2.1 244,138,660 1,133,371,048 2.6 249,603,979 1,382,975,027 3.3
West Virginia 63,750,650 227,483,017 8.1 84,794,942 312,277,959 -2.3 73,010,173 385,288,132 -1.0
Wisconsin 200,310,629 811,597,731 12.6 242,943,653 1,054,541,384 14.2 207,357,449 1,261,898,833 -2.9
Wyoming 29,987,917 115,062,586 13.6 21,668,979 136,731,565 9.2 27,271,365 164,002,930 2.9
U.S. Totals (2) 11,651,060,325 44,949,062,696 3.1 11,959,073,211 56,908,135,907 2.6 12,245,954,728 69,154,090,635 2.5
Puerto Rico 87,950,576 356,148,840 7.1 62,303,151 418,451,991 6.8 111,875,667 530,327,658 11.0
Grand Total (2) 11,739,010,901 45,305,211,536 3.1 12,021,376,362 57,326,587,898 2.6 12,357,830,395 69,684,418,293 2.6
(1) Exports and dealer transfers are excluded where possible. Cumulative figures include revisions of data for prior months, Valoume indicates both gasoline and gasohol.
(2) Percent change is form comparable period of prior year and includes only States shown. Totals include only those States for which data are shown.
(3) FHWA estimates are in bold fonts. Upon receipt of the State's actual gallons the state data will automatically be updated upon the next iteration of the report.
Pct Chg(2)
Pct Chg(2)
Pct Chg(2)

Comparison of Gross Volume of Gasoline/GasoholReported by States (1)
TABLE MF-33G
Created On: 04/05/2016 (GALLONS) November 2015 Reporting Period
July Calendar August Calendar September Calendar
STATE 51 Year 51 Year 48 Year
(51 Entities) Cumulative (51 Entities) Cumulative (48 Entities) Cumulative
Volume (3) Volume Volume (3) Volume Volume (3) Volume
Alabama 231,597,752 1,545,939,203 4.0 241,571,195 1,787,510,398 4.0 241,472,070 2,028,982,468 4.4
Alaska 29,731,719 169,718,839 0.8 28,632,254 198,351,093 0.7 25,880,687 224,231,780 0.8
Arizona 239,025,562 1,635,842,146 4.7 245,383,348 1,881,225,494 5.1 223,765,490 2,104,990,984 4.9
Arkansas 132,612,144 845,889,599 1.4 130,071,058 975,960,657 1.6 125,954,508 1,101,915,165 2.2
California 1,279,316,652 8,734,527,822 2.9 1,317,483,856 10,052,011,678 2.8 1,264,803,480 11,316,815,158 2.9
Colorado 211,709,168 1,330,202,378 4.2 212,164,296 1,542,366,674 4.2 199,460,649 1,741,827,323 4.4
Connecticut 129,492,363 849,828,227 2.7 129,396,000 979,224,227 3.0 117,536,340 1,096,760,567 2.7
Delaware 43,654,856 274,192,175 11.5 45,881,839 320,074,014 14.0 38,922,351 358,996,365 10.1
DC 11,363,620 69,831,092 2.8 10,122,328 79,953,420 3.8 9,903,088 89,856,508 4.2
Florida 723,686,014 5,142,595,164 3.9 741,048,423 5,883,643,587 4.2 754,552,820 6,638,196,407 4.3
Georgia 432,939,025 2,875,711,172 5.3 430,918,034 3,306,629,206 5.2 402,352,373 3,708,981,579 5.4
Hawaii 40,211,100 268,561,076 2.0 41,185,959 309,747,035 2.2 38,601,755 348,348,790 2.1
Idaho 64,605,156 414,193,470 4.1 69,575,869 483,769,339 4.8 83,697,210 567,466,549 6.1
Illinois 414,292,529 2,762,556,640 2.9 409,544,284 3,172,100,924 5.0 391,096,813 3,563,197,737 3.8
Indiana 285,837,380 1,822,024,148 4.2 278,544,010 2,100,568,158 4.2 264,821,577 2,365,389,735 4.1
Iowa 148,620,975 963,608,504 0.0 146,520,258 1,110,128,762 -0.1 134,118,495 1,244,247,257 -0.4
Kansas 113,820,980 761,184,172 -0.3 92,837,734 854,021,906 -2.7 105,729,525 959,751,431 -2.7
Kentucky 194,607,977 1,256,265,190 3.0 195,429,537 1,451,694,727 3.4 182,477,485 1,634,172,212 3.5
Louisiana 208,602,944 1,381,706,458 5.9 204,076,511 1,585,782,969 5.3 196,100,935 1,781,883,904 5.5
Maine 69,762,091 439,120,278 -0.8 90,778,590 529,898,868 1.6 76,536,860 606,435,728 1.1
Maryland 222,367,706 1,606,890,079 0.8 305,858,814 1,912,748,893 4.6 225,601,772 2,138,350,665 3.8
Massachusetts 240,254,954 1,611,351,204 2.2 242,812,423 1,854,163,627 1.9 228,253,350 2,082,416,977 1.7
Michigan 471,637,945 2,695,631,671 1.7 419,640,600 3,115,272,271 1.5 397,886,109 3,513,158,380 1.9
Minnesota 243,915,668 1,519,289,139 3.5 232,860,425 1,752,149,564 3.0 212,949,099 1,965,098,663 2.9
Mississippi 134,270,871 1,011,260,575 2.9 142,713,938 1,153,974,513 2.0 136,544,350 1,290,518,863 2.1
Missouri 301,099,886 1,828,624,811 2.0 279,842,566 2,108,467,377 2.1 266,415,898 2,374,883,275 2.3
Montana 56,272,941 311,719,960 5.1 53,277,900 364,997,860 4.5 47,073,009 412,070,869 4.5
Nebraska 82,468,925 517,218,586 -1.2 80,069,954 597,288,540 -0.4 74,263,888 671,552,428 0.1
Nevada 100,200,734 665,905,780 3.8 104,869,960 770,775,740 4.1 96,900,838 867,676,578 4.2
New Hampshire 65,427,112 411,903,540 0.9 65,204,846 477,108,386 1.0 60,229,057 537,337,443 1.2
New Jersey 357,757,497 2,366,130,518 0.0 361,808,399 2,727,938,917 0.0 340,005,096 3,067,944,013 0.1
New Mexico 86,779,411 572,012,488 1.4 86,592,330 658,604,818 1.6 81,655,056 740,259,874 2.1
New York 475,995,755 3,166,628,217 -0.8 471,532,927 3,638,161,144 -2.3 492,404,455 4,130,565,599 -0.9
North Carolina 410,472,526 2,638,667,536 4.7 402,009,657 3,040,677,193 4.8 383,671,700 3,424,348,893 4.9
North Dakota 44,001,539 275,680,674 2.7 42,267,491 317,948,165 2.5 38,871,429 356,819,594 1.6
Ohio 455,673,306 2,947,635,686 2.4 450,282,323 3,397,918,009 2.4 424,733,370 3,822,651,379 2.4
Oklahoma 173,230,469 1,130,429,047 2.0 160,139,426 1,290,568,473 3.8 171,235,267 1,461,803,740 0.4
Oregon 144,382,564 895,051,827 4.0 151,987,607 1,047,039,434 4.6 131,543,950 1,178,583,384 4.5
Pennsylvania 439,304,983 2,862,124,891 0.6 434,688,550 3,296,813,441 0.5 407,200,044 3,704,013,485 0.4
Rhode Island 33,406,730 222,103,227 1.3 33,932,261 256,035,488 1.9 31,829,718 287,865,206 2.2
South Carolina 252,866,417 1,634,678,877 4.9 247,849,344 1,882,528,221 5.1 235,026,638 2,117,554,859 5.7
South Dakota 46,789,315 270,170,870 5.4 47,543,585 317,714,455 4.3 44,553,888 362,268,343 4.2
Tennessee 290,051,664 1,909,679,968 2.3 291,349,671 2,201,029,639 2.7 275,638,567 2,476,668,206 2.7
Texas 1,210,112,529 8,006,101,527 4.1 1,218,749,097 9,224,850,624 4.2 1,167,204,589 10,392,055,213 4.5
Utah 104,387,540 654,247,631 1.1 100,956,789 755,204,420 0.9 98,387,591 853,592,011 0.8
Vermont 29,485,689 183,521,100 0.8 26,396,511 209,917,611 -0.7 26,527,215 236,444,826 -0.6
Virginia 349,029,952 2,328,903,166 -1.3 380,645,749 2,709,548,915 2.9 314,939,794 3,024,488,709 1.8
Washington 248,652,159 1,631,627,186 2.8 255,757,299 1,887,384,485 2.6 237,142,163 2,124,526,648 2.7
West Virginia 73,832,025 459,120,157 7.4 80,105,507 539,225,664 0.5 45,989,729 585,215,393 -2.0
Wisconsin 259,204,425 1,521,103,258 -0.8 238,945,026 1,760,048,284 -0.2 234,156,893 1,994,205,177 0.9
Wyoming 32,645,860 196,648,790 6.0 50,766,168 247,414,958 15.1 28,536,276 275,951,234 4.5
U.S. Totals (2) 12,441,469,104 81,595,559,739 2.7 12,522,622,526 94,118,182,265 2.9 11,835,155,309 ### 2.9
Puerto Rico 114,123,264 644,450,922 16.4 117,628,367 762,079,289 20.1 75,872,062 837,951,351 18.4
Grand Total (2) 12,555,592,368 82,240,010,661 2.7 12,640,250,893 94,880,261,554 3.0 11,911,027,371 ### 3.0
(1) Exports and dealer transfers are excluded where possible. Cumulative figures include revisions of data for prior months, Valoume indicates both gasoline and gasohol.
(2) Percent change is form comparable period of prior year and includes only States shown. Totals include only those States for which data are shown.
(3) FHWA estimates are in bold fonts. Upon receipt of the State's actual gallons the state data will automatically be updated upon the next iteration of the report.
Pct Chg(2)
Pct Chg(2)
Pct Chg(2)
Comparison of Gross Volume of Gasoline/GasoholReported by States (1)
TABLE MF-33G
Created On: 04/05/2016 (GALLONS) November 2015 Reporting Period
October Calendar November Calendar December Calendar
STATE 47 Year 43 Year 0 Year
(47 Entities) Cumulative (43 Entities) Cumulative (0 Entities) Cumulative
Volume Volume Volume Volume Volume Volume
Alabama 218,677,593 2,247,660,061 4.2 231,411,596 2,479,071,657 3.8 0 0 0.0
Alaska 24,185,840 248,417,620 0.8 21,563,867 269,981,487 1.1 0 0 0.0
Arizona 245,315,318 2,350,306,302 5.1 232,860,090 2,583,166,392 5.1 0 0 0.0
Arkansas 128,985,890 1,230,901,055 2.3 120,332,212 1,351,233,267 2.2 0 0 0.0
California 1,305,813,553 12,622,628,711 2.8 1,225,432,106 13,848,060,817 2.8 0 0 0.0
Colorado 200,162,074 1,941,989,397 4.3 181,727,946 2,123,717,343 4.2 0 0 0.0
Connecticut 125,540,409 1,222,300,976 2.4 119,411,622 1,341,712,598 2.2 0 0 0.0
Delaware 47,040,576 406,036,941 12.4 37,054,996 443,091,937 9.9 0 0 0.0
DC 10,167,327 100,023,835 5.2 10,554,710 110,578,545 7.0 0 0 0.0
Florida 693,606,324 7,331,802,731 4.2 744,715,885 8,076,518,616 4.3 0 0 0.0
Georgia 428,651,741 4,137,633,320 5.7 402,138,465 4,539,771,785 5.7 0 0 0.0
Hawaii 39,757,810 388,106,600 2.0 37,703,940 425,810,540 2.1 0 0 0.0
Idaho 74,078,522 641,545,071 6.2 79,304,087 720,849,158 9.0 0 0 0.0
Illinois 563,482,071 4,126,679,808 7.5 484,298,538 4,610,978,346 8.8 0 0 0.0
Indiana 272,529,927 2,637,919,662 3.9 257,908,768 2,895,828,430 3.8 0 0 0.0
Iowa 147,310,183 1,391,557,440 -0.2 133,916,884 1,525,474,324 -0.4 0 0 0.0
Kansas 113,133,592 1,072,885,023 -2.4 105,813,177 1,178,698,200 -2.4 0 0 0.0
Kentucky 189,395,099 1,823,567,311 3.5 178,600,910 2,002,168,221 3.4 0 0 0.0
Louisiana 199,912,920 1,981,796,824 4.7 178,992,233 2,160,789,057 3.8 0 0 0.0
Maine 60,714,548 667,150,276 -0.1 65,403,572 732,553,848 1.1 0 0 0.0
Maryland 260,184,447 2,398,535,112 5.4 223,958,892 2,622,494,004 5.0 0 0 0.0
Massachusetts 235,803,222 2,318,220,199 1.6 228,446,120 2,546,666,320 1.4 0 0 0.0
Michigan 414,796,770 3,927,955,150 2.0 383,449,007 4,311,404,157 2.3 0 0 0.0
Minnesota 234,639,502 2,199,738,165 3.2 211,892,044 2,411,630,209 2.9 0 0 0.0
Mississippi 150,660,981 1,441,179,844 2.0 141,113,455 1,582,293,299 2.2 0 0 0.0
Missouri 276,573,030 2,651,456,305 2.0 239,136,717 2,890,593,022 0.9 0 0 0.0
Montana 45,723,594 457,794,463 4.4 41,581,095 499,375,558 4.3 0 0 0.0
Nebraska 77,717,799 749,270,227 0.6 70,852,993 820,123,220 0.6 0 0 0.0
Nevada 98,180,256 965,856,834 4.0 92,768,021 1,058,624,855 4.1 0 0 0.0
New Hampshire 62,534,525 599,871,968 1.2 57,723,788 657,595,756 1.1 0 0 0.0
New Jersey 352,304,888 3,420,248,901 0.1 322,299,962 3,742,548,863 -0.2 0 0 0.0
New Mexico 83,590,922 823,850,796 2.7 77,607,102 901,457,898 2.1 0 0 0.0
New York 472,166,791 4,602,732,390 -0.2 440,867,921 5,043,600,311 -0.5 0 0 0.0
North Carolina 376,208,152 3,800,557,045 4.1 379,707,804 4,180,264,849 4.2 0 0 0.0
North Dakota 40,057,232 396,876,826 2.1 36,030,002 432,906,828 0.1 0 0 0.0
Ohio 456,231,063 4,278,882,442 2.5 419,731,985 4,698,614,427 2.5 0 0 0.0
Oklahoma 131,077,877 1,592,881,617 0.2 196,431,300 1,789,312,917 -1.2 0 0 0.0
Oregon 123,603,638 1,302,187,022 4.0 127,042,089 1,429,229,111 4.5 0 0 0.0
Pennsylvania 429,502,308 4,133,515,793 0.2 395,957,731 4,529,473,524 -0.3 0 0 0.0
Rhode Island 32,994,918 320,860,124 2.4 30,778,127 351,638,251 2.3 0 0 0.0
South Carolina 239,774,824 2,357,329,683 5.8 227,937,092 2,585,266,775 5.3 0 0 0.0
South Dakota 42,161,161 404,429,504 4.3 40,566,494 444,995,998 5.0 0 0 0.0
Tennessee 292,550,136 2,769,218,342 3.6 283,585,978 3,052,804,320 3.2 0 0 0.0
Texas 1,188,923,138 11,580,978,351 4.2 1,122,375,383 12,703,353,734 4.0 0 0 0.0
Utah 101,433,886 955,025,897 1.1 93,912,193 1,048,938,090 1.5 0 0 0.0
Vermont 27,765,585 264,210,411 -0.2 23,005,957 287,216,368 -0.4 0 0 0.0
Virginia 354,056,526 3,378,545,235 0.5 298,955,274 3,677,500,509 -0.3 0 0 0.0
Washington 241,020,168 2,365,546,816 2.6 228,323,403 2,593,870,219 2.5 0 0 0.0
West Virginia 36,524,342 621,739,735 -1.6 106,325,295 728,065,030 -0.9 0 0 0.0
Wisconsin 324,817,802 2,319,022,979 5.5 101,680,081 2,420,703,060 1.2 0 0 0.0
Wyoming 28,815,555 304,766,789 3.2 36,478,341 341,245,130 3.2 0 0 0.0
U.S. Totals (2) 12,320,856,355 118,274,193,929 3.1 11,529,667,250 ### 2.9 0 0 0.0
Puerto Rico 94,165,406 932,116,757 16.8 79,694,038 1,011,810,795 15.7 0 0 0.0
Grand Total (2) 12,415,021,761 119,206,310,686 3.2 11,609,361,288 ### 3 0 0 0.0
(1) Exports and dealer transfers are excluded where possible. Cumulative figures include revisions of data for prior months, Valoume indicates both gasoline and gasohol.
(2) Percent change is form comparable period of prior year and includes only States shown. Totals include only those States for which data are shown.
(3) FHWA estimates are in bold fonts. Upon receipt of the State's actual gallons the state data will automatically be updated upon the next iteration of the report.
Percent Change
Percent Change
Percent Change

Monthly Gasoline/Gasohol Reported by States 2014 (1)TABLE MF-33GA
Created On: 04/05/2016 2014 Reporting Period
State January (2) February (2) March (2) April (2) May (2) June (2) July (2) August (2) September (2) October (2) November (2) December (2) TotalAlabama 210,057,936 201,149,422 192,148,377 217,934,404 218,630,825 228,440,716 218,802,000 232,087,376 224,816,390 213,651,452 230,040,196 203,990,558 2,591,749,652Alaska 20,518,234 20,398,555 22,469,653 21,912,963 25,720,584 26,372,270 30,934,435 28,739,058 25,433,182 23,957,034 20,670,188 21,596,734 288,722,890Arizona 215,786,815 209,686,292 237,658,888 230,198,384 228,566,214 215,495,892 225,352,330 226,866,147 216,733,042 229,123,038 221,492,362 232,190,846 2,689,150,250Arkansas 114,043,746 104,175,101 119,163,754 120,287,983 126,881,797 121,761,092 127,532,705 126,544,394 117,755,166 124,574,174 118,803,233 122,890,060 1,444,413,205California 1,175,169,085 1,109,843,063 1,247,378,686 1,211,499,862 1,274,631,998 1,221,370,550 1,252,074,748 1,285,849,581 1,223,680,080 1,272,073,682 1,195,259,566 1,249,037,439 14,717,868,340Colorado 176,149,325 162,035,587 181,769,307 177,311,646 189,209,316 189,200,496 200,993,477 204,060,295 187,636,047 193,208,782 176,533,889 181,853,116 2,219,961,283Connecticut 114,212,331 103,221,193 120,104,088 117,228,438 125,944,042 122,249,671 124,182,525 123,912,091 117,068,068 125,040,248 119,173,275 122,530,908 1,434,866,878Delaware 33,510,544 32,002,844 36,208,384 37,531,479 39,606,107 26,081,643 41,036,730 34,852,538 45,359,914 35,012,372 42,024,282 39,171,834 442,398,671DC 9,015,628 8,988,399 11,072,475 9,525,102 9,637,924 10,121,403 9,591,499 9,102,295 9,182,039 8,881,558 8,265,510 9,324,910 112,708,742Florida 701,697,167 697,655,170 659,815,810 751,528,547 718,462,526 734,110,947 684,549,177 698,822,731 717,642,523 673,494,920 705,127,696 691,958,908 8,434,866,122Georgia 364,913,486 340,113,206 424,255,356 392,648,224 416,672,930 391,770,408 401,817,102 409,678,793 376,905,249 397,329,127 377,452,069 393,878,108 4,687,434,058Hawaii 39,226,954 32,822,975 40,939,645 38,045,111 39,286,332 33,741,963 39,261,529 39,664,016 38,122,601 39,259,859 36,576,946 38,696,882 455,644,813Idaho 55,187,532 59,876,404 56,403,711 50,359,192 53,580,003 58,985,313 63,637,408 63,420,985 73,193,850 69,500,843 57,365,792 63,915,882 725,426,915Illinois 365,561,952 317,718,567 368,194,377 401,954,229 447,406,567 394,789,099 388,974,869 335,633,062 412,486,592 407,054,074 399,081,681 421,991,408 4,660,846,477Indiana 226,887,616 221,037,985 248,606,290 249,458,330 268,304,226 262,414,928 271,607,173 268,399,613 255,951,240 265,021,034 253,064,886 262,847,764 3,053,601,085Iowa 127,600,420 116,464,122 133,924,338 136,186,845 155,620,818 144,850,587 149,132,209 147,126,483 138,016,979 145,217,788 137,880,906 145,570,154 1,677,591,649Kansas 105,076,460 94,996,634 107,492,171 109,292,204 117,953,223 112,980,985 115,312,095 114,933,800 108,592,509 112,444,532 108,546,437 113,523,340 1,321,144,390Kentucky 163,210,141 152,512,214 172,602,220 177,107,289 187,778,856 181,722,825 184,425,272 185,146,711 174,051,515 182,676,120 174,597,073 180,634,979 2,116,465,215Louisiana 181,850,683 169,561,382 188,180,479 194,070,114 202,305,267 168,624,358 199,640,690 202,089,193 182,760,644 203,921,395 187,835,485 198,161,610 2,279,001,300Maine 63,868,680 60,982,275 61,422,572 61,427,874 35,055,921 91,544,870 68,224,640 79,148,564 77,964,698 68,165,820 56,471,162 77,569,481 801,846,557Maryland 221,393,729 198,475,518 219,026,297 226,486,165 239,673,825 245,816,119 243,883,650 233,518,798 230,856,214 216,698,356 222,466,284 256,091,415 2,754,386,370Massachusetts 218,641,933 200,058,369 225,611,281 220,225,165 238,360,155 235,135,203 239,297,763 242,812,423 227,343,974 234,863,767 227,990,140 212,853,515 2,723,193,688Michigan 352,876,911 352,771,199 368,720,214 356,530,829 414,052,927 397,423,942 407,420,468 419,401,086 377,697,884 403,801,756 363,311,678 405,484,286 4,619,493,180Minnesota 203,383,755 189,541,775 199,190,222 195,164,012 225,432,809 221,707,652 233,844,128 232,467,234 208,575,553 222,236,892 213,185,939 215,638,807 2,560,368,778Mississippi 124,852,886 125,707,449 143,266,614 137,351,113 157,146,585 146,053,933 148,156,082 148,447,418 132,516,637 148,830,279 136,605,474 149,632,955 1,698,567,425Missouri 242,453,854 222,334,130 252,216,664 259,595,190 276,378,417 264,868,957 275,644,842 271,323,731 256,696,538 277,969,934 263,920,202 261,542,373 3,124,944,832Montana 36,386,507 35,010,182 37,926,009 40,164,936 45,102,582 46,863,455 55,046,626 52,938,515 44,704,819 44,204,797 40,252,754 40,014,873 518,616,055Nebraska 67,844,250 65,498,512 85,151,671 71,195,668 76,813,956 75,355,640 81,614,333 76,135,855 71,430,076 73,901,561 70,429,294 74,734,267 890,105,083Nevada 87,444,385 81,419,748 93,503,342 91,716,672 95,144,224 94,330,357 98,098,006 98,958,710 92,112,536 95,610,699 89,012,604 93,532,615 1,110,883,898New Hampshire 56,495,331 53,050,529 57,724,442 55,237,326 59,970,318 61,197,096 64,732,962 64,106,138 58,671,939 61,421,573 57,608,571 58,793,868 709,010,093New Jersey 318,208,481 290,732,348 339,912,396 340,043,246 356,989,234 354,252,445 365,969,059 361,600,806 337,078,324 350,414,458 336,484,915 350,834,316 4,102,520,028New Mexico 83,092,354 73,778,492 104,141,747 60,202,419 77,147,091 83,023,636 82,681,690 83,943,270 76,865,475 76,983,934 81,396,402 78,569,342 961,825,852New York 466,795,198 384,966,709 475,044,535 443,711,929 457,160,042 463,874,800 501,751,009 531,630,859 443,032,114 444,930,618 458,049,907 490,120,856 5,561,068,576North Carolina 334,540,291 314,415,222 360,433,613 369,867,647 384,403,936 375,237,823 381,856,027 380,542,778 362,478,021 388,081,020 360,258,335 372,777,758 4,384,892,471North Dakota 34,360,111 35,931,742 34,474,665 37,842,704 41,113,858 40,512,357 44,232,333 41,637,535 41,176,262 37,460,824 43,530,262 41,815,022 474,087,675Ohio 384,683,686 366,725,044 405,271,016 406,445,057 439,661,611 428,417,618 446,823,881 439,442,679 415,590,382 442,084,363 407,902,804 430,455,607 5,013,503,748Oklahoma 128,730,579 159,677,598 155,952,100 166,310,992 143,966,464 181,881,345 171,695,698 135,239,438 212,667,961 133,512,028 222,040,417 184,180,990 1,995,855,610Oregon 114,563,840 102,476,790 121,732,724 122,824,499 128,803,089 129,112,900 141,039,752 140,084,408 127,562,145 123,471,473 115,619,757 131,978,334 1,499,269,711Pennsylvania 385,326,611 357,873,698 405,334,835 408,510,455 433,436,531 422,364,915 433,320,359 434,039,190 407,342,054 439,732,976 416,550,528 430,766,565 4,974,598,717Rhode Island 29,669,992 27,949,343 30,836,438 30,265,416 36,237,947 31,161,560 33,196,474 31,987,597 30,321,967 31,572,960 30,680,302 32,341,425 376,221,421South Carolina 203,982,483 187,523,777 228,783,178 211,657,889 249,140,883 239,840,853 237,460,530 233,580,106 211,366,865 225,761,710 226,484,978 230,345,913 2,685,929,165South Dakota 38,555,760 32,918,223 31,732,292 35,186,535 35,004,466 41,272,096 41,686,448 48,226,396 43,192,928 39,848,307 36,279,991 38,976,582 462,880,024Tennessee 248,546,465 237,578,435 244,550,782 284,462,634 293,396,279 282,973,825 274,921,193 277,188,757 268,092,141 260,806,618 285,051,825 273,582,593 3,231,151,547Texas 1,056,309,303 1,002,150,702 1,126,342,595 1,112,890,053 1,153,155,521 1,106,754,352 1,136,642,527 1,159,164,569 1,087,372,762 1,168,578,067 1,103,662,188 1,149,209,132 13,362,231,771Utah 87,963,567 80,569,474 92,725,960 91,451,690 97,105,309 95,762,211 101,390,924 101,309,464 98,348,774 98,070,307 88,318,058 92,584,473 1,125,600,211Vermont 25,639,766 23,740,196 25,738,229 23,704,319 26,566,713 28,321,712 28,321,712 29,378,350 26,467,343 26,798,494 23,777,460 26,598,228 315,052,522Virginia 348,172,447 232,553,840 452,892,932 233,761,380 224,594,268 440,321,064 426,842,684 273,866,349 338,096,836 389,843,854 328,197,628 331,326,830 4,020,470,112Washington 217,278,711 198,546,118 227,075,475 227,932,561 233,304,201 234,362,763 249,355,660 251,122,590 230,124,250 236,987,598 224,911,838 220,600,834 2,751,602,599West Virginia 56,108,298 63,210,661 59,495,140 31,633,020 109,331,468 69,335,106 38,179,971 109,289,789 60,418,766 35,085,823 102,235,861 84,486,301 818,810,204Wisconsin 187,155,272 168,364,390 194,938,330 170,023,914 203,108,298 375,366,485 233,768,252 231,465,556 212,971,393 220,116,718 195,843,971 224,054,810 2,617,177,389Wyoming 22,195,520 28,229,933 23,818,854 27,016,114 23,983,803 34,064,333 26,259,327 29,353,577 49,061,308 31,401,009 35,313,012 22,903,991 353,600,781US Total 10,847,197,011 10,109,021,536 11,453,375,173 11,194,919,769 11,856,942,286 11,983,596,569 12,042,216,983 11,980,281,697 11,503,586,569 11,770,690,625 11,433,636,013 11,778,163,797 137,953,628,028Puerto Rico 82,036,182 87,599,835 79,480,932 83,321,568 59,331,764 86,098,278 75,755,726 81,082,769 72,813,879 90,456,682 76,628,883 76,172,089 950,778,587Grand Total 10,929,233,193 10,196,621,371 11,532,856,105 11,278,241,337 11,916,274,050 12,069,694,847 12,117,972,709 12,061,364,466 11,576,400,448 11,861,147,307 11,510,264,896 11,854,335,886 138,904,406,615
(1) This table shows gross volume of gasoline and gasohol reported by wholesale distributors in each State. The data are taken from State taxation reports and may refelct time lags of 6 weeks or more between the
wholesale and retail levels. The data indude highway use, non-highway use, and losses.
(2) FHWA estimates are in bold fonts. Upon receipt of the State's actual gallons, the State data will automatically be updated upon the next iteration of this report. See the Notice on page 2.

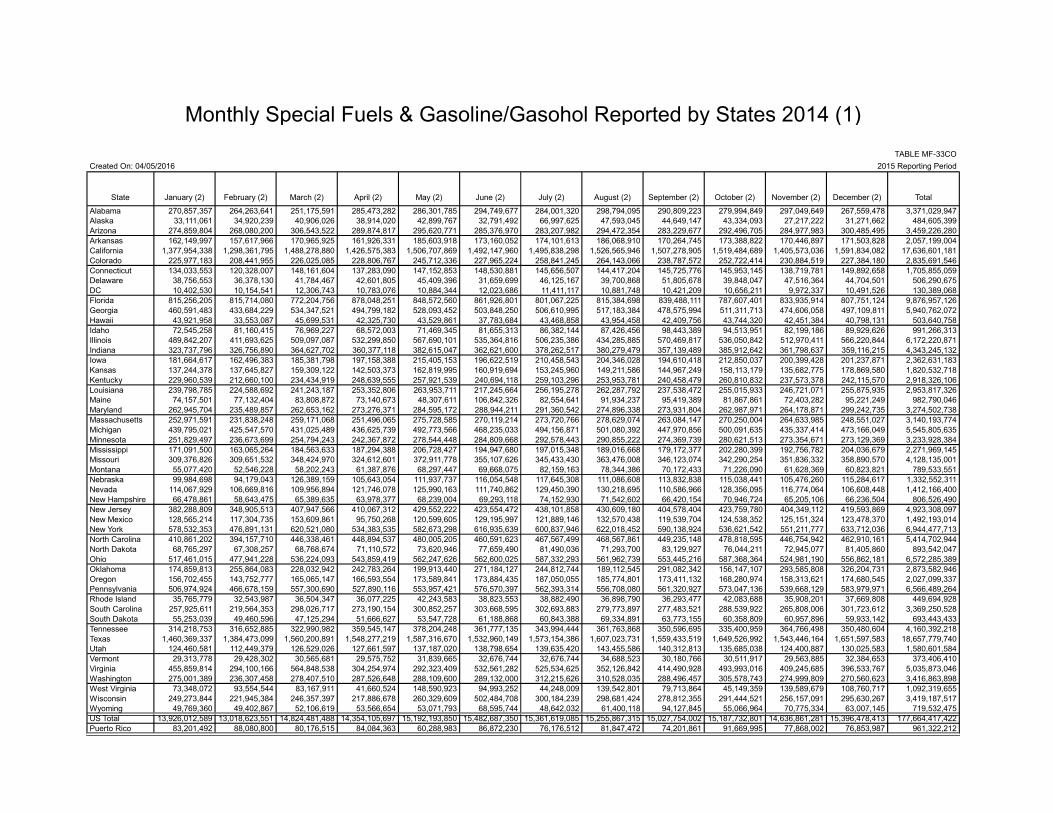
Monthly Special Fuels & Gasoline/Gasohol Reported by States 2014 (1)
TABLE MF-33CO
Created On: 04/05/2016 2015 Reporting Period
State January (2) February (2) March (2) April (2) May (2) June (2) July (2) August (2) September (2) October (2) November (2) December (2) Total
Alabama 270,857,357 264,263,641 251,175,591 285,473,282 286,301,785 294,749,677 284,001,320 298,794,095 290,809,223 279,994,849 297,049,649 267,559,478 3,371,029,947Alaska 33,111,061 34,920,239 40,906,026 38,914,020 42,899,767 32,791,492 66,997,625 47,593,045 44,649,147 43,334,093 27,217,222 31,271,662 484,605,399Arizona 274,859,804 268,080,200 306,543,522 289,874,817 295,620,771 285,376,970 283,207,982 294,472,354 283,229,677 292,496,705 284,977,983 300,485,495 3,459,226,280Arkansas 162,149,997 157,617,966 170,965,925 161,926,331 185,603,918 173,160,052 174,101,613 186,068,910 170,264,745 173,388,822 170,446,897 171,503,828 2,057,199,004California 1,377,954,338 1,298,361,795 1,488,278,880 1,426,575,383 1,506,707,869 1,492,147,960 1,495,838,298 1,526,565,946 1,507,278,905 1,519,484,689 1,405,573,036 1,591,834,082 17,636,601,181Colorado 225,977,183 208,441,955 226,025,085 228,806,767 245,712,336 227,965,224 258,841,245 264,143,066 238,787,572 252,722,414 230,884,519 227,384,180 2,835,691,546Connecticut 134,033,553 120,328,007 148,161,604 137,283,090 147,152,853 148,530,881 145,656,507 144,417,204 145,725,776 145,953,145 138,719,781 149,892,658 1,705,855,059Delaware 38,756,553 36,378,130 41,784,467 42,601,805 45,409,396 31,659,699 46,125,167 39,700,868 51,805,678 39,848,047 47,516,364 44,704,501 506,290,675DC 10,402,530 10,154,541 12,306,743 10,783,076 10,884,344 12,023,686 11,411,117 10,881,748 10,421,209 10,656,211 9,972,337 10,491,526 130,389,068Florida 815,256,205 815,714,080 772,204,756 878,048,251 848,572,560 861,926,801 801,067,225 815,384,698 839,488,111 787,607,401 833,935,914 807,751,124 9,876,957,126Georgia 460,591,483 433,684,229 534,347,521 494,799,182 528,093,452 503,848,250 506,610,995 517,183,384 478,575,994 511,311,713 474,606,058 497,109,811 5,940,762,072Hawaii 43,921,958 33,553,087 45,699,531 42,325,730 43,529,861 37,783,684 43,468,858 43,954,458 42,409,756 43,744,320 42,451,384 40,798,131 503,640,758Idaho 72,545,258 81,160,415 76,969,227 68,572,003 71,469,345 81,655,313 86,382,144 87,426,456 98,443,389 94,513,951 82,199,186 89,929,626 991,266,313Illinois 489,842,207 411,693,625 509,097,087 532,299,850 567,690,101 535,364,816 506,235,386 434,285,885 570,469,817 536,050,842 512,970,411 566,220,844 6,172,220,871Indiana 323,737,796 326,756,890 364,627,702 360,377,118 382,615,047 362,621,600 378,262,517 380,279,479 357,139,489 385,912,642 361,798,637 359,116,215 4,343,245,132Iowa 181,664,617 162,496,383 185,381,798 197,158,388 215,405,153 196,622,519 210,458,543 204,346,028 194,610,418 212,850,037 200,399,428 201,237,871 2,362,631,183Kansas 137,244,378 137,645,827 159,309,122 142,503,373 162,819,995 160,919,694 153,245,960 149,211,586 144,967,249 158,113,179 135,682,775 178,869,580 1,820,532,718Kentucky 229,960,539 212,660,100 234,434,919 248,639,555 257,921,539 240,694,118 259,103,296 253,953,781 240,458,479 260,810,832 237,573,378 242,115,570 2,918,326,106Louisiana 239,798,785 224,588,692 241,243,187 253,352,806 263,953,711 217,245,664 256,195,278 262,287,792 237,538,472 255,015,933 246,721,071 255,875,935 2,953,817,326Maine 74,157,501 77,132,404 83,808,872 73,140,673 48,307,611 106,842,326 82,554,641 91,934,237 95,419,389 81,867,861 72,403,282 95,221,249 982,790,046Maryland 262,945,704 235,489,857 262,653,162 273,276,371 284,595,172 288,944,211 291,360,542 274,896,338 273,931,804 262,987,971 264,178,871 299,242,735 3,274,502,738Massachusetts 252,971,591 231,838,248 259,171,068 251,496,065 275,728,585 270,119,214 273,720,766 278,629,074 263,084,147 270,250,004 264,633,985 248,551,027 3,140,193,774Michigan 439,795,021 425,547,570 431,025,489 436,625,739 492,773,566 468,235,033 494,156,871 501,080,392 447,970,856 500,091,635 435,337,414 473,166,049 5,545,805,635Minnesota 251,829,497 236,673,699 254,794,243 242,367,872 278,544,448 284,809,668 292,578,443 290,855,222 274,369,739 280,621,513 273,354,671 273,129,369 3,233,928,384Mississippi 171,091,500 163,065,264 184,563,633 187,294,388 206,728,427 194,947,680 197,015,348 189,016,668 179,172,377 202,280,399 192,756,782 204,036,679 2,271,969,145Missouri 309,376,826 309,651,532 348,424,970 324,612,601 372,911,778 355,107,626 345,433,430 363,476,008 346,123,074 342,290,254 351,836,332 358,890,570 4,128,135,001Montana 55,077,420 52,546,228 58,202,243 61,387,876 68,297,447 69,668,075 82,159,163 78,344,386 70,172,433 71,226,090 61,628,369 60,823,821 789,533,551Nebraska 99,984,698 94,179,043 126,389,159 105,643,054 111,937,737 116,054,548 117,645,308 111,086,608 113,832,838 115,038,441 105,476,260 115,284,617 1,332,552,311Nevada 114,067,929 106,669,816 109,956,894 121,746,078 125,990,163 111,740,862 129,450,390 130,218,695 110,586,966 128,356,095 116,774,064 106,608,448 1,412,166,400New Hampshire 66,478,861 58,643,475 65,389,635 63,978,377 68,239,004 69,293,118 74,152,930 71,542,602 66,420,154 70,946,724 65,205,106 66,236,504 806,526,490New Jersey 382,288,809 348,905,513 407,947,566 410,067,312 429,552,222 423,554,472 438,101,858 430,609,180 404,578,404 423,759,780 404,349,112 419,593,869 4,923,308,097New Mexico 128,565,214 117,304,735 153,609,861 95,750,268 120,599,605 129,195,997 121,889,146 132,570,438 119,539,704 124,538,352 125,151,324 123,478,370 1,492,193,014New York 578,532,353 476,891,131 620,521,080 534,383,535 582,673,298 616,935,639 600,837,946 622,018,452 590,138,924 536,621,542 551,211,777 633,712,036 6,944,477,713North Carolina 410,861,202 394,157,710 446,338,461 448,894,537 480,005,205 460,591,623 467,567,499 468,567,861 449,235,148 478,818,595 446,754,942 462,910,161 5,414,702,944North Dakota 68,765,297 67,308,257 68,768,674 71,110,572 73,620,946 77,659,490 81,490,036 71,293,700 83,129,927 76,044,211 72,945,077 81,405,860 893,542,047Ohio 517,461,015 477,941,228 536,224,093 543,859,419 562,247,626 562,600,025 587,332,293 561,962,739 553,445,216 587,368,364 524,981,190 556,862,181 6,572,285,389Oklahoma 174,859,813 255,864,083 228,032,942 242,783,264 199,913,440 271,184,127 244,812,744 189,112,545 291,082,342 156,147,107 293,585,808 326,204,731 2,873,582,946Oregon 156,702,455 143,752,777 165,065,147 166,593,554 173,589,841 173,884,435 187,050,055 185,774,801 173,411,132 168,280,974 158,313,621 174,680,545 2,027,099,337Pennsylvania 506,974,924 466,678,159 557,300,690 527,890,116 553,957,421 576,570,397 562,393,314 556,708,080 561,320,927 573,047,136 539,668,129 583,979,971 6,566,489,264Rhode Island 35,765,779 32,543,987 36,504,347 36,077,225 42,243,583 38,823,553 38,882,490 36,898,790 36,293,477 42,083,688 35,908,201 37,669,808 449,694,928South Carolina 257,925,611 219,564,353 298,026,717 273,190,154 300,852,257 303,668,595 302,693,883 279,773,897 277,483,521 288,539,922 265,808,006 301,723,612 3,369,250,528South Dakota 55,253,039 49,460,596 47,125,294 51,666,627 53,547,728 61,188,868 60,843,388 69,334,891 63,773,155 60,358,809 60,957,896 59,933,142 693,443,433Tennessee 314,218,753 316,652,885 322,990,982 359,545,147 378,204,248 361,777,135 343,994,444 361,763,868 350,596,695 335,400,959 364,766,498 350,480,604 4,160,392,218Texas 1,460,369,337 1,384,473,099 1,560,200,891 1,548,277,219 1,587,316,670 1,532,960,149 1,573,154,386 1,607,023,731 1,559,433,519 1,649,526,992 1,543,446,164 1,651,597,583 18,657,779,740Utah 124,460,581 112,449,379 126,529,026 127,661,597 137,187,020 138,798,654 139,635,420 143,455,586 140,312,813 135,685,038 124,400,887 130,025,583 1,580,601,584Vermont 29,313,778 29,428,302 30,565,681 29,575,752 31,839,665 32,676,744 32,676,744 34,688,523 30,180,766 30,511,917 29,563,885 32,384,653 373,406,410Virginia 455,859,814 294,100,166 564,848,538 304,254,974 292,323,409 532,561,282 525,534,625 352,126,842 414,490,928 493,993,016 409,245,685 396,533,767 5,035,873,046Washington 275,001,389 236,307,458 278,407,510 287,526,648 288,109,600 289,132,000 312,215,626 310,528,035 288,496,457 305,578,743 274,999,809 270,560,623 3,416,863,898West Virginia 73,348,072 93,554,544 83,167,911 41,660,524 148,590,923 94,993,252 44,248,009 139,542,801 79,713,864 45,149,359 139,589,679 108,760,717 1,092,319,655Wisconsin 249,273,844 221,945,384 246,357,397 217,886,678 260,329,609 502,484,708 300,184,239 298,681,424 278,812,355 291,444,521 256,157,091 295,630,267 3,419,187,517Wyoming 49,769,360 49,402,867 52,106,619 53,566,654 53,071,793 68,595,744 48,642,032 61,400,118 94,127,845 55,066,964 70,775,334 63,007,145 719,532,475US Total 13,926,012,589 13,018,623,551 14,824,481,488 14,354,105,697 15,192,193,850 15,482,687,350 15,361,619,085 15,255,867,315 15,027,754,002 15,187,732,801 14,636,861,281 15,396,478,413 177,664,417,422Puerto Rico 83,201,492 88,080,800 80,176,515 84,084,363 60,288,983 86,872,230 76,176,512 81,847,472 74,201,861 91,669,995 77,868,002 76,853,987 961,322,212
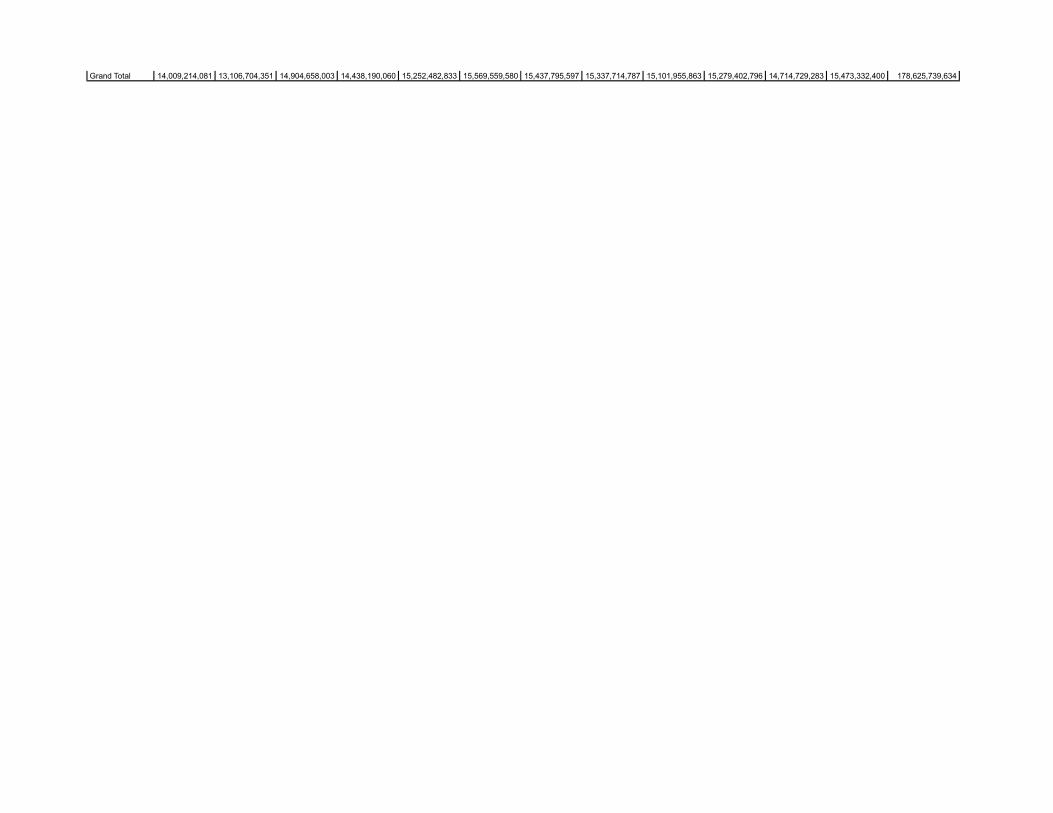
Grand Total 14,009,214,081 13,106,704,351 14,904,658,003 14,438,190,060 15,252,482,833 15,569,559,580 15,437,795,597 15,337,714,787 15,101,955,863 15,279,402,796 14,714,729,283 15,473,332,400 178,625,739,634
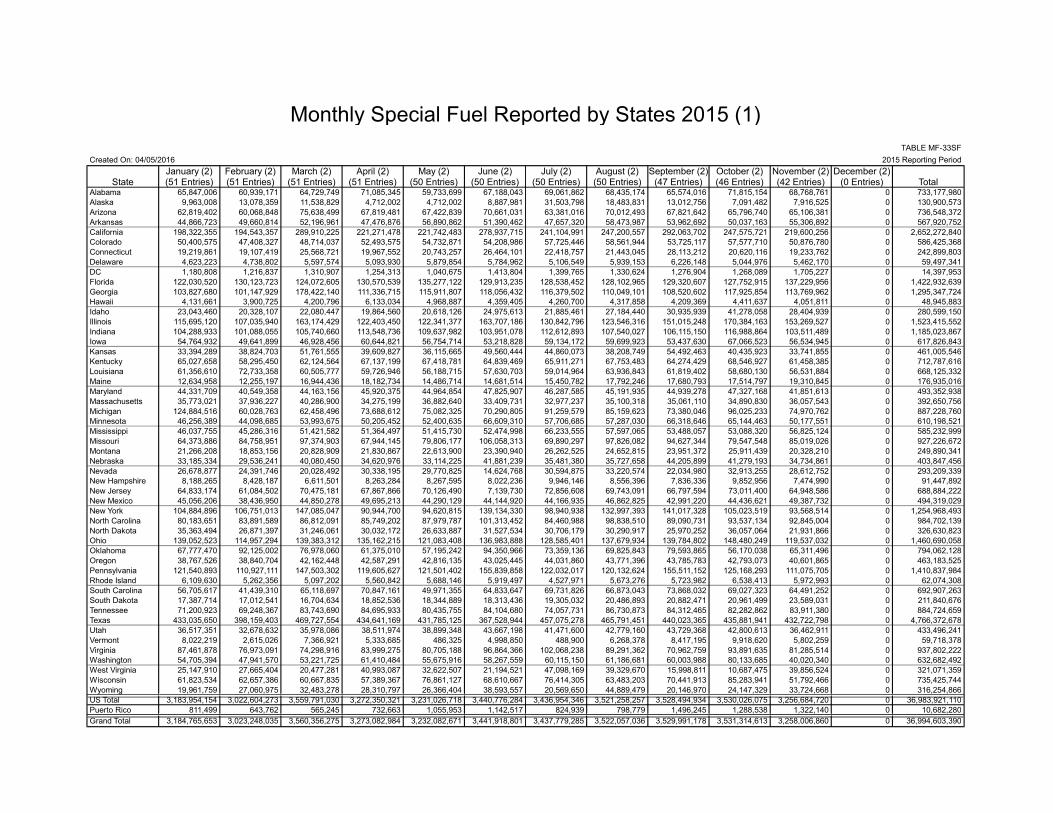
Monthly Special Fuel Reported by States 2015 (1)TABLE MF-33SF
Created On: 04/05/2016 2015 Reporting Period
January (2) February (2) March (2) April (2) May (2) June (2) July (2) August (2) September (2) October (2) November (2) December (2)State (51 Entries) (51 Entries) (51 Entries) (51 Entries) (50 Entries) (50 Entries) (50 Entries) (50 Entries) (47 Entries) (46 Entries) (42 Entries) (0 Entries) Total
Alabama 65,847,006 60,939,171 64,729,749 71,085,345 59,733,699 67,188,043 69,061,862 68,435,174 65,574,016 71,815,154 68,768,761 0 733,177,980Alaska 9,963,008 13,078,359 11,538,829 4,712,002 4,712,002 8,887,981 31,503,798 18,483,831 13,012,756 7,091,482 7,916,525 0 130,900,573Arizona 62,819,402 60,068,848 75,638,499 67,819,481 67,422,839 70,661,031 63,381,016 70,012,493 67,821,642 65,796,740 65,106,381 0 736,548,372Arkansas 44,866,723 49,660,814 52,196,961 47,476,876 56,890,862 51,390,462 47,657,320 58,473,987 53,962,692 50,037,163 55,306,892 0 567,920,752California 198,322,355 194,543,357 289,910,225 221,271,478 221,742,483 278,937,715 241,104,991 247,200,557 292,063,702 247,575,721 219,600,256 0 2,652,272,840Colorado 50,400,575 47,408,327 48,714,037 52,493,575 54,732,871 54,208,986 57,725,446 58,561,944 53,725,117 57,577,710 50,876,780 0 586,425,368Connecticut 19,219,861 19,107,419 25,568,721 19,967,552 20,743,257 26,464,101 22,418,757 21,443,045 28,113,212 20,620,116 19,233,762 0 242,899,803Delaware 4,623,223 4,738,802 5,597,574 5,093,930 5,879,854 5,784,962 5,106,549 5,939,153 6,226,148 5,044,976 5,462,170 0 59,497,341DC 1,180,808 1,216,837 1,310,907 1,254,313 1,040,675 1,413,804 1,399,765 1,330,624 1,276,904 1,268,089 1,705,227 0 14,397,953Florida 122,030,520 130,123,723 124,072,605 130,570,539 135,277,122 129,913,235 128,538,452 128,102,965 129,320,607 127,752,915 137,229,956 0 1,422,932,639Georgia 103,827,680 101,147,929 178,422,140 111,336,715 115,911,807 118,056,432 116,379,502 110,049,101 108,520,602 117,925,854 113,769,962 0 1,295,347,724Hawaii 4,131,661 3,900,725 4,200,796 6,133,034 4,968,887 4,359,405 4,260,700 4,317,858 4,209,369 4,411,637 4,051,811 0 48,945,883Idaho 23,043,460 20,328,107 22,080,447 19,864,560 20,618,126 24,975,613 21,885,461 27,184,440 30,935,939 41,278,058 28,404,939 0 280,599,150Illinois 115,695,120 107,035,940 163,174,429 122,403,450 122,341,377 163,707,186 130,842,796 123,546,316 151,015,248 170,384,163 153,269,527 0 1,523,415,552Indiana 104,288,933 101,088,055 105,740,660 113,548,736 109,637,982 103,951,078 112,612,893 107,540,027 106,115,150 116,988,864 103,511,489 0 1,185,023,867Iowa 54,764,932 49,641,899 46,928,456 60,644,821 56,754,714 53,218,828 59,134,172 59,699,923 53,437,630 67,066,523 56,534,945 0 617,826,843Kansas 33,394,289 38,824,703 51,761,555 39,609,827 36,115,665 49,560,444 44,860,073 38,208,749 54,492,463 40,435,923 33,741,855 0 461,005,546Kentucky 65,027,658 58,295,450 62,124,564 67,137,199 67,418,781 64,839,469 65,911,271 67,753,483 64,274,429 68,546,927 61,458,385 0 712,787,616Louisiana 61,356,610 72,733,358 60,505,777 59,726,946 56,188,715 57,630,703 59,014,964 63,936,843 61,819,402 58,680,130 56,531,884 0 668,125,332Maine 12,634,958 12,255,197 16,944,436 18,182,734 14,486,714 14,681,514 15,450,782 17,792,246 17,680,793 17,514,797 19,310,845 0 176,935,016Maryland 44,331,709 40,549,358 44,163,156 45,920,375 44,964,854 47,825,907 46,287,585 45,191,935 44,939,278 47,327,168 41,851,613 0 493,352,938Massachusetts 35,773,021 37,936,227 40,286,900 34,275,199 36,882,640 33,409,731 32,977,237 35,100,318 35,061,110 34,890,830 36,057,543 0 392,650,756Michigan 124,884,516 60,028,763 62,458,496 73,688,612 75,082,325 70,290,805 91,259,579 85,159,623 73,380,046 96,025,233 74,970,762 0 887,228,760Minnesota 46,256,389 44,098,685 53,993,675 50,205,452 52,400,635 66,609,310 57,706,685 57,287,030 66,318,646 65,144,463 50,177,551 0 610,198,521Mississippi 46,037,755 45,286,316 51,421,582 51,364,497 51,415,730 52,474,998 66,233,555 57,597,065 53,488,057 53,088,320 56,825,124 0 585,232,999Missouri 64,373,886 84,758,951 97,374,903 67,944,145 79,806,177 106,058,313 69,890,297 97,826,082 94,627,344 79,547,548 85,019,026 0 927,226,672Montana 21,266,208 18,853,156 20,828,909 21,830,867 22,613,900 23,390,940 26,262,525 24,652,815 23,951,372 25,911,439 20,328,210 0 249,890,341Nebraska 33,185,334 29,536,241 40,080,450 34,620,976 33,114,225 41,881,239 35,481,380 35,727,658 44,205,899 41,279,193 34,734,861 0 403,847,456Nevada 26,678,877 24,391,746 20,028,492 30,338,195 29,770,825 14,624,768 30,594,875 33,220,574 22,034,980 32,913,255 28,612,752 0 293,209,339New Hampshire 8,188,265 8,428,187 6,611,501 8,263,284 8,267,595 8,022,236 9,946,146 8,556,396 7,836,336 9,852,956 7,474,990 0 91,447,892New Jersey 64,833,174 61,084,502 70,475,181 67,867,866 70,126,490 7,139,730 72,856,608 69,743,091 66,797,594 73,011,400 64,948,586 0 688,884,222New Mexico 45,056,206 38,436,950 44,850,278 49,695,213 44,290,129 44,144,920 44,166,935 46,862,825 42,991,220 44,436,621 49,387,732 0 494,319,029New York 104,884,896 106,751,013 147,085,047 90,944,700 94,620,815 139,134,330 98,940,938 132,997,393 141,017,328 105,023,519 93,568,514 0 1,254,968,493North Carolina 80,183,651 83,891,589 86,812,091 85,749,202 87,979,787 101,313,452 84,460,988 98,838,510 89,090,731 93,537,134 92,845,004 0 984,702,139North Dakota 35,363,494 26,871,397 31,246,061 30,032,172 26,633,887 31,527,534 30,706,179 30,290,917 25,970,252 36,057,064 21,931,866 0 326,630,823Ohio 139,052,523 114,957,294 139,383,312 135,162,215 121,083,408 136,983,888 128,585,401 137,679,934 139,784,802 148,480,249 119,537,032 0 1,460,690,058Oklahoma 67,777,470 92,125,002 76,978,060 61,375,010 57,195,242 94,350,966 73,359,136 69,825,843 79,593,865 56,170,038 65,311,496 0 794,062,128Oregon 38,767,526 38,840,704 42,162,448 42,587,291 42,816,135 43,025,445 44,031,860 43,771,396 43,785,783 42,793,073 40,601,865 0 463,183,525Pennsylvania 121,540,893 110,927,111 147,503,302 119,605,627 121,501,402 155,839,858 122,032,017 120,132,624 155,511,152 125,168,293 111,075,705 0 1,410,837,984Rhode Island 6,109,630 5,262,356 5,097,202 5,560,842 5,688,146 5,919,497 4,527,971 5,673,276 5,723,982 6,538,413 5,972,993 0 62,074,308South Carolina 56,705,617 41,439,310 65,118,697 70,847,161 49,971,355 64,833,647 69,731,826 66,873,043 73,868,032 69,027,323 64,491,252 0 692,907,263South Dakota 17,387,714 17,012,541 16,704,634 18,852,536 18,344,889 18,313,436 19,305,032 20,486,893 20,882,471 20,961,499 23,589,031 0 211,840,676Tennessee 71,200,923 69,248,367 83,743,690 84,695,933 80,435,755 84,104,680 74,057,731 86,730,873 84,312,465 82,282,862 83,911,380 0 884,724,659Texas 433,035,650 398,159,403 469,727,554 434,641,169 431,785,125 367,528,944 457,075,278 465,791,451 440,023,365 435,881,941 432,722,798 0 4,766,372,678Utah 36,517,351 32,678,632 35,978,086 38,511,974 38,899,348 43,667,198 41,471,600 42,779,160 43,729,368 42,800,613 36,462,911 0 433,496,241Vermont 8,022,219 2,615,026 7,366,921 5,333,685 486,325 4,998,850 488,900 6,268,378 8,417,195 9,918,620 5,802,259 0 59,718,378Virginia 87,461,878 76,973,091 74,298,916 83,999,275 80,705,188 96,864,366 102,068,238 89,291,362 70,962,759 93,891,635 81,285,514 0 937,802,222Washington 54,705,394 47,941,570 53,221,725 61,410,484 55,675,916 58,267,559 60,115,150 61,186,681 60,003,988 80,133,685 40,020,340 0 632,682,492West Virginia 25,147,910 27,665,404 20,477,281 40,993,087 32,622,507 21,194,521 47,098,169 39,329,670 15,998,811 10,687,475 39,856,524 0 321,071,359Wisconsin 61,823,534 62,657,386 60,667,835 57,389,367 76,861,127 68,610,667 76,414,305 63,483,203 70,441,913 85,283,941 51,792,466 0 735,425,744Wyoming 19,961,759 27,060,975 32,483,278 28,310,797 26,366,404 38,593,557 20,569,650 44,889,479 20,146,970 24,147,329 33,724,668 0 316,254,866US Total 3,183,954,154 3,022,604,273 3,559,791,030 3,272,350,321 3,231,026,718 3,440,776,284 3,436,954,346 3,521,258,257 3,528,494,934 3,530,026,075 3,256,684,720 0 36,983,921,110Puerto Rico 811,499 643,762 565,245 732,663 1,055,953 1,142,517 824,939 798,779 1,496,245 1,288,538 1,322,140 0 10,682,280Grand Total 3,184,765,653 3,023,248,035 3,560,356,275 3,273,082,984 3,232,082,671 3,441,918,801 3,437,779,285 3,522,057,036 3,529,991,178 3,531,314,613 3,258,006,860 0 36,994,603,390
(1) This table shows gross volume of special fuels (diesel and alternative fuels) reported by the State motor fuel tax agencies. (2) FHWA estimates are shown in bold fonts. Upon receipt of the State's actual gallons, the State data will
Where possible, fuel consumed by all levels and all non-highway use has been excluded. Further adjustments may be automatically be updated upon the next iteration of this report. See Notice on page 2.
made during the year end analysis. Most data reflect retail sales , but a number of States tax special fuels at the wholesale level.
When interstate motor carrier fuel volume is reported quarterly to FHWA, the volume is shown in the third month of the quarter.
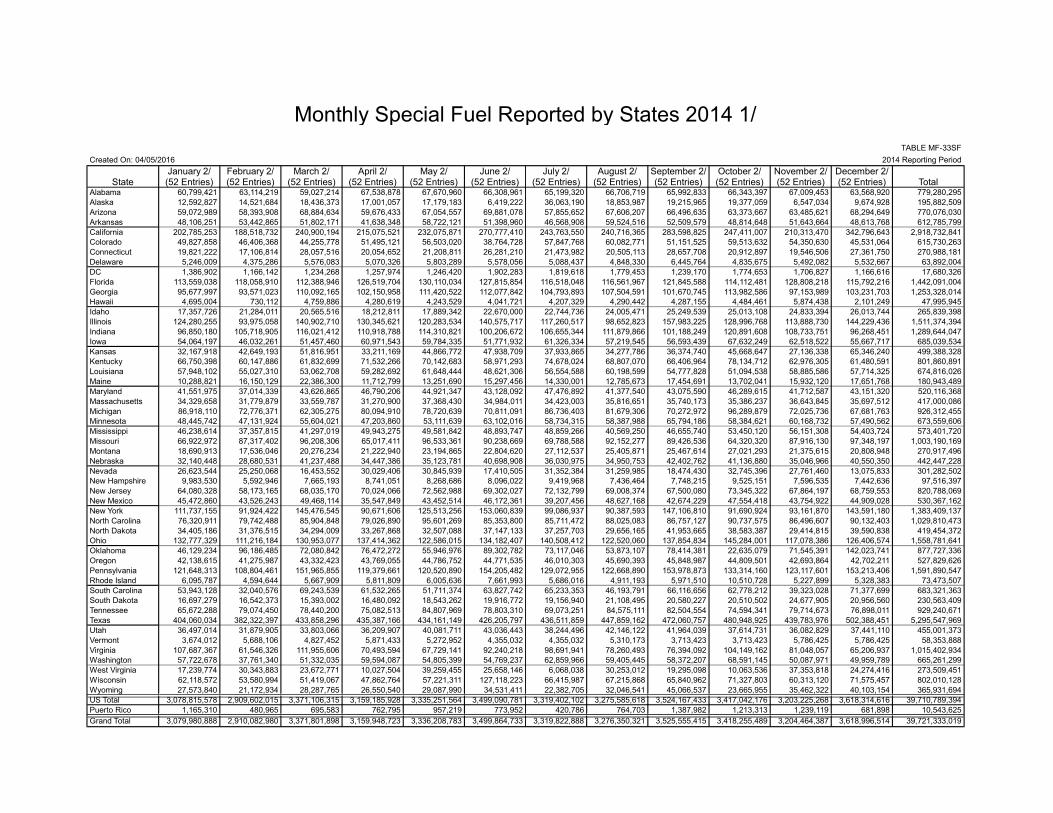
Monthly Special Fuel Reported by States 2014 1/TABLE MF-33SF
Created On: 04/05/2016 2014 Reporting Period
January 2/ February 2/ March 2/ April 2/ May 2/ June 2/ July 2/ August 2/ September 2/ October 2/ November 2/ December 2/State (52 Entries) (52 Entries) (52 Entries) (52 Entries) (52 Entries) (52 Entries) (52 Entries) (52 Entries) (52 Entries) (52 Entries) (52 Entries) (52 Entries) Total
Alabama 60,799,421 63,114,219 59,027,214 67,538,878 67,670,960 66,308,961 65,199,320 66,706,719 65,992,833 66,343,397 67,009,453 63,568,920 779,280,295Alaska 12,592,827 14,521,684 18,436,373 17,001,057 17,179,183 6,419,222 36,063,190 18,853,987 19,215,965 19,377,059 6,547,034 9,674,928 195,882,509Arizona 59,072,989 58,393,908 68,884,634 59,676,433 67,054,557 69,881,078 57,855,652 67,606,207 66,496,635 63,373,667 63,485,621 68,294,649 770,076,030Arkansas 48,106,251 53,442,865 51,802,171 41,638,348 58,722,121 51,398,960 46,568,908 59,524,516 52,509,579 48,814,648 51,643,664 48,613,768 612,785,799California 202,785,253 188,518,732 240,900,194 215,075,521 232,075,871 270,777,410 243,763,550 240,716,365 283,598,825 247,411,007 210,313,470 342,796,643 2,918,732,841Colorado 49,827,858 46,406,368 44,255,778 51,495,121 56,503,020 38,764,728 57,847,768 60,082,771 51,151,525 59,513,632 54,350,630 45,531,064 615,730,263Connecticut 19,821,222 17,106,814 28,057,516 20,054,652 21,208,811 26,281,210 21,473,982 20,505,113 28,657,708 20,912,897 19,546,506 27,361,750 270,988,181Delaware 5,246,009 4,375,286 5,576,083 5,070,326 5,803,289 5,578,056 5,088,437 4,848,330 6,445,764 4,835,675 5,492,082 5,532,667 63,892,004DC 1,386,902 1,166,142 1,234,268 1,257,974 1,246,420 1,902,283 1,819,618 1,779,453 1,239,170 1,774,653 1,706,827 1,166,616 17,680,326Florida 113,559,038 118,058,910 112,388,946 126,519,704 130,110,034 127,815,854 116,518,048 116,561,967 121,845,588 114,112,481 128,808,218 115,792,216 1,442,091,004Georgia 95,677,997 93,571,023 110,092,165 102,150,958 111,420,522 112,077,842 104,793,893 107,504,591 101,670,745 113,982,586 97,153,989 103,231,703 1,253,328,014Hawaii 4,695,004 730,112 4,759,886 4,280,619 4,243,529 4,041,721 4,207,329 4,290,442 4,287,155 4,484,461 5,874,438 2,101,249 47,995,945Idaho 17,357,726 21,284,011 20,565,516 18,212,811 17,889,342 22,670,000 22,744,736 24,005,471 25,249,539 25,013,108 24,833,394 26,013,744 265,839,398Illinois 124,280,255 93,975,058 140,902,710 130,345,621 120,283,534 140,575,717 117,260,517 98,652,823 157,983,225 128,996,768 113,888,730 144,229,436 1,511,374,394Indiana 96,850,180 105,718,905 116,021,412 110,918,788 114,310,821 100,206,672 106,655,344 111,879,866 101,188,249 120,891,608 108,733,751 96,268,451 1,289,644,047Iowa 54,064,197 46,032,261 51,457,460 60,971,543 59,784,335 51,771,932 61,326,334 57,219,545 56,593,439 67,632,249 62,518,522 55,667,717 685,039,534Kansas 32,167,918 42,649,193 51,816,951 33,211,169 44,866,772 47,938,709 37,933,865 34,277,786 36,374,740 45,668,647 27,136,338 65,346,240 499,388,328Kentucky 66,750,398 60,147,886 61,832,699 71,532,266 70,142,683 58,971,293 74,678,024 68,807,070 66,406,964 78,134,712 62,976,305 61,480,591 801,860,891Louisiana 57,948,102 55,027,310 53,062,708 59,282,692 61,648,444 48,621,306 56,554,588 60,198,599 54,777,828 51,094,538 58,885,586 57,714,325 674,816,026Maine 10,288,821 16,150,129 22,386,300 11,712,799 13,251,690 15,297,456 14,330,001 12,785,673 17,454,691 13,702,041 15,932,120 17,651,768 180,943,489Maryland 41,551,975 37,014,339 43,626,865 46,790,206 44,921,347 43,128,092 47,476,892 41,377,540 43,075,590 46,289,615 41,712,587 43,151,320 520,116,368Massachusetts 34,329,658 31,779,879 33,559,787 31,270,900 37,368,430 34,984,011 34,423,003 35,816,651 35,740,173 35,386,237 36,643,845 35,697,512 417,000,086Michigan 86,918,110 72,776,371 62,305,275 80,094,910 78,720,639 70,811,091 86,736,403 81,679,306 70,272,972 96,289,879 72,025,736 67,681,763 926,312,455Minnesota 48,445,742 47,131,924 55,604,021 47,203,860 53,111,639 63,102,016 58,734,315 58,387,988 65,794,186 58,384,621 60,168,732 57,490,562 673,559,606Mississippi 46,238,614 37,357,815 41,297,019 49,943,275 49,581,842 48,893,747 48,859,266 40,569,250 46,655,740 53,450,120 56,151,308 54,403,724 573,401,720Missouri 66,922,972 87,317,402 96,208,306 65,017,411 96,533,361 90,238,669 69,788,588 92,152,277 89,426,536 64,320,320 87,916,130 97,348,197 1,003,190,169Montana 18,690,913 17,536,046 20,276,234 21,222,940 23,194,865 22,804,620 27,112,537 25,405,871 25,467,614 27,021,293 21,375,615 20,808,948 270,917,496Nebraska 32,140,448 28,680,531 41,237,488 34,447,386 35,123,781 40,698,908 36,030,975 34,950,753 42,402,762 41,136,880 35,046,966 40,550,350 442,447,228Nevada 26,623,544 25,250,068 16,453,552 30,029,406 30,845,939 17,410,505 31,352,384 31,259,985 18,474,430 32,745,396 27,761,460 13,075,833 301,282,502New Hampshire 9,983,530 5,592,946 7,665,193 8,741,051 8,268,686 8,096,022 9,419,968 7,436,464 7,748,215 9,525,151 7,596,535 7,442,636 97,516,397New Jersey 64,080,328 58,173,165 68,035,170 70,024,066 72,562,988 69,302,027 72,132,799 69,008,374 67,500,080 73,345,322 67,864,197 68,759,553 820,788,069New Mexico 45,472,860 43,526,243 49,468,114 35,547,849 43,452,514 46,172,361 39,207,456 48,627,168 42,674,229 47,554,418 43,754,922 44,909,028 530,367,162New York 111,737,155 91,924,422 145,476,545 90,671,606 125,513,256 153,060,839 99,086,937 90,387,593 147,106,810 91,690,924 93,161,870 143,591,180 1,383,409,137North Carolina 76,320,911 79,742,488 85,904,848 79,026,890 95,601,269 85,353,800 85,711,472 88,025,083 86,757,127 90,737,575 86,496,607 90,132,403 1,029,810,473North Dakota 34,405,186 31,376,515 34,294,009 33,267,868 32,507,088 37,147,133 37,257,703 29,656,165 41,953,665 38,583,387 29,414,815 39,590,838 419,454,372Ohio 132,777,329 111,216,184 130,953,077 137,414,362 122,586,015 134,182,407 140,508,412 122,520,060 137,854,834 145,284,001 117,078,386 126,406,574 1,558,781,641Oklahoma 46,129,234 96,186,485 72,080,842 76,472,272 55,946,976 89,302,782 73,117,046 53,873,107 78,414,381 22,635,079 71,545,391 142,023,741 877,727,336Oregon 42,138,615 41,275,987 43,332,423 43,769,055 44,786,752 44,771,535 46,010,303 45,690,393 45,848,987 44,809,501 42,693,864 42,702,211 527,829,626Pennsylvania 121,648,313 108,804,461 151,965,855 119,379,661 120,520,890 154,205,482 129,072,955 122,668,890 153,978,873 133,314,160 123,117,601 153,213,406 1,591,890,547Rhode Island 6,095,787 4,594,644 5,667,909 5,811,809 6,005,636 7,661,993 5,686,016 4,911,193 5,971,510 10,510,728 5,227,899 5,328,383 73,473,507South Carolina 53,943,128 32,040,576 69,243,539 61,532,265 51,711,374 63,827,742 65,233,353 46,193,791 66,116,656 62,778,212 39,323,028 71,377,699 683,321,363South Dakota 16,697,279 16,542,373 15,393,002 16,480,092 18,543,262 19,916,772 19,156,940 21,108,495 20,580,227 20,510,502 24,677,905 20,956,560 230,563,409Tennessee 65,672,288 79,074,450 78,440,200 75,082,513 84,807,969 78,803,310 69,073,251 84,575,111 82,504,554 74,594,341 79,714,673 76,898,011 929,240,671Texas 404,060,034 382,322,397 433,858,296 435,387,166 434,161,149 426,205,797 436,511,859 447,859,162 472,060,757 480,948,925 439,783,976 502,388,451 5,295,547,969Utah 36,497,014 31,879,905 33,803,066 36,209,907 40,081,711 43,036,443 38,244,496 42,146,122 41,964,039 37,614,731 36,082,829 37,441,110 455,001,373Vermont 3,674,012 5,688,106 4,827,452 5,871,433 5,272,952 4,355,032 4,355,032 5,310,173 3,713,423 3,713,423 5,786,425 5,786,425 58,353,888Virginia 107,687,367 61,546,326 111,955,606 70,493,594 67,729,141 92,240,218 98,691,941 78,260,493 76,394,092 104,149,162 81,048,057 65,206,937 1,015,402,934Washington 57,722,678 37,761,340 51,332,035 59,594,087 54,805,399 54,769,237 62,859,966 59,405,445 58,372,207 68,591,145 50,087,971 49,959,789 665,261,299West Virginia 17,239,774 30,343,883 23,672,771 10,027,504 39,259,455 25,658,146 6,068,038 30,253,012 19,295,098 10,063,536 37,353,818 24,274,416 273,509,451Wisconsin 62,118,572 53,580,994 51,419,067 47,862,764 57,221,311 127,118,223 66,415,987 67,215,868 65,840,962 71,327,803 60,313,120 71,575,457 802,010,128Wyoming 27,573,840 21,172,934 28,287,765 26,550,540 29,087,990 34,531,411 22,382,705 32,046,541 45,066,537 23,665,955 35,462,322 40,103,154 365,931,694US Total 3,078,815,578 2,909,602,015 3,371,106,315 3,159,185,928 3,335,251,564 3,499,090,781 3,319,402,102 3,275,585,618 3,524,167,433 3,417,042,176 3,203,225,268 3,618,314,616 39,710,789,394Puerto Rico 1,165,310 480,965 695,583 762,795 957,219 773,952 420,786 764,703 1,387,982 1,213,313 1,239,119 681,898 10,543,625Grand Total 3,079,980,888 2,910,082,980 3,371,801,898 3,159,948,723 3,336,208,783 3,499,864,733 3,319,822,888 3,276,350,321 3,525,555,415 3,418,255,489 3,204,464,387 3,618,996,514 39,721,333,019

(1) This table shows gross volume of special fuels (diesel and alternative fuels) reported by the State motor fuel tax agencies. (2) FHWA estimates are shown in bold fonts. Upon receipt of the State's actual gallons, the State data will
Where possible, fuel consumed by all levels and all non-highway use has been excluded. Further adjustments may be automatically be updated upon the next iteration of this report. See Notice on page 2.
made during the year end analysis. Most data reflect retail sales , but a number of States tax special fuels at the wholesale level.
When interstate motor carrier fuel volume is reported quarterly to FHWA, the volume is shown in the third month of the quarter.
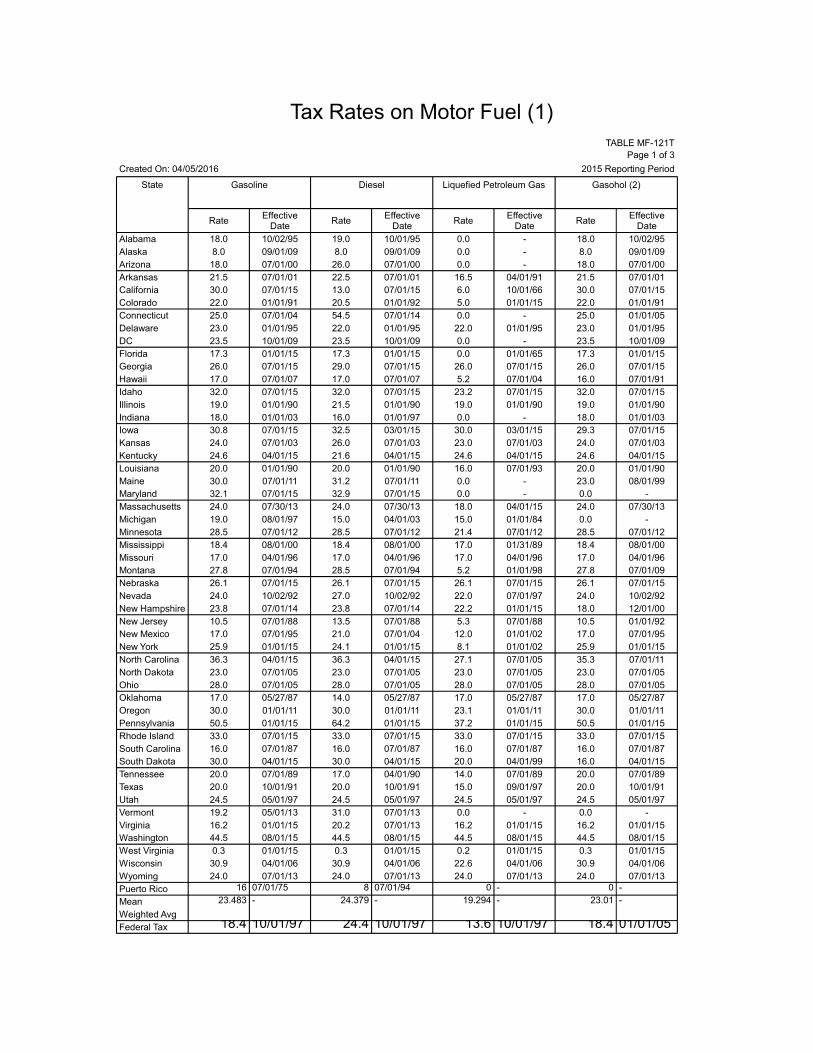
Tax Rates on Motor Fuel (1)TABLE MF-121T
Page 1 of 3
Created On: 04/05/2016 2015 Reporting Period
State Gasoline Diesel Liquefied Petroleum Gas Gasohol (2)
Rate Rate Rate Rate
Alabama 18.0 10/02/95 19.0 10/01/95 0.0 - 18.0 10/02/95Alaska 8.0 09/01/09 8.0 09/01/09 0.0 - 8.0 09/01/09Arizona 18.0 07/01/00 26.0 07/01/00 0.0 - 18.0 07/01/00Arkansas 21.5 07/01/01 22.5 07/01/01 16.5 04/01/91 21.5 07/01/01California 30.0 07/01/15 13.0 07/01/15 6.0 10/01/66 30.0 07/01/15Colorado 22.0 01/01/91 20.5 01/01/92 5.0 01/01/15 22.0 01/01/91Connecticut 25.0 07/01/04 54.5 07/01/14 0.0 - 25.0 01/01/05Delaware 23.0 01/01/95 22.0 01/01/95 22.0 01/01/95 23.0 01/01/95DC 23.5 10/01/09 23.5 10/01/09 0.0 - 23.5 10/01/09Florida 17.3 01/01/15 17.3 01/01/15 0.0 01/01/65 17.3 01/01/15Georgia 26.0 07/01/15 29.0 07/01/15 26.0 07/01/15 26.0 07/01/15Hawaii 17.0 07/01/07 17.0 07/01/07 5.2 07/01/04 16.0 07/01/91Idaho 32.0 07/01/15 32.0 07/01/15 23.2 07/01/15 32.0 07/01/15Illinois 19.0 01/01/90 21.5 01/01/90 19.0 01/01/90 19.0 01/01/90Indiana 18.0 01/01/03 16.0 01/01/97 0.0 - 18.0 01/01/03Iowa 30.8 07/01/15 32.5 03/01/15 30.0 03/01/15 29.3 07/01/15Kansas 24.0 07/01/03 26.0 07/01/03 23.0 07/01/03 24.0 07/01/03Kentucky 24.6 04/01/15 21.6 04/01/15 24.6 04/01/15 24.6 04/01/15Louisiana 20.0 01/01/90 20.0 01/01/90 16.0 07/01/93 20.0 01/01/90Maine 30.0 07/01/11 31.2 07/01/11 0.0 - 23.0 08/01/99Maryland 32.1 07/01/15 32.9 07/01/15 0.0 - 0.0 -Massachusetts 24.0 07/30/13 24.0 07/30/13 18.0 04/01/15 24.0 07/30/13Michigan 19.0 08/01/97 15.0 04/01/03 15.0 01/01/84 0.0 -Minnesota 28.5 07/01/12 28.5 07/01/12 21.4 07/01/12 28.5 07/01/12Mississippi 18.4 08/01/00 18.4 08/01/00 17.0 01/31/89 18.4 08/01/00Missouri 17.0 04/01/96 17.0 04/01/96 17.0 04/01/96 17.0 04/01/96Montana 27.8 07/01/94 28.5 07/01/94 5.2 01/01/98 27.8 07/01/09Nebraska 26.1 07/01/15 26.1 07/01/15 26.1 07/01/15 26.1 07/01/15Nevada 24.0 10/02/92 27.0 10/02/92 22.0 07/01/97 24.0 10/02/92New Hampshire 23.8 07/01/14 23.8 07/01/14 22.2 01/01/15 18.0 12/01/00New Jersey 10.5 07/01/88 13.5 07/01/88 5.3 07/01/88 10.5 01/01/92New Mexico 17.0 07/01/95 21.0 07/01/04 12.0 01/01/02 17.0 07/01/95New York 25.9 01/01/15 24.1 01/01/15 8.1 01/01/02 25.9 01/01/15North Carolina 36.3 04/01/15 36.3 04/01/15 27.1 07/01/05 35.3 07/01/11North Dakota 23.0 07/01/05 23.0 07/01/05 23.0 07/01/05 23.0 07/01/05Ohio 28.0 07/01/05 28.0 07/01/05 28.0 07/01/05 28.0 07/01/05Oklahoma 17.0 05/27/87 14.0 05/27/87 17.0 05/27/87 17.0 05/27/87Oregon 30.0 01/01/11 30.0 01/01/11 23.1 01/01/11 30.0 01/01/11Pennsylvania 50.5 01/01/15 64.2 01/01/15 37.2 01/01/15 50.5 01/01/15Rhode Island 33.0 07/01/15 33.0 07/01/15 33.0 07/01/15 33.0 07/01/15South Carolina 16.0 07/01/87 16.0 07/01/87 16.0 07/01/87 16.0 07/01/87South Dakota 30.0 04/01/15 30.0 04/01/15 20.0 04/01/99 16.0 04/01/15Tennessee 20.0 07/01/89 17.0 04/01/90 14.0 07/01/89 20.0 07/01/89Texas 20.0 10/01/91 20.0 10/01/91 15.0 09/01/97 20.0 10/01/91Utah 24.5 05/01/97 24.5 05/01/97 24.5 05/01/97 24.5 05/01/97Vermont 19.2 05/01/13 31.0 07/01/13 0.0 - 0.0 -Virginia 16.2 01/01/15 20.2 07/01/13 16.2 01/01/15 16.2 01/01/15Washington 44.5 08/01/15 44.5 08/01/15 44.5 08/01/15 44.5 08/01/15West Virginia 0.3 01/01/15 0.3 01/01/15 0.2 01/01/15 0.3 01/01/15Wisconsin 30.9 04/01/06 30.9 04/01/06 22.6 04/01/06 30.9 04/01/06Wyoming 24.0 07/01/13 24.0 07/01/13 24.0 07/01/13 24.0 07/01/13Puerto Rico 16 07/01/75 8 07/01/94 0 - 0 -
Mean 23.483 - 24.379 - 19.294 - 23.01 -
Weighted AvgFederal Tax 18.4 10/01/97 24.4 10/01/97 13.6 10/01/97 18.4 01/01/05
Effective Date
Effective Date
Effective Date
Effective Date
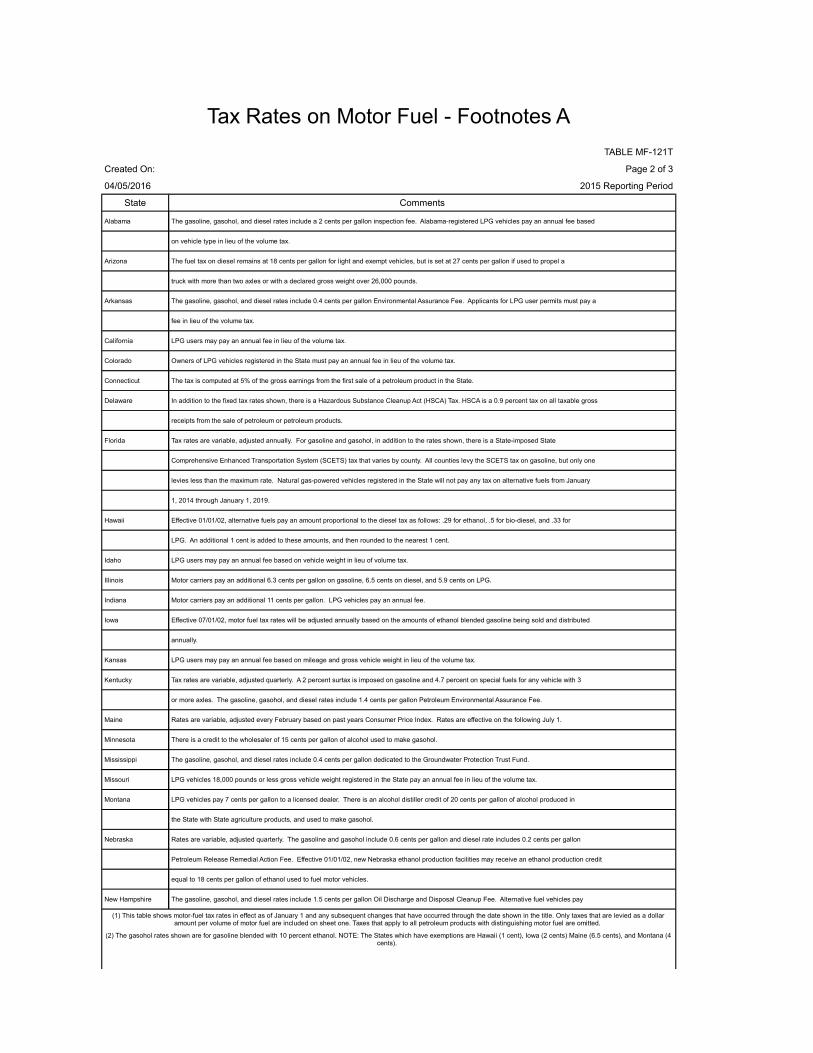
Tax Rates on Motor Fuel - Footnotes A
TABLE MF-121T
Created On: Page 2 of 3
04/05/2016 2015 Reporting Period
State Comments
Alabama The gasoline, gasohol, and diesel rates include a 2 cents per gallon inspection fee. Alabama-registered LPG vehicles pay an annual fee based
on vehicle type in lieu of the volume tax.
Arizona The fuel tax on diesel remains at 18 cents per gallon for light and exempt vehicles, but is set at 27 cents per gallon if used to propel a
truck with more than two axles or with a declared gross weight over 26,000 pounds.
Arkansas The gasoline, gasohol, and diesel rates include 0.4 cents per gallon Environmental Assurance Fee. Applicants for LPG user permits must pay a
fee in lieu of the volume tax.
California LPG users may pay an annual fee in lieu of the volume tax.
Colorado Owners of LPG vehicles registered in the State must pay an annual fee in lieu of the volume tax.
Connecticut The tax is computed at 5% of the gross earnings from the first sale of a petroleum product in the State.
Delaware In addition to the fixed tax rates shown, there is a Hazardous Substance Cleanup Act (HSCA) Tax. HSCA is a 0.9 percent tax on all taxable gross
receipts from the sale of petroleum or petroleum products.
Florida Tax rates are variable, adjusted annually. For gasoline and gasohol, in addition to the rates shown, there is a State-imposed State
Comprehensive Enhanced Transportation System (SCETS) tax that varies by county. All counties levy the SCETS tax on gasoline, but only one
levies less than the maximum rate. Natural gas-powered vehicles registered in the State will not pay any tax on alternative fuels from January
1, 2014 through January 1, 2019.
Hawaii Effective 01/01/02, alternative fuels pay an amount proportional to the diesel tax as follows: .29 for ethanol, .5 for bio-diesel, and .33 for
LPG. An additional 1 cent is added to these amounts, and then rounded to the nearest 1 cent.
Idaho LPG users may pay an annual fee based on vehicle weight in lieu of volume tax.
Illinois Motor carriers pay an additional 6.3 cents per gallon on gasoline, 6.5 cents on diesel, and 5.9 cents on LPG.
Indiana Motor carriers pay an additional 11 cents per gallon. LPG vehicles pay an annual fee.
Iowa Effective 07/01/02, motor fuel tax rates will be adjusted annually based on the amounts of ethanol blended gasoline being sold and distributed
annually.
Kansas LPG users may pay an annual fee based on mileage and gross vehicle weight in lieu of the volume tax.
Kentucky Tax rates are variable, adjusted quarterly. A 2 percent surtax is imposed on gasoline and 4.7 percent on special fuels for any vehicle with 3
or more axles. The gasoline, gasohol, and diesel rates include 1.4 cents per gallon Petroleum Environmental Assurance Fee.
Maine Rates are variable, adjusted every February based on past years Consumer Price Index. Rates are effective on the following July 1.
Minnesota There is a credit to the wholesaler of 15 cents per gallon of alcohol used to make gasohol.
Mississippi The gasoline, gasohol, and diesel rates include 0.4 cents per gallon dedicated to the Groundwater Protection Trust Fund.
Missouri LPG vehicles 18,000 pounds or less gross vehicle weight registered in the State pay an annual fee in lieu of the volume tax.
Montana LPG vehicles pay 7 cents per gallon to a licensed dealer. There is an alcohol distiller credit of 20 cents per gallon of alcohol produced in
the State with State agriculture products, and used to make gasohol.
Nebraska Rates are variable, adjusted quarterly. The gasoline and gasohol include 0.6 cents per gallon and diesel rate includes 0.2 cents per gallon
Petroleum Release Remedial Action Fee. Effective 01/01/02, new Nebraska ethanol production facilities may receive an ethanol production credit
equal to 18 cents per gallon of ethanol used to fuel motor vehicles.
New Hampshire The gasoline, gasohol, and diesel rates include 1.5 cents per gallon Oil Discharge and Disposal Cleanup Fee. Alternative fuel vehicles pay
(1) This table shows motor-fuel tax rates in effect as of January 1 and any subsequent changes that have occurred through the date shown in the title. Only taxes that are levied as a dollar amount per volume of motor fuel are included on sheet one. Taxes that apply to all petroleum products with distinguishing motor fuel are omitted.
(2) The gasohol rates shown are for gasoline blended with 10 percent ethanol. NOTE: The States which have exemptions are Hawaii (1 cent), Iowa (2 cents) Maine (6.5 cents), and Montana (4 cents).

Tax Rates on Motor Fuel - Footnotes B
TABLE MF-121T
Created On: Page 2 of 3
04/05/2016 2015 Reporting Period
State Comments
twice the usual registration fee in lieu of the volume tax.
New Jersey In addition to the rates shown, there is a Petroleum Products Gross Receipts Tax. The tax is computed on a cents-per-gallon basis and is
applicable to a wide variety of petroleum products.
New Mexico The gasoline, gasohol, and diesel rates include the Petroleum Products Loading Fee of $150 per 8,000 gallons (1.875 cents per gallon). Owners
of LPG-powered vehicles up to 54,000 pounds gross vehicle weight may pay an annual fee in lieu of the volume tax.
New York Rates are variable, adjusted annually. Rates include the Petroleum Business Tax of 17 cents per gallon. The gasoline rate includes a 0.5 mill
(0.05 cents) per gallon Petroleum Testing Fee.
North Carolina Rates are variable, adjusted semiannually.
North Dakota A special excise tax of 2% is imposed on all sales of special fuel (diesel or LPG) that are exempted from the volume tax if the fuel is sold
for use in the State. There is a producer credit of 40 cents per gallon of agriculturally derived alcohol produced in the State and used to
make gasohol.
Ohio Commercial vehicles formerly subject to the highway use tax pay an additional 3 cents per gallon. Dealers are refunded 10 cents per gallon of
each qualified fuel (ethanol or methanol) blended with unleaded gasoline.
Oklahoma Rates shown include 1 cent per gallon tax dedicated to the Petroleum Underground Tank Release Environmental Cleanup Indemnity Fund. When the
Fund reaches specified balance, future tax revenues will be deposited in a highway fund. The gasoline, gasohol, and LPG rates include 0.08
cents for fuel inspection. LPG users may pay an annual fee in lieu of the volume tax.
Oregon The diesel and LPG rates shown are paid by users for vehicles not under the jurisdiction of Public Utility Commissioner. Vehicles under the
jurisdiction of the Public Utilities Commissioner and paying motor-carrier fees are exempt from payment of the motor-fuel tax.
Pennsylvania The rates include the Oil Franchise Tax for Maintenance and Construction, a variable rate tax adjusted annually. LPG rate is based on the
gasolie gallon equivalent.
Rhode Island Rates includes 1 cent per gallon tax for the Underground Storage Tank Financial Responsibility Fund.
South Dakota As of 7/1/2009, South Dakota taxes gasoline at 22 cents and ethyl alcohol at 8 cents.
Texas Owners of LPG vehicles registered in the State must pay an annual fee in lieu of the volume tax.
Utah LPG is tax exempt if user purchases annual exemption certificate.
Vermont Diesel vehicles 10,000 pounds and over pay 26 cents per gallon. LPG vehicles are subject to a registration fee 1.75 times the usual fee. The
gasoline, gasohol, and diesel rates include 1 cents per gallon for the Petroleum Cleanup Fund.
Virginia Vehicles weighing 26,000 pounds or more having 3 or more axles pay an additional 3.5 cents per gallon.
Washington Owners of LPG vehicles pay an annual fee.
West Virginia Rates are variable, adjusted annually.
Wisconsin Rates are variable, adjusted annually.
Wyoming LPG is subject to sales tax. The gasoline, gasohol, and diesel rates include 1 cent for the Underground Storage Tank Corrective Action Account.
Tax Rates on Motor Fuel - Footnotes C

TABLE MF-121T
Created On: Page 2 of 3
04/05/2016 01/01/15 Reporting Period
State Comments

Tax Rates on Motor Fuel A
TABLE MF-121T
Page 3 of 3
Created On: 04/05/2016 2015 Reporting Period
State Percent Sales Tax
Alabama 4.0 Applies to fuel not taxable under volume tax laws.
Arizona 5.0 Applies to fuel not taxed under the motor-fuel or fuel-use taxes. Liquified petroleum gas sold, used, or stored in State is exempt.
Arkansas 4.5 Special fuel for municipal buses and gasoline are exempt.
California 6.0 Applies to sales price including Federal and State motor-fuel taxes.
Colorado 3.0 Applies to fuel taxable under volume tax laws.
Connecticut 5.0 A Petroleum Products Gross Earnings tax is applied to many petroleum products, in addition to the per gallon taxes shown on Sheet 1.
DC 5.8 Applies to fuel not taxable under volume tax laws.
Georgia 4.0 A 3-percent second motor fuel tax and a 1-cent sales tax apply to the sales price including Federal motor-fuel tax.
Hawaii 4.0 Applies to the sales price excluding Federal and State motor fuel taxes. Alcohol fuels are exempt.
Idaho 5.0 Fuels subject to the motor fuel volume tax are exempt.
Indiana 5.0 Applies to the sales price excluding Federal and State motor fuel taxes.
Iowa 5.0 Applies to fuel not taxable under fuel tax laws, including those fuels taxable, then subject to refund.
Kansas 4.9 Applies to fuels not taxable under the volume tax laws.
Kentucky 6.0 Applies to sales price, exclusive of Federal tax, of fuels not taxable under the volume tax laws.
Maine 6.0 Applies to motor fuel not taxed at the maximum rate for highway use under the volume tax laws.
Maryland 6.0 Applies to fuels not taxable under motor fuel tax laws, unless exempt from the sales and use tax by statute.
Massachusetts 5.0 Applies to fuels not taxable under the volume tax laws.
Michigan 6.0
Minnesota 6.0 Applies to fuels not taxable under the volume tax laws.
Nebraska 5.0 Gasoline is exempt. Diesel and alternative fuels subject to the volume tax are exempt.
New Mexico 5.0 Applies to fuels not taxable under the volume tax laws. Ethanol blends deductible under the gasoline tax laws are exempt.
New York 4.0
North Dakota 6.0 Applies to fuels not taxable under the volume tax laws.
Ohio 5.0 Applies to fuels not taxable under the volume tax laws.
Oklahoma 4.5 Applies to fuels not taxable under the volume tax laws.
Pennsylvania 6.0 Applies to fuels not taxable under the volume tax laws.
South Carolina 5.0 Applies to sales price of aviation gasoline only.
South Dakota 4.0 Applies to fuels not taxable under the volume tax laws.
Tennessee 6.0 pay quarterly. Fee is based on vehicle weight and fuel efficiency.
Texas 6.3 Applies to fuels not taxed or exempted under other laws.
Utah 4.9 Applies to fuels not taxable under the volume tax laws.
Washington 6.5 Applies to fuels not taxable under the volume tax laws. Certain providers of public transportation of handicapped persons are exempt.
Wisconsin 5.0 Applies to fuels not taxable under the volume tax laws.
Wyoming 4.0 Applies to sales price of LPG. Gasoline and diesel subject to volume tax are exempt.
Applies to sales price including Federal volume tax, except when used in a passenger vehicle with capacity of 10 or more, for-hire, over regularly scheduled routes in the State.
Applies only to the first $2 of the price of a gallon of motor fuel. Counties have the option to use this cents-per-gallon method, or continue using their local percentage rates in their calculations.
Tax Rates on Motor Fuel B
TABLE MF-121T
Page 3 of 3
Created On: 04/05/2016 2015 Reporting Period
State Percent Sales Tax


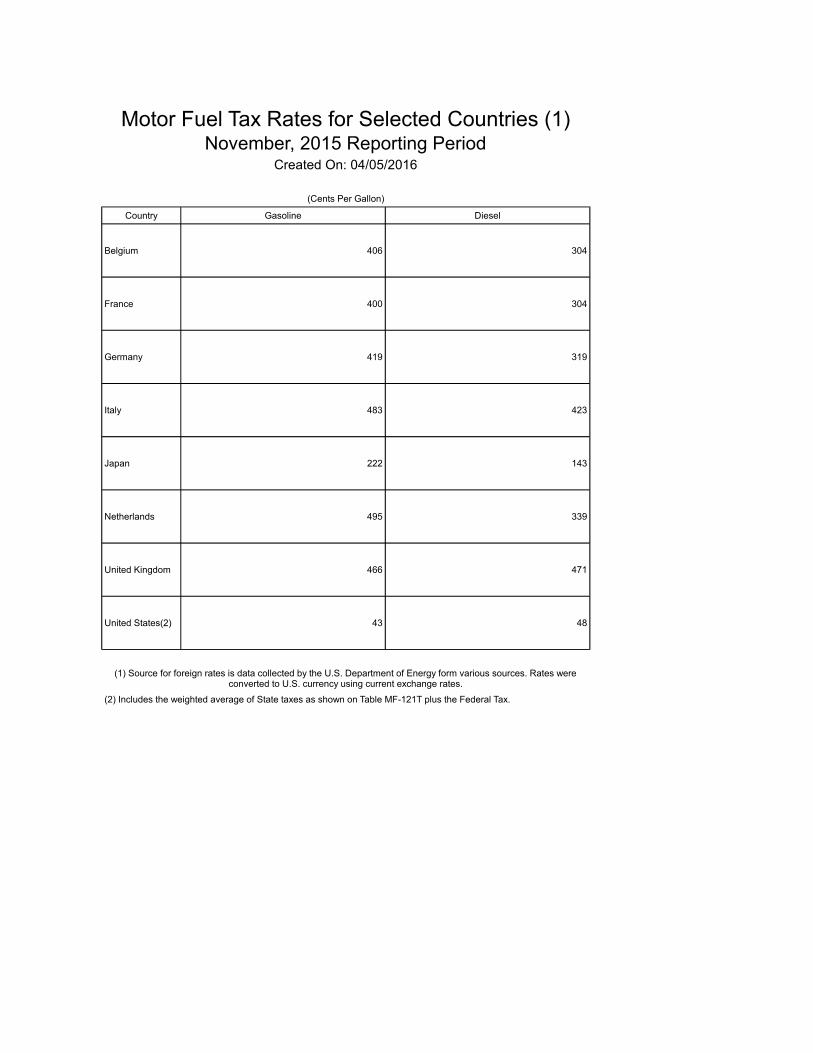
Motor Fuel Tax Rates for Selected Countries (1)November, 2015 Reporting Period
Created On: 04/05/2016
(Cents Per Gallon)
Country Gasoline Diesel
Belgium 406 304
France 400 304
Germany 419 319
Italy 483 423
Japan 222 143
Netherlands 495 339
United Kingdom 466 471
United States(2) 43 48
(2) Includes the weighted average of State taxes as shown on Table MF-121T plus the Federal Tax.
(1) Source for foreign rates is data collected by the U.S. Department of Energy form various sources. Rates were converted to U.S. currency using current exchange rates.