November 2013 Final Report Waddle Road-I-99 …twp.patton.pa.us/files/Waddle Road Interchange...
82
DRAFT WADDLE ROAD / I-99 INTERCHANGE PROJECT ALTERNATIVE ANALYSIS FINAL TRAFFIC SUMMARY REPORT Prepared by: In Association with: November 2013
Transcript of November 2013 Final Report Waddle Road-I-99 …twp.patton.pa.us/files/Waddle Road Interchange...
DRAFT WADDLE ROAD / I-99 INTERCHANGE PROJECT
ALTERNATIVE ANALYSIS
FINAL TRAFFIC SUMMARY REPORT
Prepared by:
In Association with:
November 2013

Waddle Road / I-99 Interchange Project
Alternative Analysis
Final Traffic Summary Report
November 2013
prepared by
Transportation Resource Group, Inc.
In Association with
Erdman Anthony and Associates
421.001.12
Waddle Road / I-99 Interchange Project Final Report Table of Contents
TABLE OF CONTENTS EXECUTIVE SUMMARY I. INTRODUCTION 1
A. Background 1 B. Project Location/Study Area 1 C. Background Data 1
II. EXISTING CONDITIONS 4
A. DESCRIPTION OF STUDY AREA 4
1. Major Roadways 4 2. Study Intersections 6 3. Pedestrians/Bicycles 7 4. Transit Service 8 5. Land Use and Context 8 6. Planned Transportation Projects 9 7. Special Event Traffic 9
B. TRAFFIC DATA 12
1. Daily Counts 12 2. Intersection Counts 12 3. Field Observations 13
C. LEVEL OF SERVICE AND CAPACITY ANALYSIS 21
D. CRASH DATA AND ANALYSIS 24
III. SHORT TERM/EARLY ACTION IMPROVEMENTS 27
A. Potential Improvements 27 B. Analysis Methodology 28 C. Evaluation of Improvements 28 D. Findings 33
IV. IMPROVEMENT ALTERNATIVES – PRELIMINARY 2040 TRAFFIC ANALYSIS 34 A. Growth Forecasts and Development Activity 34 B. Centre County Travel Demand Model 35 C. Traffic Forecasting Methodology and Adjustments 36 D. 2040 No-build Traffic Conditions 36 E. 2040 Build Conditions – Range of Alternatives 40
1. Conventional Diamond Interchange 42 2. Partial Cloverleaf Interchange 42 3. Diverging Diamond Interchange (DDI) 43
Waddle Road / I-99 Interchange Project Final Report Table of Contents
4. Multilane Roundabouts 44 5. Single Point Urban Interchange (SPUI) 44
F. Findings 45 V. PREFERRED ALTERNATIVES – UPDATED 2040 TRAFFIC ANALYSIS 51
A. Intersection Counts and Unmet Demand 51 B. Traffic Forecasting Methodology and Adjustments 52 C. 2040 No-build Traffic Conditions 53 D. 2040 Build Traffic Conditions 60 E. Findings and Conclusions 71
Waddle Road / I-99 Interchange Project
LIST OF FIGURES Figure 1 Project Location 3 Figure 2 Primary Study Area 10 Figure 3 Existing Lane Configuration and Traffic Control 11 Figure 4 Existing Traffic Volumes – Daily 16 Figure 5 Hourly Variation of Traffic Volumes – Waddle Road (Location 1) 17 Figure 6 Hourly Variation of Traffic Volumes – I-99 SB/Route 322 WB off-ramp (Location 3) 17 Figure 7 Existing Traffic Volumes – AM Peak Hour 7:30 AM – 8:30 AM 18 Figure 8 Existing Traffic Volumes – PM Peak Hour 4:45 PM – 5:45 PM 19 Figure 9 Existing Traffic Volumes – Saturday Peak Hour 4:45 PM – 5:45 PM 20 Figure 10 Waddle Road Reportable Crash Profile (2006-2010) 26 Figure 11 Build Alternative – Conventional Diamond 46 Figure 12 Build Alternative – Partial Cloverleaf 47 Figure 13 Build Alternative – Diverging Diamond 48 Figure 14 Build Alternative – Multilane Roundabouts 49 Figure 15 Build Alternative – Single Point Urban Interchange 50 Figure 16 2040 Design Year No-Build Traffic Volumes – Daily 55 Figure 17 2040 Design Year No-Build Traffic Volumes – AM Peak Hour 56 Figure 18 2040 Design Year No-Build Traffic Volumes – PM Peak Hour 57 Figure 19 2040 Design Year No-Build Traffic Volumes – Saturday Peak Hour 58 Figure 20 2040 Design year Build Traffic Volumes – Daily 63 Figure 21 2040 Design Year Build Traffic Volumes- AM Peak Hour 64 Figure 22 2040 Design Year Build Traffic Volumes – PM Peak Hour 65 Figure 23 2040 Design Year Build Traffic Volumes – Saturday Peak Hour 66 Figure 24 Preferred Build Alternative – Conventional Diamond with Two SB Thru Lanes 74
Waddle Road / I-99 Interchange Project
LIST OF TABLES Table1 Study Area Roadway System Characteristics 5 Table 2 Intersection Volumes by Other Modes 13 Table 3 Existing Intersection Level of Service Results 22 Table 4 Intersection Crash Frequency Reportable and Non-Reportable Crashes (2006-2010) 25 Table 5 Waddle Road Segment Crash Rate Analysis (2006-2010) 25 Table 6 Intersection Level of Service Results/Early Action Improvements 31 Table 7 Patton Township Future Growth CRPA 2040 Forecast v. Development Activity 34 Table 8 Preliminary Intersection Level of Service Results – 2040 No-Build Alternative 38 Table 9 Preliminary Overall Intersection Level of Service Results – 2040 Build Alternatives 41 Table 10 Final 2040 Intersection Level of Service Results – No Build Alternative 59 Table 11 Final 2040 Intersection Level of Service Results – Conventional Diamond Build Alternative 67 Table 12 Final 2040 Intersection Level of Service Results – Partial Cloverleaf Build Alternative 68 Table 13 Final 2040 Intersection Level of Service Results – Conventional Diamond Build Alternative – Two SB Through Lane Option 69 Table 14 Final 2040 Intersection Level of Service Results – Partial Cloverleaf Build Alternative – Two SB Through Lane Option 70 Table 15 Final 2040 Intersection Performance Comparison – Build Alternative 73
Waddle Road / I-99 Interchange Project
LIST OF REPORT APPENDICES Appendix A: Study Intersection Photographs Appendix B: Existing Traffic Signal Permits Appendix C: Centre Region Bike and Transit Route Maps Appendix D: Patton Township Existing Land Use Map Appendix E: Queue Analysis Results – Existing and Early Action Improvements Appendix F: CPRA Patton Township Growth Forecast Appendix G: Preliminary 2040 Forecasted Traffic Volumes Appendix H: Preliminary Level of Service / Queue Analysis Results – Range of Alternatives Appendix I: Final CCTDM / Project Study Area Traffic Volume Assignments Appendix J: Final Queue Analysis Results – Preferred Alternatives
TECHNICAL FILES • April 2012 Traffic Count Summaries • Existing Level of Service / Capacity • Early Action Improvements Level of Service / Capacity • Preliminary 2040 Level of Service / Capacity • September 2013 Traffic Count / Unmet Demand Summaries • Final Level of Service / Capacity Analysis – Preferred Alternatives
Waddle Road / I-99 Interchange Project Introduction
1
I. INTRODUCTION A. BACKGROUND Patton Township, in partnership with the Pennsylvania Department of Transportation (PennDOT), initiated the Waddle Road / I-99 Interchange project to increase capacity and improve safety at the interchange and on the adjacent road network. Today, travel along the Waddle Road Corridor and the Interchange is subject to heavy traffic congestion and queuing, especially on the I-99 SB/U.S. 322 WB off-ramp. Waddle Road serves as a main connector route between North Atherton Street, the main business route into State College, and the Toftrees Community. The Toftrees area is poised for significant growth as plans have been considered for a Town Center consisting of 1.3 million square feet of commercial development and approximately 2,800 residential dwelling units. While the total build-out of the Town Center is not likely with today’s economic situation, the added traffic from the development of the immediate and surrounding area will require improvements to the Interchange. These improvements are considered to be critical to the local economic development initiatives and necessary to support the existing and future land development needs over the long term for the area. B. PROJECT LOCATION/STUDY AREA The Waddle Road / I-99 Interchange (Exit 71 Woodycrest, Toftrees) is located in Patton Township, Centre County, Pennsylvania, just on the fringe of State College and Penn State University as shown in Figure 1. In the project area, I-99, also known as the Mt. Nittany Expressway, is signed as a north-south route and has multiple designations. These include U.S. Route 322 and Route 220, which are considered east-west routes. Waddle Road is aligned in a north-south direction, and for the purpose of this study was designated as the north-south route in the project area. C. BACKGROUND DATA In order to complete a thorough evaluation and analysis of the primary study area, the following data was obtained from Patton Township and the Centre Regional Planning Agency (CRPA) and reviewed:
• Traffic Signal Inventory/Equipment List
• Comprehensive Plan
• Zoning Ordinance/Map
• SALDO
Waddle Road / I-99 Interchange Project Introduction
2
• CIP/Roadway Improvements
• Official Township Map/Proposed Roads/Functional Class
• Bicycle and Pedestrian Plan/Routes
• Halfmoon – Patton Township Area Plan/Study
• Toftree’s Master Plan Project Updates (including Point of Access Study)
• Developments of significance with TIS and Plans
• Traffic Counts/Volumes (Existing and Historic)
• Crash Data – reported and non-reported available data covering a five year period
• Township Comments on Centre County Regional Comprehensive Plan
• List of Special Events that may affect interchange
• Traffic Zone Map
• Existing (base year) and 2040 Socio-Economic Forecasts
• Base Year Validated Traffic Assignment Run/Screen Lines
• 2040 With Committed Network Traffic Assignment Run/Screen Lines
• Functional Class Map
• Transportation Improvement Program (TIP)
• Long Range Transportation Plan (LRTP)
• Centre Regional Comprehensive Plan
• Transit Studies/Plans
• Bicycle/Pedestrian Plans/Routes In addition to these data sources, several field visits were conducted to identify and document existing conditions and note observations.


Waddle Road / I-99 Interchange Project Existing Conditions
4
II. EXISTING CONDITIONS A. DESCRIPTION OF STUDY AREA This section describes the major features of the primary study area including the roadways, intersections, pedestrian and bicycle facilities, transit, land use context, and planned transportation projects. Figure 2 shows the primary study area along Waddle Road that is bounded by Toftrees Avenue to the north and Clearview Avenue to the south. 1. Major Roadways The major roadways in the study area consist primarily of Township roadways with the exception of I-99/US 322. The Waddle Road bridge structure over I-99 is also state owned (S.R.3045). Table 1 summarizes the roadway system characteristics and a brief description follows.
Waddle Road Waddle Road (T-528) is Township owned and is designated as an urban collector on the Federal Functional Classification System. The number of lanes range from two to five with the wider sections appearing near the Colonnade Boulevard intersection. The bridge over I-99/US 322 has three lanes and is designated as S.R.3045. Lane widths vary from 11 to 12 feet and 4 to 10 foot shoulders are provided north of Colonnade Boulevard. Right-of-way is greatest north of Colonnade Boulevard with widths ranging from 120 to 200 feet. South of Colonnade Boulevard, right-of-way is limited, ranging from 41.5 feet to 65 feet. The posted speed limit ranges from 25 mph south of Colonnade Boulevard to 35 mph north of Colonnade Boulevard through the interchange. Colonnade Boulevard Colonnade Boulevard (T-530) is Township owned and is considered a local collector road. It carries three to four lanes with lane width ranging from 11 to 14 feet curbed. Right-of-way ranges from 60 to 70 feet. The posted speed limit is 25 mph. Strouse Avenue Strouse Avenue (T-546) is Township owned and is considered a local road. It carries two to three lanes with lane widths ranging from 11 to 14 feet curbed. Right-of-way is limited to 33 feet and the posted speed limit is 25 mph.
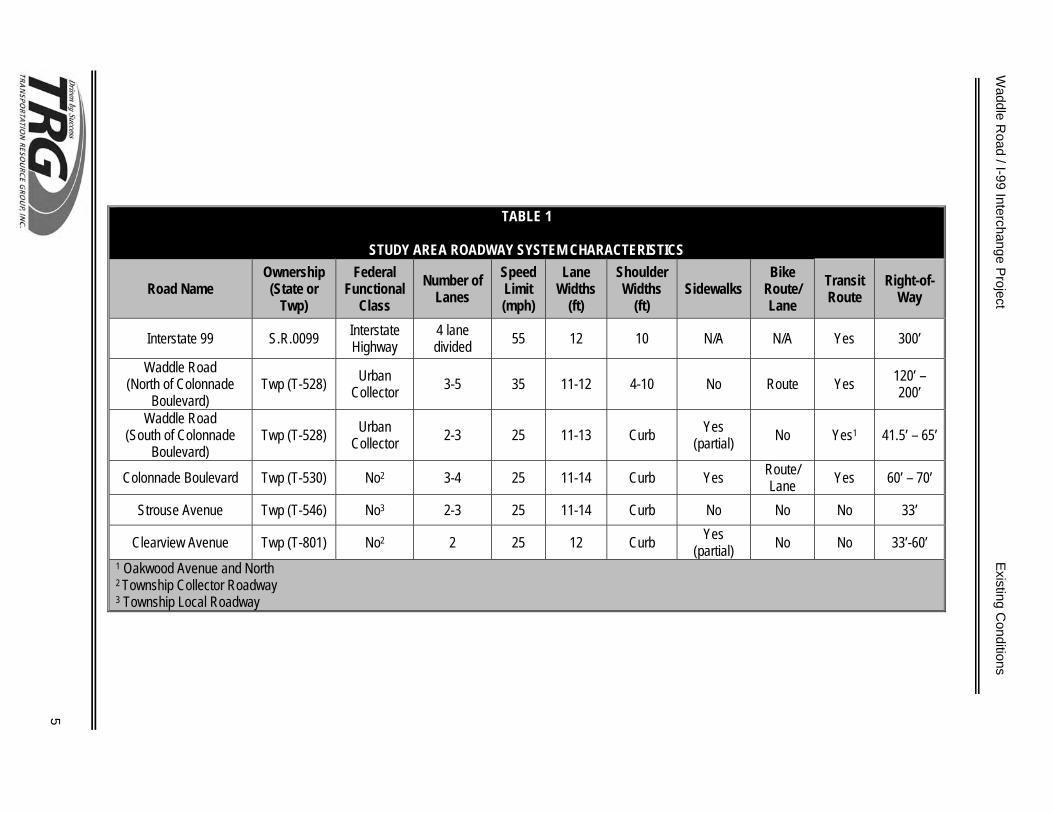
TABLE 1
STUDY AREA ROADWAY SYSTEM CHARACTERISTICS
Road Name Ownership
(State or Twp)
Federal Functional
Class Number of
Lanes Speed Limit (mph)
Lane Widths
(ft)
Shoulder Widths
(ft) Sidewalks
Bike Route/ Lane
Transit Route
Right-of-Way
Interstate 99 S.R.0099 Interstate Highway
4 lane divided 55 12 10 N/A N/A Yes 300’
Waddle Road (North of Colonnade
Boulevard) Twp (T-528) Urban
Collector 3-5 35 11-12 4-10 No Route Yes 120’ – 200’
Waddle Road (South of Colonnade
Boulevard) Twp (T-528) Urban
Collector 2-3 25 11-13 Curb Yes (partial) No Yes1 41.5’ – 65’
Colonnade Boulevard Twp (T-530) No2 3-4 25 11-14 Curb Yes Route/ Lane Yes 60’ – 70’
Strouse Avenue Twp (T-546) No3 2-3 25 11-14 Curb No No No 33’
Clearview Avenue Twp (T-801) No2 2 25 12 Curb Yes (partial) No No 33’-60’
1 Oakwood Avenue and North 2 Township Collector Roadway 3 Township Local Roadway
Waddle R
oad / I-99 Interchange Project
Existing C
onditions
5
Waddle Road / I-99 Interchange Project Existing Conditions
6
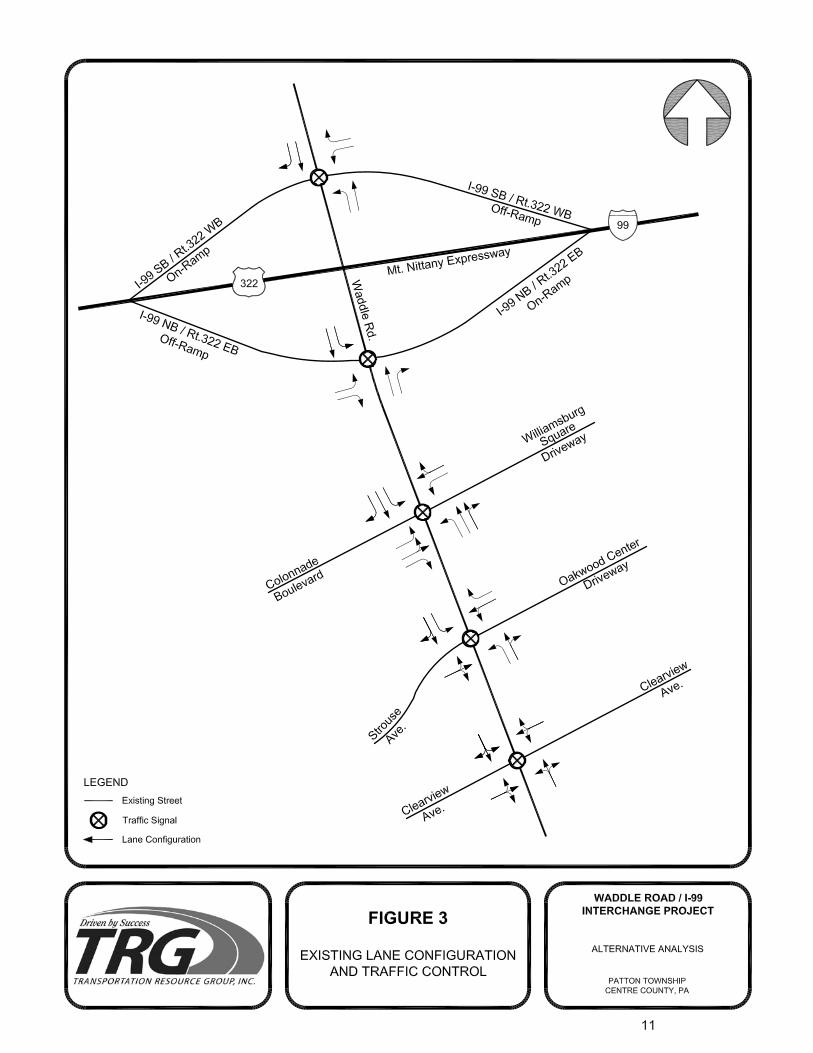
Clearview Avenue Clearview Avenue (T-801) is Township owned and is considered a local collector road. It carries two lanes with widths of 12 feet curbed. Right-of-way varies from 33 feet to 60 feet. The posted speed limit is 25 mph. Mt. Nittany Expressway – Interstate 99 Interstate 99 (U.S. 322/US 220 – S.R.099) is functionally classified as an interstate highway on the Federal Functional Classification System. I-99 is a four lane divided highway with 12 foot lanes and 10 foot shoulders. Right-of-way varies, but is largely 300 feet in the project area. A 55 mph speed limit is posted. 2. Study Intersections There are five signalized intersections in the primary study area along Waddle Road that were evaluated. Figure 3 shows the existing lane configuration and traffic control at these intersections. The Waddle Road corridor is part of an Econolite Aries closed loop coordinated traffic signal system. The signals are interconnected with fiber optic cable via the on-street master controller located at Colonnade Boulevard. The signal system operates with a 100 second AM peak hour cycle and a 120 second PM peak hour cycle time. During the week Saturday mid-day peak, the system operates on a 100 second cycle. All signals operate on “flash mode” from 12:00 midnight to 6:00 AM, seven days a week. Intersection controllers are all Econolite ASC/2S-2100. A brief description of each study intersection follows.
Waddle Road / I-99 SB – Rt. 322 WB This signalized ramp intersection has one through lane in each direction on Waddle Road with separate turn lanes. The off-ramp has separate left and right turn lanes. Pedestrian features include push buttons and marked crosswalks for pedestrian movements on three of the legs. The signal is fully actuated and coordinated with the other signals along Waddle Road. The ramp termini are spaced at approximately 600 feet which is characteristic of a compressed diamond interchange. Waddle Road / I-99 NB – Rt. 322 EB This signalized ramp intersection has one through lane in each direction on Waddle Road with separate turn lanes. The off-ramp has separate left and right turn lanes. Pedestrian features
Waddle Road / I-99 Interchange Project Existing Conditions
7
include push buttons and marked crosswalks for pedestrian movements on three of the legs. The signal is fully actuated and coordinated with the other signals along Waddle Road. Waddle Road/Colonnade Boulevard This four legged signalized intersection has a wide cross-section with a multi-lane approach on Colonnade Boulevard and Waddle Road. The eastbound approach is a private driveway with separate turn lanes. Pedestrian features include pushbuttons, man-hand signals and marked cross-walks on all legs of the intersection. The signal is volume density and coordinated with the other signals along Waddle Road. Waddle Road/Strouse Avenue This four-legged signalized intersection has one through lane in each direction on Waddle Road with separate left turn lanes. The Strouse Avenue approach is a single lane and the opposing leg is a private driveway (Oakwood Center) with separate turn lanes. Pedestrian features include push buttons, man-hand signals and marked crosswalks on all legs of the intersection. The signal is fully actuated and coordinated with the other signals along the corridor. Waddle Road/Clearview Avenue This four-legged signalized intersection has one through lane in each direction on Waddle Road. Just south of Clearview Avenue, Waddle Road widens to three lanes and operates with a center left turn lane. The Clearview Avenue approaches are single lanes. Pedestrian features include push buttons, Walk-Don’t Walk signals and marked crosswalks on all legs of the intersections. The signal is fully actuated and coordinated with the other signals along Waddle Road.
Photographs, and the existing traffic signal permit plans, of the study intersections can be found in the Report Appendices. 3. Pedestrians/Bicycles Pedestrian traffic is accommodated by a limited sidewalk network confined largely to Colonnade Boulevard and segments along Waddle Road that are discontinuous south of Colonnade Boulevard. To the north, pedestrians must use the existing 4 to 5 foot shoulders on the bridge structure to cross I-99. Bicycle lanes
Waddle Road / I-99 Interchange Project Existing Conditions
8
are provided on Colonnade Boulevard. Waddle Road north of Colonnade Boulevard to Toftrees Avenue is considered a preferred local bicycle route as identified in the Patton Township Bicycle and Pedestrian Path Study. Also, Waddle Road route north to Toftrees is shown as a proposed facility on the Centre Region Bike Map. 4. Transit Service Within the study area, local transit service is provided by the Centre Area Transportation Authority (CATA). CATA currently has three fixed routes that serve the area as noted below:
• Route V (Vario Blvd.) – This route travels and services the Colonnade Boulevard and Oakwood Avenue areas within the study area. Service is provided during the weekday, Saturday and Sunday.
• Route HP (Toftrees/Scenery Park) – This route travels and services Colonnade Boulevard and Toftrees Avenue within the study area. Service is provided during the weekday and Saturday.
• Route NV (Martin St. /Vario Blvd.) – This route travels and services Oakwood Avenue and
travels Waddle Road to I-99 NB/U.S. 322 EB to downtown State College. Service is limited to the weekday during Penn State University fall and spring semesters.
Maps of the transit routes can be found in the Report Appendices. 5. Land Use and Context The primary study area can be best described as a mixture of retail, commercial, office and residential land uses. Large retail uses can be found along Colonnade Boulevard which serve as a major attraction to the Centre County Region. Land uses along Waddle Road south of Colonnade Boulevard are largely residential with commercial and office uses situated along Waddle Road. North of I-99 lie largely residential uses with the Toftrees and other planned communities. It is this area where the greatest potential exists for future development with over 600 acres of vacant land for development. The area is zoned Planned Community and the future land use is designated as mixed-use commercial office and residential. Overall, the Waddle Road corridor has a land use context which corresponds to the Suburban Corridor/Center definitions in the PennDOT Smart Transportation Guidebook. A map of the existing land uses in the study area can be found in the Report Appendices.

Waddle Road / I-99 Interchange Project Existing Conditions
9
6. Planned Transportation Projects In addition to this Waddle Road / I-99 Interchange project, which appears on the 2013-2016 Centre County Transportation Improvement Program (TIP) and the Patton Township Capital Improvement Plan (CIP) (2013 to 2017), the CIP also lists a proposed widening project on Waddle Road. The Waddle Road widening project from Strouse Avenue to Clearview Avenue will provide a center turn lane to improve capacity and provide safe refuge for left-turning vehicles. The feasibility study for this study will commence in 2013 with construction planned for 2016. Total cost for the project is projected at $510,000.00. 7. Special Event Traffic With Penn State University’s Beaver Stadium in close proximity, the I-99 / Waddle Road interchange is part of a special event route for departing traffic leaving home football games. The route utilizes Fox Hollow Road, Toftrees Avenue and Waddle Road. Other special events in the State College area that have less of an impact but are worthwhile noting:
• Jordan Center Concerts/events • PSU Graduation • Large Athletic tournaments (collegiate and high school) • PSU Athletic Events • Arts Festival • Toftrees Conferences • Special Olympics • PSU student move in/out days • Holiday shopping season • July 4th Fest at Beaver Stadium

Waddle Road / I-99 Interchange Project Existing Conditions
12
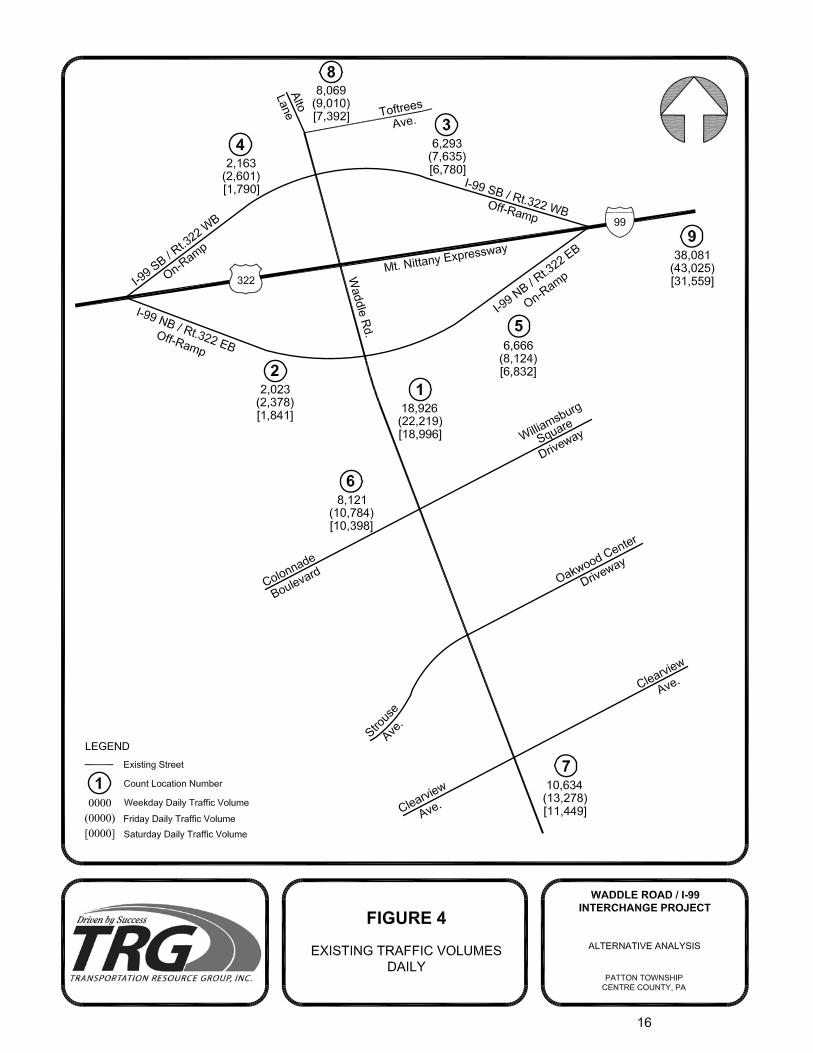
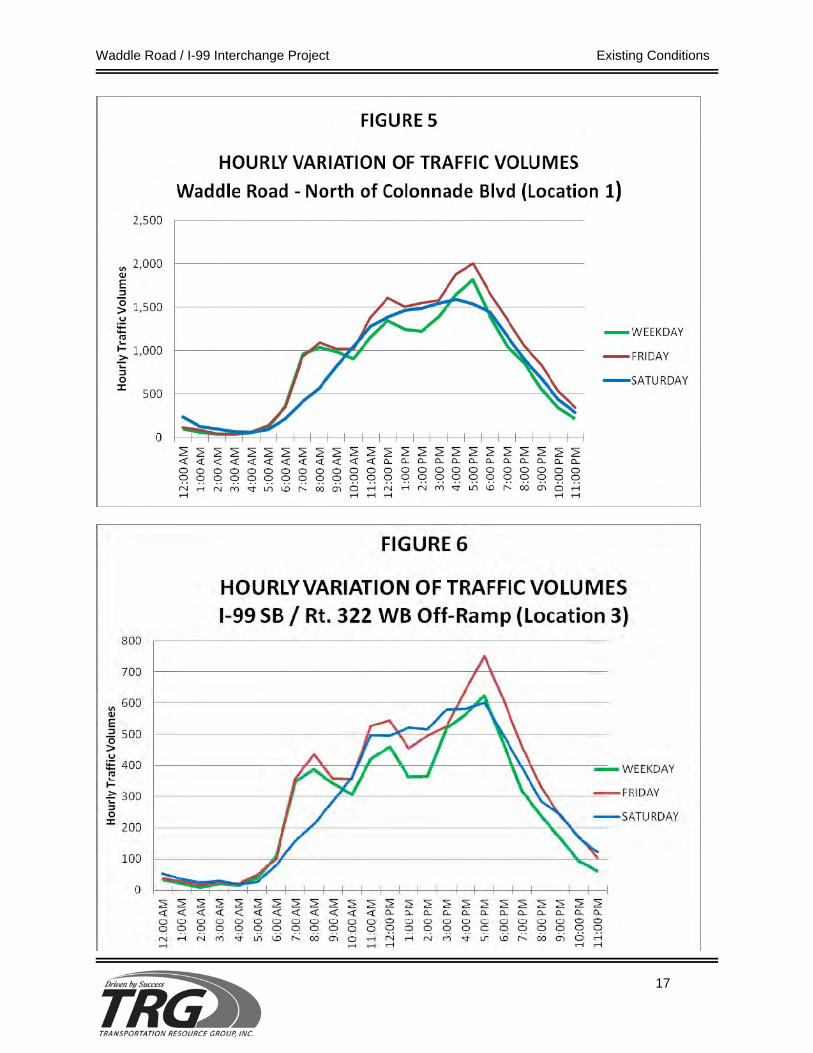
B. TRAFFIC DATA In order to determine the current traffic conditions within the study area, manual turning movement counts (TMC) and automatic traffic recorder counts (ATR) were conducted on the Waddle Road Corridor. 1. Daily Counts ATR counts were conducted over a seven-day period in April 2012 to obtain information related to hourly and daily traffic volumes and truck percentages. The counts were conducted at nine (9) locations within the project area including two (2) locations along Waddle Road. The counts provided both volume and vehicular classification information. The results of the counts show that the daily traffic volumes are highest on Fridays, with only a slight variation in volumes between the weekday and Saturday traffic volumes, and then a drop in daily volumes on Sunday. On average, approximately 1.0% of the total weekday traffic and 0.8% of the Saturday volumes consist of large trucks. Figure 4 shows the existing daily traffic volumes, while Figures 5 and 6 graphically show the hourly variation of traffic volumes on Waddle Road (count location 1) and on the I-99 SB – Route 322 westbound off-ramp (count location 3). The Friday PM peak hour surge in traffic on the off-ramp is evident with volumes 20% higher than the typical weekday. Traffic count summaries can be found in the Technical Files. 2. Intersection Counts Manual intersection turning movement counts were collected at the five signalized study intersections during a typical weekday and a Saturday in April 2012. Based on the hourly breakdown of the ATR counts, the manual counts were conducted during the following time periods:
Time Period Count Times Peak Hour
Weekday AM Hours 7:00 – 9:00 AM 9:30 –10:30 AM
7:30 – 8:30 AM
Weekday PM Hours 1:30 – 2:30 PM
3:30 – 6:30 PM 4:45 – 5:45 PM Saturday Hours 3:00 – 6:00 PM 4:45 – 5:45 PM
Waddle Road / I-99 Interchange Project Existing Conditions
13
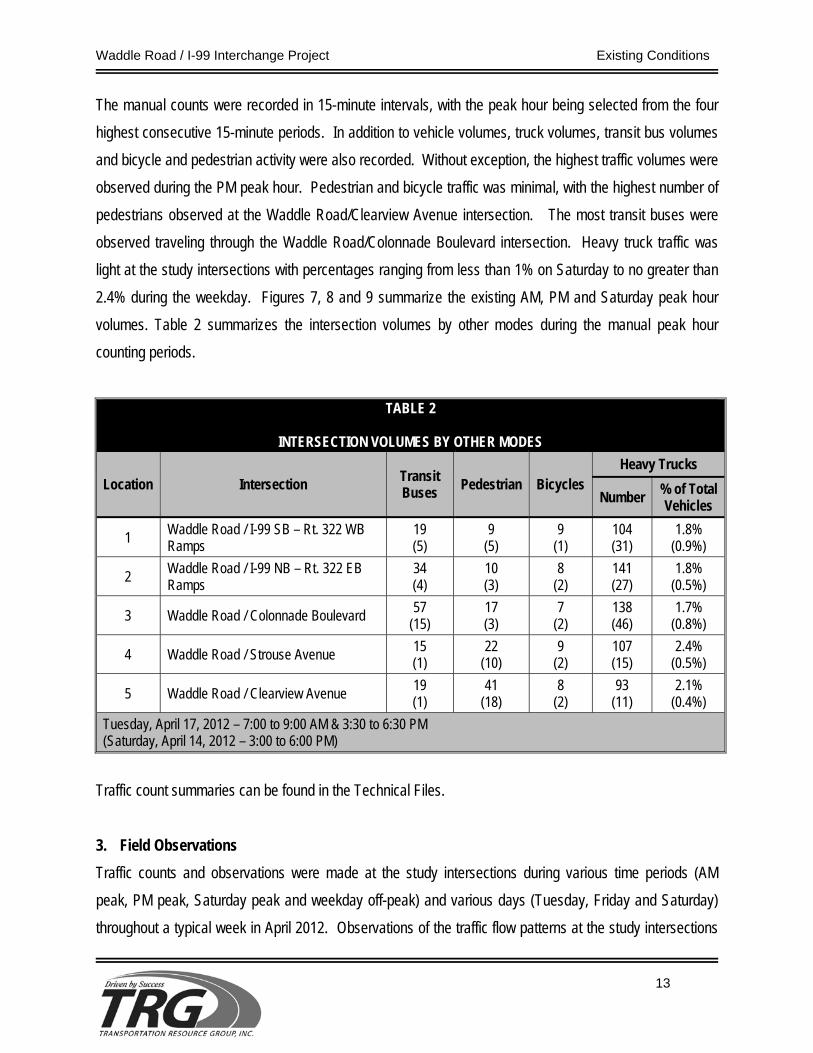
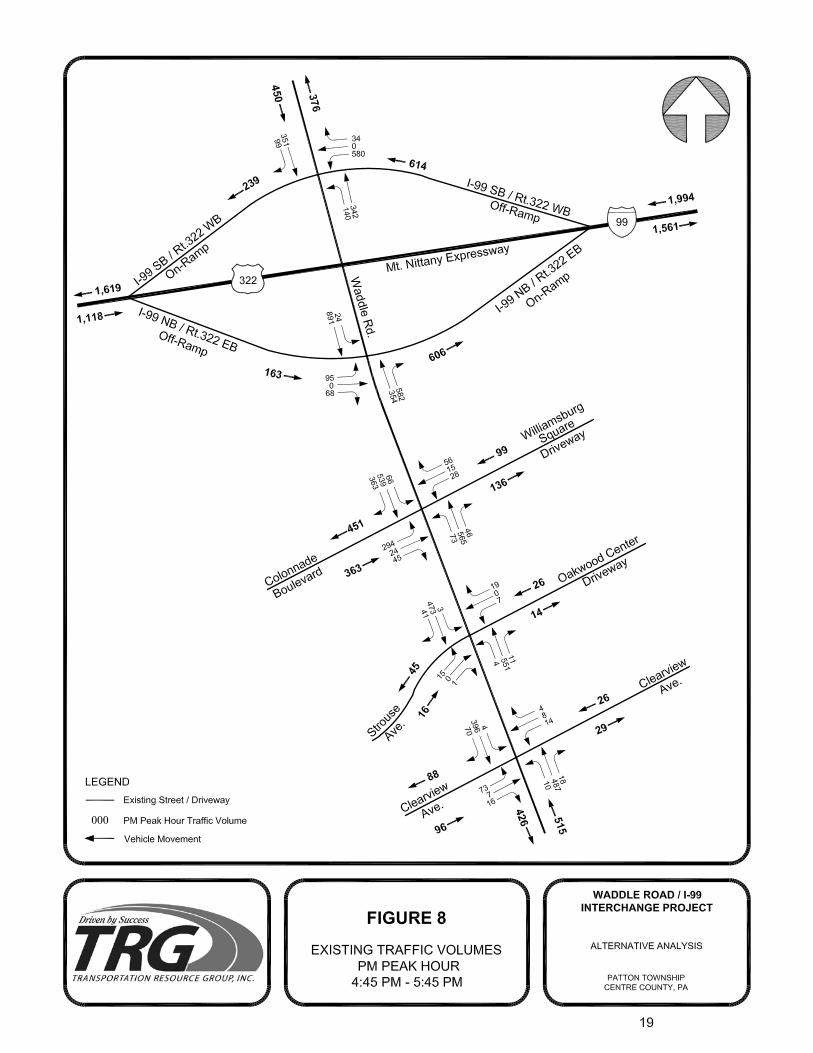
The manual counts were recorded in 15-minute intervals, with the peak hour being selected from the four highest consecutive 15-minute periods. In addition to vehicle volumes, truck volumes, transit bus volumes and bicycle and pedestrian activity were also recorded. Without exception, the highest traffic volumes were observed during the PM peak hour. Pedestrian and bicycle traffic was minimal, with the highest number of pedestrians observed at the Waddle Road/Clearview Avenue intersection. The most transit buses were observed traveling through the Waddle Road/Colonnade Boulevard intersection. Heavy truck traffic was light at the study intersections with percentages ranging from less than 1% on Saturday to no greater than 2.4% during the weekday. Figures 7, 8 and 9 summarize the existing AM, PM and Saturday peak hour volumes. Table 2 summarizes the intersection volumes by other modes during the manual peak hour counting periods.
TABLE 2
INTERSECTION VOLUMES BY OTHER MODES
Location Intersection Transit Buses Pedestrian Bicycles
Heavy Trucks
Number % of Total Vehicles
1 Waddle Road / I-99 SB – Rt. 322 WB Ramps
19 (5)
9 (5)
9 (1)
104 (31)
1.8% (0.9%)
2 Waddle Road / I-99 NB – Rt. 322 EB Ramps
34 (4)
10 (3)
8 (2)
141 (27)
1.8% (0.5%)
3 Waddle Road / Colonnade Boulevard 57 (15)
17 (3)
7 (2)
138 (46)
1.7% (0.8%)
4 Waddle Road / Strouse Avenue 15 (1)
22 (10)
9 (2)
107 (15)
2.4% (0.5%)
5 Waddle Road / Clearview Avenue 19 (1)
41 (18)
8 (2)
93 (11)
2.1% (0.4%)
Tuesday, April 17, 2012 – 7:00 to 9:00 AM & 3:30 to 6:30 PM (Saturday, April 14, 2012 – 3:00 to 6:00 PM)
Traffic count summaries can be found in the Technical Files. 3. Field Observations Traffic counts and observations were made at the study intersections during various time periods (AM peak, PM peak, Saturday peak and weekday off-peak) and various days (Tuesday, Friday and Saturday) throughout a typical week in April 2012. Observations of the traffic flow patterns at the study intersections
Waddle Road / I-99 Interchange Project Existing Conditions
14
can help determine how, when, and why reoccurring traffic congestion occurs. These observations are also critical in helping utilize traffic operations for modeling purposes and testing to evaluate early action improvement scenarios to improve traffic flow along the corridor. Some of the significant observations related to traffic flow, occurring within the study area include:
• Of the five study intersections, the Waddle Road / I-99 SB – Route 322 WB on-off ramp intersection experiences the greatest congestion.
• The longest queues observed for the westbound off-ramp and the times it occurred
follow: • AM Peak – 15 vehicles (7:45 – 8:00 AM) • PM Peak – 20 vehicles (4:40 – 5:10 PM) • Friday – Approximately 50 vehicles (4:45 – 5:45 PM) • Saturday – 35 vehicles (5:25 – 5:35 PM) Specifically on Friday, the queues on the ramp get so long that the traffic gets close to impeding on the mainline I-99 traffic. Based on ATR count data, Friday peak hour traffic volumes are over 20 percent higher than the typical weekday.
• Surplus green time was observed on the Waddle Road approaches at this intersection. During all peak hours, there would generally be an additional 15 seconds of mainline green time on Waddle Road after all traffic had cleared. The westbound off-ramp would continue to queue during this time.
• Generally, all vehicles queued on the westbound off-ramp would make it through the
signal on green except during the Friday peak hour and during isolated times during the weekday PM peak hour and the Saturday peak hour. A maximum of 25-27 vehicles on the ramp are able to make it through the green phase.
• The downstream queue for traffic headed southbound on Waddle Road and stopped
at the Waddle Road / I-99 NB – Route 322 EB on-off ramp intersection impacted the ability of vehicles making a left turn from the I-99 SB ramp to remain free flowing.
• At the Waddle Road / I-99 NB – Route 322 EB on-off ramp intersection, traffic was
observed to flow efficiently with insignificant queuing on the ramp and northbound approaches. However, on Friday from 5:15 to 5:45 and at isolated times during the weekday PM and Saturday peaks, the southbound approach would back up to the I-99 SB ramp intersection.
• At the Waddle Road / Colonnade Boulevard intersection traffic generally progresses well,
although there are some significant observations related to vehicular queuing:
Waddle Road / I-99 Interchange Project Existing Conditions
15
a. The longest queue NB on Waddle Road was 29 vehicles which occurred between 4:45 PM and 5:00 on Friday, and averaged about 20 vehicles during the Friday field observations. The northbound queue would block the unsignalized driveway to the south of the intersection.
b. The longest queue southbound on Waddle Road was 12-14 vehicles which occurred
consistently throughout the Friday field observations (4:30 – 6:00 PM).
c. The longest queues for the entire intersection occurred between 4:45 to 5:45 PM on Friday.
d. Downstream traffic backups never impacted the flow of traffic at this intersection.
• No critical operational concerns were observed at the Waddle Road intersections with
Strouse Avenue or Clearview Avenue. In general, the field observations showed that the coordinated traffic signal cycle length may be too long. Reallocation of green percentage times and adjustment to offsets would improve the study intersections, particularly at the Waddle Road / I-99 SB – Route 322 WB on-off ramp intersection.
Waddle Road / I-99 Interchange Project Existing Conditions
17


Waddle Road / I-99 Interchange Project Existing Conditions
21
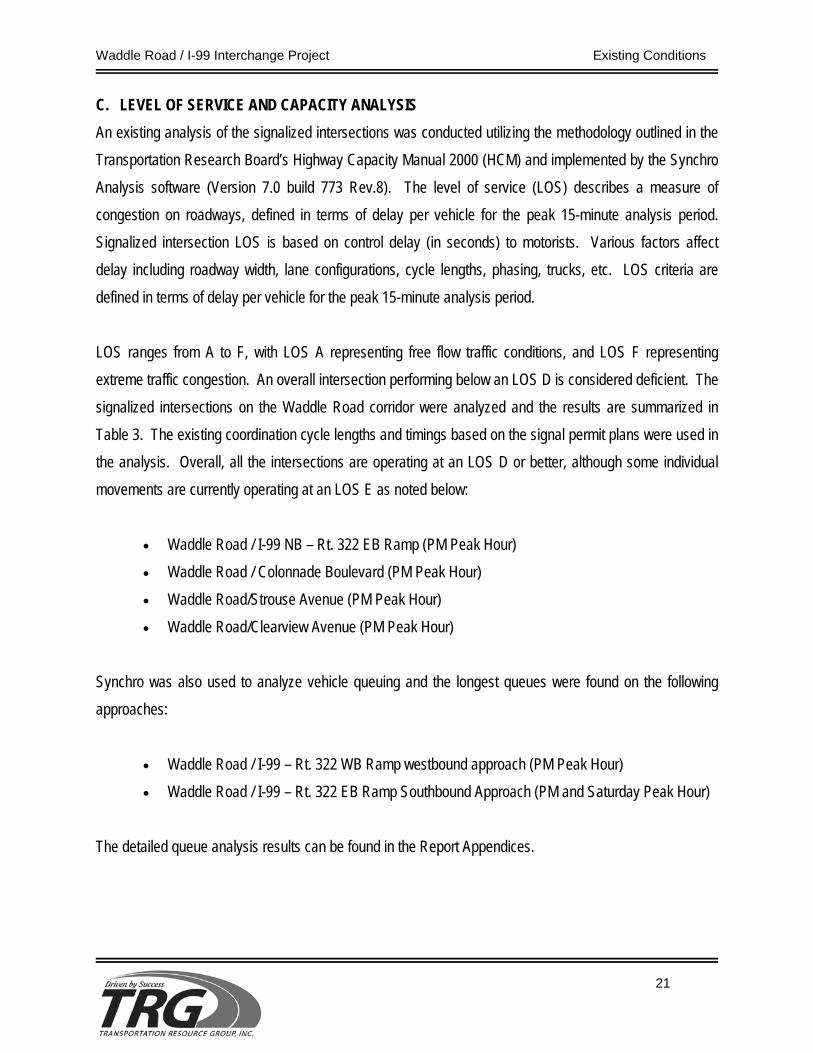
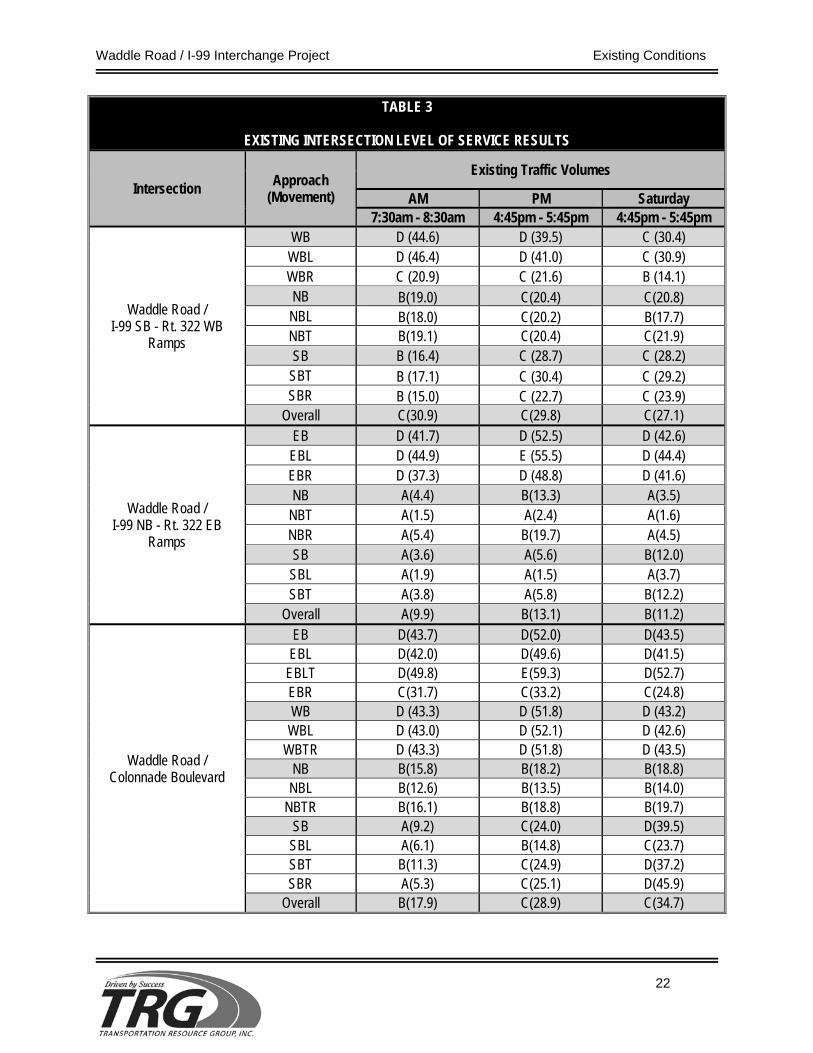
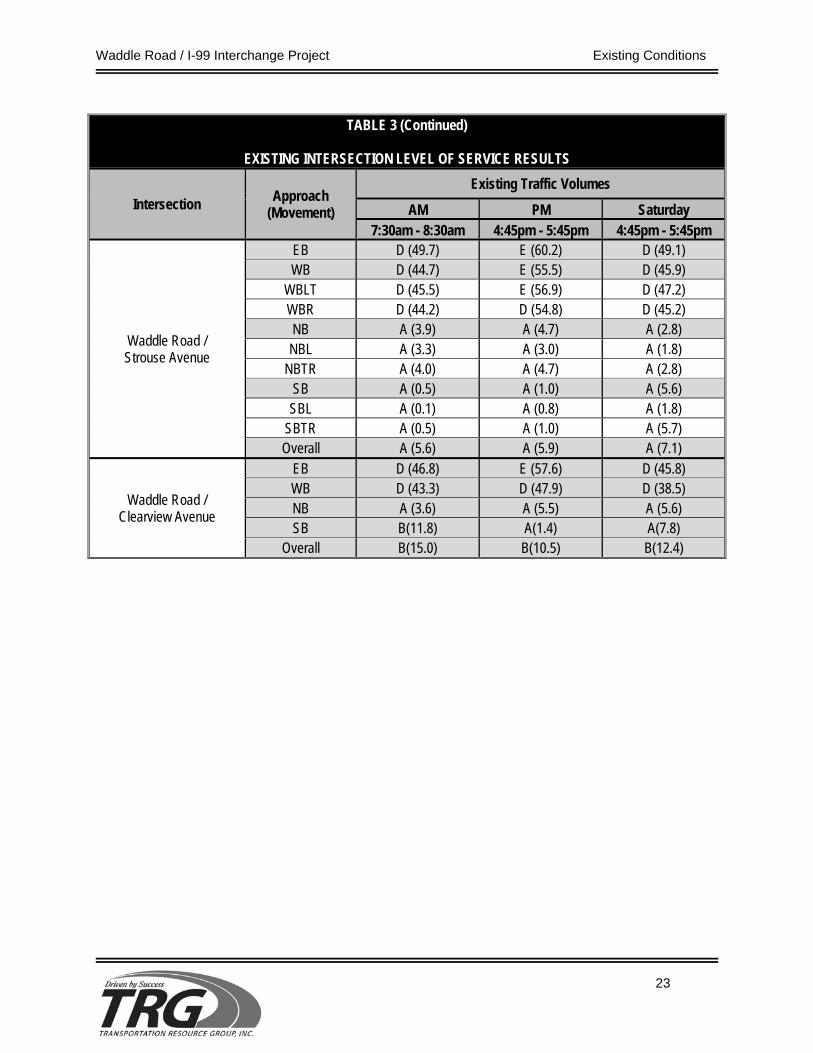
C. LEVEL OF SERVICE AND CAPACITY ANALYSIS An existing analysis of the signalized intersections was conducted utilizing the methodology outlined in the Transportation Research Board’s Highway Capacity Manual 2000 (HCM) and implemented by the Synchro Analysis software (Version 7.0 build 773 Rev.8). The level of service (LOS) describes a measure of congestion on roadways, defined in terms of delay per vehicle for the peak 15-minute analysis period. Signalized intersection LOS is based on control delay (in seconds) to motorists. Various factors affect delay including roadway width, lane configurations, cycle lengths, phasing, trucks, etc. LOS criteria are defined in terms of delay per vehicle for the peak 15-minute analysis period. LOS ranges from A to F, with LOS A representing free flow traffic conditions, and LOS F representing extreme traffic congestion. An overall intersection performing below an LOS D is considered deficient. The signalized intersections on the Waddle Road corridor were analyzed and the results are summarized in Table 3. The existing coordination cycle lengths and timings based on the signal permit plans were used in the analysis. Overall, all the intersections are operating at an LOS D or better, although some individual movements are currently operating at an LOS E as noted below:
• Waddle Road / I-99 NB – Rt. 322 EB Ramp (PM Peak Hour) • Waddle Road / Colonnade Boulevard (PM Peak Hour) • Waddle Road/Strouse Avenue (PM Peak Hour) • Waddle Road/Clearview Avenue (PM Peak Hour)
Synchro was also used to analyze vehicle queuing and the longest queues were found on the following approaches:
• Waddle Road / I-99 – Rt. 322 WB Ramp westbound approach (PM Peak Hour) • Waddle Road / I-99 – Rt. 322 EB Ramp Southbound Approach (PM and Saturday Peak Hour)
The detailed queue analysis results can be found in the Report Appendices.
Waddle Road / I-99 Interchange Project Existing Conditions
22
TABLE 3
EXISTING INTERSECTION LEVEL OF SERVICE RESULTS
Intersection Approach (Movement)
Existing Traffic Volumes
AM PM Saturday 7:30am - 8:30am 4:45pm - 5:45pm 4:45pm - 5:45pm
Waddle Road / I-99 SB - Rt. 322 WB
Ramps
WB D (44.6) D (39.5) C (30.4) WBL D (46.4) D (41.0) C (30.9) WBR C (20.9) C (21.6) B (14.1) NB B(19.0) C(20.4) C(20.8) NBL B(18.0) C(20.2) B(17.7) NBT B(19.1) C(20.4) C(21.9) SB B (16.4) C (28.7) C (28.2)
SBT B (17.1) C (30.4) C (29.2) SBR B (15.0) C (22.7) C (23.9)
Overall C(30.9) C(29.8) C(27.1)
Waddle Road / I-99 NB - Rt. 322 EB
Ramps
EB D (41.7) D (52.5) D (42.6) EBL D (44.9) E (55.5) D (44.4) EBR D (37.3) D (48.8) D (41.6) NB A(4.4) B(13.3) A(3.5)
NBT A(1.5) A(2.4) A(1.6) NBR A(5.4) B(19.7) A(4.5) SB A(3.6) A(5.6) B(12.0) SBL A(1.9) A(1.5) A(3.7) SBT A(3.8) A(5.8) B(12.2)
Overall A(9.9) B(13.1) B(11.2)
Waddle Road / Colonnade Boulevard
EB D(43.7) D(52.0) D(43.5) EBL D(42.0) D(49.6) D(41.5)
EBLT D(49.8) E(59.3) D(52.7) EBR C(31.7) C(33.2) C(24.8) WB D (43.3) D (51.8) D (43.2)
WBL D (43.0) D (52.1) D (42.6) WBTR D (43.3) D (51.8) D (43.5)
NB B(15.8) B(18.2) B(18.8) NBL B(12.6) B(13.5) B(14.0)
NBTR B(16.1) B(18.8) B(19.7) SB A(9.2) C(24.0) D(39.5) SBL A(6.1) B(14.8) C(23.7) SBT B(11.3) C(24.9) D(37.2) SBR A(5.3) C(25.1) D(45.9)
Overall B(17.9) C(28.9) C(34.7)
Waddle Road / I-99 Interchange Project Existing Conditions
23
TABLE 3 (Continued)
EXISTING INTERSECTION LEVEL OF SERVICE RESULTS
Intersection Approach (Movement)
Existing Traffic Volumes
AM PM Saturday 7:30am - 8:30am 4:45pm - 5:45pm 4:45pm - 5:45pm
Waddle Road / Strouse Avenue
EB D (49.7) E (60.2) D (49.1) WB D (44.7) E (55.5) D (45.9)
WBLT D (45.5) E (56.9) D (47.2) WBR D (44.2) D (54.8) D (45.2) NB A (3.9) A (4.7) A (2.8) NBL A (3.3) A (3.0) A (1.8)
NBTR A (4.0) A (4.7) A (2.8) SB A (0.5) A (1.0) A (5.6) SBL A (0.1) A (0.8) A (1.8)
SBTR A (0.5) A (1.0) A (5.7) Overall A (5.6) A (5.9) A (7.1)
Waddle Road / Clearview Avenue
EB D (46.8) E (57.6) D (45.8) WB D (43.3) D (47.9) D (38.5) NB A (3.6) A (5.5) A (5.6) SB B(11.8) A(1.4) A(7.8)
Overall B(15.0) B(10.5) B(12.4)
Waddle Road / I-99 Interchange Project Existing Conditions
24
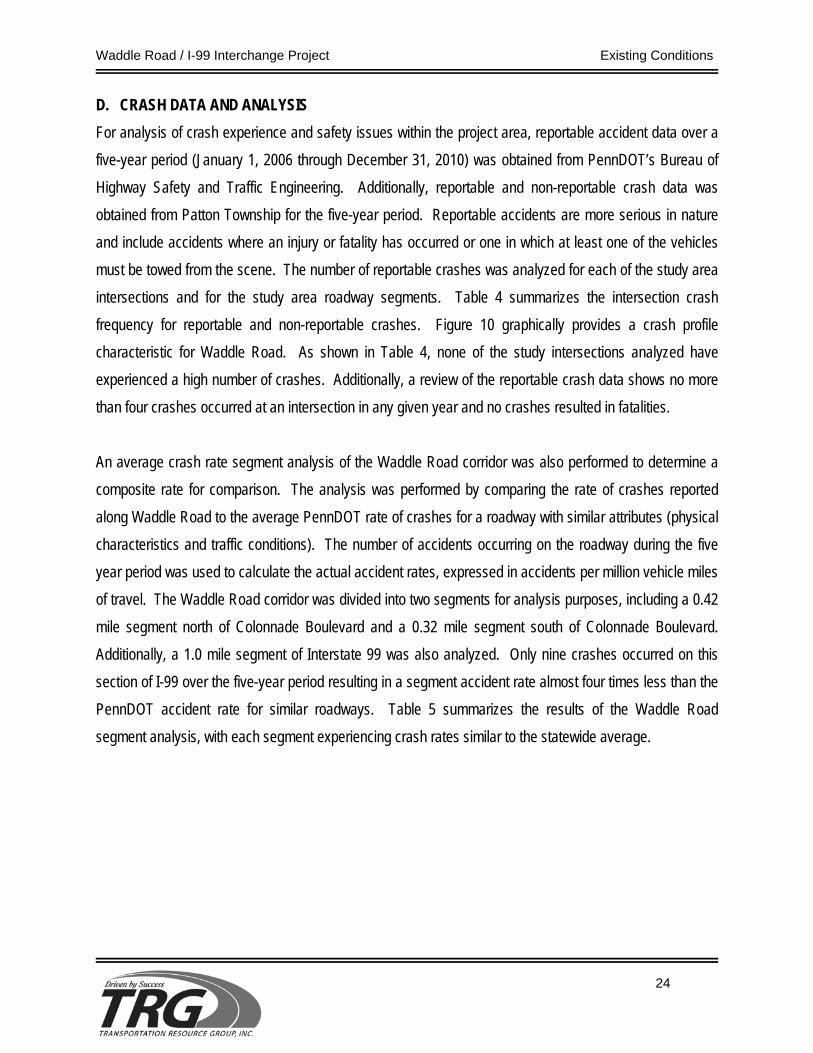
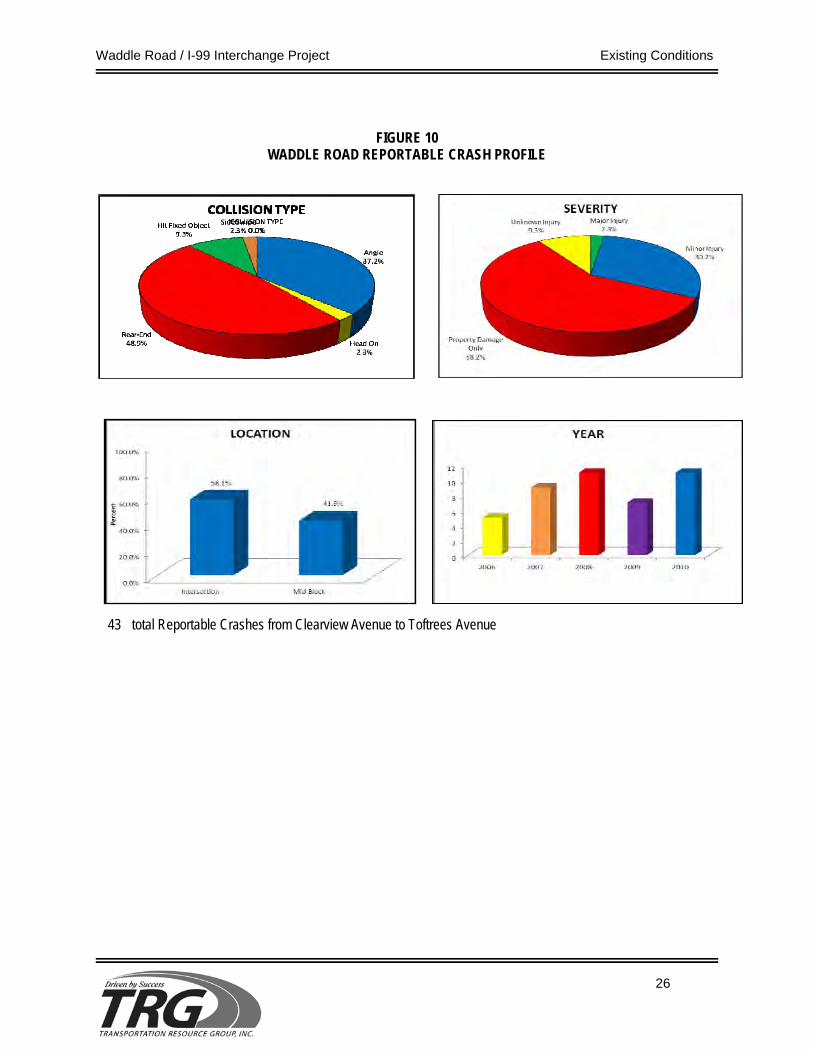
D. CRASH DATA AND ANALYSIS For analysis of crash experience and safety issues within the project area, reportable accident data over a five-year period (January 1, 2006 through December 31, 2010) was obtained from PennDOT’s Bureau of Highway Safety and Traffic Engineering. Additionally, reportable and non-reportable crash data was obtained from Patton Township for the five-year period. Reportable accidents are more serious in nature and include accidents where an injury or fatality has occurred or one in which at least one of the vehicles must be towed from the scene. The number of reportable crashes was analyzed for each of the study area intersections and for the study area roadway segments. Table 4 summarizes the intersection crash frequency for reportable and non-reportable crashes. Figure 10 graphically provides a crash profile characteristic for Waddle Road. As shown in Table 4, none of the study intersections analyzed have experienced a high number of crashes. Additionally, a review of the reportable crash data shows no more than four crashes occurred at an intersection in any given year and no crashes resulted in fatalities. An average crash rate segment analysis of the Waddle Road corridor was also performed to determine a composite rate for comparison. The analysis was performed by comparing the rate of crashes reported along Waddle Road to the average PennDOT rate of crashes for a roadway with similar attributes (physical characteristics and traffic conditions). The number of accidents occurring on the roadway during the five year period was used to calculate the actual accident rates, expressed in accidents per million vehicle miles of travel. The Waddle Road corridor was divided into two segments for analysis purposes, including a 0.42 mile segment north of Colonnade Boulevard and a 0.32 mile segment south of Colonnade Boulevard. Additionally, a 1.0 mile segment of Interstate 99 was also analyzed. Only nine crashes occurred on this section of I-99 over the five-year period resulting in a segment accident rate almost four times less than the PennDOT accident rate for similar roadways. Table 5 summarizes the results of the Waddle Road segment analysis, with each segment experiencing crash rates similar to the statewide average.
Waddle Road / I-99 Interchange Project Existing Conditions
25
TABLE 4
INTERSECTION CRASH FREQUENCY
REPORTABLE AND NON-REPORTABLE CRASHES (2006-2010)
Location Intersection Reportable Non-Reportable Total
1 Waddle Road / I-99 SB – Rt. 322 WB Ramps 9 8 17
2 Waddle Road / I-99 NB – Rt. 322 EB Ramps 5 8 13
3 Waddle Road / Colonnade Boulevard 7 14 21 4 Waddle Road / Strouse Avenue 0 0 0
5 Waddle Road / Clearview Avenue 4 4 8
TOTAL 25 34 59
TABLE 5
WADDLE ROAD SEGMENT CRASH RATE ANALYSIS (2006-2010)
Segment Location Roadway Type
Roadway Width
Segment Length
(mi.) AADT1
Total Accidents/
5 years2
Actual Rate
Statewide Average
Rate Comment
1 North of Colonnade Blvd
Urban/ NFAC/
Undivided 44’-78’ 0.42 18,312 32 2.27 2.28 Average
2 South of Colonnade Blvd
Urban/ NFAC/
Undivided 24’-37’ 0.32 10,769 11 1.82 1.75 Average
1 Based on ATR counts conducted in April 2012 and adjusted per PennDOT’s Bureau of Planning and Research 2010 Pennsylvania Traffic 2 Based on PennDOT reportable crash data from 2006-2010
Waddle Road / I-99 Interchange Project Existing Conditions
26
FIGURE 10 WADDLE ROAD REPORTABLE CRASH PROFILE
43 total Reportable Crashes from Clearview Avenue to Toftrees Avenue
Waddle Road / I-99 Interchange Project Short Term / Early Action Improvements
27
III. SHORT TERM / EARLY ACTION IMPROVEMENTS During the scoping of this project, Patton Township expressed interest in the consultant design team developing short term “early action” improvements which would be cost effective and relatively easy to implement, and would provide an immediate, positive impact to the daily reoccurring congestion along the corridor. Upon completion of the comprehensive evaluation of existing conditions and after numerous field views and discussions with Township and PennDOT officials, it was agreed that some preliminary projects should be studied and possibly initiated prior to the long term improvements which could evolve from this project. These improvements to be evaluated were categorized as Early Action Improvements. The analysis independently evaluated these improvements to determine if any low-cost solutions could be implemented to provide an immediate positive impact. A. Potential Improvements During the preliminary project development process, the consultant design team identified possible early action type projects, including:
• Ramp pre-emption
• Optimization of timings and phasing for the Waddle Road Corridor
• Restriping of Waddle Road to optimize available storage space on the bridge
• Investigating adaptive traffic signal control (i.e. – InSync)
During the June 2012 Status Meeting, with the results of the existing conditions analysis in hand, the Township decided to consider low-cost signal timing improvements and possible ramp pre-emption for the Early Action Improvements. As a follow up to the Status Meeting, Patton Township also noted that the Waddle Road corridor experiences extreme congestion during Black Friday shopping hours on an annual basis. Colonnade Boulevard is a regional shopping destination which attracts a high level of concentrated congestion due to the tremendous retail success of stores such as Kohl’s, Target, Dick’s Sporting Goods, Wegmans, Cracker Barrel and several other restaurants. Additionally, a Wal-Mart Super Center is located just south of the study area on Waddle Road. The Township questioned if improvements could be implemented to compensate for the Black Friday traffic rush.
Waddle Road / I-99 Interchange Project Short Term / Early Action Improvements
28
B. Analysis Methodology Various options were brainstormed during the traffic study process to determine their effectiveness as an early action candidate project for the Waddle Road corridor. In order to conduct the qualitative assessment, the manual turning movement counts (TMC) and automatic traffic recorder (ATR) counts from the preliminary traffic task were utilized. Based on observations and ATR counts, the Friday peak hour was a critical peak hour period. To account for the Friday peak hour traffic volumes, the weekday PM peak hour manual traffic volumes were factored up by 20% to represent the Friday peak hour. The 20% increase was based on the ATR counts comparison between the PM peak hour and the Friday peak hour. Synchro and SimTraffic 7 were utilized to evaluate both existing and early action improvement scenarios for level of service and queue evaluation. The improvements were evaluated for existing conditions and traffic volumes and were analyzed independent of any long-term improvements. C. Evaluation of Improvements The early action development process consists of low cost short term improvements which can be quickly and economically implemented to provide capacity and safety improvements for the Waddle Road Corridor. In cooperation with Patton Township and the consultant design team, five Early Action Improvements were identified and a detailed analysis was undertaken.
1. Reduce the Cycle Lengths Issue: From field observations, it appears the traffic signal cycle length which is currently
100 seconds during the AM peak, 120 seconds during the PM peak and 100 seconds during the Saturday mid-day peak is causing inefficiencies along the corridor. After individual movements have cleared out all waiting traffic, the phases remain green for extended time periods. Additionally, longer cycle lengths can lead to longer queuing and stacking. At peak time periods, the corridor experiences extremely long queues at the I-99 Southbound on-off ramp and for the southbound traffic on Waddle Road approaching the I-99 NB on-off ramp.
Improvement: Use Synchro 7 software to optimize the corridor cycle lengths. The results are
noted below: • AM Peak – 90 seconds • PM Peak – 85 seconds • Friday Peak – 110 seconds • Saturday Peak – 85 seconds
Waddle Road / I-99 Interchange Project Short Term / Early Action Improvements
29
While the Synchro optimized cycle lengths are significantly lower than the current cycle lengths, just reducing the cycle lengths by more than 10 seconds provides a noticeable improvement.
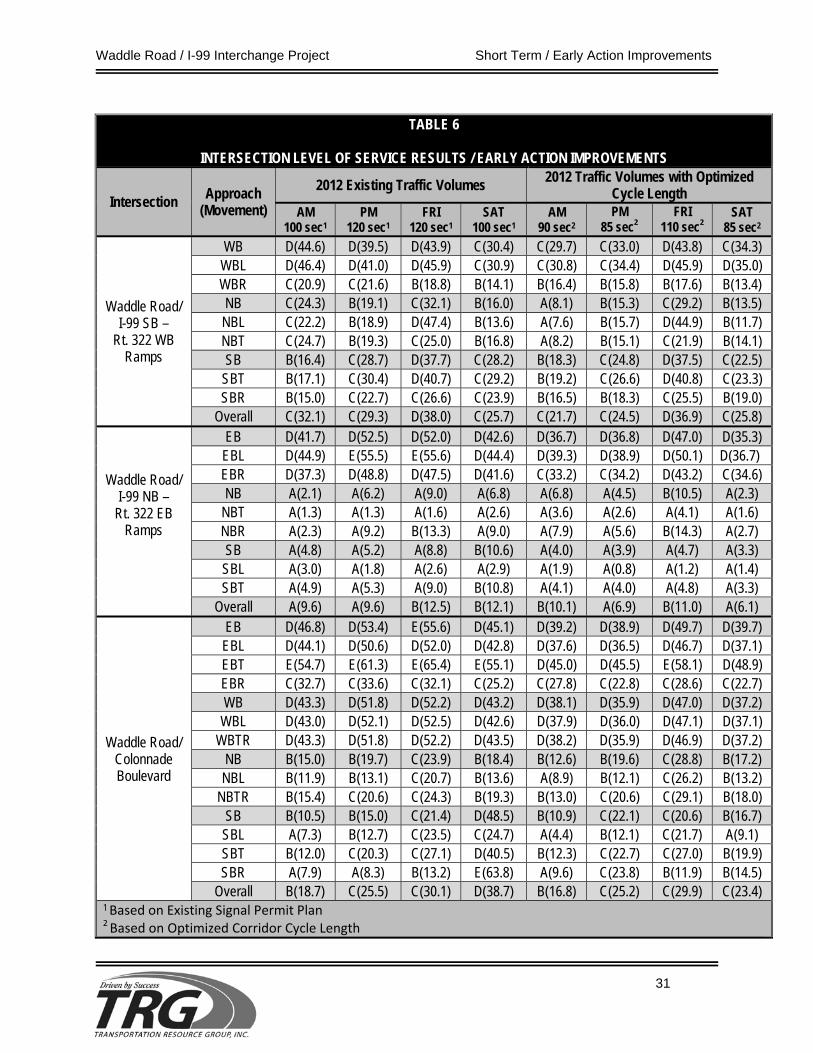
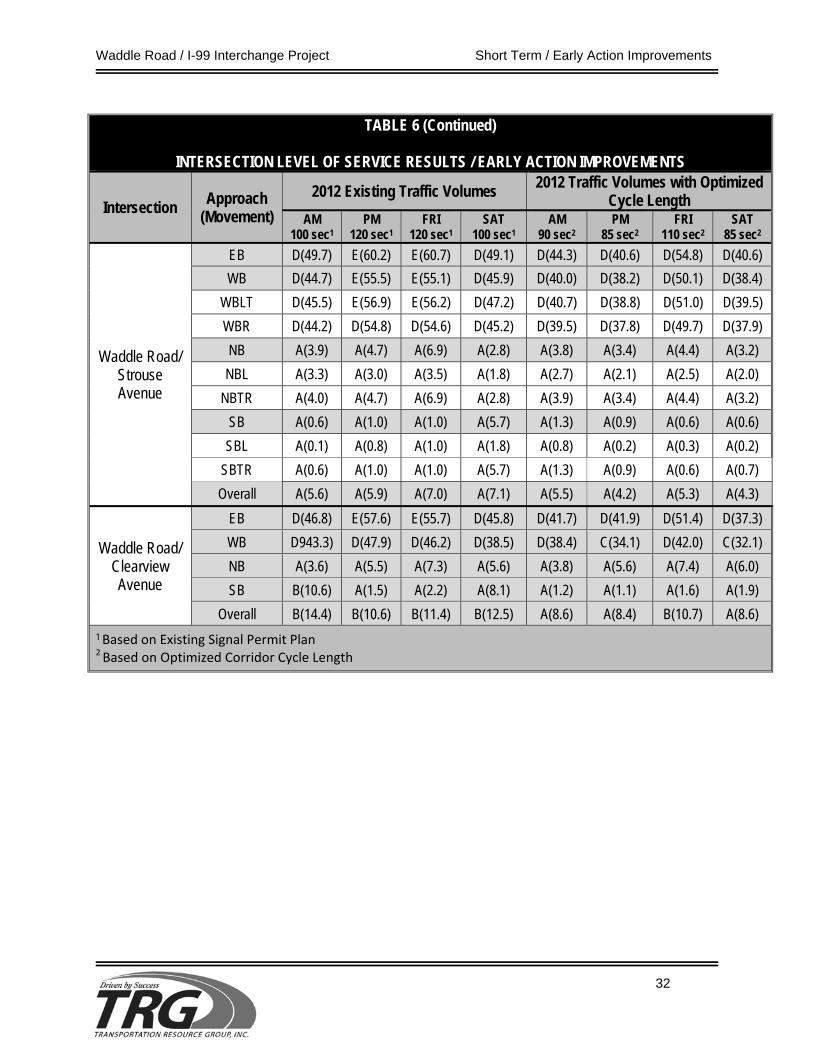
Benefit: As shown in Table 6, the level of service should improve significantly at the key
intersections with optimized cycle lengths. The queue analysis is summarized in the Appendices. Both congestion and delay should be reduced, and safety should be improved with shorter queues.
2. Reallocate Traffic Signal Timings Between Phases/Adjust Offsets Issue: As noted previously, timings at individual intersections do not appear to operate at
the optimal percentages when evaluating each movement. With the change in cycle length, Synchro will also optimize the allocation of the phase times.
Improvement: Use Synchro 7 software to optimize the corridor phase lengths and allocations of
green time. Benefit: As shown in Table 6, the levels of service improve significantly at the key areas of
congestion with the cycle length and phases optimized. Improvement is also shown in the queue analysis which is summarized in the Report Appendices. Both congestion and delay should be reduced and safety should be improved with shorter queues.
3. Add a Friday Coordination Event Issue: From actual daily hourly traffic volume data and field observations, Friday appears
to be the critical day and peak hour. On an average, traffic volumes for Friday are 20 percent higher resulting in more congestion and queuing on the I-99 SB–Route 322 WB on-off ramp.
Improvement: Add a Friday Peak Hour Event to the coordination plan. Benefit: A Friday Peak Hour Event will provide the necessary signal timings to
accommodate the higher volumes and the surge of traffic that occurs at times. Both congestion and delay should be reduced and safety should be improved with shorter queues. Refer to Table 6 for the Friday level of service results and refer to the Report Appendices for the queue results.
4. Adjust Black Friday/Flash Mode Operation for the I-99/Route 322 Ramps Issue: Patton Township has expressed that there are queue issues on the I-99 SB-Route
322 WB on-off ramp at Waddle Road during the Black Friday events and other special events. The queues on the I-99 SB-Route 322 WB on-off ramp are anticipated to be long during the special events (i.e. Black Friday) and the Township has concerns that the queues extend back onto the mainline I-99 SB /
Waddle Road / I-99 Interchange Project Short Term / Early Action Improvements
30
S.R. 322 WB. The signal permit currently shows the signal operating on “Flash” mode from midnight to 6:00 AM on Friday mornings, which is when most motorists are arriving for the Black Friday Events. Also, while the signal system is capable of adding a Black Friday Special Event, it would be challenging to develop the signal timing plan without actual volumes. The practice of having a Black Friday Event is very limited in Pennsylvania and always requires field adjustments.
Improvement: Remove the signal from “Flash” mode for the Black Friday event and put the
Waddle Road corridor into “Free” mode from midnight to 6:00 AM on Black Friday that allocates more green time to the ramp. (Consideration should also be made to eliminate the “Flash” mode altogether.) Also, recording actual Black Friday traffic volumes will be useful in addressing this issue in the future if desired by the Township.
Benefit: Removing the signal from “Flash” mode during the Black Friday event and putting
the signal corridor into “Free” mode for the Waddle Road corridor will help reduce the congestion in the area. Consideration should be given to having manual override at the I-99 SB – Route 322 WB ramp signal since the hours and traffic volumes for a Black Friday are unknown.
5. Install Ramp Pre-emption to Eliminate Queues Extending Onto Mainline I-99
Issue: Based on observations during peak time periods, excessive queuing is sometimes
present at the Waddle Road / I-99 SB – Route 322 WB off ramp. At times the queues approach the I-99 mainline resulting in a potential safety condition.
Improvement: Install ramp pre-emption on the I-99 SB – Route 322 WB off ramp to ensure
queuing does not extend onto mainline I-99 during all traffic conditions and events.
Benefit: Safety should be improved by eliminating the mixing of high speeds of an interstate highway (I-99) with ramp congested traffic which backs up onto I-99 mainline which can be a potential hazardous mix. By installing ramp pre-emption, long ramp queues can be given extended green times to avoid traffic spillover onto mainline I-99.
Waddle Road / I-99 Interchange Project Short Term / Early Action Improvements
31
TABLE 6
INTERSECTION LEVEL OF SERVICE RESULTS / EARLY ACTION IMPROVEMENTS
Intersection Approach (Movement)
2012 Existing Traffic Volumes 2012 Traffic Volumes with Optimized Cycle Length
AM 100 sec1
PM 120 sec1
FRI 120 sec1
SAT 100 sec1
AM 90 sec2
PM 85 sec2
FRI 110 sec2
SAT 85 sec2
Waddle Road/ I-99 SB –
Rt. 322 WB Ramps
WB D(44.6) D(39.5) D(43.9) C(30.4) C(29.7) C(33.0) D(43.8) C(34.3) WBL D(46.4) D(41.0) D(45.9) C(30.9) C(30.8) C(34.4) D(45.9) D(35.0) WBR C(20.9) C(21.6) B(18.8) B(14.1) B(16.4) B(15.8) B(17.6) B(13.4) NB C(24.3) B(19.1) C(32.1) B(16.0) A(8.1) B(15.3) C(29.2) B(13.5) NBL C(22.2) B(18.9) D(47.4) B(13.6) A(7.6) B(15.7) D(44.9) B(11.7) NBT C(24.7) B(19.3) C(25.0) B(16.8) A(8.2) B(15.1) C(21.9) B(14.1) SB B(16.4) C(28.7) D(37.7) C(28.2) B(18.3) C(24.8) D(37.5) C(22.5)
SBT B(17.1) C(30.4) D(40.7) C(29.2) B(19.2) C(26.6) D(40.8) C(23.3) SBR B(15.0) C(22.7) C(26.6) C(23.9) B(16.5) B(18.3) C(25.5) B(19.0)
Overall C(32.1) C(29.3) D(38.0) C(25.7) C(21.7) C(24.5) D(36.9) C(25.8)
Waddle Road/ I-99 NB –
Rt. 322 EB Ramps
EB D(41.7) D(52.5) D(52.0) D(42.6) D(36.7) D(36.8) D(47.0) D(35.3) EBL D(44.9) E(55.5) E(55.6) D(44.4) D(39.3) D(38.9) D(50.1) D(36.7) EBR D(37.3) D(48.8) D(47.5) D(41.6) C(33.2) C(34.2) D(43.2) C(34.6) NB A(2.1) A(6.2) A(9.0) A(6.8) A(6.8) A(4.5) B(10.5) A(2.3)
NBT A(1.3) A(1.3) A(1.6) A(2.6) A(3.6) A(2.6) A(4.1) A(1.6) NBR A(2.3) A(9.2) B(13.3) A(9.0) A(7.9) A(5.6) B(14.3) A(2.7) SB A(4.8) A(5.2) A(8.8) B(10.6) A(4.0) A(3.9) A(4.7) A(3.3) SBL A(3.0) A(1.8) A(2.6) A(2.9) A(1.9) A(0.8) A(1.2) A(1.4) SBT A(4.9) A(5.3) A(9.0) B(10.8) A(4.1) A(4.0) A(4.8) A(3.3)
Overall A(9.6) A(9.6) B(12.5) B(12.1) B(10.1) A(6.9) B(11.0) A(6.1)
Waddle Road/ Colonnade Boulevard
EB D(46.8) D(53.4) E(55.6) D(45.1) D(39.2) D(38.9) D(49.7) D(39.7) EBL D(44.1) D(50.6) D(52.0) D(42.8) D(37.6) D(36.5) D(46.7) D(37.1) EBT E(54.7) E(61.3) E(65.4) E(55.1) D(45.0) D(45.5) E(58.1) D(48.9) EBR C(32.7) C(33.6) C(32.1) C(25.2) C(27.8) C(22.8) C(28.6) C(22.7) WB D(43.3) D(51.8) D(52.2) D(43.2) D(38.1) D(35.9) D(47.0) D(37.2)
WBL D(43.0) D(52.1) D(52.5) D(42.6) D(37.9) D(36.0) D(47.1) D(37.1) WBTR D(43.3) D(51.8) D(52.2) D(43.5) D(38.2) D(35.9) D(46.9) D(37.2)
NB B(15.0) B(19.7) C(23.9) B(18.4) B(12.6) B(19.6) C(28.8) B(17.2) NBL B(11.9) B(13.1) C(20.7) B(13.6) A(8.9) B(12.1) C(26.2) B(13.2)
NBTR B(15.4) C(20.6) C(24.3) B(19.3) B(13.0) C(20.6) C(29.1) B(18.0) SB B(10.5) B(15.0) C(21.4) D(48.5) B(10.9) C(22.1) C(20.6) B(16.7) SBL A(7.3) B(12.7) C(23.5) C(24.7) A(4.4) B(12.1) C(21.7) A(9.1) SBT B(12.0) C(20.3) C(27.1) D(40.5) B(12.3) C(22.7) C(27.0) B(19.9) SBR A(7.9) A(8.3) B(13.2) E(63.8) A(9.6) C(23.8) B(11.9) B(14.5)
Overall B(18.7) C(25.5) C(30.1) D(38.7) B(16.8) C(25.2) C(29.9) C(23.4) 1 Based on Existing Signal Permit Plan 2 Based on Optimized Corridor Cycle Length
Waddle Road / I-99 Interchange Project Short Term / Early Action Improvements
32
TABLE 6 (Continued)
INTERSECTION LEVEL OF SERVICE RESULTS / EARLY ACTION IMPROVEMENTS
Intersection Approach (Movement)
2012 Existing Traffic Volumes 2012 Traffic Volumes with Optimized Cycle Length
AM 100 sec1
PM 120 sec1
FRI 120 sec1
SAT 100 sec1
AM 90 sec2
PM 85 sec2
FRI 110 sec2
SAT 85 sec2
Waddle Road/ Strouse Avenue
EB D(49.7) E(60.2) E(60.7) D(49.1) D(44.3) D(40.6) D(54.8) D(40.6) WB D(44.7) E(55.5) E(55.1) D(45.9) D(40.0) D(38.2) D(50.1) D(38.4)
WBLT D(45.5) E(56.9) E(56.2) D(47.2) D(40.7) D(38.8) D(51.0) D(39.5) WBR D(44.2) D(54.8) D(54.6) D(45.2) D(39.5) D(37.8) D(49.7) D(37.9) NB A(3.9) A(4.7) A(6.9) A(2.8) A(3.8) A(3.4) A(4.4) A(3.2) NBL A(3.3) A(3.0) A(3.5) A(1.8) A(2.7) A(2.1) A(2.5) A(2.0)
NBTR A(4.0) A(4.7) A(6.9) A(2.8) A(3.9) A(3.4) A(4.4) A(3.2) SB A(0.6) A(1.0) A(1.0) A(5.7) A(1.3) A(0.9) A(0.6) A(0.6) SBL A(0.1) A(0.8) A(1.0) A(1.8) A(0.8) A(0.2) A(0.3) A(0.2)
SBTR A(0.6) A(1.0) A(1.0) A(5.7) A(1.3) A(0.9) A(0.6) A(0.7) Overall A(5.6) A(5.9) A(7.0) A(7.1) A(5.5) A(4.2) A(5.3) A(4.3)
Waddle Road/ Clearview Avenue
EB D(46.8) E(57.6) E(55.7) D(45.8) D(41.7) D(41.9) D(51.4) D(37.3) WB D943.3) D(47.9) D(46.2) D(38.5) D(38.4) C(34.1) D(42.0) C(32.1) NB A(3.6) A(5.5) A(7.3) A(5.6) A(3.8) A(5.6) A(7.4) A(6.0) SB B(10.6) A(1.5) A(2.2) A(8.1) A(1.2) A(1.1) A(1.6) A(1.9)
Overall B(14.4) B(10.6) B(11.4) B(12.5) A(8.6) A(8.4) B(10.7) A(8.6) 1 Based on Existing Signal Permit Plan 2 Based on Optimized Corridor Cycle Length
Waddle Road / I-99 Interchange Project Improvement Alternatives
33
D. Findings As shown in the previous analysis, there are improvements which can be completed early in order to provide some immediate relief to the existing congestion and improve safety on the Waddle Road Corridor interchange ramps. These improvements involve minimal costs and time but are able to provide immediate results until the long-term solution can be implemented. The following improvements are provided for consideration: 1. For an immediate action, implement low-cost signal timing optimization improvements consisting of the
following:
Reducing cycle lengths Adjusting off-sets Reallocating green time between phases Adding a Friday Event to the coordination program Eliminating the I-99/Route 322 Ramp flash mode during Black Friday weekend
The traffic signal permits will need revised and approved by PennDOT. Engineering to produce final design timings will range from $2,000.00 to $3,000.00 with the Township revising the signal permits and implementing the timing changes in the field.
2. Conduct ATR traffic counts during the Black Friday Event weekend to use in the future development of
a Black Friday Coordination Event.
3. Install ramp pre-emption on the I-99 SB / Route 322 WB off Ramp when Township funding is available. Construction costs will range from $10,000.00 to $12,000.00 with a pre-emption loop placed at 1,000 feet from the stop bar. Engineering costs to modify the Interchange and Colonnade Boulevard signal permits are estimated at $3,000.00 to $4,500.00
Once completed, Patton Township should monitor the performance of the recommended early action improvements to ensure the desired effects are taking place. It is very likely that some additional “fine tuning” of the signal timings will be necessary. Upon evaluation, if the lower cost early action tasks do not meet the needs of Patton Township, then further methods such as adaptive traffic signal timing should be considered for the corridor with the Interchange Improvement Alternatives. An adaptive traffic signal timing system eliminates the need for static timing plans by creating dynamic “greens” based on real-time traffic demand. Adaptive traffic signal control would cost approximately $30,000.00 per intersection for the new equipment and installation and would be required at all intersections within the system.
Waddle Road / I-99 Interchange Project Improvement Alternatives – Preliminary Traffic Analysis
34
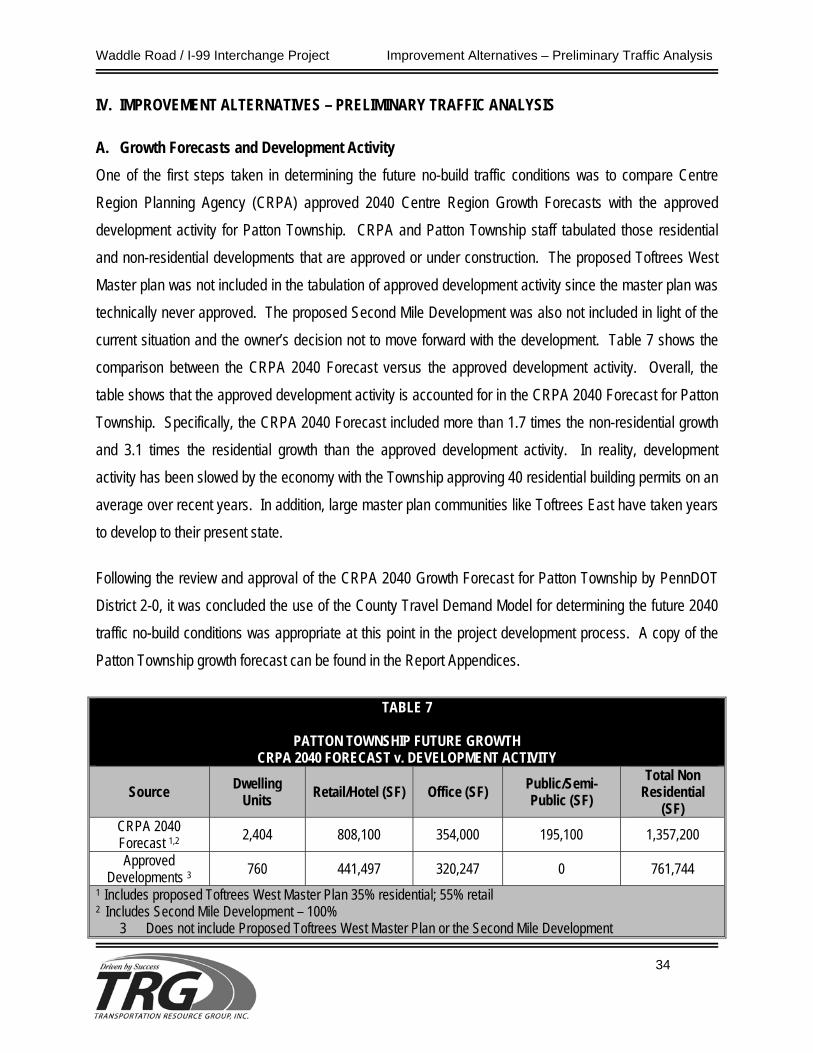
IV. IMPROVEMENT ALTERNATIVES – PRELIMINARY TRAFFIC ANALYSIS A. Growth Forecasts and Development Activity One of the first steps taken in determining the future no-build traffic conditions was to compare Centre Region Planning Agency (CRPA) approved 2040 Centre Region Growth Forecasts with the approved development activity for Patton Township. CRPA and Patton Township staff tabulated those residential and non-residential developments that are approved or under construction. The proposed Toftrees West Master plan was not included in the tabulation of approved development activity since the master plan was technically never approved. The proposed Second Mile Development was also not included in light of the current situation and the owner’s decision not to move forward with the development. Table 7 shows the comparison between the CRPA 2040 Forecast versus the approved development activity. Overall, the table shows that the approved development activity is accounted for in the CRPA 2040 Forecast for Patton Township. Specifically, the CRPA 2040 Forecast included more than 1.7 times the non-residential growth and 3.1 times the residential growth than the approved development activity. In reality, development activity has been slowed by the economy with the Township approving 40 residential building permits on an average over recent years. In addition, large master plan communities like Toftrees East have taken years to develop to their present state.
Following the review and approval of the CRPA 2040 Growth Forecast for Patton Township by PennDOT District 2-0, it was concluded the use of the County Travel Demand Model for determining the future 2040 traffic no-build conditions was appropriate at this point in the project development process. A copy of the Patton Township growth forecast can be found in the Report Appendices.
TABLE 7
PATTON TOWNSHIP FUTURE GROWTH CRPA 2040 FORECAST v. DEVELOPMENT ACTIVITY
Source Dwelling Units Retail/Hotel (SF) Office (SF) Public/Semi-
Public (SF) Total Non
Residential (SF)
CRPA 2040 Forecast 1,2 2,404 808,100 354,000 195,100 1,357,200
Approved Developments 3 760 441,497 320,247 0 761,744
1 Includes proposed Toftrees West Master Plan 35% residential; 55% retail 2 Includes Second Mile Development – 100%
3 Does not include Proposed Toftrees West Master Plan or the Second Mile Development
Waddle Road / I-99 Interchange Project Improvement Alternatives – Preliminary Traffic Analysis
35
B. Centre County Travel Demand Model The Centre County Travel Demand Model (CCTDM) was developed by the Centre Region Planning Agency for use as a tool in transportation planning and air quality evaluation for the Centre County Metropolitan Planning Organization (CCMPO). The CCTDM is a regional, trip-based demand model that is implemented in the Citilabs CUBE TP Plus software platform. A four-step modeling process is used and includes trip generation, trip distribution, mode choice, and trip assignment. The model forecasts passenger car and truck trips, as well as mode shares of travel (highway, transit, carpool, etc.). The model region is divided into 330 traffic analysis zones (TAZs). Each TAZ contains current and projected data used to predict trip generation data. The model’s roadway network represents all state roadways and the significant local roadways. Use of a travel demand model has the following advantages:
1. It is an integral component of the MPO long range planning process.
2. The distribution and assignment of trips are carried out in an integrated network that involves the region’s growth/development activity and improvements to the network.
3. It minimizes the potential bias that may result from using manual trip generation and
distribution procedures.
4. Internal trips are handled by the model rather than relying on the Institute of Transportation Engineers (ITE) limited internal trip information and factors. This often leads to overestimating trip generation and traffic demand.
The preliminary version (September 2012) of the CCTDM had been calibrated and validated according to 2010 daily travel data and 2010 was considered the model’s “base year”. The model output provided the roadway and node network, base year 2010 link ADT and node turning movement volumes. The CCTDM (2010) roadway network, TAZ loading points and model output were reviewed with respect to the project study area intersections. Since the 2010 model output appeared reasonable with the roadway network and TAZ loading points, it was assumed that the original calibration and validation of the CCTDM remained valid and a focused model or sub-area model approach was not necessary for the preliminary evaluation. The 2040 model forecast year includes the CRPA 2040 growth forecasts and the existing plus committed (E+C) roadway network. The committed network represents those improvements on the Transportation Improvement Program (TIP). In the case of Patton Township, the committed network contained only a
Waddle Road / I-99 Interchange Project Improvement Alternatives – Preliminary Traffic Analysis
36
TSM signal improvement project on Atherton Street (Business 322) and no capacity type improvements to the roadway system. While the E+C network was not complete outside the Patton Township area, the CRPA agreed to provide preliminary 2040 forecast runs for use in the project. The model output provided included the E+C network, 2040 link ADT and node turning movement volumes. This would provide the basis for determining the 2040 no-build traffic volumes. C. Traffic Forecasting Methodology and Adjustments Output from the CCTDM provided daily link volumes and node turning movement volumes. To account for limitations in traffic forecasting at the turning movement level of detail, NCHRP Report 255 establishes forecasting procedures that minimize these limitations. The NCHRP Report 255 procedures use the relationships among base year traffic counts and the model volumes (base year and future year) to calculate volume forecasts based on the volume changes observed between the base year model and the future year model runs. Depending on the extent of the volume changes and the original count volumes, different routines are used to calculate the initial peak hour volume forecasts. The initial peak hour volume forecasts were checked for both a corridor and intersection basis and found to be reasonable for the preliminary evaluation of the alternatives. Minor intersection-to-intersection imbalances were found and adjustments were made.
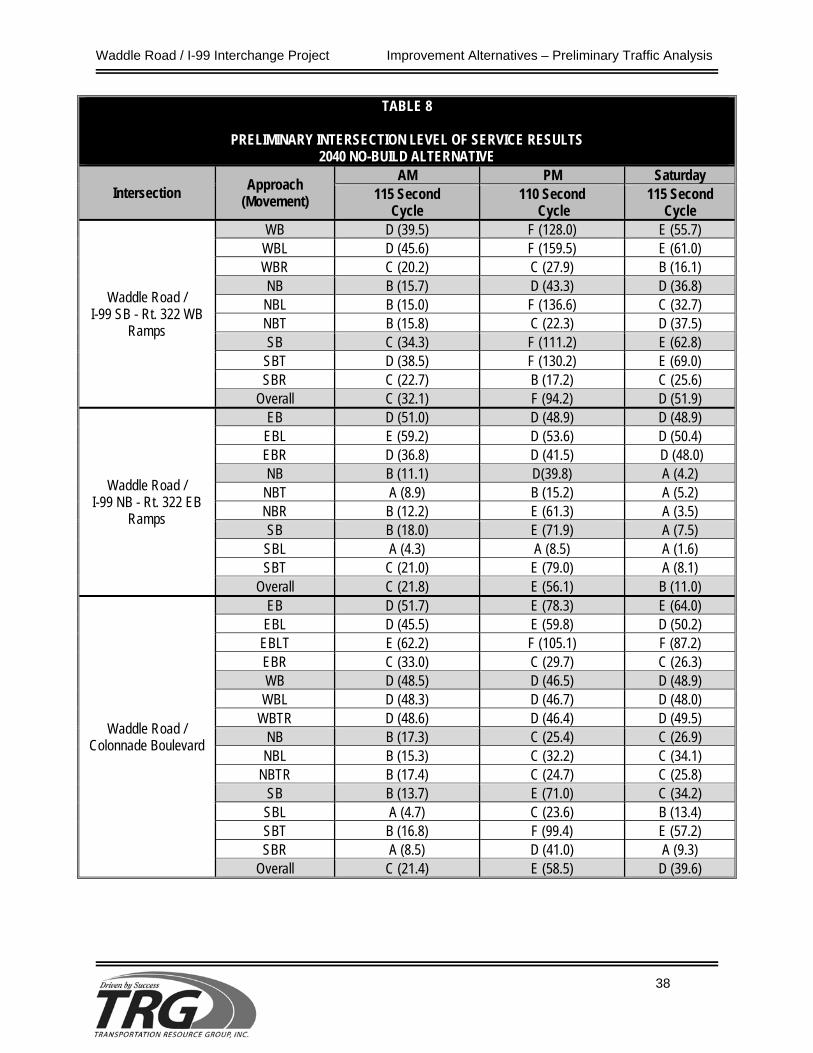
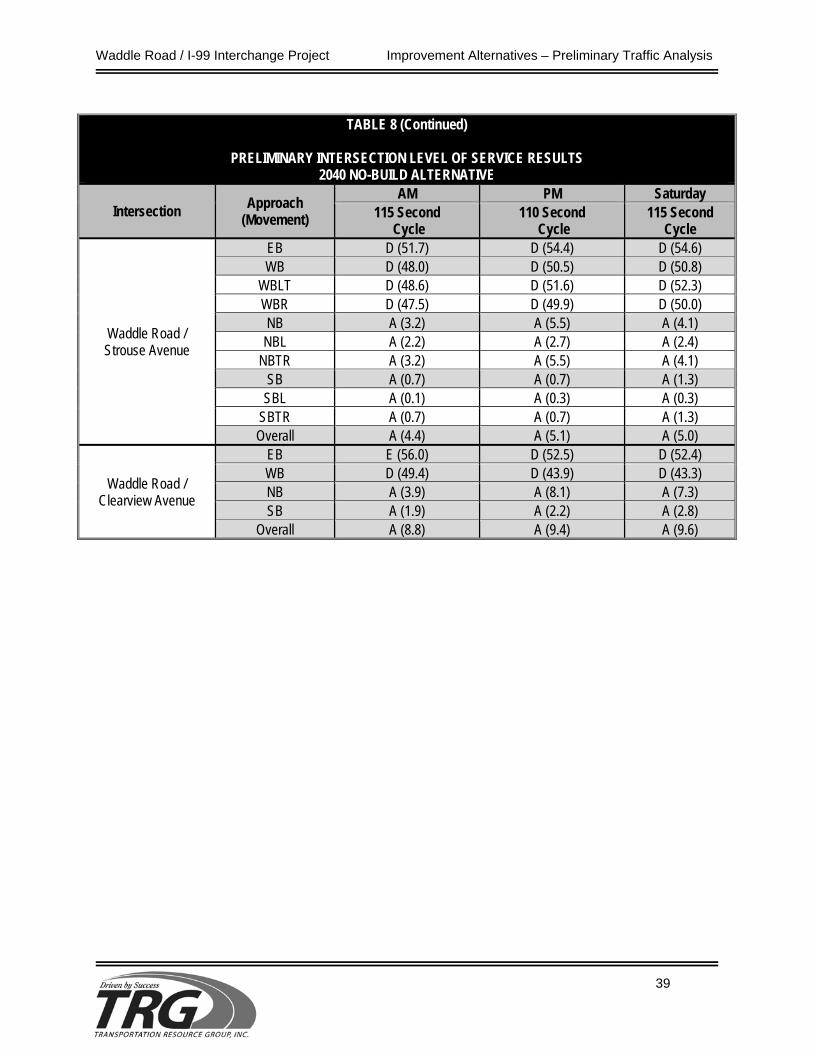
D. 2040 No-Build Traffic Conditions The preliminary AM, PM and Saturday peak hour forecast volumes represent the output from this traffic volume forecasting methodology. For this project, the 2040 No-Build Traffic Volumes represents no capacity type improvement at the Interchange. Waddle Road north of Colonnade Boulevard (Location 1) is forecasted to carry nearly 28,000 daily vehicles during the weekday and just under 33,000 daily vehicles for the Friday study period. That same section will carry an average of 2,800 vph during the PM peak hour period and 2,400 vph across the I-99/Rt. 322 bridge. The preliminary 2040 forecasted daily and peak hour design volumes can be found in the Report Appendices. Table 8 summarizes the level of service analysis and capacity results for the Preliminary 2040 no-build conditions. No adjustments were made to the peak hour factors (PHF), although Synchro runs optimized the signal timings and the overall cycle length for the corridor. The Colonnade Boulevard intersection
Waddle Road / I-99 Interchange Project Improvement Alternatives – Preliminary Traffic Analysis
37
continues to drive the length of the signal cycle for the corridor. An overall LOS D and above is considered acceptable. Those intersections which show an overall LOS E or F and are unacceptable are:
• Waddle Road/ I-99 SB – Rt. 322 WB ramp (PM Peak Hour)
• Waddle Road / I-99 NB – Rt. 322 EB ramp (PM Peak Hour)
• Waddle Road/Colonnade Blvd. (PM Peak Hour)
The overall LOS at the Waddle Road intersections with Strouse Avenue and Clearview Avenue improves, operating at an LOS A with the optimization of signal timings and the corridor cycle length. Vehicle queues were also evaluated for the 2040 No-build conditions using Synchro and the optimized signal timings. With the deterioration in the level of service and increased delays, vehicle queues increased significantly for the following approaches:
• Waddle Road/ I-99 SB – Rt. 322 WB ramp and southbound approach (PM and Saturday Peak Hour)
• Waddle Road/Colonnade Blvd southbound approach (PM and Saturday Peak Hour)
The detailed queue analysis results can be found in the Report Appendices.
Waddle Road / I-99 Interchange Project Improvement Alternatives – Preliminary Traffic Analysis
38
TABLE 8
PRELIMINARY INTERSECTION LEVEL OF SERVICE RESULTS 2040 NO-BUILD ALTERNATIVE
Intersection Approach (Movement)
AM PM Saturday 115 Second
Cycle 110 Second
Cycle 115 Second
Cycle
Waddle Road / I-99 SB - Rt. 322 WB
Ramps
WB D (39.5) F (128.0) E (55.7) WBL D (45.6) F (159.5) E (61.0) WBR C (20.2) C (27.9) B (16.1) NB B (15.7) D (43.3) D (36.8)
NBL B (15.0) F (136.6) C (32.7) NBT B (15.8) C (22.3) D (37.5) SB C (34.3) F (111.2) E (62.8)
SBT D (38.5) F (130.2) E (69.0) SBR C (22.7) B (17.2) C (25.6)
Overall C (32.1) F (94.2) D (51.9)
Waddle Road / I-99 NB - Rt. 322 EB
Ramps
EB D (51.0) D (48.9) D (48.9) EBL E (59.2) D (53.6) D (50.4) EBR D (36.8) D (41.5) D (48.0) NB B (11.1) D(39.8) A (4.2)
NBT A (8.9) B (15.2) A (5.2) NBR B (12.2) E (61.3) A (3.5) SB B (18.0) E (71.9) A (7.5)
SBL A (4.3) A (8.5) A (1.6) SBT C (21.0) E (79.0) A (8.1)
Overall C (21.8) E (56.1) B (11.0)
Waddle Road / Colonnade Boulevard
EB D (51.7) E (78.3) E (64.0) EBL D (45.5) E (59.8) D (50.2)
EBLT E (62.2) F (105.1) F (87.2) EBR C (33.0) C (29.7) C (26.3) WB D (48.5) D (46.5) D (48.9)
WBL D (48.3) D (46.7) D (48.0) WBTR D (48.6) D (46.4) D (49.5)
NB B (17.3) C (25.4) C (26.9) NBL B (15.3) C (32.2) C (34.1)
NBTR B (17.4) C (24.7) C (25.8) SB B (13.7) E (71.0) C (34.2)
SBL A (4.7) C (23.6) B (13.4) SBT B (16.8) F (99.4) E (57.2) SBR A (8.5) D (41.0) A (9.3)
Overall C (21.4) E (58.5) D (39.6)
Waddle Road / I-99 Interchange Project Improvement Alternatives – Preliminary Traffic Analysis
39
TABLE 8 (Continued)
PRELIMINARY INTERSECTION LEVEL OF SERVICE RESULTS
2040 NO-BUILD ALTERNATIVE
Intersection Approach (Movement)
AM PM Saturday 115 Second
Cycle 110 Second
Cycle 115 Second
Cycle
Waddle Road / Strouse Avenue
EB D (51.7) D (54.4) D (54.6) WB D (48.0) D (50.5) D (50.8)
WBLT D (48.6) D (51.6) D (52.3) WBR D (47.5) D (49.9) D (50.0) NB A (3.2) A (5.5) A (4.1)
NBL A (2.2) A (2.7) A (2.4) NBTR A (3.2) A (5.5) A (4.1)
SB A (0.7) A (0.7) A (1.3) SBL A (0.1) A (0.3) A (0.3)
SBTR A (0.7) A (0.7) A (1.3) Overall A (4.4) A (5.1) A (5.0)
Waddle Road / Clearview Avenue
EB E (56.0) D (52.5) D (52.4) WB D (49.4) D (43.9) D (43.3) NB A (3.9) A (8.1) A (7.3) SB A (1.9) A (2.2) A (2.8)
Overall A (8.8) A (9.4) A (9.6)

Waddle Road / I-99 Interchange Project Improvement Alternatives – Preliminary Traffic Analysis
40
E. 2040 BUILD CONDITIONS – RANGE OF ALTERNATIVES For the purpose of the traffic analysis, five (5) build alternatives for the interchange were selected for the preliminary evaluation. The evaluation focused on traffic performance of the alternatives with particular emphasis on intersection levels of service and capacity, and vehicle queue results. Specifically, the following interchange build alternatives were considered:
• Conventional Diamond Interchange • Partial Cloverleaf Interchange • Diverging Diamond Interchange (DDI) • Multilane Roundabouts • Single Point Urban Interchange (SPUI)
For the traffic evaluation and comparison of the build alternatives, the no-build 2040 design year preliminary traffic volumes were used in the traffic alternatives evaluation. Due to the preliminary nature of the CCTDM, CRPA did not make special travel model runs for the build alternatives for the preliminary evaluation. While time and funding constraints were a factor, it was felt that the changes to the interchange are “spot improvements” in terms of the overall roadway network and alternate build runs would not produce significantly different results from the no-build 2040 design year volumes. Synchro Version 7.0 (build 773 Rev 8) was utilized in evaluating traffic performance of all the interchange build alternatives except for the multi-lane roundabout. For this alternative, HCM 2010 method is the preferred PennDOT analysis tool. Also, for each build alternative, signal timings were optimized which resulted in a varying cycle length. Table 9 summarizes the overall level of service and delay performance of each build alternative for the AM, PM and Saturday peak hour study periods for the 2040 design year. Detailed level of service and queue results for each alternative can be found in the Report Appendices. A discussion of each build alternative follows.
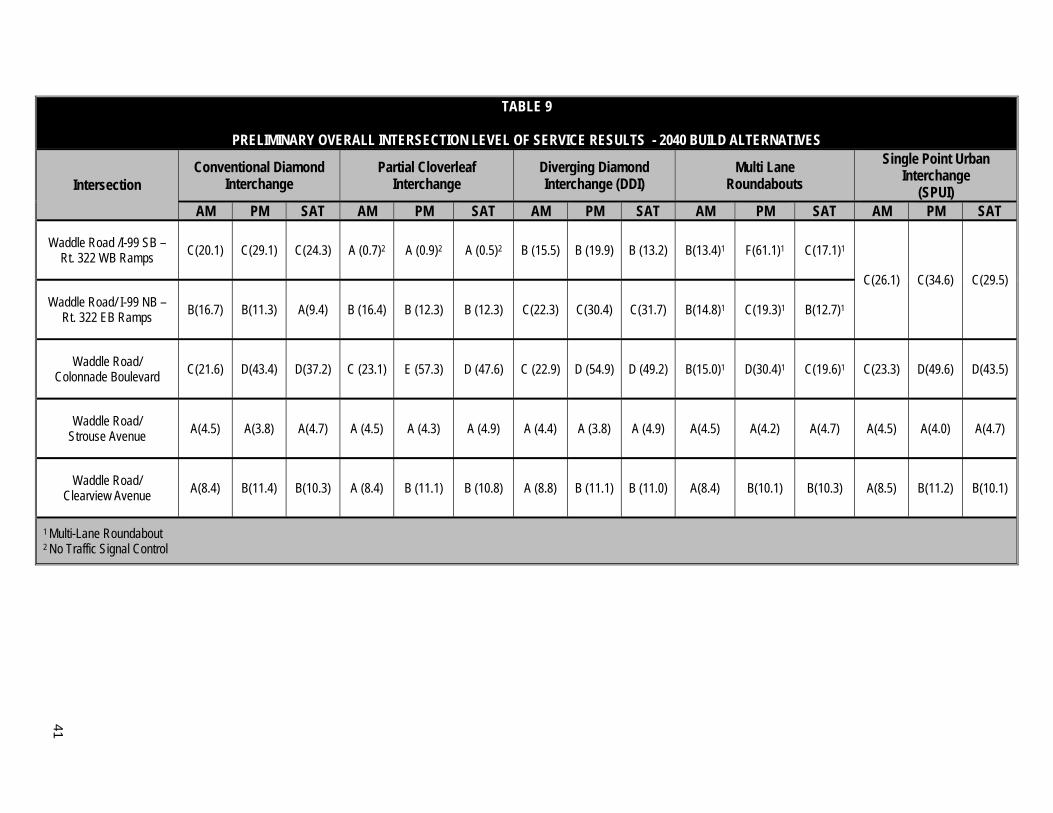
TABLE 9
PRELIMINARY OVERALL INTERSECTION LEVEL OF SERVICE RESULTS - 2040 BUILD ALTERNATIVES
Intersection Conventional Diamond
Interchange Partial Cloverleaf
Interchange Diverging Diamond Interchange (DDI)
Multi Lane Roundabouts
Single Point Urban Interchange
(SPUI) AM PM SAT AM PM SAT AM PM SAT AM PM SAT AM PM SAT
Waddle Road /I-99 SB – Rt. 322 WB Ramps C(20.1) C(29.1) C(24.3) A (0.7)2 A (0.9)2 A (0.5)2 B (15.5) B (19.9) B (13.2) B(13.4)1 F(61.1)1 C(17.1)1
C(26.1) C(34.6) C(29.5) Waddle Road/ I-99 NB –
Rt. 322 EB Ramps B(16.7) B(11.3) A(9.4) B (16.4) B (12.3) B (12.3) C(22.3) C(30.4) C(31.7) B(14.8)1 C(19.3)1 B(12.7)1
Waddle Road/ Colonnade Boulevard C(21.6) D(43.4) D(37.2) C (23.1) E (57.3) D (47.6) C (22.9) D (54.9) D (49.2) B(15.0)1 D(30.4)1 C(19.6)1 C(23.3) D(49.6) D(43.5)
Waddle Road/ Strouse Avenue A(4.5) A(3.8) A(4.7) A (4.5) A (4.3) A (4.9) A (4.4) A (3.8) A (4.9) A(4.5) A(4.2) A(4.7) A(4.5) A(4.0) A(4.7)
Waddle Road/ Clearview Avenue A(8.4) B(11.4) B(10.3) A (8.4) B (11.1) B (10.8) A (8.8) B (11.1) B (11.0) A(8.4) B(10.1) B(10.3) A(8.5) B(11.2) B(10.1)
1 Multi-Lane Roundabout 2 No Traffic Signal Control
41
Waddle Road / I-99 Interchange Project Improvement Alternatives – Preliminary Traffic Analysis
42
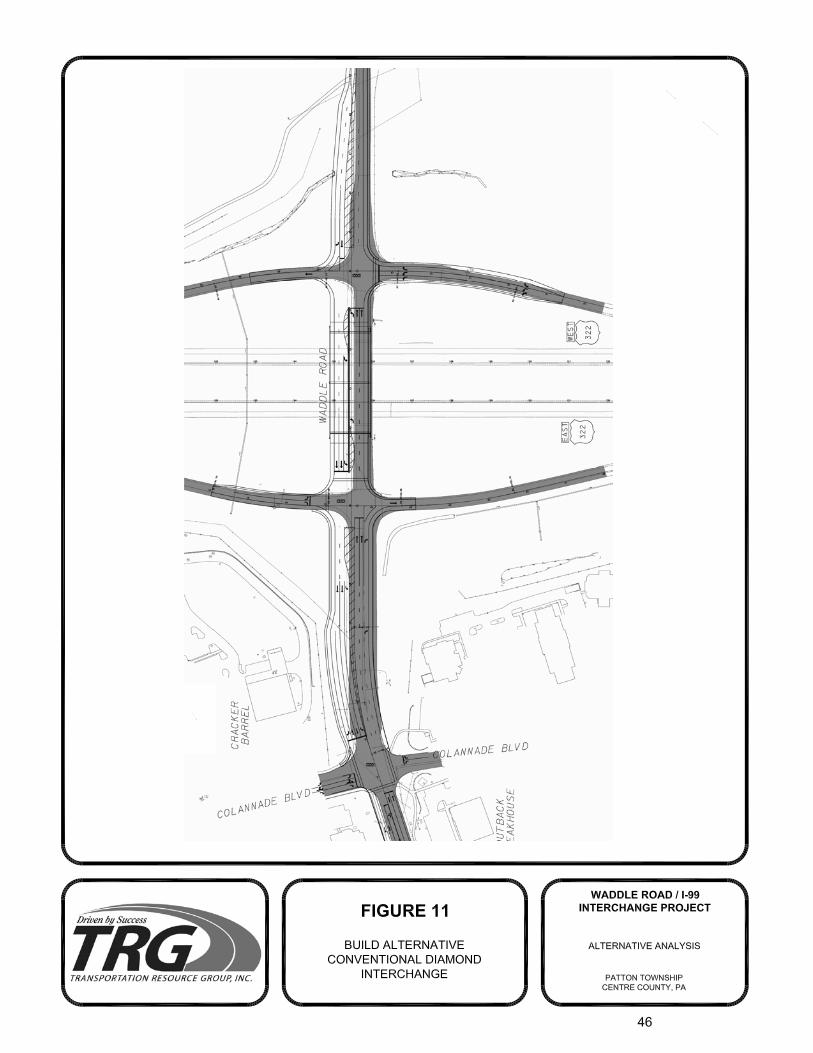
1. Conventional Diamond Interchange As shown in the preliminary design in Figure 11, this build alternative would expand the existing conventional diamond interchange to accommodate the 2040 design year volumes. With peak hour volumes projected to reach 2,000 vph through the interchange, the bridge structure would be widened desirably for six lanes (two through lanes and one left turn lane in each direction). The following is a summary of the key traffic performances and features of this alternative:
• Most common interchange type and is easily understood by all users. • Can grow in operation as traffic increases with sufficient width available on the bridge. • Pedestrians and bicyclists can be accommodated and this alternative is considered the most
pedestrian/bicycle friendly. • Achieves an overall LOS C or better at the Interchange with 2040 design traffic volumes. • Dual left turn lanes are required on the I-99 SB / 322 WB ramp. • No vehicle queuing issues at the ramp termini with the 2040 design traffic volumes.
With optimized signal timings, the Strouse Avenue and Clearview Avenue signalized intersections are not affected by this alternative and should operate at no less than an LOS B overall for the study periods. The Colonnade Boulevard signalized intersection should operate at no worse than a LOS D overall with slightly lowest delay among the non-roundabout alternatives. However, southbound queues on Waddle Road at Colonnade Boulevard remain a problem and may spillback through the interchange.
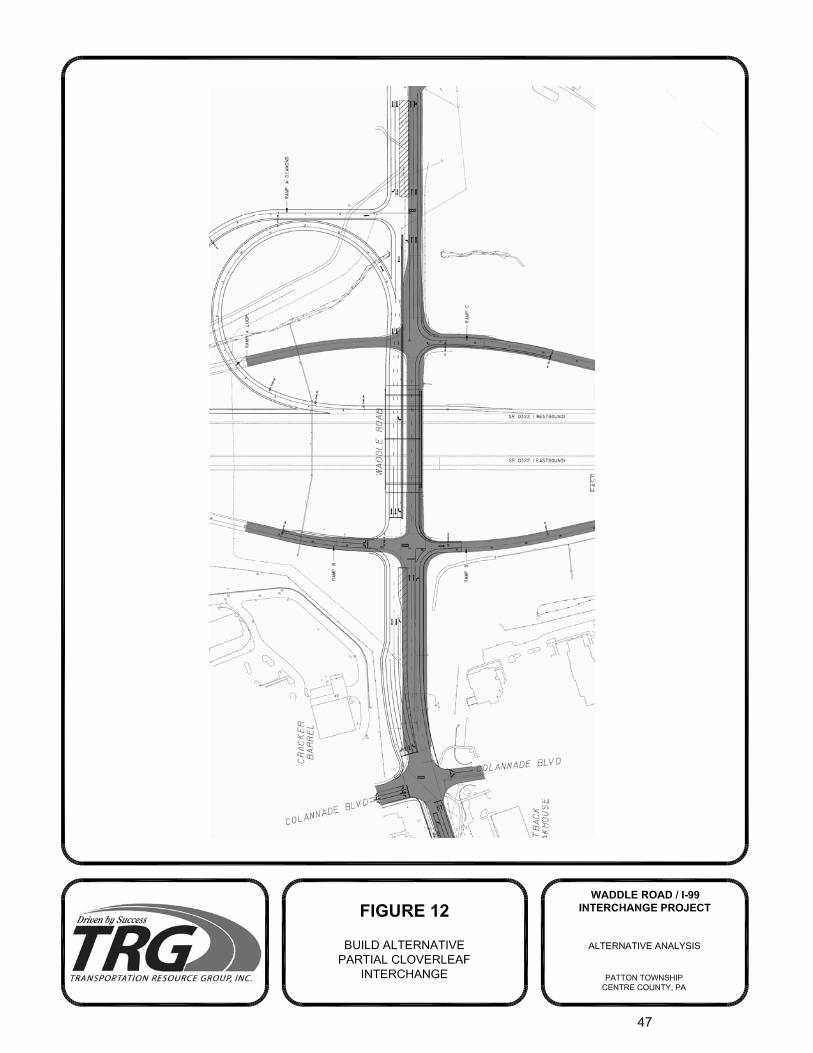
2. Partial Cloverleaf Interchange This build alternative utilizes a partial cloverleaf (Par Clo-B) in the northeast quadrant and maintains the existing diamond configuration for the I-99 NB – Rt. 322 EB ramps. A preliminary design of this alternative is shown in Figure 12. The I-99 SB – Rt. 322 WB off ramp remains for right turn movements only. The heavier left turn movement is accommodated by the partial cloverleaf loop ramp followed by a free flow right turn movement onto Waddle Road. The following is a summary of the key traffic performances and features of this alternative:
• Commonly used at on/off ramps where left turn movements are extremely heavy. • Pedestrians and bicycles can be accommodated, but free flow right turn movements are not
considered pedestrian/bicycle friendly. • Reduces vehicle conflicts and there will be no traffic signal at the I-99 SB – Rt. 322 WB on/off
ramps. • Results in best overall levels of service at the Interchange (LOS B or better) with 2040 design
traffic volumes. • No vehicle queuing issues at ramp termini with the 2040 design volumes.
Waddle Road / I-99 Interchange Project Improvement Alternatives – Preliminary Traffic Analysis
43
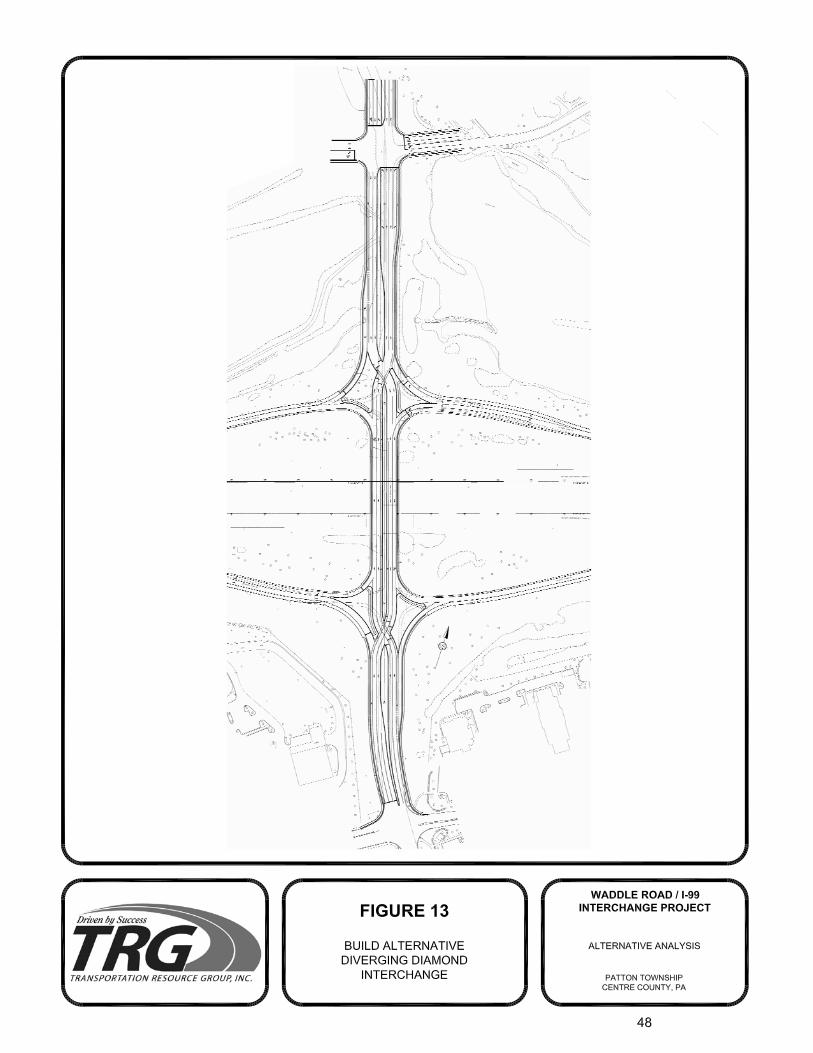
With optimized signal timings, the Strouse Avenue and Clearview Avenue signalized intersections are not affected by the alternative and should operate at no less than a LOS B overall for the study periods. The Colonnade Boulevard signalized intersection is affected by this alternative with the increase in the corridor system cycle length. This resulted in an overall LOS E during the PM peak hour study period. Southbound queues on Waddle Road at Colonnade Boulevard remain a problem and may spill back through the interchange. 3. Diverging Diamond Interchange (DDI) This build alternative is the reconfiguration of the interchange as a diverging diamond interchange (DDI). A preliminary design of this alternative is shown in Figure 13. The following is a summary of the key traffic performance and features of this alternative:
• Designed to accommodate high left turn movements and through movements on the mainline
by traffic crossing to other side. • Benefits include no left turn lanes or phasing on the mainline with one controller and reduction
in vehicle conflict points. • Drivers are typically confused with the operation of traffic crossing over to the other side. • Pedestrians and bicycles can be accommodated, although some features are not considered
pedestrian and bicycle friendly. • Results in overall LOS C or better for the Interchange with the 2040 design volumes. • Some queuing issues for southbound traffic between ramp termini using the 2040 design
volumes and assuming one signal controller with ramp termini spacing at 500 to 600 feet. With optimized signal timings, the Strouse Avenue and Clearview Avenue signalized intersections are not affected by the alternative and should operate at no less than a LOS B overall for the study periods. The Colonnade Boulevard signalized intersection should operate with no worse than a LOS D overall with slightly higher delay than the conventional diamond alternative. However, southbound queues on Waddle Road at Colonnade Boulevard remain a problem and may spillback through the interchange.
Waddle Road / I-99 Interchange Project Improvement Alternatives – Preliminary Traffic Analysis
44
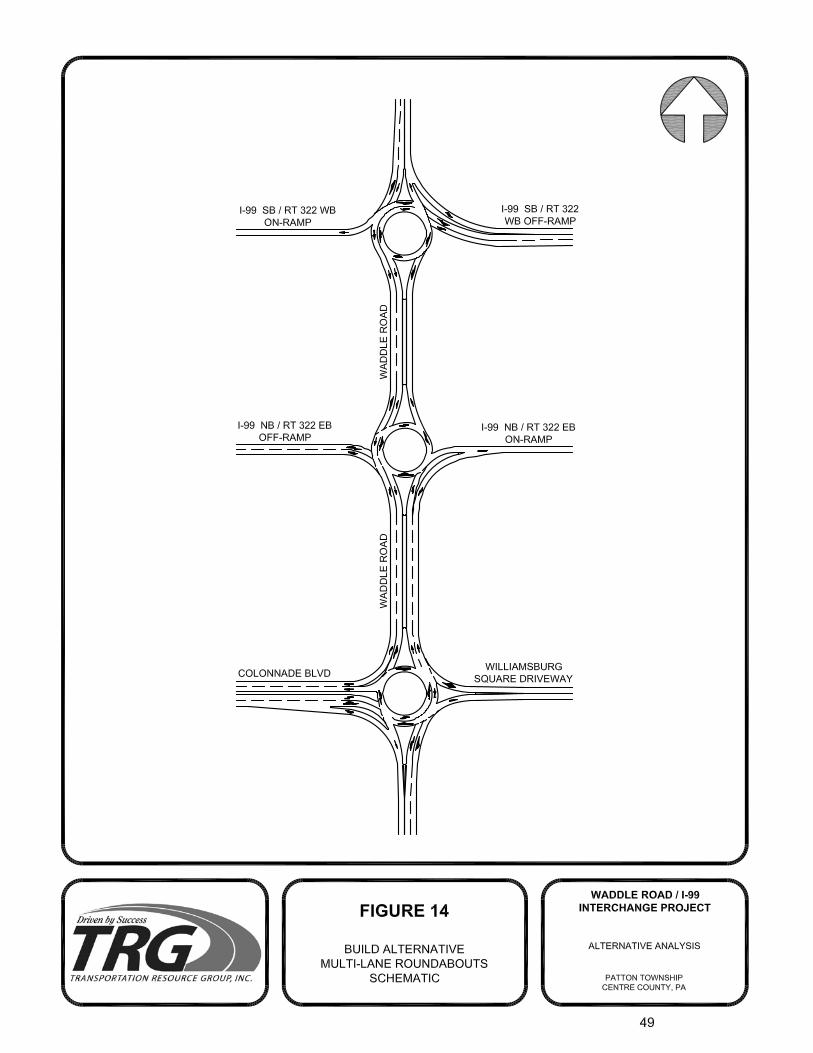
4. Multilane Roundabouts This build alternative would reconfigure the interchange with multilane roundabouts at the ramp termini. Roundabouts are viewed by FHWA as a desirable improvement that should be evaluated when considering alternatives. It is recognized that roundabouts should be evaluated on a case by case basis and may not always be the right fit. A schematic design is shown in Figure 14 and the following is a summary of the key traffic performances and features of this alternative:
• Benefits include reduction in conflict points and speeds, and no traffic signals. • Does not work well with unbalanced traffic volumes. • Some safety benefits are lost with multilane roundabout designs. • Pedestrians and bicycles can be accommodated around the perimeter at the splitter island and
roundabouts are considered pedestrian/bicycle friendly given slower entry speeds. • The Rt. 322 WB ramp fails (LOS F) during the PM peak hour with the 2040 design traffic
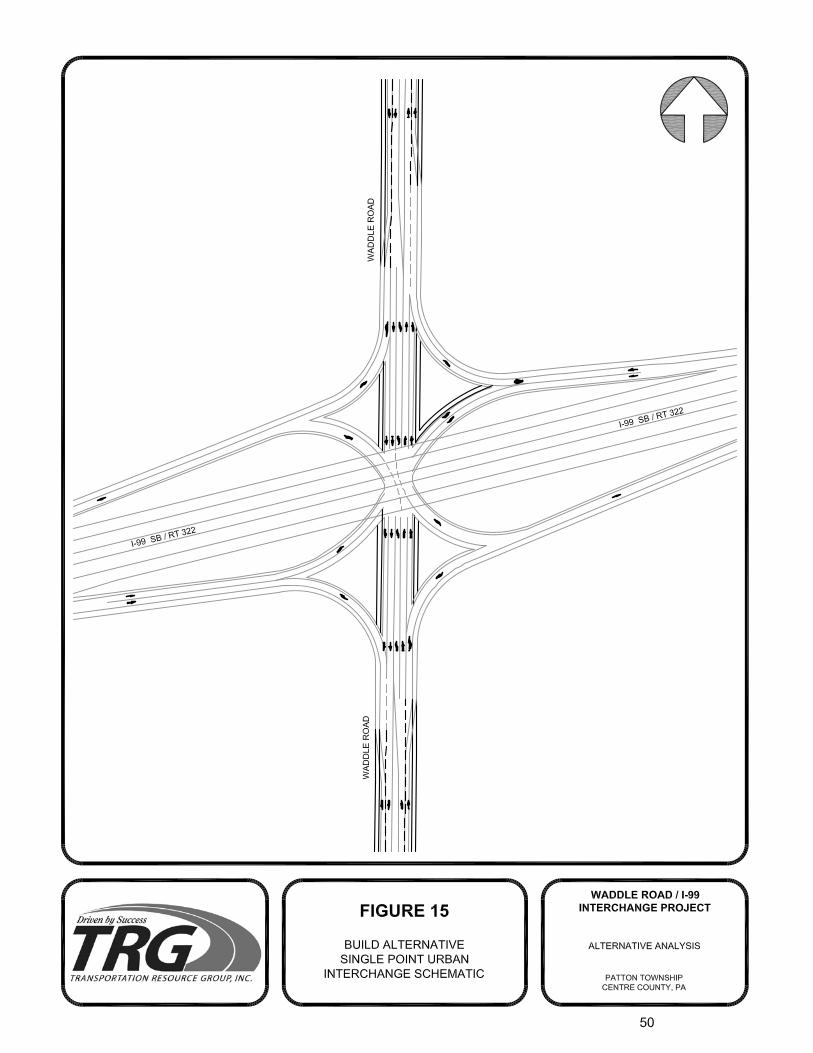
volumes and a two lane design. With the closeness of the interchange (approximately 600 feet), a roundabout was also evaluated at the Colonnade Boulevard intersection with this alternative. While the roundabout operation would provide the best overall levels of service at the Colonnade Boulevard intersection, southbound queues on Waddle Road would remain a problem and may spillback through the interchange. The Strouse Avenue and Clearview Avenue signalized intersections, with optimized signal timings, should not be affected by this alternative and will operate at no less than a LOS B overall. 5. Single Point Urban Interchange (SPUI) This build alternative is the reconfiguration of the interchange as a Single Point Urban Interchange (SPUI). The look and size is similar to the conventional diamond interchange and a schematic design is shown in Figure 15. The following is a summary of the traffic performances and features of this alternative:
• Operates with one three phase traffic signal, reducing conflict points and phasing. • Works best when opposing traffic flows are balanced. • Pedestrians and bicycles can be accommodated, but a large SPUI is not considered
pedestrian and bicycle friendly. • Results in an overall LOS C for the Interchange but has the highest volume delay (34.6 secs)
among the non-roundabout alternatives with 2040 design traffic volumes. • Vehicle queues are not an issue with only one intersection controlled by a signal.
With optimized signal timings, the Strouse Avenue and Clearview Avenue signalized intersections are not affected by the alternative and should operate at no less than an LOS B overall for the study periods. The Colonnade Boulevard signalized intersection should operate at no worse than a LOS D overall with similar
Waddle Road / I-99 Interchange Project Improvement Alternatives – Preliminary Traffic Analysis
45
delay to the conventional diamond alternative. Southbound queues on Waddle Road remain a problem and may spill back through the interchange. F. FINDINGS Five build alternatives were evaluated based on their traffic performance in improving the existing diamond interchange to accommodate the 2040 design year preliminary traffic volumes. All build alternatives provided a desirable LOS C at the interchange, with the exception of the two lane multilane roundabout. The diverging diamond interchange alternative (DDI) showed issues with queuing between the ramp termini, which is inherent with DDIs when spacing becomes 500 to 600 feet and there is one controller for the interchange. With the remaining build alternatives providing similar acceptable levels of service for the 2040 design year, the conventional diamond alternative, which is an expansion to the current diamond interchange configuration, and viewed as the most pedestrian and bicycle friendly, may be considered as one of the preferred alternatives. The preferred alternatives would be advanced for refinement to address the following technical comments associated with the 2040 design year preliminary traffic analysis results:
• Updated CCTM and study area model calibration • Final 2040 Design Year Traffic Volumes • Waddle Road southbound queuing and spillback issues at Colonnade Boulevard
For the updated traffic analysis, it was decided that both the Conventional Diamond (CD) and Partial Cloverleaf (PC) build alternatives would be further evaluated in the updated traffic analysis of the preferred build alternatives.
Waddle Road / I-99 Interchange Project Preferred Alternatives – Updated 2040 Traffic Analysis
51
V. PREFERRED ALTERNATIVES – UPDATED 2040 TRAFFIC ANALYSIS Based on the earlier preliminary traffic analysis evaluation of several build alternatives, the Conventional Diamond (CD) and Potential Cloverleaf (PC) build alternatives were selected as the preferred alternatives to be further evaluated with the updated traffic analysis. Specifically, the updated traffic analysis included the following:
• New intersection manual counts and unmet traffic demand observations • HCM 2010 / Synchro 8-0 / SimTraffic Analysis • Multi-period Analysis • Final Centre County travel demand model • Evaluation of improvement options to Colonnade Blvd intersection
The analysis follows the directions provided in PennDOT Strike-off Letter (SOL) 494-13-03 regarding the 2010 Highway Capacity Manual (HCM) and traffic data collection analysis, and simulation specific to Pennsylvania. A. Intersection Counts and Unmet Demand As part of the updated traffic analysis, new manual turning movement counts (TMC) were conducted at the following critical study intersections:
• Waddle Road / I-99 SB – Rt. 322 WB Ramps • Waddle Road / I-99 NB – Rt. 322 EB Ramps • Waddle Road / Colonnade Boulevard
A key element of the new TMC’s was the recording of unmet demand due to an over saturated intersection. This data is required for multi-period analysis. The manual counts were conducted by PennDOT District 2-0 and TRG personnel on a typical weekday and Saturday (non-football) in September 2013. The count times were similar to the April 2012 counts and the resultant peak hour time periods were also similar:
• Weekday AM Peak Hour – 7:30 to 8:30 AM • Weekday PM Peak Hour – 4:45 to 5:45 PM
Waddle Road / I-99 Interchange Project Preferred Alternatives – Updated 2040 Traffic Analysis
52
• Saturday Peak Hour – 4:45 to 5:45 PM It is important to note, with the early action signal timing improvements implemented, there was very little unmet demand observed and recorded. Traffic count and queue / unmet demand summaries can be found in the Technical Files. B. Traffic Forecasting Methodology and Adjustment Since the preliminary travel model output was provided in September 2012, the CCTDM has been finalized and determined to be suitable for the updated traffic analysis. The Centre County consultant, Whitman, Requardt and Associates, LLP (WRA), was retained and provided the technical services to refine and calibrate the travel model for the project study area. A subarea focusing approach was taken which has the advantage of retaining the County highway network system and trip table, this allowing the interaction of the study area with the region. An important step in the travel model calibration process for the study area was to check the accuracy and reasonableness of 2010 base year daily traffic assignments to actual volumes. This involved an iterative process of running the base year travel model and making adjustments until the desired accuracy and reasonableness was achieved. As a result, the following calibration adjustments to the CCTDM were made for the project study area:
1. TAZ 108,110,296,297 and 301 were split and centroid connector were adjusted 2. Added 1300 daily airport trips to TAZ 151 3. Adjusted the k factor between Patton Township and Huston, Philipsburg, Port Matilda,
Taylor, Rush and Worth A final check of the 2010 base year daily traffic volume assignment showed an overall accuracy of 3 percent for the project study area. Also, actual link volumes were well within the maximum desirable deviation allowed. A summary of the preliminary travel model final check can be found in the Report Appendices.
Waddle Road / I-99 Interchange Project Preferred Alternatives – Updated 2040 Traffic Analysis
53
C. 2040 No-build Traffic Conditions The 2040 no-build traffic conditions represent no capacity type improvements at the interchange. From the preliminary travel model results, minor changes to the existing plus committed (E+C) network were made, but the basic county network system remain unchanged. The following improvements in Patton Township were included in the E+C network:
• Traffic signal control at the Atherton Street and Trader Joe’s Driveway intersection • Assumed traffic signal control and widening of the Waddle Road and Toftrees
intersection to accommodate the forecasted growth from the Toftrees West Master Plan (TZ 110/338)
A complete list of the TIP network improvements and the 2040 no-build daily traffic volume assignment can be found in the Report Appendices. The 2040 no-build traffic volumes were derived from the traffic NCHRP 255 forecasting methodology and adjustment process. Figure 16 shows the 2040 design year daily volumes forecasted at the eight ATR traffic count locations. Figure 17, 18 and 19 show the 2040 design year AM, PM and Saturday peak hour traffic volumes at the study intersections. With the land use forecast, traffic is expected to grow significantly in the study area. Waddle Road through the interchange will see an average growth of 87 percent. Table 10 summarizes the level of service and capacity analysis for the design year 2040 no-build conditions on the study intersections. HCM 2010/Synchro 8.0 was utilized to run a multi-period analysis of the peak hour study periods. For each run, the cycle length signal timings were optimized. An overall LOS D is considered acceptable. Those intersections which show an overall LOS E or F and are unacceptable are:
• Waddle Road / I-99 SB – Rt. 322 WB ramp (PM Peak Hour) Those intersections which show an approach or movement at an LOS E or F are:
• Waddle Road / I-99 SB – Rt. 322 WB ramp (AM and Sat Peak Hour) • Waddle Road / I-99 NB – Rt. 322 EB ramp (AM, PM and Sat Peak Hour) • Waddle Road / Colonnade Blvd. (PM Peak Hour) • Waddle Road / Strouse Avenue (PM and Sat Peak Hour) • Waddle Road / Clearview Avenue (PM and Sat Peak Hour)
Waddle Road / I-99 Interchange Project Preferred Alternatives – Updated 2040 Traffic Analysis
54
The overall LOS at the Waddle Road intersections with Strouse Avenue and Clearview Avenue improves, operating at an LOS A with the optimization of signal timings and the corridor cycle length. Vehicle queues were also evaluated for the 2040 no-build conditions using SimTraffic and the optimized signal timings. With the deterioration in the level of service and increased delays, vehicle queues increased significantly for the following approaches:
• Waddle Road / I-99 SB – Rt. 322 WB ramp approach (AM, PM and Sat Peak Hour) • Waddle Road / I-99 NB – Rt. 322 EB ramp approach (PM Peak Hour) • Waddle Road / Colonnade Blvd eastbound approach (PM Peak Hour) • Waddle Road northbound approach through Clearview, Strouse and Colonnade Blvd
(PM Peak Hour) The detailed queue analysis results can be found in the Report Appendices.


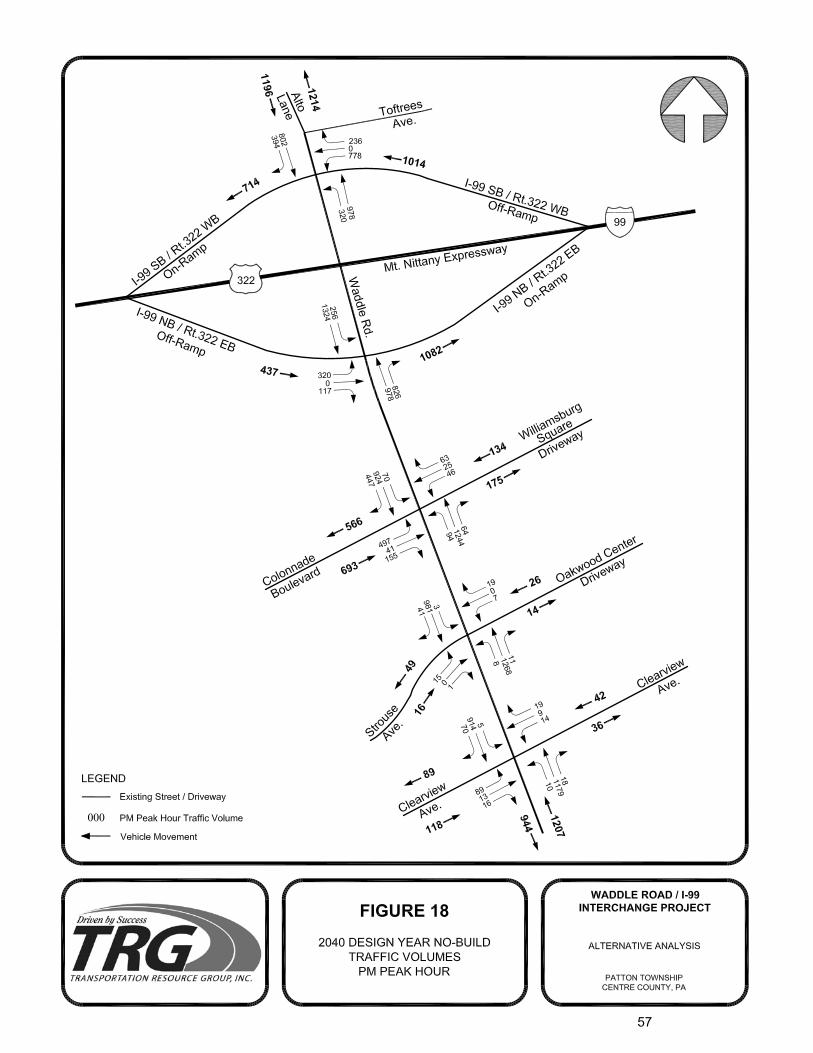

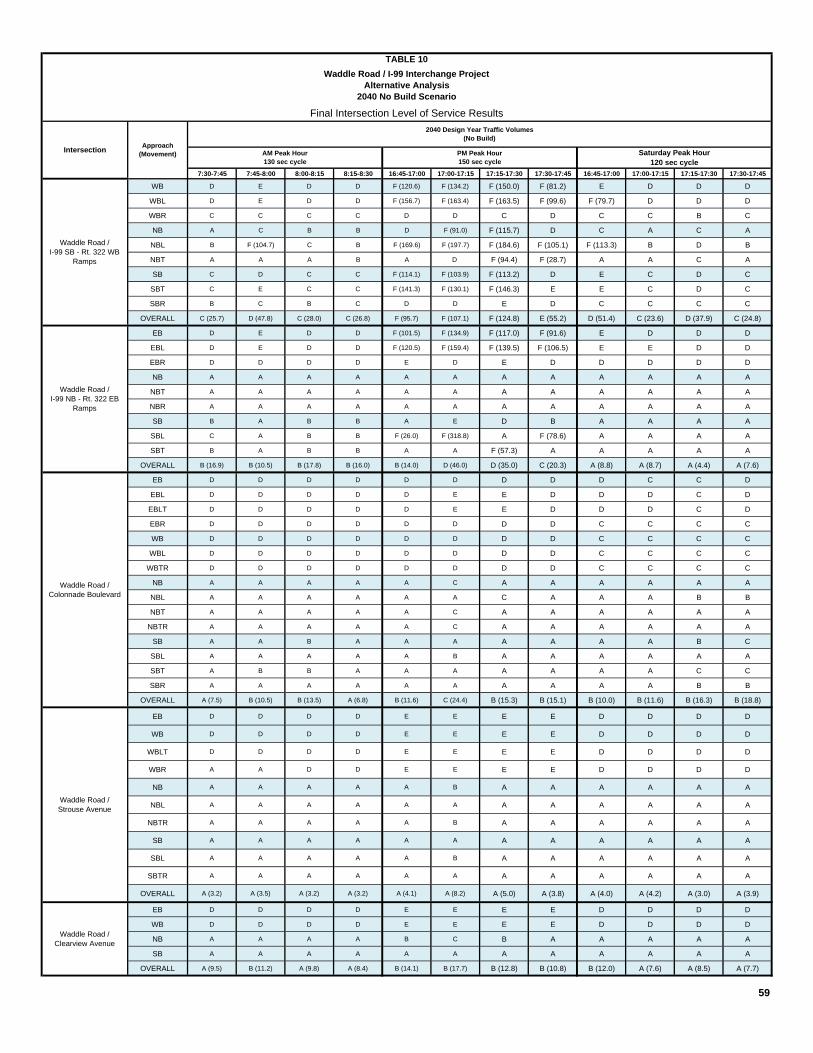
7:30-7:45 7:45-8:00 8:00-8:15 8:15-8:30 16:45-17:00 17:00-17:15 17:15-17:30 17:30-17:45 16:45-17:00 17:00-17:15 17:15-17:30 17:30-17:45
WB D E D D F (120.6) F (134.2) F (150.0) F (81.2) E D D D
WBL D E D D F (156.7) F (163.4) F (163.5) F (99.6) F (79.7) D D D
WBR C C C C D D C D C C B C
NB A C B B D F (91.0) F (115.7) D C A C A
NBL B F (104.7) C B F (169.6) F (197.7) F (184.6) F (105.1) F (113.3) B D B
NBT A A A B A D F (94.4) F (28.7) A A C A
SB C D C C F (114.1) F (103.9) F (113.2) D E C D C
SBT C E C C F (141.3) F (130.1) F (146.3) E E C D C
SBR B C B C D D E D C C C C
OVERALL C (25.7) D (47.8) C (28.0) C (26.8) F (95.7) F (107.1) F (124.8) E (55.2) D (51.4) C (23.6) D (37.9) C (24.8)
EB D E D D F (101.5) F (134.9) F (117.0) F (91.6) E D D D
EBL D E D D F (120.5) F (159.4) F (139.5) F (106.5) E E D D
EBR D D D D E D E D D D D D
NB A A A A A A A A A A A A
NBT A A A A A A A A A A A A
NBR A A A A A A A A A A A A
SB B A B B A E D B A A A A
SBL C A B B F (26.0) F (318.8) A F (78.6) A A A A
SBT B A B B A A F (57.3) A A A A A
OVERALL B (16.9) B (10.5) B (17.8) B (16.0) B (14.0) D (46.0) D (35.0) C (20.3) A (8.8) A (8.7) A (4.4) A (7.6)
EB D D D D D D D D D C C D
EBL D D D D D E E D D D C D
EBLT D D D D D E E D D D C D
EBR D D D D D D D D C C C C
WB D D D D D D D D C C C C
WBL D D D D D D D D C C C C
WBTR D D D D D D D D C C C C
NB A A A A A C A A A A A A
NBL A A A A A A C A A A B B
NBT A A A A A C A A A A A A
NBTR A A A A A C A A A A A A
SB A A B A A A A A A A B C
SBL A A A A A B A A A A A A
SBT A B B A A A A A A A C C
SBR A A A A A A A A A A B B
OVERALL A (7.5) B (10.5) B (13.5) A (6.8) B (11.6) C (24.4) B (15.3) B (15.1) B (10.0) B (11.6) B (16.3) B (18.8)
EB D D D D E E E E D D D D
WB D D D D E E E E D D D D
WBLT D D D D E E E E D D D D
WBR A A D D E E E E D D D D
NB A A A A A B A A A A A A
NBL A A A A A A A A A A A A
NBTR A A A A A B A A A A A A
SB A A A A A A A A A A A A
SBL A A A A A B A A A A A A
SBTR A A A A A A A A A A A A
OVERALL A (3.2) A (3.5) A (3.2) A (3.2) A (4.1) A (8.2) A (5.0) A (3.8) A (4.0) A (4.2) A (3.0) A (3.9)
EB D D D D E E E E D D D D
WB D D D D E E E E D D D D
NB A A A A B C B A A A A A
SB A A A A A A A A A A A A
OVERALL A (9.5) B (11.2) A (9.8) A (8.4) B (14.1) B (17.7) B (12.8) B (10.8) B (12.0) A (7.6) A (8.5) A (7.7)
59
Waddle Road / Colonnade Boulevard
Waddle Road / Strouse Avenue
Waddle Road / Clearview Avenue
Waddle Road / I-99 SB - Rt. 322 WB
Ramps
Waddle Road / I-99 NB - Rt. 322 EB
Ramps
Saturday Peak Hour 120 sec cycle
TABLE 10
2040 Design Year Traffic Volumes (No Build)
Waddle Road / I-99 Interchange ProjectAlternative Analysis
2040 No Build Scenario
Final Intersection Level of Service Results
Intersection Approach (Movement) AM Peak Hour
130 sec cyclePM Peak Hour 150 sec cycle
Waddle Road / I-99 Interchange Project Preferred Alternatives – Updated 2040 Traffic Analysis
60
D. 2040 Build Traffic Conditions For the 2040 build traffic conditions, the following preferred alternatives were evaluated with the updated traffic analysis:
1. Conventional Diamond - This build alternative would widen the existing conventional diamond interchange to provide a six lane bridge and include the following lane configuration:
• Two northbound and southbound through lanes • Side by side northbound and southbound left turn lanes • Dual left turn lanes and right turn lanes on the westbound ramp • High type channelized northbound right turn lane at the eastbound ramp • Separate right and left turn lanes on the eastbound ramp • Channelized southbound right turn lane at the westbound ramp
The ramp termini would remain signalized. A conceptual design of this preferred alternative is shown in Figure 11.
2. Partial Cloverleaf - This build alternative would widen the existing bridge to six lanes and utilize
a partial cloverleaf (Par Clo-B) in the northeast quadrant to accommodate the heavy westbound off-ramp left turn movements.
• Two northbound and southbound through lanes • Dual left turn lanes on the eastbound ramp • Existing westbound ramp becomes right turn only stop controlled • Partial cloverleaf loop ramp is a free flowing movement onto Waddle Road • Waddle Road northbound left turn movements onto I-99 SB would be controlled by a
traffic signal • High type channelized northbound right turn lane at the eastbound ramp
A conceptual design of this preferred alternative is shown in Figure 12.
The CCTDM project travel model network was modified and supplemental runs were made for each preferred alternative by WRA. Separate build runs were also made to model the option of the auxiliary

Waddle Road / I-99 Interchange Project Preferred Alternatives – Updated 2040 Traffic Analysis
61
southbound through lane on Waddle Road from Colonnade Blvd to Strouse Avenue. The daily traffic assignments showed very little difference and were in the margin of error between the two preferred alternatives and options. As a result, it was recommended by WRA and decided that one build alternative traffic assignment would be used to develop the design year traffic volumes for the build alternatives. The 2040 build daily traffic volume assignments can be found in the Report Appendices. The 2040 design year build alternative traffic volumes were derived using the NCHRP 255 traffic forecasting methodology and adjustment process. Figure 20 shows the 2040 design year forecasted daily traffic volumes at the eight ATR count locations. Figures 21, 22 and 23 show 2040 design year build traffic volumes for the AM, PM and Saturday peak hour periods at the study intersections. While the build alternatives will add significant traffic capacity to the intersection, daily traffic volumes showed a 3 percent increase through the interchange area when compared to the no-build traffic volumes. Tables 11 and 12 summarize the level of service and capacity analysis for the design year 2040 build conditions at the study intersections for the preferred alternatives. HCM 2010/Synchro 8.0 was utilized to run a multi-period analysis of the peak hour study periods. For each run, the cycle length signal timings were optimized. An overall LOS D is considered acceptable. The results were very similar for both preferred alternatives and there were no intersections that had an overall LOS less than D. As expected, the Waddle Road / I-99 SB – Rt. 322 WB ramp operated significantly better with the Partial Cloverleaf build alternative. Those signalized intersections which showed an approach or movement at an LOS E or F are:
• Waddle Road / I-99 NB / Rt. 322 EB ramp (PM and Sat Peak Hour) • Waddle Road / Colonnade Blvd (PM Peak Hour) • Waddle Road / Strouse Avenue (PM and Sat Peak Hour) • Waddle Road / Clearview Avenue (PM and Sat Peak Hour)
Again, for both preferred alternatives the southbound through movement remained a problem during the PM peak hour period with a v/c ratio exceeding 1.0, a level of service F is shown despite a delay of 28 seconds.
Waddle Road / I-99 Interchange Project Preferred Alternatives – Updated 2040 Traffic Analysis
62
Vehicle queues were also evaluated for the 2040 build traffic conditions for each preferred alternative using SimTraffic and the optimized signal timings. For both preferred alternatives, southbound queuing is a problem during the PM peak hour period with the approach exceeding capacity (vc > 1.0). This causes spillback through the interchange and affects the queuing on the I-99 / Rt. 322 WB off ramp. For the northbound direction, the SimTraffic results show queuing and spillback between the Colonnade Blvd and Strouse Avenue intersections. The detailed queue analysis results can be found in the Report Appendices. To address the Waddle Road southbound through movement capacity and queuing / spillback issue, a range of improvement options were assessed at the Colonnade Blvd signalized intersection. The option to add an auxiliary second southbound through lane and retaining the split phasing was found to be the most effective in addressing the issue. Tables 13 and 14 summarize the level of service and a capacity analysis for the 2040 design year build conditions with the preferred alternatives and two southbound through lane option. The results are similar for both with all intersections should operate with an overall LOS C or better. The Strouse and Clearview Avenue approaches show a LOS E during the PM peak hour period but this can be contributed to the longer cycle length associated with the Conventional Diamond build alternative. The intersections should operate at a LOS A or B with both preferred alternatives. Vehicle queues were also evaluated for both preferred alternatives with the auxiliary through lane option. The results show that the Conventional Diamond build alternative is more effective in reducing southbound through lane queuing and spillback through the interchange. The PM peak hour (4:15 to 5:15 PM) 95th percentile queue (618 ft) for this movement slightly exceeds the available stacking distance (605 ft) between Colonnade Blvd and the I-99 NB / Rt. 322 EB ramp. For this same time period, the Partial Cloverleaf build alternative shows significantly longer queues (752 ft) which causes additional spillback through the interchange. Overall, the southbound queues on Waddle Road are over 20 percent longer with the Partial Cloverleaf build alternative and the auxiliary through lane option. The detailed queue analysis results can be found in the Report Appendices.
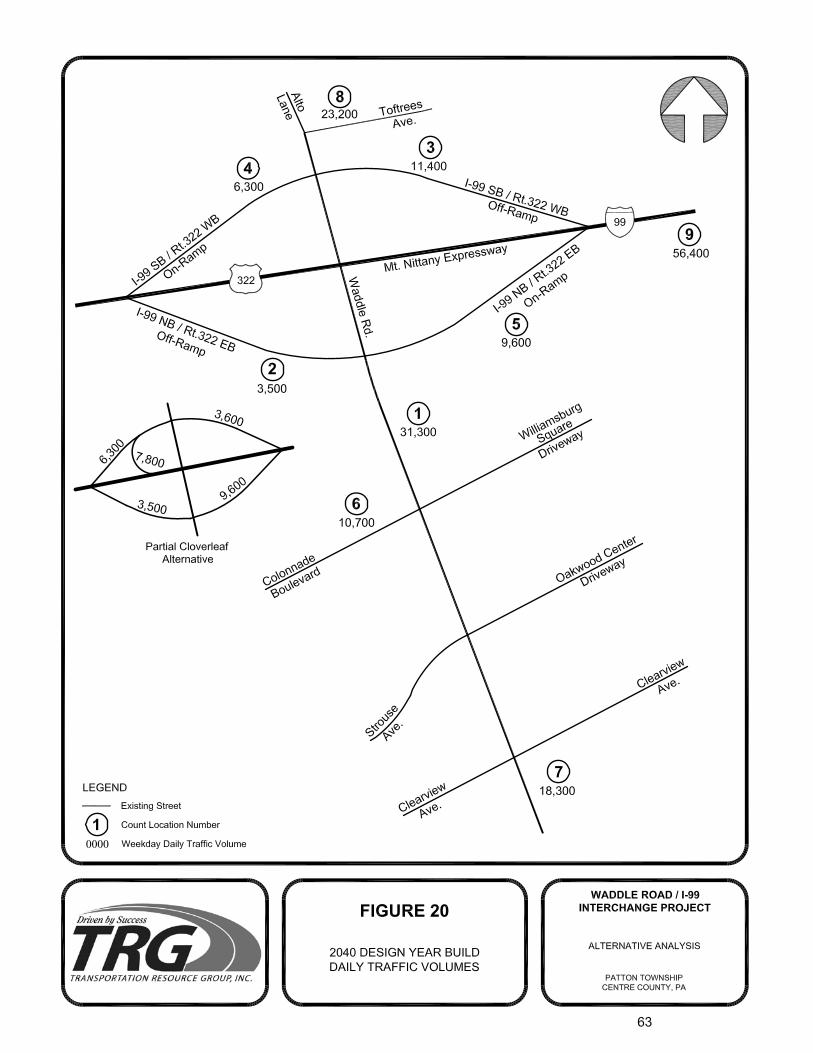


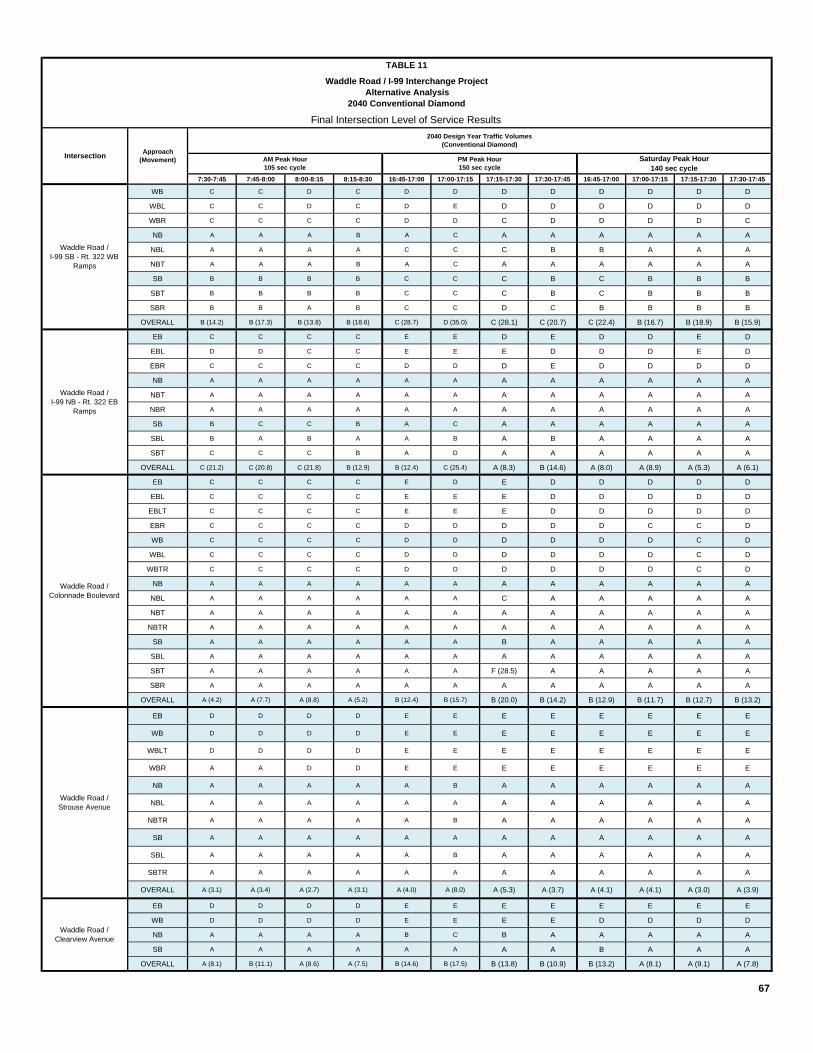
7:30-7:45 7:45-8:00 8:00-8:15 8:15-8:30 16:45-17:00 17:00-17:15 17:15-17:30 17:30-17:45 16:45-17:00 17:00-17:15 17:15-17:30 17:30-17:45
WB C C D C D D D D D D D D
WBL C C D C D E D D D D D D
WBR C C C C D D C D D D D C
NB A A A B A C A A A A A A
NBL A A A A C C C B B A A A
NBT A A A B A C A A A A A A
SB B B B B C C C B C B B B
SBT B B B B C C C B C B B B
SBR B B A B C C D C B B B B
OVERALL B (14.2) B (17.3) B (13.8) B (18.6) C (28.7) D (35.0) C (28.1) C (20.7) C (22.4) B (16.7) B (18.9) B (15.9)
EB C C C C E E D E D D E D
EBL D D C C E E E D D D E D
EBR C C C C D D D E D D D D
NB A A A A A A A A A A A A
NBT A A A A A A A A A A A A
NBR A A A A A A A A A A A A
SB B C C B A C A A A A A A
SBL B A B A A B A B A A A A
SBT C C C B A D A A A A A A
OVERALL C (21.2) C (20.8) C (21.8) B (12.9) B (12.4) C (25.4) A (8.3) B (14.6) A (8.0) A (8.9) A (5.3) A (6.1)
EB C C C C E D E D D D D D
EBL C C C C E E E D D D D D
EBLT C C C C E E E D D D D D
EBR C C C C D D D D D C C D
WB C C C C D D D D D D C D
WBL C C C C D D D D D D C D
WBTR C C C C D D D D D D C D
NB A A A A A A A A A A A A
NBL A A A A A A C A A A A A
NBT A A A A A A A A A A A A
NBTR A A A A A A A A A A A A
SB A A A A A A B A A A A A
SBL A A A A A A A A A A A A
SBT A A A A A A F (28.5) A A A A A
SBR A A A A A A A A A A A A
OVERALL A (4.2) A (7.7) A (8.8) A (5.2) B (12.4) B (15.7) B (20.0) B (14.2) B (12.9) B (11.7) B (12.7) B (13.2)
EB D D D D E E E E E E E E
WB D D D D E E E E E E E E
WBLT D D D D E E E E E E E E
WBR A A D D E E E E E E E E
NB A A A A A B A A A A A A
NBL A A A A A A A A A A A A
NBTR A A A A A B A A A A A A
SB A A A A A A A A A A A A
SBL A A A A A B A A A A A A
SBTR A A A A A A A A A A A A
OVERALL A (3.1) A (3.4) A (2.7) A (3.1) A (4.0) A (8.0) A (5.3) A (3.7) A (4.1) A (4.1) A (3.0) A (3.9)
EB D D D D E E E E E E E E
WB D D D D E E E E D D D D
NB A A A A B C B A A A A A
SB A A A A A A A A B A A A
OVERALL A (8.1) B (11.1) A (8.6) A (7.5) B (14.6) B (17.5) B (13.8) B (10.9) B (13.2) A (8.1) A (9.1) A (7.8)
67
Waddle Road / Colonnade Boulevard
Waddle Road / Strouse Avenue
Waddle Road / Clearview Avenue
Waddle Road / I-99 SB - Rt. 322 WB
Ramps
Waddle Road / I-99 NB - Rt. 322 EB
Ramps
Saturday Peak Hour 140 sec cycle
TABLE 11
2040 Design Year Traffic Volumes (Conventional Diamond)
Waddle Road / I-99 Interchange ProjectAlternative Analysis
2040 Conventional Diamond
Final Intersection Level of Service Results
Intersection Approach (Movement) AM Peak Hour
105 sec cyclePM Peak Hour 150 sec cycle
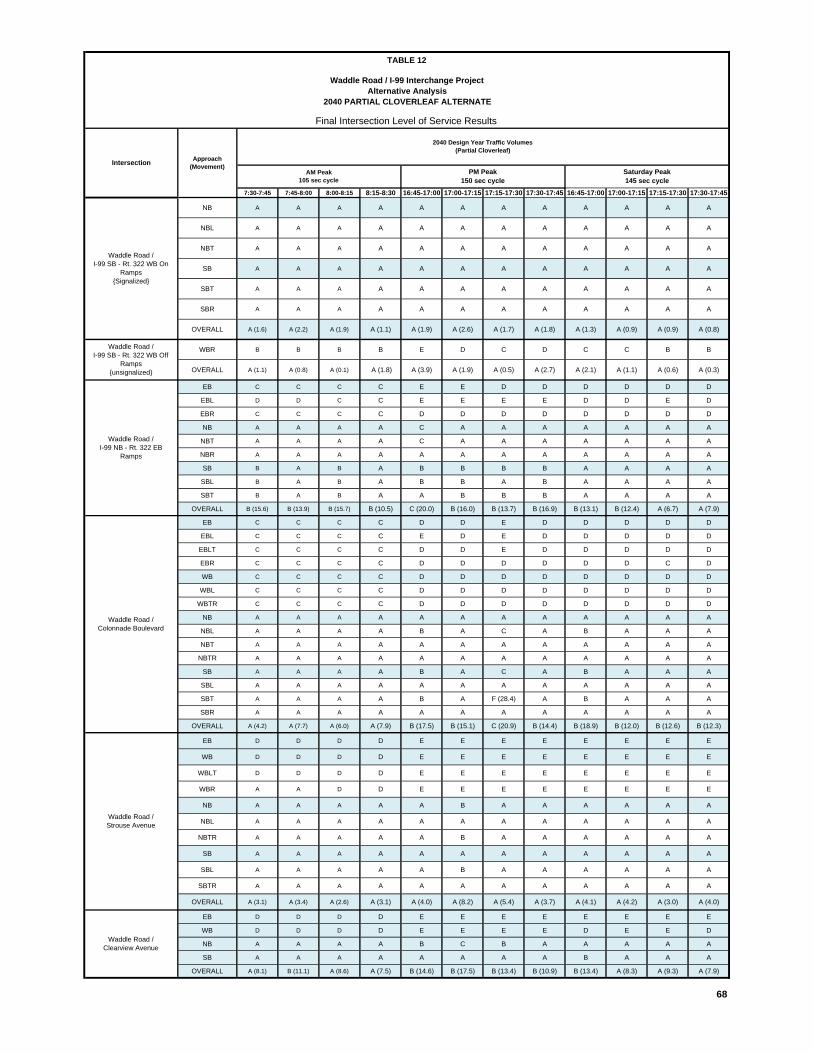
7:30-7:45 7:45-8:00 8:00-8:15 8:15-8:30 16:45-17:00 17:00-17:15 17:15-17:30 17:30-17:45 16:45-17:00 17:00-17:15 17:15-17:30 17:30-17:45
NB A A A A A A A A A A A A
NBL A A A A A A A A A A A A
NBT A A A A A A A A A A A A
SB A A A A A A A A A A A A
SBT A A A A A A A A A A A A
SBR A A A A A A A A A A A A
OVERALL A (1.6) A (2.2) A (1.9) A (1.1) A (1.9) A (2.6) A (1.7) A (1.8) A (1.3) A (0.9) A (0.9) A (0.8)
WBR B B B B E D C D C C B B
OVERALL A (1.1) A (0.8) A (0.1) A (1.8) A (3.9) A (1.9) A (0.5) A (2.7) A (2.1) A (1.1) A (0.6) A (0.3)
EB C C C C E E D D D D D D
EBL D D C C E E E E D D E D
EBR C C C C D D D D D D D D
NB A A A A C A A A A A A A
NBT A A A A C A A A A A A A
NBR A A A A A A A A A A A A
SB B A B A B B B B A A A A
SBL B A B A B B A B A A A A
SBT B A B A A B B B A A A A
OVERALL B (15.6) B (13.9) B (15.7) B (10.5) C (20.0) B (16.0) B (13.7) B (16.9) B (13.1) B (12.4) A (6.7) A (7.9)
EB C C C C D D E D D D D D
EBL C C C C E D E D D D D D
EBLT C C C C D D E D D D D D
EBR C C C C D D D D D D C D
WB C C C C D D D D D D D D
WBL C C C C D D D D D D D D
WBTR C C C C D D D D D D D D
NB A A A A A A A A A A A A
NBL A A A A B A C A B A A A
NBT A A A A A A A A A A A A
NBTR A A A A A A A A A A A A
SB A A A A B A C A B A A A
SBL A A A A A A A A A A A A
SBT A A A A B A F (28.4) A B A A A
SBR A A A A A A A A A A A A
OVERALL A (4.2) A (7.7) A (6.0) A (7.9) B (17.5) B (15.1) C (20.9) B (14.4) B (18.9) B (12.0) B (12.6) B (12.3)
EB D D D D E E E E E E E E
WB D D D D E E E E E E E E
WBLT D D D D E E E E E E E E
WBR A A D D E E E E E E E E
NB A A A A A B A A A A A A
NBL A A A A A A A A A A A A
NBTR A A A A A B A A A A A A
SB A A A A A A A A A A A A
SBL A A A A A B A A A A A A
SBTR A A A A A A A A A A A A
OVERALL A (3.1) A (3.4) A (2.6) A (3.1) A (4.0) A (8.2) A (5.4) A (3.7) A (4.1) A (4.2) A (3.0) A (4.0)
EB D D D D E E E E E E E E
WB D D D D E E E E D E E D
NB A A A A B C B A A A A A
SB A A A A A A A A B A A A
OVERALL A (8.1) B (11.1) A (8.6) A (7.5) B (14.6) B (17.5) B (13.4) B (10.9) B (13.4) A (8.3) A (9.3) A (7.9)
68
Waddle Road / Strouse Avenue
Waddle Road / Clearview Avenue
Waddle Road / I-99 NB - Rt. 322 EB
Ramps
Intersection
Waddle Road / I-99 SB - Rt. 322 WB On
Ramps{Signalized}
Approach (Movement)
AM Peak 105 sec cycle
Waddle Road / I-99 SB - Rt. 322 WB Off
Ramps{unsignalized}
Waddle Road / Colonnade Boulevard
TABLE 12
PM Peak 150 sec cycle
Saturday Peak 145 sec cycle
2040 Design Year Traffic Volumes(Partial Cloverleaf)
Final Intersection Level of Service Results
Waddle Road / I-99 Interchange ProjectAlternative Analysis
2040 PARTIAL CLOVERLEAF ALTERNATE
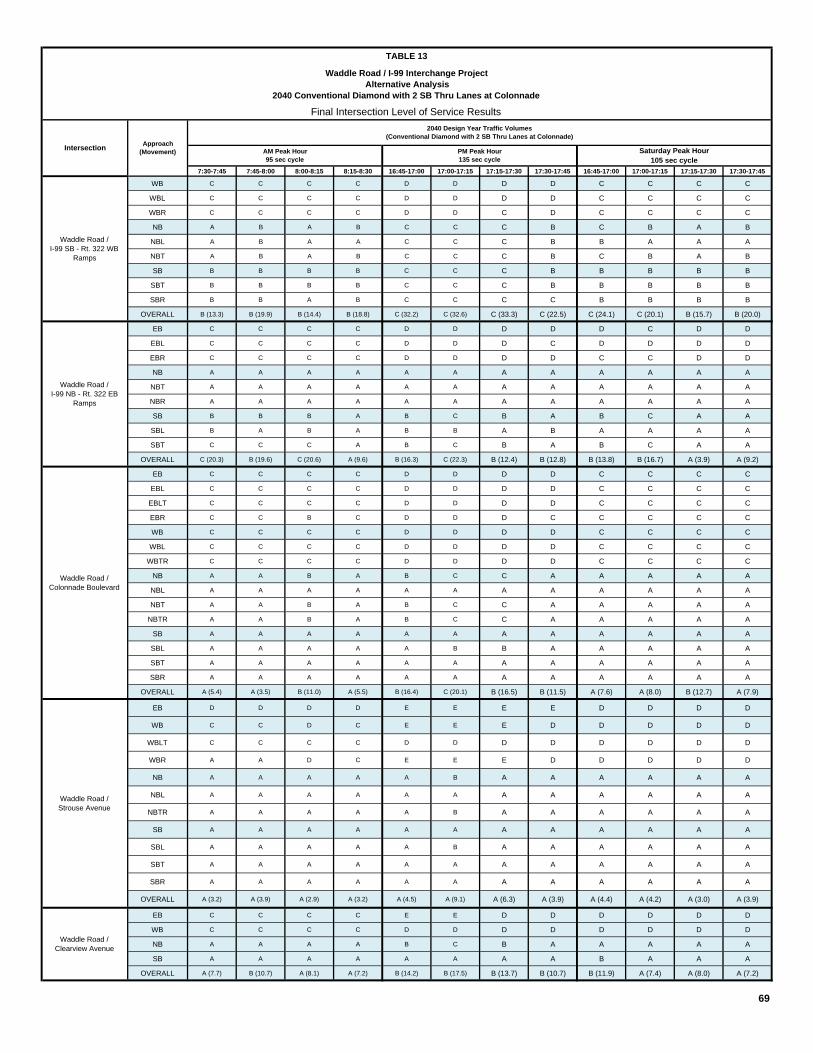
7:30-7:45 7:45-8:00 8:00-8:15 8:15-8:30 16:45-17:00 17:00-17:15 17:15-17:30 17:30-17:45 16:45-17:00 17:00-17:15 17:15-17:30 17:30-17:45
WB C C C C D D D D C C C C
WBL C C C C D D D D C C C C
WBR C C C C D D C D C C C C
NB A B A B C C C B C B A B
NBL A B A A C C C B B A A A
NBT A B A B C C C B C B A B
SB B B B B C C C B B B B B
SBT B B B B C C C B B B B B
SBR B B A B C C C C B B B B
OVERALL B (13.3) B (19.9) B (14.4) B (18.8) C (32.2) C (32.6) C (33.3) C (22.5) C (24.1) C (20.1) B (15.7) B (20.0)
EB C C C C D D D D D C D D
EBL C C C C D D D C D D D D
EBR C C C C D D D D C C D D
NB A A A A A A A A A A A A
NBT A A A A A A A A A A A A
NBR A A A A A A A A A A A A
SB B B B A B C B A B C A A
SBL B A B A B B A B A A A A
SBT C C C A B C B A B C A A
OVERALL C (20.3) B (19.6) C (20.6) A (9.6) B (16.3) C (22.3) B (12.4) B (12.8) B (13.8) B (16.7) A (3.9) A (9.2)
EB C C C C D D D D C C C C
EBL C C C C D D D D C C C C
EBLT C C C C D D D D C C C C
EBR C C B C D D D C C C C C
WB C C C C D D D D C C C C
WBL C C C C D D D D C C C C
WBTR C C C C D D D D C C C C
NB A A B A B C C A A A A A
NBL A A A A A A A A A A A A
NBT A A B A B C C A A A A A
NBTR A A B A B C C A A A A A
SB A A A A A A A A A A A A
SBL A A A A A B B A A A A A
SBT A A A A A A A A A A A A
SBR A A A A A A A A A A A A
OVERALL A (5.4) A (3.5) B (11.0) A (5.5) B (16.4) C (20.1) B (16.5) B (11.5) A (7.6) A (8.0) B (12.7) A (7.9)
EB D D D D E E E E D D D D
WB C C D C E E E D D D D D
WBLT C C C C D D D D D D D D
WBR A A D C E E E D D D D D
NB A A A A A B A A A A A A
NBL A A A A A A A A A A A A
NBTR A A A A A B A A A A A A
SB A A A A A A A A A A A A
SBL A A A A A B A A A A A A
SBT A A A A A A A A A A A A
SBR A A A A A A A A A A A A
OVERALL A (3.2) A (3.9) A (2.9) A (3.2) A (4.5) A (9.1) A (6.3) A (3.9) A (4.4) A (4.2) A (3.0) A (3.9)
EB C C C C E E D D D D D D
WB C C C C D D D D D D D D
NB A A A A B C B A A A A A
SB A A A A A A A A B A A A
OVERALL A (7.7) B (10.7) A (8.1) A (7.2) B (14.2) B (17.5) B (13.7) B (10.7) B (11.9) A (7.4) A (8.0) A (7.2)
69
Intersection Approach (Movement) AM Peak Hour
95 sec cyclePM Peak Hour 135 sec cycle
TABLE 13
Waddle Road / Colonnade Boulevard
Waddle Road / Strouse Avenue
Waddle Road / Clearview Avenue
Waddle Road / I-99 SB - Rt. 322 WB
Ramps
Waddle Road / I-99 NB - Rt. 322 EB
Ramps
Saturday Peak Hour 105 sec cycle
2040 Design Year Traffic Volumes (Conventional Diamond with 2 SB Thru Lanes at Colonnade)
Waddle Road / I-99 Interchange ProjectAlternative Analysis
2040 Conventional Diamond with 2 SB Thru Lanes at Colonnade
Final Intersection Level of Service Results
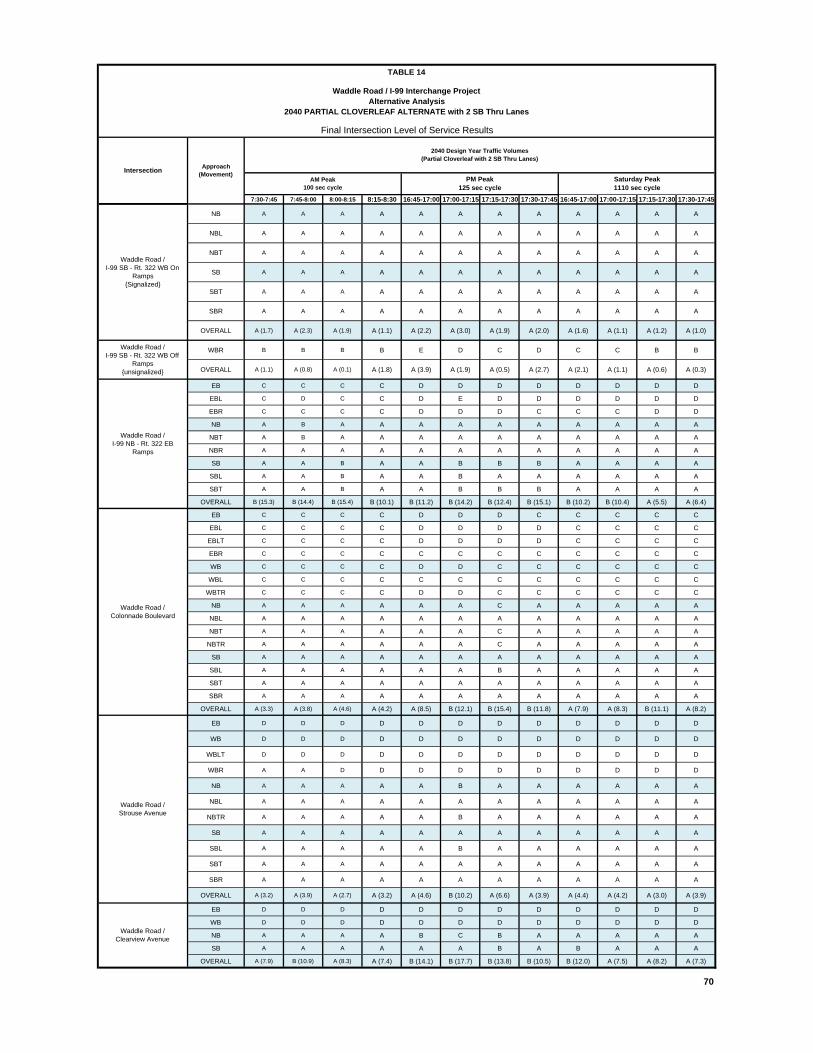
7:30-7:45 7:45-8:00 8:00-8:15 8:15-8:30 16:45-17:00 17:00-17:15 17:15-17:30 17:30-17:45 16:45-17:00 17:00-17:15 17:15-17:30 17:30-17:45
NB A A A A A A A A A A A A
NBL A A A A A A A A A A A A
NBT A A A A A A A A A A A A
SB A A A A A A A A A A A A
SBT A A A A A A A A A A A A
SBR A A A A A A A A A A A A
OVERALL A (1.7) A (2.3) A (1.9) A (1.1) A (2.2) A (3.0) A (1.9) A (2.0) A (1.6) A (1.1) A (1.2) A (1.0)
WBR B B B B E D C D C C B B
OVERALL A (1.1) A (0.8) A (0.1) A (1.8) A (3.9) A (1.9) A (0.5) A (2.7) A (2.1) A (1.1) A (0.6) A (0.3)
EB C C C C D D D D D D D D
EBL C D C C D E D D D D D D
EBR C C C C D D D C C C D D
NB A B A A A A A A A A A A
NBT A B A A A A A A A A A A
NBR A A A A A A A A A A A A
SB A A B A A B B B A A A A
SBL A A B A A B A A A A A A
SBT A A B A A B B B A A A A
OVERALL B (15.3) B (14.4) B (15.4) B (10.1) B (11.2) B (14.2) B (12.4) B (15.1) B (10.2) B (10.4) A (5.5) A (6.4)
EB C C C C D D D C C C C C
EBL C C C C D D D D C C C C
EBLT C C C C D D D D C C C C
EBR C C C C C C C C C C C C
WB C C C C D D C C C C C C
WBL C C C C C C C C C C C C
WBTR C C C C D D C C C C C C
NB A A A A A A C A A A A A
NBL A A A A A A A A A A A A
NBT A A A A A A C A A A A A
NBTR A A A A A A C A A A A A
SB A A A A A A A A A A A A
SBL A A A A A A B A A A A A
SBT A A A A A A A A A A A A
SBR A A A A A A A A A A A A
OVERALL A (3.3) A (3.8) A (4.6) A (4.2) A (8.5) B (12.1) B (15.4) B (11.8) A (7.9) A (8.3) B (11.1) A (8.2)
EB D D D D D D D D D D D D
WB D D D D D D D D D D D D
WBLT D D D D D D D D D D D D
WBR A A D D D D D D D D D D
NB A A A A A B A A A A A A
NBL A A A A A A A A A A A A
NBTR A A A A A B A A A A A A
SB A A A A A A A A A A A A
SBL A A A A A B A A A A A A
SBT A A A A A A A A A A A A
SBR A A A A A A A A A A A A
OVERALL A (3.2) A (3.9) A (2.7) A (3.2) A (4.6) B (10.2) A (6.6) A (3.9) A (4.4) A (4.2) A (3.0) A (3.9)
EB D D D D D D D D D D D D
WB D D D D D D D D D D D D
NB A A A A B C B A A A A A
SB A A A A A A B A B A A A
OVERALL A (7.9) B (10.9) A (8.3) A (7.4) B (14.1) B (17.7) B (13.8) B (10.5) B (12.0) A (7.5) A (8.2) A (7.3)
70
TABLE 14
Waddle Road / I-99 SB - Rt. 322 WB Off
Ramps{unsignalized}
Waddle Road / Colonnade Boulevard
Waddle Road / Strouse Avenue
Waddle Road / Clearview Avenue
Waddle Road / I-99 NB - Rt. 322 EB
Ramps
IntersectionPM Peak
125 sec cycleSaturday Peak 1110 sec cycle
2040 Design Year Traffic Volumes(Partial Cloverleaf with 2 SB Thru Lanes)
Final Intersection Level of Service Results
Waddle Road / I-99 Interchange Project Alternative Analysis
2040 PARTIAL CLOVERLEAF ALTERNATE with 2 SB Thru Lanes
Waddle Road / I-99 SB - Rt. 322 WB On
Ramps{Signalized}
Approach (Movement)
AM Peak 100 sec cycle
Waddle Road / I-99 Interchange Project Preferred Alternatives – Updated 2040 Traffic Analysis
71
E. FINDINGS AND CONCLUSIONS The following are the major findings and conclusions of the preferred alternatives updated traffic analysis:
1. Major capacity improvements are required at the existing conventional diamond interchange (No-Build Alternative) to accommodate the 2040 design year traffic congestion and safety conditions. The major contributor to the need is the forecasted growth for the Toftrees West area.
2. Both the Conventional Diamond and Partial Cloverleaf preferred build alternatives should provide desired overall LOS C or better with the 2040 design year traffic volumes. However, southbound through lane capacity and queuing may remain a congestion and safety problem without improvements to the Colonnade Boulevard intersection. Spillback may occur through the interchange, largely during the PM peak hour period.
3. To address the southbound queuing / spillback issue, a range of improvement options were
investigated at the Waddle Road / Colonnade Blvd intersection. An auxiliary southbound through lane from Colonnade Blvd to Strouse Avenue was found to address the capacity issue for both the preferred build alternatives. However, queuing and spillback through the interchange may remain a congestion and safety problem with the Partial Cloverleaf build alternative during a short portion of the PM peak hour period. Queue lengths on the southbound leg are approximately 20 percent longer with this alternative.
4. The Conventional Diamond build alternative is considered to be more pedestrian and bicycle
friendly than the Partial Cloverleaf alternative.
5. The Conventional Diamond build alternative can be expanded to accommodate a Partial Cloverleaf (Par Clo - B) in the northwest quadrant in the future if traffic conditions and needs change.
6. In the design year 2040, Waddle Road south of Colonnade Blvd may become congested due
to the through traffic volumes for a short portion of the PM peak hour period.
Table 15 provides a summary performance comparison of the no-build and preferred alternatives.
Waddle Road / I-99 Interchange Project Preferred Alternatives – Updated 2040 Traffic Analysis
72
In conclusion, the Conventional Diamond build alternative, with the auxiliary through lane at Colonnade Blvd, was found to be the most effective improvement to accommodate the 2040 design year conditions. A conceptual design of this preferred build alternative is shown in Figure 24.
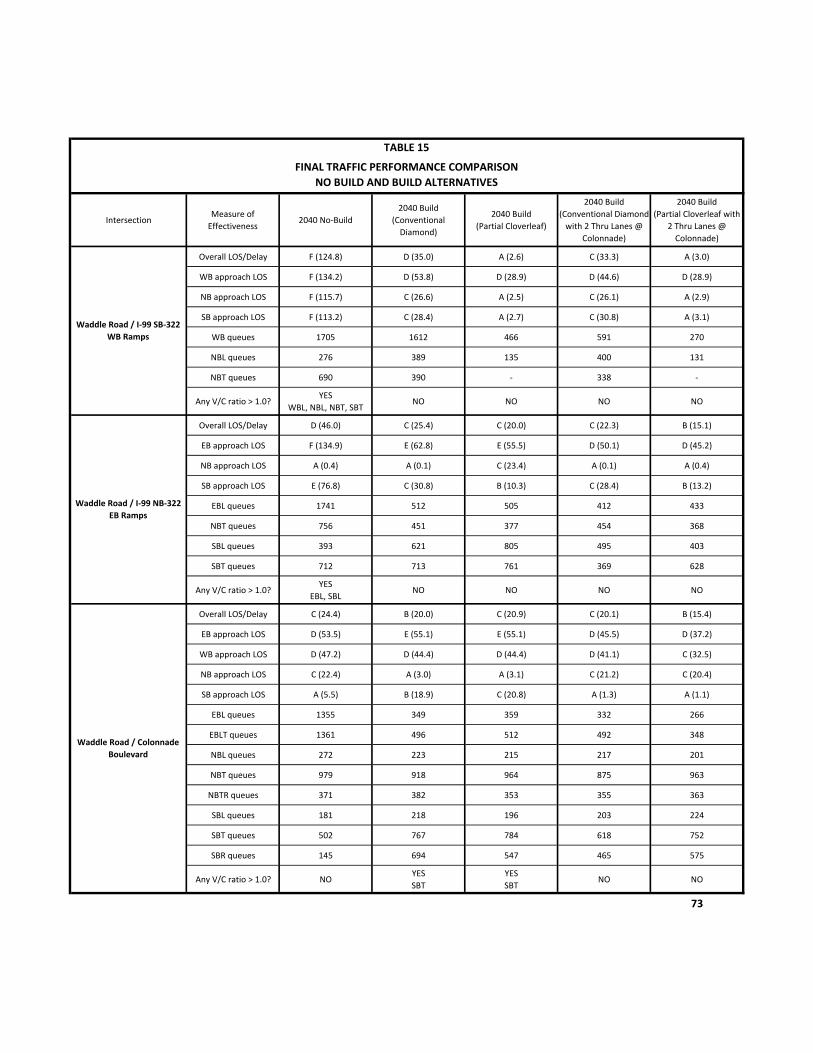
IntersectionMeasure of
Effectiveness2040 No‐Build
2040 Build
(Conventional
Diamond)
2040 Build
(Partial Cloverleaf)
2040 Build
(Conventional Diamond
with 2 Thru Lanes @
Colonnade)
2040 Build
(Partial Cloverleaf with
2 Thru Lanes @
Colonnade)
Overall LOS/Delay F (124.8) D (35.0) A (2.6) C (33.3) A (3.0)
WB approach LOS F (134.2) D (53.8) D (28.9) D (44.6) D (28.9)
NB approach LOS F (115.7) C (26.6) A (2.5) C (26.1) A (2.9)
SB approach LOS F (113.2) C (28.4) A (2.7) C (30.8) A (3.1)
WB queues 1705 1612 466 591 270
NBL queues 276 389 135 400 131
NBT queues 690 390 ‐ 338 ‐
Any V/C ratio > 1.0?YES
WBL, NBL, NBT, SBTNO NO NO NO
Overall LOS/Delay D (46.0) C (25.4) C (20.0) C (22.3) B (15.1)
EB approach LOS F (134.9) E (62.8) E (55.5) D (50.1) D (45.2)
NB approach LOS A (0.4) A (0.1) C (23.4) A (0.1) A (0.4)
SB approach LOS E (76.8) C (30.8) B (10.3) C (28.4) B (13.2)
EBL queues 1741 512 505 412 433
NBT queues 756 451 377 454 368
SBL queues 393 621 805 495 403
SBT queues 712 713 761 369 628
Any V/C ratio > 1.0?YES
EBL, SBLNO NO NO NO
Overall LOS/Delay C (24.4) B (20.0) C (20.9) C (20.1) B (15.4)
EB approach LOS D (53.5) E (55.1) E (55.1) D (45.5) D (37.2)
WB approach LOS D (47.2) D (44.4) D (44.4) D (41.1) C (32.5)
NB approach LOS C (22.4) A (3.0) A (3.1) C (21.2) C (20.4)
SB approach LOS A (5.5) B (18.9) C (20.8) A (1.3) A (1.1)
EBL queues 1355 349 359 332 266
EBLT queues 1361 496 512 492 348
NBL queues 272 223 215 217 201
NBT queues 979 918 964 875 963
NBTR queues 371 382 353 355 363
SBL queues 181 218 196 203 224
SBT queues 502 767 784 618 752
SBR queues 145 694 547 465 575
Any V/C ratio > 1.0? NOYES
SBT
YES
SBTNO NO
73
Waddle Road / I‐99 SB‐322
WB Ramps
Waddle Road / I‐99 NB‐322
EB Ramps
Waddle Road / Colonnade
Boulevard
FINAL TRAFFIC PERFORMANCE COMPARISON
NO BUILD AND BUILD ALTERNATIVES
TABLE 15
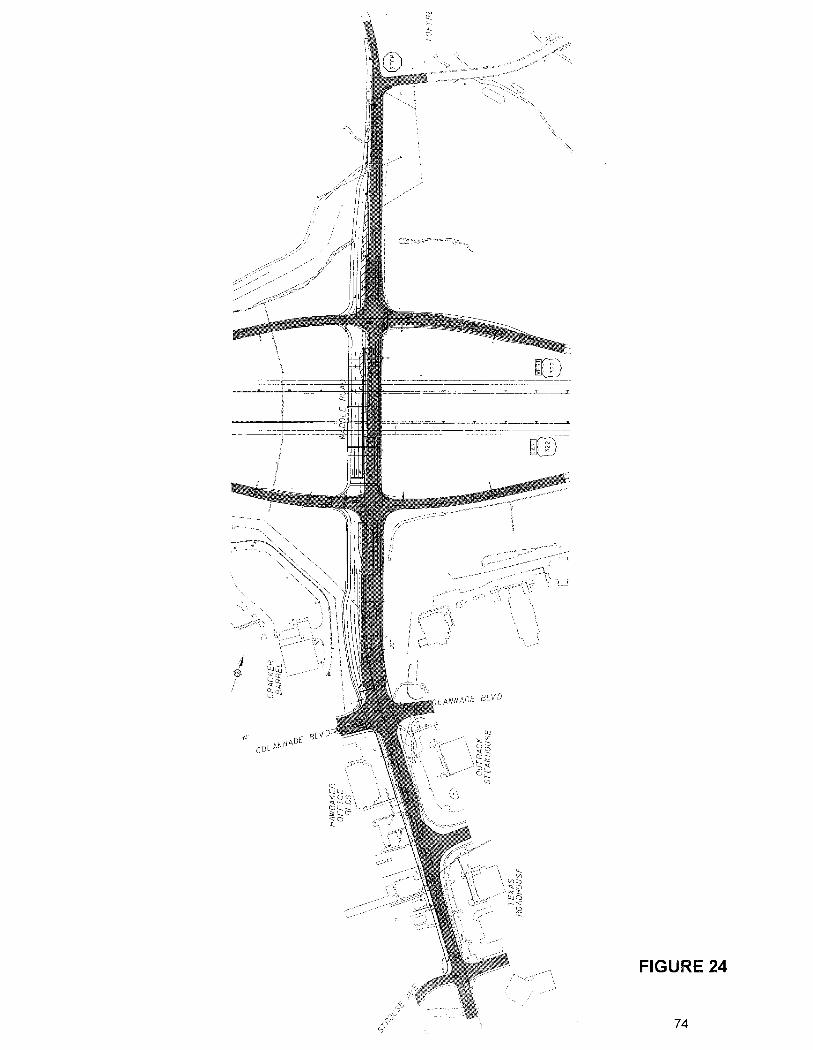
Waddle Road / I-99 Interchange Project Appendices
75
APPENDICES