November 1973 - apps.dtic.mil · this document is best quality available. the copy furnished to...
94
AD-787 880 THE INTERPRETATION OF REACTION TIME IN INFORMATION PROCESSING RESEARCH Robert G. Pachella Michigan University Prepared for: Air Force Office of Scientific Research ^ November 1973 DISTRIBUTED BY: Kfiri National Technical Information Service U. S. DEPARTMENT OF COMMERCE rf^
Transcript of November 1973 - apps.dtic.mil · this document is best quality available. the copy furnished to...

AD-787 880
THE INTERPRETATION OF REACTION TIME IN INFORMATION PROCESSING RESEARCH
Robert G. Pachella
Michigan University
Prepared for:
Air Force Office of Scientific Research
^
November 1973
DISTRIBUTED BY:
Kfiri National Technical Information Service U. S. DEPARTMENT OF COMMERCE
rf^

THIS DOCUMENT IS BEST QUALITY AVAILABLE. THE COPY
FURNISHED TO DTIC CONTAINED
A SIGNIFICANT NUMBER OF
PAGES WHICH DO NOT
REPRODUCE LEGIBLYo

010588-13-E
AFOSR -TR-74-161ST
.. HUMAN PERFORMANCE CENTER 00 DEPARTMENT OF PSYCHOLOGY 00 i> , The University of Michigan, Ann Arbor 00 o <
The Interpretation or Reaction Time in Information Processing Research
ROBERT G. PACHELLA
D D C
X\ MOV 8 1974
Approved for public release: j j;j- jr;j^rn-prpl distribution unlimited. UÜU^,hÜ Ü LbLi
Technical Report No. 45
Reproduced by
NATIONAL TECHNICAL INFORMATION SERVICE U S Department of Commerce
Springfield VA 22151
November 1973
TO

ft hm fw
1 ■■' J KM!t SMttoa^s«
j C Ssfl Seettoo ' Q
JillTIf iCftuM , i i
k
I BY
j tHSiWUTHM/MAtlttll
hl:1. ~ AY/M. MO.
iTYOOOES
jf SPBtJÄT-
fc! w— )
';
THE HUMAN PERFORMANCE CENTER
DEPAR TMENT OF PSYCHOLOGY
The Human Performance Center is a federation of research programs whose emphasis is on man as a processor of information. Topics under study include perception, attention, verbal learning and behavior, short- and long-term memory, choice and decision proc- esses, and learning and performance in simple and complex skills. The integrating concept is the quantitative description, and theory, of man's performance capabilities and limitations and the ways in which these may be modified by learning, by instruction, and by task design.
The Center issues two series of reports. A Technical Report series includes original reports of experimental or theoretical studies, and integrative reviews of the scientific literature. A Mem- orandum Report series includes printed versions of papers presented orally at scientific or professional meetings or symposia, methodo- logical notes and documentary materials, apparatus notes, and ex- ploratory studies.
(
A;R w~
Di:
lrr rr -• - :.VSQ
.! is d (7b).
iv •i:.c.\ c;;;cü-
*»

Unc"1 assified Security Cla»«ific»Uon /qp-^g7^
DOCUMENT CONTROL DATA R&D (Smtwlty cta9$lt)cmtion at till*, body ol mbmttmct mpd tnJmming mnnatmHan uat * • mnftmd wh»n ihm ov«r*fl «port I» tlmfift+it) i
I oiHCiNATiNC ACTIVIT* (Cotpotmtm MtlthlW)
University of Michigan, Human Performance Center Department of Psychology, Ann Arbor, Michigan
2«, Rtl'OHT SCCUKITY CLASSIFICATION
Unclassified ?b cnouP
3 REPORT TITLE
THE INTERPRETATION OF REACTION TIME IN INFORMATION PROCESSING RESEAR CH
4. OEJCdlPTl VE NOTES (Typ» of ittpotl und Inclumitrm daft)
Scientific Interim s AU THOR(S) (Html MM, mlddl» Inlitmt. I»i naai«)
Robert G. Pachella
« REPORT DATE
November 1973 7». TOT 4L MO OF PACES
87 7b. NO. OP KEFS
39 «A. CONTRACT OR GRANT NO
FM620-72-C-0019 •A). ORIGINATOR'S REPORT NUMBER)*!
6. PROJECT NO
«• 61101D
* 681313
1949
%h OTHER REPORT NO!S> (Any othar m«ib*fi that m**r £>• m*migrtmd iM« rmport)
AFOSR -TR-74-161 3' 10 DISTRIBUTION STATEMENT
1 Approved for public release; distribution unlimited.
II SUPPLEMENTARY NOTES
TECH, OTHER
II SPONSORING MILITÄR« ACTIVITY
Air Force Office of Scientific Research 1400 Wilson Boulevard WL) Arlington, Virginia 22209
13 ABSTRACT
This chapter discusses the use of reaction time measures in modern experiner." psychology. Methodological and theoretical issues are raised concerning the legi: of experimentation in which reaction time is the major dependent variable and z'r.e limitations of interpretation of reaction time in the presence of variable error rates. The relationship between the speed and the accuracy of performance ana theoretical models underlying this relation are also discussed.
Rnprodurert by
NATIONAL TECHNICAL INFORMATION SERVICE
U R Oopartnipnt of ComTrtj-rc© SprinRfieid VA 22151
DD /.T..1473 Unc! assifiort

7 Security ClaasificsH
3 KCV MONO*
reaction time Additive Factor Method Subtraction Method Speed-Accuracy Trade-off
I» Unclassified Security Claaaiftcation
m*

THE UNIVERSITY OF MICHIGAN
COLLEGE OF LITERATURE, SCIENCE AND THE ARTS
DEPARTMENT OF PSYCHOLOGY
THE INTERPRETATION OF REACTION TIME IN
INFORMATION PROCESSING RESEARCH
Robert G. Pachella
V HUMAN PERFORMANCE CENTER—TECHNICAL REPORT UO. h$
November, 1973
D D C
j^ NOV 8 1974
üteEUTTE D
n
This research was supported by the Advanced Research Projects Agency, Department of Defense, and monitored by the Air Force Office of Scientific Research, under Contract No. F^l4620-72-C-0019 with the Human Performance Center, Department of Psychology, University of Michigan.
This paper will appear as a chapter in 3. Kantowitz (Ed.), Human In- formation Processing: Tutorials in Performance and Cognition, New York: Lawrence Earlbaum Associates, 197^"
m Approved for public release; distribution unlimited.

/
The Interpretation of Reaction Time in
Information Processing Research
Robert G. Pachella
The University of Michigan
Introduction
Reaction time measures have become increasingly prevalent in human
information processing research. This increased use over the past few
years has taken two distinct forms. First, a large number of experiments
utilizing reaction time as the major dependent variable have appeared in
the literature on substantive psychological problems. Included among
these problems are such topics as sensory coding and selective attention,
the retrieval of information from long and short term memory, psychological
refractoriness, parallel and serial information processing, the psycho-
logical representation of semantic and logical relations and the selection
and execution of responses. Indeed, reaction time has become about as
couLuon a dependent variable as there is in human experimental psychology,
The goal of this substantive research has been to understand basic
psychological processes. In this endeavor, reaction time measures have
sometimes been used as much for convenience as for any particular theoret-
ical purpose. Deriving predictions about the duration of psychological
processes from the theoretical models describing such processes has become
:i common practice. These derivations seemingly involve only a few straight-
forward assumptions which link the duration of a process to what it accom-
plishes. However, as intuitive as these assumptions seem, the implicit
acceptance of them on the part of many researchers has limited the poten-
tial contribution of their work. Without the explicit statement of how
reaction time is related to the ongoing process, it is often difficult to
relate the observed variation in the obtained reaction times to the infor-
mational transformations and manipulations that are supposed to be going
on in the hypothesized processing network. In other words, it is not
always obvious how information about process durations is psychologically
meaningful. Deese (1969, p. 518), for example, exprejsing some doubts
about contemporary cognitive psychology, has observed that, "We have
insisted upon the measurement of behavior to the extent that most of the
things we observe in experiments have no relevance for the process of
thinking, other than the empty observation that thinking, like most pro-
cesses, takes a measurable amount of time." Thus, there is a need to
examine explicitly the assumptions upon which the use of reaction time
measures in substantive research is founded.
A second area of research, also making use of reaction time measures,
has concerned itself more directly with the study of reaction time per se.
Ill is kind of research has generally been concerned with discovering the
conditions and parameters th.it produce and account for variation in reac-
tion time without regard for specific experimental paradigms and substan-
tive problems. Such factors as the distribution of stimuli (e.g., the

/
Fache11a 3
number, frequency and presentation order of specific stimuli), the distri-
bution of responses, the intertrial intervals and the relative emphasis
of speed vs. accuracy have all been shown to have systematic effects on
reaction time in various different experimental paradigms.
This class of research has been seen by some investigators to be of
limited value to the class of research on substantive issues. To some
extent work such as this has been considered methodological in nacure.
It has attempted to discover the conditions and procedures under which
reaction time measures can be collected most reliably and interpreted most
reasonably. Until recently, parameters which were known to affect reac-
tion time per se were thought to be artifacts to be removed from experi-
ments on problems of substance in which reaction time was simply being
used as a dependent variable. Some psychologists have actually found it
disquieting that there exist researchers who seem to have actively taken
up the study of a dependent variable per se and its associated experimental
artifacts. In fact, one psychologist, who was studying problems of human
memory, was once asked by a reaction time researcher to describe his own
work; he clawed sarcastically that he was engaged in the study of "per-
cent correct." The point, of course, is that reaction time, like percent
correct, Is simply a measure. It is neither a process nor a mechanism,
and thus::, some people feel it should not be an object of direct attention.
Nevertheless, given the prevalence of reaction time measures in contempo-
rary experimental work, it is clear that what is known about reaction time
per se should be related to reaction time as it is used as a dependent
variable.
.fc_
F.'iehel LT I*
Tlie purpose, then, of this chapter will be ;. examine some reaction
time research. It is not intended as a reviev of literature about par-
ticular substantive iseues, but rather it is an attempt to extract from
that literature the manner in which reaction time measures have been used
to draw inferences about psychological processes. Furthermore, an attempt
will be made to examine some of the assumptions and principles upon which
the interpretation of reaction time measurement is based. It is hoped
that the juxtaposition of these sets of issues will lead to the more care-
ful use and interpretation of reaction time measures in the understanding
of human information processing.
'Die use of reaction time as a dependent variable.—To some extent
the prevalence of reaction time measures over the past few years can be
traced to the concurrent resurgence of interest in cognitive psychology.
In contrast to earlier, more behavioristic approaches, modern cognitive
psychology can be characterized as the study of events which cannot be
directly observed. The events of interest to a cognitive psychologist
usually take place when the subject is not engaged in any overt activity.
They are events which often do not have any overt behavioral component.
Thus, reaction time is often chosen as a dependent variable by default:
there simply isn't much else that can be neasured.
It is true, of course, that one can make inferences about unobserva-
ble mental events by studying subsequent behavior that results from or is
dependent upon this cognitive activity. Much cognitive research is done
in this manner. However, these indirect procedures are not always useful
in situations where a subject is not making a lot of errors or where
■A^
fache11a 5
experimental conditions have not drastically degraded performance, The
only property of mental events that can be studied directly, in the intact
organism, while the events are taking place, is their duration.
A second and per.iaps more important consideration accounting for the
popularity of reaction time measures is the indisputable nature of time
as a meaningful and measurable quantity. It is often the case that depen-
dent vuriables in psychology are only arbitrarily related to the underlying
construct for which they are a measure. For example, an investigator
interested in the amount of learning that can be produced by some experi-
mental manipulation, might choose the percentage of correct items or. a
post test as his dependent variable. Percent correct in this case is only
a surrogate for the real variable of interest, "amount of learning." Any
monotonic transformation of percent correct would likely do as well. By
contrast, one would no^ arbitrarily transform the time scale, because time
itself is directly meaningful. The events being studied are considered to
be filling real time, and thus real time is_ the variable of interest.
This point takes on particular significance if the independent vari-
ables in an experiment interact in a statistical sense; that is, if the
effect of one independent variable is fundamentally changed depending on
the level of some other independent variable. For the purposes of con-
structing theories, multifactor experiments which test for the existence
of such interactions have more efficacy than experiments testing the
simple effects of individual variables. However, the interpretation of
data from multifactor experiments is contingent upon the scalability of
the dependent variable. Many statistical interactions can be either

Pnohella 6
produced or eliminated by a suitable monotonic transformation of the
dependent variable. Thus, given the inviolable character of reaction
time against such arbitrary rescaling, the interpretation of such inter-
actions or 3ack thereof, wh<n obtained, is that much more secure.
heaction time as commonly defined.—-What is it that gets measured
when -he dependent variable in an experiment is reaction time? This ques-
tion should be kept distinct, for the moment, from the related question
of how reaction times are interpreted once they are obtained. The ques-
tion here concerns simply how reaction times are obtained; what they mean
in an operational sense.
Reaction time most typically is defined as the interval between the
presentation of a stimulus to a subject and the subject's response. More
operationally stated, this interval is usually measured from ihe onset of
the stimulus presentation to the initiation of the subject's response.
Certain definitional problems must be solved in order to measure reaction
time in this way. To begin with, the constitution of a stimulus presen-
tation and, thus, the definition of its onset is not always psychologically
obvious. For example, auditory and visual stimuli have fundamentally dif-
ferent temporal characteristics in the way in which they can be presented;
auditory stimuli must necessarily be spread out in time, while visual
stimuli can, in principle, be presented instantaneously. Further, occa-
sionally a stimulus presentation will consist of a discrete, temporal
sequence of items. In this case reaction time is measured, operationally,
from the onset of the last item. In a more functional sense, however,

Fachen a 7
defining "stimulus presentation" in this manner may be somewhat dübioufi;
especially when ruch a sequential presentation is compared to one in which
all of the items are presented simultaneously.
Similar problems exist at the response end of the reaction time
interval. Occasionally, the initiation of a response is also noc well
defined. Variability in reaction time can be obtained strictly as a func-
tion of a response's susceptibility to physical measurement. For example,
different initial phonemes in a vocal response will take differential
amounts of time to activate a voice key. Furthermore, the amount of time
it takes to initiate a response is not always free of the effects of
response characteristics, such as response length or complexity, which
temporally follow the initiation of the response. Thus, the operational
definition of reaction time as the interval between the onset of the stim-
ulus and the initiation of a response is not always a simple matter: it
is intimately linked to whatever operational definitions are supplied to
the terms "stimulus" and "response." To the extent that these operational
procedures become confounded with experimental conditions, the further
interpretation of the obtained reaction times is limited.
There is another more subtle procedural question involved in defining
the reaction time interval. It is more subtle because it involves the
intentions of the experimental subject. Reaction times are generally
assumed, on the basis of either explicit or implicit instructions, to be
generated under conditions where the subject is trying to minimize his
response time. It is generally assumed that the subject in a reaction
time experiment waits for the stimulus to be presented, does whatever he
-*L
Fache!la 8
has to do in his usual manner in order to respond correctly, and then
responds immediately. In other words, the subject is not rushing his
response, nor is he wasting any time: reaction time is taken to be the
minimum amount of time needed by the subject in order to produce a correct
response.
Since instructions to the subject are not the type of procedure that
always produce the desired result, the obtained reaction times sometimes
require post hoc editing. These procedures consist of eliminating from
the data responses +.hat for one i ;ason or another seem out of the ordinary,
and while it is likely that such editing procedures are often carried out
for superstitious reasons, they nevertheless tend tc have a definitional
effect. That is, the data which are most typically reported in experi-
ments utilizing reaction time as the dependent variable are from the
responses that seem most likely to represent the minimum intervals needed
by subjects to produce correct responses. For t..ample, very fast responses
are occasionally eliminated on the grounds that they represent "anticipa-
tion'1 response0 that seem to havt been initiated without the subject
strictly waiting for the stimulus to appear. Sometimes extremely slow
responses are eliminated. Tnis can be accomplished by simply removing
responses vhich are longer than some predetermined criterion, or by
reporting the median reaction time for a ccadition. This will tend to
eliminate the effect of the generally positively skewed tail of a reaction
time distribution.
While the practice of removing responses from data on the basis of
their being "too fast" or "too slow" is perhaps arbitrary, a more common

/
Puchella 9
practice, the removal of error responses, has seemed somewhat more Justi-
fiable. This is because these trials are well defined and are clearly in
violation of the basic definition of reaction time. A trial on which an
error is made is apparently the result of activity which is not related
to the process under investigation; clearly, if the subject has made an
error he has done something out of the ordinary on that trial. Thus,
investigators generally examine and report only the reaction times result-
ing from correct responses.
Whether such editing of experimental data can actually be Justified
will be the focus of later discussion. Nevertheless, in practice, the
reaction times that get reported in experimental literature generally
conform to the above requirements, and thus serve as the basis for any
further theoretical interpretations that may be called for in an experi-
ment .
Experimental Logic and Reaction Time Measures
Aside from questions about the conditions under which reaction time
measures are obtained, the further interpretation of reaction time is
dependent upon the experimental logic involved in specific situations.
For example, experimenters often desire to interpret the reaction times
obtained in an experiment as "the time to recognize," "the time to deduce,"
"decision time," or "the time to search memozy." In order to allow any
of these specific interpretations, an experiment must employ a design
which is suitable to the conclusion that the obtained variation, in reac-
tion time is related to the variation in the duration of the particular
■' ~ —^—^—^—*~m
rucliellu LO
mental process under study. Since most of these processes are unobserved
and mediational, it is almost always necessary to employ the kind of
experimental designs classified by Garner, Hake and Eriksen (1951*) as
converging operations: they must include several conditions, none of
which uniquely identify the effect of the process under study, but which
taken together define such an effect.
Of course, all of the general principles of experimental design and
deductive logic are applicable when reaction time is a dependent variable.
However, at present two commonly used types of converging operations have
particular significance for information processing research. These are
the Subtraction Method and the Additive Factor Method, which will be dis-
cussed in some detail below. Each of these methods can be contrasted with
a more molar approach to experimentation in which obtained reaction times
are of interest essentially without further interpretation. That is,
whereas the methods to be described below have as their purpose the sub-
dividing of the time interval between stimulus and response into media-
tional effects, the molar approach takes the entire interval as its unit
of interest. It is, for example, a suitable approach in situations where
the immediate function of an experiment is to discover how long it takes
to perform some relatively well-defined perceptual-motor task. In such
cases converging operations are hardly necessary. Thus, while such an
approach is of great value to some areas of research (e.g., e.pplied prob-
lems), it is of only marginal significance to information processing
research which attempts to investigate the mental processes intervening
between a stimulus and a response.
Pachella 11
The Subtraction Method.—One of the problems confronting an informa-
tion processing researcher regarding the interpretation of reaction time
measures is the attribution of the effect of some experime ital manipula-
tion to a particular mediating process. This is a problem because a
reaction time interval always involves other processes besides the one of
interest.. The Subtraction Method is a set of converging operations that
is commonly used, often without being labeled as such, to eliminate this
problem. When applicable, it allows for the isolation of a mediating
process and the measurement of its duration. The method is applicable
when tne performance of an experimental task involves the sequential
action of a series of discrete mental events. In order to measure the
duration of one of these mental events, the reaction time for an experi-
mental task containing the event as a subprocess is compared to that for
a comparison task which differs from the experimental task only by the
deletion of the process of interest. In other words, the comparison task
must involve all of the processes contained in the experimental task
except for the process that is to be isolated. The difference in reaction
time for these two conditions will then be equal to the dui ation of the
isolated process. Thus, if an experimenter is interested in the effect
of an independent variable on the duration of a particular mental process
he needs only to compare the difference obtained between an experimental
and comparison condition of the type indicated above as a function of the
independent variable.
A recent experiment by Eriksen, Pollack and Montague (1970) illus-
trates the application of this reasoning particularly well. These
»<■» ' • ■*——M^i*

r.-u'hollti 12
investigators were interested in studying the processes involved in the
encoding of visually presented words. The experimental i.ask involved
having subjects simply name stimulus words which were presented one at a
tine. Reaction time was measured from the onset of a stimulus word to
the initiation of the vocal response naming the word. That is, the first
sound emitted in making the response triggered a voice key which termi-
nated the reaction time interval. The independent variable of interest
was the length, in syllables,of the stimulus word. The results showed
that one-syllable words could be named faster than three-syllable words.
This seemingly straightforward result might have been taken at face
value to indicate that it takes more time to encode longer words. The
problem with this interpretation is that it equates "reaction time" with
"encoding time" and this is not strictly correct. The naming task
described above must involve several distinct operations. For one, the
stimulus word must be encoded. This is the process in which Eriksen,
Pollack and Montague were interested. Additionally, the response, vocal-
izing the stimulus word's name, must be performed. Variability in reaction
time due to the length of the stimulus word on the process of executing
the response is irrelevant to the question of the effect of word length
on encoding time. Note that it makes no difference that reaction time
was measured to the initiation of the response. This is because it may
simply take longer to initiate a longer word than a shorter one. In other
words, it is possible that it may take no longer to perceptually encode a
three-syllable word than a one-syllable word; it may only take longer to
initiate a three-syllable response than a one-syllable response.

l-ai-hella 13
In order to assess this ponsibility, Eriksen, Pollack and Montague
applied the Subtraction Method. A comparison task was constructed in
which the subject was presented with a stimulus word. He did not respond
to the stimulus word directly, however; he merely encoded it. Following
a short time interval a light was presented to the subject. The subject
responded to this stimulus light by emitting the name of the encoded word.
Reaction time in this condition was measured from the onset of the stim-
ulus light to the initiation of the vocalized response. Thus, this reac-
tion time interval involved everything the interval in the experimental
task involved except for the encoding of the stimulus word. In this
comparison condition there was no difference in reaction time for one- vs.
three-syllable responses. Therefore, the authors concluded that the
entire difference obtained in the experimental condition could be attrib-
uted to the perceptual encoding of the stimulus.
Criticism of the Subtraction Method.—The conclusions drawn by Erik-
sen, Pollack and Montague are dependent upon the applicability of the
Subtraction Method. To the extent that general criticisms can be levied
against this method their conclusions must suffer. At least two general
criticisms have been levied.
First, the Subtraction Method begs one of the most fundamental ques-
tions underlying information processing research; namely, the description
of the mental events involved in an experimental task. The starting
point for the application of the method is a relatively sophisticated
one: in order to construct a comparison task, one must already
riMBHMl

Fudiella Ik
know the sequence of events which transpire between stimulus and response.
Such sophisticated knowledge is rarely available. Rather, it is more
often the case that the structure of the mental events is presented with
only logical or intuitive (as opposed to empirical) Justification. Obvi-
ously, the conclusions reached on the basis of the application of the
method can then be no stronger than the substantiation of the initial
conceptualization of the experimental task. Thus the experiment by Erik-
sen, Pollack and Montague purports to show the effect of word length on
stimulus encoding, but it has presupposed with only the meagerest of
justifications the existence of such a process and its independence from
response execution. This general class of criticism will be discussed in
greater detail below in connection with the Additive Factor Method.
A second general criticism of the Subtraction Method concerns the
comparability of the experimental and comparison tasks, or as Sternberg
(1969b) has called it, the assumption of pure insertion. This refers to
the assumption that it is possible to completely delete (or insert) mental
events from an information processing task without changing the nature of
the other constituent mental operations. In order for the difference in
reaction time between the experimental and comparison task to meaning-
fully represent the duration of an isolated process, all of the other pro-
cesses common to both tasks have to be strictly comparable. For example,
in order to accept the conclusion of Eriksen, Pollack and Montague, that
the effects of word length are localized in the encoding process, it
must be assumed that the response execution processes for the two tasks
in their experiment are identical. There is nothing in the application
~tla

Fachollti 15
of the method itself, or in the data collected therefrom, that can Justify
this assumption.
A recent series of experiments by Egeth and his colleagues (Egeth
and Blecker, 1971; Egeth, Jonides and Wall, 1972; Egeth, Atkinson, Gilmore
and Marcus, 1973; Egeth, Marcus and Sevan, 1972) have demonstrated tha
importance of this issue. These experiments have utilized subtractive
logic for ostensibly methodological purposes. They have employed what
are known as "C-reactions" in order to simplify their experimental tasks
from the subject's point of view, thereby reducing extraneous variability
and thus requiring less data per subject in order to produce stable
results.
A C-reaction calls on a subject to respond as quickly as he can when
a stimulus from a particular class is presented, and not to respond if
any other stimulus is presented. This can be contrasted to the more com-
mon practice of having the subject execute a unique, overt response for
each potential class of stimuli used in an experiment. For example, in
% a commonly used experimental task subjects are presented with pairs of
letters. Trey are to judge whether the letters are the same or different.
/ Common practice, utilizing manual responses, would assign "same" responses
to the index finger of one hand and "different" responses to the index
i finger of the other hand. The utilization of a C-reaction makes response
type (i.e., same vs. different) a "between subjects" variable. That is,
each subject makes only one response. Some subjects respond only on same
trials, not responding ac all on different trials, and other subjects
respond in the opposite manner.

^mm
Pachella l6
2 Egeth's argument runs the following way : In the above example, for
irstance, subjects must decide whether the presented letters are the same
or different. It is this decision process that is of interest to most
cognitive psychologists. However, in the usual experimental setup, after
noting whether the letters are the same or different, the subject must
remember which response to make for same stimuli and which response to
make for different stimuli. Since this assignment i3 arbitrary, it must
be learned, and this learning is reflected in the amount of practice
necessary in order for a subject to produce stable data. Furthermore,
variability in the produced reaction times due to deciding what response
to make is not relevant to the process of interest—deciding whether the
letters are the same or different. On top of all this, subjects undoubt-
edly make errors in this task, not because they have misclassified the
stimulus letters, but because once they have classified the letters they
have executed the wrong response. With the C-reaction, once the stimulus
pair is classified as the same or different, the subject need only remem-
ber whether he is a "same responder" or a "different responder." Certainly
this condition also involves memory, but it is much simpler and requires
less practice and learning than remembering which overt response goes
with each class of stimulus. Thus, by eliminating the response decision
process from the experimental task, response decision time has been
removed (i.e., subtracted) from the obtained reaction time, thereby
reducing subsequent variability.
in order for this argument to be truly persuasive one would need to
be assured that this methodological innovation did not fundamentally
tf*

Pachella 17
modify the processes of interest underlying the experimental task. That
is, in order for data collected with C-reactions to be comparable to data
collected in the usual way with choice reactions, it must be assumed that
the rest of the cognitive processes involved are not affected by the
3 presence or absence of the response decision stage. It is possible,
however, to construct CJI alternative argument that encoding changes as a
function of the inclusion of the response decision stage, and in this
situation the alternative seems introspectively reasonable. For example,
"same responders" (i.e., subjects who respond only on same trials) might
be conceived of as subjects who are "looking for" sameness. Their deci-
sion processes, as compared to those for subjects who have to respond to
both sameness and difference, might be bitted in favor of sameness and
the duration of the decision process on same trials might be affected by
this bias.
Egeth and Blecker (1971) investigated this possibility. In an exper-
iment designed to study the effects of orientation (rightside up vs.
upside down) on the type of letter classification described above both
C-reaction conditions and choice raction conditions were utilized. The
patterns of results for both sets of conditions were remarkably similar.
The only major difference was the fact that the reaction times for the
C-reaction conditions were considerably faster than those for the choice
reaction conditions, presumably because of the deletion of the response
decision stage. Thus, in this situation the logic of the Subtraction
Method seemed tenable.
On the other hand, Egeth, Marcus and Bevan (1972) have shown that
such good fortune cannot always be expected. In a somewhat different
B" A
Pachella l8
type of letter classification task they again utilized both C-reactions
and choice reactions. This time, however, the two sets of conditions pro-
duced remarkably different patterns of results. It appeared that in
this situation the deletion of the response decision stage drastically
affected the nature of the processing, thus illustrating the lack of
comparability that was noted above.
Since, a priori, it is impossible to know when the deletion of a
stage will drastically affect processing, this question of comparability
can always be put forward in criticism of the Subtraction Method: The
method involves the comparison of similar but nevertheless different
tasks. It can always be asserted that the information processing for the
two tasks, aside from the simple deletion or addition of a particular
mental event, is fundamentally different.
Another way of looking at the above criticism is to say that the
data collected by using the Subtraction Method generally yield no evidence
about the adequacy of the assumptions underlying its use. If one accepts
the assumption that the converging tasks are comparable, then one can
interpret the data collected. But the data themselves give no indication
about the comparability of the converging tasks.
This does not always have to be the oase, however. In some situa-
tions the data obtained using the Subtraction Method can provide a built- /
in indication of the reasonableness of the assumption of comparability.
The experiments of Egeth discussed above are one such case. In doing his
experiments both ways (with C-reactions and choice reactions), he can
check the comparability of his tasks. However, it should be noted that the
alleged methodological advantages of C-reactions are then lost. Another

Faehella iy
situation of this kind has been developed and used extensively by Stern-
berg in the study of short-term character recognition (Sternb.rg, 19o°a;
1969b). The experimental task utilized in the study of this problem
starts with the subject memorizing a short list of characters (usually
letivers or digits) before each trial. The subject is then presented with
a probe character and he is to decide whether or not the probe is contained
in the memorized list. Reaction time measured from the onset of the probe
character is taken as the dependent variable.
The processing model developed by Sternberg to account for the per-
formance of this task hypothesizes that the internalized or encoded probe
character is compared sequentially with each item on the memorized list.
Each comparison, then, comprises one mental operation in the processing
sequence. Thus, if two conditions which differ from each other in list
length by only one item are compared, the difference in theiv reaction
times can be interpreted as the duration of a mental comparison. This is
an elementary application of subtradive logic and it is limited, Just as
the other examples mentioned above were limited, by the assumption of
comparability—the assumption that the deletion of one mental comparison
leaves the others intact. However, in this case, successive list lengths
can be compared. List length 2 can be compared with list length
3; list length 3 can be compared with list length k; and so on. If strict
comparability holds, that is, if the deletion of one mental operation
doesn't affect the others, then the successive differences in reaction
time should all be identical. The data elating list length to reaction
time should be linear. In other words, an obtained linearity of the data
can be used to check the applicability of the subtractive logic.

Pachella 20
In general, in order to get away from this pervasive criticism of
the Subtraction Method (i.e., the comparability of tasks) the critical
difference of interest must be embedded in a more complex set of converg-
ing operations. In the above instance several conditions were compared,
varying the number of identical operations contained from condition to
condition. Thuii, these repeated applications of the Subtraction Method
allow for the detection of any drastic changes in processing as a result
of the number of stages—provided, of course, that such drastic changes
result in changes in the duration of the affected mental operations.
Looking at only one difference in reaction time fron one experimental
condition and one comparison is tantamount to accepting all of the a
assumptions underlying the methor".
One last point should be mentioned with regard to this criticism
about the comparability of tasks in the Subtraction Method. The criti-
cism is not unique to this situation, but rather« it is a criticism
that can be applied to the use of converging operations in genoral.
Converging operations, by definition, involve several tasks or conditions
that differ from each other in certain systematic ways. They must do
this otherwise they wouldn't converge on some theoretical construct.
The argument can thus be made that the converging tasks may involve funda-
mentally different mediational components. In situations of this type,
perhaps conservatism is not the best policy, since converging operations
of one form or another would seem always to be necessary in the study of
mental events. Thrj, data collected and interpreted utilizing subtractive
logic should not necessarily be dismissed on tnese grounds alone. Such
criticism ought only be paid attention to when it is accompanied by other
*n
Fachella 21
persuasive evidence or argumentation indicating that the tasks used to con-
verge are not comparable. In other words, since it is impossible to
prove that comparability holds; and since it is, in principle, always pos-
sible to demonstrate that it doesn't hold, when in fact it doesn't; an
hypothesis garnered via subtractive logic might be maintained, at least
in a tentative way until it is disproven. Thus, any particular application
of converging operations such as the Subtraction Method, will leave open
an obvious direction for further experimentation: The search for data
demonstrating that the common components of the converging operations are
not comparable.
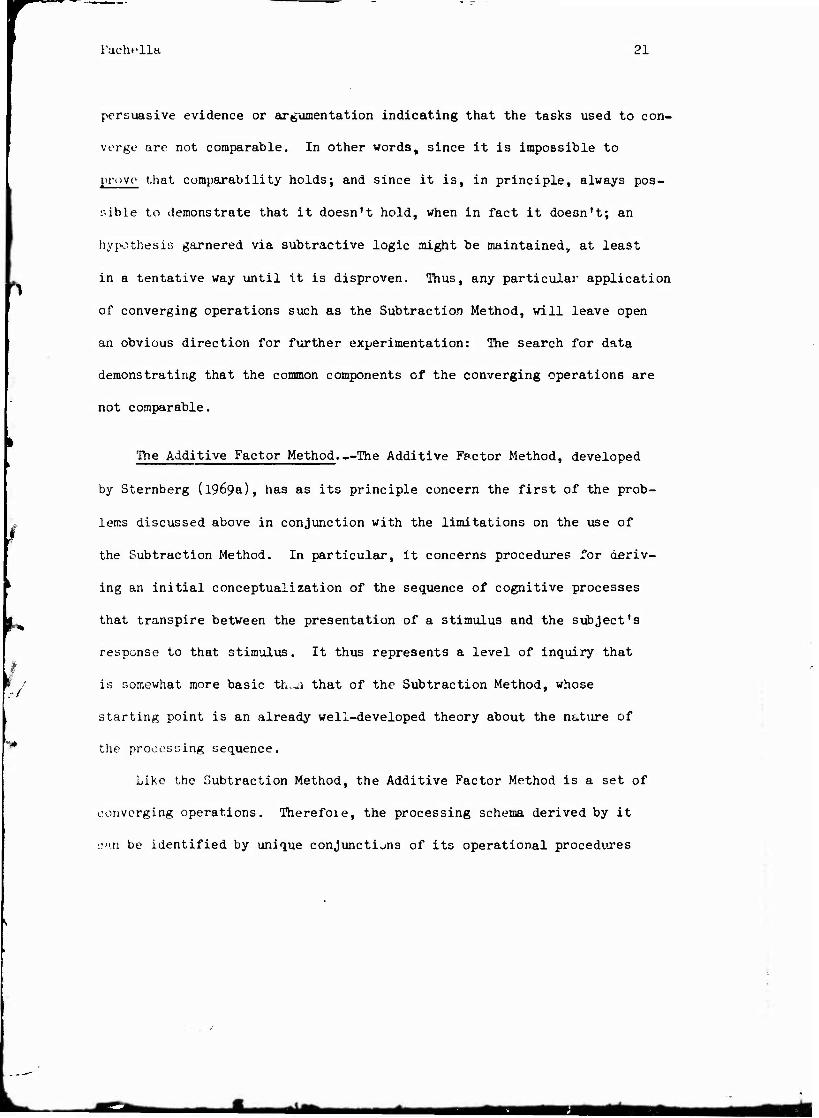
The Additive Factor Method.—The Additive Factor Method, developed
by Sternberg (1969a), has as its principle concern the first of the prob-
lems discussed above in conjunction with the limitations on the use of
the Subtraction Method. In particular, it concerns procedures for deriv-
ing an initial conceptualization of the sequence of cognitive processes
that transpire between the presentation of a stimulus and the subject's
response to that stimulus. It thus represents a level of inquiry that
is somewhat more basic th.^i that of the Subtraction Method, whose
starting point is an already well-developed theory about the nature of
the processing sequence.
Like the Subtraction Method, the Additive Factor Method is a set of
converging operations. Therefoie, the processing schema derived by it
c't.n be identified by unique conjunctions of its operational procedures
*k

Fachella 22
and assumptions. That is, each process identified by the Additive Fector
Method receives its definition from a pattern of data which is the result
of a set of operations.
The basic logic underlying this method involves the following concep-
tions. First, it is assumed that the reaction time interval is filled
with a sequence of independent stages or processes. It is the purpose of
each of these stages to receive an input from the preceding stage and to
perform a particular translation or transformation on it. Its output is
then passed along to the next stage or process. Each stage produces a
particular transformational effect in the sequence of information process-
ing. That is, while the input to each stage will vary in form from trial
to trial, it will nevertheless have had the same transformations applied
to it as any other input at that point in the sequence. The output of a
stage will likewise have achieved some particular level of information
processing. Thus, the purpose of a stage is to produce a constant infor-
mational transformation.
The nature of the informational transformation produced by a stage
is taken to be independent of the durations of the stages that have pre-
ceded it. Furthermore, the output of a stage represents a constant
informational translation regardless of its own duration. Thus, the
nature of the input and output of each stage is independent of factors
which influence its duration. It is the durations of these stages and
the factors affecting their duiations that are the primary concern of the
Additive Factor Method.
For example, consider an information processing stage which finds
the name of a stimulus; that is, a stage which receives an essentially
•ftUfe.

l'nchella ?3
spntiuJ representation of a stimulus (i.e., a representation with proper-
ties isomorphic to the spatial properties of a stimulus) and Lranslates
it into an acoustic representation (i.e., a representation with properties
isomorphic to the stimulus name). This spatial representation is the
result of the preceding stages of processing. It may, of course, vary
from trial to trial in its particular form depending on what the actual
stimulus is, but it will have been processed on each trial to the same
degree (e.g., it will be spatial and it will have similar resolution and
detail). Further, the nature of tnis input is not dependent on how long
it took to get through the preceding stages, but only on the fact that it
has gotten through them. The input is now processed by the stage in ques-
tion. The result is an acoustic representation which will go on to the
next stage. The nature of this output representation is not dependent
upon the duration of this particular translation process, but only on the
fact that the process has been completed. Thus, the input and output of
a stage are independent of the duration of the stage in question and of
those of the preceding stages.
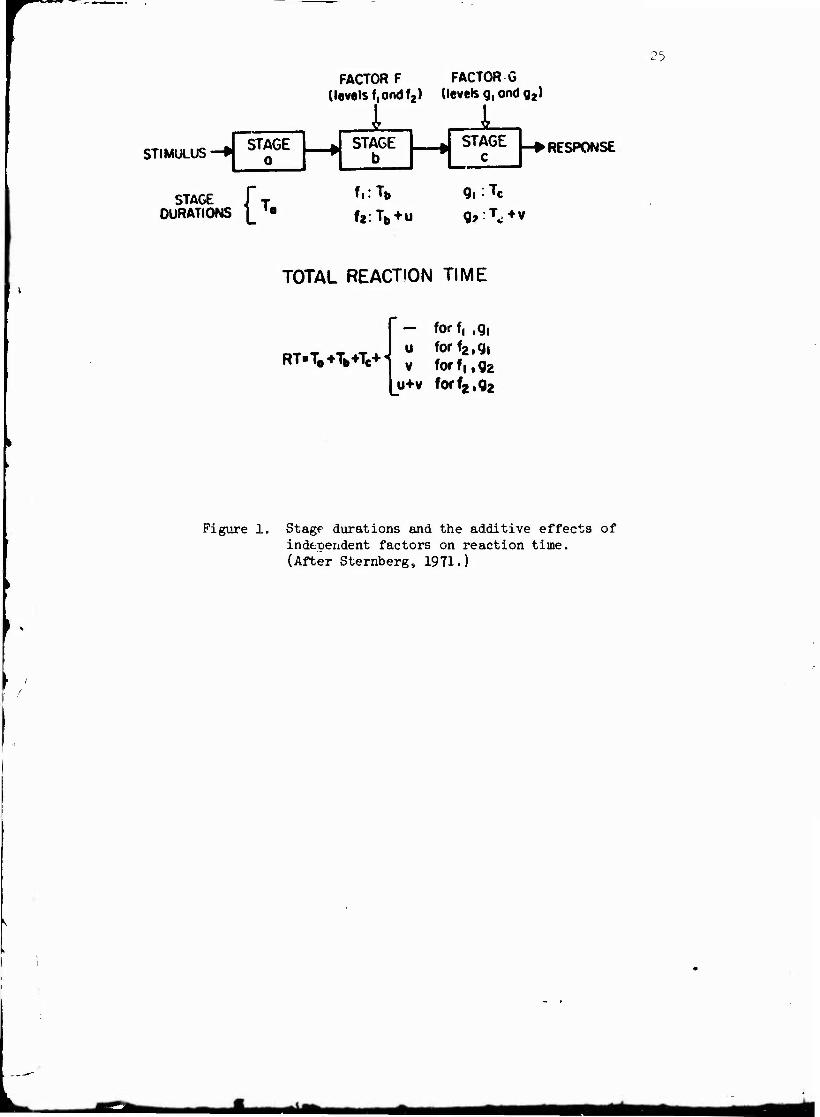
This conception of stage leads to several implications regarding the
relationship between the durations of stages and experimental manipula-
tions. First, total reaction time is simply the sum of the stage dura-
tions. Wien an experimental manipulation affects the reaction time for
•i particular information processing task, it does so by changing the
durations of one or more of the constituent stages of processing. Second,
if two different experimental manipulations affect two different stages,
they will produce independent effects on total reaction time.
m

Pachella
the effect of one manipulation will be the some regardless of the Level of
the other variable. In other words, the effect,, of the two experimental
factors should be additive; they should not interact :n a stuthai .-»I
sense. This fact follows quite directly from the relationship ,1, .rribed
•>K>vo between th. iurations of stages and their inputs and output:;. Third,
if two experimental factors mutually modify each other'« effect, that is,
if they interact in a statistical sense, they must affect some stage in
common. Figure 1 illustrates the nature of the additivity in a situation
where two experimental factors (F and G) affect two different stages of
processing (a and b). Figure 2 shows the resultant additi-ity in graphi-
cal form.
In using the Additive Factor Method to interpret reaction time
measures the above, implications are applied to data from multifactor
experiments. Thai \z, in order to apply the method, a well-defined infor-
mation processing task (where reaction time is being measured as the
dependent variable) must be embedded in a multifactor experimental design.
The larger the number of experimental factors that are manipulated, the
finer will be the analysis of the constituent stages of the experimental
task and/or the better will be the definition of each constituent stage.
Basically, the data from such an experiment are simply analyzed in order
to find pairs of factors which have additive effects on reaction time.
Each time such a pair is discovered it is concluded that each factor
affects a different stage. Further, from the patterns of interactions it
m
FACTOR F FACTOR G (levels f,ond f2) (levels g, ond
I I 92>
1 MULUS —* STAGE 0
STAGE b
STAGE c
STAGE DURATIONS {'•
f,:Tb
f2.Tb+U
g(:Tc
25
RESPONSE
TOTAL REACTION TIME
RT«T,*W
— for f, ,g, u forf2,q, v forf, ,g2
u+v forf2,g2
Figure 1. Stage durations and the additive effects of independent factors on reaction time. (After Sternberg, 1971.)

26
UJ
H
O O <
Q:
f, L
f.
Figure 2. Graphical illustration of the additivity of independent factors,
tmmmatm

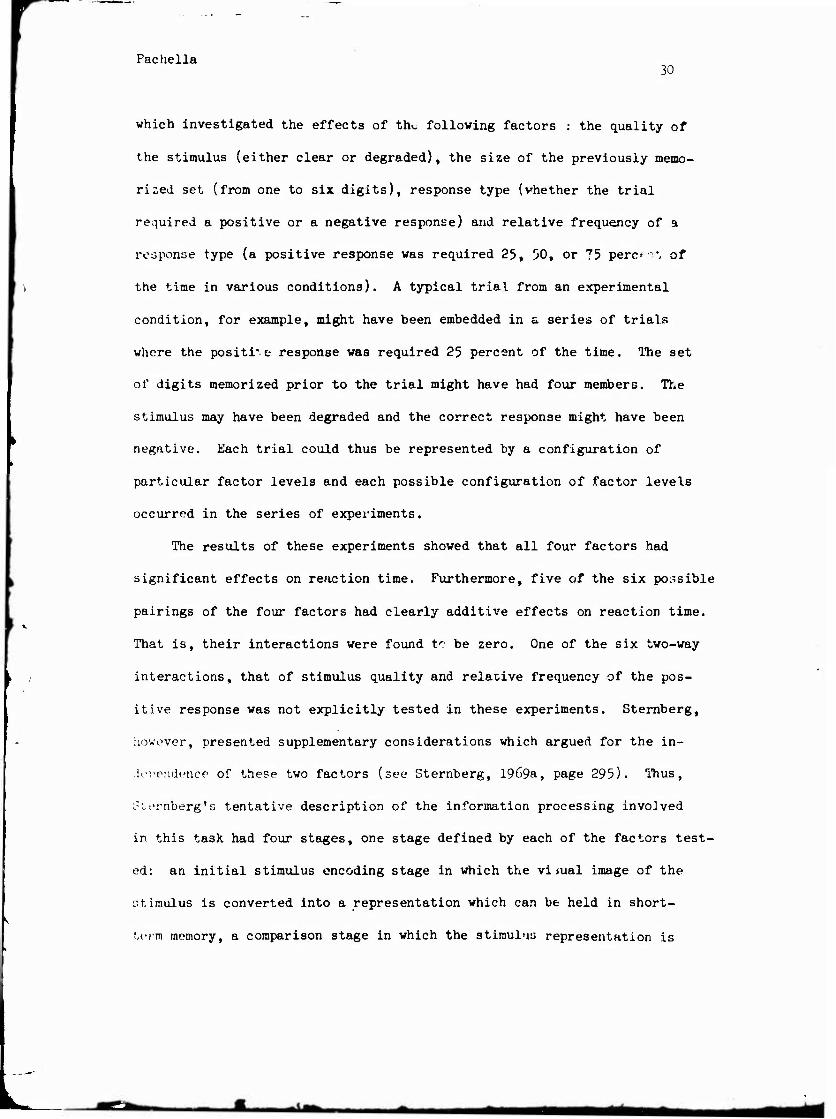
Pachella 2|
i:-. |uw.::iblfi to give definition to the processing '-hut is accompl i-.-.nvl by
various stages. Thus, if factors A and B are found to interact, i.hen it
can lu- fuv.orted that there is some stage whoso pmce:;;; is such that it
c.-ui In; affected by both Factor A and Factor H. KLr.urr i i llu:; Lr-iL.•:; h>rw
Uio cattern of additivity and interactions amon^i four experimental manip-
ulation:-: (F, G, H, and I) can be used to define a processing schema, ""he
concrete examples which will be given below will also elucidate the meth-
odology.
Prior to looking at these examples, however, three additional method-
ological generalities should be noted. First, the analysis of an informa-
tion processing task into component stages by looking at the pattern of
additive factors is contingent upon the inherent scalability of reaction
time measures that was discussed earlier. Additivity and interaction have
moaning only in the context of a dependent variable that is imrnun- to
arbitrary monotonic rescaling. In the present context, the obtained reac-
tion time measures are directly of interest because the events that are
under consideration (i.e., the stages) are taking place in real time. The
additivity is a property of the real time durations of the stages leading
to the production of the observed reaction time measures. Consequently,
not only are transformations of the time scale inappropriate, but so are
measures of reaction time, such as medians, which are themselves in prin-
ciple not additive.
Second, care must be taken that the manipulation of experimental
factors does not redefine the experimental task or its component stages.
Reproduced from best available copy.

r /v
(MM A / » / \
/ X A \ // eM /«nttrocf\ Werocl\«
factors r *""■ ~v j" L.
processes
/ \
'' <' ä
stimulus -♦• • '-* stage a ■♦• stage b _»... .. .-• l
StOQ3 C ■»•••-»response
Figure 3. The effect of factors F, G, H and I on stages a, b and c and the pattern of additivity and interaction among the factors (After Sternberg, 1969a.)

Pachella or.
The experimental factors should be reasonable within the context of
the experiment-*! task. For example, in a certain sense, the construc-
tion of a comparison task in the Subtraction Method might be considered
.-.:• :i limiting case of a factor manipulation. Of course, in such a case
the limitations of comparability that were discussed earlier would th^n
apply to the present method. More will be said about this below; for the
moment it will suffice to note that one of the motivations behind the
development of the Auditive Factor Method was the notion that changing
the levels of a factor is a somewhat weaker manipulation of information
processing than the deletion of entire processes.
Finally, the Additive Factor Method represents a clear conjunction
of the interest in substantive issues with that of the study of reaction
time per se. Clearly, the Additive Factor Method supplies at least one
context in which the direct discussion of the effects of experimental
manipulations on reaction time are not simply the study of artifacts. The
more factors that can be found that systematically affect reaction time in
general, the greater the likelihood that the underlying process structure
of any information processing task will be elucidated.
An Additive Factor Case Study.—The usefulness of the Additive Factor
analysis was originally demonstrated by Sternberg (1969a and b) in connec-
tion with the study of short-term character recognition. The typical
experimental task used to study this problem requires a subject to make a
positive response if the stimulus is one of a previously memorized posi-
tive set of stimuli and a negative response otherwise. This simple infor-
mation processing task was embedded in a series of multifactor experiments
*k
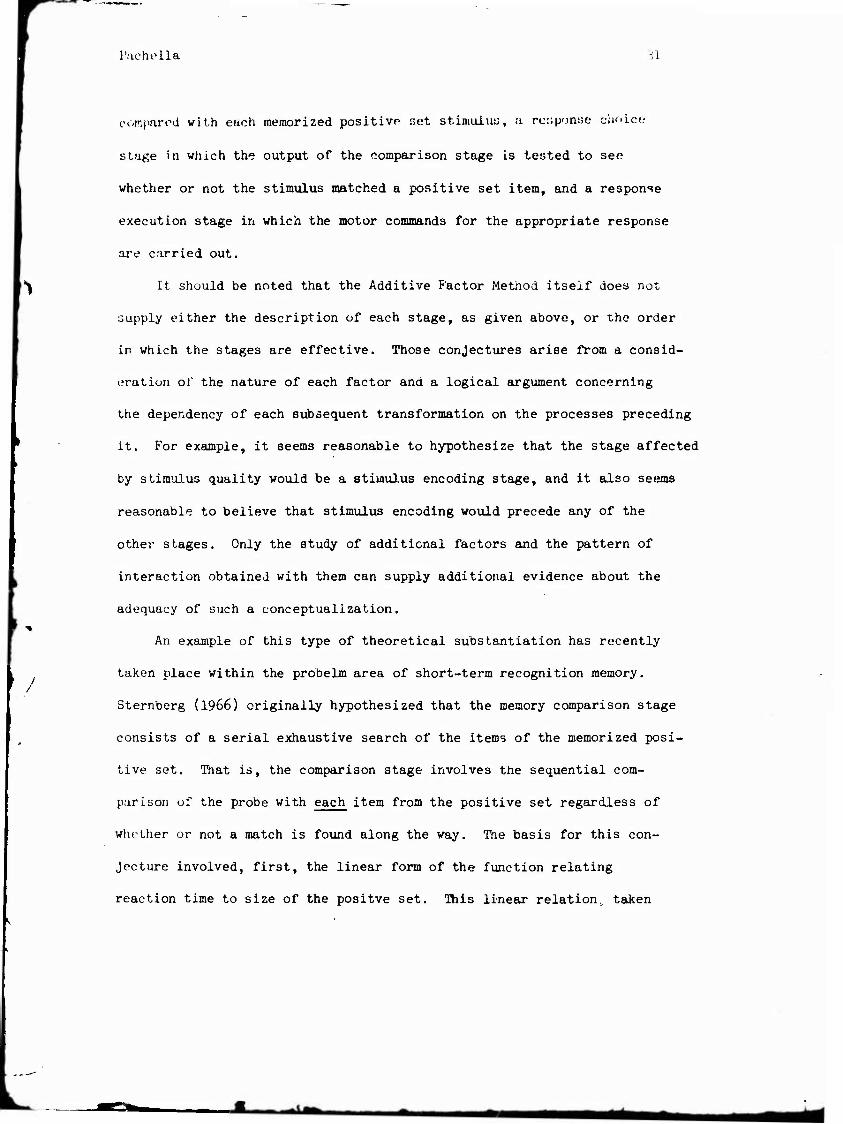
Pachella 30
which investigated the effects of th^ following factors : the quality of
the stimulus (either clear or degraded), the size of the previously memo-
rized set (from one to six digits), response type (whether the trial
required a positive or a negative response) and relative frequency of a
response type (a positive response was required 25, 50, or 75 perc ■*, of
the time in various conditions). A typical trial from an experimental
condition, for example, might have been embedded in a series of trials
where the positive response was required 25 percent of the time. The set
of digits memorized prior to the trial might have had four members. The
stimulus may have been degraded and the correct response might have been
negative. Each trial could thus be represented by a configuration of
particular factor levels and each possible configuration of factor levels
occurred in the series of experiments.
The results of these experiments showed that all four factors had
significant effects on reaction time. Furthermore, five of the six possible
pairings of the four factors had clearly additive effects on reaction time.
That is, their interactions were found to be zero. One of the six two-way
interactions, that of stimulus quality and relative frequency of the pos-
itive response was not explicitly tested in these experiments. Sternberg,
however, presented supplementary considerations which argued for the in-
dependence of these two factors (see Sternberg, 1969a, page 295). Thus,
St-ernberg's tentative description of the information processing involved
in this task had four stages, one stage defined by each of the factors test-
ed: an initial stimulus encoding stage in which the visual image of the
stimulus is converted into a representation which can be held in short-
term memory, a comparison stage in which the stimulus representation is
/
l'achella 31
compared with each memorized positive set stimulus, a response choice
stage in which the output of the comparison stage Is tested to see
whether or not the stimulus matched a positive set item, and a response
execution stage in which the motor commands for the appropriate response
are carried out.
It should be noted that the Additive factor Method itself does not
supply either the description of each stage, as given above, or the order
in which the stages are effective. Those conjectures arise from a consid-
eration of the nature of each factor and a logical argument concerning
the dependency of each subsequent transformation on the processes preceding
it. For example, it seems reasonable to hypothesize that the stage affected
by stimulus quality would be a stimulus encoding stage, and it also seems
reasonable to believe that stimulus encoding would precede any of the
other stages. Only the study of additional factors and the pattern of
interaction obtained with them can supply additional evidence about the
adequacy of auch a conceptualization.
An example of this type of theoretical substantiation has recently
taken place within the probelm area of short-term recognition memory.
Sternberg (1966) originally hypothesized that the memory comparison stage
consists of a serial exhaustive search of the items of the memorized posi-
tive set. That is, the comparison stage involves the sequential com-
parison of the probe with each item from the positive set regardless of
whether or not a match is found along the way. The basis for this con-
jecture involved, first, the linear form of the function relating
reaction time to size of the positve set. This linear relation, taken

Fachella -^
ia conjunction with subtractive logic, implicates the serial nature of
the comparisons (see page 20). Second, the additivity of the factors of
size of the positive set and response type implicates the exhaustive
nature of the search. If the comparison stage were not exhaustive, that
is, if the stage terminated itself upon finding a match, then differential
effects of size of the positve set would be expected for positive und
negative responses. Response type and positive set size would interact.
This follows from the fact that in such a self-terminating search all of
the items in memory have to be searched on negative trials, whereas on
positive trials only about half of the items, on the average, need to be
searched in order to find a match. Thus, since set size has the same
effect on both positive and negative responses, it was concluded that all
of the memorized items are checked on both positive and negative trials.
An extensive analysis of an additional factor, the probability of
particular probe stimuli, led Theios, Smith, Haviland, Traupman and Moy
(1973) to challenge this position. They found that reaction time in a
short-term recognition experiment decreased as a function of stimulus
probability, and this fact seemed inconsistent with the hypothesis that
the memorized list is searched exhaustively. How could stimuli, because
of their particular probability of occurrence, have different reaction
times if the probe stimulus had to be compared with all of the stimuli
in memory? They concluded that the memory comparison stage must be serial
and self-terminating with the order of comparisons determined, at least
to some extent, by stimulus probability. Unfortunately, the experimental

^1 Pai*hc] la
design of Theios, et al., did not allow for the clear demonstration of
the interaction of stimulus probability and memory set size as the Addi-
tive Factor Method would predict if the effect of stimulus probability
was localized in the memory comparison stage.
Recently, however, two independent Additive Factor experiments have
clarified this issue to some extent. In one, Klatzky and Smith (1972)
varied stimulus probability and size of the positive set and found no
evidence for an interaction. This would indicate that these two factors
have their effects on different stages. In the other experiment, Miller
and Pachella (1973) varied stimulus probability and stimulus quality and
found that these factors strongly interact. Therefore, it seems reason-
able that the stimulus probability effect found by Theios, e_t al., (1973)
is localized, not in the comparison stage, but in the encoding stage.
Thus, Sternberg's original conjecture about the nature of the comparison
process still seems momentarily plausible. Furthermore, the interaction
of stimulus probability and stimulus degradation adds still further defi-
nition to the transformation that takes place in stimulus encoding: what-
ever its nature, it must involve a process such that the effect oi stimulus
probability can be modified by the clarity of the stimulus.
Criticism of the Additive Factor Method.—The above examples are
intended as a demonstration of the usefulness of the Additive Factor
Method. It is a useful method beca'ise it is unambiguous enough to allow
investigators to independently examine findings arising out of its appli-
cation and either to agree on their interpretation or to express their
uisagreements in a meaningful•empirical discourse. On the other hand,
*■

P.ichella ->''
because of certain limitations underlying the method, it would be more
than naive to hold with any tenacity a model having the Additive Factor
analysis as its sole justification.
One of these limitations has been alluded to above. It is simply
the argument that the manipulation of factor levels may cause a funda-
mental change in the processing sequence as may happen with the deletion
of an entire stage within the Subtraction Method. From a procedural point
of view, the difference between the Subtraction Method and the Additive
Factor Method can be quite subtle. Thus, "number of overt responses" in
a short-term recognition experiment (e.g., one vs. two response*, as in
Egeth, Marcus and Bevan, 1972) is taken to fundamentally modify the pro-
cessing sequence, whereas "stimulus quality" (e.g., the presence vs. the
absence of a checkerboard noise pattern as in Sternberg, 1967) is taken
to simply modify the duration of the encoding stage.
Second, the demonstration of additivity in multifactor experiments
often amounts to the acceptance of a null hypothesis concerning the inter-
action between two variables. Great cautio. needs to be exercised in such
instances. The data needed in order to demonstrate true additivity
require a precision that few reaction tine experiments obtain. Further-
more, as Sternberg (1969a) has pointed out, experimental artifacts are
more likely to obscure true additivity than true interaction. Thus, two
factor interactions are best believed when they are obtained in experi-
ments that also contain convincing demonstrations of additivity.
Finally, any particular conception of "information processing stage"
and its properties may be more problematic than determinate. On the one

hand, the Additive Factor analysis can be taken as definitional, ao it has
been in the present paper. The concept of "stage" can be simply defined
by the pattern of additivity and interaction that is achieved from sets
of multifactor experiments. In such a case a "stage" is operationally
defined, albeit from a set of converging operations, and its properties
will be those inherent in the assumptions underlying the methodology. This
is then a functionally based approach to theorizing. It represents a
shorthand for conceptualizing the effects of experimental variables.
On the other hand, there can be independent conceptions of processing
stages which have external justification. These may be derivable from
other forms of data outside of the context of reaction time and/or infor-
mation processing based theory (e.g., from psychobiology, psycholinguistics,
or psychophysics). In such cases, it becomes an empirical question as to
whether or not these "stages" have the properties which satisfy the defi-
le nition of stage derivable by the Additive Factor Method. In situations
where stages have some independent definition, it is perfectly conceivable
that two factors might affect a single stage in an additive manner or they
might affect different stages and interact. This latter possibility would
be the result, for example, when a given factor modified not only the dura-
tion of a stage, but also the nature of the output from that stage. In this
situation the pattern of data obtained from multifento^ experiments
would serve not so much for the discovery of the stages themselves, but
rather for the determination of their specific properties. Thus, a model
of processing in which the stages are defined by an Additive Factor anal-
ysis may not be identifiably different from an alternative model based on
«*

Pachella jo
a different definition of stage in which the properties of the stages do
not lead to the simple patterns described above. They may be Just two
different conceptualizations of the structure underlying some body of data.
Reaction Time and Performance Accuracy
The interpretation of reaction time measures necessarily depends upon
the precision of their measurement. With regard to experimental data,
this precision is usually discussed in the context of the inter- and intra-
subject reliability that is necessary to draw certain statistical conclu-
sions. For example, the last section presented the partitioning of the
reaction time interval into stages on the basis of the additivity and
interaction among independent variables. The ability to detect such rela-
tions depends upon the amount of extraneous variability that is inherent
in Mie obtained reaction time measures. The present section furthe1"
discusses the precision of reaction time measures. The limitations on
interpretability to be presented here, however, concern the variability
that can be attributed to a covariate measure, performance accuracy.
Ihe definition of reaction time as an empirical question.—It was
stated earlier that reaction time is commonly defined as the minimum
amount of time needed for a subject to produce a correct response. For
the purposes of theorizing, it is this property that makes reaction time
useful. Unfortunately, this definition is not an operational or proce-
dural definition; rather, it simply represents an assumption on the part
of the experimenter or theorist, other than the instructions
*1ifc m i^a^

37
(.',iv< ii in the subject, there is generally no cvidenc« within a tyi.l'-ai
reaction time experiment that the times produced by the subject are really
the minimum possible while the subject is maintaining accurate Performance.
Whether or not subjects actually produce latencies that conform to
the :u\ive requirements is, in fact, an empirical question. Con.ui.-r, Tor
example, an information processing experiment in which the subject.-, are
instructed to work at various different rates of speed. That is, in addi-
tion to a condition in which the subjects are given the usual instructions
to respond as fast as possible without making errors, there are other
conditions in which the subjects are induced to work at various speeds
which are either faster or slower than this normal reaction time. Thus,
on some blocks of trials speed of responding is greatly emphasized; on
other blocks speed is only moderately emphasized; and on still other
blocks great accuracy and caution are emphasized.
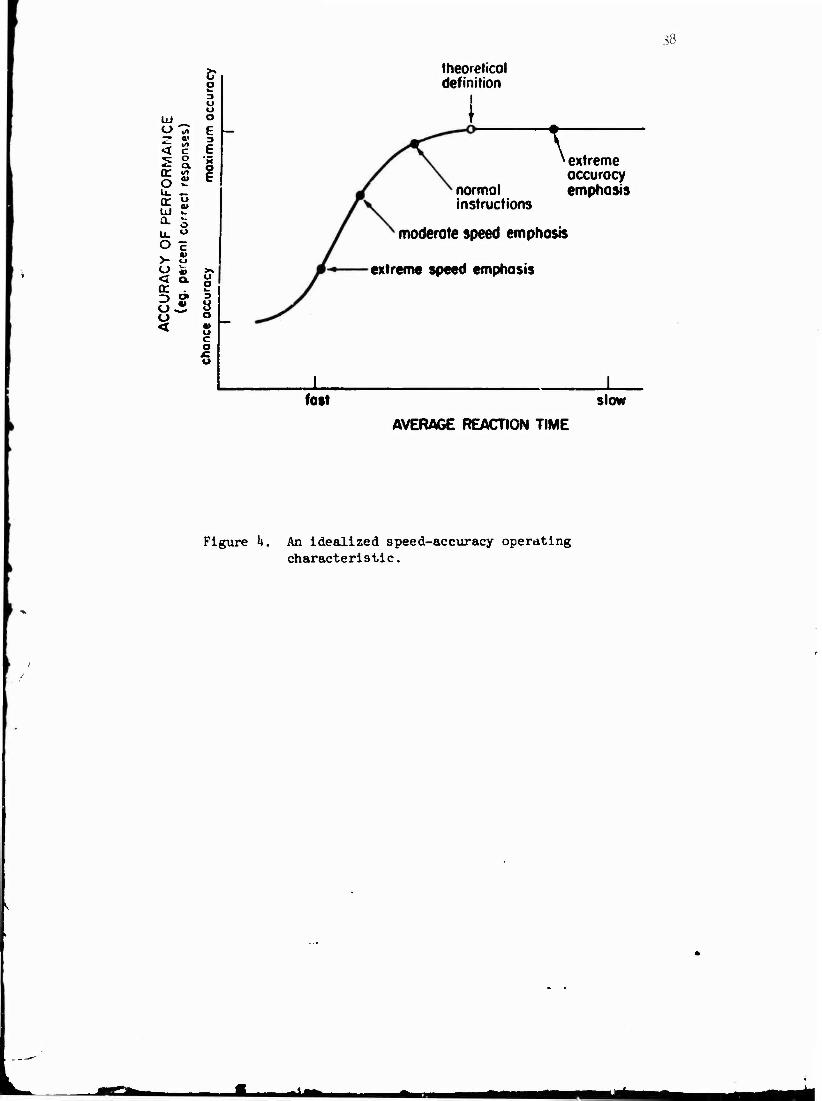
Figure k represents the outcome of such an experiment in idealized
form. Pew (1969) has called this type of function a speed-accuracy oper-
ating characteristic. Such a curve plots the relationship between the
average latency of response (e.g., mean reaction time) against the average
accuracy of responses (e.g., the percentage of correct responses) for each
of the various speed emphasis conditions for a particular experimental
task. Virtually all of the speed-accuracy operating characteristics that
have been reported in the literature share the basic properties of the
hypothetical data of Figure k. They are inonotonically increasing functions
Reproduced from best available copy.
38
< 5;
u> c o ex
O ? u. — er SJ
U. w O Z > S o « < ex 0: .
O
3 O o o E 3 E '5 1
theoretical definition
u o
5 S «1 u c o u
T normal instructions
extreme accuracy emphasis
moderate speed emphasis
extreme speed emphasis
fast slow
AVERAGE REACTION TIME
Figure k. An idealized speed-accuracy operating characteristic.
L mit

Pnchella 39
and, when accuracy is measured in percentage of correct responses, they
are typically negatively accelerated.
The open circle on Figure k is the point at which subjects are assumed
to be operating according to the common definition of reaction time. It
represents the fastest reaction time at which maximum accuracy is main-
tained. It is extremely doubtful that experimental subjects ever adopt
this speed-accuracy criterion. Errorless performance is a rare occurrence
when the usual reaction time instructions ar'j given to subjects. Even
experienced subjects whose data are exemplary in all other respects (e.g.,
consistent, low variability, etc.) will generally make two to three percent
errors in most reaction time tasks, and much higher rates are often reported
in published experiments. Thus, experimental subjects almost always oper-
ate at a point that is below maximum accuracy.
Several things should be noted about these errors with regard to
their limiting effects on the interpretability of reaction time. First,
low error rates are generally dismissed by experimenters as inconsequen-
tial. They are assumed to be a part of the inherent variability of per-
formance that one can expect of experimental subjects, öuch an assumption
is undoubtedly wrong and can lead to serious errors of interpretation.
Reaction time measures are usually derived from extremely simple
information processing tasks. Subjec^.s would probably never make an error
in them if they were not being timed, and if they were not trying to mini-
mize their response time. Consider, for example, the vocal naming task
that is often used in information processing research. This task simply
requires a subject to say aloud the name of a familiar stimulus, often a
2ft»

Pachella
letter or number, when it is presented visually on a screen. In situations
where time is not a factor, it is indeed doubtful that a literate adult
would ever misname a letter or a number. Note that the occasional, "real-
life" instances of mistaking the identity of a letter or number usually
occur as a result of not taking enough time in responding. However, the
general interpretation of reaction time assumes that subjects are not
rushing their response; they are supposed to be taking the amount of time
necessary for a successful completion of their task.
Thus, it seems unlikely that even low error rates are a result of
inherent subject variability. More likely they result from subjects
responding Just a little faster than they should because they are trying
to minimize their response time. Furthermore, it is not unreasonable that
subjects should do this. The problem confronting a subject when faced
with the usual reaction time instructions is to find the optimal speed at
which to work. If he never made an error, a subject would not know if he
could still go a little faster without making errors. Undoubtedly, the
subject chooses a speed-accuracy criterion at which he will, in fact, rush
his response—at least to the extent that he will make an occasional error,
and within a range such that his error rate will seem acceptable to hi*i
and/or to the experimenter.
Second, it is not, in itself, a matter of great concern that subjects
do not operate at the point assumed by the general definition of reaction
time. Of much greater importance is the possibility that differences in
speed-accuracy criterion may be correlated with experimental conditions.
That is, it is possible that subjects may vary from condition to condition

i'.-tch< I IM kl
the- extent to which they tend to rush their responses. Thus obtained
differences in reaction time may not be due entirely to underlying pro-
cessing differences. This possibility bakes on added significance when
the error rates in an experiment are ignored or go unreported, since the
differences in reaction time that are obtained, while artifactual in som^
sense, may be statistically significant.
Third, the limitations on the interpretability of reaction time as a
result of variability in error rates is further accentuated by the general
form of the speed-accuracy operating characteristic. The practical sig-
nificance of the negative acceleration of such curves, given error rate
as the accuracy measure, lies in the fact that small differences in error
rate can lead to large differences in reaction time. This is particularly
true for the range of high, overall accuracy (90 to 100 percent) typically
found in reaction time experiments. This means, of course, that what may
look like relatively meaningless error differences might contaminate
reaction time values extensively.
An example of the speed-accuracy problem.—A recent experiment by
Theios (1972a) illustrates the problems that can result from the abcve
considerations. Subjects were visually presented with single digits.
Their cask was to simply name the digits under the constraints usually
applicable in reaction time experiments, to be as fast as possible while
maintaining maximum accuracy. The particular parameter of interest in
the experiment was the effect of stimulus probability. Thus, in various
conditions the probability of particular stimuli was varied from .2 to .8.
■1—i *-*-

:,-,,,;. 1(-
The results of the experiment are shewn in Table I. As a rc-.ult of
the essentially invariant reaction times that were obtained, Theirs eon-
eluded that stimulus probability had no effect on the information process-
ing involved in this simple naming tr.sk.
However, before such a conclusion can be believed several things
about the pattern of the error data must be noted. First, acros:; all
eonditions the subjects averaged about three percent errors. As noted
above, this is not unusual for reaction time experiments. But, again,
consider the simpJicity of this experimental task. These subjects made
on the average three percent (and in one condition as much as six percent)
errors in a task which simply required them to name a visually presented
digit. Outside of the context of a reaction time experiment such an error
rate in such a task would be quite unacceptable.
Second, note that the variability of the error rates was quit.», small.
This again is typical. However, the error rates are systematically related
to the probability conditions. Thus, the subjects in the .2 probability
condition made six percent errors when they ave*"\6ed 356 .msec, per response.
The relevant question to ask is: What would their average reaction time
be if they were only making one or two percent errors as they did in the
.7 a»d .8 probability conditions? In other words, if subjects had adopted
a uniform accuracy criterion for all of the probability conditions, would
reaction time have been found to be invariant? From a more practical
point of view, the question might be put this way: How much difference in
reaction time could possibly result from such small error differences?

I'.'it'liclla < -, •4.3
Table I
Mean reaction time and proportion of errors
as a function of stimulus probability
(from, Theios, 1972a)
Stimulus probability
Mean naming time (msec.)
Mean proportion errors
.2 .3 .1* .5 .6 ■7 • 1 .6
356 356 351 357 3U8 3^7 3U6
.06 .01» .03 .02 .02 .01 .02
L ■

Paehella ),j,
A second experiment by Theios from the same series of experiments as
the one described above will perhaps shed some light on these questions.
This experiment contained one condition that was methodologically identi-
cal to one of the conditions whose results are presented in Table I. In
particular, it duplicated almost exactly the .5 probability condition from
the experiment described above. However, in this experiment the subjects
performed more accurately than the subjects in the first experiment,
making fewer than one percent errors, while their reaction times were
considerably slower, by about 100 msec.
Theios (1972b) has attributed this performance difference to a dif-
ference in the speed-accuracy criterion of the subjects in the two experi-
ments. If this is the case, then it is certainly conceivable that such a
speed-accuracy trade-off might produce at least as large a difference in
going fron; the .2 to tne .8 probability conditions of the first experiment.
That is, in order for the subjects to have reduced their error rate by
four percent in the .2 probability condition, they might have had to
lengthen their reaction time by as much as 100 msec. Thus, it is doubtful
that the data in Table I can be used to substantiate the claim that stim-
ulus probability does not affect naming reaction time. It is alternatively
possible that, for some reason, the subjects produced roughly equal reac-
tion times in each of the probability conditions, thereby causing the
effect of stimulus probability to appear as error differences.
Some attempted solutions to the problem of variable error rates.—The
above example was selected because it illustrates particularly well the
potential problems associated' with variable error rates in reaction time

Parhelia ><5
research. This ubiquitous problem hai: received little systematic atten-
tion. Nevertheless;, when errors occur in reuction time experiment:;
investigators must do something about them. Thus, several procedures
have evolved and are in current use even though there exists a paucity of
justification for their application.
The first and by far most common procedure for handling errors is to
simply ignore them. As noted earlier, the data most often reported in
published reaction time experiments are the reaction times from the correct
responses only. The data from the trials on which errors are made are
simply not included in the analysis of the experimental results. Further-
more, summary statistics about errors (e.g., error rate for each condition)
are also sometimes missing. Such a procedure implies obvious assumptions
about the relationship between correct and incorrect trials, particularly
if such a procedure is believed to "solve" the error problem. In
particular, the ignoration of errors assumes that the reaction time for
correct responses is not affected by the overall error rate for an exper-
mental condition.
Such an assumption, in most instances, could not be more false. In
the type of experiment described earlier, which leads to the kind of speed-
accuracy characteristic pictured in Figure k, reaction time for correct
responses follows a speed-accuracy characteristic which is similar to that
for total reaction time. That is, when subjects adjust their speed-
accuracy criterion from block to block (or condition to condition), aver-
age correct, reaction time decreases as error rate increases. In fact,
one tiling which each of the general classes of models to be discussed in
M -' — - —^—^^—^
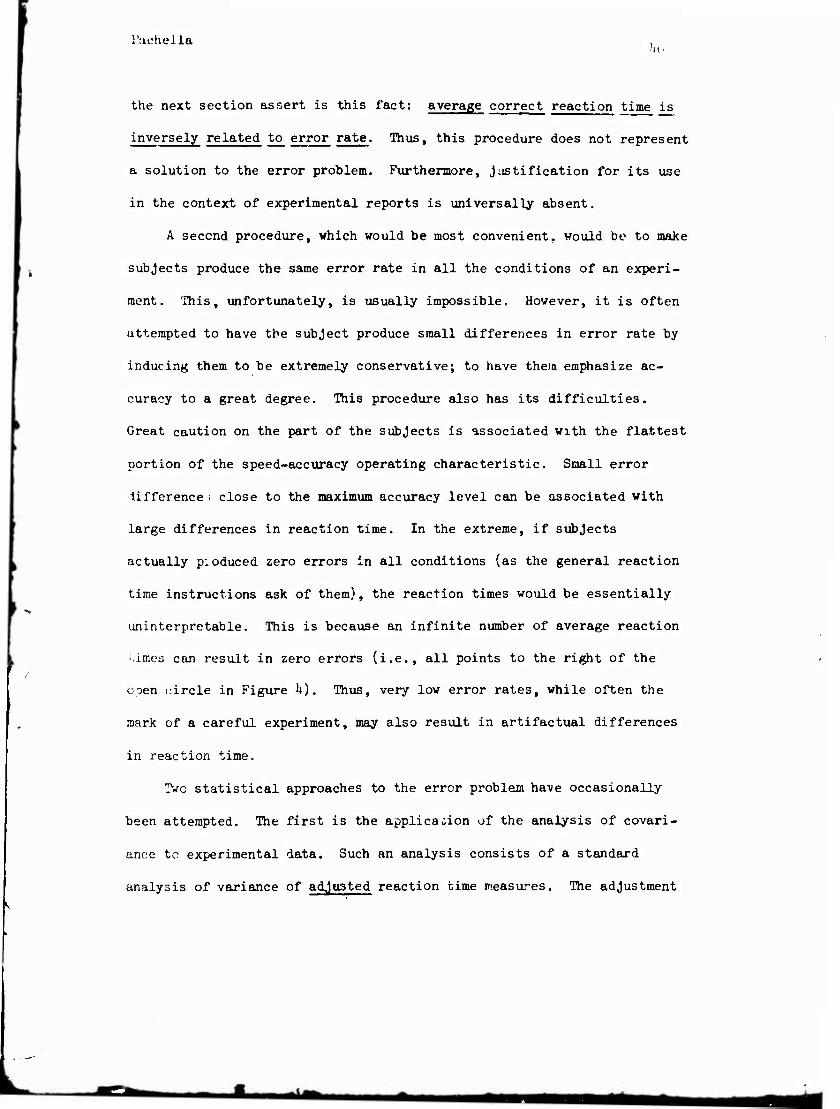
Tachella . !|t>
the next section assert is this fact: average correct reaction time is
inversely related to error rate. Thus, this procedure does not represent
a solution to the error problem. Furthermore, justification for its use
in the context of experimental reports is universally absent.
A second procedure, which would be most convenient, would be to make
subjects produce the same error rate in all the conditions of an experi-
ment. This, unfortunately, is usually impossible. However, it is often
attempted to have the subject produce small differences in error rate by
inducing them to be extremely conservative; to have them emphasize ac-
curacy to a great degree. This procedure also has its difficulties.
Great caution on the part of the subjects is associated with the flattest
portion of the speed-accuracy operating characteristic. Small error
difference . close to the maximum accuracy level can be associated with
large differences in reaction time. In the extreme, if subjects
actually pioduced zero errors in all conditions (as the general reaction
time instructions ask of them), the reaction times would be essentially
uninterpretable. This is because an infinite number of average reaction
'Mates can result in zero errors (i.e., all points to the right of the
open circle in Figure k). Thus, very low error rates, while often the
mark of a careful experiment, may also result in artifactual differences
in reaction time.
Two statistical approaches to the error problem haAie occasionally
been attempted. The first is the application of the analysis of covari-
ance to experimental data. Such an analysis consists of a standard
analysis of variance of adjusted reaction time measures. The adjustment
wm

Fachel la h-l
ii!" l.h'- reaction time measures is brought about on the basis of a linear
n-i'.re:;:; ion of reaction time against errors suitable to the particular
experimental design. In other words, the scores that get analyzed are
the reaction times predicted by a regression equation for some constant
level of error rate (e.g., the mean value).
There are a number of technical statistical considerations that dic-
tate great caution in the application of this cova:-iance technique to the
error problem in reaction time studies (see particularly, Evans and
Anastasio, 1968). Furthermore, one less subtle difficulty is the assump-
tion on the part of this analysis of a linear relation between accuracy
and reaction time measures. As noted above, when the error measure is
percentage of error, this relation is not linear, therefore the model
underlying this statistical procedure is not suitable. However, it is
possible (although not always feasible) to base the predicted reaction
time measures on nonlinear functions or to apply a suitable transformation
to the experimental data in order to make the relevant speed-error rela-
tion linear. The latter possibility is often accomplished by using the
logarithm of the error rates, the logarithm of the accuracy odds, i.e.,
log -—7 r— or the information transmitted (in bits) by the subject's p(error)
responses. Each of these transformations has the effect of producing an
essentially .Linear speed-accuracy characteristic. Thus, under certain
highly favorable conditions covariance analysis might be an aid in hand-
Ling the problem of variable error rates.
A second statistical procedure that has occasionally been suggested
as a solution to the error problem involves the application of the

Puehella , „ ho
multivariate analysis of variance (MANOVA). In short, this analysis
treats the reaction time and accuracy measures as a bivariate dependent
variable. The variance-covariance matrix for this vector variable can be
partitioned into independent component effects in a manner analogous to
the partitioning of total variance in the standard analysis of variance.
These effects are then tested statistically against the null hypothesis
that they simply represent samples from the same bivariate normal popula-
tion. As illustrated by the Theios experiment discussed in the last
section, such a procedure would seem ideal for handling the error problem
in reaction time research. However, it should be noted that the constraint
of a linear relation between reaction time and accuracy measures is again ^. , ,
present. That i9v the dependent vector variable i3 assumed to be sampled
from a bivariate normal population which has the linear correlation coef-
ficient, p, as a parameter. Furthermore, in situations where the appli-
cation of MANOVA techniques seems reasonable the statistical-computer
software necessary for complex experimental designs may still need devel-
opment. Nevertheless, such a technique seems promising, even if it only
awakens the realization of the multivariate nature of reaction time-
accuracy data.
An experimental approach to the speed-accuracy problem.—A somewhat
nore drastic approach to the problems cited above is to draw conclusions
about human information processing on data other than the usual reaction
time measures. As pointed out earler, reaction time measures, as commonly
defined, have much intuitive and theoretical appeal; however, as also
noted, it may not be possible'to obtain empirical measures which coincide
*\m i i^w^—att

Pfiehella )i9
exactly with these intuitive and theoretical notions. The examples to be
presented below utilize as their data base, not ordinary reaction time
measures, but rather the speed-accuracy characteristic itself. That is,
the conclusions to be drawn are based on the relationship between reaction
tine :-.nd error measures over a wide range of speed-accuracy criteria.
The general experimental paradigm involves inducing subjects to work
at various different rates of speed in each of the conditions in an exper-
iment. Functions of the type shown in Figure k are then derived for each
condition. Conclusions about the relevant information processing are
based on the changes from condition to condition of the function that
relates reaction time to the accuracy measures.
Inducing subjects to work at different rates of speed has been accom-
plished in several different ways. Hick (1952) and Howell and Kreidler
(19^'3, 196U) verbally instructed subjects to work at different rates of
speed on different blocks of trials or in different conditions. Fitts
(1966) and Swensson (1972) utilized explicit payoff matricies providing
monetary incentives favoring speed vs. accuracy to produce the same kind
of shift in speed-accuracy criterion. Recently, Pachella, Fisher and
Karsh (1968) and Yellott (1971) have described a procedure which involves
defining for the subject a response time limit and asking that the subject
attempt to produce his responses faster than this deadline. Subjects are
provided with feedback on each trial as to whether or not they have
successfully beaten the deadline i-.z;d from one block of trials to the next
the deadline is manipulated in order to produce shifts in the speed of
responding. Each of the above techniques is quite effective in producing
tia

Fachella r,, 50
trade-offs that are highly consistent across subjects. The latter dead-
line technique, however, is most efficient methodologically and is the
procedure that is utilized in the examples described below.
At the outset of this presentation, however, one point should be made
perfectly clear. While an attempt will be made to show that the data in
these examples are consistent with other knowledge obtained using reaction
time measures, the techniques illustrated here should not be considered as
simply a correction procedure for reaction time experiments. An experiment
which derives a speed-accuracy characteristic is potentially a different
kind of an experiment than the usual reaction time procedure. Thus, there
is no reason to believe that subjects performing under the kind of speed
stress present in these experiments are necessarily processing information
in the same manner that they might in the corresponding conditions of the
more typical reaction time situation. In general, data obtained in this
manner must be first evaluated in their own right and then, if consistent
with other procedures, generalized accordingly.
Speed-accuracy relations and stimulus discriminability.—Pachella and
Fisher (1969) obtained speed-accuracy operating characteristics for a task
involving simple absolute Judgments of spatial position. On each trial a
bar marker assumed one of ten horizontal positions across a uniform visual
field. The subject indicated which of the positions he judged the marker
to be in by pressing one of ten keys on which his fingers rested. In
addition to an unspeeded condition, three deadline conditions were used in
the experiment. On some blocks of trials subjects attempted to make each
of their judgments in less than 1.0 sec. On other blocks of trials the
1 ■ ■ mS\

,|. ■pili.f WM'. 0.7 sec, and on still other bloekr; the deadline wa:. ,.h :;(•>:.
.•■„. ..;,;,;,M-t.s were explicitly instructed to try to beat the deadline on each
trial ami within this constraint to be as accurate a.s possible. LJtimulus
discriminability was varied in two different ways: by varying the spacing
of t.he poraible stimuli positions (wide vs. narrow spacing) and by varying
the contrast of the stimulus against the background ^bright vs. aim back-
ground ).
The speed-accuracy operating characteristics for the three stimulus
conditions that were run are presented in Figure 5- Note that the accuracy
measure displayed on the ordinate is information transmission which in this
situation, where stimulus information is held constant across conditions,
becomes a measure of performance accuracy. The results show that varying
discriminability by reducing stimulus contrast has a different effect than
changing discriminability by increasing stimulus similarity. While both
manipulations produce decrements in performance, decreasing similarity
changes the rate at which speed is traded for accuracy and reducing stim-
ulus contrast does not.
These data are thus consistent with the stage analysis of choice reac-
tion time tasks arrived at by Stcrnberg (1969a, Exp. V). This analysis
distinguishes between an early stimulus encoding stage which is affected by
:aimulus degradation (in the present case, stimulus contrast) which adds
only a constant to the time needed to attain a given level of accuracy.
However, higher level processes which analyze this encoded representation
in greater detail are affected by stimulus similarity which thus affects the
rate at which performance accuracy is acquired.
•a^

*«-
12-
»0-
'•!■
r & i«(- S
6
O
2 •■
//
1/ : /
A .4 i • .T m i.o
J i i i I I ♦ i i
Figure 5. The relationship between information transmission and response time as a function of discriminability and speed constraint conditions. (From Pachella and Fisher, 1969-)
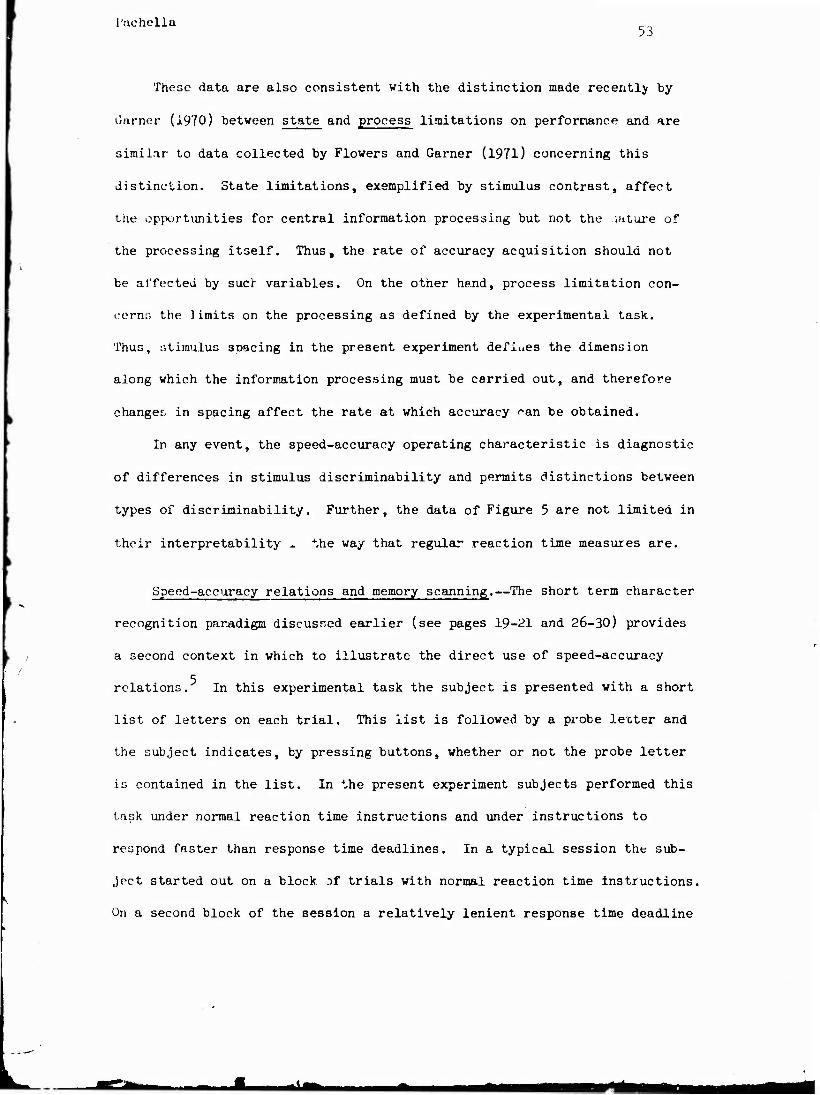
i'ac holla
These data are also consistent with the distinction made recently by
Earner (1970) between state and process limitations on performance and are
similar to data collected by Flowers and Garner (1971) concerning this
distinction. State limitations, exemplified by stimulus contrast, affect
the opportunities for central information processing but not the .l&ture of
the processing itself. Thus, the rate of accuracy acquisition should not
be affected by such variables. On the other hand, process limitation con-
cerns the limits on the processing as defined by the experimental task.
Thus, stimulus spacing in the present experiment defines the dimension
along which the information processing must be carried out, and therefore
changes, in spacing affect the rate at which accuracy fan be obtained.
In any event, the speed-accuracy operating characteristic is diagnostic
of differences in stimulus discriminability and permits distinctions between
types of discriminability. Further, the data of Figure 5 are not limited in
their interpretability ^ the way that regular reaction time measures are.
Speed-accuracy relations and memory scanning.—The short term character
recognition paradigm discussed earlier (see pages 19-21 and 26-30) provides
a second context in which to illustrate the direct use of speed-accuracy
relations. In this experimental task the subject is presented with a short
list of letters on each trial. This list is followed by a probe letter and
the subject indicates, by pressing buttons, whether or not the probe letter
is contained in the list. In the present experiment subjects performed this
task under normal reaction time instructions and under instructions to
respond faster than response time deadlines. In a typical session the sub-
ject started out on a block ?f trials with normal reaction time instructions.
On a second block of the session a relatively lenient response time deadline
«»la

Pachella 51*
was imposed and on each subsequent block the deadline was made more strin-
gent.
Twenty practiced subjects participated in four experimental sessions.
Each session contained five blocks of M trials (reaction time instructions,
pi it" four deadline conditions). The length of the lint, presented on euch
trial was varied from session to session. Thus, within one session a sub-
ject saw only one list length. Subjects, days and list lengths were coun-
terbalanced in order to eliminate specific practice effects.
The speed-accuracy operating characteristics obtained for each 3et
size (i.e., list length) are presented in Figure 6. The function:. ?<>r "ye::"
and "no" trials (not responses) are plotted separately in each pane], Mote
that the curves share the general features of the hypothetical curve in
Figure h. Also note that the functions fcr "yes" and "no" trials for each
set size are quite similar—at least for set sizes 2, h and 5 (set size 3
seems to be a little noisy). Further, the curves for "yes" and "no" trials
tend to separate as a function of set size: For set size 2 the functions
are light on top of ont another, while for set size 5 they are quite sepa-
rate. In fact, for the set size 5 condition there is a difference of over
100 msec, between the "yes" and "no" functions for some levels of accuracy.
The import of these features (and others) can be seen somewhat more
easily in Figures 7 snd 8. Here iso-accuracy contours have been constructed
from Figure 6. These functions represent the predicted reaction time (based
JL_

100-
90-
o 80f- UJ a. a: 70h o ° 60h
Stt Slit 2
Yw Trials No Trials
St» Sizt 3
J L.
r s«t sitt s
400 600 -L. J I L
800 1000 400 600 MEAN REACTION TIME, msec
800 1000
Figure 6. The speed-accuracy operating characteristic as a function of trial type and set size.
«id tm

1000
Figure 7. Iso-accuracy contours predicted for reaction time as b. function of set size.

57
1000
900
800
700
600
500
400
r 95% Correct
Yes Trials No Trials
RT-I05S+490 RT-60S*620
_J I I I I
a: ÜJ
< a: LU >
O UJ
g lOOOr 85% Correct w oc 900 a.
800h
700
600
500
400
--</. /
RT-65S+400 RT-30S*470
X J
r 90% Correct
— RT-I05S*300 RT-69S + 420
' I I L__l
r 80% Correct
^o—<f s
±
RT-35S+440 RT- I5S*470
_L 2 3 4 5 0 12 3
SIZE OF POSITIVE SET, S
Figure 8. Iso-accuracy contours predicte for reaction tin:.? as a function of set size and trial type.
«*--—

l-'ache i la
50
on linear interpolation) for specific accuracy levels as a function of set
size.
In Figure 7 four accuracy levels, 95, 90, 85 and 80 percent correct are
plotted on the same axes, averaged across trial type. The first thing to
note about this figure is that in going from 95!? to 907> correct, there is a
large effect on the intercept of the function relating reaction time to set
size. In other words, the initial effect of stressing speed appears to be
located in what was described earlier as the encoding and/or the responding
stages of processing. This result agrees well with a previous finding of
Swanson and Briggs (1969). They placed subjects under speed stress in a
task similar to the present one and, for error rates down to about 10/5,
found only intercept effects. The present data show, on the other hand,
that if subjects are further pressed for speed, no further intercept effects
are obtained, ui't instead the slope of the function decreases. Thus, more
extreme speed emphasis seems to affr"<+ the memory searching stages of pro-
cessing.
Figure 8 shows the same four accuracy contours as Figure 7, only here
the "yes" and "no" trials have been separated out. In each panel the equa-
tion of the best fitting straight line for each function is also presented.
First, note that the data are quite noisy when analyzed this finely. Thus,
considerable caution should be taken in believing them. Nevertheless, for
each accuracy level the slopes of these functions are considerably steeper
tor the "no" trials than for the "yes" trials. Such a result, if real,
would support strongly the possibilitv of a self-te" nu: ating scan of memory.
It. should be noted, however, that besides being noisy, the present data are
also somewhat contradictory. If the data from the normal reaction time

Fache11a 59
cMiili lion:; (i.e., the rightmo3t point for ouch function in Figur'' '<) an-
pl'jt'.i'd by themselves, they present evidence which is quite typical of un
exhaustive scanning process. That i3, these points, as shown in Figure 9,
are quite rallel.
One !,,'.!: be tempted to construct a rather elaborate hypothe. i/ Cor
this situation: Under normal reaction time condition:;, subject:, utilize an
exhaustive scan of memory. However, when pressured to emphasize speed they
go to a self-terminating procedure. That is, speed stress leads to a basic
change in processing strategy.
Before . ♦ "'trig this kind of speculation get too far out of hand, though,
a less dramatic possiblity should be explored. This notion has to do with
the general limitations of interpreting reaction time data due to the pres-
ence of variable error rates. Note the small differences in accuracy for
the various list length conditions of Figure 9. The numbers above each
point indicate the appropriate percent correct. These small accuracy dif-
ferences are slightly correlated with set size (particularly for the "no"
trials). Correlations of this type are not only typical, in many memory
scanning experiments they are even stronger. By contrast, the data of
Figure 8 represent an attempt (albeit somewhat of an approximation) to con-
trol for error differences. That is, the functions plotted there are equal-
tccuru -y contours. Thus, the particular slope values that were obtained
above, in either case, may be the result of subtle differences in speed-
accuracy operating criteria. In other words, reaction time data in general
may not be precise enough to make the distinction necessitated by the above
hypotheses.
«L mm
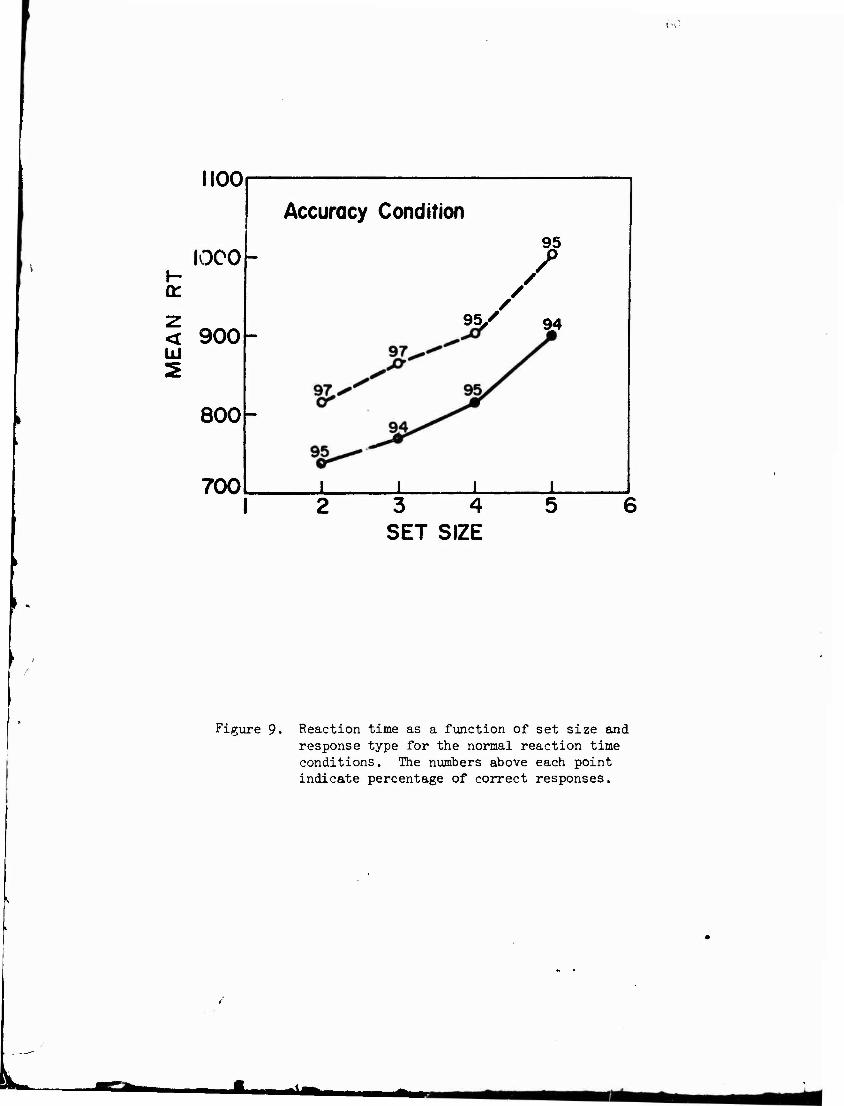
'
1100
1000 a:
i
i
< 900 h LÜ
800-
700
Accuracy Condition 95
95y 94
3 4 SET SIZE
Figure 9. Reaction time as a function of set size and response type for the normal reaction time conditions. The numbers ahove each point indicate percentage of correct responses.

Fach el la £,i
Figure 10 han been constructed to further illustrate thi3 point. This
figure has been constructed in the following way: Reaction times were selected
from Figure 6 that would exactly fit the predictions of either an exhaustive
or a self-terminating scanning process. The corresponding accuracy levels for
each of these reaction times were also noted. These have been indicated above
each point in Figure 10. The result shows that either hypothesis can be fit
exactly with the data from Figure 6 and a range of only ibout seven percent
errors is necessary to bring this about. The point is to show that either
hypothesis might have been supported with data, had this been real data, whose
error differences might have been dismissed as insignificant. And while the
present data are not really good enough to seriously Justify the strong man-
ipulation that went into creating Figure 10, they illustrate the fact that
reasonable attention must be paid to even small error rates. Thus, great
caution must be exercized in evaluating this kind of data.
Theoretical Conceptions of Reaction Time and Speed-Accuracy Relations
The last section discussed the difficulty of interpreting reaction time
data in the presence of variable error rates. Attempted solutions to this
problem depend, either explicitly cr implicitly, upon theoretical conceptions
of the nature of speed-accuracy relations and these relations, in turn, depend
upon conceptions of reaction time in general. The present section will out-
line a few of these formulations in their simplest form and will emphasize
particularly how each conceives of the relationship between speed and accuracy.
More complex versions of each of these models are available and the reader is
urged to turn to the original sources for detailed analyses. The purpose of
the present section is basically pedagogical: to place in some theoretical
ritaaai

1000
900
800
o 700
§ 600
K 500
S 400
96/ looo joojn*ec/choroc,ery!r
- Slopt: SOnwtc/Choracttr
u 900
•- 800
i 700
z 500 < ui 400-
X 12 3 4
SET SIZE
J I
•* 50tm«c/Chorocter
5 6 JL _L 12 3 4
SET SIZE 5 6
Figure 10. Hypothetical data derived from Figure 6 for two alternative memory scanning hypotheses. The numbers associated with each point indicate the predicted percentage of correct responses.

Fachella r ;
perspective the notions whose importance were noted in the last section. To
ce sure, as each model is made more complex it is more capable of accounting
for more phenomena, but it is then more difficult to distinguish each from
the others. And for the present purposes, it is the distinctions between the
r.odels that will be emphasized.
Tr.e fast-guess model.—One of the simplest conceptions of speed-accura-
cy relations in reaction time has been presented by Ye^Iott (1971). This
model states that the decrement in accuracy produced by emphasizing speed is
due to a failure of stimulus processing on some proportion of the trials. In
a series of trials under speed stress there will be two kinds of responses.
Due class of responses will be uic same as those produced under normal reaction
time instructions. That is, they will be produced in their usual manner, taking
the amount of time necessary for an accurate response. These responses are
"ailed stimulus controlled responses. The ether class of responses, called
fast-guess respens _-s, are initiated without the usual stimulus processing.
These responses will be much faster thin stimulus controlled responses, but
they will have only a chance probability cf being correct. The greater the
emphasis en speed, the larger will be the percentage of these fast-guess re-
sponses. Thus, speed emphasis will increase error rates and decrease average
reaction time.
>'orr,f of the more subtle implications of this conception become apparent
if ■.::!■ basic speed-accuracy relation described earlier is replotied in a some-
w;.a'. different form. For the moment consider a simple two-choice experiment
with various speed emphasis conditions like those which led to the creation
S Figure <♦. Instead of plotting average total reaction time for each speed-
emphasis condition, however, in this case the difference between average cor-
!■■.■,'•, reaction time and average error reaction time, each weighted by its re-
- m -' — - 1 JM

Paehella
spective proportion of trials, will be used. Thus, the quantity (p M -
p M ) will appear on the ordinate where p and p are the probabilities of
correct and error responses and M and M are mean correct and mean c e
error reaction times, respectively. Further, instead of simply using percent
correct as a measure of accuracy, the difference between percent correct and
percent error (p - p ) will be plotted on the abscissa, c e
In situations where the model described above is correct, a function
such as that shown in Figure 11 will result. The important features of such
a graph (and hence, also the reasons for creating it) are as follows: First,
a condition consisting of nothing but stimulus controlled responses will yield
the highest and rightmost point on the function. In such a condition (for
such a simple task) perfect accuracy would obtain and (p - p ) = 1.0. Fur- c e
thermore, the value of (p M - p M ) will equal the average duration of stim-
ulus controlled responses (shown in Figure 11 as u ) since there are neither
fast-guess responses nor errors in this condition. Second, a condition con-
sisting of nothing but fast-guess responses will yield the origin of the graph
[i.e., the point (0,0)]. In such a case, p = p and M = M , since all re- c e c e
sponses are fast-guess responses. Third, Yellott (1971) has derived the fact
that the form of the function for the two quantities in question, as shown in
Figure 11, is linear. This fact can be seen in an intuitive manner from the
realization that the intermediate points on the function result from simple
linear mixtures of the conditions at the extremes of the function. Finally,
given the ranges of the ordinate (from 0,0 to p ) and the abscissa (from 0.0
to 1.0), it can be seen that the slope of the function is equal to p , the s
average duration of stimulus controlled responses. This fact is particularly

65
H-s
<s
moderate speed emphasis
extreme occuracy emphosis
Pr-P.
Figure 11. The form of speed-accur".cy operating characteristic utilized by the Fast-Guess Model. as is the average duration of stimulus controlled responses.

Fache! lu /(",
valuable in situations where one wants to estimate the duration of stimulus
controlled responses but where perfect accuracy conditions are not available.
On the basis of the presentation made in the last section, the fast-guess
model represents a mixed blessing. On the one hand, the basic notion of a
speed-accuracy operating characteristic becomes essentially an elaborate
artifact if fast-guessing in this simple form were the only mechanism
underlying such relations. That is, the mechanism accounting for speed-
accuracy trade-offs is not a processing mechanism, but rather it is a gross,
relatively peripheral strategy on the part of subjects in order to handle
speed stress. Thus, the idea of using speed-accuracy relations directly in
the study of information processing as illustrated earlier loses some of
its force.
On the other hand, if fast-guessing is the only mechanism underlying
the production of errors in reaction time experimentation, then the precise
formulation given by Yellott (1971) represents a powerful solution to the
problem of variable error rates. The average duration of stimulus controlled
responses, y , which is easily derivable from experiments in which speed-
accuracy criteria are manipulated, is exactly the parameter about which
information processing researchers wish to theorize. In other words, the
fast-guess model represents a theoretically well-founded correction for
variable error rates.
Is fast-guessing enough?—The question must be faced as to whether or
not subjects are capable of producing speed-accuracy tradeoffs in some way
other than the simple strategy that was outlined above. To begin with, it
should be noted that no experimental demonstration can rule out fast-guessing
as a potential strategy on the part of subjects. Subjects can
*-■ - * -« —
i riLiieixa 67
always choose to make fast-guess responses if they want to. Thus, what
follows below is simply an attempt to show that subjects are able to produce
speed-accuracy trade-offs with some strategy or mechanism other than simple
fast-guessing.
6 This illustration utilizes as its experimental task a simple letter
classification of the type which has been studied extensively by Posner. On
each trial the subject is presented with a pair of letters. Ke must decide
whether the two letters are both vowels or both consonants, vhat is, if they
belong to the same CLASS, in which case he is to make a same response. If
one of the letters is a vowel and the other a consonant, that is, if they
don't belong to the same CLASS, he is to make a different response. A same
response is to be made, of course, if the two letters differ from each other
only in case (e.g., A a), that is, if they have the same NAME, since they
will then be both vowels or both consonants. Trials of this type where the
letters match in NAME as well as CLASS are typically classified on the order
of 70 msec, faster than pairs of letters which match in CLASS only (see
Fosner and Mitchell, 1967). Likewise, a same response is appropriate if
the letters are physically identical (e.g., A A). These PHYSICAL matches
are typically 70 msec, faster than NAME matches. The stimulus sequences
used in the present experiment had equal proportions of each of these three
kinds of same trials, as well as equal proportions of same and different
tritt In. Under the fast-guess strategy described above, errors produced by
speed stress should be just as likely for all kinds of same and different
trials, since the stimulus is not processed on error trials. In other words,
if the decision to produce a fast-guess is made prior to stimulus processing,
then the random presentation of trial types should y'^ld a rectangular dis-
tribution of errors.
.3ix subjects were run in the experiment for five sessions, •■>.■:■. '••.ion
consisting of UUO trials. The first two sessions were practice .luring which
subject;:, simply performed the letter classification task under typical reac-
tion time instructions. The data from the last half of the second session
was analysed and the mean reaction times for the CLASS matches and •lu- ilAME
mutches were computed.
The last three sessions of the experiment were each divided into three
blocks. On one of these blocks the subject performed the classification
task just as he did during the practice sessions. On each of the other two
blocks the subject attempted to produce all of his responses faster than a
response time deadline. For one of these blocks the deadline was equal to
the mean reaction time of the CLASS matches from the second practice session
ind for the other block the deadline was equal to the mean reaction time of
the NAME matches from the second practice session. Note that these dead-
lines rfcre individually computed for each subject on the basis of his own
dal-i from session two. The order of the blocks was counterbalanced across
subjects and sessions. Subjects were given immediate feedback on each trial
as to the speed and the accuracy of their responses.
The results are presented in Table II. Across the columns are the
various types of trials that could occur in each block. The rows present
the average percent error and mean reaction time for each block (accuracy,
slow deadline and fast deadline) for the experimental days.
The basic result is quite clear. The error distributions are not rec-
tangular. Speed stress affects CLASS matches more than it affects rJAME

Fache11a 69
Table II
Mean reaction time and error rate for each trial
type and deadline condition
PHYSICAJ. NAME CLASS SAME SAME SAME DIFFERENT AA Aa AE Ab
Accuracy
Percent Error
1.0 2.8 3.9 3.2
(no deadline) Reaction
Time (msec.)
510 577 661 62U
Slow Deadline Percent Error
1.8 3.8 16.0 5.8
(equal to mean of CLASS matches) Reaction
Time kn 531 593 569
Fast Deadline Percent Error 2.7 10.5 23.7 11.5
(equal to mean of NAME matches) Reaction
Time 1*63 50 It 5U6 533
t tlCIK'J j.a
matches and it affects NAME matches more than it affects PHYSICAL matches.
The pattern of results produced here clearly eliminates the simple version
of the fast-guess model from being the only source of errors in this situ-
ation.
Cumulative speed-accuracy models.—The above experiment would seem to
indicate that, at least for this task, subjects accumulate information over
time and that they respond when time pressure requires on the basis of what-
ever information is available at thai moment. According to this idea speed
stress ought to affect those stimuli first which require the most processing
and those stimuli last which require the least processing. Thus, as the
present data indicate, CLASS matches, involving a high level of information
extraction, should be affected most by speed stress, while PHYSICAL matches
should be affected the least.
Numerous cumulative processing models exist as alternatives to simple
fast-guessing. A number of these have been summarized by Broadbent (1971)
and Audley (1973). Two will be briefly presented here because of the par-
ticular way in which they characterize speed-accuracy relations. They will
be labeled the Accumulator Model and the Random Walk Model. Again, only
very simple versions of these models will be presented.
Both of these models assume that responses are contingent upon central
decision processes. These decisions are based on evidence about ehe stim-
ulus situation that is acquired over time. Both models assume that the
accumulated evidence is inherently probabilistic; that it is imperfect or
fallible. The models differ from each other in the way in which the evi-
dence is used in making decisions.
-^

i -jene i m 71
Hie Accumulator Model assumes that evidence regarding each possible (or
expected) stimulus alternative is simply aggregated. As evidence
pertinent to any particular stimulus is received, it is added in or totaled
with all other evidence about that stimulus which has been received up to
that moment. A decision to respond is made when the evidence favoring any
particular stimulus reaches some critical value. The higher this critical
value, the greater is the amount of evidence needed in order to respond.
Since it takes time to accumulate evidence, high critical values will lead
to long reaction times. However, decisions which result from high critical
values v.'ill be based on more evidence than those which result from low
critical values, thus they will have a higher probability of being correct.
Cognitive adjustments to speed stress involve adjusting these critical
values to which stimulus evidence must be accumulated in order to respond.
Cpeed stress will lead to low critical values which in turn will lead to
fast reaction times and high error rates.
In the Random Walk Model evidence about the various stimulus alterna-
tives is also aggregated. However, the decision to respond is based on a
relative criterion rather than an absolute one. When the evidence
favoring one alternative exceeds the evidence in favor of any of the other
alternatives by some critical amount, a response is initiated. The model
Is called a Random Walk Model because the state of the evidence from moment
to moment can be conceived of as a random walk among the various alterna-
tives. Over time the accumulated evidence will tend toward favoring one of
the possible alternatives but it will have vacillations as a result of the
probabilistic nature of the datum that is acquired at any moment.

I :t -'llr I ii
Reaction time will be a function of the si;-.e of the critical value by
which the evidence for a particular alternative muut exceed any of the
others. If this critical value is high, that is, if the evidence lavori.ih
one alternative must exceed that of the other alternatives by a large amount,
then reaction times will be long. Again, however, in this situation the
decision will have been based on a large amount of aggregated evidence and
thus the probability of error will be small. By contrast, small critical
values will lead to fast reaction times and high error rates. Cognitive
adjustments to speed stress are made by adjusting the size of the critical
value. The more speed is emphasized, the lower the critical value.
The important difference between the two models presented here is this:
In the Accumulator Model evidence is aggregated separately for each alterna-
tive. A single datum favoring one alternative does not affect the state of
evidence favoring other alternatives. In the Random Walk Model, a single
datum affects the state of evidence for all alternatives, increasing the
chances of one response and decreasing the chances for the others.
The following simple analogy derived from Edwards (1965) may serve to
make these models more concrete. Imagine two bags full of poker chips. One
bag, which will be called the "red" bag, contains 60 percent red poker chips
and !»0 percent blue poker chips. The other bag, called the "blue" bag, con-
taint; 60 percent blue and UO percent red chips. One of these bags is pre-
sented to a subject and he is to determine whether it is the "red" or the
"blue" bag. The subject makes this determination by sequentially drawing
single poker chips from the bag. In the analogy the bags correspond to
stimuli. The sequential sampling corresponds to the process whereby evidence
is aggragated. Reaction time is represented by the number of poker chips

I'rinhvLlu
73
drawn before the subject reaches his decision. The mixture of red and blue
chip:-, in each bag causes the data on which a decision is based to be inher-
ently probabilistic.
If the subject behaves in a manner analogous to the Accumulator Model
he will draw chips until he has some particular number of red or blue chips,
in which case he will respond accordingly. For example, he may continue to
draw until he has drawn either five red or five blue chips in the sequence,
in which case he will respond "red" bag or "blue" bag respectively. If he is
pressed for time he may decide to respond after drawing either three red or
three blue chips. In this case, however, his chances of being in error are
increased. If accuracy is emphasized, the subject may decide to sample
until he has drawn a total of ten or twelve chips of one color. Given the
composition of the two bags, it is quite improbable (though not impossible)
that this decision will be wrong.
A subject behaving in a manner analogous to the Random Walk Model will
continue to sample until the number of chips of one color exceeds the number
of chips of the other color by some particular amount. The larger the excess
needed for a response, the mere time it takes to reach a decision, but the
higher the probability that the decision will be correct. Thus, the m«-.rgin
of difference between the accumulated totals determines the operating crite-
rion on the speed-accuracy characteristic. Under this strategy, after some
particular number of draws, if the same number of red and blue chips have
been accumulated, the subject is no closer to a decision than when he started
sampling. By contrast, with the Accumulator strategy each datum (or chip)
contributes to reaching a decision.
hLKl

Parhelia 7U
Macro- vs. micro- speed-accuracy relations.—Thus far three very-
simple models have been presented. While these models may be unrealistic
in their simplicity, their variety axlows for the consideration of rela-
tionships that are useful in understanding both the performance of sub-
jects and the research strategies employed by experimenters in the study
of speed-accuracy tradeoffs.
One of these relationships concerns the average speed of responses
and the error rate for those responses for various speed emphasis condi-
tions. Up to this point the present paper has dealt exclusively with this
relationship, which for the present purposes will be termed the macro-
tradeoff. The three models discussed above make similar statements about
this relation: Speed emphasis leads to a reduction in average reaction
time and an increase in error rate. Furthermore, the experimental work
presented earlier has shown that this relationship can be useful in the
study of information processing.
A second relationship, which can be distinguished on the basis of
these models, also involves a consideration of ehe speed and the accuracy
of responses. In this case, however, the concern is with the speed of
error responses relative to the speed of correct responses within & par-
ticular speed emphasis condition. This relation, which will be termed the
micro-tradeoff, will be shown to be independent of the macro-tradeoff, at
least with regard to the present models, since each of these models makes
a different prediction about the reaction time for errors relative to the
reaction time for correct responses. In fact, every possible ordering of
the speed of errors relative to the speed of correct responses will be
mid
75
represented among these predictions. Thus, the models agree about, '.he
general form of the macro-tradeoff but disagree about the form of Uie micro-
tradeoff.
The Fast-Guess Strategy predicts that error responses will, on the
r.vorage, be faster than correct responses. This follows simply fror, the
fact that errors occur only as a result of fast-guess responses which are
assumed to be faster than stimulus controlled responses. Correct responses
represent a mixture of the fast-guess responses that happen to be correct
by chance, and stimulus controlled responses. This mixture will have a
longer average duration than the average for error responses. However,
average correct reaction time will, nevertheless, be a function of speed
stress since the proportion of correct-by-chance fast-guess responses in
the mixture vill increase with speed emphasis.
The Random Walk Model predicts that within any speed emphasis condition,
errors and correct responses will have the same reaction time. A reconsid-
eration of the poker chip analogy will make this prediction clear. Imagine
that after each draw of a poker chip the subject evaluates the aggregated
evidence by using Bayes Theorem. That is, after each draw he uses Bayes
Theorem to revise the odds in favor of each alternative. Such an odds revi-
sion process can be represented as a random walk between the two alternatives
as illustrated in Figure 12. When the odds favoring one alternative over
the other alternative reach some critical value or boundary a response is
initiated. The important thing to note with regard to the micro-tradeoff
is that any random walk terminating on one of the boundaries, regardless of

i
§ «
ao
-r i
b »o s a
1 «c I "*^.
At
-*>
LULU o» inn 1 ♦too i ioi
i-i. J I •0:1 »I no MOO
Figure 12. The Bayesian, odd-revision Random Walk Model.
■ ■ ■ m\m am

Fache1la 77
how long it. takes to get there, will have the same probability of being cor-
rect as any other walk terminating on that boundary. This follows from the
basic definition of probability or "odds." Thus, the probability of being
correct is independent of the duration of a particular random walk and cor-
es rect and error responses will have the same average reaction time.
Finally, the Accumulator Model predicts that, within a particular speed
emphasis condition, errors will have longer reaction times than correct
responses. Again; consider the poker chip analogy. In the Accumulator
Model the subject samples poker chips until he has sampled some critical
number of red or blue chips; for example, imagine the critical number to be
five. A short reaction time will occur when the subject, happens to sample
only five chips and they all turn out to be either red or blue. Given the
composition of the two bags, it would be relatively improbable to sample
such a sequence from the wrong bag. By contrast, a sampling sequence con-
sisting of five chips of one color and four chips of the other color will
represent the longest possible sequence and it will have a relatively high
probability of being in error. Thus, on the average, for a given criterion,
errors will be associated with long sequences (by analogy, long reaction
times) and correct responses with short sequences.
Quantification of the micro-tradeoff can be carried out in a more con-
tinuous manner than the simple relations described above between the means
of error and correct responses. In particular, Rabbitt and Vyas (1970) and
Lappin and Disch (1972a) have utilized a procedure for acquiring a function
relating accuracy to reaction time for the micro-tradeoff in a form similar
to that which has been described for the macro-tradeoff (e.g., as in Figure
It). Under this procedure the reaction times for a particular speed emphasis
-f"—
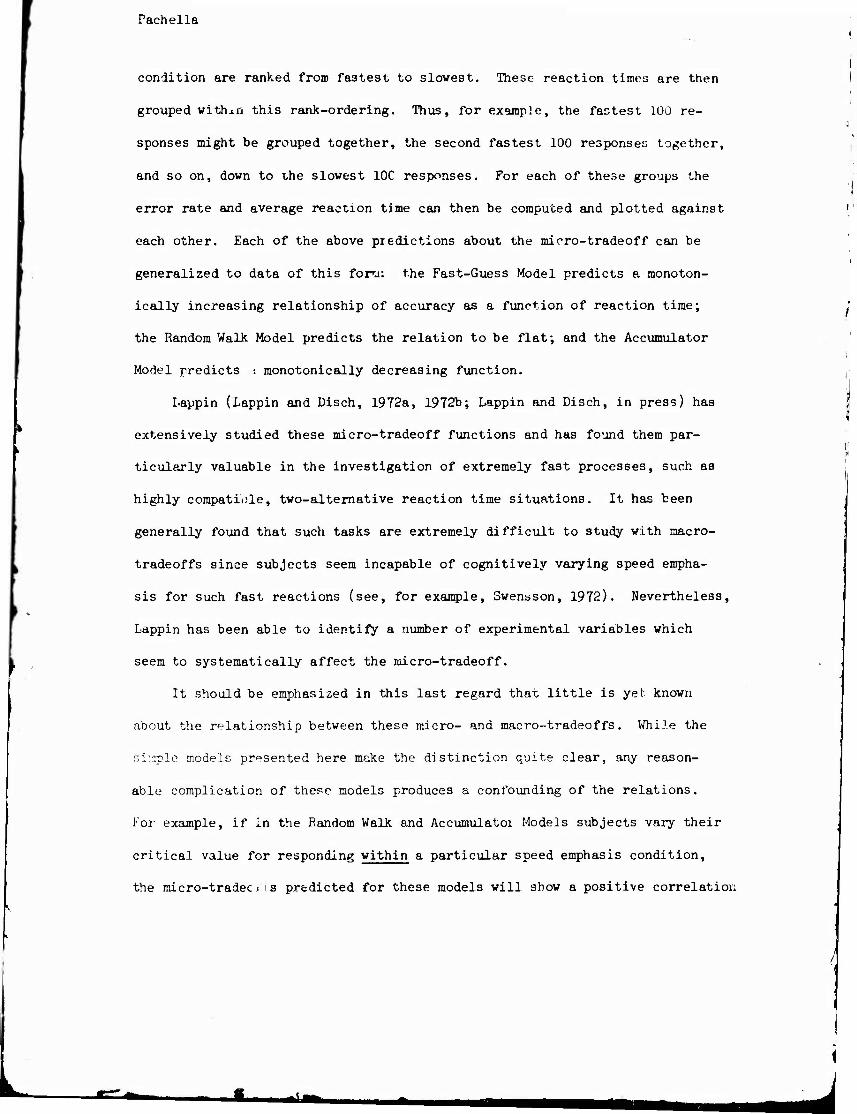
Pachella
condition are ranked from fastest to slowest. These reaction times are then
grouped withxn this rank-ordering. Thus, for example, the fastest 100 re-
sponses might be grouped together, the second fastest 100 responses together,
and so on, down to the slowest IOC responses. For each of these groups the
error rate and average reaction time can then be computed and plotted against
each other. Each of the above predictions about the micro-tradeoff can be
generalized to data of this foro: the Fast-Guess Model predicts a monoton-
ically increasing relationship of accuracy as a function of reaction time;
the Random Walk Model predicts the relation to be flat; and the Accumulator
Model predicts ; monotonically decreasing function.
Lappin (Lappin and Disch, 1972a, 1972b; Lappin and Disch, in press) has
extensively studied these micro-tradeoff functions and has found them par-
ticularly valuable in the investigation of extremely fast processes, such as
highly compatible, two-alternative reaction time situations. It has been
generally found that such tasks are extremely difficult to study with macro-
tradeoffs since subjects seem incapable of cognitively varying speed empha-
sis for such fast reactions (see, for example, Swensson, 1972). Nevertheless,
Lappin has been able to identify a number of experimental variables which
seem to systematically affect the micro-tradeoff.
It should be emphasized in this last regard that little is yet known
about the relationship between these micro- and macro-tradeoffs. While the
simple models presented here make the distinction quite clear, any reason-
able complication of these models produces a confounding of the relations.
For example, if in the Random Walk and Accumulatoi Models subjects vary their
critical value for responding within a particular speed emphasis condition,
the micro-tradec> is predicted for these models will show a positive correlation
«Tfc M . +
r.'u'hel ia
79
between accuracy and reaction time. Since it seems reasonable that such
variation takes place, the precise untangling of these relations awaits
further experimental and theoretical development.
Summary
Reaction time measures have been used, and will continue to be used,
extensively by researchers interested in substantive issues in experimental
psychology. The value of this experimental work is naturally dependent upon
the inherent strengths and weaknesses of the experimental logic with which
the study of these issues takes place. This logic, in turn, is dependent
upon the precision with which reaction time measures themselves can be mean-
ingfully interpreted.
Many of these substantive issues involve questions about processes
which are mediational and unobservable. Kence, they require an experimental
logic which has come to be known as "converging operations." Conclusions
drawn from experimental designs of this type necessitate multifactor or
multiple-task comparisons. In such situations it is always possible that
the rele/ant processing on the part of the subject may become task or condi-
tion dependent. That is, the subject's processing strategy may change
drastically from condition to condition, thus the comparisons needed in
order to -onverge on some theoretical concept may be invalidated. Obviously
caution is needed in interpreting any particular set of experiments which
in.vo.lve such a sophisticated mode of investigation. In other words, it may
be naive in such situations to allow theories and research strategies to
become too dependent upon some limited set of observations. The idea of the
single "critical" experiment for deciding between potential hypotheses may
not, be practicable for this kind of research.

Fache1 l.i
Furthermore, the particular methods of converging upon information
processing constructs that have been discussed in the present chapter in-
volve powerful assumptions about the precision of reaction time measures.
In particular, they involve the use of interval properties of the reaction
tir.e measures that are obtained as datd. from experiments. The Subtraction
Method leads to conclusions based directly upon the magnitude of a difference
obtained for pairs of experimental conditions and the Additive Factor Method
utilizes differences between differences (i.e., interactions) in order to
structure mental events. Given the variable error rates that are obtained
in reaction time experiments, and the subtleties of speed-accuracy relations
as discussed earlier, it is not clear that such interval properties should
be ascribed to reaction time measures as they are obtained from current
experiments. Indeed, for the purposes of theorizing, experimentally obtained
reaction times may have only ordinal properties and even these can be negated
by a large, positively correlated association between reaction time and
accuracy.
Of great importance, then, to the development of methodologies involv-
ing reaction time measures in the investigation of substantive issues, is
the careful study of reaction time as a measure, per se. Much more must
become known about the general strategies used by subjects in the generation
of reaction times before a high degree of confidence can be had about incor-
porating these measures in subtle substantive controversies. Until then,
great patience and care must be taken in order to limit the possibility of
^erious error in their interpretation.

l'ricli.-l In f'l
References
Auiil'.v, '.'. J. Some observations on theories of choice reaction time:
Tutorial review. In Kornblun, 13. (Ed.) Attention and Performance IV.
J.t-w York: Academic Press, 1973-
:iiwMbont, D. E. Decision and Stress. London: Academe Pret;s, 1971-
Deese, J. Behavior and fact. American Psychologist, 1969, 2j+_, 515-522.
Edwards, W. Optimal strategies for seeking information: Models for statis-
tics, choice reaction times, and human information processing. Journal
of Mathematical Psychology, 1965, 2, 312-329.
Egeth, H., Atkinson, J., Gilmore, G., and Marcus, N. Factors affecting
processing mode in visual search. Perception and Psychophysics, 1973,
13f 39U-U02.
Egeth, H., and Blecker, D. Differential effects of familiarity on Judg-
ments of sameness and difference. Perception and Psychophysics, 1971,
9, 321-326.
Eget1"., H., Jonides, J., and Wall, S. Parallel processing of multielement
displays. Cognitive Psychology, 1972, 3.» 67^-698.
Egeth, H., Marcus, N., and Bevan, W. Target-set. and response-set inter-
action: Implications for models of human information processing.
Science, 1972, 176, 1UU7-IUU8.
Eriksen, C. '.■/. , Pollack, M. D., and Montague, W. Implicit speech: Mech-
anism in perceptual encoding? Journal of Experimental Psychology,
L970, 8jt_, 502-507.
Evans, Ü. H., and Anastasio, E. J. Misuse of analysis of covariance when
treatment effect and covariate are confounded. Psychological Bulletin,
.1968, 69, 225-23*4.

Fachella
Fitts, P. M. Cognitive aspects of information processing: III. Set for
speed versus accuracy. Journal of Experimental Psychology, 1966, 71,
8U9-857.
Flowers, J. H., and Garner, W. R. The effect of stimulus redundancy on
speed of discrimination as a function of state and process limitation.
Perception and Fsychophysics, 1971, 9_, 158-l60.
Garner, W. R. The stimulus in information processing. American Psycholo-
gist, 1970, 25., 350-358.
Garner, W. R., Hake, H. W., and Eriksen, C. W. Operationism and the concept
of perception. Psychological Review, 1956, 63, 1U9-159.
Hick, W. E. On the rate of gain of information. Quarterly Journal of
Experimental Psychology, 1952, U_, 11-26.
Howell, W. C, and Kreidler, D. L. Information processing under contradic-
tory instructional sets. Journal of Experimental Psychology, 1963, 6_5_,
39-M3.
Howell, W. C., and Kreidler, D. L. Instructional sets and subjective
criterion levels in a complex information processing task. Journal of
Experimental Psychology, 196U, 68, 6l2-6lU.
Klatzky, R. L., and Smith, E. E. Stimulus expectancy and retrieval from
short-term memory. Journal of Experimental Psychology, 1972, 9j±_, 101-107.
Lappin, J. S., and Disch, K. The latency operating characteristic: I.
Effects of stimulus probability on choice reaction lime. Journal of
Experimental Psychology, 1972a, 92., ^19-^27-
Lappin, J. S., and Disch, K. The latency operating characteristic: II.
Effects of visual stimulus intensity on choice reaction time. Journal
of Experimental Psychology; 1972b, 93, 367-372.

Fachella 83
Lfippiu, •>. S., and Disch, K. The latency operating characteristic: III.
Temporal uncertainty effects. Journal of Experimental Psychology, in
press.
Miller, J. 0., and Pachella, R. G. On the locus of the stimulus probability
i'i':Vrt. Journal of Experimental Psychology, in press.
Pachelja, R. G., and Fisher, D. F. Effect of stimulus degradation and simi-
larity on the trade-off between speed and accuracy in absolute judgments.
Journal of Experimental Psychology, 1969, &1, 7-9 •
Pachella, R. G., Fisher, D. F., and Karsh, R. Absolute Judgments in speeded
tasks: Quantification of the trade-off between speed and accuracy.
Psychonomic Science, 1968, 12, 225-226.
Pew, R. W. The speed-accuracy operating characteristic. Attention and
Performance II. Acta Psychologica, 1969, 30, 16-26.
Pcsner, M. I., and Mitchell, R. F. Chronometrie analysis of classification.
Psychological Review, 1967, JJi, 392-1+09.
Rabbitt, P. K. A., and Vyas, S. M. An elementary preliminary taxonomy for
some errors in choice RT tasks. Attention and Performance III. Acta
Psychologica, 1970, 33, 56-76.
Sternberg, S. High-speed scanning in human memory. Science, 1966, 153,
652-05I.
Sternherg, S. Two operations in character recognition: Some evidence from
reaction time measurements. Perception and Psychophysics, 1967, 2_, 1+5-53.
Sternberg, S. The discovery of processing stages: Extensions of Dondei:s
method. Attention and Performance II. Acta Psychologica, 1969a, 30,
276-315.
ma

facneua
Sternberg, S. Memory scanning: Mental processes nvealed by reaction time
experiments. American Scientist, 1969b, 5_7, 1*21-1*57.
ITternberg, S. Decomposing mental processes with reaction time data. Invited
Address, Annual Meeting of the Midwestern Psycho]ogieal Association, 1971.
i-vaiu'vMi, J. M., and Briggs, G. E. Information processing as a function of
speed versus accuracy. Journal of Experimental Psychology, 1969, 81,
.523-239.
Swensson, R. G. Tne elusive tradeoff: Speed versus accuracy in visual dis-
crimination tasks. Perception and Psychophysics, 1972, 12, 16-32.
Swensson, R. G., and Edwards, W. Response strategies in a two choice reac-
tion time task with a continuous cost for time. Journal of Experimental
Psychology, 1971, 88, 67-81.
Theios, J. The locus of cognition. Paper presented at Thirteenth Annual
Meeting of the Psychonomic Society, November, 1972.
Theios, J. Reaction time measurements in the study of memory processes:
Theory and data. Wisconsin Mathematical Psychology Program, Report 72-2,
December, 1972.
Theios, J., Smith, P. G., Haviland, S. E., Traupmann, J., and Moy, M. C.
Memory scanning as a serial self-terminating process. Journal of EAper-
imental Psychology, 1973, 97, 323-336.
Yellott, J. I. Correction for fast guessing the speed-accuracy tradeoff in
choice reaction time. Journal of Mathematical Psychology, 1971, 8,
159-199.
■

Pachella
Footnotes
1. The preparation of this chapter was supported by the Advanced Research
Projects Agency, United States Department of Defense and monitored by
the United States Air Force Office of Scientific Research, under Con-
tract KM620-72-C-0019 with The University of Michigan's Human Perfor-
mance Center. The author would like to acknowledge the helpful
conversations and correspondence with J. Lappin, P.. W. Pew, S. Sternberg,
R. G. Swehsson, and E. A. C. Thomas.
2. Egeth has made this argument only by way of very informal personal
communication with the author. It is reconstructed here for pedagogical
purposes and should not be taken as a formal position on Egeth's part.
3. The importance of the comparison of C-reactions and choice reactions is
relevant only with regard to the argument constructed earlier about the
application of subtractive logic to the methodological advantages of
C-reactions. The nature and value of Egeth's research is not directly
dependent upon this comparison.
k. It should be noted that the original explication of the Additive Factor
Method by Sternberg (1969a) was made in this broader context. The rather
narrow description presented in the present chapter is done for tutorial
purpose:-,, although it accurately reflects the manner in which the method
has been applied by many investigators.
>. Tliis experiment was originally presented at the Forty-fourth Annual
Meeting of the Midwestern Psychological Association, May, 1972.

Pachella 8(,
6. This experiment was originally presented at the Thirteerth Annual
Meeting of the Psychonomic Society, November, 1972.
7. The terms macro- and micro-tradeoff and this particular manner of
discussing this distinction derives largely from many conversations
between the present author and E. A. C. Thomas.
8. It should be noted that this Bayesian odds criterion version of the
Random Walk Model represents a monotonic transformation of the simple
difference criterion version presented earlier. This elegant demon-
stration of the form of the micro-tradeoff was originally made by
Wilfred Kincaid of The University of Michigan's Mathematics Department.
s7 RECENT TECHNICAL REPORTS
35. Wichawut, C. Encoding variability and the effect of spacing of repetitions in continuous recognition memory. January 1972.
36. Walter, D. A. The role of acoustic and semantic dimensions of memory in sentence memory and comprehension. March 1972.
37- Greeno, J. G. The structure of memory and the process of solving problems. June 1972.
38. Greeno, J. G. & Bjork, R. A. Matuematical learning theory and the new "mental forestry." July 1972.
39. Polzella, D. J. Remembering the functional sentence. August 1972.
ho. Malin, J. T. An analysis of strategies for solving certain substitution problems. April 1973.
kl. Robinson, J. K. Storage and retrieval processes under conditions of proactive interference. April 1973.
k2. Mayer, R. E. Acquisition and resilience under test stress of structurally different problem solving procedures. May ±073.
1+3. Jagacinski, R. J. Describing multidimensiona'i. stimuli by the method of adjustment. June 1973.
hk. Egan, D. & Greeno, J. G. Theory of rule induction: Knowledge acquired in concept learning, serial pattern learning, and problem solving. August 1973.
1+5. Pachella, R. G. The interpretation of reaction time in information processing research. November 1973.
RECENT MEMORANDUM REPORTS
Ik. Halff, K. M. The differential effects cf stimulus presentation during error- and success-feedback intervals in concept identification. August 1971-
15. Mayer, R. E. Dimensions of learning to solve problems. February 1972.
16. Martin, E. Serial learning theory. February 1973.
l"l. Pachella, R. G. The effect of set on the tachistoscopic recognition of pictures. October 1973.
1