November 1971 Washington, D.C. TC Publication 434
62
UNITED STATES TARIFF COMMISSION BROADWOVEN POLYESTER-COTTON FABRICS: WORKERS OF THE BIRMINGHAM PLANT OF AVONDALE MILLS Report to the President on Investigation No. TEA-W-116 Under SectiOn 301(c)(2) of the Trade Expansion Act of 1962 TC Publication 434 Washington, D.C. November 1971
Transcript of November 1971 Washington, D.C. TC Publication 434
UNITED STATES TARIFF COMMISSION
BROADWOVEN POLYESTER-COTTON FABRICS: WORKERS OF THE BIRMINGHAM PLANT OF
AVONDALE MILLS
Report to the President on Investigation No. TEA-W-116
Under SectiOn 301(c)(2) of the Trade Expansion Act of 1962
TC Publication 434 Washington, D.C.
November 1971
UNITED STATES' TARIFF
Catherine Bedell, Chairman
Joseph 0. Parker, Vice Chairman
Glenn W. Sutton
Will E. Leonard, Jr.
George M. Moore
J. Banks Young
Kenneth R. Mason, Secretary
Address all communications to United States Tariff Commission
Washington, D.C. 20436

CONTENTS
Page
Report to the President Finding of the Commission Views of Chairman Bedell, Commissioner Sutton, and
Commissioner Moore 3 Dissenting views of Commissioner Leonard- 6
Information obtained in the investigation:
Articles under investigation A-1 U.S. tariff treatment A-2 U.S. consumption:
Woven fabrics of manmade fibers A-6
Woven fabrics of cotton A-7 Men's and boys' shirts A-7
Not knit A-7
Knit A-9 U.S. production:
Woven fabrics of manmade fibers A-9 Woven fabrics of cotton A-10
Men's and boys' shirts A-11 Not knit A-11 Knit A-12
U.S. imports: Woven fabrics of manmade fibers A-13 Woven fabrics of cotton A-14
Men's and boys' shirts A-14
Not knit A-14
Knit A-16 U.S. exports:
Woven fabrics of manmade fibers A-16
Woven fabrics of cotton A-17 Men's and boys' shirts A-17
Avondale Mills A-18
The Birmingham Plant A-19 * * *
Company statement Appendix A. Statistical tables Appendix B. Statement of Donald Comer, Jr., President of
Avondale Mills, on closing the Birmingham Plant
A-19 A-20
A-40
1 2

ii
CONTENTS--Continued
Appendix Tables
Page
1. Woven fabrics of manmade fibers covered by TSUS item 338.30: Changes in U.S. :'ates of duty, and U.S. dutiable imports for consumption, 1935-70 and January-June 1971 A-21
2. Selected cotton fabrics: U.S. rates of duty in specified years 1930 to 1971 A-22
3. U.S. rates of duty applicable to men's and boys' shirts, not knit, of the types provided for in specified TSUS items, 1930 and GATT concessions to Jan. 1, 1972 A-23
4. Men's and boys' shirts, 1/ not ornamented, not knit, of cotton: Rates of duty and U.S. imports for consumption, 1930, 1947-70, January-June 1970, and January-June 1971 A-24
5. Men's and boys' shirts, 1/ not ornamented, not knit, of manmade fibers: Ad valorem equivalents of rates of duty and U.S. imports for consumption, 1930, 1947-70, January-June 1970, and January-June 1971 A-25
6. U.S. rates of duty applicable to men's and. boys' shirts, knit, of the types provided for in specified TSUS items, 1930 and GATT concessions to Jan. 1, 1972 A-26
7. Woven fabrics of manmade fibers (except glass): U.S. pro-duction, imports for consumption, exports of domestic merchandise, and apparent consumption, 1961-70 A-27
8. Certain woven cotton fabrics of intermediate yarn numbers (approximately 30s to 40s): U.S. production, imports for consumption, exports of domestic merchandise, and apparent consumption, 1964-70 A-28
9. Men's and boys' shirts, 1/ not knit: U.S. production, imports for consumption, exports of domestic merchandise, and apparent consumption, 1960-70, January-June 1970, and January-June 1971 A-29
10. Men's and boys' shirts, not knit: U.S. production, imports for consumption, exports of domestic merchandise, and apparent consumption, total and by shirt type, 1965-70, January-June 1970, and January-June 1971 A- 30
11. Men's and boys' shirts, knit: 1/ U.S. production, imports for consumption, exports of domestic merchandise, and apparent consumption, 1965-70 A 31
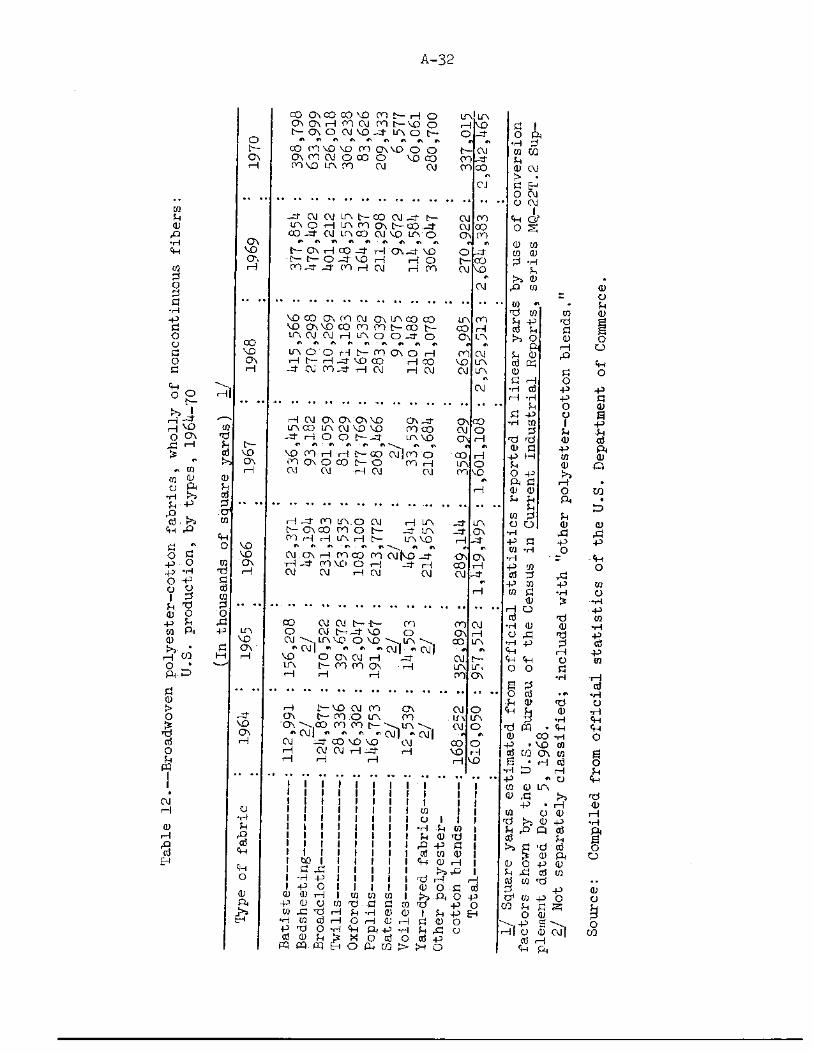
12. Broadwoven polyester-cotton fabrids, wholly of noncontin-uous fibers: U.S. production, by types, 1964-70 A 32
13. Men's and boys' shirts, not knit: U.S. production, 1/ by types and fibers, specified years, 1958 to 1970-------- A-33
14. Broadwoven polyester fabrics, wholly of noncontinuous fibers: U.S. imports for consumption, by types, 1964-70 and January-June 1971 A-34
iii
CONTENTS - -Continued
Page
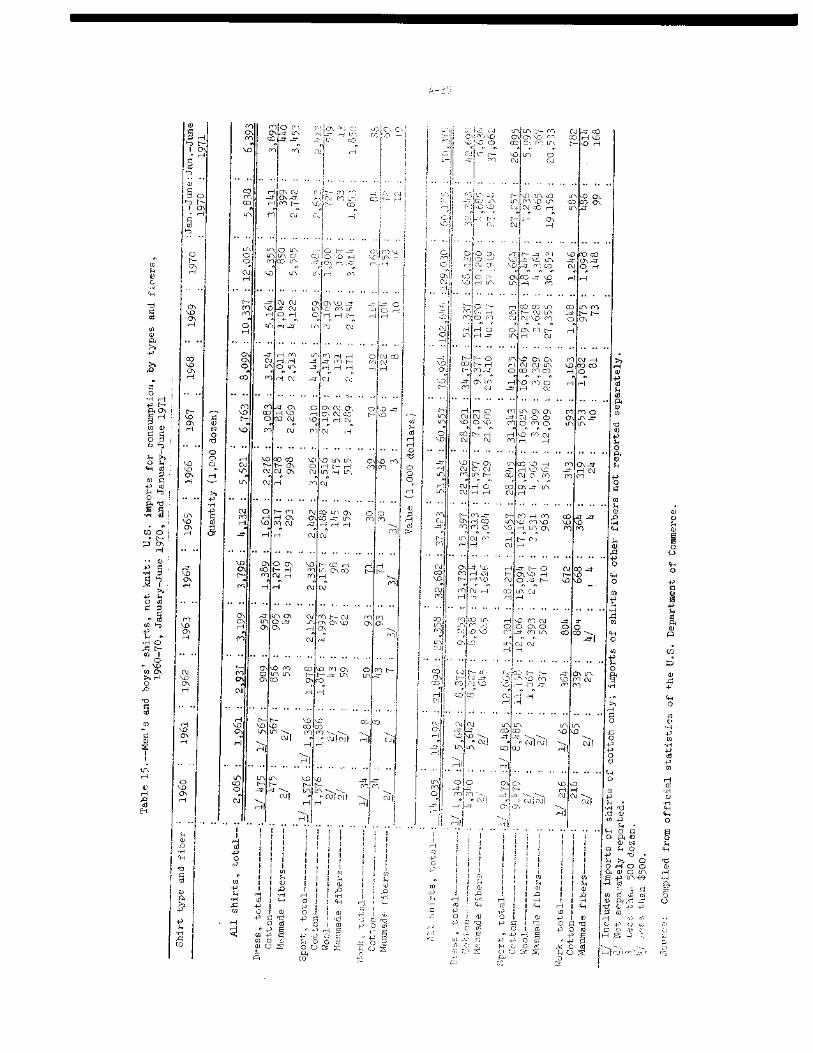
15. Men's and boys' shirts, not knit: U.S. imports for con-sumption, by types and fibers, 1960-70, January-June 1970, and January-June 1971 A-35
16. Men's and boys' dress shirts, not knit: U.S. imports for consumption, by principal sources, 1965-70 A-36
17. Men's and boys' sport shirts, not knit: U.S. imports for consumption, by principal sources, 1965-70--- A-37
18. Men's and boys' knit shirts, except T- and sweat: 1/ U.S. imports for consumption, by fibers, 1962-70, January-June 1970, and January-June 1971 A-38
19. Broadwoven polyester fabrics, wholly or chiefly by weight of noncontinuous fibers: U.S. exports of domestic mer-chandise, by kinds, 1965-70 A-39
Note.--The whole of the Commission's report to the President may not be made public since it contains certain information that would result in the disclosure of the operations of an individual concern. This published report is the same as the report to the President, except that the above-mentioned information has been omitted. Such omissions are indicated by asterisks.


REPORT TO THE PRESIDENT
U.S. Tariff Commission, November 15, 1971.
To the President:
In accordance with section 301(f)(1) of the Trade Expansion Act
of 1962 (76 Stat. 885), the U.S; Tariff Commission herein reports the
results of an investigation made under section 301(c)(2) of that act
in response to a workers' petition.
On September 16, 1971, seven employees of the Birmingham (Ala.)
plant of Avondale Mills filed a petition on behalf of the employees
of the plant for a determination of their eligibility to apply for
adjustment assistance. The Commission instituted an investigation
(TEA-W-116) on October 1, 1971, to determine whether, as a result
in major part of concessions granted under trade agreements, articles
like or directly competitive with the broadwoven polyester-cotton fab-
rics of the type produced by the plant are being imported into the
United States in such increased quantities as to cause, or threaten
to cause, the unemployment or underemployment of a significant num-
ber or proportion of the workers of such plant.
Public notice cf the receipt of the petition and the institution
of the investigation was published in the Federal Register on
October 8, 1971 (36 F.R. 19658). A public hearing was requested, but
the request was later rescinded and no hearing was held.
The information in this report was obtained principally from
officials of Avondale Mills and from the Commission's files.
Finding of the Commission
On the basis of its investigation, the Commission 1/ finds
(Commissioner Leonard dissenting) that articles like or directly com-
petitive with the broadwoven polyester-cotton fabrics of the type
produced by the Birmingham (Ala.) Plant of Avondale Mills are, as a
result in major part of concessions granted under trade agreements,
being imported into the United States in such increased quantities as
to cause, or threaten to cause, the unemployment or underemployment
of a significant number or proportion of the workers of such plant.
1/ Vice Chairman Parker and Commissioner Young did not participate in the decision

3
Views of Chairman Bedell, Commissioner Sutton, and Commissioner Moore
This investigation was undertaken pursuant to section 301(c)(2)
of the Trade Expansion Act of 1962 in response to a petition filed on
September 16, 1971, by the workers of the Birmingham plant of Avondale
Mills for a determination of their eligibility to apply for adjustment
assistance under that Act.
The Birmingham plant, which ceased operations on October 24, 1971,
was the sole plant in the Avondale Mills system producing fine-spun
polyester-cotton fabrics, specifically chambrays, shirtings, and
ginghams. Most of the fabrics woven at the Birmingham plant were sold
to a few large retail firms for manufacture into shirts, principally
dress and sports shirts for men. The petitioners contend that imports
of fabrics like or directly competitive with those produced at the
Birmingham plant, as well as imports of finished shirts made from such
fabrics, have increased in major part as a result of trade-agreement
concessions and have been the major factor in causing their unemployment.
Imports of manmade and cotton fabrics, as well as imports of
shirts manufactured from such fabrics, increased sharply in recent
years. Applicable rates of duty for such articles were reduced
substantially as a result of trade-agreement concessions. Although the
growth in imports of these articles has been influenced by many factors,
articles like or directly competitive with the fabrics' produced at the
Birmingham plant have been imported in increased quantities, as a
result in major part of trade-agreement concessions, and were the major
factor in causing unemployment at the Birmingham plant. The major
changes in trade and rates of duty pertinent to this determination
are summarized below.

As a result of trade-agreement concessions, the ad valorem
equivalents of the compound rates of duty on polyester-cotton fabrics
of the type produced at the Birmingham plant were reduced 66 percent
between 1930 and 1971, or from 80.4 percent to 27.6 percent. Imports
of fabrics of manmade fibers increased sharply following the most
recent concessions under the GATT, effective in 1951 and in the years
from 1968 through 1971, from 212 thousand pounds in 1951 to 39 million
pounds in 1970. For the current year, such imports are entering at an
estimated annual rate of 47 million pounds, a rate quadruple that for
imports in 1959. Polyester-cotton fabrics of the type produced at
the Birmingham plant figure prominently in these increases.
Similarly, the ad valorem equivalents of the compound rates of
duty on men's and boys' shirts made from polyester-cotton fabrics of
the type produced at the Birmingham plant were reduced 55 percent
pursuant to trade-agreement concessions under the GATT, from 80.6
percent to 36.1 percent, the level at which the rate of duty has re-
mained since 1958. Imports of men's and boys' dress shirts of manmade
fibers (neither ornamented nor knit), which, in recent years, consist
principally of polyester-cotton shirts similar to those produced from
fabric woven at the Birmingham plant, increased sharply from 51
thousand dozen in 1962, the first year for which data are available,
to 5.5 million dozen in 1970, and continued to increase into 1971.
Imports of men's and boys' sports shirts of the same fabrics increased
similarly from 34 thousand dozen in 1962 to 3.4 million dozen in 1970.

5
The impact of these increased imports, which resulted in major
part from trade-agreement concessions, on the Birmingham plant of
Avondale Mills has been devastating. In an effort to continue operating,
the plant turned, most recently, to supplying fancy goods to the dress
shirt trade, a specialty market for which the plant's equipment was not
particularly well-suited. Faced with the prospect of continually
increasing concession-generated imports, Avondale Mills decided to close
the Birmingham facility in view of operating losses at this plant at
a rate exceeding one million dollars annually. As a result, a
significant number and proportion of employees, unable to relocate
within the remaining plants of the firm, became unemployed.
The severe impact of concession-generated imports on the Birmingham
plant has its parallel in the recent firm and worker investigations on
the Arista Mills Co. 1/ For both firms, their major line of fabrics
was adversely affected by imports of concession-generated shirtings
and shirts. For both firms, at least one major customer shifted to
purchasing imported shirts competitive with those manufactured from
fabrics produced by the firm. And for both firms, reorientation of
their production facilities into other lines proved ineffective.
In view of the foregoing, we believe the petitioners have met
the criteria for eligibility to apply for adjustment assistance under
the Trade Expansion Act of 1962.
1/ Arista Mills, TEA-F-12 (Nov. 1970) and TEA-W-47 (Mar. 1971). In these two investigations the majority found affirmatively with respect to the firm and the workers. Chairman Bedell was not then a member of the Commission.

6
Dissenting Views of Commissioner Leonard
Section 301(c)(2) of the Trade Expansion Act of 1962 has imposed
four conditions, each of which must be satisfied if an affirmative deter-
mination is to be made. The conditions are:
1. Articles like or directly competitive with the broad-woven polyester-cotton fabrics produced by the workers concerned are being imported in increased quantities.
2. The increased imports are in major part the result of concessions granted under trade agreements.
3. A significant number or proportion of the workers con-cerned are unemployed or underemployed, or threatened with unemployment or underemployment.
4. The increased imports resulting in major part from trade-agreement concessions are the major factor caus-ing or threatening to cause the unemployment or under-employment.
A negative determination in the instant investigation is required
because the second condition described above is not satisfied by the
facts found. The facts do not show that any increase in imports is due
in "major' part to trade-agreement concessions.
A very large percentage of the imports of the fabrics and shirts
that have been regarded as being like or directly competitive with the
fabrics produced by Birmingham were made in the Far East. The textile
industries in that area, as in the United States, are labor-intensive--
that is, labor accounts for a sizable portion of the costs of produc-
tion. The wages paid to the textile workers in these countries are,
7
however, much lower than those paid to their counterparts in the United
States. It has been estimated that in the latter part of 1969 the
average hourly earnings in the textile industries of such countries
ranged from a high of 54 cents in Japan to a low of 11 cents in Taiwan,
as compared to $2.34 in the United States. The earnings are undoubtedly
higher today, but the relationship probably has not changed appreciably.
Even if worker productivity in some or all of these countries is less
than the worker productivity in the United States, and even if certain
fringe benefits in these countries are added to their cost of labor,
there still would appear to be a significant difference in labor costs.
In a statement regarding the decision to close the Birmingham
Plant, Donald Comer, President of Avondale Mills, referred to the wage
problem as follows:
Today our former dress customers, as they need colored yarn dress goods, buy the Japanese import made with labor paid at one-fifth the rate of ours.
There is no way we can pay ourselves wages at a race many times that of people around the world, and at the same time afford the luxury of uncontrolled imports made with this cheap labor, with-out disastrous results.
Birmingham's customers have an ample amount of fabrics available to them, made with labor paid at a rate that is illegal in this country, to more than take care of their needs.
Our normal market was completely flooded with low wage imports of piece goods or garments last year, and with over all imports running at a rate 40% higher this year it is futile to hope for a better time tomorrow.
Mr. Comer did not refer to trade-agreement concessions as being
responsible for increased imports.
8
In view of the apparent existence of significant price disparities,
which appear to reflect not only duty reductions but also substantial
differences in costs of production (including raw material, overhead,
and labor), any increase in imports cannot be said to have resulted in
"major" part from concessions granted under trade agreements. Especially
is this so when it is considered that the bulk of the reductions in the
rates of duty on the imported articles were made as far back as 1948,
long before any significant increase in imports of such articles. The
rate of duty on men's and boys' shirts, not ornamented and not knit, of
manmade fibers has not been reduced since June 30, 1958, and the rate
on such shirts, knit, not ornamented, of manmade fibers has not been
reduced since June 6, 1951.

An-1
INFORMATION OBTAINED IN THE INVESTIGATION
Articles Under Investigation
The Birmingham Plant of Avondale Mills, which ceased operations on
October 24, 1971. produced woven fabrics of spun (noncontinuous fiber)
yarns which were composed of blends of polyester (manmade) fiber and
combed cotton. Prior to September 1970, the spun yarns consisted of
50-percent polyester fibers and 50-percent combed cotton of yarn
No. 33 1/ in both warp 2/ and filling. 3/ Subsequently they were 65-
percent polyester and 35-percent combed cotton, of yarn numbers 40s for
warp and 37s for filling. The filling counts ran from 50 to 60 picks 4/
per inch and the warp counts ran from 80 to 90 per inch.
The Birmingham Plant produced fine yarn-dyed plainwoven types,
particularly chsmbrays, ginghams, and other shirtings, weighing approxi-
mately 4 to 5 yards per pound. The Birmingham Plant (hereinafter
referred to as Birmingham) is the only plant of Avondale in which such
fabrics are produced.
The petition stated that the competing imported fabrics entered
under items 338.3065 and 338.3085 of the Tariff Schedules of the United
States Annotated (TSUSA). Such fabrics are described in the TSUSA as
being woven fabrics, of manmade fibers, wholly of spun yarn, and wholly
or in chief value of polyester.
1/ Yarns spun on the cotton system are numbered according to the num-ber of 840-yard hanks that weigh 1 pound. No. 1 yarn measures 840 yards (1 hank) to the pound; No. 100 yarn measures 84,000 yards (100 hanks) to the pound; the higher the yarn number, the finer the yarn.
2/ Yarns running lengthwise of the fabric. 3/ Yarns running from edge to edge of the fabric, at right angles to
the warp. 4/ A pick is one filling yarn.

A-2
Nearly all of the types of fabrics woven at Birmingham are sold
for manufacture into shirts, principally dress shirts for men. The
petition alleges that the "tremendous" increase in the imports of
shirts, as well as of shirting fabrics, has been the result of dras-
tic reductions in the duties covering these items and has contributed
in major part to the closing of the Birmingham Plant and the result-
ing unemployment.
U.S. Tariff Treatment
The fabrics of the types woven at Birmingham are included in
item 338.30 of the TSUSA. The rate his -Lory for this item is shown
in the following table.
Certain woven fabrics of manmade fibers (item 338.30), including polyester and cotton blends in chief value of polyester: Changes in rate of duty pursuant to trade agreements, 1930 to 1971
: Ad valorem equivalent of Rate of duty Effective date : rate of duty, based on
imports in 1970 Cents per pound and :
Percent percent ad valorem
450 + 60% or 70% : June 18, 1930 1/ : 2/ 80.4 450 + 45% : June 15, 1936 3/ : 6o.4 27.50 + 45% or 22.5% : Jan. 1, 1948 7/ : 2/ 38.4 250 + 22.5% : June 6, 1951 E/ 31.1 220 + 22.5% : Jan. 1, 1968 5/ : 30.2 200 + 22.5% : Jan. 1, 1969 5/ : 29.4 170 + 22.5% : Jan. 1, 1970 5/ : 28.3 15O + 22.5% - Jan. 1, 1971 5/ : 27.6
•
1/ Tariff Adt of 1930. 2/ Estimated; 1970 import classes not strictly comparable. 3/ Trade agreement with France. 4/ Pursuant to reductions under the General Agreement on Tariffs
and Trade (GATT). 5/ Kennedy Round.

A-3
As illustrated above, the rate of duty applicable to the Birmingham-
type fabrics has undergone several reductions pursuant to trade agree-
ments. Table 1 in the statistical appendix shows the quantity and
value of imports under the various duty rates and the ad valorem
equivalents of the rates, based on imports in 1970. The ad valorem
equivalent in 1971 was 66 percent lower than in 1930.
Pursuant to Presidential Proclamation No. 4074, effective
August 16, 1971, the rates of duty on most imported products, includ-
ing woven fabrics and shirts of manmade fibers, were increased by
the temporary imposition of an additional duty of 10 percent ad valo-
rem or less, as provided for in new subpart C of part 2 of the appen-
dix to the TSUSA. There have been recent press reports that the sur-
charge on most wool and manmade-fiber textiles, except raw materials,
will be removed in the near future after formal agreements have been
signed between the United States and Japan, the Republic of Korea,
Taiwan, and Hong Kong which will impose quantitative limitations on
imports of specified wool and manmade-fiber textile categories.
Broadwoven fabrics of cotton, including types comparable to
the polyester-cotton blended fabrics of Birmingham, are dutiable
in the TSUSA under items 320.30 to 320.40, if not bleached and not
colored; 321.30 to 321.40, if bleached but not colored; and 322.30 to
322.40, if colored, whether or not bleached. The rates of duty vary
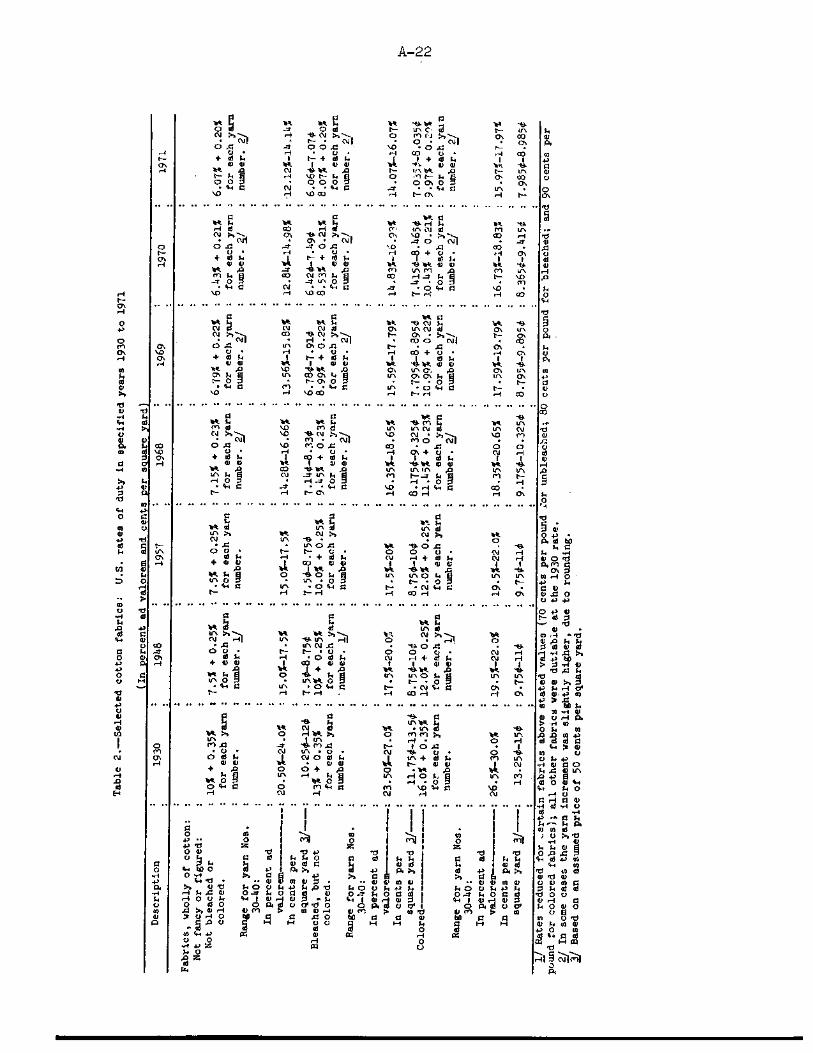
according to yarn number and are summarized in table 2. The

A-4
duty reductions effected between 1930 and 1971 amounted to a total
reduction of about 40 percent.
Imports of cotton fabrics are subject to restraints in accord-
ance with the provisions of the Long-Term Arrangement Regarding
International Trade in Cotton Textiles (LTA). The LTA was designed
to increase significantly access to markets where imports were sub-
ject to restriction; to maintain orderly access to markets where
restrictions were not maintained; and to secure from exporting coun-
tries, where necessary, a measure of trade restraint in their export
policy so as to avoid disruptive effects in import markets. Imports
of cotton fabrics and all other articles subject to restraints under
the LTA are exempt from the additional duty proclaimed by the
President on August 16, 1971 (headnote 5(g) to subpart C of part 2
of the appendix to the TSUSA).
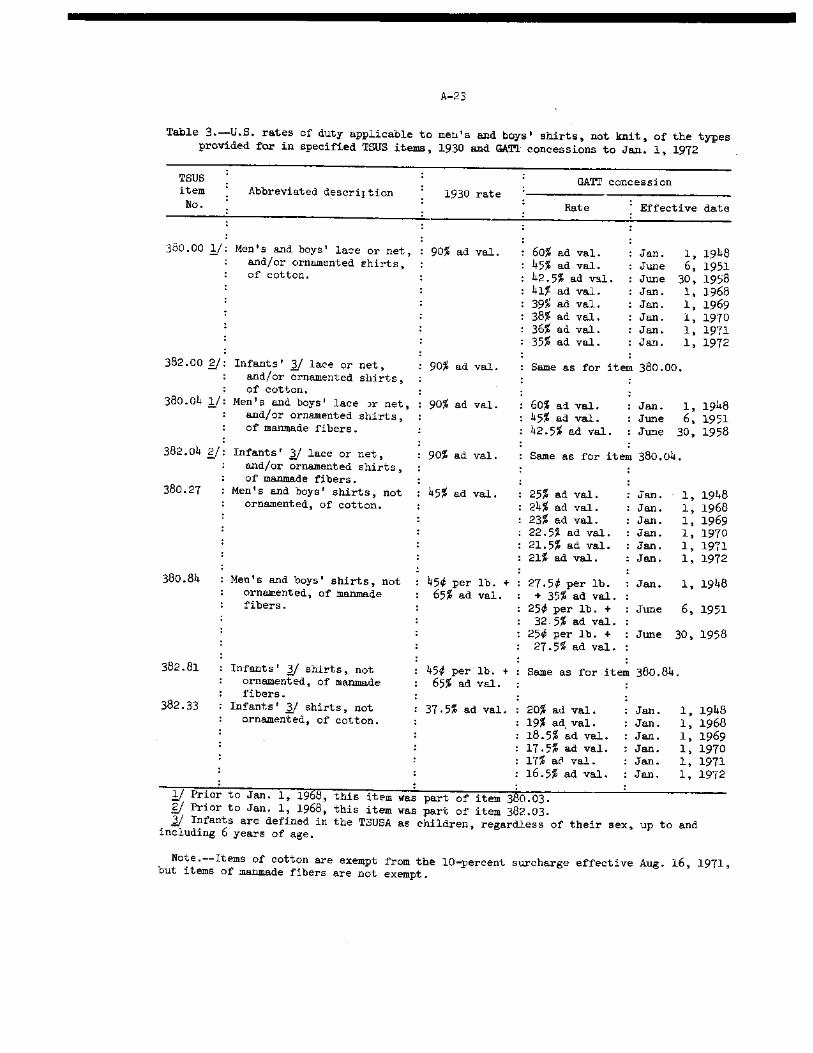
The U.S. rates of duty, in the Tariff Act of 1930 and pursuant to
trade agreement concessions, applicable to men's and boys' shirts,
not knit, which include the types made from fabrics similar to those
produced by Birmingham, are shown in tables 3, 4, and 5. Most of
the imports of men's and boys' shirts of cotton, not knit, are not
ornamented and are entered under item 380,27. The rate of duty on
such shirts was reduced from 45 percent ad valorem in the act of
1930 to 25 percent ad valorem, effective January 1, 1948, pursuant
to a concession granted in the General Agreement on Tariffs and
Trade (GATT). The rate was not reduced again until the Kennedy
Round, when it was reduced by stages, effective January 1 of each

A-5
year, from the pre-Kennedy Round rate of 25 percent ad valorem to the
present rate of 21.5 percent ad valorem. IA is scheduled to be
reduced to 21 percent ad valorem, effective January 1, 1972. The
changes in duty between 1930 and 1971 resulted in a total rate reduc-
tion of 52 percent.
Men's and boys' shirts of manmade fibers, not knit and not orna-
mented (item 380.84), were dutiable at the rate of 45 cents per pound
plus 65 percent ad valorem in the act of 1930. The rate was reduced
to 27.5 cents per pound plus 35 percent ad valorem in the first round
of GATT negotiations, effective January 1, 1948. Further reductions
were negotiated under the GATT to 25 cents per pound plus 32.5 per-
cent ad valorem, effective June 6, 1951, and to 25 cents per pound
plus 27.5 percent ad valorem, effective June 30, 1958. No further
reductions have been made in this rate of duty. The ad valorem
equivalent of the rate, based on imports in 1970, for this item was
80.6 percent in 1930, 44.5 percent in 1948, 41.1 percent in 1951, and
36.1 percent in 1958-71.
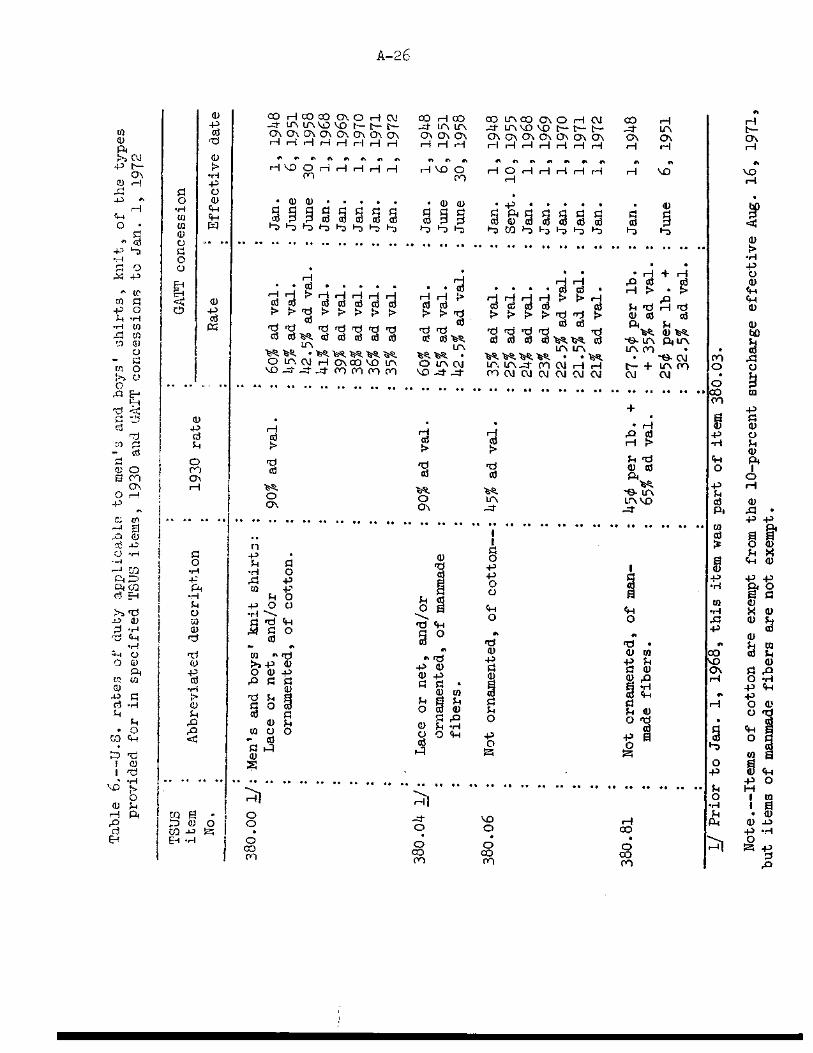
The rate history since 1930 on men's and boys' shirts, knit, of
cotton, is similar to that on such shirts, not knit. The rate
history on knit shirts of manmade fibers is similar to that on such
shirts, not knit, up to June 6, 1951, when the rate became 25 cents
per pound plus 32.5 percent ad valorem. No further changes have been
made in this rate (table 6).
A-6
U.S. Consumption
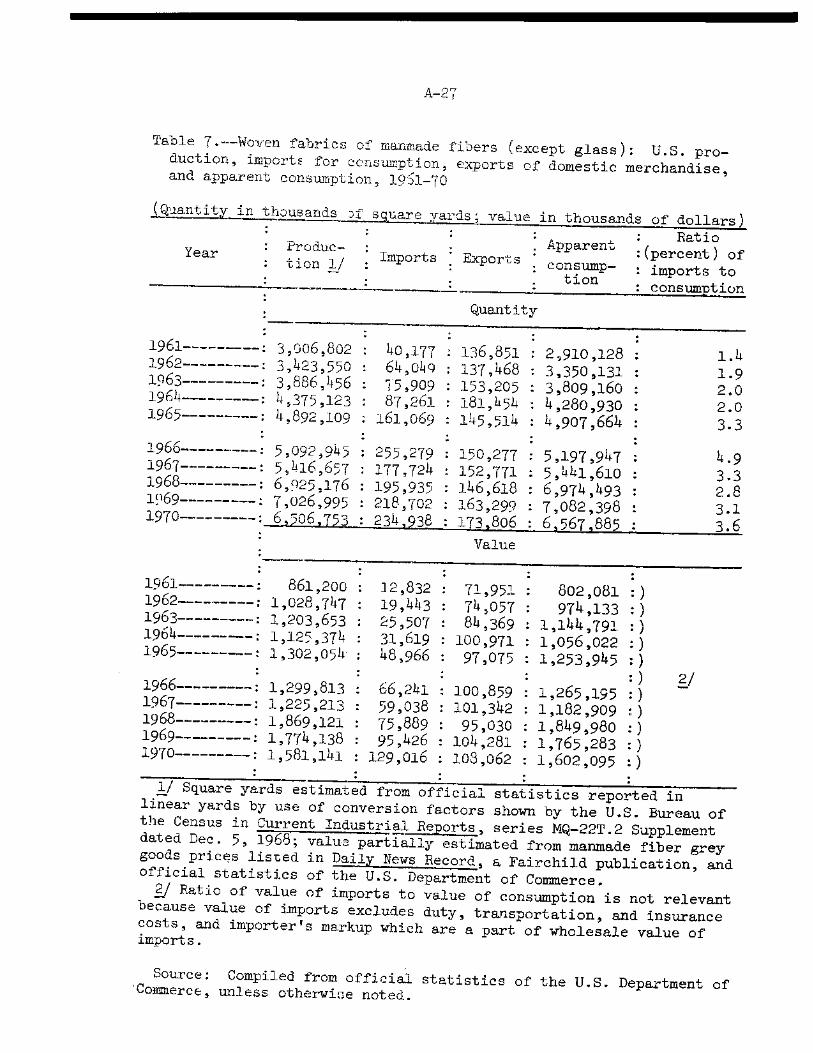
Woven fabrics of manmade fibers
The consumption of all broadwoven fabrics of manmade fibers
(except glass) increased from 2.9 billion square yards, valued at
$0.8 billion, in 1961 to 7.1 billion square yards, valued , at $1.8
billion, in 1969 (table 7). Consumption declined in 1970 to 6.6 bil-
lion square yards, valued at $1.6 billion, and is believed to be con-
tinuing to decline in 1971. The major increases in the consumption
during the 1961-69 period consisted of nylon filament fabrics,
spun rayon and acetate fabrics, spun rayon and acetate blends with
cotton, polyester and cotton blends, polyester and rayon blends, and
filament/spun combinations of rayon and acetate. The declines in
1970 and 1971 are reflected in a reduction in demand in the United
States of almost all the principal types of fabrics. It is esti-
mated, however, that the output of nylon fabrics and spun acetate
and rayon fabrics decreased to a larger extent than the polyester and
cotton and polyester and rayon blends. During the 1961-70 period,
the ratio of imports to consumption was less than 5 percent and
reached its maximum of 4.9 percent in 1966.
Data on domestic consumption of fabrics of polyester and cotton
blends similar to those produced by Birmingham are not available
because import and export statistics do not report such fabrics sepa-
rately. It is believed, however, that domestic consumption of poly-
ester and cotton blends increased consistently from 1964 to 1970, but
has declined in 1971.

A-7
Woven fabrics of cotton
The domestic consumption of cotton fabrics of the same range of
yarn numbers as the fabrics produced by Birmingham declined drasti-
cally from about 1 billion square yards in 1964 and 1965 to approxi-
mately a quarter of a billion square yards in 1970 (table 8). The
share of imports, however, increased greatly, from about 15 percent
of consumption in 1964 to 67 percent in 1970. It is not known how
many of these imports were shirting fabrics.
Men's and boys' shirts
Not knit.--U.S. consumption of men's and boys' shirts of woven
fabrics increased from 36.5 million dozen in 1960 to 43.4 million
dozen in 1966, declined to 40.9 million dozen in 1968, and then
increased to 43.6 million dozen in 1970. Imports accounted for 6
percent of consumption in 1960, 10 percent in 1965, 28 percent in
1970, and 31 percent in the first half of 1971 (table 9).
U. S. consumption of men's and boys' dress shirts increased from
12.6 million dozen in 1965 to 19.6 million dozen in 1970 (table 10).
U.S. imports accounted for 13 percent in 1965, 32 percent in 1970,
and 40 percent in January-June 1971.
In the past 3 years, U.S. shirt manufacturers have become more
style conscious, particularly with regard to men's dress shirts,
incorporating innovations in collar design and in colors and patterns
and promoting new ideas, such as the tapered look. This development
was initiated by shirt manufacturers with nationally known brands.

A-8
As a result, U.S. consumption of dress shirts increased more rapidly
between 1968 and 1970 than in previous years.
Consumption of men's and boys' sport shirts has followed a
pattern different from that of dress shirts. Woven sport shirt con-
sumption declined from 25.7 million dozen in 1965 to 18.9 million
dozen in 1970. Some of this decline was caused by the increase in
knit sport-shirt consumption. Another reason for the decline has
been greater wearing of dress shirts as sport shirts. U.S. imports
increased their share of consumption from 10 percent in 1965 to 29
percent in 1970 and in the first half of 1971.
Woven fabrics wholly of cotton were the principal ones used in
dress and sport shirts from 1930 to about 1968. Wash-and-wear dress
and sport shirts of polyester and cotton, usually in chief weight of
polyester, increased their share of consumption in the 1955-65
period, but not until the advent of the permanent-press finish did
their growth increase rapidly; they have exceeded cotton shirts in
consumption in recent years.
Work shirt consumption increased from 4 million dozen in 1965
to 4.7 million dozen in 1968, then declined to 4.3 million in 1970
(table 10). The ratio of imports tc consumption has been small, and
was only 4 percent in 1970. Cotton fabrics are the principal ones
used in work shirts, although fabrics of polyester and cotton have
accounted for an increasing share of the total fabrics used.

A-9
Knit.--Domestic consumption of knit shirts increased from 13
million dozen in 1965 to 19 million dozen in 1968 and was 16 mil-
lion dozen in 1970 (table 11). The production of knit sport shirts
increased irregularly over the period whereas the production of knit
dress shirts declined substantially. The ratio of imports to con-
sumption was 13 percent in 1965 and 17 percent in 1970.
U.S. Production
Woven fabrics of manmade fibers
The U.S. production of all broadwoven fabrics of manmade fibers
(except glass) increased from 3.0 billion square yards, valued at
$0.9 billion, in 1961 to 7.0 billion square yards, valued at $1.8
billion, in 1969 (table 7). It declined to 6.5 billion square yards,
valued at $1.6 billion, in 1970, and is expected to decline further
in 1971. The largest increases in production from 1961 to 1969 were
in polyester and cotton blends, nylon fabrics, spun rayon and/or
acetate and cotton blends, polyester and rayon blends, saran and
olefin filament fabrics, and combination filament and spun polyester
fabrics. In 1970, declines in the output of these same fabrics con-
tributed to the overall decrease in production. The largest declines,
however, were in those fabrics containing rayon and nylon fibers.
The great bulk of the domestically produced broadwoven fabrics of
manmade fibers are shipped to other domestic companies which use the
fabrics for manufacture into apparel, household articles, and indus-
trial applications.
A-10
Data on domestic production of the specific polyester and cotton
blends made by Birmingham are not available. The production of broad-
woven polyester and cotton fabrics, wholly of noncontinuous fibers
and in chief weight of polyester, increased from 0.6 billion square
yards in 1964 to 2.8 billion square yards in 1970 (table 12). Con-
:sistent increases in production were recorded in polyester and cotton
- bedsheeting, and except for 1966, also in polyester and cotton broad-
'cloth. Production of yarn-dyed polyester and cotton blends, which
would include types similar to the output of Birmingham, declined
slightly from 215 million square yards in 1966, the first year for
which separate statistics were available, to 211 million square yards
in 1967, then increased to 281 million and 306 million square yards
in 1968 and 1969, respectively; in 1970 it declined to 281 million
square yards, about the same as in 1968.
Woven fabrics of cotton
The U.S. production of cotton fabrics of intermediate yarn num-
bers, which would include types similar to the blends woven by
Birmingham, declined substantially, from 859 million square yards in
1964 to about 95 million square yards in 1970 (table 8). The
increasing consumption of manmade fibers in fabrics which formerly
were wholly of cotton was a large factor in causing this decline.
A-11
Men's and boys' shirts
Not knit.--U.S. production of men's dress shirts of woven fabrics
increased from 6.5 million dozen in 1958 to 7.6 million dozen in 1961
and to 12.1 million dozen in 1970 (table 13). Production of men's
dress shirts of woven cotton fabrics increased from 6.1 million dozen
in 1958 to 8 million dozen in 1964, but then declined to 3.9 million
dozen in 1970. Production of men's dress shirts of woven fabrics of
manmade fibers, chiefly of polyester and cotton blends, increased
from 391,000 dozen in 1958 to 8.2 million dozen in 1970 and accounted
for nearly two-thirds of production in 1970 compared to only 6 percent
in 1958 and 16 percent in 1964. Improvements in the technology of the
permanent-press finish and its adaptability to polyester and cotton
fabrics accounted in large part for the rapid rise in the production
of dress shirts of these fabrics since 1964.
The big three dress-shf.rt manufacturers--Cluett, Peabody and Co.
(Arrow Division), Manhattan Industries, and Phillips Van-Heusen Corp.,
account for at least 40 percent of total domestic dress-shirt produc-
tion. Their dominance in the dress-shirt market enables them to lead
in product style changes, such as collar styles, tapered body, and
wide varieties of colors and patterns, and to be able to sell the
shirts in volume.
Domestic production of men's and boys' sport shirts of woven
fabrics increased steadily from 1945 to 1965, but has since declined
steadily. Production amounted to 20.7 million dozen in 1958,

A-12
23 million dozen in 1965, and 13.6 million dozen i - 1970. The reasons
for the decline after 1965 were cited in the section on U.S. consump-
tion. As in dress shirts, U.S. production of sport shirts of woven
cotton fabrics has declined steadily, particularly since 1964, while
production of sport shirts of polyester and cotton and of other man-
made fibers has increased (table 13). In 1964, production of men's
and boys' sport shirts of fabrics of manmade fibers accounted for 12
percent of the total fabrics used, and in 1970 had increased to 56
percent of the total. The improvement in the permanent-press finish-
ing technique also contributed in large part to the increase in the
output of sport shirts of woven fabrics of manmade fibers.
No single producer or small group of producers accounts for a
large share of the production of sport shirts of woven fabrics. Con-
sequently, there are no style leaders, as in dress-shirt production.
U.S. production of work shirts of woven yarns has ranged from
about 3.7 million to 4.6 million dozen since 1958. Work shirts are
made mainly of cotton fabrics, but the production of those of poly-
ester and cotton fabrics has grown steadily, particularly since 1966.
Knit.--The production of knit men's and boys' shirts increased
irregularly between 1965 and 1970. All of the increase was accounted
for by sport shirts, as dress-shirt production decreased sub-
stantially over the period. The total production of knit men's and
boys' shirts during 1965-70 ranged between 11.6 thousand dozen in
1965 and 16.6 thousand dozen in 1968; it was 13.4 thousand dozen in
1970 (table 11). Cotton is the major fiber used in knit sport shirts.

A-13
U.S. Imports
Woven fabrics of manmade fibers
Imports of broadwoven fabrics of manmade fibers (except glass)
increased from 40.2 million square yards, valued at $12.8 million, in
1961 to 255.3 million square yards, valued at $66.2 million, in 1966,
then declined to 177.7 million square yards, valued at $59.0 million,
in 1967. Thereafter, they increased regularly to 234.9 million
square yards, valued at $129.0 million, in 1970 (table 7). The
imports have been principally polyester fabrics, especially dyed and
finished spun-yarn goods (chiefly blends with cottoL), and dyed and
finished filament-yarn goods (mostly blends with rayon); rayon fab-
rics, particularly dyed and finished filament-yarn goods; and nylon
fabrics, notably grey filament-yarn goods. Polyester fabrics
(including blends) accounted for 45 percent of the imports in 1970;
rayon fabrics, 22 percent; nylon fabrics, 13 percent; acrylic fab-
rics, 8 percent; and acetate fabrics, 4 percent. Almost all of the
imports are similar in type and quality to the like domestic fabrics;
their prices, however, are usually lower.
Imports of the specific types of fabrics woven by Birmingham
and imports of polyester and cotton blends are not separately
reported in official statistics. Imports of woven polyester fabrics
wholly of noncontinuous fibers, which would include polyester and
cotton blends in chief value of polyester, are reported as to
whether not bleached and not colored (grey goods) or other (finished
goods). Imports of the finished goods, which would include
A-1)4
Birmingham types, rose from 2.4 million square yards, valued at
$0.9 million, in 1964 to 45.5 million square yards, valued at $12.4
million, in 1966. From the high in 1966, imports declined irregularly
to 13.6 million square yards, valued at $7.0 million, in 1970 (table
14). The imports in the first 6 months of 1971, 8.6 million square
yards, valued at $3.8 million, indicate an increase for the year
over 1970.
Woven fabrics of cotton
Imports of woven fabrics of cotton, including types similar to
the polyester-cotton blends of Birmingham, fluctuated substantially
during 1964-70. They ranged between 150 million square yards in
1964 and 227 million square yards in 1966, and were 170 million
square yards in 1970 (table 8).
Men's and boys' shirts
Not knit.--U.S. imports of men's and boys' dress, sport, and
work shirts of woven fabrics increased from 2.1 million dozen in
1960 to 12 million dozen in 1970 and were 6.4 million dozen in
January-June 1971 (table 15). Imports of men's and boys' dress
shirts increased from 475,000 dozen in 1960 to 6.4 million dozen in
1970 and were 3.9 million dozen in the first half of 1971. Imports
of men's and boys' sport shirts increased from 1.6 million dozen in
1960 to 5.5 million dozen in 1970 and were 2.4 million dozen in
January-June 1971. Imports cf work shirts have been small and
amounted to only 169,000 dozen in 1970.
A-15
Imports of men's and boys' dress shirts of woven cotton fabrics
increased from 475,000 dozen in 1960 to 1.3 million dozen in 1965,
then declined to 850,000 dozen in 1970 (table 15). Imports of dress
shirts of manmade fibers, principally polyester and cotton, increased
from 53,000 dozen in 1962 to 5.5 million dozen in 1970. Imports of
men's and boys' sport shirts of cotton woven fabrics were 1.6 million
dozen in 1960, increased to 2.5 million dozen in 1966, and then
declined to 1.9 million dozen in 1970. Imports of sport shirts of
woven fabrics of manmade fibers increased from 59,000 dozen in 1962
to 3.4 million dozen in 1970.
Dress shirts of woven fabrics have been imported mainly from
Hong Kong, the Republic of Korea, Japan, and Taiwan. Imports of
men's and boys' dress shirts from Hong Kong and the Republic of Korea
accounted for 70 percent of the total quantity of imports in 1970,
with the rise in imports from the Republic of Korea having been sharp
since 1967. Average unit values on an f.o.b. basis indicate dress
shirts from the Republic of Korea and Taiwan are lower-priced than
those from Hong Kong and Japan (table 16).
Imports of men's and boys' sport shirts, not knit, have been
mainly from Hong Kong, Japan, Taiwan, and the Republic of Korea.
Based on average unit values on an f.o.b. basis, such imports from
Taiwan are the lowest priced, Hong'Kong next, and Japan, the highest
priced, except in 1970, when those from the Republic of Korea were
slightly higher in price than those from Japan.

A-16
Knit.--Imports of knit shirts increased from 1.2 million dozen
in 1962 to 3 million dozen in 1969, then declined to 2.7 million
dozen in 1970; they were 1.8 million dozen in the first half of 1971
(table 18). Imports of knit shirts of cotton during each year 1963-
70 did not exceed the 1962 volume, but imports of knit shirts of
manmade fibers increased from 2,000 dozen in 1962 to 1.9 million
dozen in 1969, declined to 1.7 million dozen in 1970, and were 1.3
million dozen in January-June 1971. It is believed that most of the
types imported in recent years were sport shirts.
U.S. Exports
Woven fabrics of manmade fibers
In 1961-70, U.S. exports of broadwcven fabrics Df manmade
fibers (except glass) ranged between 137 million square yards, valued
at $72 million, in 1961 and 181 million square :rards, valued at $101
million, in 1964 (table 7). They declined from the 1964 high to l47
million square yards, valued at $95 million, in 1968, then increased
to 174 million square yards, valued at $108 million, in 1970. The
largest exports have been polyester fabrics, especially dyed and
finished filament goods; rayon and/or acetate filament yarn fabrics,
particularly dyed and finished goods; and rayon and/or acetate spun
yarn fabrics, mostly mixed and blended printed goods.
Exports of the polyester and cotton fabric types woven by
Birmingham and of all polyester and cotton blends are not separately
A-17
reported in official statistics. Data on exports of broadwoven poly-
ester fabrics wholly or chiefly by weight of noncontinuous fibers,
however, are available. Such exports are reported according to
whether the fabrics are unbleached (grey) or bleached, dyed, or
colored (finished). The exports of the finished goods, which would
include the Birmingham types woven after August 1970, increased from
5.8 million square yards, valued at $3.9 million,in 1965 to 23.6 mil-
lion square yards, valued at $14.3 million, in 1970 (table 19).
Woven fabrics of cotton
Exports of certain woven cotton fabrics (Nos. 30s to 40s), which
would include types similar to fabrics made at Birmingham, declined
from 17.4 million square yards in 196 14 to 12.1 million square yards
in 1970 (table 8).
Men's and boys' shirts
Exports of men's and boys' shirts, both not knit and knit, have
been very small compared to domestic production.
A-18
Avondale Mills
Avondale Mills was incorporated March 24, 1897, in Alabama. It
is engaged in spinning and weaving cotton and manmade-fiber yarns and
fabrics, and in producing double knits, in 13 plants (11 in Alabama,
1 in Georgia, and 1 in North Carolina). Its products include tick-
ings; denims; chambrays; seersuckers; corduroys; dress plaids; work-
clothing fabrics; sportswear and children's wear fabrics; sateens,
drills, twills and drapery and furniture fabrics; and carded and
combed yarns for knitting, weaving,insulating, carpet, chenille, and
webbing trades.
According to Moody's Industrial Manual, the net profit of Avondale
Mills for the fiscal year ending August 31, 1969, was $4,058,099 and
for the fiscal year ending August 31, 1970, was $4,834,330.
A-19
The Birmingham Plant
The Birmingham Plant, the original plant of Avondale Mills, was
in continuous operation from 1897 until it closed on October 2 1 ,
1971. It was the only plant in the company that produced polyester
and cotton fine yarn-dyed fabrics, and such fabrics represented 100
percent of its output. Prior to September 1970, the plant's produc-
tion consisted of two main types, chambrays and ginghams; beginning
in September 1970, another type, sport denim, was added. The cham-
brays and ginghams were usually shipped directly to the cutting-up
trade, but the denims were transferred to another Avondale plant for
further processing.
Company statement
Donald Comer, Jr., President of Avondale Mills, made a statement
on August 10, 1971, concerning the closing of the Birmingham Plant.
The statement is reproduced as appendix B to this report.


APPENDIX A
Statistical Tables


A-21
Table .--Woven fabrics of manmade fibers covered by TSUS item 338.30: Changes in U.S. rates of duty, and U.S. dutiable imports for consumption, 1935-70 and January-June 1971
: Ad valorem equiv-: Dutiable imports alent of rates :
: of duty, bated on • : Quantity Value
:
1935 : 45¢ lb. + 60% o: 70% ad val. 1/ : 2/ 80.4 : 1936- 1937 : val . . 45¢ lb. + 45% ad val
: . - 60.4 :
1938 : 1939 :
1940 : 1941 : 1942 : 1943 :
1944 :
1945 : 1946 : 1947 : . 1948 1949 : 27.5 lb. + 45% or 22.5% ad val.:
: V 38.4 :
1950 : 1951 : 25O lb. + 22.5% ad val. 31.1 : 1952 : 1953 : 1954 :
1955 1956 : 1957 : 1958 : : 1959 : - .
1960 : : 1961 : : 1962 : : 1963 : 1964 :
1965 : 1966 : 1967 : : 1968 : 22.5O lb. + 22.5% ad val. 30.2 : 1969 : 20O lb. + 22.5% ad val. 29.4 :'
. 1970 : 170 lb. + 22.5% ad val. 28.3 : 1971 (Jan.-June)--: 150 lb. + 22.5%•ad val.
.
27.6 :3/ .
1/ The 1930 rate. 2/ Estimated. 3/ Includes small amount of nondutiable imports.
Source: Compiled from official statistics of the U.S. Department of Commerce.
Period Change in rates of duty
imports in 1970 . . : 1 000 : 1 000
Percent : pounds : dollars
467 V44 : 604
1,041 : 993
1512 50 : 671 470
256 : 273 116 112 :
45 : 60
66 : 131
41 : 168
299 : 1,285
597 : .2,730 :
416 : 1,137 204 1,183
156 : 397
237 : 57.5
212 : 802
394 : 1,160
1,235 : 2,298
1,111 : 2,336
1,576 : 2,900
2,700 : 4,897
3,170 : 5,332
4,782 : 5,795
10,873 : 10,471
10,097 : 12,182
7,575 : 12,832
10,062 : 18,247
10,682 : 19,071
11,910 : 25,408
20,876 : 41,286
36,204 : 58,285
25,596 : 51,832
28,629 : 66,467
32,975 : 80,641 .
.39,042 : 113,974 23,477 :/ 65,976
.
rn .40 rn H
H
•-I
O
Os
H N
H
0 4,
0 In
.-4
O
•
.0 HI 0
0
0 CO
4) O
Os H
0
01
8.
0
Tab
le
2.-
-Se
lecte
d c
otto
n fa
A-22
CJ y O
Iro. " lit E 0 1,0. -44- Ivo y lt4 -0
0 __4- 0 0 t- if', al ? 1 ---.. r-I '0 N >, ---.,
C- u-s C- 0 M ., --... Os 0.)
• i • to- • NI ...1. 0 0 ,0
• 0 • NI 0 A N
kt, • 0 .0 1• Os
,- • 0 • H • CI • • --I OD
+ 0 t. H OD 0 •
H t
0 4) .4 ./1\ 1)0.+ gi A.'
11'. -4. 0 0)
Ill I 0 4) -* • N-- is- \ et
t- 1-, 1 NH ‘01"At".• 1.1 43,11 o .•) r- I. pi 0, cc:. o 0 • o o o 0 ...1.• 0 Os 0 0 • ON
• 04 0 CV • • 04 0 • • 44 0 LIN VD H t-- ON •- r-1 ,-0 c0
4) 10
▪
.
4)
0 rn
• - •4:1 4)
O
4) H .0
8.4 0
4-4
•cl
0
1-4
c.
4) C)
0
ra
co
4)
IC H .0
9 1.• 0
0 0
H Iro.
)0It •41. H k tok.cn VA 14 VC C UN CV ai H 0 CO
ON NO • }.• '...... CO H 01 >I "-N. 0, VA- CV Y., `..., • Rd • Cl • CV I • --1' CV{ • -1.
0 .0 -.1. -.1- 0 .0 ..0 • 0 .0 CO
0 • ,-I • C.I • ,--I 0? + 0 • 41
0 1. I I 1t -0 !E0 4) Irct -0-
0 4) 0 .0 IR. ,0 -1 4 %,.. , co 0, 0'1 I-4 El
4,1 4.r■ (41 ,o c0 H -1 P. y
01 1.1 0 N- '.0 -7 07 cm• -4 LI-N 0 0 • .--.7 • 0 • el
• 04 q• • 44 0 ..7• 0 4-1 0 1/40 ■0 H '.0 CO H t-- H H cc)
O 0 104.0{. 1R. VA $4 110. '0- CV
CJ -0-
CJ 01 01 Os in cv al ON In CV?•8 ---.. W -0- CV 7., "••• t- ON • ".... 1"..
co • CV 1 • H • 0.1 I • c0 0 NI • o
.O I/4 ON 0 .0 t-- • A Ch
u • 4-I • (3 • H CO 4. C3 • H ON + 0 34 vt . t- + 0 t4 I I 0 1. I I
-0
4) 4) I 4) 0 10). '4+ IA. 0) 4) ase. It .0 CO -..110, 41 o‘in 0'. 4:, as in NOl F. II in G
NU F. pri LIN o. o■ 1.. tal toch
0 0 • t-- ON 0 P • r- • 0 0 • I-- •
w0 rn • • 44 0 u-s • 0 4-4 0 C-
u) H CO CO H t- H H 00
O 0 1)4. 0 -0
M1.4. I. Irk 104. 81 V( -0- In P. ye in 0 '0 In o in trs 0) 0 Ws 01
N S., ----, '-0 -0 N )••• --.... '.0 N • 0,---., ■.0 el • NI •
In • N1 • tn 0 0.11 • •
0 .0 \O Cn 0 .0 CO • .0 0 0
0 • H •
4) -0 V W
u • H 0 \ + 0 • al H + 0 1.-, 1 0? + a) 1. I I 0 1.-• itjt 4.
4) 4) let. I) I. 1st 4) Net ,.0 a") -»). IA ,0 in In ir \ .0 u-\ In tr \ 5., CV ..4. In )... pi en t- -a 8. El. in C- H 0 • .--1 --i• 0 P • H • 0
H
P • H • 44 0 -.7 • • 44 0 VD • H 4-1 C CO
t- H t-- 0 \ H cC, H 0 \
se VI. 4rN
I•44 O Et 0
• • 0
UN el 9 Il IIN >,, IA Cs) CV >. VA. 0 4, 0) In -0 • • 0 P. 0 b•
• .0 • UN 0 .0 la. "0 o .0 • -4+ 8. 0 O C) • I- 1.-- CI • 0 0 0 • CV H 14 H
0 k H • + 0 $4 CV H+ 0 14 CV H 8) 0 qt1
4) 41 vit CO V 0 i I 4) 4; t I p, tn P g +
.0 I Irk .0 lOt -0 Vet „c 11),I. -0 0 \ tett. 7.1 el 0 43. 0 )14 u-, tr■ 0
• 1,4 CO H 0 In 0 p • 1" • o p • t.-. • 0 p • C.- +) P.
0 in • 0 44 0 r- • CV 4. 0 CT, • 0 0) C-- H t- H H 00 H H Os a) ,0 0
0 +) +.s
0 ..., V O 0 0 c- 0 p
lark Isk 1. in 41
•--• •c1 0 •
Ill }, ....... ice N H, in -0. In
Y litt .,' li ,. 6
oi >. -...., %Q. in f -1 •• •ti • ,-.4, 0
• 4 . in N .0 . 43. o .0 • 43. N 1 L' 0 0 • t.- r-- • 0 • 0 0 0 . 0, H H H .0 y..
i
0 14 r-1 • 0 0 1,-. N 4-1 + al 14. Cu H 0 00 + 0 0
.0 a ap. +
4) .1) I I 0/ 4) I 4.. > 0 •,. Ittt -0. Irk .0 let .0 .0 14 It /4 04.
v:
o p 0 -4., s.. 0 . n lere. 0 0
In in 0 t., g •
In IA •0 • t- 4) 0 7... 9 V‘ • o f..) 0 t•-• • N 4. 0 ON • +, F. rl O.
N- H t•-- •-•1 - H CO H H ON oi 0 4, 0) . .. .. •• *a .. .• •• .. •• ..•• •• a.. •• .. .• •• •• •• .• •• •• •• •• •• •• .. •• • 4' 0
• in bp ty 73 +4 W
g01 0 Mt
.14, 0 UN 104. I.
ex • tr4 0 43s
0 ■••I PA > rl
0 III
O I•4 CO ItIt 0 H 11.4. Y. 0 in
M in .1:3 ja
14 .I., Its • I LIN • r-1 • 0 r-1 0 0 0 0
cn,c) ...1- -0- el .0 t- I 0 .0 4-1 4) • U • 01 In • o • N -04- 0 • 0. 4. U) 0 00 F.
4) 41 1-1 I tr \ + et 1. el IIN 0 44 4,
• 0 W let t- 0 4) + ,0 0 0 + ,0 b.
N +4 0 O0 0 • Itst. .0 F. A
0
tee. 0 0 In. H 8.• .0)
k 0 p UN H 8- 0 t ,
• H • 0 In In 03 .p El
• H al 0 0 44 0 4-1 0 0 01 4. 0 cn VD 14 0 N.13 04 k 0 4-1 OI H N
VD p. H 0
V Y
0 , i
I
O H 0 0 4,4 0 ...I 0
O
1 I I I I 1' - 0 V.
4., 41 Z 0 O 0
0 r
1
'V 4, Z
b.0 M
1 c'- )1 0
41 b O. .t.-'A S
O 4:4 I
0) I I O I I W III cd
.--... 1„., p,
4-) • • 0
•
/ 0 •0
44 a It'
0 0 14.4 5.4 0
+, P. V. ' 0
•P
0 1 k FA
0 ••1 14 14,3 a
0 0 $.• 1.1 44 a) .-) 0
tl. 4, i P. 'A r, 03 4-1 0
0
44 b• ›. •• gg01 +4 . >. 11 •• V 0 m., 0 0.1•CI 0/
• • 4) 0 el 4) a 0)' in >, 0 u.:1 8.00 8.4, 8..o'0 14 0 0 k 40 &I 14 0 0 44 4, 8-1 0 ). oi 0 .4 H.0 4.) o -4 F. o 0
I 0 4) 0 -1. k 0 0 O 0-71.000 1:100 ,... 0 0 F. 44 I 0 VII 0 •• 04 44 IV ,--1 CD 0
0 0 0 0 P, CI 0"Cl 0 0 Pt 0 0 O. 0.1 1 V H V P
0 P, 0 CI Ct 1-1 0 a.) o 0 ..-1 0
)
4
0 H 0 I ).9 CI 0
a) -1 4-, •I g '13 °
H 0 C3 g H H F. .d o
g I-4 H
00 CI 0
4, CO 4) fa 01 4) 0 0 •0
O 0 4) c4 H SO g 0
0 4 0 0 HI -F, Z
0 I-I III oi
/4 0 Z
0
HI 9 -c-‘11;11 a ru. P.
• • • • • • •. . • • • • • • • • • -• •• • • • • • • • • • • • • • • • • • • • • • • • • • • • • • • ••
A-23
Table 3.—U.S. rates of duty applicable to men's and boys' shirts, not knit, of the types provided for in specified TSUS items, 1930 and GATT concessions to Jan. 1, 1972
TSUS item No.
Abbreviated descriltion GATT concession
1930 rate Rate : Effective date
380.00 1/: Men's and boys' lace or net, : 90% ad val. : 6o% ad val. : Jan. 1, 1948 and/or ornamented shirts, : : 45% ad val. : June 6, 1951 of cotton. : 42.5% ad val. : June 30, 1958
: 41% ad val. : Jan. 1, 1968 : 39% ad val. : Jan. 1, 1969 : 38% ad val. : Jan. 1, 1970 : 36% ad val. : Jan. 1, 1971 : 35% ad val. : Jan. 1, 1972
382.00 /: Infants' / lace or net, : and/or ornamented shirts, : of cotton.
: 90% ad val. : Same as for item 380.00.
380.04 1/: Men's and boys' lace )r net, : 90% ad val. : 60% ad val. : Jan. 1, 1948 : and/or ornamented shirts, : : 45% ad val. : June 6, 1951
of manmade fibers. •
: 42.5% ad val. : June 30, •
1958
382.04 2/: Infants' 3/ lace or net, : and/or ornamented shirts,
: 90% ad val. : Same as for item 380.04. :
of manmade fibers. 380.27 : Men's and boys' shirts, not : 45% ad val. : 25% ad val. : Jan. 1, 1948
: ornamented, of cotton. : 24% ad val. : Jan. 1, 1968 : 23% ad val. : Jan. 1, 1969 : 22.5% ad val : Jan. 1, 1970 : 21.5% ad val : Jan. 1, 1971 21% ad val. : Jan. 1, 1972
380.84 : Men's and boys' shirts, not : ornamented, of manmade
: 450 per lb. + : 27.50 per lb. : Jan. 1, : 65% ad val. : + 35% ad val. :
1948
fibers. : 250 per lb. + : June 6, : 32.5% ad val. :
1951
: 250 per lb. + : June 30, : 27.5% ad val. :
1958
• 382.81 : Infants' 3/ shirts, not : 450 per lb. + : Same as for item 380.84.
: ornamented, of manmade : 65% ad val. : fibers.
382.33 : Infants' 3/ shirts, not : 37.5% ad val. : 20% ad val. : Jan. 1, 1948 : ornamented, of cotton. 19% ad. val. : Jan. 1, 1968
: 18.5% ad val. : Jan. 1, 1969 : 17.5% ad val. : Jan. 1, 1970 : 17% ad val. : Jan. 1, 1971 : 16.5% ad val. : Jan. 1, 1972
1/ Prior to Jan. 1, 19 8, this item was part of item 380.03. 2/ Prior to Jan. 1, 1968, this item was part of item 382.03. 3/ Infants are defined in the TSUSA as children, regardless of their sex, up to and
including 6 years of age.
Note.--Items of cotton are exempt from the 10-percent surcharge effective Aug. 16, 1971, but items of manmade fibers are not exempt.

Percent : ad valorem :
1 000 dozen
1,000 dozen
1 ,000 :
dozen : dozen
A-24
Table 4.--Men's and boys' shirts, 1/ not ornamented, not knit, of cotton.: Pates of. duty and U.S. imports for consumption, 1930, 1947-70, janliary-JUne 1970, and Jan-uary-June 1971
Year Rate of duty 1/
Imports
Dress shirts : Sport shirts Work shirts Total
•
1930 45 2/ 2/ at 3/ 1 1947 45 2/ 2/ 2/ 1 1948 25 2/ 2/ at 1 1949- 25 T/ 2/ 2/ 1 1950 25 2/ 2/ 2/ . . 3/ 1 1951 25 2/ 2/ 2/ • . 2 1952 25 2/ 2/ 2/ 1 1953 25 2/ 2/ 2/ 11 1954 25 2/ 2/ 2/ 211 1955 25 2/ 2/ at : 552 1956 25 2/ 2/ 2/ • 1;1;7'5 1957 25. 2/ 2/ . ' 1,390
25 2/ 2/ 2/ : 1,500 25 2/ 2/ 2/ : :--',2.1.5 1959
1960 25 174 1,560 : 34 : P.,068 1961 25 565 1,374 : 9 : a ,94121 1962 25 854 1,871 : 43 : 2,768 1963--------- 25 901
2, 1964------- 1965- -
25 25
1.,261 1,314
39 2- :1n 2 ,184
: '3 T9 33 610 : .:: 8:97 5497 258 333 .,,
1966 25 1,274 1967 25 799 2,194 : 65 : 3,058 1968 -- 24 1 ,o66 2,141 62 : 3,269 1969 - 23 1,237 - 2,166 104 : 3,307 1970 22.5 841 1,893 : 153 : 2,887 Jan.-June--
1970- 22.5 : 42a 831 72 1,331 1971 21.5 : 464 621 69 : 1,154
if Includes small amounts- of` infants' Shirts- Infants are defined in the TSUSA as children, regardless of their sex, up to and including - 6 years of age. The rates of duty for these shirts were 37.5 percent. ad valorem for 1930-47, 20: percent for 1948-67, 19 percent fOr 1968,. 18.5 percent. for 1969, 17.5 percent for 1970, and 17 percent for 1971.
2/ Not available. 3/ Estimated-
Source: Compiled from official statistics of the U.S. Department of Commerce.

A-25
T‘tble 5.--Men's and boys' shirts, 1/ not ornamented, not knit, of man-n-Ado fibers: Ad valorem equivalents of rates of duty and U.S. im-porLs for consumption, 1930, 1947-70, January-June 1970, and January-June 1971
Year : Ad valorem : : equivalent : Imports
: of rate of : Dress : Sport : Work : duty 2/ : shirts : shirts : shirts : Total
1 ,000 : 1,000 : 1 000 : 1 000 Percent : dozen : dozen : dozen : dozen
1930 : 80.6 : 3/ : 3/ : 3/ : 3/ 1947 : 80.6 : 3/ : 3/ : 3/ : 37 1948 : 44.5 : 3/ : 3/ : 3/ : 3/ 1949 : 44.5 : 3/ : 3/ : 3/ : 3/ 1950 : 44 .5 : 3/ : 3/ : 3/ : 3/ 1951 : 41.1 : 3/ : 3/ : 3/ - : 3/ 1952 : 41.1 : 3/ : 3/ : 3/ : 3/ 1953 : 41.1 : 3/ : 3/ : 3/ : 3/ 195. : 41.1 : 3/ : 3/ : 3/ : 3/ 1955 : 41.1 : 3/ : 3/ : 3/ : 3/ 1956 : 39.1 : 3/ : 3/ : 3/ : 3/ 1957 . 37.6 : 3/ : 3/ 3/ : 3/ 1958 : 36.1 : 3/ : 3/ : 3/ .: 3/ 1959 : 36.1 : 3/ : 3/ : 3/ : 3 / 1960 : 36.1 : 3/ : 3/ : 3/ : 3/ 1961 : 36.1 : 3/ : 3/ : 3/ : 3/ 1962 : 36.1 : 51 : 34 ; - : 85 1963 : 36.1 : 48 : 30 : - : 78 1964 : 36.1 : 117 : ft : - : 178 1965 : 36.1 : 279 : 73 : - : 352 1966 : 36.1 : 972 : 459 : 2 : 1,433 1967 : 36.1 : 2,259 : 1,208 : 4 : 3,471 1968 : 36.1 : 2,500 : 1,995 : 8 : 14,503 1969 : 36.1 : 4,104 : 2,664 : 5 : 6,773 1970 : 36.1 • 5,465 : 3,358 : 14 : 8,837 Jan.-June-- . . . .
1970 36.1 : 2,726 : 1,831 : 11 : 4,568 1971 : 36.1 : 3,420 : 1,834 : 19 : 5,273
: . . . . 1/ Includes small quantities of infants' shirts. Infants are defined
in the TSUSA as children, regardless of their sex, up to and including 6 years of age.
2/ Based on imports in 1970. 3/ Not available.
Source: Compiled from official statistics of the U.S. Department of Commerce.
•• •• •• •• •• •• • • •• •• •• •• •• •• ••
rid a3
cd Pi 't.tas •t.sas LIN Lc\ u-\ ‘.0
•• • • •• • • •• •• •• • • ••
90%
ad v
al.
9 0%
ad v
al.
•• •• •• •• •• •• •• • • •• •• •• ••
Abbr
eviated de
scrip
tion
•• •• • • •• •• • • .. •• •• •0 •• •• •• •• •• •• •• •• .•
i o
a) o rd 4) I
g
+3 0 0 g
it! g cH 4-I -..... o o rd ci-i g o a
rc rd • 4) a) in
e, rd -4-3 .4-' $•1
N4..) 0 o a) +) -1-) a) a) do 0 •
V 0) 01 g $-1 0 0
O a) ;-1 $-1 a) 0 .0 o o rd
0 0 4-I +3 05
-P gi 03 0 0
14
•• •• • • •• •• • • •• •• • • •• •• •• •• •• *. •• •• •• •• •• •• •• •• •• • so •• •• ••
H
\JD co
00 CO CO Or)
T211
0 0
0 co 01
A-26
a CO H CO CO O\ 0 H C\) CO H co co ir\ c0 O\ 0 H N CO H --1- tr., Lf \ k. 0 ',SD N- N- I-- --7-1 - U-N lf \ --i" IC\ V) \O t-- t-- t-- --1 - U∎ O\ ON 01 O\ ON O\ ON ON O\ O\ 0\ ON ON O\ O\ O\ O\ O\ O\ O\ H H H H H H H i-i H H H H H r--I H H r-I H H H
a a a ..... a a el 41 a
H 0' 0 H H H H H r-I VD 0 H 0 H 1-1 H H r-I H \ D
01 Cn H
• 0 (1) • • • • • • (1) (I) • a)
g9Ogggegg gqg gafilgggg g b b b b b b .--, b b b b b ca b b b F-D b 9
• • •• •• •• •• •• •• •• • • •• •• • • •• •• •• •.■ •• •• •• •• •• •• •• ••
• •
. • • • H + H H H .0 03 cd • • 03 • • • • • • • 03 • • • • 1 'A H •
H H H H H H H .0
a3 a3 03 03 03 03 03 r-ict Hai 1> rj Tie 1 7131 7.13. $-, rd H rd rd rd cri rri a) al a3 ca a3 al a3 Pi
rd rd rd rd I'd rd rid rd rd rid rd '00 rid 'CI 13k a) bb^
a3 al b4-:L a3 a3 od al a3 ce cd't-tz. a3 al au a3 Vt
in Mu_N a3 - "Su.N cow\ Pi LIN.
C\ LC\
vit. t,s..... • .6..c. is.sk t...4.., %.<4... t-1.5,..: ., t.s.,.., tka. • .t.4., .t.k. %...Q. t...t..z • • .t..t„ • -0- N
O u-N.N H mcok.0 L.C\ 0 u-s.cv LIN I.C\ ..../' 0") CNI H H C-- + LIN (11
N.0...-' .-7); --1' Cf) (Y) C) (Y) \O .....1- ....1- oiNNNC\ICVN CV N
a \
MI°
a)
4-) C.)
cH
a)
• a3 Cr) •0 0 c.)
O co w
4-) Ei a) a) -P 0
0
-P r-i ;-[ ad a) Pi
-P Ea P4
El 1=1 c) s-1
c4-1 a) a)
fai 0
(1)
4-) cd a)
00 a3 • 4)
0\ 0 •P 0 •1--1
4-,
0 a) 0 rd
40 -4
CO O
4-1 -P
5-1 1 rn I gl
44 a) +)
M +3
rfl 0
PI
-P L— ON
co-4 0 •
0
Er,
ta 4-) 0
s-1 -H •ri U)
r.)) 4)
rn C.•
0
N
7:1
a) 0 E
ON 0 r-4
-P
.0 0.)
0 •1-i
04 CO 03 PH
j-)
•H r7.,' CH
'4-1 C.) 0 .1)
ral rt), UL
S-1 • 0
CO 4-4 •
rt CJ rd
• •1-1 ,1> 0 ;•4
CC?
GATT
conc
essi
on
Effe
ctive date
a) -P
CO
•• ••
-P c3
0 0,1
A-27
Table 7.--Woven fabrics of manmade fibers (except glass) : U.S. pro-duction, importE for consumption, exports of domestic merchandise, and apparent consumption, 191-70
(Quantity in thousands -.)f square yards; value in thousands of dollars) : Ratio
Produc- : . Apparent :(percent) of Year Imports : Exports . consump- : tion 1/ : : imports to tion : consumption
Quantity
•
40,177 : 136,851 : 2,910,128 : 1.4
64,00 : 137,468 : 3,350,131 : 1.9
75,909 : 153,205 : 3,809,160 : 4
2.0
87,261 : 181,454 : 4,280,930 : 2.0
161,069 : 145,514 : 4,907,664 : 3.3 • .
255,279 : 150,277 : 5,197,947 : 4.9
177,724 : 152,771 : 5,441,610 : 3.3 195,935 : 146,618 : 6,974,493 : 2.8 218,702 : 163,299 : 7,082,398 : 3.1
±, 38 : 12_._ 16,16/iL35L3.6
Value
: 861,200 : 12,832 : 71,951 : 802,081 :) : 1,028,747 : 19,443 : 74,057 : 974,133 :) : 1,203,653 : 25,507 : 84,369 : 1,144,791 -: 1,125,374 : 31,619 : 100,971 : 1,056,022 :) -: 1,302,054 : 48,966 : 97,075 : 1,253,945 :)
: 1,299,813 : 66,241 : 100,859 : 1,265,195 :) : 1,225,213 : 59,038 : 101,342 : 1,182,909 :) : 1,869,121 : 75,889 : 95,030 : 1,849,980 :) : 1,774,138 : 95,426 : 104,281 : 1,765,283 :) : 1,581,1111 : 129,016 : 108,062 : 1,602,095 :)
• • 1/ Square yards estimated from official statistics reported in
linear yards by use of conversion factors shown by the U.S. Bureau of the Census in Current Industrial Reports, series MQ-22T.2 Supplement dated Dec. 5, 1968; value partially estimated from manmade fiber grey goods prices listed in Daily News Record, a Fairchild publication, and official statistics of the U.S. Department of Commerce. 2/ Ratio of value of imports to value of consumption is not relevant
because value of imports excludes duty, transportation, and insurance costs, and importer's markup which are a part of wholesale value of imports.
Source: Compiled from official statistics of the U.S. Department of Commerce, unless otherwioe noted.
1961 : 3,006,8 02 : 1962 : 3,423,550 : 1963 : 3,886,456 : 1964 ,375,123. 1965 : 4,892,109 :
. 1966 : 5,092,943 : 1967 : 5,416,657 : 1968 : 6,925,176 : 1969 : 7,026,995 : 1970 :At:L06 2 73 : 231L
1961 1962 1963 1964 1965
1966 1967 1968 1969 1970

• Apparent ' Ratio of
: tion 1/ : ports 2/: ports 2, consume- imports to : Produc- : im- : Ex- : :
. tion : consumption Year
A-28
Table 8.--Certain woven cotton fabrics of intermediate yarn numbers (approximately 30s to 40s): U,S. production, imports for consump-tion, exports of domestic merchandise, and apparent consumption, 1964-70
•
: :
1,000 : 1,000 : 12229 : 1,000 : : Percent sq. yds.: sa.....21s.: sq. yds.: sq. yds.
1964 : 858,942 : 150,035. 17,358 : 991,619 : 15.1 1965 : 845,326 : 206,725 : 16,109 : 1,035,942 : 20.0 1966 : 556,824 : 226,862 : 14,952 : 768,734 : 29.5 1967 : 356,532 : 153,541 : 14,217 : 495,856 : 31.0 1968 : 226,447 : 191,503 : 14,749 : 403,201 : 47.5 1969 : 139,597 : 209,228 : 11,876 : 336,949 : 62.1 1970 : 94,886 : 170,157 : 12,126 : 252,917 : 67.3
1/ Square yards estimated from official statistics reported in linear yards by use of conversion factors shown by the U.S. Bureau of the Census in Current Industrial Reports, series MQ-22T.2 Supplement, dated Dec. 5, 1968.
2/ Includes carded fabrics.
Source: Compiled from official statistics of the U.S. Department of Commerce.

A-29
Table 9.--Men's and boys' shirts, 1/ not knit: U.S. production, im-ports for consumption, exports of domestic merchandise, and apparent consumption, 1960-70, January-June 1970, and January-June 1971
(Quantity in thousands of dozens; value in millions of dollars)
Year
. :
. . Produc- . tion 2/ :
. : Im- . Ex- ,
: :
ports 3/ : ports 4/
Apparent consump- tion
•
: .
:
, Ratio (percent) of imports to consumption
Quantity
1960 : 34,641 : 2,085 : 225 : 36,501 : 6 1961 : 33,544 : 5/ 1,961 : 236 : 35,269 : 6 1962 : 37,126 : 2,936 : 218 : 39,844 : 7 1963 : 37,014 : 3,198 : 213 : 39,999 : 8 1964 : 38,935 : • 3,796 : 216 : 42,515 : 9 1965 : 39,592 : 4,132 : 486 : 43,237 : 10 1966 : 38,420 : 5,521 : 501 : 43,440 : 13 1967 : 35,632 : 6,764 : 511: 41,885 : 16 1968 : 33,209 : 8,099 : 429 : 40,879 : 20 1969 : 31,630 : 10,337 : 380 : 41,587 : 25 1970--- : 31,924 : 12,005 : 305 : 43,624 : 28 Jan.-June, : . . . .
1970 : 15,320 : 5,838 : 161 : 20,997 : 28 1971 : 14,480 : 6,393 : 159 : 20,714 : 31
Value
1960 781 : 4 6 789 :) 1961 753 : 5/ 14 : 6 : 761 :) 1962 851 : 22 : 5 : 868 :) 1963 861 : 25 : 6 : 880 :) 1964 924 : 33 : 5 • 952 :) 1965 962 : 37 • 9 • 990 :) 1966 1967
-: :
985 :
1,008 : 52 : 61 :
10 : 10 :
1,027 1,059
:) :) 6/
1968 : 1,000 : 77 • 8 : 1,069 :) 1969 : 1,022 : 103 : 8 : 1,117 :) 1970 : 7/ : 129 : 8 : 7/ :) Jan.-June :
1970 7/ : 6o : 4 : 7/ :) 1971 7/ 7o : 4 : 7/ :)
. : if Includes dress, sport, work and uniform shirts. 2/ Q
•
uantity data from National Cotton Council and U.S. Department of Commerce.
3/ Excludes shirts of vegetable fibers except cotton and of silk. 4/ I
•
ncludes cotton shirts only in 1960-64, estimated in 1960-61. 5/ I
•
ncludes cotton shirts only, which probably accounted for 90 per- cent or more of total imports.
6/ Ratio of value of imports to value of consumption is not relevant because value of imports excludes duty, transportation, and insurance costs, and importer's markup which are a part of wholesale value of imports.
7/ Not available.
Source: Compiled from official statistics of the U.S. Department of Commerce, except as noted.

A-30
Table 10.--Men's and boys' shirts, not knit: U.S. production, imports for con-sumption, exports of domestic merchandise, and apparent consumption, total and by shirt type, 1965-70, January-June 1970, and January-June 1971
• Type and year : Production : Imports 1/
• : : Exports :
Apparent consumption
Ratio of im- : ports to : consumption
1,000 - 1,000 _ : 1,000 : 1,000 dozen dozen : dozen : dozen Percent
All shirts: 2/ : • . • . • •• 1965 : 39,592 : 4,132 : 487 : 43,237 : 10 1966 : 38,420 : 5,521 : 501 : 43,440 : 13 1967 : 35,632 : 6,764 : 511 : 41,885 : 16 1968 : 33,209 : 8,099 : 429 : 40,879 : 20 1969 : 31,630 : 10,337 : 380 : 41,587 : 25 1970 : 3/ 31,924 : 12,005 : 305 : 43,624 : 28 Jan.-June . . . . .
1970 : 3/ 15,320 : 5,838 : 161 : 20,997 : 28 1971 : 3/ 14,480 : 6,393 : 159 : 20,714 : • 31
. . . Dress shirts: - . • . •
1965 : 11,178 : 1,610 : 199 : 12,589 : 13 1966 : 11,097 : 2,276 : 214 : 13,159 : 17 1967 : 11,316 : 3,083 : 199 : 14,200 : 22 1968 : 11,597 : 3,524 : 156 : 14,965 : 24 1969 : 12,125 : 5,164 : 175 : 17,114 : 30 1970-•----• ---: 3/ 13,409 : 6,355 : 118 : 19,646 : 32 Jan.-June . . . 1970-•: 3/ 6,130 : 3,141 : 70 : 9,201 : 34 • 1971 : 3/ 6,000 : 3,893 : 63 : 9,830 : 40
Sport shirts: • . • . • 1965 : 23,446 : 2,492 : 208 : 25,730 : 10 1966 : 21,987 : 3.206 : 253 : 24,940 : 13 1967 : 15,813 : 3,610 : 274 : 22,149 : 16 1968----------: 16,128 : 4,445 : 248 : 20,325 : 22 1969 : 14,191 : 5,059 : 182 : 19,068 : 27
1970- • : 3/ 13,563 : 5,481 : 175 t 18,874 : 29 Jan.-June . . • .
1970. : 3/ 6,851 : 2.613 : 85 : 9,379 : 28
1971 : 3/ 6,052 : 2,412 : 90 : 8,374 : 29
Work shirts: • . 1965 : 4,029 : 30 : PO : 3,979 : 1
1966 : 4,1po : 39 : 34 : 4,195 : 1
1967 : 4,161 : 70 : 38 : 4,193 : 2 1968 : 4,568 : 130 : 25 : 4,673 : 3 1969 : -7, olo • 114 : 23 : 4,010 : •:) _1 1970 3/ 4,110 : 169 : 12 : 4,267 : 4
Jazz. -June . . . . 1970. : 3/ 1,941 : 84 : 3/ 6 : 2,019 : 1971 3/ 2,053 : 88 : 3/ 6 : 2,135 :
1/ Excludes shirts of Ir_getable fibers except cotton and of silk, not separately reported.
2/ includes el-ess, s .T;o7t, wx-k, end unifo-71 shirts. 3/ Estimated.
Source: Co,7tied from official statistics of the U.S. Department of Commerce and from str.tie..ics of tIlc National Cott.on Council.

A-31
Table 11.--Men's and boys' shi=ts, knit: 1/ U.S. production, imports for consumption, exports of domestic merchandise, and apparent consumption, 1965-70
Year . Production
Imports
: . .
•
Exports • . •
Apparent consump- tion
• : : ' :
Ratio of imports to consumption ' Dress
• ' Sport
• ' Total
. •
: 1,000 : 1,000 : 1,000 • 1 , 000 - 1 , 000 • 1 , 000 : : dozen : dozen : dozen : dozen : dozen : dozen : Percent
1965--: 1,083 : 10,522 : 11,605 : 1,755 : 2/ 109 : 13,251 : 13 1966--: 694 : 12,488 : 1,182 : 2,386 : 93 : 13,475 : 15 1967--: 530 : 12,521 : 13,051 : 2,123 : 83 : 15,091 : 14 1968--: 543 : 16,031 : 16,574 : 2,727 : 116 : 19,185 : 14 1969--: 348 : 12,507 : 12,855 : 2,996 : 122 : 15,729 : 19 1970--: 260 : 13,180 : 13,440 : 2,675 : 74 : 16,041 : 17
1/ Includes dress and sport shirts; data are not reported separately on U.S. imports and U.S. exports.
2/ Estimated.
Source: Compiled from official statistics of the U.S. Department of Com-merce and from statistics of the National Cotton Council, except as noted.
A-32
CO
a) rQ
c11
CO
0
0
O
O I
I
H 0 0\ rd
a3
a co
co a) a) U P4
c13 4-1 ro
0 +3 °
0 -4-3
I 0 ;-t N 0
Fi +3 to Pi 0.
0 • P4
0 a) O
03 O
P:1
H
E-I
(In thO
usan
ds of
CO ON CO CO \..0 cr) H O Lnt Li\ 0\ 0\ H Cr) al Cr) N- \-0 0 H N- 0\ 0 N \-0 —1- LIN 0 0
0 a al a a a a
CO Cr) \..0 \-0 01 CP0.0 0 t--- CU ON ON 01 al 0 CO 0 \0 CO M- r i
cr) \0 Ln er) N N cr) c0
CJ
• f. •• -• .• •• •• •• •• •• e• • • . • • • • •
NN I (N.I LIN c0 N C\J 0'1 \ 0 H (Y) ON t— CO N c0
co N Ln CO N ■.0 In 0 ON (Y1 0 \
a a a a a a a is a a (1) ta 0\ H CO r-i ON NO 0 Cf) a)
O N- 0 H H 0 c0 ^1 •H (r) (+7 r-I N H CY) N ■0
(I) ,s3)
•• •• ••• •• •• •• •• •• •• •• • •
co oN (f.) cv ON If\ ap co \-0 0\ \-0 CO rr) cc) CO t-- Lc\ c\J H in.° 0
c0 a is a a is a is a is
\-0 in 0 0 n N- Cr') O\ 0 H ON =I --.1- c0 H CO
(Y-) I-1 N H
•• •• •• •• •• •• •• -•• •• • • •• •• ••
N-
ON
••• •• A• •• •• •• •• •• ••
H cvl Lf1 0 al 1-.-1 LIN N- ON CO CY) (-v-) H r-I C- LIN ■-0
\ .0 a is ON a a a a
N . H fr) CO (Y) NI\S) 0\ (41 \0 0 rl H
N N N
.••• •• •• •• •• •• •• •• •.•
c0 N CV t-- t-- fr) LIN 0 N t--, --1- \SD0
‘..0 N ---... In N.0 0 ‘..0 -----. in -----... ON a (\il a a " in NI . odi H N.0 0 CY\ N r-i ----
1..IN L"-- Cr) 01 ON H H H H
•• • • •• • • •• •• •• •• •• •• •• •• •• ••
H N M ON O\ N.-- (-)1 -0 LIN in
ON --ON CO Cr) M
ON a NI. a a oji NI a
CO NO NO N r-i N N r-1
•• •• •• • ■• ••
of c
onversio
n MQ-22T.2 Su
p—
•• ••
=I CV ON - ON - 0\ VD 0\ -t- in CO LIN N '.0 Cr-) c0
LIN \ 0 a a
H -H t-- 00 NI (Y) -0 ( ON 0 CO N- CD Cr) H CV N - H
• • CO
L(N 0
ON •1-1 -P cA •1-1
ON 0 ■ c0 N a3
a -P
=I CO
• • — • •
re) N
ON H c.)
CO LIN •1-1 C1--1
N 4-1 0 0
cr) ON
• • CO a
O rd a3
ON L'N 0 Pa
(-11 N
NO In a3
N LIN a) H
H
+3
Cr\ CO . ■-•I CO
N 0 0
H rd rd
. a) 0
co H -4-) 1-1 LIN 0
Cr) \0 0 -4-)
a Pa o
H a) (1) -I F-1
the Cens
us
Type
of fabric
CO
ri
to u) rd 0 X to
cl.) 0 H (3: H
4-t o
0 44 U)
••
inclu
ded
with "other poly
ester
—cotto
n b
lends.
"
from
off
icia
l sta
tis
tic
s of the U
.S.
Departmen
t of
Comm
erce.
0 . 0 a3 .a
F-1 a) rd N 0 CH $.1 (1) LI LIN ;5 4-1 N 0 rd -13=1 ■ r4-1
a 0) CO -.1-1 CO 0 -I-) • N.0 u) \0 r-1 a3 cn O\ CO H \.0 E • *-1 cd
-,-I =I -P a c.)

A-33
Table 13.--Men's and boys' shirts, not knit: U.S. production, 1/ specified years, 1958 to 1970
(In thousands of dozens) .
by types and fibers,
Type and fiber : 1958 : 1961 : 1964 : 1967 : 1968 : 1969 : 1970
Dress shirts: Men's : 6,513 : 7,553 : 9,559 : 9,70 : 10 .,004 : 10,834 : 12,054
Cotton . 6,122 : 7,100 : 8,030 : 5,470 : 4,402 : 3,481.: 3,857
Manmade fibers : 391 : 453 : 1,529 : 4,298 : 5,602 7,353 : 8,197 •
Boys' 844 : 1,0_75 : 1,734 • 1,548 : 1 593 : 1,291 : 1,355 Cotton 819 • 1,043 : 1,682 • 929 : 710 • 568 : 596
Manmade fibers 25 : 32 • 52 : 619 • 883 • 723 : 759
Total -( 7 57 : 8,628 : 11,293 : 11 316 11,597 : 12,125 : 13 409.
Cotton : 6,941 : 8,143 : 9,712 • 6,399 • 5,112 ,0 9 : , 53
Manmade fibers 416 : 485 : 1,581 : 4,917 : 6,485 : 8,076: 8,956
Sport shirts: Men's : 14,791 : 14,703 : 16,777 : 12,553 : 11,240 : 9,956 : 9,756
Cotton : 11,981 : 11,909 : 13,589 : 7,030 : 5,0!8 : 3,684`: 3,610 wool 2/ - : 592 : 588 : 671 : 502 :- 450 : 597 : 585
Manmade fibers : 2,218 : 2,206 : 2,517 : 5,021 : 5,732 : 5,675 : 5,561
Boys' : 5,315 : 6,048 : 6260 : 4 ,888 : 4 ,235 •
3,812
Cotton :
5,580 5,874
:
5,5 : 5,315 : 46 5,7 : 3,443 : 2,151 : 1,652 ': 1,487 Wool : 117 : 112 : 120 : 438 : 195. • 296 : 267 Manmade fibers : 177 : 168 : 182 • 2,379 : 2,542 • 2,287 • 2,058
Total : , 20,665 20,298 : 22,825 • 18,813 : 16,128 • 14,191 : 13,568
Cotton .' 17,561 : 17,224 : 19,335 1 10,473 : 7,209 : 5,336 : 5,097
wool : 709 : 700 : 791 : 940 : 645 : 893 : 852
Manmade fibers : 2,395 : 2,374 : 2,699 : 7,400 : 8,274 : 7,962 : 7,619
Work shirts: Cotton : 4,064 : 3,576 • 3,592 • 3,329 : 3,289. 2,547 : 2,548 Manmade fibers : 83 111 : 270 : 832 1,279 : 1,372 : 1,562
Total 4,147 : 3,687 : 3,862 : 4,161 : 4,568. 4,110
1/ Partly estimated. 1 Includes small quantities of fibers other than cotton, wool or manmade fibers.
Source: Compiled from official statistics of the U.S. Department of Commerce and statistics of the National Cotton Council.

A-34
Table 14.--Broadwoven polyester fabrics, wholly of noncontinuous fibers: U.S. imports for consumption, by types, 1964-70 and January-June 1971
: Not bleached : Year and not : Other Total
colored :
Quantity (square yards)
1964 357,339 : 2,409,267 : 2,766,606 1965 : 12,503,019 : 17,401,842 : 29,904,861 1966 : 34,647,156 : 45,477,843 : 80,124,999 1967 : 6,404,719 : 14,651,081 : 21,055,800 1968 3,083,116 : 29,298,890 : 32,382,006 1969 2,187,116 : 17,708,118 : 19,895,234 1970 728,518 : 13,630,016 : 14,358,534 1971 (January-June) 60 951 : 8 661 903 : 8 722 854
Value
1964 $73,730 : $911,008 : $984,748 1965 2,364,947 : 5,086,592 : 7,451,539 1966 6,177,430 : 12,438,775 : 18,616,205 1967 1,549,698 : 4,215,586 : 5,765,284 1968 670,225 : 9,114,197 : 9,784, 422 1969 451,132 : 7,383,489 : 7,834,621 1970- 164,232 : 7,040,233 : 7,204,465 1971 (January-June) 23,250 : 3,768,173 : 3,791,423
Source: Compiled from official statistics of the U.S. Department of Commerce.
• LIN C- C') 0■ ,0 c'n 00 0, 0-;
m N 0.] Lc\ 0 CV
12-1. 01 •0 1.0 OD CO H Cll I 01 1.1-1
.4 ., L--- L--- 0\ C,.! H
C.1 1-.1- CO 03 HI ‘..0 ti
CJ
CO In \
• • • 1 • • • • • •
Cr-) 4-,) 01 O 01 N 1.0 CO HI 1.0 H ON C11 CO ti 0 CO N 104 H
\O M N m C■J
H ■0 co c0 ‘.0 `...0 \ ■LD N t-- 0, H
c\L ON a. I ^ H Lam.
N N
N 0 N CN 0 0 Cc) ri H 01 0\ OD -1- LI \ 01 01 HI \0 •1 0/ H H H
M1 HH N
col
co
CO CON Lr.
CT c0 0 10 C)
\ CO
H H
0 \
CO CO
H N
VD ON 0 D\ CC H 0) L— H 1_1-1 ,CT, C) N- N H H
H N N
CN Cr) CN N 01 N-- N 0/ 0\ U\ CD C) CN 01 ,9 CN
CN 01 H CN
MII N H
H H
rl ‘.0 C)
0, Lc, LIN NI
HI
,00 CO
NI NI H
LI l 1-1, LIN 1C) 1.0 -C- CO 1--- I"- C-- C.- 01 Cci 0--1- ----, 1.0 1.0. ----_-----.
N " "NINI -----. NI. C1I HI HI Hi
H I
ade f
ib
ers
Ld
A•4
O
ca
a) rn
a)
IC O PC a)
O
0 rl
I-, •
rd 5-,
-p 0 •
O 0 P., a) 0
a) NI /II 0 5-4
Tri • r0
OHOO a) P4 a) 0 tr., HI
•,-1 0
0 0.
rn CC a) P. t c) H a: 4) 0 0) H o 4, tO
0 r-/ T
0,
O
0,
a)
a)
a)
ti
dr/
a) CJ
1•
a)
0
0)
O \ ON
Tab
le 15.
- -M
en's
‘.0 rn
co C)
ti C) CT ri
VO
to C) 0
C)
01 H
0
C 0 0 -1- -1-
01 CO C11
rr,
CC C) H H N N
N I
H
( .1 CO N- -1- 0\ 10 1.71 \CD CO \- (v) N
H 0 cc) cr-)
H H rI H
Lt1 01 Lc\ 00 CO
NINI CO100
HI
N N— Lc-- CU rrct CO N
• • a
N N
,C)
-Cr N CO H N N- 01 1.0
N--- HI 10 0.1 0 -1 N-
N HI CO L0 C.1 H --1
• • - • • • • • • • - • • •
01 CD Cr'. H10 01 N 1./N H 0 0\ 0 0 0 0,1 Cn C,1 Ln CO CO
I 0, C.0 0, NN
H
• • • o • e • •
• •
II HI, ■ • , •
,O •
0 -P
H
C01110
0.1
li 611
o
H • • ..
H tri 4-,
4-) I 01 IO
-P td 0
8 I Cd ,P C, 4-,
-R 4, 0 El
0 0 Cd CI0
PC Cn
H
cvj
C)
01 0, 1.0
CO
Cc) CO
CC C CC/ .0
CO
H CT c‘.1 C) 0, H N 0-) L0.,
CO
H 0-1 CO
C)
(-1
• • • • • • • , • . , • • • • • • •
LI, V\ Hi 0 N--0
0,0 CO H CO 0 01 ,0 u,
\•1 Lr‘
• • • • • • • 1, • • e • • • • • • • • •
C- N N 0, 0, ‘0 C C_4; 0 Lr\ Cn Cr% ^ G H
H 0 H 0 Hi HI HI
HI -1- LC') N H
e • 1 • • - • • •
, • • • • • • •
011 0 0 0-, C) • CO H11, 01 0 r--1 10 -CC CO LCS -1- 0C
N 01 0". 10 -1- 01 trJ N 0 H
0111 CC 0 as CO CO rl H 0411 \JD H Lf, rq
.0 H CO 00 L, CO U\ 01 ("n r-- 0,1 [- m0 N cA, ,q CN
rl "
H 0 C CN 0/ N-- H a, Hi H N
.----1' ! cot-- C- t.-- H0 H,IN \.0c,i NO, ,0) „DC•-■ coN coH ,..,2, , anii L.--- En -r 0 CO CO CO r-I 0
4 -1-1 CN LC \ H 10 01 0 HI r-2Is ; I c0 Ca -,1- H N
- it' •• •• •• - ••
,,.... ,- --_,,i , H
-, ...r \ ...r +A L"\\ -ON OCSi \ OC
CJ 0 0 0 \ C \ IS \ 01 0 CO 0 L
0 CC H\ .0 (n N \0 N N co H H
• , e e • • • • •
-1- 1D N- C, 10 CO 10 H C) 0, --1- -1 N 01 C4 C) HI 1.1., 1.0-1- HI N Lc, 0-) r.r, c.-- 00 N CC 0'-1 01 Cn
,
i N
.--.(1! N H Ni 0 (0 0, /_/-4- u-s
HI N H
01 t-- 01 ---r N- CO H 01 c0 -7 N o) H co If\ \c, co ‘..o \-1) -1 , 01 01 0 1D H 01 CI, 01 01
1"---, LO. 01 011 H C--- C1 CO1 r-I HI N H
H m Ul CO H 0 C,.) oN 04 H -1- _CN 0-1 0.1 0 if\ 0 Lis. H
00 0,1 HCC -CIOJ N
Qua
ntit
y (
1,
00
0 d
oz
en)

A-36
Table 16.--Men's and boys' dress shirts, not knit: U.S. imports for consumption, by principal sources, 1965-70
Source 1965 .1966 : 1967 ; 1968 ; 1969 ; 1970
Republic Japan Taiwan Malaysia All other
Quantity (1,000 dozen)
Hong Kong----------: of Korea :
763 113 578 21 55 79
: : : : : :
1,052 151 793 36
112 132
: : : : : :
1,600 358 809 145 92 79
: : : : : :
1,635 830 796 190 19 54
: : : : : :
2,069 1,559
830 518 126 62
: 2,172 : 2,313 : 834 : 829 : 126 : 81
Total 1,609 : 2,276 : 3,083 : 3,524 : 5,164 : 6,355 Value (1,000 dollars)
Hong Kong 71709 : 10,698 : 15,336 : 17,110 : 21,616 :25,686 Republic of Korea : 888 : 1,288 : 2,975 : 6,746 : 13,119 :20,783 Japan • 5,371 : 7,974 : 7,511 : 8,299 : 8,513 : 9,241 Taiwan : 199 : 252 : 1,268 : 1,796 : 5,129 : 9,022 Malaysia : 433 : 959 : 757 : 157 : 1,196 : 1,250 All other 797 : 1,154 : 774 : 679 : 1,764: 2,138
Total : 15,397 : 22,325 : 28,621 : 34,787 : 51,337 :68,120
Unit value (per dozen)
Hong Kong : 410.10 :$10.17 $9.59 : $10.46 : $10.45 : $11.82 Republic of Icorea : 7.86 : 8.53 8.31 : 8.13 : 8.42 : 8.99 Japan 9_29 10.06 : 9.28 : 10.43 : 10.26 : 11.09 Taiwan : 6.99 : 8.714 : 9.45 : 9.90 : 10.88 Malaysia-----------: 7.87 8.56 : 8.23 : 8.26 : 9.51 : 9.94 All other----------. 10,09 1 8.74 9.80 : 12.57 : 28.65 : 26.28
Average 9.57 : 9.81 9.28 : 9.87 : 9.94 : 10.72
• Source: Compiled from official statistics of the U.S. Department of
Commerce.
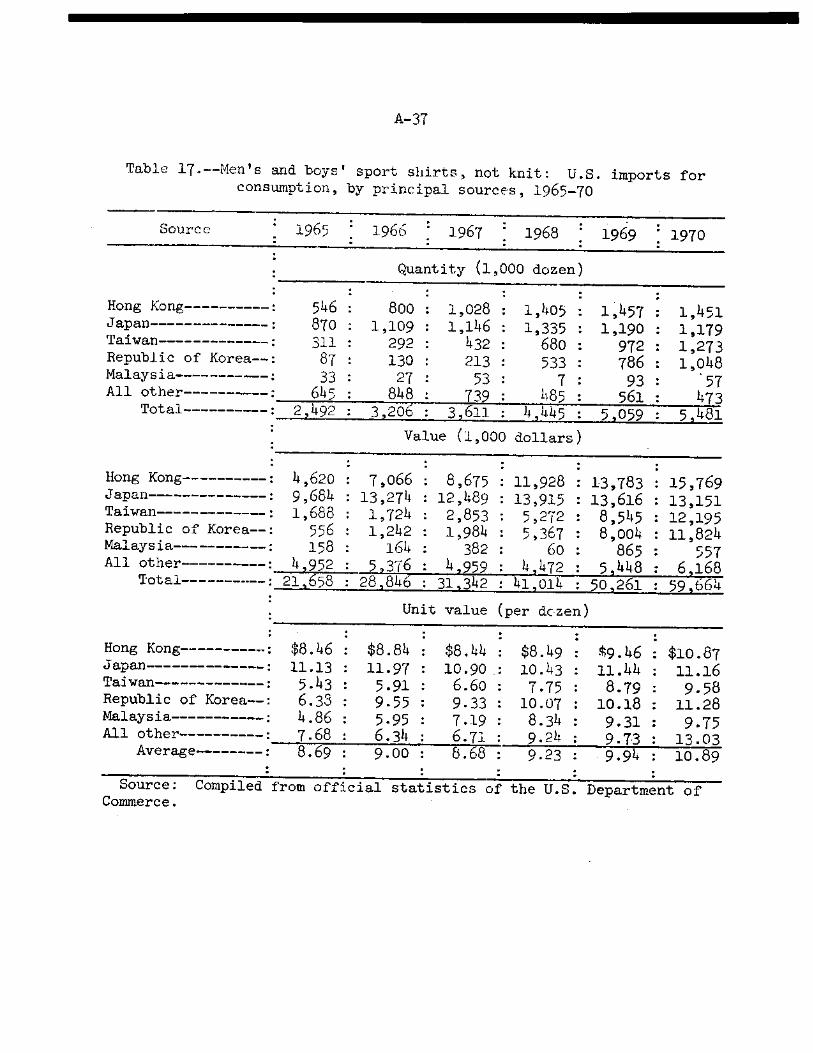
A-37
Table 17.--Men's and boys° sport shirts, not knit: U.S. imports for consumption, by principal sources, 1965-70
Source • , . •
•
1965 '
•
1966
•
1967 • 1968 : 1969 : 1970 •
Quantity (1,000 dozen)
Hong Kong : Japan : Taiwan : Republic of Korea : Malaysia : All other :
Total :
546 : 800 : 1,028 : 1,405 : 870 : 1,109 : 1,146 : 1,335 : 311 : 292 : 432 : 68o : 87 : 130 : 213 : 533 : 33 : 27 : 53 : 7 :
645 : 848 : 739 : 1485 : 2,492 : 3,206 : 3,611 : 4,445 :
: 1,451 : 1,179 : 1,273 : 1,048 : '57 : 473 : 5,481
1,457 1,190
972 786 93 561
5,059
Value (1,000 dollars)
: : - : • Hong Kong : 4,620. 7,066. 8,675 : 11,928 : 13,783 : 15,769 Japan : 9,684 : 13,274 : 12,489 : 13,915 : 13,616 : 13,151 Taiwan : 1,688 : 1,724 : 2,853 : 5,272 : 8,545 : 12,195 Republic of Korea : 556 : 1,242 : 1,984 : 5,367 : 8,004 : 11,824 Malaysia : 158 : 164 : 382 : 60 : 865 : 557 All other : 4,952 : 5,376 : 4,959 : 4,472 : 5,448 : 6J68
Total ---: 21,658 : 28,846 : 31,342 : 41,014 : 50,261 : 59,664
Unit value (per dozen)
•
Hong Kong : $8.46 : $8.84 : $8.44 : $8.49 : !fi9.46 : $10.87 Japan : 11.13 : 11.97 : 10.90 : 10.43 : 11.44 : 11.16 Taiwan : 5.43 : 5.91 : 6.60 : 7.75 : 8.79 : 9.58 Republic of Korea : 6.33 : 9.55 : 9.33 : 10.07 : 10.18 : 11.28
: 9.75
Source: Compiled from official statistics of the U.S. Department of Commerce.
4.86 8.34 Malaysia :
: 5.95 • 7.19 :
: 9.31 All other : 7.68 : 6.34 : 6.71 : 9.24 : 9.73
Average : 8.69 : 9.00 : 8.68 : 9.23 : 9.94 : 13.03 : 10.89

0 0
4-,
9
0
0
• C- O ON
•rl
• 9 •
cd
cd
Cd
••
N • cd
O rd • I-- cd 0\
(1.)
P4 I-3 CJ I
a) d 0
g ▪ /-D
▪ 0 • t-
▪ c\J "--; \a O ON
0 ra
rd
cJ rn
0 a)
g
I.
OH
N
0
a)
g 0 N-
I a. • .-I
0 Ed
0 ti 0
(1,000 do
zen
)
CO
ON
ti \C) ON
\O ON r-I
tr\ 0 ON
0\
spor
t shi
rts
, not separ
ately r
epor
ted.
Depar
tment
of Co
mmer
ce
rCd
av
I
A-38
-1-
c0
\O \D co
c0 \D
\O
CO
-1- \D
• • •
0
• • •
rn
• N
0 0
4-) 0
C.)
tr\
is\
Co
(7\
If\
0
H
H
N ON
H •
L 33
• •
H
•
"
H 0 0
t•---
tr\ ri
r- ♦
UN
(r)
NI
0 -I- -1- N l
cu •
H
N ON CO
H
t--
\O 0\
H 00
H
ti
0 CU 0\
0 N C/N H
H
CO
CO N -1
• • •
H ON
• • •
N
crq U)
(1) 'a
4-1
U) rci
X
rII N
(fl cO:
• •
cn -1-
Lc\ 1 N-
(\ I
\AD 0\ 0\
(r) ti F-4
H
N rti
0 cr) 0 C\ 0 t--•!
a)
cd ao H
•
ir\ ti •
r-i
rn C\J CO
• •
N 0\
• •
C\I
• •
cd -0
0
CO
_1-
•• ••
CO CO CO
•• ••
CO 0 CO
CO
.•
Cu
CO
CO \0
• • ••
CO O
rc) r-I CO
cr)
H \O ON
0 O
4-3
0 0
LC\
ON
U\
cr")
L(\
t*---
H
a H
CO
co
cr)
•
CV 0
a
\O
CO H
CO
CO
C\J
-1-
a
H co
N- H
0
"•-■ CV
N
Ho 0
H
H
MMLnN
••
ir\
N-
LCN
t--
• -
t--
N
aD
a CO
ON
t---
Ni
• •
\O CO
a
\ H ••
0 (A.1 CO
a \,0 rI
co 7 700
H H
0) 1..C\
a H
UN N t----
a
0
••
a\ u-\
a
tr\ 0‘ CO
I
U)
U)
-1 4-4
0
(mod
0 cd
1.
\.0
O ' N--
L!\ H
I•r‘. H H
Lr -1-
• 0 a) ts1 0
,E=3 CO
U)
H cr) .•
H
CO Cd
0 -1-3 C\I
9 CO
Cr) U) 0:3
CO
N a)
0 H
0
t--
cC)
\C)
0\
H
4-) 0
E-I
0 N
H H
-Eac)•
tr\
O r--I
0\ 0\
0 rl
-(19-
0
0 H
-Ef)-
H
0 H
cn \O
-Cr}
ON cr)
r-I -ea-
0 CV
-69-
N
\O
• • •
O
U
N-
ON
CO
0\
ON
L.r■
N-
•
Lc ,
N- •
N
CO
(c) tr\
CO 0
Cr) if\
H
CV
OC)
0
CO
H \.0
• c0
7 0
• COH
• •
• CVI
• 0.1
I
0 H
01C.0
LC\
U\
H
• • 0\
• • ON
H N
0 H
CV
0 H
H \O
ON
7 rn CV
. . NCO
CV 7 l0
• • •
• •
0 CV
• • N H
N N-
• . 0
H
• • •
Lc\ Crl
• 7
C- •
I (01
s-i U) ra •ri 4-4
rd d
o cd
■.0
O
O
cr)
co
Crl ir\
CO
ON
O\
N
• •
t*-- IT\
r-♦
V) ON
00
r--1
11\
\CD 0
•
.•
Cd
a)

A-39
Table 19.--Broadwoven polyester fabrics, wholly or chiefly by weight cf noncontinuous fibers: U.S. exports of domestic merchandise, by kinds, 1965-70
Bleached, Year Unbleached : dyed, Total .
: colored, etc. :
Quantity (square yards)
1965 1,264,346 : 5,844,399 : 7,108,745 1966 : 900,349 : 8,695,424 : 9,595,773 1967 804,433 : 10,879,345 : 11,683,778 1968 724,284 : 12,271,519 : 12,995,803 1969 : 1,172,638 : 19,444,584 : 20,617,222 1970 3,106,611 : 23,633,201 : 26,739,812
Value
1965 $897,018 : $3,939,22 4 : $4,836,242 1966 529,632 : 5,593,177 : 6,122,809 1967 367,897 : 7,486,506 : 7,834,403 1968 485,872 : 8,278,750 : 8,764,622 1969 • 576,771 : 13,217,201 : 13,793,972 1970 1,057,472 : 14,330,873 : 15,388,345
Source: Compiled from official statistics of the U.S Department of Commerce.

A-40
APPENDIX B
Statement of Donald Comer, Jr., President of Avondale Mills, on closing the Birmingham Plant
August 10, 1971
BIRMINGHAM PLANT TO CLOSE Donald Comer, Jr.
After lengthy and careful analysis, the decision to close the
Birmingham Plant of the Avondale Mills has been made. We plan to
complete existing contracts and the plant will close approximately
October 15. This plant has been in continuous operations since 1897.
It is the original plant of the Avondale Mills which was founded by
Governor B. B. Comer. In its early years a major part of the produc-
tion of this plant went into the export market in the form of narrow
print cloths. During the 1920's the product line was changed to
dress chambray which bore the Arkwright and Manchester labels. They
were known around the world, but particularly in the Philippine and
Chinese markets.
In the late 1930's our foreign markets were taken over by the
Japanese whu, with a lower price resulting from a much lower wage
rate, produced a fabric they called "Marchester." Their fabric and
patterns were exact copies. The label they used was identical to our
Manchester label in color and layout. The only difference being an
"R" in place of the "N." By necessity, the production of the
Birmingham Plant was diverted 100% to the domestic market. Inasmuch
as the plant was designed to make fine yarn, the product was made
for the dress and sport shirt market. As the Japanese began to

A- 241
invade the United States market after World War II, they concentrated
on the markets supplied by our Birmingham Plant because the major
part of their productive facilities are designed for light weight
goods. Today our former dress customers, as they need colored yarn
dress goods, buy the Japanese import made with labor paid at one-
fifth the rate of ours. Our former sport shirt customers, in order
to protect themselves from shirt imports , are building plants in the
Asian countries. This market we have to regard as lost forever. The
sport shirt people are not clone in this approach.
I quote Robert C. Sprague, chairman and chief executive officer
of Sprague Electric Company, North Adams, Massachusetts; "Imports are
a threat to our business. Relief must be provided by specific legis-
lation rather than offered through the time consuming procedure of
the escape clause, because of the rate at which United States pro-
ducers of electronic products are shifting their plants abroad. It
must be provided by either the statutory imposition of import quotas
or by an increase in the import duty to the statutory rate of 35 per
cent ad valorem. The transfer of these plants to offshore sites is
destroying the jobs of American workers in the electronic industries.
Once the plants are established abroad, the jobs in the U. S. are
lost forever."
I quote Joseph S. Wright, chairman and chief executive officer
of the Zenith Radio Corporation: "The question of imports is a
tremendously complicated subject. Our industry - I mean consumer
electronics finished products - produced last year a $1 billion
A-42
negative trading balance on an understated basis. American industry,
facing dumping prices, has had to establish factories on'Taiwan and
elsewhere, tnough Zenith was among the last to do so.
"The difficult thing is that, if this were fair competition,
that would be one thing, but it isn't, and it's pretty upsetting to
American industry. As an example, three years ago, there were five
color TV tube plants in the Chicago area; today there is only one."
This is one among several industries trying to solve their prob-
lem in a similar fashion. For the good of America, I don't believe
that establishing offshore bases for manufacture is any answer to
the problem. As we continue to liquidate American jobs it is obvious
that in a short time we will become a nation of paupers with no one
to pick up the welfare check. There is no way we can pay ourselves
wages at a rate many times that of people around the world, and at
the same time afford the luxury of uncontrolled imports made with
this cheap labor, without disastrous results. We are extremely re-
luctant to sacrifice an American job because we feel every one of
them is vital to the continued success of this country. We will
fight every way we know how to protect an Avondale job, and certainly
as long as I am president of Avondale we will not bring into this
country anything Avondale has the facilities to make.
Birmingham's customers have an ample amount of fabrics available
to them, made with labor paid at a rate that is illegal in this coun-
try, to more than take care of their needs. In our efforts to con-
tinue operating, we have most recently been trying to supply fancy

A-43
goods to the dress shirt trade. Unfortunately, our equipment does
not lend itself to this specialty market and we are currently losing
money in Birmingham at a rate in excess of a million dollars annually.
Of course, we cannot continue this. Our normal market was completely
flooded with low wage imports of piece goods or garments last year,
and with overall imports running at a rate 40% higher this year it
is futile to hope for a better time tomorrow. Therefore, we reluc-
tantly reached what we feel is the only wise decision - namely, to
close the plant. Fortunately, up until the present time the products
of our other plants have not been attacked so devastatingly by
imports. Although with our present so called free trade policy it is
only a matter of time until the low wage countries tool up to invade
other fields. When you are the only free trade country in the world,
unfcrtunately you have dumped into your market all the excess capac-
ity that all the other countries can't use in their own market or
supply under trade agreements with other nations. We do have faith
in this country and we have faith that the Congress will soon take a
realistic approach to our trade problems. For the good of the world
we believe in trade among the nations, but we further believe for the
good of all it should be done on an orderly basis. It is a shame
that so uany American jobs have been and continue to be sacrificed
while we continue to do everything but take the firm, necessary
legislative stand.
Some people call controlling imports protectionism. I call it
playing the game as it is played everywhere in the world but here.
A-44
The matter must be deaLt with right away. In the meantime, although
it is a shrinking market, the textile market in this country is still
a large one. Our capital expenditures have been made to keep our
plants as modern as any in the world and wherever possible to direct
our product line into areas that we feel will be least susceptible to
low wage imports. Our overall operation continues at a profitable
level.
Our Trust member employees are our most valuable asset. This
particularlapplies to the 414 in Birmingham who have tried so hard
to save this plant. Although we realize it is not the ideal solution,
and maybe in some cases is not a solution at all, we will be able to
offer a job to every Trust member who is willing to relocate and if
necessary to train for a new job.
This is the unhappiest task I have had in my 39 years with Avon-
dale. Although they are too late coming for some of us, I still have
faith in our legislative processes. I don't believe it will happen
again.