
Novel spatial analysis of residential resource consumption ... · PDF fileYu, et al., Novel...
7
Novel spatial analysis of residential resource consumption via the Melbourne train network Yu, J. a , Lipkin, F. a and Moglia, M. a a Land and Water Flagship, CSIRO, Highett, Victoria Email: [email protected] Abstract: Urban data volumes are increasing and becoming more accessible at a rapid rate. Therefore, novel approaches are required to synthesise and analyse the data in a meaningful way. The Australian Urban Research Infrastructure Network (AURIN) is providing tools and is negotiating data access to key datasets about cities to facilitate research on urban issues. Through AURIN, a number of datasets around urban settlements have been made available to researchers and policy analysts, including on demographics, housing, and resource consumption. These datasets are aggregated to geographic regions such as Australian Bureau of Statistics statistical areas, local government localities or postcodes in order to cater for the purpose of these regions. However, this can be a challenge when performing contextual analysis over a given region, as the data is not easily compared between spatial aggregations. Although this is a wealth of information, we argue that these regions are less intuitive to the general public compared with regions located around a familiar local landmark, such as a train station. Therefore, using landmarks like these as the basis for performing spatial analysis of its surrounding region may provide improved understanding of urban issues. In this paper, we explore the use of Melbourne metropolitan train stations as landmarks to explore the functional relationship between key co-variates such as population, house size, income and dependent variables water and electricity consumption for areas in Greater Melbourne. To achieve this, Thiessen polygons are used to define catchment areas and data is aggregated to these regions surrounding each train station. By presenting the data spatially for these regions in Melbourne, we demonstrate the use of a novel approach to spatial visualisation data. Results show strong associations between income and electricity consumption, and between measures of urban density with resource consumption. Keywords: Water and energy consumption, demographics, housing, spatial data analysis 21st International Congress on Modelling and Simulation, Gold Coast, Australia, 29 Nov to 4 Dec 2015 www.mssanz.org.au/modsim2015 1188
Transcript of Novel spatial analysis of residential resource consumption ... · PDF fileYu, et al., Novel...

Novel spatial analysis of residential resource consumption via the Melbourne train network
Yu, J. a, Lipkin, F. a and Moglia, M. a
a Land and Water Flagship, CSIRO, Highett, Victoria Email: [email protected]
Abstract: Urban data volumes are increasing and becoming more accessible at a rapid rate. Therefore, novel approaches are required to synthesise and analyse the data in a meaningful way. The Australian Urban Research Infrastructure Network (AURIN) is providing tools and is negotiating data access to key datasets about cities to facilitate research on urban issues. Through AURIN, a number of datasets around urban settlements have been made available to researchers and policy analysts, including on demographics, housing, and resource consumption. These datasets are aggregated to geographic regions such as Australian Bureau of Statistics statistical areas, local government localities or postcodes in order to cater for the purpose of these regions. However, this can be a challenge when performing contextual analysis over a given region, as the data is not easily compared between spatial aggregations. Although this is a wealth of information, we argue that these regions are less intuitive to the general public compared with regions located around a familiar local landmark, such as a train station. Therefore, using landmarks like these as the basis for performing spatial analysis of its surrounding region may provide improved understanding of urban issues. In this paper, we explore the use of Melbourne metropolitan train stations as landmarks to explore the functional relationship between key co-variates such as population, house size, income and dependent variables water and electricity consumption for areas in Greater Melbourne. To achieve this, Thiessen polygons are used to define catchment areas and data is aggregated to these regions surrounding each train station. By presenting the data spatially for these regions in Melbourne, we demonstrate the use of a novel approach to spatial visualisation data. Results show strong associations between income and electricity consumption, and between measures of urban density with resource consumption.
Keywords: Water and energy consumption, demographics, housing, spatial data analysis
21st International Congress on Modelling and Simulation, Gold Coast, Australia, 29 Nov to 4 Dec 2015 www.mssanz.org.au/modsim2015
1188

Yu, et al., Novel spatial analysis of residential resource consumption via the Melbourne train network
1. INTRODUCTION
Cities are complex system of systems and constantly changing; with datasets pertaining to diverse issues owned by equally diverse stakeholders. Management of cities is primarily sectoral and problems tend to be resolved within sectoral boundaries. Whilst this makes sense from the perspective of legal and regulatory responsibilities, however we believe that a more holistic and systemic approach to resolving urban issues would be more effective. Such an approach would rely on cross-sectoral data, albeit, data varies in the encoding formats, terminology, and spatial units used, as well as access protocols. It is also analysed and visualised for a variety of end uses, for example, reports and interactive media sites. In this paper, we explore these issues in the context of spatial visualisations, which provides a useful means for facilitating informed conversation and learning by visualising and correlating data. Geospatial Information Systems (GIS) and spatial visualisation techniques have enabled improved discovery of spatially-correlated patterns and trends. Applications include analysis of land use changes, spatio-temporal dynamics, and comparison of various data sources from different domains by overlaying these over each other.
A key challenge is interpreting the data and its analysis. Analysis or visualisation of data requires quality checking, data cleansing and data harmonisation, if more than one source is used. An additional dimension to the data challenge is the ability to transact across multiple spatial aggregation classifications. In the Australian context, classifications for spatially aggregating data is generally based on demography, postal areas, or administrative boundaries. Therefore, data aggregated on different classifications become difficult to combine and compare, which poses difficulties in performing multi-disciplinary analysis that are often required, e.g. water, energy, and demographic data analysis.
Partnering with the Australian Urban Research Infrastructure Network initiative (AURIN), CSIRO has developed a nationally applicable data standard for the encoding Water and Energy Supply and Consumption (WESC) datasets for the energy and water sector via the AURIN Lens 6/2 Project (L6/2) (Yu et al. 2015). AURIN aims to provide researchers and planners with access to information services and online tools to understand patterns of urban development and to model urban growth for a sustainable future (Sinnott et al. 2012, Sinnott et al. 2015). CSIRO is facilitating access to water and energy datasets to researchers, government agencies and interested community groups via a WESC data hub accessed through the AURIN portal. The CSIRO WESC data hub is currently providing access to data from the major capital cities and a selection of regional centres in Victoria, NSW, ACT and Queensland.
The WESC data hub aims to support evidence-based urban research in the areas of water and energy policies. Residential water and energy use is often analysed for planning purposes, at various temporal and spatial scales (Lenzen, Dey et al. 2004; Gato, Jayasuriya et al. 2007; Moglia, Grant et al. 2009; Baynes, Lenzen et al. 2011; Harmer and Henze 2015). A large number of co-variates have been reported to impact on both energy and water use, and for both types of resources there is generally a temporal pattern repeating itself on an annual, seasonal and hourly basis – at all spatial scales. For the purposes of this paper, we are interested in exploring the link between demographics, including per-capita income, and resource use (i.e. water and electricity consumption). Lenzen and colleagues (2004) have in fact shown for the case of Sydney that the Energy Requirements per capita (GJ/cap) increase in a near-linear manner as a function of annual income (A$/cap) but that also larger households appear to be requiring less energy per capita than smaller households. Similar patterns of electricity use that are strongly dependent on income have been found in China (Chen, Wang et al. 2013) and Brazil (Cohen, Lenzen et al. 2005). The link between income and water use is not as thoroughly explored, although Amarasinghe and Smakhtin (2014) found that per capita water use at the national scale is linked to the per capita income in the country, and Schleich and Hillenbrand (2009) found that income and price of water are shown to have a statistically significant impact on residential water use in Germany. What is clear from these studies is that it is critical when analysing resource use, to allow analysis at the most appropriate spatial and temporal scale, to allow for greatest forecasting capacity or for the greatest insights. Water and energy system operators need forecasts at half-hourly or minute by minute granularity, whilst strategic planners need a broader level of granularity for high level analysis in order to link key factors to resource use, thus providing long term projections or the definition of management levers.
Policy analysis and reporting is used to inform stakeholders and the general public in order to further understand current issues and challenges. However, we argue that the data presented using the spatial classifications used for these reports are not always easily interpreted, recognised or communicated to the general public due to the codes used to classify spatial regions according to the geo-classification, e.g. ABS Statistical Area Level 2 (ABS SA2) codes. We believe that spatially presented data may be more easily understood when suburb, postcodes, or landmarks, such as train stations, are being used to denote the data. Lin et al. (2014) have performed an analysis of train stations and its accessibility to services in Perth and the
1189

Yu, et al., Novel spatial analysis of residential resource consumption via the Melbourne train network
link between particular train stations and increased patronage. Lin et al. also note that train stations have been used previously to analyse surrounds. Thus, we propose the hypothesis that using aggregation based on train stations and the public transport train system may allow people (community members, stakeholders, modellers, etc) to more easily understand the data.
In this paper, we propose a spatial approach intended to allow the general public to explore and associate spatial regions with multiple categories of data via central markers. We propose exploring the use of train stations as central markers for a given region as a more intuitive geospatial marker than other classifications such as ABS Statistical areas classification. In order to overcome the difficulty of combining data that is aggregated using different geospatial classifications, train stations are used to perform segmentation of data using Thiessen polygons and co-locate data points together in order to visualise correlations between population, housing, income, water consumption and electricity consumption using data from the Greater Melbourne region. In Section 2, we present the methodology used to collect analyse and visualise the appropriate data and define a notion of train catchments to co-locate and distribute proportions of each dataset. In Section 3, we present the result of the analysis. Finally, in Section 4, we present a discussion of the spatial analysis and future work.
2. METHODOLOGY
A train-station catchment is defined as a geographic area encompassing housing properties that are closest to that particular station than any of the other stations. The Thiessen polygons geo-processing tool from the ArcGIS suite of tools is applied in which closeness is measured with Euclidean distance rather than routing through a street network. The boundary lines between two stations is also the mid-point to a surrounding station catchment.
Figure 1. Train station catchments for a region of inner Melbourne.
The train station catchment is an arbitrarily derived layer that does not contain any form of alignment with geographic areas that are utilized for distributing aggregated data i.e. SA1-3, postcode or Suburb see Figure 2 below. In order to represent data within train-station catchments, data is distributed on the basis of proportion of the proportions of an area that a train station catchment intersects a given geographic region. For example, if the Prahran train station catchment intersects 30% of SA2 region 21136 than that proportion of data is distributed to the train station catchment, this is repeated for all intersecting SA2 regions.
The geographic units employed in the current study ranged from, SA2 for the data which was collated from the ABS, and localities (i.e. suburbs) for the data collected form utility companies.
1190

Yu, et al., Novel spatial analysis of residential resource consumption via the Melbourne train network
Figure 2. Overlay of ABS SA2 regions (red) and train station catchments (black) for a region in Melbourne.
The data used for the analysis of income, household, water consumption and electricity consumption are collected from multiple sources. The data used:
● Electricity: ABS 4670.0 Household Energy Consumption Survey, Aus.: Summary of Results, 2012. ● Water: Yarra Valley Water, South East Water and City West Water Consumption data from
AURIN Lens 6/2, 2012. ● Income: Total Personal Income (weekly) by Age By Sec, Table B17, 2011 Census ● House Size: Dwelling Structure and No. Bedrooms by No. Persons, Table T16, 2011 Census
3. RESULTS
3.1. Train-station catchments spatial analysis for Melbourne - water and electricity consumption
Residential electricity survey data obtained from the ABS and the water consumption data obtained from the AURIN portal were used to analyse resource consumption for Greater Melbourne in those two aspects respectively. The residential electricity survey data used classifies electricity consumption using the ABS Statistical Areas classification (ABS SA2 at the most granular level). The water consumption data provided by AURIN were sourced from the water retailers for Metropolitan Melbourne (Yarra Valley Water, City West Water and South East Water) and the data were aggregated to postcode regions. Both were processed and redistributed into the train-station catchments using the method described in the section above. Figure 3 below shows a map visualisation of the electricity and water consumption for 2012 aggregated using the train-station catchments.
Figure 3. Electricity and water consumption for 2012 using the train-station catchments.
1191
Yu, et al., Novel spatial analysis of residential resource consumption via the Melbourne train network
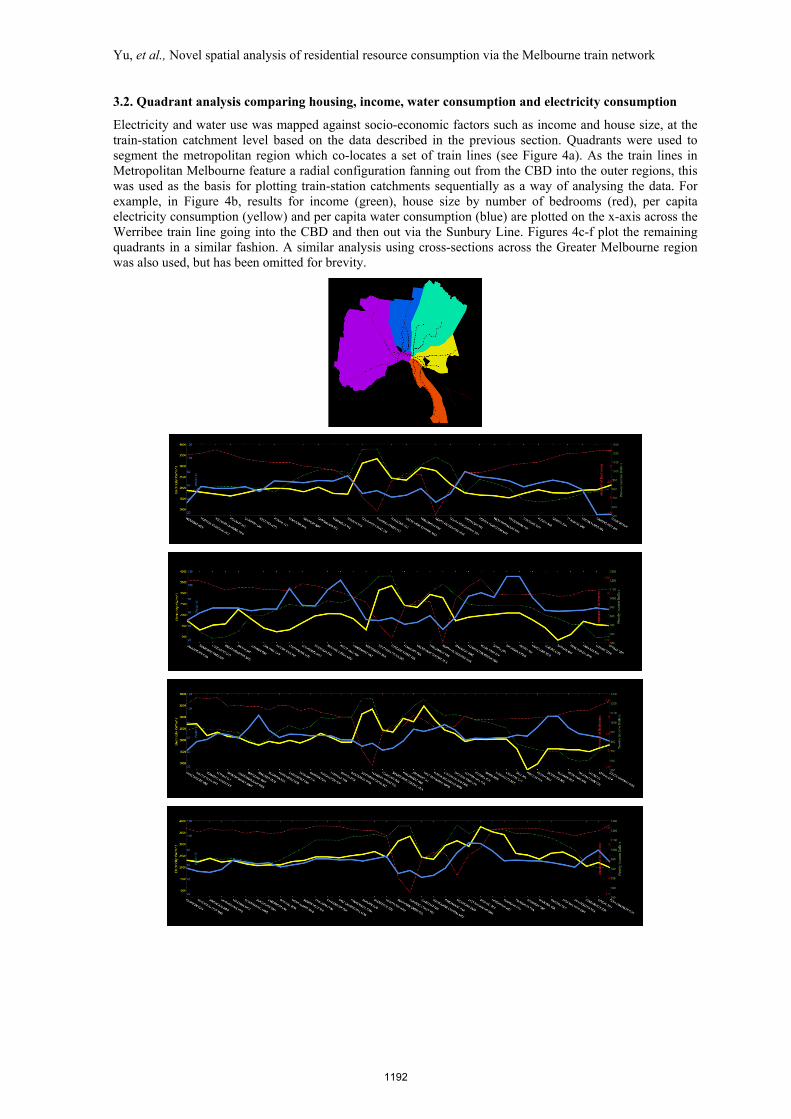
3.2. Quadrant analysis comparing housing, income, water consumption and electricity consumption
Electricity and water use was mapped against socio-economic factors such as income and house size, at the train-station catchment level based on the data described in the previous section. Quadrants were used to segment the metropolitan region which co-locates a set of train lines (see Figure 4a). As the train lines in Metropolitan Melbourne feature a radial configuration fanning out from the CBD into the outer regions, this was used as the basis for plotting train-station catchments sequentially as a way of analysing the data. For example, in Figure 4b, results for income (green), house size by number of bedrooms (red), per capita electricity consumption (yellow) and per capita water consumption (blue) are plotted on the x-axis across the Werribee train line going into the CBD and then out via the Sunbury Line. Figures 4c-f plot the remaining quadrants in a similar fashion. A similar analysis using cross-sections across the Greater Melbourne region was also used, but has been omitted for brevity.
1192

Yu, et al., Novel spatial analysis of residential resource consumption via the Melbourne train network
Figure 4. Quadrant analysis of Greater Melbourne by income, number of bedrooms in a house, electricity consumption, and water consumption. a) Quadrants and train lines; b) Line plot across Werribee and Sunbury
train lines; c) Line plot across Craigieburn and Upfield Line; d) Line plot across Hurstbridge and South Morang line; e) Line plot across Croydon and Glen Waverley line; f) Line plot across Frankston and
Sandringham line.
4. DISCUSSIONS AND FUTURE WORK
Train-station catchments have been defined and used in this paper as a method for aggregating multiple datasets. This method allows comparison using a single spatial classification. The results shown in the previous section illustrate correlations between these datasets using the train-station catchments and place names which may be more intuitive than the ABS Statistical area codes, postcodes and localities identifiers.
Although, the main contribution of the paper is the method for aggregating different datasets together using train-station catchments, the application of the method produced results showing some correlations for electricity consumption in two aspects. First, electricity consumption is strongly correlated with indicators of income in both the quadrant and cross-section analysis as shown visually by the yellow lines and the green lines in the line charts in Figure 4. This result appears to come across more strongly than in previous studies, but it remains to be seen if similarly strong correlations can be found in other cities.
Second, electricity consumption per sq. m. is increased in regions closer to the Melbourne CBD. The line charts in Figure 4 shows a rise in per capita electricity consumption towards the center for train-station catchments nearer the CBD. Figure 3 depicts this via a map-based view and the darker areas show the increased electricity consumption in regions in and around the CBD. This points to the fact that there is increased density of residential housing towards the Melbourne CBD.
The results obtained also show that per capita water consumption is higher in the outer suburbs than in the inner suburbs closer to the Melbourne CBD. Again, this may be due to the higher levels of urbanisation towards the center of Melbourne pointing to perhaps less outdoor areas for residential properties requiring less water usage, e.g. watering of gardens. However, further studies are required to gather data to verify this.
These results combined illustrate the importance of urban form and socio-economics in the metabolism of a city: providing insights into the processes by which a city uses resources. Understanding urban metabolism is critical for a resource constrained future where our future well-being and prosperity will depend on the extent to which we can do more with less.
Presenting data in this manner allows both the general public and the decision- or policy-makers within various organisations to quickly understand trends in the data. This paper has used a method of aggregating multiple datasets together to allow the contrasting of the data on a level playing field and subsequently produced a more cohesive analysis of the data than using the datasets as-is. This analysis yielded some insight into behaviours and the urban characteristics of Greater Melbourne and could be used in public awareness campaigns, understanding of key factors contributing to resource consumption and longer-term targeted urban planning.
However, there is a need for improved data availability and consistency. Despite initiatives such as Open Government in the US, UK and Australia, INSPIRE in Europe, and research data networks such as AURIN and DataOne, there is more work required to establish data standards for the various domains, such as the environment, finance, and transport, in particular common definitions and encoding formats. The establishment of common definitions, encoding formats, and access methods will allow data infrastructures to be more easily discoverable and used across different systems and client applications.
Additionally, the standardised handling of spatial identifiers and classifications in the Australian context as well as internationally is needed in order to be able to transact across spatial classifications. Francis et al. 2013 propose the Spatial Identifier Reference Framework (SIRF) for identifying and linking place names and related data thus providing information about the crosswalks between data, spatial references and its
1193

Yu, et al., Novel spatial analysis of residential resource consumption via the Melbourne train network
provenance. Wickramasuriya et al. 2013 propose a platform using Geospatial Business Intelligence approaches to provide an integrated view of data from disparate sources across local and state government agencies, and private organisations and apply it to the Illawara region in NSW, Australia. Wickramasuriya et al. also note a similar challenge and propose Extract-Transform-Load mapping processes between spatial aggregations in order to integrate the data at a common spatial aggregation. Clearly, future work is needed to address this ongoing challenge to facilitate more consistency and use of such data.
Results obtained from the data in this paper provide clues for future investigation. The first is in quantifying whether train-station catchments are more intuitive through user studies. While, the authors and the anecdotal evidence would suggest these are more intuitive, a thorough user trial or cognitive science experiment to evaluate the presentation of the data between the various classifications is required. Secondly, though we have presented the data in a consistent spatial classification using train-station catchments, it does not capture the temporal dynamics of each region as this work only looked at static set of data according to time. Therefore, additional work is required to investigate appropriate visualisation methods and tools for capturing the spatio-temporal nature of the data. Having such a tool would allow users to understand the variation of resource consumption, the changing population and land use patterns.
ACKNOWLEDGMENTS
Funding for AURIN has been provided by the Australian Government under the National Collaborative Research Infrastructure Strategy (NCRIS) and associated programmes.
REFERENCES
Amarasinghe, U. A. and V. Smakhtin (2014). Global water demand projections: past, present and future. IWMI Research Report 156. Colombo, Sri Lanka, International Water Management Institute (IWMI).
Baynes, T., M. Lenzen, et al. (2011). Comparison of household consumption and regional production approaches to assess urban energy use and implications for policy, Energy Policy 39(11): 7298-7309.
Chen, J., X. Wang, et al. (2013). A statistical analysis of a residential energy consumption survey study in Hangzhou, China, Energy and Buildings 66: 193-202.
Cohen, C., M. Lenzen, et al. (2005). Energy requirements of households in Brazil, Energy Policy 33(4): 555-562.
Francis, W., Atkinson, R., et al. (2013). Model-driven data harvesting to publish provenance for geospatial references. In Proceedings of the 7th international conference on Knowledge capture (pp. 121-124). ACM.
Gato, S., N. Jayasuriya, et al. (2007). Forecasting Residential Water Demand: Case Study, Journal of Water Resources Planning and Management 133(4): 309-319.
Harmer, L. C. and G. P. Henze (2015). "Using calibrated energy models for building commissioning and load prediction." Energy and Buildings 92: 204-215.
Lenzen, M., C. Dey, et al. (2004). Energy requirements of Sydney households, Ecol. Economics 49(3): 375-399.
Moglia, M., A. L. Grant, et al. (2009). Estimating the effect of climate on water demand: Towards strategic policy analysis, Australian Journal of Water Resources 13(2): 81-94.
Schleich, J. and T. Hillenbrand (2009). Determinants of residential water demand in Germany, Ecol. Economics 68(6): 1756-1769.
Lin, T., Xia, J., et al. (2014). Spatial analysis of access to and accessibility surrounding train stations: a case study of accessibility for the elderly in Perth, Western Australia, Transport Geography 39: 111-120.
Sinnott, R.O., Bayliss, C., et al. (2012), A data-driven urban research environment for Australia, Proc. IEEE 8th Intl. Conf. on E-Science, vol., no., pp.1-8, Oct. 8-12, doi: 10.1109/eScience.2012.6404481
Sinnott R. O., Bayliss C., et al. (2015), The Australia urban research gateway, Concurrency Computat.: Pract. Exper., 27, pp. 358–375, doi: 10.1002/cpe.3282
Wickramasuriya, R., Ma, J., et al. (2013). Using geospatial business intelligence to support regional infrastructure governance. Knowledge-Based Systems, 53, 80-89.
Yu, J., Inman, M. and Simons, B. (2015). Protocols to integrate urban water data with energy and other sectors within AURIN, Paper presented at Ozwater’15, Adelaide, Australia, May 12-15. pp. 1-8.
1194


![A Study of the Spatial Relevance between Economic ... · a negative impact on water consumption [2]. Spatial Statistical Analysis is an important approach to study spatial distribu-tion](https://static.fdocuments.in/doc/165x107/605a86ee45a40e108723fe18/a-study-of-the-spatial-relevance-between-economic-a-negative-impact-on-water.jpg)