Novel Polymerase Inhibitors: Characterisation of a ...
132
Novel Polymerase Inhibitors: Characterisation of a Nanocarrier and Activity Testing in a 3D Non- Melanoma Skin Tumour Model Inaugural-Dissertation to obtain the academic degree Doctor rerum naturalium (Dr. rer. nat.) submitted to The Department of Biology, Chemistry and Pharmacy Of the Freie Universität Berlin, Germany by Cherine Mohamed Ossama Mohamed Ali (Ali- von Laue) From Cairo, Egypt August 2011
Transcript of Novel Polymerase Inhibitors: Characterisation of a ...

Novel Polymerase Inhibitors:
Characterisation of a Nanocarrier and
Activity Testing in a 3D Non- Melanoma
Skin Tumour Model
Inaugural-Dissertation
to obtain the academic degree
Doctor rerum naturalium (Dr. rer. nat.)
submitted to
The Department of Biology, Chemistry and Pharmacy
Of the Freie Universität Berlin, Germany
by
Cherine Mohamed Ossama Mohamed Ali (Ali- von Laue)
From Cairo, Egypt
August 2011

1st
Reviewer: Prof. Dr. Monika Schäfer-Korting
2nd
Reviewer: Prof. Dr. Heinz. H. Pertz
Date of defence: 23. September 2011

The following work was done under the supervision of
Prof. Dr. Monika Schäfer-Korting
Institut für Pharmazie (Pharmacology und Toxicology)
Freie Universität Berlin
To my Family with all love and gratitude

IV
ACKNOWLEDGEMENT
First I would like to express my gratitude to Prof. Dr. Monika Schäfer-Korting for
giving me the opportunity to work under her accomplished supervision on such
interesting and challenging topic. I am also thankful for her invaluable scientific
guidance and support throughout the project.
The present work would not have been possible without the help and support of many.
In particular, I would like to thank Dr Wolfgang Mehnert for his advice and stimulating
scientific discussion which helped me greatly in the pharmaceutical technology part of
my work. I am grateful for Gabi and Barbara for their administrative assistance and
Hannelore for her help during the practical phase. I am thankful for all my colleagues at
the department of Pharmacology and toxicology for their help and always providing
nice working atmosphere.
Furthermore, I am indebted to my colleagues Loaye, Senem, Rangita, and Corina at the
department of pharmaceutical technology for making my work so enjoyable and
thankful to Prof. Dr. Müller for giving me the possibility to perform the technology part
in his laboratories. At the department of veterinary medicine, I would like to especially
thank Prof. Plendl, Mrs Briest Worsch and Mrs Eckert for their technical support with
the histology of the skin models and the scanning electron microscopy. At the
department of pharmaceutical biology I am grateful to Prof. Dr. Pertz for his patience
and understanding during stressful and hectic times.
I am thankful for Alexandra, Nada, Nesrin and Saghi for their friendship and continuous
help. I am indebted to my family for their continuous encouragement and support. Last
but not least, I am thankful to Sigward for proof reading my thesis and his support and
to the little twinkle that made me finish the thesis rather quickly.

INDEX
V
INDEX
ACKNOWLEDGEMENT IV
INDEX V
ABBREVIATIONS VII
1 INTRODUCTION 1 1.1 Structure and function of the skin 2 1.2 Actinic keratosis 6 1.3 Current treatment 9 1.4 Novel approaches and treatment options 14 1.5 Innovative carrier systems for dermal application 16 1.6 Human skin equivalent for the evaluation of therapeutic options 17 1.7 Tumour biomarkers 18 1.8 Aim of the thesis 21
2 MATERIALS 22 2.1 Technical devices 23 2.2 Chemicals and reagents 25 2.3 Primary cells and cell lines for cell culture 29 2.4 Culture media and solutions 30 2.5 ELISA working solutions 33 2.6 Immunohistochemistry and histology solutions 34
3 METHODS 35 3.1 Development and validation of HPLC method 36 3.2 Solid lipid nanoparticles optimization 38 3.3 Particle characterisation 40 3.4 Characterisation of SLN drug interaction 41 3.5 Cell culture 42 3.6 Building of three dimensional skin tumour constructs 43 3.7 Histology 45 3.8 Immunohistochemistry 46 3.9 Viability test 47 3.10 Enzyme linked immunosorbent assay 49 3.11 Statistical analysis of data 53

INDEX
VI
4 RESULTS 54 4.1 Development and validation of HPLC method 55 4.2 Development of solid lipid nanoparticles (SLN) 60 4.3 Stability investigations of OxBu loaded SLN 66 4.4 Characterisation of SLN drug interaction 72 4.5 SLN embedded hydrogels 74 4.6 Evaluation of cytotoxicity in 2D-cell culture 76 4.7 Studies on reconstructed three dimensional tumour constructs 79
5 DISCUSSION 92 5.1 Formulation optimisation, characterisation and stability evaluation 93 5.2 Pharmacodynamics studies 99
6 SUMMARY 106 6.1 English summary 107 6.1 German summary 109
7 REFERENCES 111
ABBREVIATIONS
VII
ABBREVIATIONS
3D Three dimensional
5-FU 5-Fluorouracil
ACN Acetonitrile
AK Actinic keratosis
BPE Bovine pituitary extract
BSA Bovine serum albumin
CK Cytokeratin
CK18-Asp396 Caspase cleaved cytokeratin 18
DDM Dako diluent medium
DE Dermal equivalent
DMEM Dulbecco’s modified Eagle’s medium
DMSO Dimethyl sulfoxide
DNA Deoxyribonucleic acid
DSMZ Deutsches Sammlung für Mikroorganismen und Zellkultur
EDTA Ethylendiamine-N,N,N’,N’-tetra acetic acid
EGF Epidermal-growth-factor
ELISA Enzyme linked immunosorbent assay
FBM Fibroblasts basal medium
FCS Foetal calf serum
GDP Guanosine diphosphate
GMP Guanosine monophosphate
Gn Guanine
Gs Guanosine
GTP Guanosine triphosphate
H&E Haematoxylin & eosin
hEGF Human epidermal growth factor
HPLC High pressure liquid chromatography
HPV Human Papilloma virus
HSE Human skin equivalent
Ig3-A Ingenol 3-Angelate

ABBREVIATIONS
VIII
IHC Immunohistochemistry
KBM Keratinocyte basal medium
KCl Potassium chloride
KDa Kilo dalton
KGM Keratinocyte growth medium
KH2PO4 Potassium dihydrogen phosphate
LD Laser diffractometry
LoD Limit of detection
LoQ Limit of quantification
MetOH Methanol
µm Micrometer
µM Micromolar
MTT 3-(4,5-dimethylthiazol-2-yl)-2,5-
diphenyltetrazoliumbromid
Na2HPO4 Sodium hydrogen phosphate
NaCl Sodium chloride
NaOH Sodium hydroxide
NEAA Non Essential amino acids
NHDF Normal human dermal fibroblasts
NHK Normal human keratinocytes
nm Nanometer
OD Optical density
PBS Phosphate buffered saline
PCS Photon correlation spectroscopy
PDT Photodynamic therapy
pg Picogram
P-gp P-glycoprotein
PI Polydispersity index
pol Polymerase
PS Parelectric spectroscopy
RetT Retention time
rpm Revolutions per minute
RT Room temperature
SB Stratum basale
ABBREVIATIONS
IX
SC Stratum corneum
SCC12 Human head and neck squamous cell carcinoma
SCC25 Human oral squamous cell carcinoma
SD Standard deviation
SDS Sodium dodecyl sulphate
SE Skin equivalent
SEM Scanning electron microscope
SG Stratum granulosum
SM Stop medium
SS Stratum spinosum
TM Transport medium
UV Ultra violet
WR Working reagent

1 INTRODUCTION

1.INTRODUCTION
2
1.1 Structure and function of the skin
The skin covers almost the entire surface of the human body and is often considered to
be one of the largest organs. Its surface area varies between 1.5-2 m² for an average
sized adult, which equates to an approximate volume of 15-25 dm³ and represents 8-
10% of total body weight (Garidel 2003). Being the outermost surface, the skin forms
one of the most important interfaces of the inner milieu of the body and the environment
and hence it serves a variety of crucial functions. These include coherence of the
organism’s internal tissues and organs, but also body protection, sensation and
thermoregulation as well as the retention of water, electrolytes and other body
constitutes. The protective function includes protection from mechanical and physical
impacts like abrasion, incision, incursion, shock and UV radiation, but also chemical
exposure and biological attack. Mechanical protective properties are mainly based on
the physical characteristics of the skin and its biological responses to mechanical injury
like the enhancement of cell proliferation with a resulting thickening of the outer layer,
the epidermis. Furthermore physical protection is provided by physiological adaptations
to continuous stress, like the formation of horny skin (callus) increase in melanin
synthesis, the ensuing darkening and the subsequently improved UV protection.
Chemical protection is also largely based on the physiology of the skin, the rapid
proliferation and shedding of skin cells as well as repair mechanisms like wound
healing and scarring. Furthermore, the skin’s defence function against biological attack
relies on the aforementioned physical properties and the pH on its surface (Schmid-
Wendtner and Korting 2006). Both the protective function against chemical and
especially biological assaults is however crucially enhanced by different components of
the immune system and other cells, capable of producing highly reactive substances like
oxygen free radicals, antimicrobial peptides, both of human as well as of microbial
origin (Gallo and Nakatsuji 2011; Nogues, et al. 2002; Schneider, et al. 2005).
The skin’s sensory functions depend on a variety of receptors for temperature, pain,
pressure and touch, its crucial role in thermoregulation is based on the dilatation or
contraction of blood vessels as well as via sweat glands, and hence the adaptation of
heat conductance and water evaporation.
1.INTRODUCTION
3
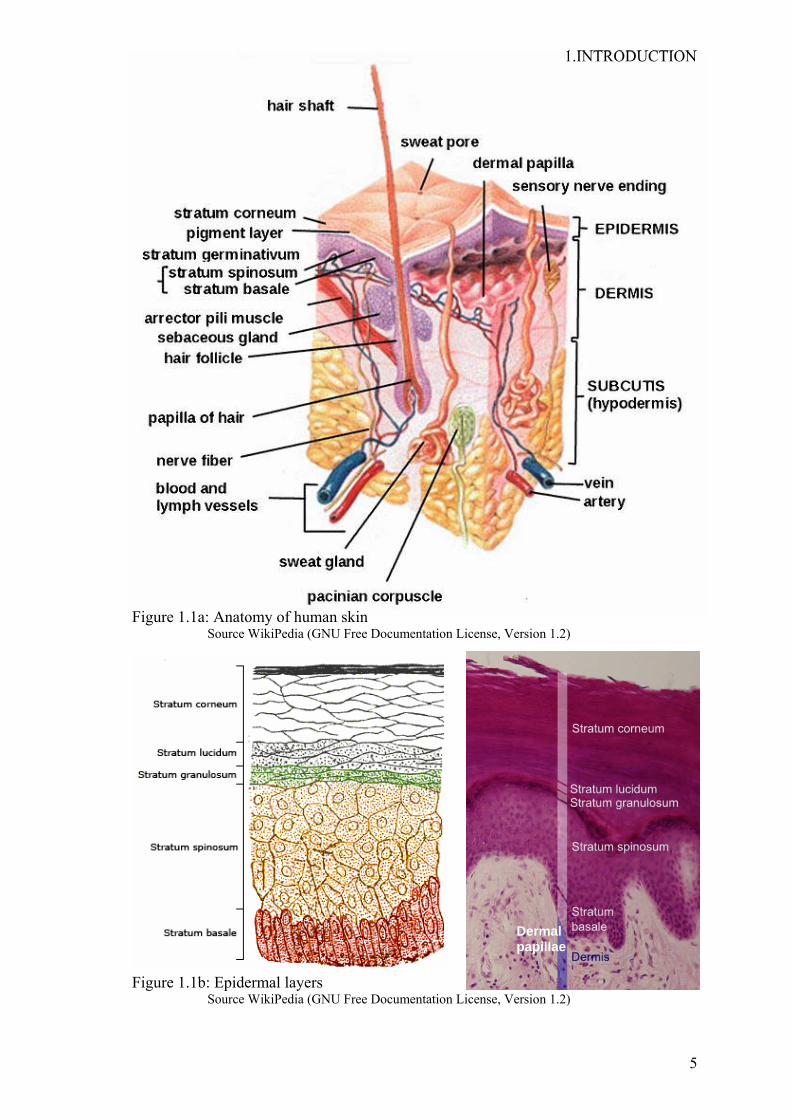
Anatomically, the skin is characterised by its three different layers, epidermis, dermis
and the subcutis (Figure 1.1), with epidermis and dermis collectively being called cutis.
The cutis passes into the subcutis without a distinct border, yet each of the three layers
contribute significantly in the overall function of the skin and are characterised by a
distinct cell composition. The epidermis is the most superficial layer, hence provides
the first barrier of protection from the invasion of foreign substances. It can be
subdivided into a number of layers or strata, consisting from the outside to the inside of
stratum corneum (SC), occasionally stratum lucidum (SL), stratum granulosum (SG),
stratum spinosum (SS) and stratum basale (SB) (Figure 1.1b). The thickness of the
epidermis varies from about 0.1 mm to 1.5 mm (Marks, et al. 2006), hence making it
sometimes difficult to clearly distinguish the different strata. Especially keratinocytes
and corneocytes are predominant, but melanocytes, Langerhans and Merkel cells are
also cell types usually present in the epidermis. Since the epidermis is avascular, it is
nourished by diffusion from the dermis, a process enhanced by the increased interface
created by epidermis’ rete ridges that are intertwined with the dermal papillae of the
dermis (Figure 1.1).
The stratum basale (SB) consists of a row of stem cells, half of which stay in the
stratum basale and divide continuously. The other half differentiate and move from SB
to the next epidermal layer SS, to begin the maturation process, resulting in mature
keratinocytes. Therefore, SB is responsible for the constant renewing of the epidermis
(Houben, et al. 2007). While migrating through the SS and subsequently the SG, cells
undergo rapid differentiation, and progressive maturation that is characterised by the
accumulation of keratin, a process referred to as keratinisation or cornification. The
keratinocytes then become flattened and synthesise lamellar granules. These lamellar
bodies migrate towards the cell periphery and are extruded to form the multilamellar
lipid layers between the keratinised cells in the SC (Houben et al. 2007; Wertz 1996).
Moreover, keratohyalin is formed and the cell membrane undergoes changes, i.e. the
phospholipid content is decreased whereas the ceramide content increases (Mizutani, et
al. 2009). The following layer, the SG, mainly consists of dense granules accumulating
keratinocytes, sometimes referred to as granular cells. Here cornification becomes most
pronounced, resulting in cell death that appears to be quite distinct of apoptosis
(Houben et al. 2007). In areas of thick skin, like the palms of the hands, the SG is
followed by the SL, a translucent layer of dead keratinocytes (Corcuff, et al. 1993). In
the absence of a SL, the SG is adjacent to the SC. In the SC keratinocytes gradually
1.INTRODUCTION
4
migrate to the surface while undergoing terminal transformation. At the end of this
process the nucleus and cell organelles have been lost and these keratinised cells also
known as coenocytes are subsequently shed in a process called desquamation (Houben
et al. 2007). These dead corneocytes are embedded in a multilamellar lipid matrix that
mainly consists of free fatty acids as well as their salts, triglycerides, cholesterol,
cholesterol esters, cholesterol sulphate and ceramides (Lavrijsen, et al. 1994; Mac-
Mary, et al. 2004). Sometimes, the SC is divided further into two layers, the stratum
conjunctum and the stratum disjunctum, which consists of the last two to three loosely
bound cell layers.
From stem cell division and keratinocyte formation in the basal layer to terminal
differentiation and desquamation, it takes approximately four to six weeks (Marks et al.
2006). Two to four weeks until the cells reach the SC and another two weeks before the
unnoticeable shedding of individually corneocytes from the skin surface, called
desquamation (Houben et al. 2007).
The surface of the skin is usually covered with a hydrolipid film, composed of all the
SC’s components as well as secretions from sebaceous and sweat glands. This result in
an acidic pH at the skin surface that is known to regulate both epidermal permeability
(Hachem, et al. 2003) as well as enzyme activity required for cellular metabolism and
renewal (Williams, et al. 2005). Furthermore, this acidity contributes to the physical
barrier function of the skin as well as to the cutaneous antimicrobial protection,
mentioned above (Schmid-Wendtner and Korting 2006; Subedi, et al. 2009).
Interestingly, the pH appears that at least in certain areas of the skin to be gender
specific (Williams et al. 2005).
The epidermis is adjacent to the dermis which connects the former with the
subcutaneous tissue. The dermis is composed of a dense network of elastin and
collagen fibres, which provide the mechanical properties of the skin. Its average
thickness ranges from 3 mm to 5 mm. It is vasculated and interlaced, for example with
arrector pili muscle that move the hair but also lymph vessels, nerves and adnexa, and
its integrity is a prerequisite for epidermal keratinocyte self-renewal (Leary, et al. 1992).
Especially the blood vessels are crucial for the functions of the dermis, since they
ascertain the supply of nutrients and oxygen.
1.INTRODUCTION
5
Figure 1.1a: Anatomy of human skin Source WikiPedia (GNU Free Documentation License, Version 1.2)
Figure 1.1b: Epidermal layers Source WikiPedia (GNU Free Documentation License, Version 1.2)
Dermal papillae Rete
ridge
1.INTRODUCTION

1.INTRODUCTION
6
The dermis is subdivided into two layers, the upper, called papillary and the lower, the
reticular dermis. Both are characterised by the abundance of collagen, elastic fibres,
and extra fibrillar matrix, with the predominant cell types being fibroblasts and
macrophages. The papillary dermis is composed of fine and loosely arranged collagen
fibres and its dermal papillae undulate around the rete ridges of the epidermis. The
dermis is attached to the underlying subcutis, sometimes also referred to as hypodermis,
or subcutaneous connective tissue. The subcutis is predominantly populated by
fibroblasts, adipocytes, and macrophages and stores adipose tissue. Its physiological
functions include nutrient storage and thermal insulation.
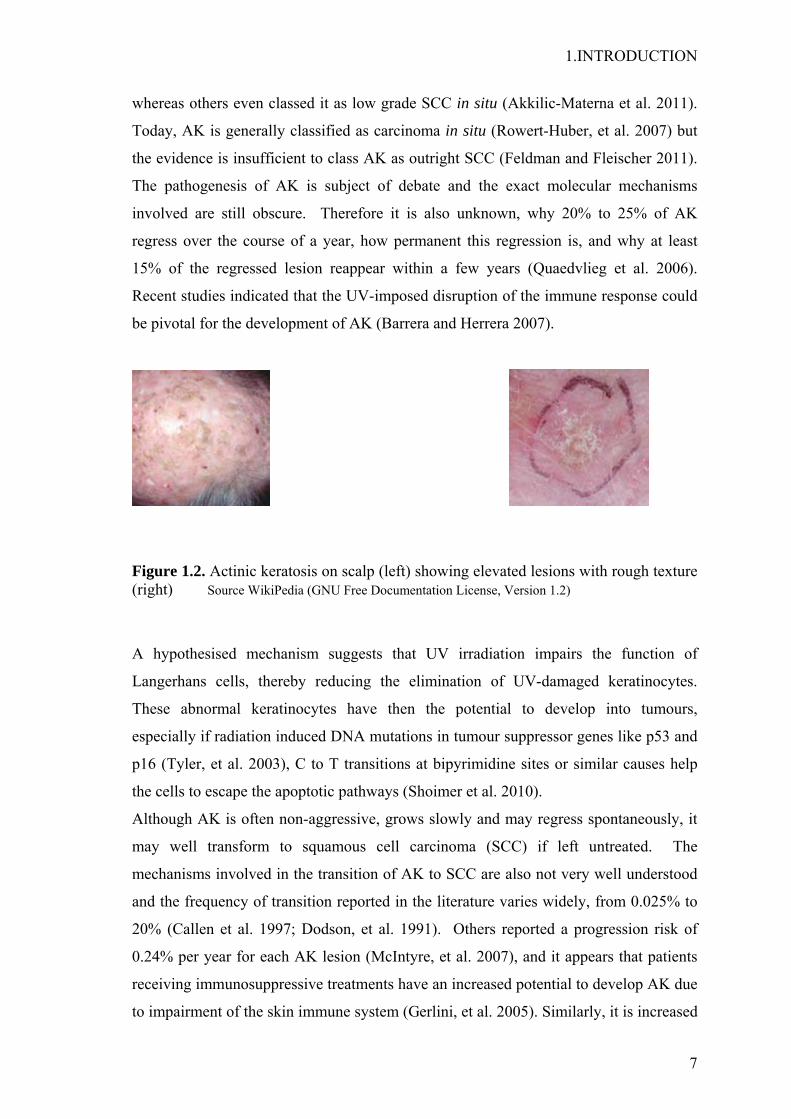
1.2 Actinic keratosis
Actinic keratosis (AK)( ICD-10: L57.0) (Fig. 1.2), also called solar keratosis, was long
considered a premalignant condition but is now generally regarded as early stage skin
carcinoma in situ (Feldman and Fleischer 2011) characterised by epidermal lesions of
transformed keratinocytes (Akkilic-Materna, et al. 2011; Callen, et al. 1997). These
epidermal neoplasms are often UV-induced and frequently occur in sun exposed areas
of the skin, particularly, the face, scalp, upper chest, shoulders and forearm (Silapunt, et
al. 2003). AK may appear as a single or multiple lesions and usually manifests as coarse
scaly patches with diameters commonly ranging from 1 mm to 2.5 cm. Early stages of
AK are subclinical and difficult to diagnose visually. Later on lesions can reach
substantially larger sizes, varying from normal pinkish flesh or skin colour to a more
heavily pigmented reddish brown tint and evolve into metastatic skin cancer if not
treated adequately. The characteristic abnormal cell differentiation, seen in actinic
keratosis, does not occupy the whole thickness of the epidermis, and does not reach
down hair follicles. In general, AK is asymptomatic but sometimes can cause a burning
sensation and erythema in skin areas exposed to sun light. AK is more prevalent in
males as well as people with fair skin (mainly Fitzpatrick skin type I or II) and the
incidence increases with age. It is the most common dermatological disease after acne
vulgaris and dermatitis and is a risk factor in the pathogenesis of non-melanoma skin
cancer (NMSC), especially squamous cell carcinoma (Ko 2010; Quaedvlieg, et al. 2006;
Shoimer, et al. 2010). Therefore AK was classed by some as precursor lesions to SCC,
1.INTRODUCTION
7
whereas others even classed it as low grade SCC in situ (Akkilic-Materna et al. 2011).
Today, AK is generally classified as carcinoma in situ (Rowert-Huber, et al. 2007) but
the evidence is insufficient to class AK as outright SCC (Feldman and Fleischer 2011).
The pathogenesis of AK is subject of debate and the exact molecular mechanisms
involved are still obscure. Therefore it is also unknown, why 20% to 25% of AK
regress over the course of a year, how permanent this regression is, and why at least
15% of the regressed lesion reappear within a few years (Quaedvlieg et al. 2006).
Recent studies indicated that the UV-imposed disruption of the immune response could
be pivotal for the development of AK (Barrera and Herrera 2007).
Figure 1.2. Actinic keratosis on scalp (left) showing elevated lesions with rough texture (right) Source WikiPedia (GNU Free Documentation License, Version 1.2)
A hypothesised mechanism suggests that UV irradiation impairs the function of
Langerhans cells, thereby reducing the elimination of UV-damaged keratinocytes.
These abnormal keratinocytes have then the potential to develop into tumours,
especially if radiation induced DNA mutations in tumour suppressor genes like p53 and
p16 (Tyler, et al. 2003), C to T transitions at bipyrimidine sites or similar causes help
the cells to escape the apoptotic pathways (Shoimer et al. 2010).
Although AK is often non-aggressive, grows slowly and may regress spontaneously, it
may well transform to squamous cell carcinoma (SCC) if left untreated. The
mechanisms involved in the transition of AK to SCC are also not very well understood
and the frequency of transition reported in the literature varies widely, from 0.025% to
20% (Callen et al. 1997; Dodson, et al. 1991). Others reported a progression risk of
0.24% per year for each AK lesion (McIntyre, et al. 2007), and it appears that patients
receiving immunosuppressive treatments have an increased potential to develop AK due
to impairment of the skin immune system (Gerlini, et al. 2005). Similarly, it is increased
1.INTRODUCTION
8
in the presence of risk factors like IDRBEU (induration/inflammation; diameter > 1cm;
rapid enlargement; bleeding; erythema; Ulceration) (Quaedvlieg et al. 2006).
The differences in the reported transition rates are probably due to the difficulty to
unambiguously enumerate AK lesions in severely sun damaged skin, and at times the
occasionally reported obstacles to clinically distinguish AK from SCC (Quaedvlieg et
al. 2006). Although the basis of these difficulties has been questioned recently (Ehrig, et
al. 2007; Ibrahim and Brown 2009), routine histological analysis of skin biopsies still
appears the only way to determine reliably whether a lesion is AK or an invasive SCC.
Although most AKs do not transform to SCC, there is a strong relation between SCC
occurrence and AK, with up to 60% of reported SCC cases having evolved from AK.
Most likely, SCC arises from large ulcerated, thickened AK lesions with diameters of
more than 1 cm.
Being the second most common reason for patients to visit a dermatologist (Spencer, et
al. 2005), AK has a prevalence of 6-26% in western populations and up to 40% in
Australia (Goldberg and Mamelak 2010; Quatresooz, et al. 2008) with about 20% of
untreated lesions developing into malignant SCC per year which has also become a
relevant cause of death in heart and kidney transplant receivers (Molina, et al. 2010).
Since it is currently difficult to predict which AK lesion will spontaneously regress and
which will progress to SCC, elimination of the lesions in the premalignant AK phase is
highly recommended to prevent progression into the more invasive disease (Merk 2007;
Quatresooz et al. 2008).

1.INTRODUCTION
9
1.3 Current treatment
Although the rate at which AK transforms to SCC remains unclear, it has been
estimated that within a 10 year timeframe, 6%-10% of patients with multiple AK
lesions will develop full scale SCC (Dodson et al. 1991). On the basis of such
mathematical estimations, it is reasonable to recommend the treatment of AK (Hensen,
et al. 2009; Muston, et al. 2009). Both, treatment for cosmetic purposes as well as
medical intervention to alleviate the symptoms of AK are frequently carried out.
Destructive and topical drug therapy are the two predominant options, with choice
depending on the nature of the lesion and the degree of diffusion, patient’s choice and
clinicians intuition (Ibrahim and Brown 2009; Stockfleth and Kerl 2006).
Destructive therapies: destructive therapies include cryotherapy, curettage and other
forms of surgery (Sellheyer and Bergfeld 2006). These procedures involve the
mechanical removal of lesions and are useful for single well-defined lesions. Simplicity
of the techniques, high speed and ambulatory application, the sufficient removal of the
cancerous tissue and reasonable efficacy are the main advantages (Schlaak, et al. 2011).
Cryotherapy is at present the most commonly used treatment for AKs. It is
reasonably efficient, inexpensive and hence cost effective (Silapunt et al. 2003). The
easiest way to apply liquid nitrogen is by spraying or using a cotton tip. Liquid
nitrogen has been reported to be highly effective in treating lesions residing in the
upper dermis with cure rates sometimes reaching up to 98% (Lubritz and Smolewski
1982; Szeimies, et al. 2002), although properly controlled studies are missing. The
downsides of cryosurgery include redness, blisters and pain during and after the
course of treatment. Cryosurgery is not standardised concerning frequency, duration,
intensity (Stockfleth and Kerl 2006) and not useful in the treatment of hyperkeratotic
lesions unless preceded by curettage (Silapunt et al. 2003).
Curettage is a scraping technique using a sharp curette to mechanically remove
abnormal tissue and thus it requires the use of local anaesthetics. It is currently the
best option for treating thick hyperkeratotic lesions and may be followed by electro-
surgery or cryotherapy to remove traces of abnormal tissues and to stop bleeding.
Similarly shave excision a slicing technique is used. It has the advantage of allowing
histological diagnosis (Stockfleth and Kerl 2006), but similar to cryosurgery and
curettage, it has side effects like scarring, hypo- or hyper-pigmentation and infection

1.INTRODUCTION
10
(McIntyre et al. 2007). AK excision is only rarely used, but the treatment of choice
on suspicion of invasive SCC or recurrence of lesions (Stockfleth and Kerl 2006).
Topical treatments: Despite the popularity of destructive treatment for AK, significant
therapeutic effects can be achieved by topical medication. It is especially useful for
patients with multiple lesions (>15) and the most convenient strategy to treat sub-
clinical and widely spread lesions, covering face, hands or shoulders, and where
cosmetic considerations are pivotal (Schlaak et al. 2011). Topical therapeutic options
include common anti-tumour agents as well as photosensitizers. There appears to be a
correlation between the position of the lesion and the response to topical treatment, with
facial lesions having the quickest response (McIntyre et al. 2007; Silapunt et al. 2003).
5 Fluorouracil (5-FU): the usefulness of 5-FU in treating AK was discovered by
coincidence, when it was observed that lesions healed more often than expected in
patients receiving 5-FU systemically. It is a pyrimidine analogue, which
competitively inhibits the enzyme thymidylate synthetase that catalyses reductive
methylation reaction of deoxyuridine monophosphate (dUMP) to deoxythymidine
monophosphate (dTMP) (Stockfleth and Kerl 2006), pivotal to DNA synthesis
(Longley, et al. 2003). The inhibition thus interferes with the normal cell cycle
progression hence 5-FU disrupts the growth of rapidly proliferating cells. Treatment
was reported to be reasonably effective for both apparent and subclinical lesions in
multiple areas, with clearance rates of around 50% and recurrence rates up to 55%
for localised disease (Gupta 2002; Stockfleth and Kerl 2006). Beside its therapeutic
use, 5-FU can also serves as a diagnostic tool, because it induces erythema in place
with subclinical lesions (Jorizzo 2004a; Jorizzo, et al. 2004b), yet in Europe this is an
experimental off-label use. Amongst other adverse drug reactions associated with the
intensive application of 5-FU, severe inflammation is frequently the most serious and
has limited its clinical use (Silapunt et al. 2003). However, if dihydropyrimidine
dehydrogenase deficiency exists, the side effects can include life-threatening
complications (Johnson, et al. 1999). Co-administration of topical steroids or pulse
therapy have been shown to reduce inflammation based adverse effects (Robins
2002; Stockfleth and Kerl 2006). Similarly, lowering the concentration applied in a
cream from 5% to 0.5% has been suggested to reduce irritation (Askew, et al. 2009;
Jorizzo, et al. 2004a). The application of 0.5% 5-FU prior to cryosurgery also
decreases the number of lesions as well as their recurrence (Gaspari 2007; Jorizzo, et
al. 2007). In large clinical trials, rates of complete cure were found to reach up to
1.INTRODUCTION
11
43% with 5-FU for both 5% cream and 0.5% 5-FU loaded to a microsponge (Jorizzo
2004a; Jorizzo 2004b). Being currently considered the golden standard for the
treatment of AK by dermatologists, 5-FU was used as reference drug in this work.
Imiquimod: Imiquimod 5% cream was originally approved as a topical treatment for
external anogenital warts (Gaspari 2007). It is an imidazoquinoline amine and acts as
immunomodulator through the activation of toll like receptor 7 (TLR7). Thereby it
stimulates the production of cytokines such as interferon (IFN)-α and tumour
necrosis factor (TNF)-α by innate immune cells (Novak, et al. 2008). Topical
application therefore results in localised cytokine induction followed by influx of
cell-mediated immune response associated immune cells and regression of viral
lesions (Gebauer, et al. 2009). These immunological effects, in conjunction with the
observations that patients with impaired cellular immunity are prone to develop AK
and cutaneous malignancies, prompted its evaluation as a topical treatment for AKs.
Imiquimod was found to be effective to treat both visible and subclinical lesions with
cure rates estimated to be between 45 % and 84% (Gebauer et al. 2009; Torres, et al.
2007) but is contraindicated in hyperkeratotic skin (Wilson 2010). Clinical studies in
other cutaneous conditions revealed that dosing frequency influences the safety and
efficacy profile of imiquimod (Gebauer et al. 2009). The main side effects, resulting
from 5% imiquimod therapy, are erythema, oedema, itching, dry skin and irritations.
Diclofenac sodium: the non-steroidal anti-inflammatory, diclofenac sodium,
interferes with the arachidonic acid pathway by inhibiting cyclooxygenases 1 and 2
(COX-I and COX-II) with relative equipotency (Gan 2010; Schlaak et al. 2011) but
has recently been suggested to have pharmacological effects on other targets, too
(Gan 2010). COX is well known to induce the synthesis of arachidonic acid
metabolites like prostaglandins that have a variety of biological actions. One of them,
the prostaglandin E 2 (PGE-2) has been shown to be a significant suppressor of the
immune system, leading to the formation of tumours (Kose, et al. 2008). Therefore it
is not surprising that high levels of COX have been correlated with tumour growth
(Ulrich and Stockfleth 2009). Diclofenac sodium is commonly used at a
concentration of 3% in 2.5% hyaluronan gel (Schlaak et al. 2011). In diclofenac 3%
gel, the role of hyaluronic acid is to provide a more sustained delivery of diclofenac
to the skin cells (Ulrich and Stockfleth 2009). Furthermore, it has been shown that it
binds to the CD44 receptor of keratinocytes which may lead to an increased
bioavailability of diclofenac within the epidermis, resulting in prolongation of its

1.INTRODUCTION
12
half-life (Ulrich and Stockfleth 2009; Wang, et al. 1992). Cure rates of about 50%
with diclofenac/hyaluronic acid have been reported (Merk 2007).
Retinoids: vitamin A analogues are sometimes employed for the chemo-prevention
of cancers, since they might prevent the transformation of keratinocytes (Khan, et al.
1993). Usually they are only used in combination with other therapies or to prevent
the progression from AK to full SCC. In one study, application of 0.5% tretinoin
reduced AK levels by 45% compared to 23% in a placebo group. Similarly one
placebo-controlled randomised study suggests systemic administration of etretinate
could reduces AKs by as much as 85% (Moriarty, et al. 1982). However, few studies
have looked at their efficacy in the treatment of basal cell carcinoma, and none has
demonstrated sufficient efficacy in the treatment of AK (Barrera and Herrera 2007;
Xu, et al. 2006), and therefore any retinoid use is still considered experimental and
off label.
Photodynamic therapy (PDT): Patients allergic to 5-FU can alternatively be treated
by PDT with the photosensitizer 5-aminolevulinic acid (5-ALA), commonly being
used in the concentration range 5-40%. Its methyl derivative, methyl aminolevulinate
too, is being used apparently interchangeably. 5-ALA is applied to the lesions and
covered for 14-16 hrs with light proof dressing. The lesions are then subjected to
visible light, preferably red light (640 nm) or blue light (400-450 nm). Hyper-
proliferating cells lack normal cell to cell adhesion and therefore are preferentially
penetrated by 5-ALA (Szeimies, et al. 2010) which brings about a phototoxic
reaction that kills the cancer cells where it is enzymatically converted into the
endogenous photosensitizer protoporphyrin IX (Juzeniene, et al. 2010). The
mechanism of action of PDT involves the formation of reactive oxygen species,
particularly singlet oxygen, which damage the vascular endothelium and induce
apoptosis. PDT provides acceptable cosmetic results and the treatment can readily be
repeated. However, the usefulness of PDT is often reduced by insufficient patient
compliance over the course of treatment and patients may experience burning
sensations, itching and stinging at the site of application. Other side effects include
erythema, oedema and crusting (Park, et al. 2009). Reported cure rates of AK lesions
are 64% with photodynamic therapy by 5-aminolaevulinic acid nanoemulsion
followed by red-light irradiation (Szeimies et al. 2010). When using methyl
aminolevulinate as photosensitizer for minor to moderate lesions, response rates can
be up to 91% (Quatresooz et al. 2008).

1.INTRODUCTION
13
Ingenol 3-angelate (Ig3-A): formerly known as PEP005 is a diterpene ester extracted
from Euphorbia peplus radium weed (figure 1.3). It is a protein kinase C (PKC)
agonist which eradicates tumour cells through a strong inflammatory reaction
involving PKC -mediated neutrophilic infiltrate (Ogbourne, et al. 2004). Ig3-A was
shown to traverse the epidermis with the aid of P-glycoprotein (P-gp) to reach the
dermis and there to cause damage to the tumour (Siller, et al. 2009). A phase II
clinical study with ingenol mebutate gel demonstrated complete clearance in 71% of
the patients with AK. Though the trial excluded immunosuppressed patients and
hyperkeratotic lesions, the outcome looks promising with respect to the short-course
therapy (Siller et al. 2009). Another randomised, double-blind, vehicle-controlled,
phase IIa study demonstrated that the applications of Ig3-A at variable concentrations
of up to 0.05% are safe and well tolerated. 0.05% showed the highest efficacy with
complete healing of at least four of five lesion treated, in 67% of the participants
(Anderson, et al. 2009).
Figure 1.3: Chemical structure of ingenol 3-angelate, the active ingredient in the sap of Euphorbia peplus

1.INTRODUCTION
14
1.4 Novel approaches and treatment options
Taken altogether, the treatment options currently available including, excision,
curettage and desiccation, cryotherapy, or topical treatments including, imiquimod,
photodynamic therapy, cox-1 / 2 inhibitors, chemical peels or 5-fluorouracil are neither
appropriate for all patients nor all types of AK lesions. Moreover they have the
limitations of poor tolerability or being cosmetically unacceptable with recurrence rates
varying for different treatments (Stockfleth 2009). Therefore new therapeutics options
with better tolerability and higher response are needed.
The links between DNA synthesis and skin cancer development have been under
investigation for nearly half a century (Bates, et al. 1968; Hennings, et al. 1968).
However, purposely interfering with DNA synthesis as an approach for the treatment of
AK or NMSC is a relatively novel concept and still under investigation (Gandhi, et al.
1997; Jiang, et al. 2000). Since DNA replication is a crucial part of cell proliferation,
hence AK development and tumour growth, a very early step of DNA synthesis and
replication, catalysed by polymerase-α, is therefore considered an interesting target
(McIntyre et al. 2007; Richartz, et al. 2008).
Based on recent findings by Richartz and co-workers (Richartz et al. 2008), a promising
set of potential DNA-polymerase-α inhibitors were developed by molecular modelling
and ligand docking (Zdrazil, et al. 2010).
Among a variety of modelled agents, the diphosphate form of the guanosine
phosphonate OxBu was predicted to be particularly active and selective for
polymerase-α because its di-phosphate form appeared to fit particularly well to the
binding site of the enzyme (Schwanke, et al. 2010). Since the phosphorylated form was
predicted to be too hydrophilic to penetrate the cells, a deposphorylated prodrug was
found to be synthesised more readily (Schwanke et al. 2010), and the activity of the
prodrug was investigated. Activation through kinases is expected to take place, once
taken up by the cell, resulting in the hypothesised antitumour activity. The results
obtained in vitro by Schwanke and colleagues (Schwanke et al. 2010) appear to support
the in silico findings and the assumptions made. They show that OxBu efficiently
reduces the viability of SCC25 (39% max inhibition), which is nearly equipotent to 5-
FU (41% max inhibition) the current gold treatment for actinic keratosis in vivo.

1.INTRODUCTION
15
However in comparison to the latter OxBu does not appear to have a deleterious effect
on NHK cells.
However, as becomes apparent from the chemical structure of both OxBu and OxHex
(figure 1.4), both compounds have molecular weights of >400 g/mol with log P values
of 1.36 and 2.34, hence their potential use is most probably dependent on suitable
carrier systems for dermal application.
N
N
N
N
NH
R1
R3
NH2
R2
Figure 1.4: Chemical structure of the novel guanosine phosphonate analogues OxBu and OxHex, (M = molecular weight, p = phosphonate)
Ligand M (g/ mol) logP R1 R2 R3
OxBu 436.41 1.36 OH OP CH3
OxHex 464.46 2.34 OH OP CH3

1.INTRODUCTION
16
1.5 Innovative carrier systems for dermal application
Interest in dermal drug delivery has been steadily growing in the last 20 years. Several
effects can be achieved by dermal administration of active compounds, since delivery
of actives may be locally (e.g. anti-infectives, corticosteroids, non steroidal anti-
inflammatory drugs) or systemically (e.g. nicotine batches), hence dermal application
does not equate to local treatment. Various factors determine the drug’s percutaneous
absorption, including physico-chemical characteristics, dissolution velocity, partition
coefficient and molecular weight (Guy and Hadgraft 1983; Potts and Guy 1992).
Another important factor to consider is the carrier system itself since it interacts with
human stratum corneum, thereby affecting its barrier function and the penetration of
the drug. Furthermore, the carrier system can determine the drug’s release from the
formulation and hence influence its kinetics and dynamics. Several constrains, ranging
from low uptake to severe systemic side effects have been reported with the use of
conventional topical formulations. Therefore, there is a strong need for novel carrier
system that enhance drug delivery to the target site and allowing skin penetration
(Choi and Shin 2007). Several dosage forms, like emulsions, microemulsions,
liposomes and nanosuspensions have been intensively studied for their permeation
enhancement of pharmacologically active compounds. (Cosco, et al. 2008; Pardeike,
et al. 2009; Rao, et al. 2004; Santos, et al. 2008) . Since their invention in the early
1990’s (Müller, et al. 1995; Souto, et al. 2004b), solid lipid nanoparticles (SLN) have
also been studied by many research groups as potential carrier or drug delivery system
for oral, nasal, ocular, rectal and topical routes, especially for poorly water-soluble
drugs (Almeida and Souto 2007; Kipp 2004; Souto and Müller 2010).
Among their advantages over other colloidal carriers, SLN can provide high drug
encapsulation capacity, increased chemical protection of labile compounds, long term
physical stability, controlled drug release characteristics and improved bioavailability
(Alhaj, et al. 2008; Sanna, et al. 2007). Additionally, widely available, conventional
manufacturing methods and raw materials used in emulsions production can be
employed for their large-scale production, thereby reducing processing cost (Bummer
2004; Mehnert and Mader 2001; Müller, et al. 2002). In the following study, a solid
lipid nanoparticles preparation was adapted and optimised as carrier system for the
novel guanosine phosphonate analogue OxBu (and to a lesser degree for OxHex).

1.INTRODUCTION
17
Based on the results obtained during the course of the work, it was decided to focus on
OxBu, since it is easier to synthesise and more selective than OxHex.
1.6 Human skin equivalent for the evaluation of therapeutic options
An important prerequisite for the development of new anti cancer therapeutics is a
better understanding of the basic principles of tumour growth. Current in vitro
approaches are based on monolayer cell culture, while conventional in vivo models are
based on genetic, chemical or mechanical induction of carcinogenesis in mice
(Atillasoy, et al. 1997). Most refined alternative approaches to animal experiments are
based on human skin equivalent (HSE) (Schäfer-Korting, et al. 2008; Schäfer-Korting,
et al. 2006) which have the advantage of exposing different cell types to a micro-
environment that more closely reflects the in vivo situation. However the drug
permeability of most HSE is still much higher than that of human or pig skin, the
commonly used alternative (Schäfer-Korting et al. 2008), an observation that might be
related to insufficient epidermal differentiation and in particular the structure of the
stratum corneum.
The development of in vitro squamous carcinoma model allows better understanding of
the SCC pathogenesis and paves the way for screening of new treatment options
(Commandeur, et al. 2009; Höller-Obrigkeit, et al. 2009). Three dimensional tumour
constructs were developed as in vitro models by Höller and colleagues, the models
proved to be useful in assessing the response to PDT using immunohistochemical
approach. In the following work, building on the previously described method (Höller-
Obrigkeit et al. 2009), three dimensional (3D) tumour constructs were adapted and
optimised for the evaluation of the pharmacodynamics of OxBu and the effect of the
employed carrier system.

1.INTRODUCTION
18
1.7 Tumour biomarkers
For the evaluation of therapeutic efficacy rapidly detectable markers of tumour cell
death are crucial. In vitro studies demonstrate that tumour cells undergoing apoptosis
can release cellular components into the cell culture media such as cytochrome c,
nucleosomes and cleaved cytokeratin 18 (Beachy and Repasky 2008). Several
immunomarkers have been shown to be useful as diagnostic tools for different types of
epithelial skin tumours. Among the most commonly used is Ki-67, a nuclear
proliferation marker mainly used by pathologists for the differentiation between benign
and malignant tumours (Sanders and Carr 2007).
Another interesting tumour marker is p53, a cellular protein that plays an essential role
in regulating the cell cycle and the cellular response to certain environmental and/or
genotoxic stresses. Under normal growth conditions, p53 is a short-lived protein and is
expressed at relatively low basal levels within the cell. In response to various cellular
stresses, including exposure to DNA-damaging agents, UV irradiation, hypoxia, and
nucleotide depletion, p53 is rapidly induced and functions as a transcriptional activator
(Ju, et al. 2007). In vivo studies have reported the overexpression of p53 in patients with
sun damaged skin, solar keratosis and SCC (Barzilai, et al. 2007; Gibson, et al. 1997).
Since DNA damage is caused either directly or indirectly during treatment with
radiotherapy and chemotherapy, p53 was considered as one of the most important
markers indicating response to therapy and several studies were conducted aiming to
correlate the response to treatment with p53 expression (Partridge, et al. 2007).
However, some of these studies showed conflicting results (Partridge, et al. 2005). A
study by Cabelguenne and colleagues (Cabelguenne, et al. 2000) had suggested that the
presence of p53 mutation is associated with a lower response to chemotherapy. Other
studies have reported that tumours overexpressing p53 were more responsive to
cisplatin than those which did not express it (Bradford, et al. 2003). It is therefore very
likely that p53 influences drug response and indicates tumour activity in a genotype-
specific manner (Sangster-Guity, et al. 2011).
A further intriguing marker in SCC development and progression is AxL, a
transmembrane tyrosine kinase which plays a role in cell survival, and chemotaxis
(Green, et al. 2006) and has been shown to be upregulated in SCC derived cells.
Recently, cytokeratins (CK), a protein family belonging to the intermediate filaments,
1.INTRODUCTION
19
appear particularly useful tools for the monitoring of carcinomas and disease
progression (Barak, et al. 2004).
Simple epithelia specific CKs like CK8, CK18, and CK19 are currently most frequently
employed CK markers in clinical use so far (Prados, et al. 2000; Sliwowska, et al.
2006). Cytokeratin 18 (CK18) is cleaved by caspases at two distinct sites (Asp238 and
Asp396) during apoptosis. Cleavage after Asp396 leads to exposure of the M30
neoepitope (CK18-Asp396) which is detected by the M30- ELISA assay. This product
of caspase-mediated cleavage during apoptotic cell death was reported to be present in
cancerous but not normal cells (Leers, et al. 1999).
Total soluble full-length CK18 and soluble COOH-terminal fragments are measured
with the M65-ELISA assay. As shown in table 1.1, several in vitro (Hagg, et al. 2002;
Kramer, et al. 2004; Schutte, et al. 2004; Thurnher, et al. 2003) and in vivo studies
(Ausch, et al. 2009a; Biven, et al. 2003; Brandt, et al. 2010; de Haas, et al. 2008;
Linder, et al. 2004; Scott, et al. 2009; Yaman, et al. 2010) demonstrated the potential
significance of measuring the ratio of circulating full length cytokeratin 18 (CK18) to its
caspase-cleaved fragment (CK18-Asp 396) as a prognostic and predictive tool as well
as to monitor response to chemotherapy. In this work, aiming for a sensitive testing
procedure, commercially available ELISA kits M30 Apoptosense and M65 served to
measure extracellular and intracellular CK18-Asp396 and total soluble CK18 in the
medium of 3D tumour skin models respectively, in response to topical application of
different treatments.

1.INTRODUCTION
20
Table 1.1: Reported findings on the in vitro and in vivo use of CK18 (M65) and CK18-Asp 396 (M30) as prognostic tumour markers
In vitro Model Reported findings Reference Human breast epithelial cells
Dose dependent increase in the amount of CK18-Asp396 in cells treated with cisplatin and paclitaxel.
(Hagg et al. 2002)
Human head and neck squamous cell carcinoma of the tongue
Betulinic acid induces CK18-Asp396 over 72 hrs in dose dependent manner.
(Thurnher et al. 2003)
Human breast epithelial cells
Increases in soluble CK18 with 85% comprising CK18 –Asp396, observed in culture medium at 24 and 48 h after treatment with 50 µM cisplatin
(Kramer et al. 2004)
HCT116 colon cancer cells and MDA-MB-231 breast cancer cells
Drugs inducing rapid CK18 cleavage have mechanisms of actions distinct from conventional genotoxic and microtubule-targeting agents.
(Biven et al. 2003)
In vivo Model Reported findings Reference Breast cancer patients Sera (n=14)
Increase in CK18-Asp396 level by 50% in 57% of responsive patients treated with cyclophosphamide/ epirubicin/ 5-FU or docetaxel.
(Biven et al. 2003)
Prostate and breast cancer patients
Analysis of different CK18 forms in patient sera suggested that tumour apoptosis may not be the dominating death mode in many tumours in vivo.
(Linder et al. 2004)
Ovarian cancer patients receiving carboplatin (n=15)
M30, M65, and qRT-PCR as biomarkers in clinical trials of anticancer agents which induce tumour apoptosis/ necrosis.
(Cummings, et al. 2006)
Patients with disseminated testicular germ cell cancer (TC) (n=34)
M65 and M30 levels reflect chemotherapy-induced changes that correlate with changes in markers routinely used in clinic.
(de Haas et al. 2008)
Gastrointestinal carcinoma patients (n=35)
Increase in CK18-Asp396 level in patient with partial or stable disease in response to 5-FU/leucovorin based therapy.
(Brandt et al. 2010)
Gastric carcinoma patients (n=32)
Serum M65 and M30 levels were elevated in patients with advanced gastric carcinoma patients. M30 levels can be helpful to predict tumour load and also survival.
(Yaman et al. 2010)

1.INTRODUCTION
21
1.8 Aim of the thesis
The aim of the work presented here was to optimise and characterise a nanocarrier
system for OxBu and OxHex and to determine its long-term stability, both loaded and
unloaded. In order to enable the detection of the novel drugs and their predicted active
metabolites, it was envisaged to optimise and validate an analytical method. Since
during the course of the work, OxBu emerged as the most promising candidate, it
became the main focus of this work.
For the second part of the work, the main aim was to evaluate the therapeutic efficacy of
OxBu and the employed carrier system in a three dimensional non melanoma skin
tumour model.

2 MATERIALS

2. MATERIALS
23
2.1 Technical devices
Technical Device Company
Autoclave, Tuttaner-system sterilizer 2540ELV Guwina-Hofmann, Berlin
Cell counter (0.0025 mm² / 0.1 mm), Neubauer VWR, Darmstadt
Cell dispenser VWR, Darmstadt
Centrifuge Eppendorf 5415D Eppendorf, Hamburg
Centrifuge Megafuge 1.0R Heraeus, Hamburg
Centrifuge tubes (15 and 50 ml) Sarstedt, Nümbrecht
CryoTube™ vials Nunc, Wiesbaden
Digital microscope, BZ-8000 Keyence, Neu-Isenburg
EmulsiFlex-C5 Avestin, Mannheim
Filtration system Millipore® Millipore, Schwalbach
Filtropur S 0.2 µm Sarstedt, Nümbrecht
Flasks, tissue cell culture (75 cm2) TPP, Trasadingen, Switzerland
FLUOstar Optima BMG Labtech, Offenburg
Frigocut 2800 N Leica, Bensheim
High speed stirrer IKA®-Werke, Staufen
Incubator BB 6220 Heraeus, Hanau
Incubator shaker New Brunswick Scientific, New Brunswick, USA
Inserts (for skin models; pore size 0.4 µm) Falcon, Heidelberg
Lamin Air–sterile working bench HB2472 Heraeus, Hanau

2. MATERIALS
24
Magnetic agitator IKAMAG® RCT Janke & Kunkel, Staufen
Mastersizer 2000 Malvern Instruments, UK
Pasteur pipettes Carl Roth, Karlsruhe
Phase contrast inverted microscope, Axiovert 135 Carl-Zeiss, Jena
pH-Meter 766 Calimatec Knick, Nürnberg
Pipettes, TPP serological (5, 10 and 25 ml) TPP, Trasadingen, Switzerland
Plates, ELISA (96-wells) Greiner, Frickenhausen
Plates, tissue culture (6-deep wells) VWR, Darmstadt
Scalpel, disposable Feather, Osaka, Japan
Scanning electron microscope Zeiss, Oberkochen
Slides, microscope Carl Roth, Karlsruhe
Standard power pack P25 Biometra, Göttingen
Syringe (5 and 20 ml) Carl Roth, Karlsruhe
Teflon rings Physics Department, FU-Berlin
Tips, pipette (10, 100, 1000 µl) Sarstedt, Nümbrecht
Ultra sonic bath Sonorex® RK 100 Bandelin, Berlin
Ultra Turrax T25 Janke and Kunkel, Staufen
Vacuum set Vacuboy®Integra Biosciences, Fernwald
Vortex Heidolph, Kellheim
Water bath DC3/W26 Haake, Karlsruhe
Zetasizer Nano ZS Malvern Instruments, Malvern, UK

2. MATERIALS
25
2.2 Chemicals and reagents
Chemicals and Reagents Company
Adenine HCl Sigma Aldrich, Steinheim
Amphotericin B PAA Laboratories, Cölbe
Apifil Gattefossé, Saint-Priest, France
Aprotinin Sigma- Aldrich, Steinheim
Ascorbic acid Merck, Darmstadt
Axl C20, goat polyclonal Santa Cruz, Heidelberg
Beeswax Claude Cosmetics, Köln
Calcium chloride Sigma Aldrich, Steinheim
Carbopol 940 Goldschmidt, Essen
Carmullose sodium Caleo, Hilden
Cetyl palmitate 15 Fagron, Brabüttel
Chloric acid (HCl) Sigma Aldrich, Steinheim
Choleratoxin Sigma Aldrich, Steinheim
Cleaved caspase-7, Asp198 New England Biolab, Frankfurt
Collagen G Biochrom, Berlin
Compritol® 888 ATO (glyceryl behenate) Gattefossé, Saint-Priest, France
Cryomold standard/intermediate SakuraFineteck, Torrance, USA
Dako diluent medium Dako, Hamburg
Dimethylsulfoxide (DMSO) VWR, Darmstadt
Di-sodium hydrogen phosphate (Na2HPO4) Carl Roth, Karlsruhe
DMEM (10x) Biochrom, Berlin
DMEM/ F-12 (Ham) Gibco, Darmstadt

2. MATERIALS
26
DMEM+ GlutaMax Gibco, Darmstadt
Donkey anti-goat IgG-FITC Santa Cruz, Heidelberg
Dulbecco ́s modified Eagle`s medium (DMEM) Sigma-Aldrich, Steinheim
EGF (epidermal growth factor) Gibco, Darmstadt
Eosin Y solution 1% in water Carl Roth, Karlsruhe
Ethanol, 96% Carl Roth, Karlsruhe
Ethanol, absolute VWR, Darmstadt
Ethylendiamin tetraacetic acid (EDTA) Carl Roth, Karlsruhe
Foetal calf serum Biochrom, Berlin
Gelucire® 44/14 Gattefossé, Saint-Priest, France
Gelucire® 50/13 Gattefossé, Saint-Priest, France
Gentamycin Gibco, Darmstadt
Glycerin Caelo, Hilden
Goat anti-mouse IgG (H+L) - Chromeo 488 Abcam, Cambridge, UK
Goat anti-rabbit IgG (H+L) - Chromeo 494 Abcam, Cambridge, UK
Haematoxylin solution Carl Roth, Karlsruhe
Human total p53 DuoSet IC R&D Systems, Wiesbaden
Hydrocortisone Biochrom, Berlin
Hydrogen peroxide (H2O2), 30% Carl Roth, Karlsruhe
Immunoselect antifading mounting medium DAPI Dako, Hamburg
Insulin (human) Roche Diagnostic, Mannheim
Isopropanol, ≥99% Sigma-Aldrich, Steinheim
Keratinocyte basal medium (KBM) Lonza, Walkersville, USA
Ki-67, goat polyclonal Abcam, Cambridge, UK
Labrafac™ PG Gattefossé, Saint-Priest, France

2. MATERIALS
27
Labrafil® M 1944 CS Gattefossé, Saint-Priest, France
Labrafil® M 2125 CS Gattefossé, Saint-Priest, France
Labrafil® M 2130 CS Gattefossé, Saint-Priest, France
Labrasol® Gattefossé, Saint-Priest, France
Lanette N Caelo, Hilden
Lauroglycol™ 90 Gattefossé, Saint-Priest, France
Leupeptin Sigma Aldrich, Steinheim
M30-Apoptosense® Enzo Life Science, Lausen, CH
M65® ELISA Enzo Life Science, Lausen, CH
Methanol (HPLC grade) VWR, Darmstadt
MMP2, rabbit polyclonal Abcam, Cambridge, UK
Mouse monoclonal to acidic Cytokeratin Abcam, Cambridge, UK
NEAA (non essential amino acids) Gibco, Darmstadt
Newborn calf serum Biochrom, Berlin
OxBu Chiracon, Luckenwalde
OxHex Chiracon, Luckenwalde
Parafilm© M Carl Roth, Karlsruhe
Penicillin streptomycin (100I.U/ml; 100µg/ml) Gibco, Darmstadt
Pepstatin Sigma- Aldrich, Steinheim
Plurol® Oleique CC 497 Gattefossé, Saint-Priest, France
Poloxamer 188 (Lutrol® F68) BSAF, New Jersey, USA
Propylene glycol caprylate Gattefossé, Saint-Priest, France
Propylene glycol monocaprylate Gattefossé, Saint-Priest, France
Propylene glycol Caelo, Hilden
Roti® Histofix Carl Roth, Karlsruhe

2. MATERIALS
28
Rotihistol Carl Roth, Karlsruhe
Sodium azide Carl Roth, Karlsruhe
Sodium chloride VWR, Darmstadt
Sodium dihydrogen phosphate Carl Roth, Karlsruhe
Sodium dodecyl sulfate Sigma-Aldrich, Steinheim
Sodium hydroxide Sigma-Aldrich, Steinheim
Sulfuric acid, 96% VWR, Darmstadt
Transcutol® P Gattefossé, Saint-Priest, France
Transferrin Promo Cell, Heidelberg
Triiodothyronin Sigma-Aldrich, Steinheim
Triton X-100 Carl Roth, Karlsruhe
Trypan blue stain, 0.4% Gibco, Darmstadt
Trypsin Biochrom, Berlin
Tween© 20 (Polysorbate 20) Carl Roth, Karlsruhe
Tween© 80 (Polysorbate 80) Sigma - Adrich, Steinheim
Tylose H 10000 (Hydroyethylcellulose) Hoechst, Frankfurt
Tylose H 3000 (Hydroyethylcellulose) Hoechst, Frankfurt
Witepsol (W32, W45) Sasol, Witten

2. MATERIALS
29
2.3 Primary cells and cell lines for cell culture
Cell Lines Description Source
SCC 12 Head and neck squamous skin carcinoma
Department of Dermatology and Allergology, RWTH Aachen
SCC 25 Tongue squamous carcinoma LGC, Promochem, Wesel
Primary Cells Description Source Keratinocytes Normal human keratinocytes Isolated from human
foreskin obtained locally from a hospital, Berlin
Fibroblasts Normal human fibroblasts Isolated from human foreskin obtained locally from a hospital, Berlin

2. MATERIALS
30
2.4 Culture media and solutions
Transport medium
DMEM 1 U/ml penicillin 1 µg/ml streptomycin
Fibroblasts basal medium (FBM)
DMEM 2 mM L-glutamine 100µg/ml streptomycin 100IU/ml penicillin
Fibroblasts growth medium (FGM) DMEM 7.5% (v/v) foetal calf serum (FCS) 2 mM L-glutamine
Keratinocyte basal medium (KBM)
KBM
Keratinocyte growth medium (KGM) KBM 30 µg/ml BPE 0.1 ng/ml hEGF 0.5 µg/ml hydrocortisone 5 µg/ml insulin
SCC basal medium DMEM- Nut Mix F-12 1 U/ml penicillin 1 µg/ml streptomycin
SCC growth medium DMEM- Nut Mix F-12 1 U/ml penicillin 1 µg/ml streptomycin 10% foetal calf serum
Stop Medium
DMEM 10% (v/v) foetal calf serum 2 mM L-glutamine
Trypsin-EDTA
1.67% trypsin 0.67% EDTA in PBS
All cell culture media and solutions were stored at 2-8°C.

2. MATERIALS
31
Medium for 3D tumour constructs
X- medium (for submerged culture phase) X+ medium (for air liquid interface)
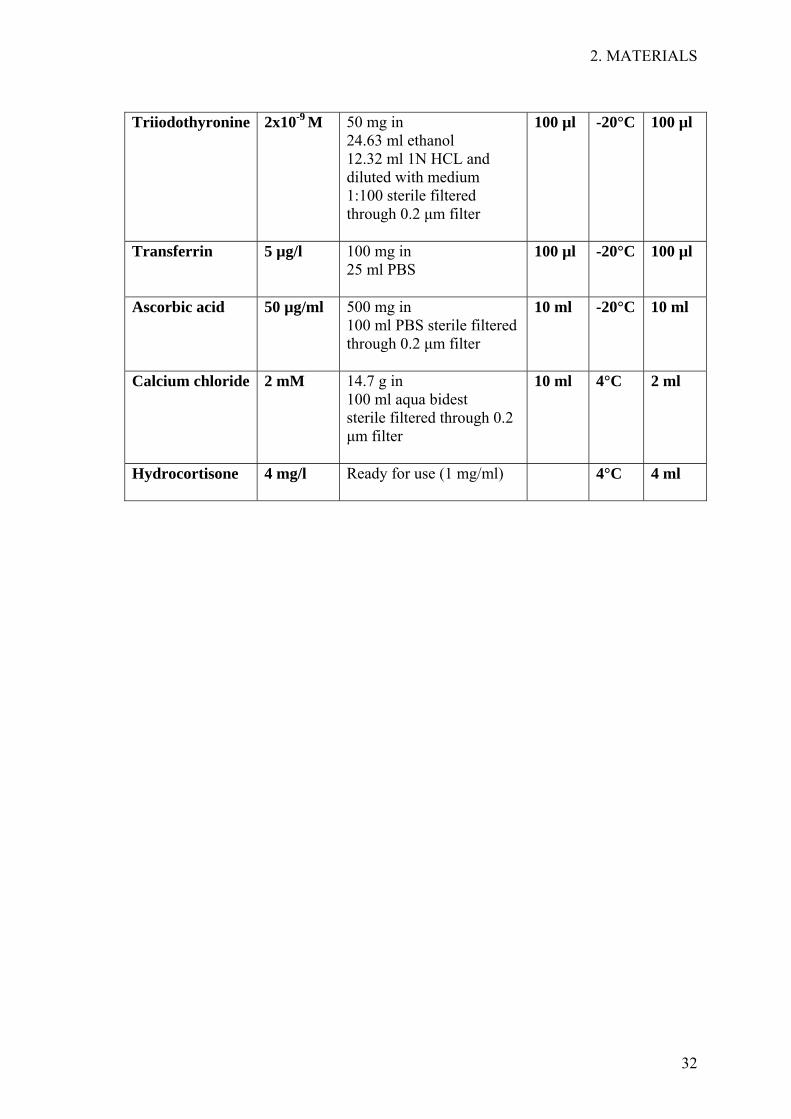
DMEM high glucose/ DMEM- Nut Mix F-12 (1:1) 1.8x10⁻⁴ M adenine HCl 0.25 µg/ml amphotericin B 10-10 M choler atoxin 50 µg/ml gentamicin 5 mg/l insulin 10 µg/l EGF 0.5% NEAA 1% penicillin/streptomycin 10% newborn calf serum 2x10⁻⁹ M triiodothyronine 5 µg/l transferrin 4 mg/l hydrocortisone 50 µg/ml ascorbic acid, 2 mM calcium chloride (added additionally to the above)
Supplement End conc in medium
Preparation Aliquots Storage Volume on 1 L medium
Adenine HCl 1.8x10⁻⁴ M 155 mg adenine in (10 ml 0,1N HCL + 40 ml PBS) sterile filtered through 0.2 µm filter
100 µl -20°C 100 µl
Amphotericin B
0.25 µg/ml Ready for use
1000 µl -20°C 1000 µl
Choleratoxin 100 µg/l 1 mg in 10 ml PBS
1000 µl 4°C 1000 µl
Gentamicin 50 µg/ml Ready for use
RT 1000 µl
Insulin 5 mg/l 10 mg in 10 ml 0,01N HCL sterile filtered through 0.2 µm filter
500 µl -20°C 500 µl
EGF 10 µg/l 100 µg in 10 ml PBS
1000 µl -20°C 1000 µl
NEAA 0.5% Ready for use
5 ml 4°C 5 ml
Pen /Strep 1% Ready for use
10 ml -20°C 10 ml
Serum 10% Ready for use
100 ml -20°C 100 ml
2. MATERIALS
32
Triiodothyronine 2x10⁻⁹ M 50 mg in
24.63 ml ethanol 12.32 ml 1N HCL and diluted with medium 1:100 sterile filtered through 0.2 µm filter
100 µl -20°C 100 µl
Transferrin 5 µg/l 100 mg in 25 ml PBS
100 µl -20°C 100 µl
Ascorbic acid 50 µg/ml 500 mg in 100 ml PBS sterile filtered through 0.2 µm filter
10 ml -20°C 10 ml
Calcium chloride 2 mM 14.7 g in 100 ml aqua bidest sterile filtered through 0.2 µm filter
10 ml 4°C 2 ml
Hydrocortisone 4 mg/l Ready for use (1 mg/ml)
4°C 4 ml
2. MATERIALS
33
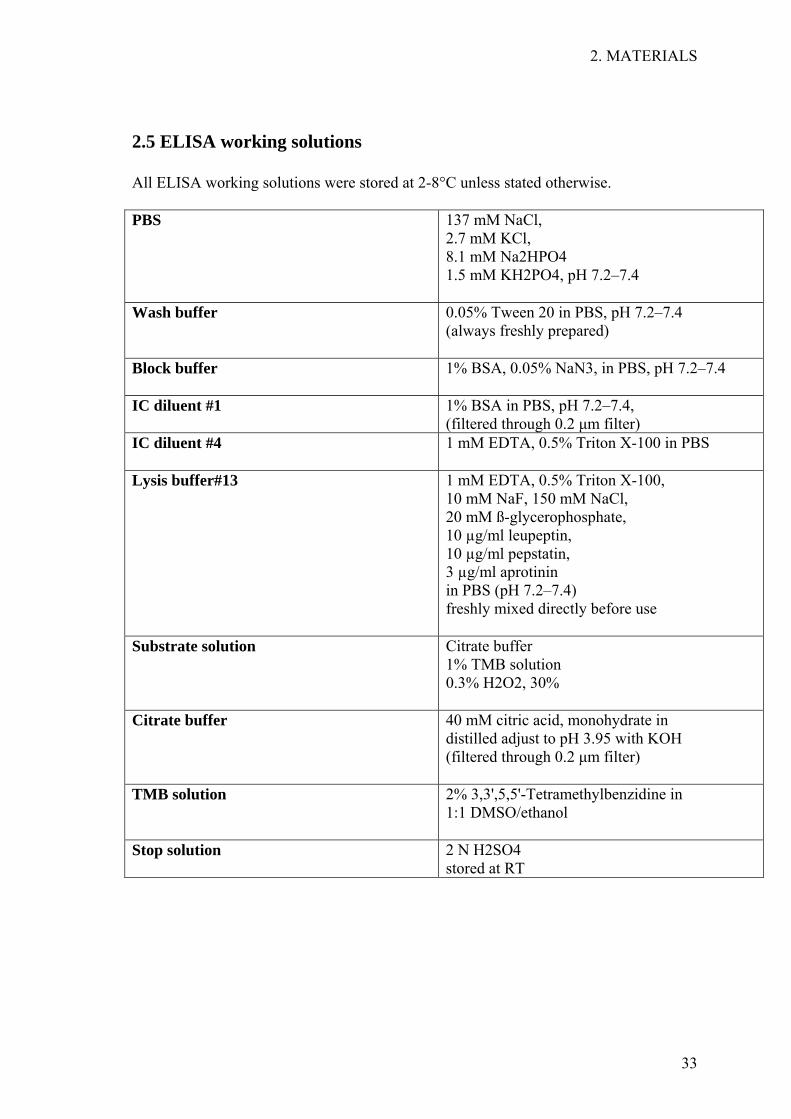
2.5 ELISA working solutions
All ELISA working solutions were stored at 2-8°C unless stated otherwise.
PBS 137 mM NaCl, 2.7 mM KCl, 8.1 mM Na2HPO4 1.5 mM KH2PO4, pH 7.2–7.4
Wash buffer 0.05% Tween 20 in PBS, pH 7.2–7.4 (always freshly prepared)
Block buffer 1% BSA, 0.05% NaN3, in PBS, pH 7.2–7.4
IC diluent #1 1% BSA in PBS, pH 7.2–7.4, (filtered through 0.2 µm filter)
IC diluent #4 1 mM EDTA, 0.5% Triton X-100 in PBS
Lysis buffer#13 1 mM EDTA, 0.5% Triton X-100, 10 mM NaF, 150 mM NaCl, 20 mM ß-glycerophosphate, 10 µg/ml leupeptin, 10 µg/ml pepstatin, 3 µg/ml aprotinin in PBS (pH 7.2–7.4) freshly mixed directly before use
Substrate solution Citrate buffer 1% TMB solution 0.3% H2O2, 30%
Citrate buffer 40 mM citric acid, monohydrate in distilled adjust to pH 3.95 with KOH (filtered through 0.2 µm filter)
TMB solution 2% 3,3',5,5'-Tetramethylbenzidine in 1:1 DMSO/ethanol
Stop solution
2 N H2SO4 stored at RT
2. MATERIALS
34
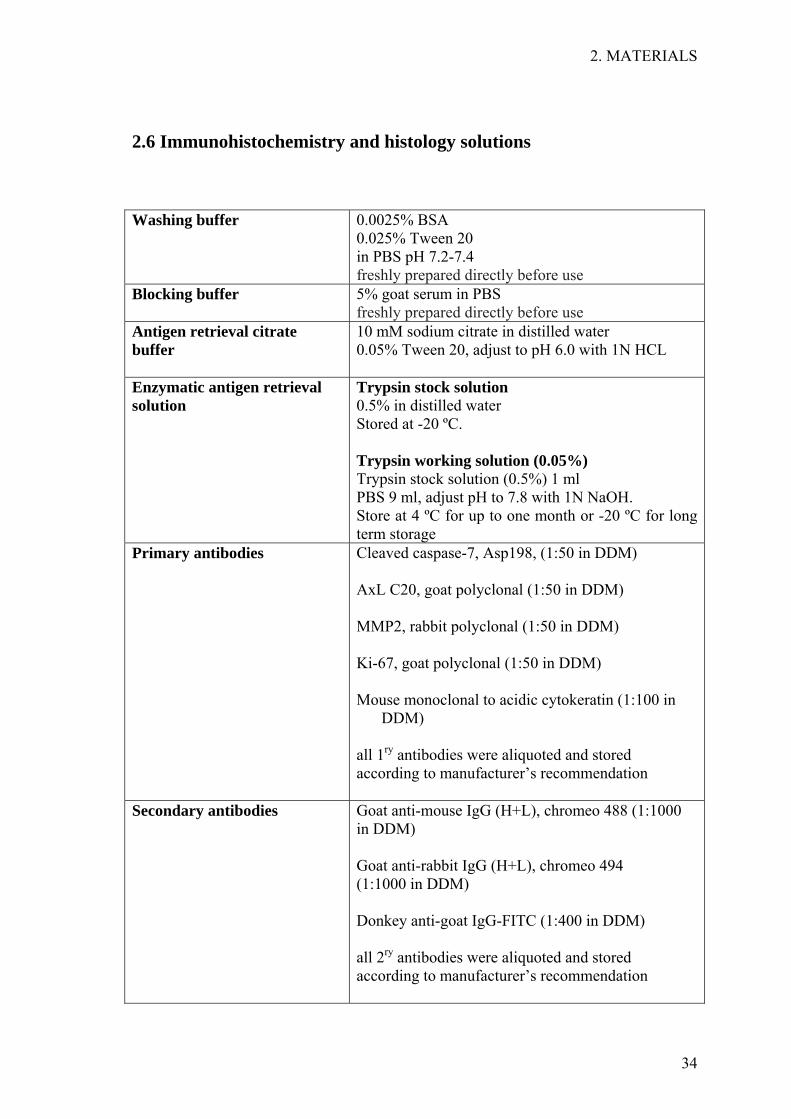
2.6 Immunohistochemistry and histology solutions
Washing buffer
0.0025% BSA 0.025% Tween 20 in PBS pH 7.2-7.4 freshly prepared directly before use
Blocking buffer
5% goat serum in PBS freshly prepared directly before use
Antigen retrieval citrate buffer
10 mM sodium citrate in distilled water 0.05% Tween 20, adjust to pH 6.0 with 1N HCL
Enzymatic antigen retrieval solution
Trypsin stock solution 0.5% in distilled water Stored at -20 ºC. Trypsin working solution (0.05%) Trypsin stock solution (0.5%) 1 ml PBS 9 ml, adjust pH to 7.8 with 1N NaOH. Store at 4 ºC for up to one month or -20 ºC for long term storage
Primary antibodies
Cleaved caspase-7, Asp198, (1:50 in DDM) AxL C20, goat polyclonal (1:50 in DDM) MMP2, rabbit polyclonal (1:50 in DDM) Ki-67, goat polyclonal (1:50 in DDM) Mouse monoclonal to acidic cytokeratin (1:100 in
DDM) all 1ry antibodies were aliquoted and stored according to manufacturer’s recommendation
Secondary antibodies Goat anti-mouse IgG (H+L), chromeo 488 (1:1000 in DDM) Goat anti-rabbit IgG (H+L), chromeo 494 (1:1000 in DDM) Donkey anti-goat IgG-FITC (1:400 in DDM) all 2ry antibodies were aliquoted and stored according to manufacturer’s recommendation

3 METHODS
3. METHODS
36
3.1 Development and validation of HPLC method
3.1.1 HPLC Method
For the analysis of OxBu and OxHex, a Merck Hitachi HPLC system, consisting of
Autosampler AS-2000A, Interface D 6000, Pump L-6200, UV-Detector L-4000A
linked to a LiChroCART® 250-4 Purospher® STAR RP-18 (pH-stable: 1.5–10.5)
column and a LiChroCART 4-4 precolumn were used. The system was controlled by
and all data were transferred to a PC, running the D-7000 HSM Software. The injected
sample size was 50 µl, UV detection was set to 275 nm. A mobile phase gradient (see
Table 3.1) was run with a flow rate of 1.5 ml/min. It consisted of methanol (HPLC
grade) and buffer solution consisting of 7% acetonitrile in 10 mM KH2PO4, 2 mM
(Bu4)N+Cl- adjusted to pH 6 with NaOH (1N). The mobile phase was filtered under
vacuum and degassed for 15 min immediately before use.
Table 3.1: gradient used for the chromatography of OxBu/ OxHex
Time (min) Procedure Buffer: Methanol
0-44 adjusting 90:10
45-60 maintaining 25:75
61-69 adjusting 25:75
70-80 maintaining 90:10
3.1.2 Sample preparation
A stock solution of OxBu or OxHex was prepared by dissolving 5-10 mg of the powder
in DMSO to reach a concentration of 2x10⁻² M, with the DMSO volume always being
adjusted to the amount of substance. Serial dilutions in the same buffer used for the
mobile phase were then prepared and spiked with 3 µl 3x10⁻⁵ M adefovir as internal
standard.

3. METHODS
37
3.1.3 HPLC method validation
Linearity, was investigated by measuring 7 different concentrations of the test
substance. Each point was calculated as the average of three sample injections.
Calibration curve was obtained by plotting the calculating area under the peak of the
tested substance versus the concentration in µg/ml, resulting in a calibration curve.
Using linear regression analysis, the linearity was determined as described in the ICH
guidelines (ICH 2005).
Specificity, is the ability to measure the test substance in complex matrices or the
presence of other compounds, was determined by analysing OxBu or OxHex in the
presence of guanosine and its mono-, di-, and tri-phosphate derivatives.
Detection and Quantification Limits, the lowest level at which a substance can be
detected or quantified (LoD) or quantified (LoQ) were deduced from data of the
standard curve. LoD was calculated from the standard deviation (SD) of the y intercept
of the regression line and the slope of the calibration curve as described (ICH 2005).
LoQ, the lowest amount of the test substance in a sample which can be quantified with
certain accuracy and precision, was determined as described in the (ICH 2005).
Accuracy, was calculated as described (ICH 2005). For high and medium range
concentrations, deviations of 15% were considered acceptable, for low concentrations
the limit was increased up to 20% (Machnik, et al. 2007).
Precision, an indication of the degree of scatter between a series of measurements, was
deemed acceptable if the variation was ≥ 15% and 20% for high or medium and low
concentrations respectively (Machnik et al. 2007). The two measurements of accuracy
and precision were determined for the developed method.
• Intra-assay accuracy and precision were evaluated for both compounds from
at least 7 concentrations within the linearity range in triplicate that were
prepared and analysed at the same time.
• Inter-assay accuracy and precision, indicators of how much any measured
value of a specific procedure can vary with changing experimental set-up, were
evaluated by performing 3 independent assays at different concentration levels
of OxBu and OxHex on 3 consecutive days.
Range, the interval between the highest and lowest concentration of the detected
substance for which the method was shown to be suitably linear with both sufficient
precision and accuracy, was determined using the data from the linearity study as
published (ICH 2005).

3. METHODS
38
3.2 Solid lipid nanoparticles optimization
Solid lipid nanoparticles (SLN) are made of lipids with a melting point above RT. This
rather novel pharmaceutical formulation, which reduces or negates the need of organic
solvents and can increase the bioavailability and stability of sensitive drug molecules,
has been suggested to provide controlled release characteristics to a formulation and
hence is considered to be a novel pharmaceutical delivery system (Jenning, et al.
2000b).
3.2.1 Screening for lipids
Before attempting to formulate any kind of nanocarrier; a screen was performed in order
to identify the most suitable lipid for drug encapsulation. For solid lipids, this was done
by mixing 10 mg of the active ingredient initially alone with 1 g of each lipid in a glass
vial and heating up the mixture 10°C above the lipid’s melting point, while shaking.
Liquid lipids were also heated up before adding the active ingredient. A range of
temperatures between 40°C and 80°C was evaluated. Whenever deemed necessary by
previous results, the active ingredient was initially dissolved in a solvent and then added
to the lipid before heating. Following the complete melting of the lipid, the mixture was
allowed to cool, while being visually inspected every 20 min during the first 3 hrs and at
irregular intervals thereafter until 24 hrs after the start of the experiment. Any sign of
drug crystal formation or phase separation was noted at the given time points. Only
clear mixtures with no visible drug crystals were chosen for further investigation since
this indicates drug solubilisation in the mixture.
3.2.2 High pressure homogenization
Hot high pressure homogenisation was used to prepare solid lipid nanoparticles (SLN)
by adapting the method published by Freitas and colleagues (Freitas and Müller 1999).
The lipid and aqueous surfactant solution were heated up to temperatures 10º C above
the melting point of the lipid. 10 mg OxBu or OxHex were first dissolved in DMSO
before being mixed with the melted lipid (10°C above melting point).The aqueous phase
with the emulsifier (at same temperature as the melted lipid) was then added to the
mixture and a pre-emulsion was prepared using a 70°C warm rotor-stator mixer (Ultra-
Turrax T25) for 30 sec at 9500 rpm/min. The obtained pre-emulsion was homogenised
in high pressure homogeniser (EmulsiFlex-C5) applying a pressure of 500 bar.

3. METHODS
39
Three homogenisation cycles for 2.5 min in total were carried out. The obtained product
was filled in hot silanised glass vials, which were immediately sealed and allowed to
cool down to 15°C in a water bath.
3.2.3 Solid lipid nanoparticle hydrogels
Four gel-forming agents (hydroxyethyl cellulose 10000, hydroxyethyl cellulose 30000,
Carbopol 940 and carmellose sodium) were selected for hydrogel preparation. For
Carbopol 940 hydrogel a two step production was chosen. Briefly, 1% of the gel-
forming polymer was dispersed in distilled water and mixed, using high speed Ika
stirrer at approximately 1000 rpm for 5 min. The pH was then adjusted to
approximately pH6, using freshly prepared 5% sodium hydroxide solution. Since the
volumes and the consistency involved do not permit continuous pH monitoring, an
approximate ratio of polymer and NaOH (w:v) was used, which had been determined in
a series of preliminary experiments. SLN (3.5% compritol) dispersions were prepared
by hot high pressure homogenization as described above and were then added in small
portions to the pH-adjusted polymer gel. The final ratio of gel and SLN mixed was 1:1
(v:v).
For the gel forming agents, carmellose sodium and the two variants of hydroxyethyl
cellulose, a one step preparation procedure was implemented. Carmellose sodium was
added in small portions under constant stirring by a magnetic stirrer, to reach a final
concentration of 5.5%. Similarly hydroxyethyl cellulose 30000 was added using similar
conditions to reach a final concentration of 2.5%. Hydroxyethyl cellulose 10000 was
added to the SLN after the latter had been mixed with glycerine to result in a final
concentration of 87.5% SLN, 10% glycerine and 2.5% hydroxyethyl cellulose. In all
three cases mixing continued for approximately 10 min before the material was allowed
to gelify at 4°C for at least 5 hrs. For stability tests, the SLN-loaded hydrogels were
then left at RT for 120 days. SLN were physically characterised before and after their
incorporation into hydrogels to check for the effect of incorporation on particle size as
result of interactions between the ingredients of the final formulation and the SLN. As
reference material the SLN dispersions was used.

3. METHODS
40
3.3 Particle characterisation
A stability profile was analyzed combining different methods that collectively provide a
completer picture. Methods included dynamic and low angle static light scattering
technique (or photon correlation spectroscopy; PCS), laser diffractometry (LD), light
microscopy and scanning electron microscopy. PCS determines the actual size
distribution for particles up to 3 µm whereas LD serves to differentiate particle
populations and light microscopy was performed to judge the presence of any larger
particles or agglomerates in the formulation. Scanning electron microscopy was
employed to judge the particles shape and surface.
3.3.1 Photon correlation spectroscopy
Photon correlation spectroscopy (PCS) yields the z-average, or intensity weighted mean
diameter as well as the polydispersity index (PI). The latter is a measure of the width of
the size distribution (the smaller the PI, the narrower the distribution). Prior to particle
size analysis by PCS, the SLN were diluted to a concentration of 10 µl in 10 ml in
distilled water, whereas the SLN, embedded hydrogel were diluted with double-distilled
water to weak opalescence. The mean particle diameter size and PI were calculated
from 10 measurements at RT. Particles size was checked at different time intervals with
size analysis being performed at 1, 7, 14, 30, 90 and 180 days after nanoparticles
production.
3.3.2 Laser diffractometry
Laser diffractometry (LD) uses the fact that the pattern of scattered light depends on the
size of the examined particles with the diffraction angles being inversely proportional to
the particles’ radius. With LD, a broad range of sizes can be measured (e.g. 20 nm–2000
µm), enabling the detection of large particles besides a small sized bulk population. For
the particle size analysis a Mastersizer 2000 was used. The run length of 60 sec/
measurement. Sample was added until an obscuration 4-6 was reached. Three sets of
data were collected, the diameter ≥50% (LD50), ≥90% (LD90) and ≥95% (LD95) size
indicators that represents the value where 50%, 90% or 95% of the measured particles
are below the stated size. The obtained data provide an indication of uniformity within
the sample. Results were analyzed using the provided software that calculates on the
basis of the Mie-theory, an analytical solution of Maxwell's equations. The parameters
used were: real refractive index: 1.59; imaginary refractive index: 0.01.

3. METHODS
41
3.3.3 Visual observation and light microscopy
A Leitz light microscope, equipped with a CMEX-1 digital camera connected to Image
Focus software version 1.3.1.4, was used to monitor the presence of agglomerates or
very large particles. Magnifications of the analysed material by 16x10-fold, 40x10-fold,
63x10-fold and 100x10-fold were possible with the equipment. Gelation over time and
at fixed temperatures was visually observed in the stored SLN dispersions at regular
intervals.
3.3.4 Scanning electron microscopy
Scanning electron microscopy (SEM) is a type of electron microscopy that images the
sample’s surface by scanning the latter with a high-energy beam of electrons in a raster
scan pattern. SEM was used to obtain more detailed information about the size and
shape of the particles in the nanodispersions as well as in the final gel formulation. The
nanodispersions were applied on clean glass covers, covered with a thin gold layer for
120 sec and dried under vacuum before analysis. SEM studies were performed in
cooperation with the Institute of Veterinary Medicine at the Freie Universität Berlin,
using a Zeiss DSM 950.
3.4 Characterisation of SLN drug interaction
3.4.1 Parelectric spectroscopy
Parelectric spectroscopy (PS) was employed to check for free drug molecules in the
aqueous phase and to unravel the mode of OxBu interaction with the lipid matrix
(Blaschke, et al. 2007; Braem, et al. 2007a). Drug molecules can either be attached to
the surface (parabolic relationship) or incorporated into the lipid matrix (linear
relationship) (Braem, et al. 2007b; Sivaramakrishnan, et al. 2004a). Therefore, dipole
density and dipole mobility were measured for SLN loaded with different
concentrations of OxBu. A concentration range of 0-0.05% OxBu was investigated
using Lutrol® F68 as emulsifier. A substantially larger concentration range of 0-0.5%
OxBu was analysed when both Tween 80 and Lutrol® F68 were used as emulsifiers.
The experiments were carried out with a ZDR frequency analyser in a frequency range
of 0.4-4 GHZ. A detailed theoretical background of parelectric spectroscopy is
described elsewhere by (Blaschke et al. 2007).

3. METHODS
42
3.5 Cell culture
3.5.1 Isolation and cultivation of primary fibroblasts and keratinocytes
Keratinocytes and fibroblasts for primary cell cultures were isolated from human
juvenile foreskin, collected in transport medium (TM) immediately after surgery and
kept at 4°C until processing. Isolation commenced within 8 hrs after surgery. Foreskin
was incubated for 20 hrs at 4°C with Trypsin-EDTA-solution (cold trypsinisation). The
enzymatic reaction was stopped using stop medium (SM). The keratinocytes were
scraped off the tissue into ice cold PBS using forceps. The cell suspension was then
centrifuged for 5 min at 1000 rpm, followed by decantation of the supernatant, washing
with PBS and centrifugation, again under the same conditions. Pellets were then
resuspended in KGM. Keratinocytes pooled from at least three donors were then seeded
in cell culture flasks before being incubated at 37°C and 5% CO2.
To isolate the fibroblasts, the remaining foreskin was trypsinised for 10 min at 37°C and
5% CO2 (warm trypsinisation). The reaction was stopped using stop medium and the
foreskin was washed with PBS followed by centrifugation for 5 min at 1000 rpm at 4°C.
The supernatant was then decanted and the pellet suspended in FGM. Fibroblasts,
pooled from at least three donors were then cultivated in cell culture flasks at 37°C and
5% CO2. Pooling of keratinocytes or fibroblasts from at least three different donors
ensured elimination of unique properties of individual donors and hence improved
reproducibility. The keratinocytes were split 1:3 when 60-70% confluence was reached.
Fibroblasts were split every 2nd week at a ratio of 1:4. For the experiments,
keratinocytes of passage 2-3 and fibroblasts of passage 2-4 were used.
3.5.2 Culture conditions of cell lines
SCC12 and SCC25 cells were cultured in the respective growth medium (as described in
section 2.4) at 37°C and 5% CO2 until 70%-90% confluence. Passaging involved
trypsinisation for 1 min at 37°C, washing with PBS and resuspension in growth medium.
3.5.3 Seeding and stimulation of cells for p53 regulation studies
NHK, SCC12 and SCC25 were seeded at concentration of 2.5x10⁶ cells in 2 ml growth
medium in petri dishes. 24 hrs later, the medium was changed to basal and cells were exposed
to OxBu (in DMSO) or OxBu sodium (in 0.1 M NaOH) or 5-FU (in PBS) to reach a
concentration of 10-4 M and 7.5 10-4 M. As control, cells were exposed to the same amount of
solvent. Cells were then lysed after 48 hrs for analysis of p53 as described in section 3.10.3.

3. METHODS
43
3.6 Building of three dimensional skin tumour constructs
3.6.1 Dermal Equivalent
Fibroblasts from passage 2-4 were trypsinised with 1 ml trypsin/EDTA (3:1) and
incubated for 1 min at 37 °C. 1 ml FCS/flask was then added to stop the reaction and the
cell suspension was collected in sterile tube. In parallel, cold collagen G was mixed
with DMEM (x10) at a ratio of 8:1. The mixture was neutralised with 1N NaOH (sterile
filtered), using the medium’s colour as a pH indicator (orange to pink as endpoint). The
NHDF suspension (1x10⁶ / ml) was then carefully added and distributed in the mixture
avoiding air bubbles. The collagen fibroblast mixture was subsequently poured into
inserts (4 ml each) and kept for at least 4 hrs at 37°C and 5% CO2 to polymerise in 6
deep well plates. A Teflon ring was then carefully put on top of each collagen sheet and
X- medium was added underneath as well as on top of the human dermal equivalent.
The medium was then changed again after 15-20 min or at least the same day before
being cultured for 24 hrs at 37°C and 5% CO2 (submerged culture conditions).
3.6.2 Epidermal Equivalent
The following day, pooled NHK (passage 2-3) were trypsinised (as described for
NHDF) and resuspended in KGM. Once the keratinocytes were seeded at a
concentration of 2x10⁶ cell in 500 µl KGM on top of the fibroblast- collagen sheet
(inside the Teflon ring), the constructs were incubated at 37°C and 5% CO2 for 24 hrs.
Then KGM was removed from the surface of the constructs and replaced by
2 ml X-medium.
Medium was changed each 2-3 days (submerged culture). 5-7 days after seeding
keratinocytes, medium was removed from the top of the HSE and only the bottom
quarter of the insert was surrounded by medium, hence the HSE were in contact with
the medium only via the permeable bottom. All medium covering the surface was
removed, exposing the keratinocytes to air-liquid interface. The amount of calcium in
the culture medium was then increased to 2 mM and 1% ascorbic acid was added to
promote keratinocytes differentiation. Subsequently, the constructs were cultured for
another 5-7 days with their surface continuously maintained in contact with air.

3. METHODS
44
3.6.3 Skin Tumour Constructs
Human head and neck squamous cell carcinoma (SCC 12) cells obtained from facial
epidermis of a 60 year old male kidney transplant recipient (Rheinwald and Beckett
1981) were grown to 60-70% confluence in 75 cm2 under normal cell culture
conditions. In all experiments, cells used were from passages 89-95. Following trypsin⁄
EDTA digestion for 2 min at 37°C, 1 ml FCS was added to stop the reaction and cells
were centrifuged at 1000 rpm for 5 min. After the removal of the supernatant, the cell
pellet was resuspended in SCC medium and 2x10³ cells (in 100 µl medium) were
spotted onto the top of the keratinocyte layer covering the surface of the HSE. The
models were histologically examined when they were 12, 14, 16 and 18 days old to
observe the invasion of tumour cells into the models.
3.6.4 Stimulation of skin tumour constructs
48 hrs after seeding SCC12 on top of the models, standard topical treatments using
volumes of 10 µl/cm2 of 10-3 M OxBu solution (with 0.5% DMSO dissolved in PBS),
OxBu sodium solution (dissolved in 0.5% NaOH, pH 8, diluted with PBS for final
concentration), 5-FU (dissolved water, diluted with PBS for final concentration), and
OxBu loaded SLN. The equivalent amounts of solvents diluted in PBS or unloaded SLN
were used as controls, as appropriate. Treatments were applied each second day with a
total of two applications (at day 1 and 3) within 5 days or three applications at (day 1, 3,
and 5) within 7 days.
Response to the different treatments was assessed semi-qualitatively using IHC, by
checking the presence of markers for proliferation (Ki-67), metastasis (MMP2), SCC
(AxL and cytokeratin 10), as well as apoptosis (caspase7), as described in section 3.8.
As quantitative read out parameters, the level of cytokeratin 18 (CK18) as indicator for
epithelial total cell death (apoptosis and necrosis) and its caspase cleaved fragments
(CK18-Asp396) as indicator for apoptosis were measured in tissue extracts and the
culture medium as well as p53 as indicator of cellular stress due to DNA damage in
tissue extracts using ELISA.

3. METHODS
45
3.7 Histology
3.7.1 Fixing and embedding the tissue
At the end of any treatment, HSE tissues were fixed in 4% paraformaldehyde overnight,
dehydrated by incubation in increasing concentrations of ethanol (70, 80, 90, and 100%)
for 2 min each and then in xylene twice for 10 minutes each. HSE were then embedded
in melted paraffin (60°C) in blocks which were cooled down to RT for 15 min and
subsequently to -12°C for 1 hr. Paraffin embedded tissues were cut into 5 µm vertical
sections using microtome. Sections floating on the surface of a water bath of the
microtome were retrieved by partially submerging polysine covered slides and lifting
them up gently, making sure that sections attached next to, but not on top of each other.
Sections were left to dry at RT for 8 hrs till used for immunohistochemical or
histological analysis.
3.7.2 Deparaffinisation and rehydration
Before proceeding with the staining protocol, the slides were deparaffinised and
rehydrated. Incomplete removal of paraffin can cause poor staining. Sections were
washed twice in xylene for 10 min each, then twice in 100% ethanol (5 min each),
followed by two washes in 95% ethanol, 80% ethanol and 70% ethanol for (3 min
each). Finally, sections were rinsed twice in doubled distilled water for (5 min each).
Sections were then kept hydrated till proceeding with the staining process.
3.7.3 Haematoxylin and eosin staining
In order to evaluate the histology of the tumour skin constructs, haematoxylin and eosin
(H&E) staining was performed. This widely used technique distinctly stains different
cell structures and tissue. Haematin, the oxidised product of haematoxylin, stains cell
nuclei in blue, while eosin stains the cytoplasm and connective tissue pink. H& E
staining was done by gently immersing the tissue sections in double distilled water for
30 sec and then in Mayer’s haematoxylin with agitation for 5 min. Slides were then
rinsed for 5 min under running tap water followed by staining with 1% Eosin Y solution
for 30 seconds. Sections were then dehydrated with 2 changes in 96% ethanol and
2 changes in absolute ethanol for 2 min each. The ethanol was then extracted with
xylene (2x2 min each). After drying the slides, 1 drop of Roti-Histokitt mounting
medium was added on each slide. Once covered with a cover slip, slides were left to
dry for 24 hrs, before sections were examined using light microscopy.

3. METHODS
46
3.8 Immunohistochemistry
3.8.1 Antigen retrieval
Immunohistochemistry (IHC) is an antibody based method to demonstrate the presence
and localisation of proteins in tissue sections. Antigen retrieval steps are critical before
proceeding with immunohistochemical staining. Depending on the antigen of interest,
there are two main methods of antigen retrieval with different suitabilities.
Heat mediated antigen retrieval was used to retrieve Ki-67, AxL and Caspase7
antigens. Slides were placed in 10 mM sodium citrate buffer pH 6.0 (5 min, RT) before
being heated up using a water bath. After a brief moment at boiling point, samples were
maintained at 95°C for (20-40 min) and then left to cool at RT for 20-30 min, before
being rinsed three times in distilled water (5 min each). After a gentle wash with PBS,
incubation with 0.0025% BSA and 0.025% tween 20 incubation with PBS for
20-30 min followed.
Enzymatic antigen retrieval was used to retrieve acidic cytokeratin and MMP2 antigens.
The enzymatic antigen retrieval buffer, described in the materials section was freshly
prepared using warm distilled water. Sections were deparaffinised and rehydrated
before slides were immersed in 37°C water to warm up. The warmed slides were
transferred into the enzyme solution and kept for 10-20 min with intermittent gentle
agitation, then removed and placed under gently running tap water for 3 min to rinse off
the enzyme.
3.8.2 Immunofluorescence staining
Proceeding the antigen retrieval step, unspecific antibody binding sites were blocked by
an incubation with goat serum (1:20 in PBS) for 30 min at RT, using 200 µl/slide.
Blocking was followed by three washing steps with 0.0025% BSA and 0.025% Tween
20 dissolved in PBS. The sections were then incubated with the primary antibody
(diluted according to manufacture’s instructions) for 1 hr at RT or over night at 4°C.
Briefly, cleaved caspase-7 (Asp198), AxL C20 - goat polyclonal, Ki-67-goat polyclonal
and MMP2-rabbit polyclonal antibodies were diluted 1:50 in DDM, whereas mouse
monoclonal antibody to acidic cytokeratin was diluted 1:100 in DDM. The incubation
was followed by three wash cycles in wash buffer, before, the sections were incubated
with secondary antibody for 1 hr at RT (in the dark). The secondary antibody had been
diluted according to manufactures’ instructions in DDM. Briefly, goat anti-mouse IgG

3. METHODS
47
(H+L) labelled with Chromeo 488 and goat anti-rabbit IgG (H+L) labelled with
Chromeo 494 were diluted 1:1000 in DDM, whereas FITC linked donkey anti-goat IgG
was diluted 1:400 in DDM. After the incubation with secondary antibody, the latter
was decanted and sections were washed three times in PBS (containing 0.0025% BSA
and 0.025% Tween 20). Finally one drop of DAPI mounting medium was added and
samples were covered with a cover slip, before being analysed or stored in dark at 4°C.
Pictures were taken using a fluorescence microscope (BZ-800; Keyence Essen,
Germany). To determine the level of unspecific binding of the secondary antibody to
the cells, the above procedure was also carried out without the addition of primary
antibody (negative control).
3.9 Viability test
The hydrogen receptor reagent 3-[4,5-dimethylthiazol- 2-yl]-2,5 biphenyl tetrazolium
bromide (MTT) is commonly used to estimate in vitro cellular viability and has been
employed in several screening protocols in cancer research (Page, et al. 1988; Sargent
and Taylor 1989; Twentyman, et al. 1989).
3.9.1 Seeding and stimulation
Human keratinocytes passage (P 2-4), fibroblasts (P 2-3), SCC12 (P 89-95) and SCC25
(P 1-8) grown to about 80% confluence, were washed with PBS and detached from
culture flasks with trypsin solution. DMEM with 10% FCS was added to stop the
trypsin digestion and the cell suspension was centrifuged at 1000 rpm and RT for 5 min.
Cells were resuspended in growth medium and counted using Neubauer cell counting
chamber, for which a sample was diluted 1:10 with 0.4 % trypan blue. Cells were
seeded in 500 µl growth media at a density of 40x104 cells/well in 24-well plates and
incubated at 37°C for 24 hrs.
Growth medium was replaced with basal medium before cells were exposed to the
appropriate concentration of the drug under investigation (usually 2.5 µl of 2x10⁻² to
2x10⁻⁴ M drug solutions, hence reaching drug concentrations of 10-4 to 10-6 M per well).
Cells exposed to the same amount of solvent served as control. For experiments with the
nanodispersions, dilutions of 1:1000 and 1:100 of drug loaded SLN were chosen to
attain final concentration of 1 and 10 µM OxBu respectively in the culture medium.

3. METHODS
48
3.9.2 Cell viability measurement
The viability of cells grown in culture was assessed using the MTT test (Cole 1986;
Rai-el-Balhaa, et al. 1985). At the indicated time point (usually 48 hrs after exposure),
40 µl of a 5 mg/ml MTT sterile solution (dissolved in PBS) was added and plates were
incubated in the dark at 37°C for 4 hrs. Afterwards, the supernatant was carefully
removed and 250 µl DMSO was added for cell lysis. Plates were shaken for 5 min at
300 rpm and 100 µl of each well was transferred to 96 well plate. Absorption was
measured at 540 nm using a microplate reader. DMSO was used as blank. Cell viability
was evaluated using the formula:
Viability (%) = (Absorbance Test - Blank) x100
(Absorbance Control- Blank)
Mean cell viability and standard deviation were calculated from at least three
independent experiments.
3. METHODS
49
3.10 Enzyme linked immunosorbent assay
3.10.1 Sample preparation for ELISA
Cell Lysates preparation was initiated by removing all medium from the treated cells
and rinsing them twice with PBS, making sure to remove any remaining of PBS after
the second rinse. Cells were then scraped off the growth support and lysed in 400 µl
lysis buffer #13 for p53 measurement. After 15 min incubation on ice, the lysates were
centrifuged at 4000 rpm for 5 min and the supernatant transferred into a clean 1.5 ml
tube. The protein concentration of each sample was then quantified (as described in
section 3.10.2). If not analysed immediately, samples were stored at -20° C.
Tissue extract preparation was initiated at the end of the appropriate treatment cycle of
tumour constructs. The epidermis was carefully isolated from the dermal equivalent
using blunt forceps and placed in 2 ml tubes. 500 µl precooled lysis buffer #13 was
added and the sample was kept on ice for the extraction. Epidermal tissue was
disrupted and extracted using stainless steel beads and a TissueLyser for 3x10 sec. The
lysate was then centrifuged at 4°C and 9000 rpm for 5 min. The supernatant was
subsequently collected and aliquoted into 100 µl and the protein concentration of each
sample quantified (see section 3.10.2). If not analysed immediately, samples were
stored at -20° C.
Culture Medium was collected to analyse the proteins released into the medium by the
tumour or normal HSE. To detect CK18 and CK18-Asp396, 1 ml medium was
collected from each HSE before seeding the SCC cells on the keratinocyte layer. This
process was repeated before the start of treatment (48 hrs after seeding the SCC) and
each second day thereafter. The medium was centrifuged at 5000 rpm for 2 min and if
not analysed immediately, samples were stored at -20°C.
3.10.2 Protein determination
Protein determination of cells lysates and tissue extracts was performed using a
commercially available kit (Thermo Scientific Pierce BCA Protein Assay) according to
the manufacturer’s protocol. This detergent-compatible formulation is based on
bicinchoninic acid (BCA) for the colorimetric detection and quantification of total
protein. This method combines the well-known reduction of Cu+2 to Cu+1 by protein in
an alkaline medium (the biuret reaction) with the highly sensitive and selective
colorimetric detection of the cuprous cation (Cu+1) using a reagent containing
3. METHODS
50
bicinchoninic acid. The purple-coloured reaction product of this assay is formed by the
chelation of two molecules of BCA with one Cu+1. This water-soluble complex exhibits
strong absorbance at 540 nm that is approximately linear with increasing protein
concentrations over a broad working range (0 to 2,000 µg/ml).
Briefly, the diluent for the serial dilution was the lysis buffer used for cell and tissue
lysis (1:10 in distilled water). Working reagent (WR) was prepared by mixing 5 ml of
reagent A with 100 µl of reagent B. 25 µl of each standard or unknown sample were
pipetted in duplicate into a microplate. 200 µl of the WR were then added to each well
and mixed thoroughly on a plate shaker for 30 sec at 600 rpm. The plate was then
covered and incubated at 37°C for 30 min, before being left to cool to RT. The
absorbance was finally measured at 540 nm in a plate reader.
3.10.3 Determination of p53
The commercially available DuoSet-IC ELISA kit was used according to the
manufacturer’s protocol to measure natural and recombinant human p53 in cell lysates
and tissue extracts. This assay is based on the principle that an immobilised capture
antibody specific for human p53 binds both phosphorylated and unphosphorylated p53.
After washing away unbound material, a biotinylated detection antibody specific for
human total p53 is used to detect both phosphorylated and unphosphorylated protein,
using a standard streptavidin-HRP format.
Briefly, the assay was performed in a 96-well microplate which was coated with 100 µl
capture antibody per well and left overnight at RT. Capture antibody was removed and
each well was washed with wash buffer before being gently tapped upsides down
against clean paper towels to remove any remaining drops of liquid. The plate was then
blocked by adding 300 µl block buffer to each well and incubated for 2 hrs at RT.
Afterwards the plate was washed again three times as described above. Standard
solutions of recombinant human p53 were diluted with diluent # 4 to obtain an eight-
point standard curve (with concentrations of 0, 100, 200, 400, 1000, 2000, 4000,
8000 pg/ml) using 2-fold serial dilutions. Samples were diluted (1:50 in diluent# 4) in
order to have the optical density (OD) results within the linearity range of the standard
curve. 100 µl standard or samples were pipetted in duplicates into the precoated
microplate and incubated for 2 hrs at RT. Aspiration and washing of the microplate
were repeated as described above. 100 µl detection antibody was added to every well
and incubated for 2 hrs at RT. Another cycle of aspiration and washing was followed by
the addition of 100 µl streptavidin-HRP (1:200 in PBS) to each well and incubation for

3. METHODS
51
20 min at RT in the dark. After washing once more, 100 µl substrate solution was added
for 20 min at RT, while being protected from light. Finally, 50 µl stop solution was
added. The absorbance at 450 nm was determined in each well within 20 min. A
measurement at 570 nm was used to correct for background. The unknown p53
concentrations in the samples were calculated from the standard curve using a 4
Parameter Logistic (4PL) regression (4 parameter fit according to manufacturer’s
recommendation).
3.10.4 Determination of Apoptosis (M30 Apoptosense ELISA)
The M30-Apoptosense is an ELISA assay for the quantitative measurement of the
apoptosis-associated M30 neo-epitope14 in tissue culture supernatants or cell extracts of
epithelial tissues. The amount of CK18-Asp396 (M30) released by the HSE was
assessed following the manufacturer’s protocol. Briefly, 25µl of each sample (medium
or tissue extracts) were added to 96 well microstrips, coated with a mouse monoclonal
antibody against the neo-epitope M30. Swiftly thereafter, 75µl detection horseradish
peroxidase-conjugated monoclonal antibody against the M30 epitope was added to each
well using an 8 channel multi-pipetter. After incubation for 4 hrs on a plate shaker (600
rpm) at RT, unbound antibody was washed away using (5x300 µl) washing buffer.
The microplate was then gently tapped several times upside down against clean paper
towels to remove any remaining liquid. 100µl of TMB (3,3,5,5-tetramethylbenzidine)
was added to each well as a substrate. After 20 min incubation (in the dark) the reaction
was stopped using 1N HCL (50µl/well). Absorbance was measured in a microplate
reader at 450 nm. The concentration of the M30 antigen in the sample was assessed
using a seven point standard curve (0, 75, 150, 250, 500, 750 and 1000 U/L). The values
obtained for the tissue lysates were normalised for total protein content to compare the
fold induction of apoptosis.
3.10.5 Determination of total cell death (M65 ELISA)
M65 ELISA is a one-step in vitro immunoassay for the quantitative determination of
soluble cytokeratin 18 (CK18) in serum and plasma. The method uses two mouse
monoclonal antibodies (M5 and M6, both IgG2b) specific for conventional epitopes on
CK18 and measures total soluble CK18, released from necrotic and apoptotic cells into
the medium. Upon cell lysis, the method can also be used to determine intracellular
levels of CK18.
A commercially available kit was used according to manufacturer’s recommendations.
The kit is based on a 96-well plate format, with each well being coated with a mouse

3. METHODS
52
monoclonal ‘catcher’ antibody that binds to an epitope on CK18. It contains seven-
concentrations of antigen (125–2000U/l) to produce standard curves and certified low
and high quality controls (ca 200 and 1000U/l). Briefly, 25 µl of sample, standard or
blank was added to each well. Immediately afterwards and using a 8 channel multi-
pipetter, 75 µl of HRP-conjugated monoclonal antibody (M5) solution was added to act
as the detection antibody (Kramer et al. 2004). Samples were then incubated for 2 hrs at
RT while constantly shaking at 600 rpm. Any unbound conjugate was removed by
washing five times with wash solution. The incubation with 200 µl of the substrate
3,30,5,50-tetramethyl-benzidine solution for 20 min in the dark results in colour
development that is proportional to the CK18 concentration. The reaction was stopped
with 50 µl of 1.0 M sulphuric acid and absorbance was measured in a microplate reader
at 450 nm. The amount of antigen in the samples was calculated by interpolation, using
the plotted standard curve of known concentrations of M65 antigen standards vs
absorbance.
3. METHODS
53
3.11 Statistical analysis of data
3.11.1 Descriptive statistics
If not stated otherwise, experiments were carried out in triplicate. For the SLN
characterisation the data are based on three independent batches of which at least three
samples were analysed on three independent days. These triplicates were used to
calculate arithmetic mean and the standard deviation (mean ± SD). Tumour models
were usually produced in batches of 6 and treated in duplicates. The arithmetic mean
and the standard deviation (mean ± SD) was calculated on the averages of three
independent experiments.
Results were represented graphically and the statistical analysis was carried out using
GraphPad Prism Software Version 4.02.
3.11.2 Inferential statistics
Further statistical analysis to test the significance of difference from random variation,
was tested using student’s t-test, or two-sided ANOVA, for two and multi-parameter
comparisons respectively, as appropriate. A significant difference was accepted for
values of p< 0.05.

4. RESULTS
54
4 RESULTS
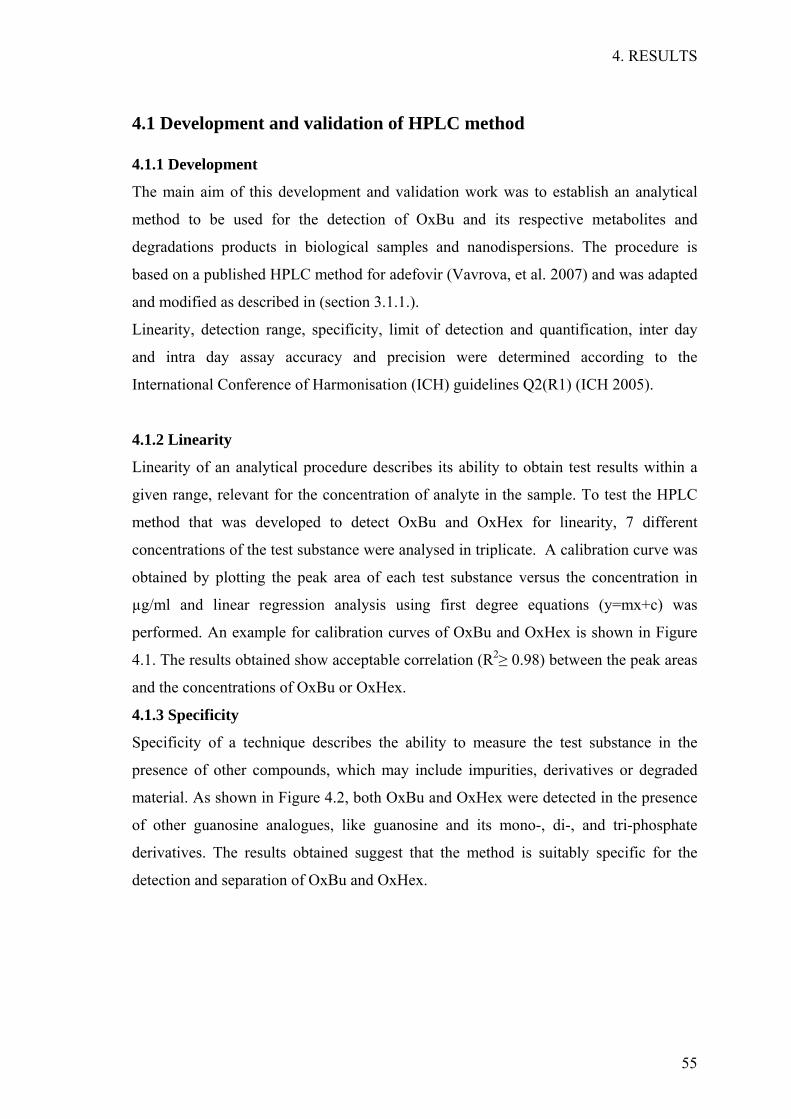
4. RESULTS
55
4.1 Development and validation of HPLC method
4.1.1 Development
The main aim of this development and validation work was to establish an analytical
method to be used for the detection of OxBu and its respective metabolites and
degradations products in biological samples and nanodispersions. The procedure is
based on a published HPLC method for adefovir (Vavrova, et al. 2007) and was adapted
and modified as described in (section 3.1.1.).
Linearity, detection range, specificity, limit of detection and quantification, inter day
and intra day assay accuracy and precision were determined according to the
International Conference of Harmonisation (ICH) guidelines Q2(R1) (ICH 2005).
4.1.2 Linearity
Linearity of an analytical procedure describes its ability to obtain test results within a
given range, relevant for the concentration of analyte in the sample. To test the HPLC
method that was developed to detect OxBu and OxHex for linearity, 7 different
concentrations of the test substance were analysed in triplicate. A calibration curve was
obtained by plotting the peak area of each test substance versus the concentration in
µg/ml and linear regression analysis using first degree equations (y=mx+c) was
performed. An example for calibration curves of OxBu and OxHex is shown in Figure
4.1. The results obtained show acceptable correlation (R2≥ 0.98) between the peak areas
and the concentrations of OxBu or OxHex.
4.1.3 Specificity
Specificity of a technique describes the ability to measure the test substance in the
presence of other compounds, which may include impurities, derivatives or degraded
material. As shown in Figure 4.2, both OxBu and OxHex were detected in the presence
of other guanosine analogues, like guanosine and its mono-, di-, and tri-phosphate
derivatives. The results obtained suggest that the method is suitably specific for the
detection and separation of OxBu and OxHex.
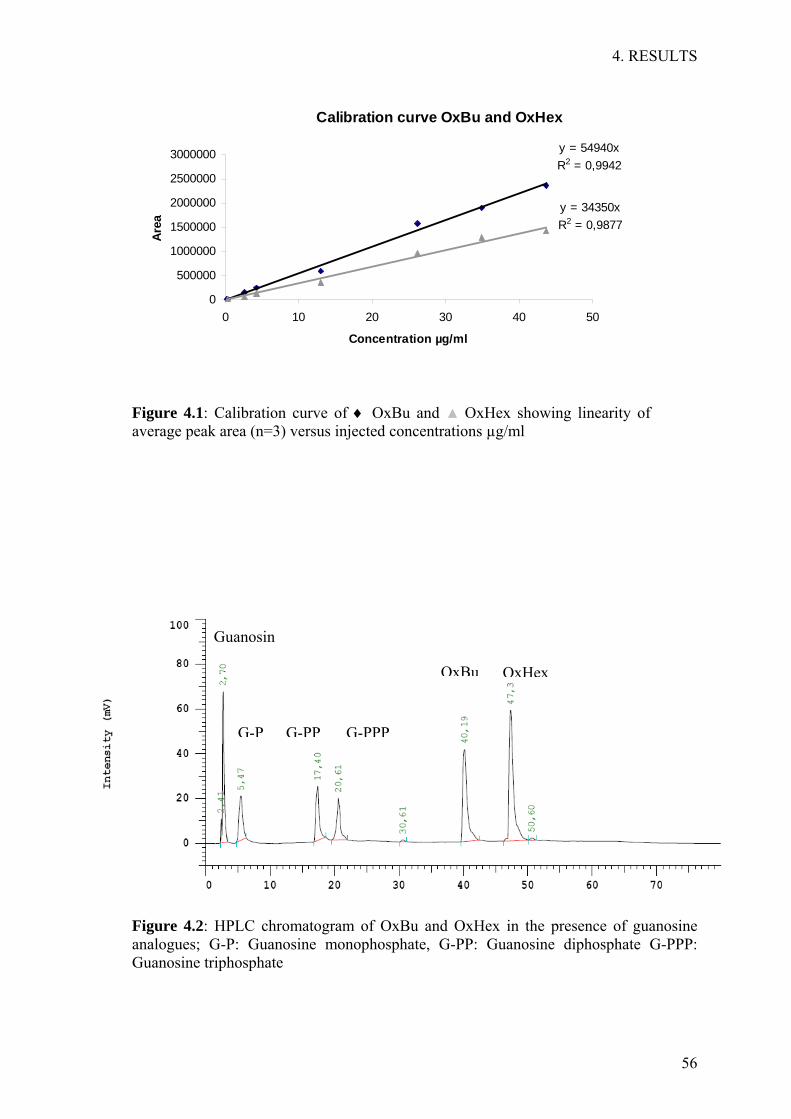
4. RESULTS
56
Calibration curve OxBu and OxHex
y = 54940xR2 = 0,9942
y = 34350xR2 = 0,9877
0
500000
1000000
1500000
2000000
2500000
3000000
0 10 20 30 40 50
Concentration µg/ml
Area
Figure 4.1: Calibration curve of ♦ OxBu and ▲ OxHex showing linearity of average peak area (n=3) versus injected concentrations µg/ml
Figure 4.2: HPLC chromatogram of OxBu and OxHex in the presence of guanosine analogues; G-P: Guanosine monophosphate, G-PP: Guanosine diphosphate G-PPP: Guanosine triphosphate
G-P
Guanosin
G-PP G-PPP
OxBu OxHex

4. RESULTS
57
4.1.4 Detection and quantification Limit
Limit of detection (LoD) describes the lowest concentration of a substance at which it
can still be detected with a reasonably high degree of certainty. At this level,
quantification is usually not sufficiently accurate. The lowest concentration for which
accurate quantitative results can be obtained, is called limit of quantification (LoQ). For
the quantification by HPLC, the LoD and LoQ were 0.158 and 0.48µg/ml for OxBu and
1.21 and 3.65µg/ml for OxHex respectively.
4.1.5 Accuracy and precision
Accuracy expresses the degree of similarity between a value obtained for a
characterised standard or a known sample using an analytical method and the value for
the same sample that is accepted as reference value. Precision expresses the
reproducibility of a method. It is determined as the degree of scatter between a series of
measurements using the same analytical method under identical conditions. Based on
the calibration results, measurements were carried out to determine both intra- and inter-
assay accuracy and precision.
• Intra-assay accuracy and precision
The results obtained for both compounds are summarised in table 4.1. The intra-
assay accuracy ranged from 86.36% to 106.85% for OxBu and 94.3% to 112% for
OxHex. The intra-assay precision (RSD) ranged from 3.3% to 12.67% and 4.24% to
14.47% for OxBu and OxHex respectively.
• Inter-assay accuracy and precision
As summarised in table 4.2, the inter-assay accuracy for OxBu ranged from 86.35%
to 114.32% while precision was between 2.32%-11.44%. Similarly, for OxHex, the
inter-assay accuracy was between 92.8% to 114.1% and precision ranged between
2.36%-8.73%.
For both substances the intra and inter-assay accuracy and precision fulfilled the
requirement over the tested range of concentrations. The recovery data of both
compounds was thus demonstrated to be accurate for the intended purpose and therefore
is adequate for routine analysis.
4.1.6 Range
The calculations suggest that the HPLC method is accurate for OxBu and OxHex within
the range of 0.26-43.6 µg/ml and 0.46- 46.44 µg/ml, respectively.

4. RESULTS
58
Table 4.1: Intra-assay accuracy and precision of the HPLC method for
OxBu (n=3).
Nominal Measured Accuracy (%) Precision (%) Concentration Concentration (µg/ml) (µg/ml; mean ± SD)
43.63 39.27 ± 4.55 90.02 12.67 34.9 30.14 ± 3.08 86.36 9.82 26.18 23.08 ± 1.47 88.21 11.26 13.09 13.20 ± 0.49 99.05 3.37 4.36 3.84 ± 0.40 89.17 10.50 2.62 2.30 ± 0.27 87.89 11.93 0.436 0.412 ± 0.02 94.52 4.90 0.262 0.279 ± 0.01 106.85 3.33
OxHex (n=3)
46.44 52.07 ±7.4 112.13 14.26 37.16 38.6 ±2.17 103.92 5.63 27.87 26.47 ±3.54 94.9 13.37 13.93 14.43 ± 1.03 103.6 7.13 4.64 5.18 ± 0.40 111.7 7.62 2.78 3.11 ± 0.45 112.07 14.47 0.46 0.412 ± 0.02 94.52 4.24

4. RESULTS
59
Table 4.2 Inter-assay accuracy and precision of the HPLC method for
OxBu (n=3).
Nominal Measured Accuracy (%) Precision (%) Concentration Concentration (µg/ml) (µg/ml; mean ± SD)
39.28 37.69 ± 1.12 95.95 2.97 34.94 30.13 ± 3.36 86.35 11.17 19.02 21.75 ± 1.92 114.32 8.86 13.75 13.21 ± 0.38 96.04 2.91 4.36 3.83 ± 0.36 88.02 9.62 2.62 2.25 ± 0.25 86.07 11.44 0.436 0.42 ± 0.01 96.82 2.32 0.292 0.279 ± 0.01 95.87 3.04
OxHex (n=3)
43.68 47.7 ± 2.8 109.18 5.94 41.41 40.07 ± 0.95 96.76 2.36 26.47 29.26 ± 1.94 110.52 6.73 14.29 13.21 ± 0.76 92.43 7.13 4.76 5.42 ± 0.40 113.7 5.78 3.18 3.83 ± 0.32 114.1 8.73 0.46 0.43 ± 0.02 94.8 3.87

4. RESULTS
60
4.2 Development of solid lipid nanoparticles (SLN)
4.2.1 Lipid Screening
The poor solubility of OxBu and OxHex in excipients commonly used in topical
applications was a major challenge for formulation optimisation. Therefore, a series of
solubilisers, waxes, glycerides and oils was screened (table 4.3) to identify the suitable
carrier systems. Drug solubility was investigated by dissolving increasing amounts of
OxBu or OxHex in different carrier systems. For solid lipids, the drug/lipid mixture was
heated to at least 10°C above the melting point of the lipid, while shaking. Liquid
carrier systems, with the exception of solvents, were heated to 40°C, 50°C, 65°C and
80°C while shaking. Drug dissolution was visually checked at regular intervals while
heating the mixture as well as during and after cooling. As indicated in table 4.3 the
results demonstrate that even after shaking for a long time (24 hrs), OxBu and OxHex
particles, although uniformly distributed, yet were not dissolved in any system except
DMSO. Therefore combinations of lipids with DMSO and active constituent were
tested according to the above described procedure. All solubility checks were
implemented by visual inspection for the presence or absence of crystalline structures
during and after cooling down the mixtures to RT. The results shown in table 4.4
indicate that all but three lipids were not suitable as carrier systems. In a number of
them, OxBu and OxHex did not or only marginally dissolve, as suggested by the
presence of considerable amounts of crystals in the mixtures. In other lipids,
OxBu/OxHex appeared to dissolve but phase separation was observed after cooling the
lipid/DMSO mixture. In the three promising candidates, Lanette N, Gelucire® 50/13 and
Compritol® 888 ATO (glyceryl behenate) neither phase separation nor crystal structures
were observed after 24 hrs. Hence it is most likely that the mixture of lipid/DMSO kept
OxBu and OxHex dissolved.
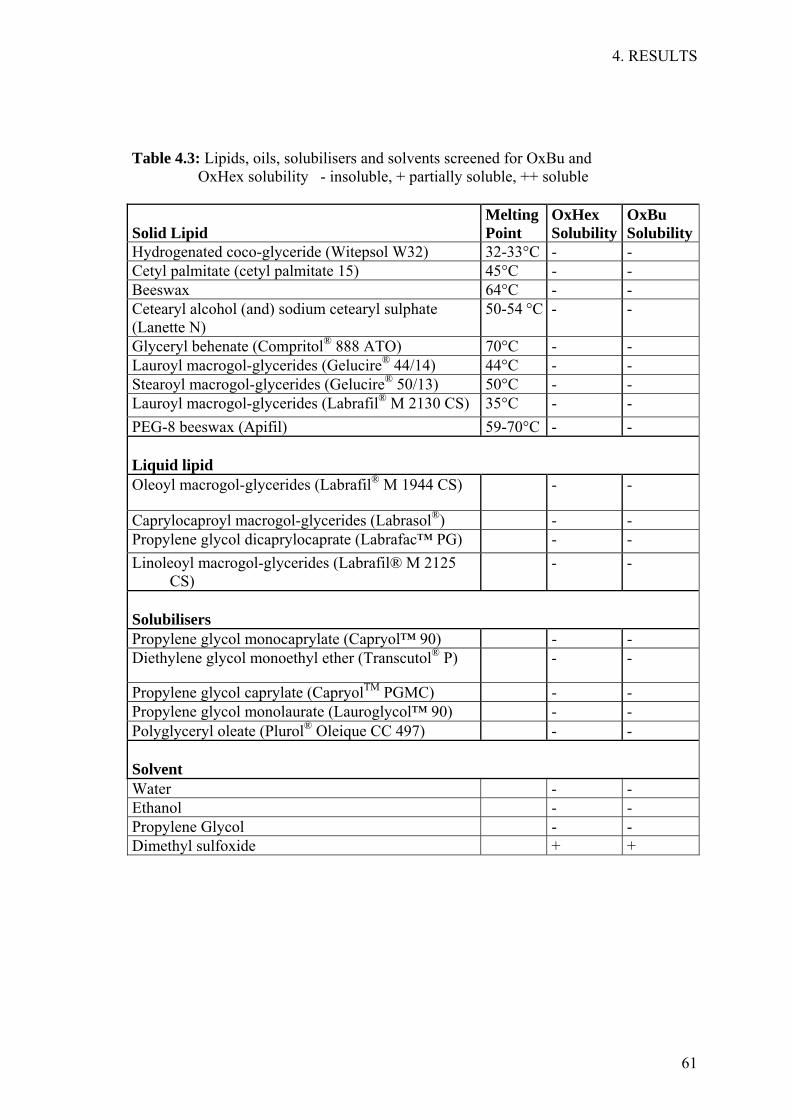
4. RESULTS
61
Table 4.3: Lipids, oils, solubilisers and solvents screened for OxBu and OxHex solubility - insoluble, + partially soluble, ++ soluble
Solid Lipid
Melting Point
OxHex Solubility
OxBu Solubility
Hydrogenated coco-glyceride (Witepsol W32) 32-33°C - - Cetyl palmitate (cetyl palmitate 15) 45°C - - Beeswax 64°C - - Cetearyl alcohol (and) sodium cetearyl sulphate (Lanette N)
50-54 °C - -
Glyceryl behenate (Compritol® 888 ATO) 70°C - - Lauroyl macrogol-glycerides (Gelucire® 44/14) 44°C - - Stearoyl macrogol-glycerides (Gelucire® 50/13) 50°C - - Lauroyl macrogol-glycerides (Labrafil® M 2130 CS) 35°C - - PEG-8 beeswax (Apifil) 59-70°C - - Liquid lipid
Oleoyl macrogol-glycerides (Labrafil® M 1944 CS) - -
Caprylocaproyl macrogol-glycerides (Labrasol®) - - Propylene glycol dicaprylocaprate (Labrafac™ PG) - - Linoleoyl macrogol-glycerides (Labrafil® M 2125
CS) - -
Solubilisers
Propylene glycol monocaprylate (Capryol™ 90) - - Diethylene glycol monoethyl ether (Transcutol® P) - -
Propylene glycol caprylate (CapryolTM PGMC) - - Propylene glycol monolaurate (Lauroglycol™ 90) - - Polyglyceryl oleate (Plurol® Oleique CC 497) - - Solvent
Water - - Ethanol - - Propylene Glycol - - Dimethyl sulfoxide + +
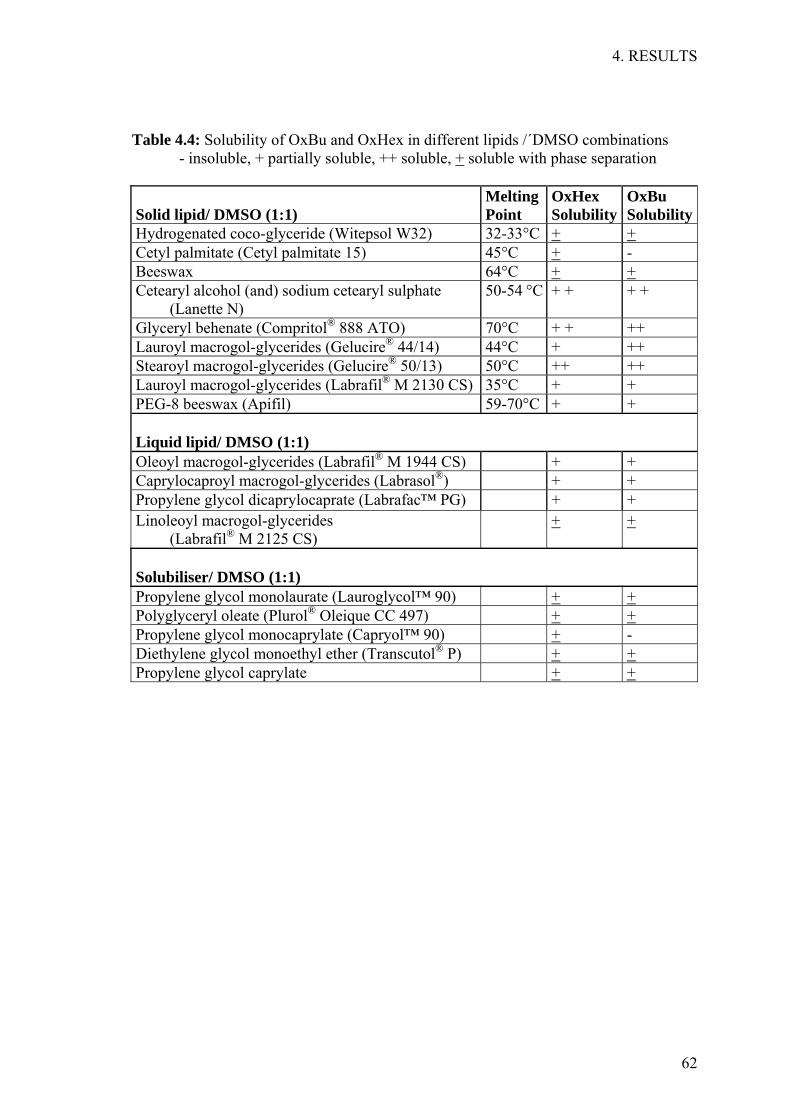
4. RESULTS
62
Table 4.4: Solubility of OxBu and OxHex in different lipids /´DMSO combinations - insoluble, + partially soluble, ++ soluble, + soluble with phase separation
Solid lipid/ DMSO (1:1)
Melting Point
OxHex Solubility
OxBu Solubility
Hydrogenated coco-glyceride (Witepsol W32) 32-33°C + + Cetyl palmitate (Cetyl palmitate 15) 45°C + - Beeswax 64°C + + Cetearyl alcohol (and) sodium cetearyl sulphate
(Lanette N) 50-54 °C + + + +
Glyceryl behenate (Compritol® 888 ATO) 70°C + + ++ Lauroyl macrogol-glycerides (Gelucire® 44/14) 44°C + ++ Stearoyl macrogol-glycerides (Gelucire® 50/13) 50°C ++ ++ Lauroyl macrogol-glycerides (Labrafil® M 2130 CS) 35°C + + PEG-8 beeswax (Apifil) 59-70°C + + Liquid lipid/ DMSO (1:1)
Oleoyl macrogol-glycerides (Labrafil® M 1944 CS) + + Caprylocaproyl macrogol-glycerides (Labrasol®) + + Propylene glycol dicaprylocaprate (Labrafac™ PG) + + Linoleoyl macrogol-glycerides
(Labrafil® M 2125 CS) + +
Solubiliser/ DMSO (1:1)
Propylene glycol monolaurate (Lauroglycol™ 90) + + Polyglyceryl oleate (Plurol® Oleique CC 497) + + Propylene glycol monocaprylate (Capryol™ 90) + - Diethylene glycol monoethyl ether (Transcutol® P) + + Propylene glycol caprylate + +
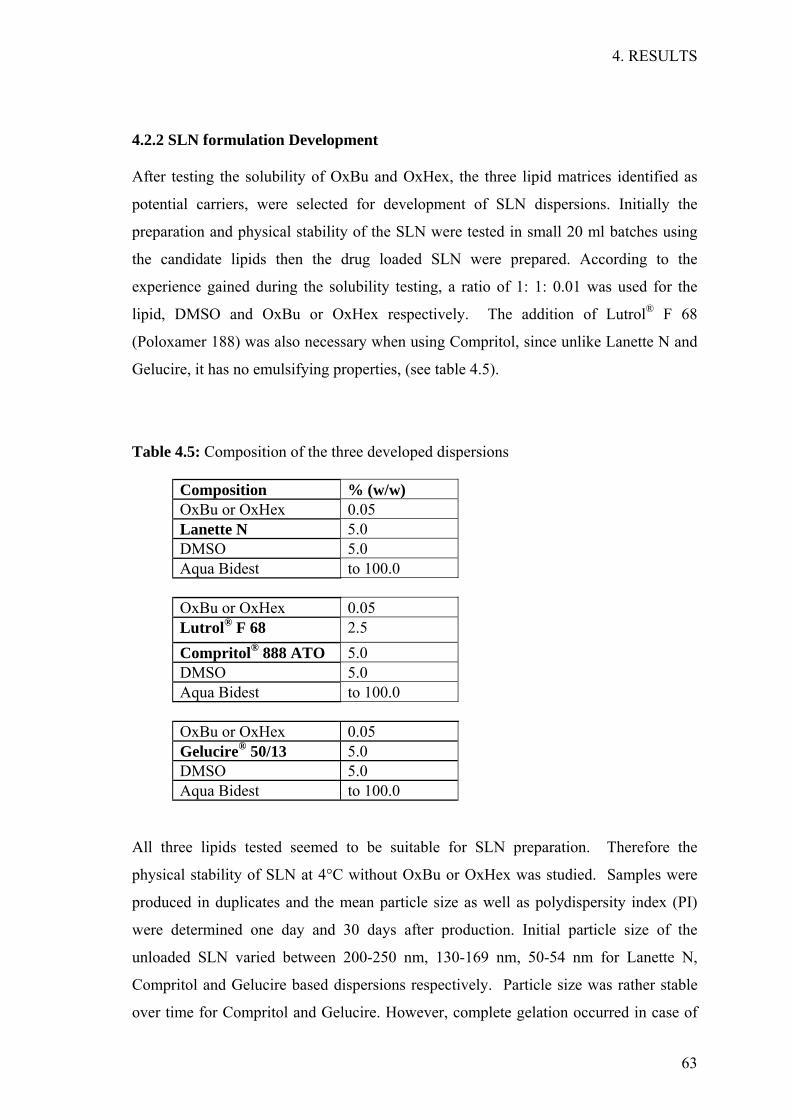
4. RESULTS
63
4.2.2 SLN formulation Development
After testing the solubility of OxBu and OxHex, the three lipid matrices identified as
potential carriers, were selected for development of SLN dispersions. Initially the
preparation and physical stability of the SLN were tested in small 20 ml batches using
the candidate lipids then the drug loaded SLN were prepared. According to the
experience gained during the solubility testing, a ratio of 1: 1: 0.01 was used for the
lipid, DMSO and OxBu or OxHex respectively. The addition of Lutrol® F 68
(Poloxamer 188) was also necessary when using Compritol, since unlike Lanette N and
Gelucire, it has no emulsifying properties, (see table 4.5).
Table 4.5: Composition of the three developed dispersions
Composition % (w/w) OxBu or OxHex 0.05 Lanette N 5.0 DMSO 5.0 Aqua Bidest to 100.0 OxBu or OxHex 0.05 Lutrol® F 68 2.5 Compritol® 888 ATO 5.0 DMSO 5.0 Aqua Bidest to 100.0 OxBu or OxHex 0.05 Gelucire® 50/13 5.0 DMSO 5.0 Aqua Bidest to 100.0
All three lipids tested seemed to be suitable for SLN preparation. Therefore the
physical stability of SLN at 4°C without OxBu or OxHex was studied. Samples were
produced in duplicates and the mean particle size as well as polydispersity index (PI)
were determined one day and 30 days after production. Initial particle size of the
unloaded SLN varied between 200-250 nm, 130-169 nm, 50-54 nm for Lanette N,
Compritol and Gelucire based dispersions respectively. Particle size was rather stable
over time for Compritol and Gelucire. However, complete gelation occurred in case of

4. RESULTS
64
unloaded Lanette N dispersion after one month. Therefore Lanette N based SLN were
not investigated further as a possible carrier system (see table 4.6).
To determine the effect of loading the drug, the physical stability of SLN with OxBu or
OxHex was investigated at 4°C. Loading OxHex increased the particle size of
Compritol and Gelucire preparations, compared to the unloaded SLN. With an average
of 375+178 nm, this increase was quite pronounced in the Gelucire based dispersion,
and although the size increase was within acceptable limits, variability was high,
indicating heterogeneous regions within each sample.
Table 4. 6: Mean particle size and polydispersity index (PI) of unloaded and OxBu/ OxHex loaded SLN dispersions using 5% Gelucire 50/13, Lanette N and Compritol as lipid matrix after 1 day and 30 days of production and storage at 5°C.
SLN Day Value Lipid Gelucire 50/13 Lanette N Compritol Unloaded 1 mean size [nm] 54 237 133 PI 0.37 0.14 0.18 30 mean size [nm] 57 gel 141 PI 0.33 - 0.2
0.05% OxBu 1 mean size [nm] 289 328 201 PI 0.4 0.41 0.24 30 mean size [nm] 540 gel 235 PI 0.67 - 0.24
0.05% OxHex 1 mean size [nm] 281 gel 240 PI 0.5 - 0.26 30 mean size [nm] 556 - 446 PI 0.56 - 0.4
Like the unloaded control, Lanette N based SLN loaded with OxHex gelified directly
after production, hence this combination was not used for further evaluation. As for
Gelucire 50/13, particles size increased upon loading of OxHex showing high
variability within and between the samples. Only Compritol SLN loaded with OxHex,
having an average size of 240+6 nm provided acceptable stability and uniformity.
Therefore it was chosen as the candidate for further stability investigations.
Loading OxBu increased the particles size and polydispersity index compared to the
unloaded SLN. For Gelucire based SLN, particle size increase was even more
pronounced than that observed with OxHex, being 289+75 nm directly after production
and 540+330 nm after 30 days, showing high variability within and between batches.
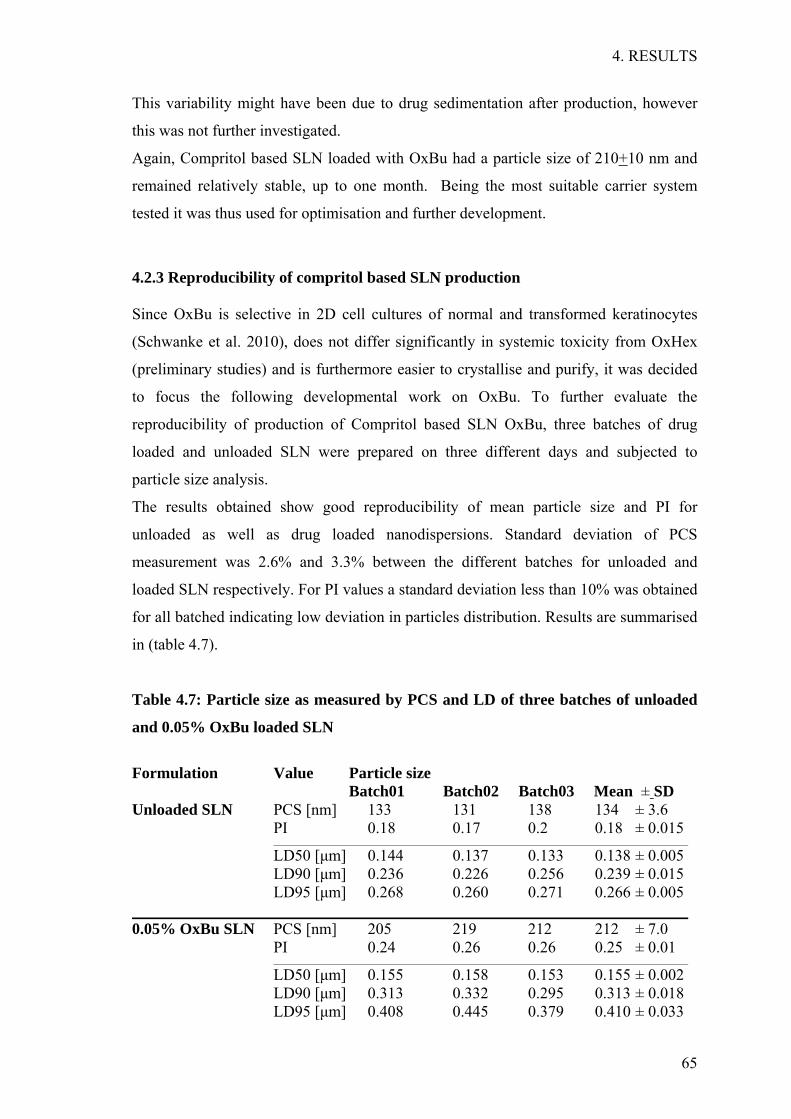
4. RESULTS
65
This variability might have been due to drug sedimentation after production, however
this was not further investigated.
Again, Compritol based SLN loaded with OxBu had a particle size of 210+10 nm and
remained relatively stable, up to one month. Being the most suitable carrier system
tested it was thus used for optimisation and further development.
4.2.3 Reproducibility of compritol based SLN production
Since OxBu is selective in 2D cell cultures of normal and transformed keratinocytes
(Schwanke et al. 2010), does not differ significantly in systemic toxicity from OxHex
(preliminary studies) and is furthermore easier to crystallise and purify, it was decided
to focus the following developmental work on OxBu. To further evaluate the
reproducibility of production of Compritol based SLN OxBu, three batches of drug
loaded and unloaded SLN were prepared on three different days and subjected to
particle size analysis.
The results obtained show good reproducibility of mean particle size and PI for
unloaded as well as drug loaded nanodispersions. Standard deviation of PCS
measurement was 2.6% and 3.3% between the different batches for unloaded and
loaded SLN respectively. For PI values a standard deviation less than 10% was obtained
for all batched indicating low deviation in particles distribution. Results are summarised
in (table 4.7).
Table 4.7: Particle size as measured by PCS and LD of three batches of unloaded
and 0.05% OxBu loaded SLN
Formulation Value Particle size Batch01 Batch02 Batch03 Mean ± SD Unloaded SLN PCS [nm] 133 131 138 134 ± 3.6 PI 0.18 0.17 0.2 0.18 ± 0.015
LD50 [µm] 0.144 0.137 0.133 0.138 ± 0.005 LD90 [µm] 0.236 0.226 0.256 0.239 ± 0.015 LD95 [µm] 0.268 0.260 0.271 0.266 ± 0.005 0.05% OxBu SLN PCS [nm] 205 219 212 212 ± 7.0 PI 0.24 0.26 0.26 0.25 ± 0.01
LD50 [µm] 0.155 0.158 0.153 0.155 ± 0.002 LD90 [µm] 0.313 0.332 0.295 0.313 ± 0.018 LD95 [µm] 0.408 0.445 0.379 0.410 ± 0.033
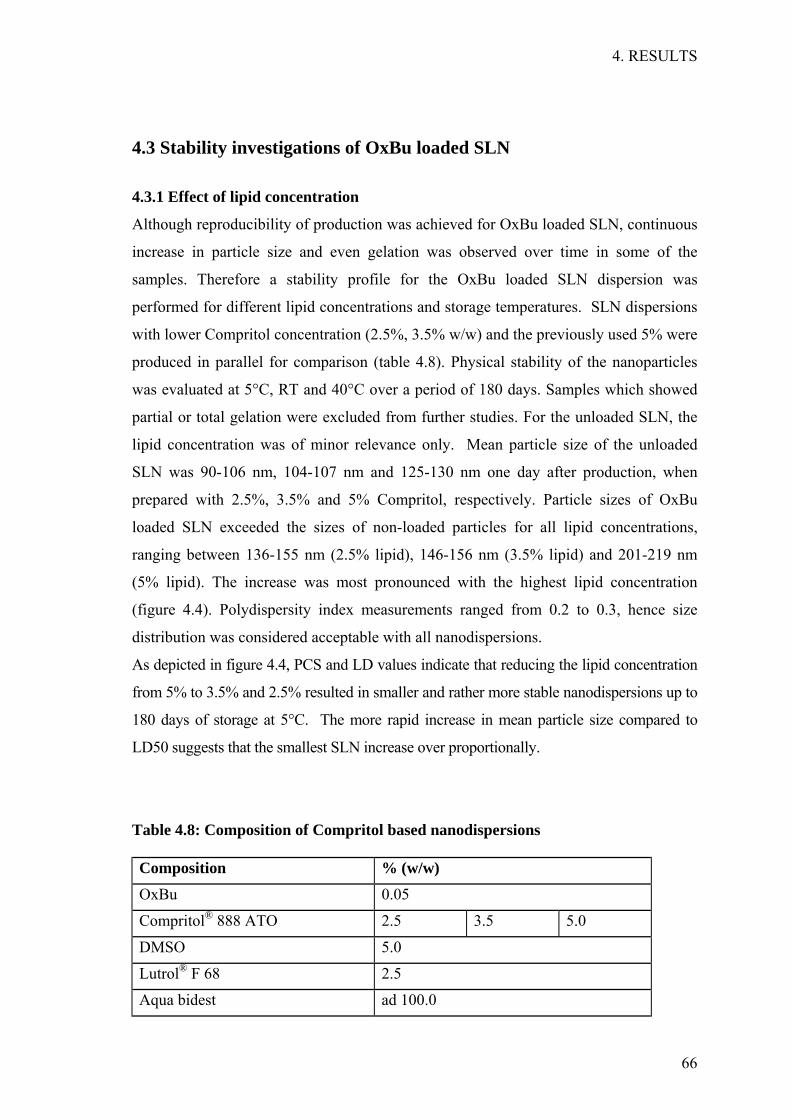
4. RESULTS
66
4.3 Stability investigations of OxBu loaded SLN
4.3.1 Effect of lipid concentration
Although reproducibility of production was achieved for OxBu loaded SLN, continuous
increase in particle size and even gelation was observed over time in some of the
samples. Therefore a stability profile for the OxBu loaded SLN dispersion was
performed for different lipid concentrations and storage temperatures. SLN dispersions
with lower Compritol concentration (2.5%, 3.5% w/w) and the previously used 5% were
produced in parallel for comparison (table 4.8). Physical stability of the nanoparticles
was evaluated at 5°C, RT and 40°C over a period of 180 days. Samples which showed
partial or total gelation were excluded from further studies. For the unloaded SLN, the
lipid concentration was of minor relevance only. Mean particle size of the unloaded
SLN was 90-106 nm, 104-107 nm and 125-130 nm one day after production, when
prepared with 2.5%, 3.5% and 5% Compritol, respectively. Particle sizes of OxBu
loaded SLN exceeded the sizes of non-loaded particles for all lipid concentrations,
ranging between 136-155 nm (2.5% lipid), 146-156 nm (3.5% lipid) and 201-219 nm
(5% lipid). The increase was most pronounced with the highest lipid concentration
(figure 4.4). Polydispersity index measurements ranged from 0.2 to 0.3, hence size
distribution was considered acceptable with all nanodispersions.
As depicted in figure 4.4, PCS and LD values indicate that reducing the lipid concentration
from 5% to 3.5% and 2.5% resulted in smaller and rather more stable nanodispersions up to
180 days of storage at 5°C. The more rapid increase in mean particle size compared to
LD50 suggests that the smallest SLN increase over proportionally.
Table 4.8: Composition of Compritol based nanodispersions
Composition % (w/w)
OxBu 0.05
Compritol® 888 ATO 2.5 3.5 5.0
DMSO 5.0
Lutrol® F 68 2.5
Aqua bidest ad 100.0
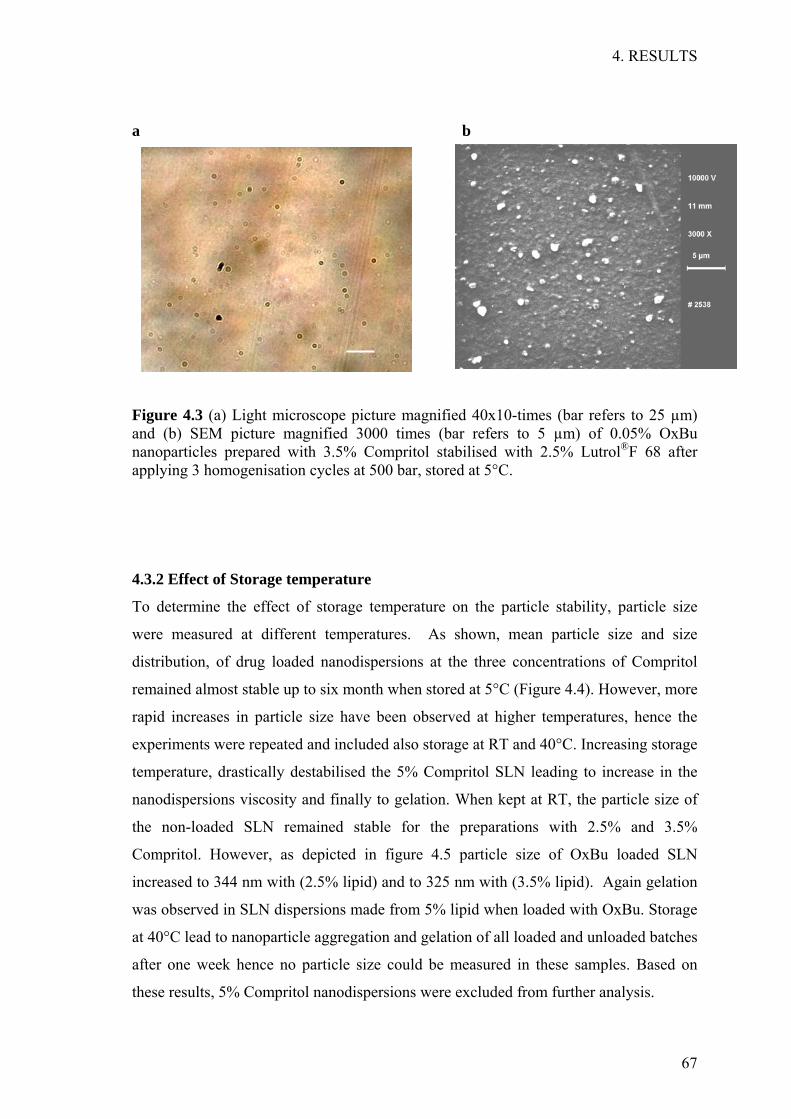
4. RESULTS
67
a b
Figure 4.3 (a) Light microscope picture magnified 40x10-times (bar refers to 25 µm) and (b) SEM picture magnified 3000 times (bar refers to 5 µm) of 0.05% OxBu nanoparticles prepared with 3.5% Compritol stabilised with 2.5% Lutrol®F 68 after applying 3 homogenisation cycles at 500 bar, stored at 5°C.
4.3.2 Effect of Storage temperature
To determine the effect of storage temperature on the particle stability, particle size
were measured at different temperatures. As shown, mean particle size and size
distribution, of drug loaded nanodispersions at the three concentrations of Compritol
remained almost stable up to six month when stored at 5°C (Figure 4.4). However, more
rapid increases in particle size have been observed at higher temperatures, hence the
experiments were repeated and included also storage at RT and 40°C. Increasing storage
temperature, drastically destabilised the 5% Compritol SLN leading to increase in the
nanodispersions viscosity and finally to gelation. When kept at RT, the particle size of
the non-loaded SLN remained stable for the preparations with 2.5% and 3.5%
Compritol. However, as depicted in figure 4.5 particle size of OxBu loaded SLN
increased to 344 nm with (2.5% lipid) and to 325 nm with (3.5% lipid). Again gelation
was observed in SLN dispersions made from 5% lipid when loaded with OxBu. Storage
at 40°C lead to nanoparticle aggregation and gelation of all loaded and unloaded batches
after one week hence no particle size could be measured in these samples. Based on
these results, 5% Compritol nanodispersions were excluded from further analysis.
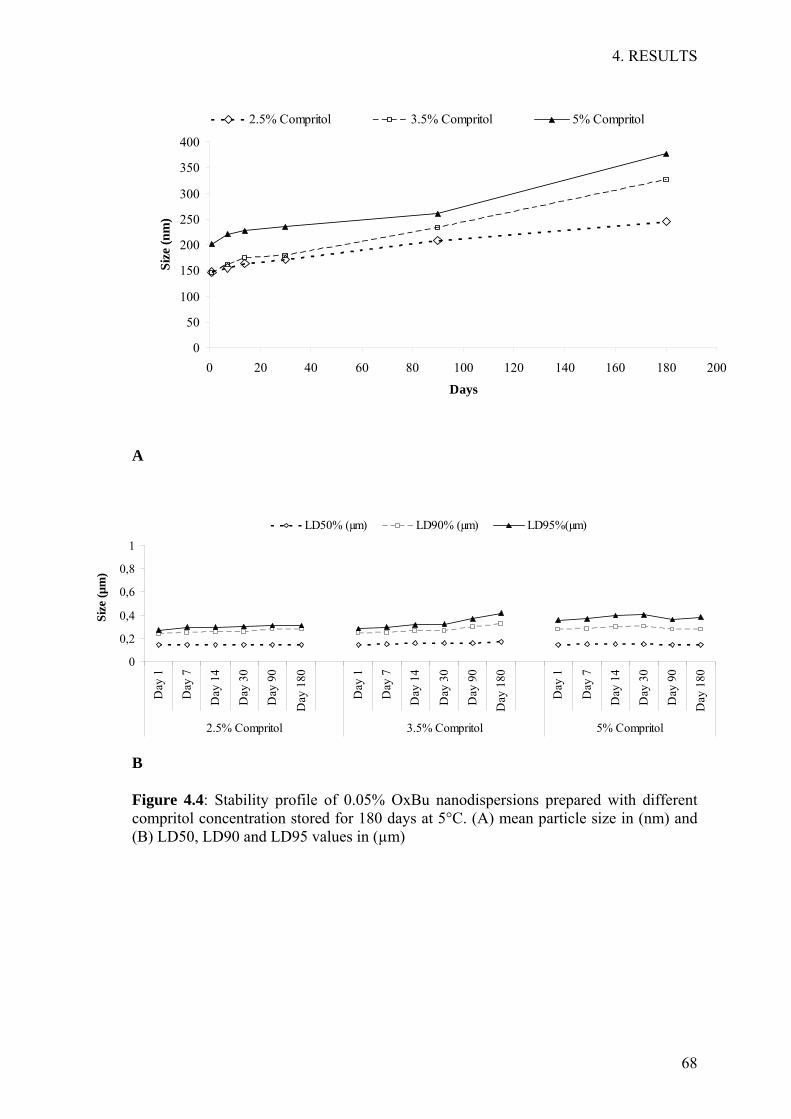
4. RESULTS
68
0
50
100
150
200
250
300
350
400
0 20 40 60 80 100 120 140 160 180 200
Size
(nm
)
2.5% Compritol 3.5% Compritol 5% Compritol
Days
A
B
Figure 4.4: Stability profile of 0.05% OxBu nanodispersions prepared with different compritol concentration stored for 180 days at 5°C. (A) mean particle size in (nm) and (B) LD50, LD90 and LD95 values in (µm)
0
0,2
0,4
0,6
0,8
1
Day
1
Day
7
Day
14
Day
30
Day
90
Day
180
Day
1
Day
7
Day
14
Day
30
Day
90
Day
180
Day
1
Day
7
Day
14
Day
30
Day
90
Day
180
2.5% Compritol 3.5% Compritol 5% Compritol
Size
(µm
)
LD50% (µm) LD90% (µm) LD95%(µm)

4. RESULTS
69
Figure 4.5 Mean particle size (nm) of OxBu loaded (closed symbols) and unloaded (open symbols) SLN stored at RT for 1 month. ∆ 2.5%; ∇ 3.5% Compritol, both with 2.5% Lutrol® F 68. Gelation occurred in the OxBu loaded SLN after 30 days of storage at RT when prepared with 5% Compritol.
4.3.3 Effect of drug loading
In order to study the drug loading capacity of the SLN as well as the drug’s effect on
particle stability, SLN dispersions with four different OxBu concentrations (0.05, 0.1,
0.15, and 0.25 %) were prepared and the particle size was measured over 180 days.
Given the results obtained for storage temperature and medium term stability and
specifically the PI values, all further work was based on the 3.5% Compritol SLN.
Solubilisation of OxBu at higher concentrations was only partially possible and
frequently led to precipitation and crystal formation (data not shown). However,
addition of Tween 80 (polysorbate 80) to help drug solubilisation in the lipid phase, in
addition to that by Lutrol® F 68 in the aqueous phase, enabled a 5 fold increase of a
drug loading of max. 0.25%. Increases in particle size due to OxBu loading were
comparatively small at low OxBu concentrations but considerably more pronounced at
the highest, with an average size of 180 nm at 0.25%. Although the combination of 2
emulsifiers gave particles size below 100 nm, the PI ranged between 0.5-0.7 indicating
a wide distribution and hence instability of the nanodispersions. As expected the particle
size grew over time, but this effect was much less pronounced than that with increased
drug loading (see figure 4.6). The increase of DMSO from 5% to 10% seemed to have
very little effect on particle size or particle growth rate (figure 4.7).
0 10 20 30 400
100
200
300
400
Time (days)
Part
icle
siz
e (n
m)

4. RESULTS
70
A
B OxBu% Value Day1 Day7 Day14 Day30 Day180 0% LD50 [µm] 0.136 0.134 0.136 0.135 0.149 LD90 [µm] 0.204 0.215 0.233 0.226 0.276 LD95 [µm] 0.227 0.292 0.272 0.257 0.314 0.05%
LD50 [µm] 0.13 0.135 0.136 0.139 0.147 LD90 [µm] 0.194 0.2 0.202 0.203 0.28 LD95 [µm] 0.214 0.221 0.223 0.224 0.39
0.1%
LD50 [µm] 0.138 0.137 0.14 0.14 0.15 LD90 [µm] 0.222 0.232 0.208 0.211 0.231 LD95 [µm] 0.247 0.262 0.232 0.234 0.39
0.15%
LD50 [µm] 0.138 0.137 0.141 0.14 0.15 LD90 [µm] 0.226 0.234 0.237 0.232 0.238 LD95 [µm] 0.256 0.269 0.267 0.265 0.284
0.25%
LD50 [µm] 0.148 0.153 0.157 0.155 0.164 LD90 [µm] 0.273 0.29 30.3 0.332 0.356 LD95 [µm] 0.338 0.368 0.377 0.444 0.478
Figure 4.6: Stability profile of nanodispersions prepared with (3.5% Compritol, 2.5% Lutrol® F68, 2.5% Tween 80, 5% DMSO) and OxBu concentrations (0-0.25%) (A) graph showing mean particle size (nm) and (B) table with LD50, LD90, LD95 values (µm)
0
50
100
150
200
250
1 7 14 30 180Time (days)
Size
(nm
)
0% OxBu 0.05% OxBu 0.1% OxBu 0.15% OxBu 0.25% OxBu
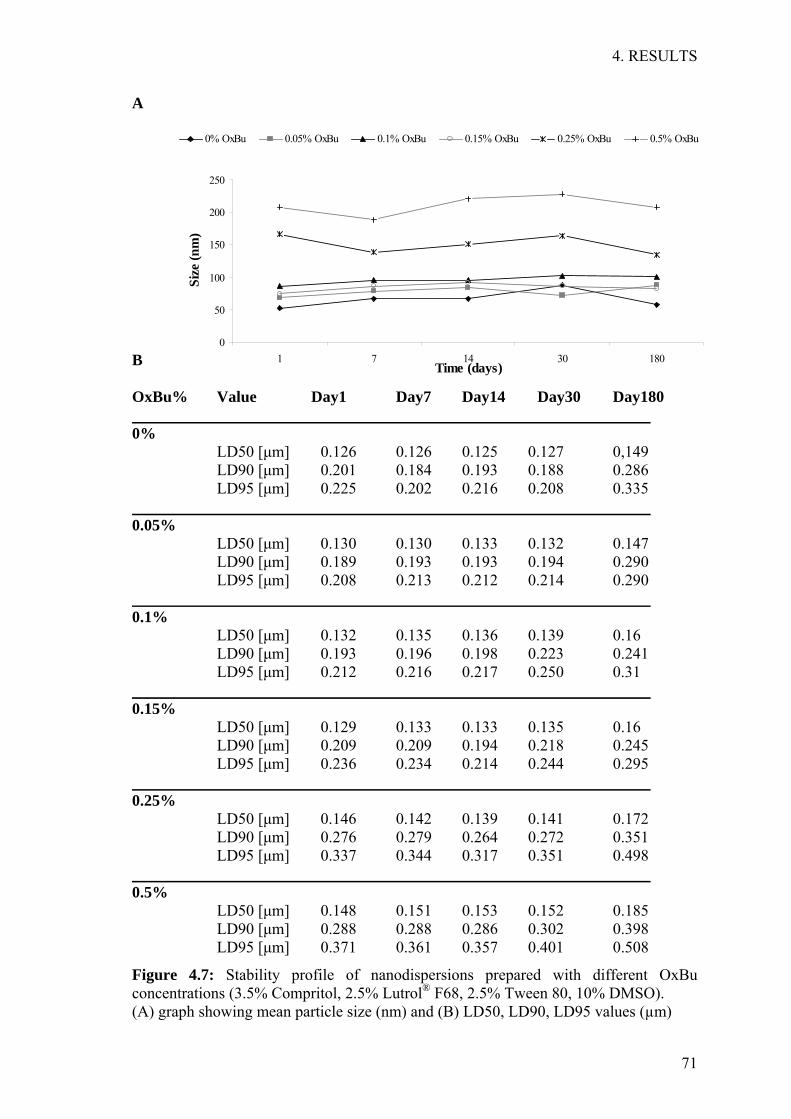
4. RESULTS
71
A B OxBu% Value Day1 Day7 Day14 Day30 Day180 0% LD50 [µm] 0.126 0.126 0.125 0.127 0,149 LD90 [µm] 0.201 0.184 0.193 0.188 0.286 LD95 [µm] 0.225 0.202 0.216 0.208 0.335 0.05% LD50 [µm] 0.130 0.130 0.133 0.132 0.147 LD90 [µm] 0.189 0.193 0.193 0.194 0.290 LD95 [µm] 0.208 0.213 0.212 0.214 0.290 0.1% LD50 [µm] 0.132 0.135 0.136 0.139 0.16 LD90 [µm] 0.193 0.196 0.198 0.223 0.241 LD95 [µm] 0.212 0.216 0.217 0.250 0.31 0.15% LD50 [µm] 0.129 0.133 0.133 0.135 0.16 LD90 [µm] 0.209 0.209 0.194 0.218 0.245 LD95 [µm] 0.236 0.234 0.214 0.244 0.295 0.25% LD50 [µm] 0.146 0.142 0.139 0.141 0.172 LD90 [µm] 0.276 0.279 0.264 0.272 0.351 LD95 [µm] 0.337 0.344 0.317 0.351 0.498 0.5% LD50 [µm] 0.148 0.151 0.153 0.152 0.185 LD90 [µm] 0.288 0.288 0.286 0.302 0.398 LD95 [µm] 0.371 0.361 0.357 0.401 0.508
Figure 4.7: Stability profile of nanodispersions prepared with different OxBu concentrations (3.5% Compritol, 2.5% Lutrol® F68, 2.5% Tween 80, 10% DMSO). (A) graph showing mean particle size (nm) and (B) LD50, LD90, LD95 values (µm)
0
50
100
150
200
250
1 7 14 30 180Time (days)
Size
(nm
)
0% OxBu 0.05% OxBu 0.1% OxBu 0.15% OxBu 0.25% OxBu 0.5% OxBu

4. RESULTS
72
4.4 Characterisation of SLN drug interaction
4.4.1 Parelectric Spectroscopy
Parelectric spectroscopy was employed to measure the drug entrapment efficiency in the
Compritol based SLN when different drug concentrations were loaded. Only Lutrol® F
68 was used as an emulsifier for OxBu concentrations below 0.05%, while Tween 80
was used as co emulsifier for all higher concentrations (see table 4.9). As before OxBu
dilutions were chosen for DMSO to reach a final concentration of 5%, however the
effect of increasing DMSO to 10% was also tested. Dipole density measurements
increased in line with the concentration of OxBu (figure 4.8). Tween 80 slightly
decreases dipole density as indicated by the comparison of the 0% and 0.05% OxBu
samples with and without the additional emulsifier. Dipole mobility remained stable at
around 0.05 with and around 0.06 without Tween 80 respectively. The results indicate
that the OxBu molecules are either completely incorporated in the lipid matrix of the
nanoparticles or alternatively OxBu is free in solution and not associated with particle
surface (figure 4.8) when a combination of Tween 80 and Lutrol® F68 was used.
However this is unlikely, since the slight increase in dipole density indicates that OxBu
itself has slight dipole properties and hence full incorporation is suggested. In fact,
measurements at high frequencies confirmed that there was no free OxBu in solution
(data not shown). Additionally, OxBu as analysed by HLPC indicated drug entrapment
by 96 +0.3% (data not shown).
Table 4.9: Composition of OxBu SLN used for parelectric spectroscopy measurement
Composition %
OxBu 0- 0.05 0.05-0.5
Compritol® 888 ATO 3.5 3.5
Lutrol F®68 2.5 2.5
Tween 80 - 2.5
DMSO 5.0 5.0- 10.0
Aqua bidest ad 100 ad 100
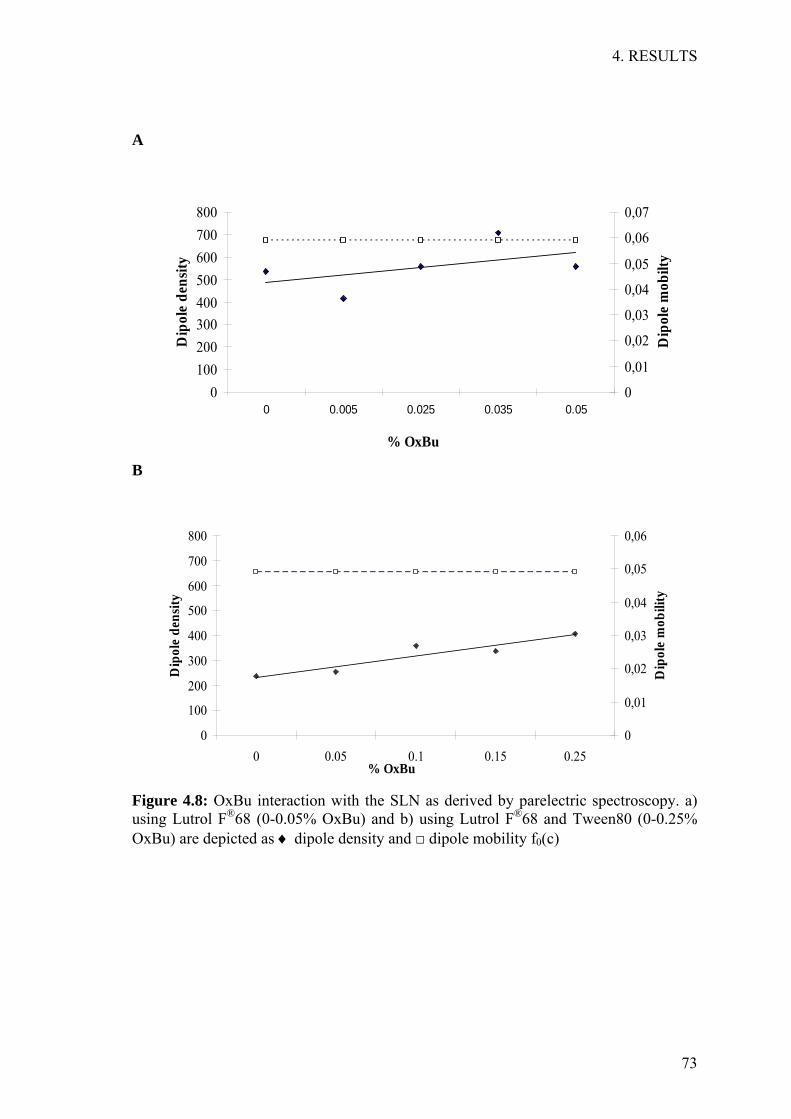
4. RESULTS
73
A
B
Figure 4.8: OxBu interaction with the SLN as derived by parelectric spectroscopy. a) using Lutrol F®68 (0-0.05% OxBu) and b) using Lutrol F®68 and Tween80 (0-0.25% OxBu) are depicted as ♦ dipole density and □ dipole mobility f0(c)
0
100
200
300
400
500
600
700
800
0 0.05 0.1 0.15 0.25% OxBu
Dip
ole
dens
ity
0
0,01
0,02
0,03
0,04
0,05
0,06
Dip
ole
mob
ility
0100200300400500600700800
0 0.005 0.025 0.035 0.05
% OxBu
Dip
ole
dens
ity
0
0,01
0,02
0,03
0,04
0,05
0,06
0,07
Dip
ole
mob
ilty

4. RESULTS
74
4.5 SLN embedded hydrogels
4.5.1 Optimisation and particle characterisation in semisolid dosage form
Four different hydrogels were prepared using different gel forming polymers. They
were either directly added to the nanodispersions or mixed as plain gel together with the
unloaded SLN to obtain a semisolid dosage form (table 4.10). To determine the
influence of SLN incorporation into hydrogels, particle size was determined before and
after incorporation, by measuring mean particle size of diluted gels in comparison to
unloaded SLN alone. Especially for Carbopol based gel, carboxylic groups need to be
neutralised with a base, as described in the method section, for a gel to form. This
neutralisation process could lead to particle aggregation due to the presence of sodium
ions which has the consequence of decreasing zeta potential. However, this did not
seem to have an effect on the poloxamer stabilised glyceryl behenate lipid
nanoparticles. Particle size analysis showed that for all tested formulations, the particles
were below 200 nm when stored for 120 days at RT. Particle size measurements varied
from 133 nm for the unloaded SLN, 195 nm for carmellose sodium, 145 nm for Tylose
10000, 147 nm and 151 nm for Tylose 30000 and Carbopol 940 respectively.
Polydispersity index ranged between 0.3-0.35 for all hydrogels except for carmellose
sodium where it was slightly higher (approx 0.45).
Table 4.10: Composition of different SLN embedded gel formulations
Gel Composition % (w/w) Carbopol 940 0.50 Sodium Hydroxide 0.05 SLN (3.5% compritol) 50.00
1
Aqua Bidest ad 100.0 Tylopur C600 5.45
2 SLN (3.5% compritol) ad 100.0 Tylose H10000 2.50 Glycerine 10.0
3
SLN (3.5% compritol) ad 100 Tylose H30000 2.50
4 SLN ad 100.0

4. RESULTS
75
A
B
Figure 4.9 A) Mean particle size (nm) and PI of SLN before and after incorporation into different hydrogels measured after 1 (open column) and 120 days (closed column) of storage at RT. B) Scanning electron microscope picture of unloaded nanoparticles embedded in gel (bar refers to 5 µm) The incorporation into the gel matrix did not lead to significant increases in SLN particle size or particle aggregation and denotes a substantial improvement in stability. The results were also confirmed by the scanning electron microscope pictures of the nanoparticles embedded in gel matrix depicted in (figure 4.9). .

4. RESULTS
76
*** *** ***
OxBu SLN 1:
100
SLN 1:10
0
OxBu SLN 1:
1000
SLN 1:10
00
1µM O
xBu
10µM
OxB
u
100µ
M OxB
u0
25
50
75
100
125
150
175SCC25SCC12NHK
% V
iabi
lity
***
4.6 Evaluation of cytotoxicity in 2D-cell culture
4.6.1 Cell Viability
The cytotoxicity of OxBu solution was compared to the unloaded and loaded SLN with
3.5% compritol (at 1:100 and 1:1000 dilutions equivalent to 10 µM and 1 µM OxBu
respectively) in NHK as well as in SCC12 and SCC25 cell lines.
The results obtained (figure 4.10) show that OxBu concentration of 100 µM induced a
reduction of viability of about 40% and 51% in SCC12 and SCC25 respectively,
compared to cells treated with solvent (0.5% DMSO) control. At lower concentrations
(10 and 1 µM OxBu), cytotoxicity was much less pronounced in SCC25 and was not
even observed in SCC12. However when 1 µM (0.00005%) or 10 µM (0.0005%) OxBu
loaded SLN were tested, cytotoxicity in both SCC cell lines was found to be significant,
with viability being reduced to 36.5% and 49% in SCC12 and SCC25 respectively. At
these concentrations even more pronounced cytotoxicity was observed in NHK where
viability was reduced to less than 10%. While no reduction in case of NHK was
observed at any of the tested concentrations of OxBu solution which is in accordance
with previous results by (Schwanke et al. 2010). This suggests that SLN enhance the
cytotoxic effect of OxBu considerably in all cell lines tested.
Figure 4.10: Cell viability testing in NHK, SCC12, SCC25 cell lines (48 hrs) of unloaded SLN, 0.05% OxBu loaded SLN and OxBu solution at concentrations of 1, 10 and 100 µM, (n=3, *p< 0.05 versus control)

4. RESULTS
77
4.6.2 p53 regulation
As response to DNA damage, several cellular and molecular processes are activated due
to cellular stress which results in either DNA repair or programmed cell death. The
tumour suppressor p53 was shown to play an important role in this process and was
used as read out parameter for SCC prognosis. Selection of the dose was based on
previous studies (Singh, et al. 2007) where 750 µM 5-FU was used to study the
regulation of p53 in Hep-2 and HeLa cells. The effect of OxBu and its sodium salt on
p53 induction was compared to the induction by 5-FU in monolayer cell cultures of
SCC12, SCC25 as well as normal human keratinocytes (NHK) cells. For this, cells were
incubated at two different concentrations 750 µM and 100 µM. In parallel, cells treated
with similar amount of DMSO, sodium hydroxide or water served as solvent controls
respectively. After 48 hrs incubation, cells were lysed and the intracellular level of p53
was quantified using ELISA. As shown in fig. 4.11, a reduction in p53 protein to 58%
and 73% was observed in SCC12 cells treated with 750 µM and 100 µM OxBu, when
compared to the solvent control. Unlike the reduction observed with OxBu, an increase
was found after exposure to 5-FU. This induction was dose-dependent with an
enhancement by 60% for the lower (100 µM) while a doubling was observed for the
higher (750 µM) concentration. In SCC25, an even more pronounced reduction in the
p53 level was observed after treatment with OxBu and the sodium salt. p53 was down
to 21% when treated with 750 µM OxBu and to 18 % and 32% when treated with 750
µM and 100 µM sodium salt. As was the case with SCC12, 750 µM 5-FU increased p53
levels in SCC 25 cells. However, at the lower concentration a reduction to 75% was
found (Figure 4.11b).
In normal human keratinocytes, OxBu and its sodium form reduced p53 to 49% and
47%, and to 50% and 64% at the higher and lower concentrations respectively. 5-FU
again induced p53 by 59% compared to its solvent treated control.
Taken together, the regulation of p53 indicates that OxBu and 5-FU exert their effects
via different molecular mechanisms, but the overall response does not give a concrete
enough picture on the effect of the treatment hence other method should also be used for
further investigation.
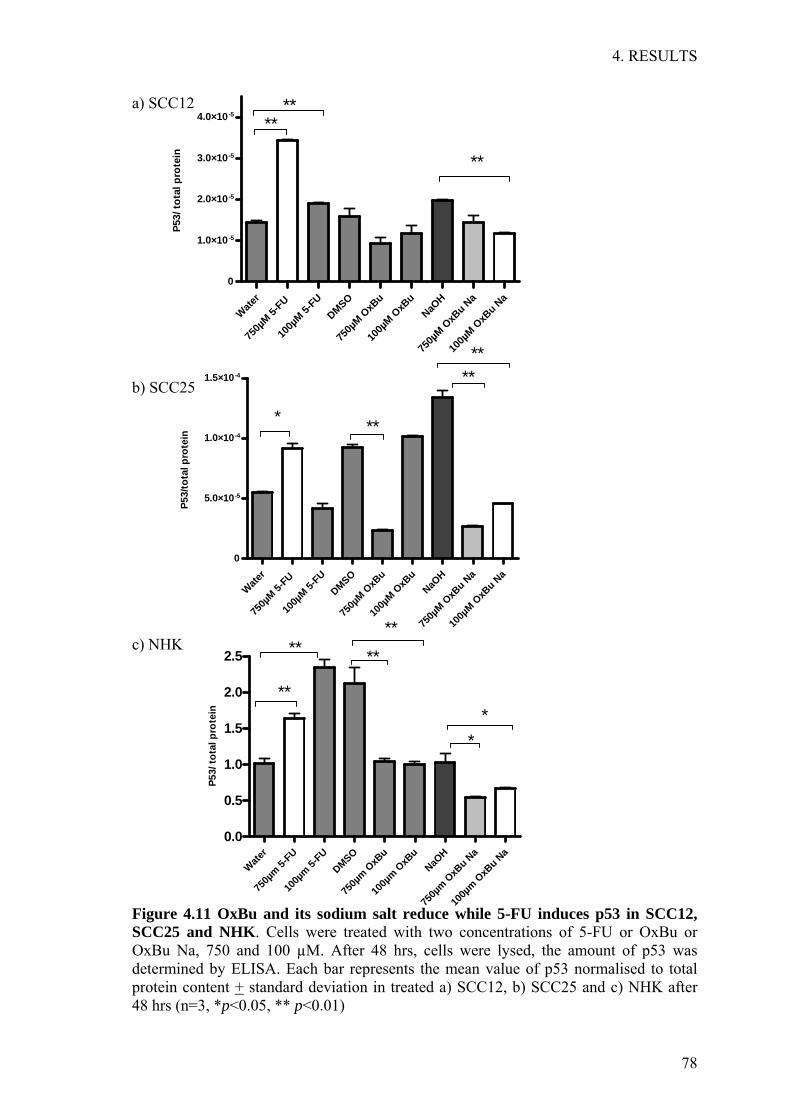
4. RESULTS
78
a) SCC12
b) SCC25
c) NHK
Figure 4.11 OxBu and its sodium salt reduce while 5-FU induces p53 in SCC12, SCC25 and NHK. Cells were treated with two concentrations of 5-FU or OxBu or OxBu Na, 750 and 100 µM. After 48 hrs, cells were lysed, the amount of p53 was determined by ELISA. Each bar represents the mean value of p53 normalised to total protein content + standard deviation in treated a) SCC12, b) SCC25 and c) NHK after 48 hrs (n=3, *p<0.05, ** p<0.01)
Water
750µ
m 5-FU
100µ
m 5-FU
DMSO
750µ
m OxB
u
100µ
m OxB
uNaO
H
750µ
m OxB
u Na
100µ
m OxB
u Na
0.0
0.5
1.0
1.5
2.0
2.5
**
******
**
P53/
tota
l pro
tein
Water
750µ
M 5-FU
100µ
M 5-FU
DMSO
750µ
M OxB
u
100µ
M OxB
uNaO
H
750µ
M OxB
u Na
100µ
M OxB
u Na
0
5.0×10⁻⁵
1.0×10⁻⁴
1.5×10⁻⁴
****
***
P53/
tota
l pro
tein
Water
750µ
M 5-FU
100µ
M 5-FU
DMSO
750µ
M OxB
u
100µ
M OxB
uNaO
H
750µ
M OxB
u Na
100µ
M OxB
u Na
0
1.0×10⁻⁵
2.0×10⁻⁵
3.0×10⁻⁵
4.0×10⁻⁵
**
****
P53/
tota
l pro
tein

4. RESULTS
79
4.7 Studies on reconstructed three dimensional tumour constructs
4.7.1 Building of 3D tumour constructs
The building of tumour models can be subdivided into three phases, the creation of the
dermal equivalent, made up of collagen and fibroblasts, the initiation of an epidermal
equivalent made up of keratinocytes and the differentiation of the epidermal equivalent
into distinct layers. Based on the method of Höller-Obrigkeit and colleagues (Höller-
Obrigkeit et al. 2009), the growth conditions included 21-23 days of culture
(7 days submerged culture, 14 days air liquid interface followed by seeding SCC12 cells
for another 48 hrs). Epidermal equivalent initiation was achieved through seeding NHK
at density of 1x10⁶ cells on top of each dermal equivalent (2x10⁶ NDHF). The models
were grown on 10% serum culture medium in 6 well culture plates (2-3 ml volume
capacity) and during the air liquid interface, the models were lift up on rubber stoppers.
This setting resulted in excess medium reaching the epidermis, which lead to a patchy
covering and insufficient cell layering. Moreover, the instability of the rubber stoppers
lead to formation of air bubbles underneath the models, hence using the above
conditions, epidermal differentiation was not fully achieved (figure 4.12.1).
4.7.2 Improvement of 3D tumour constructs
The above method was further optimised in order to get better histological features of
the epidermis in the constructs and to be able to assess the activity of OxBu and the
employed carrier system. This included shorter incubation period (5 days submerged
culture conditions, 5-7 days at the air liquid interface followed by seeding SCC12 cells).
Epidermal equivalent initiation was achieved through seeding keratinocytes at density
of 2x10⁶ cells on top of the dermal equivalent (1x10⁶ NDHF). Since the air liquid
interface is very crucial for keratinocytes differentiation, deep 6 well plates (12-17 ml
volume) were used which had the advantage that fixed volume of medium (9.3 ml) can
diffuse through the insert membrane to the collagen without air bubbles formation or
excess medium reaching the epidermis, which lead to better epidermal differentiation and
histological features of the construct. Light microscopy examination of H&E stained
constructs sections (figure 4.12.2) connected to a dermal equivalent through a basal
membrane. The invasion of the SCC in the tumour constructs was examined at different
time points by light microscopy of H&E stained paraffin embedded sections.

4. RESULTS
80
Figure 4.12.1 Paraffin embedded section (5 µm thick) stained with haematoxylin and eosin (H&E) showing the histological features of SCC construct developed at RWTH Aachen (left) and at FU-Berlin (right) using the culture conditions described in section 4.7.1 (bar = 30 µm)
A B
C D Figure 4.12.2 Histological sections of tumour constructs build at FU-Berlin using the culture conditions described in section 4.7.2 showing (A) normal constructs (no SCC) with 1) stratum corneum, 2) epidermis consisting of 5-6 keratinocyte layers and 3) dermis (B) 48 hrs after seeding of SCC cells onto the surface of the SE, altered morphology of the epidermis with prominent parakeratosis (C) three days and (D) four days after seeding, showing SCC nests in different layers of the epidermis and SCC cells penetrating through the disrupted basement membrane zone (bar = 30 µm)
1
3
2
4
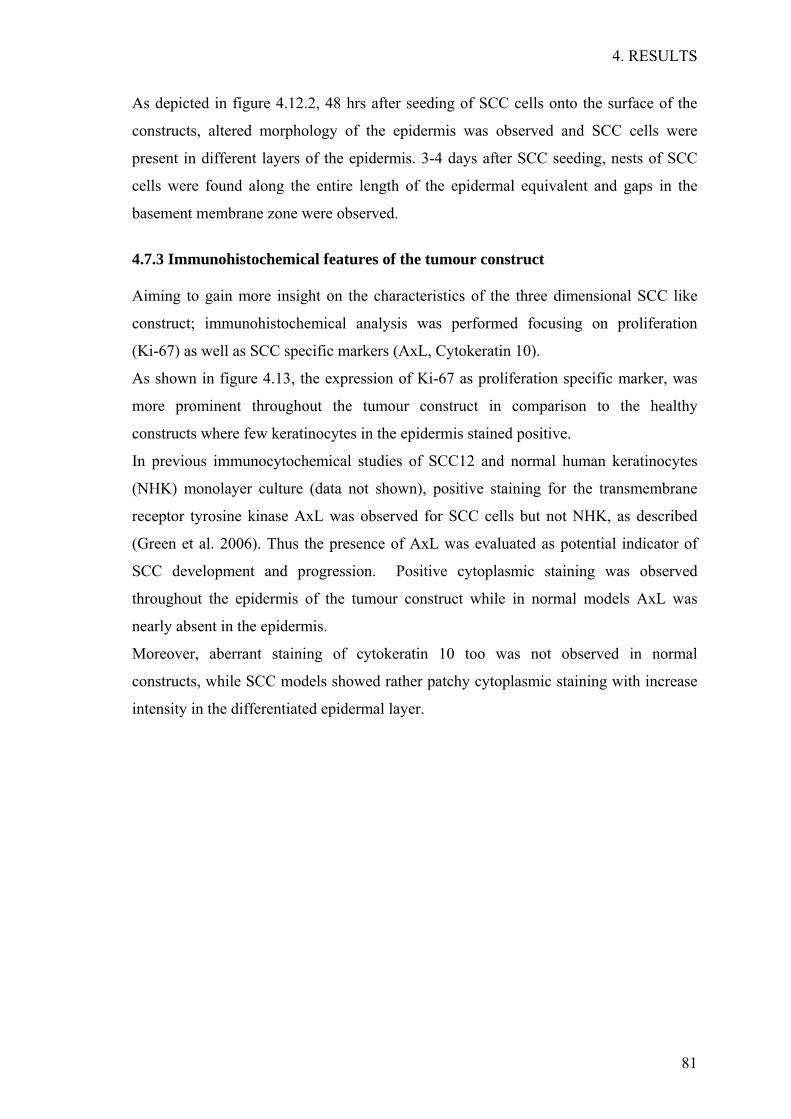
4. RESULTS
81
As depicted in figure 4.12.2, 48 hrs after seeding of SCC cells onto the surface of the
constructs, altered morphology of the epidermis was observed and SCC cells were
present in different layers of the epidermis. 3-4 days after SCC seeding, nests of SCC
cells were found along the entire length of the epidermal equivalent and gaps in the
basement membrane zone were observed.
4.7.3 Immunohistochemical features of the tumour construct
Aiming to gain more insight on the characteristics of the three dimensional SCC like
construct; immunohistochemical analysis was performed focusing on proliferation
(Ki-67) as well as SCC specific markers (AxL, Cytokeratin 10).
As shown in figure 4.13, the expression of Ki-67 as proliferation specific marker, was
more prominent throughout the tumour construct in comparison to the healthy
constructs where few keratinocytes in the epidermis stained positive.
In previous immunocytochemical studies of SCC12 and normal human keratinocytes
(NHK) monolayer culture (data not shown), positive staining for the transmembrane
receptor tyrosine kinase AxL was observed for SCC cells but not NHK, as described
(Green et al. 2006). Thus the presence of AxL was evaluated as potential indicator of
SCC development and progression. Positive cytoplasmic staining was observed
throughout the epidermis of the tumour construct while in normal models AxL was
nearly absent in the epidermis.
Moreover, aberrant staining of cytokeratin 10 too was not observed in normal
constructs, while SCC models showed rather patchy cytoplasmic staining with increase
intensity in the differentiated epidermal layer.
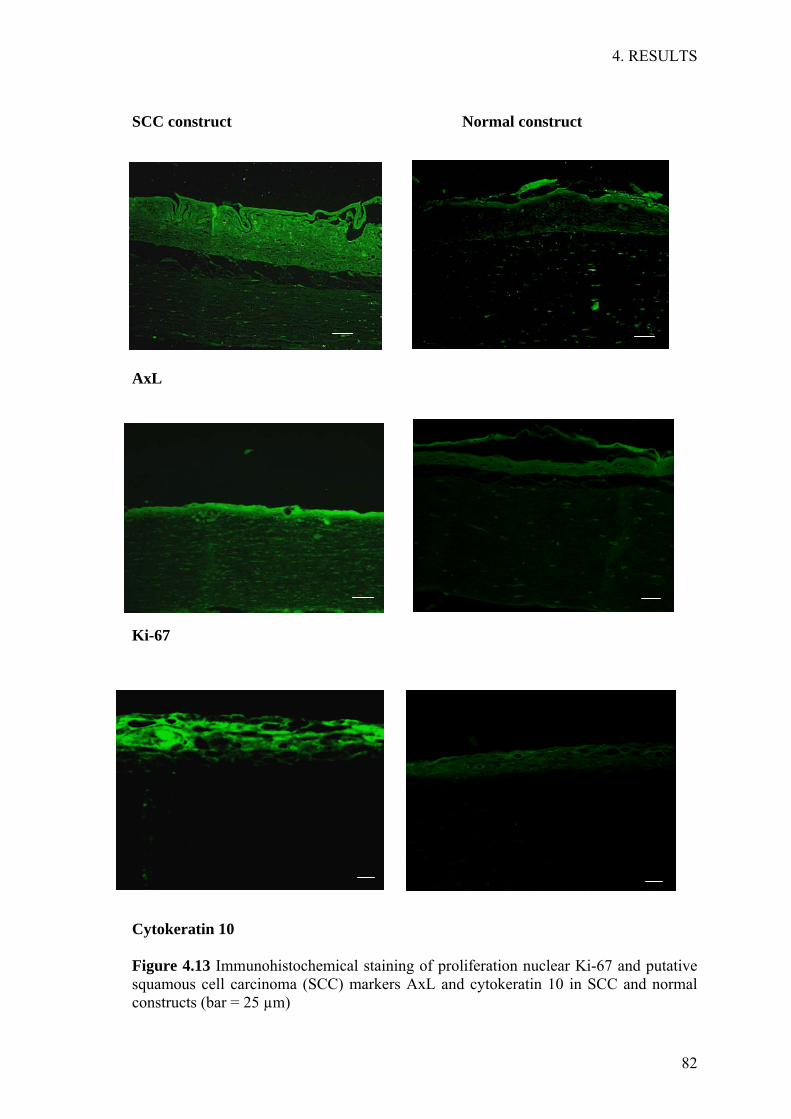
4. RESULTS
82
SCC construct Normal construct
AxL
Ki-67
Cytokeratin 10
Figure 4.13 Immunohistochemical staining of proliferation nuclear Ki-67 and putative squamous cell carcinoma (SCC) markers AxL and cytokeratin 10 in SCC and normal constructs (bar = 25 µm)

4. RESULTS
83
4.7.4 Activity testing in tumour constructs: qualitative evaluation
In preliminary studies on the tumour constructs (sent from RWTH Aachen), a dose
finding experiment was performed comparing the effect of applying double dose
(day 1 and 3, within 5 days) of 0.025%, 0.05% and 0.1% OxBu solution. For
immunohistochemistry, sections were stained with Ki-67 to detect SCC proliferation in
the tumour construct, anti-matrix metalloproteinase MMP2 to detect both the latent and
active the enzyme, hence indicating invasion. Finally apoptosis was assessed by anti-
caspase-7 staining. The results obtained from immunohistochemical analysis in (table
4.11) showed a more pronounced apoptotic activity of 0.05% and OxBu than 0.025% as
shown by the expression of caspase7. Meanwhile 0.05% and 0.1% appeared equipotent,
hence 0.05% was chosen for further investigations.
Table 4.11: Immunofluorescence staining results of the dose finding experiments after the application of (double dose, day 1 and 3, within 5 days) of 0.025%, 0.05% or 0.1% of OxBu solutions
Ki-67 MMP2 Caspase 7
Control
0.025% OxBu
0.05% OxBu
0.1% OxBu

4. RESULTS
84
Next, the tumour constructs were treated with 0.05% OxBu solution, Efudex cream (5%
5-FU cream) or phosphate buffer pH 7.4 (PBS, negative control), respectively. The
constructs were treated by applying 10µl/cm2 of the test substance either as single
(day 1) or double dose (day 1+3) within 5 days in total. The outcomes of
immunofluorescence staining (table 4.12) indicates double dose application of
0.05%OxBu solution to be at least as active as 5% 5-FU in terms of inducing apoptosis
(caspase7) and reducing proliferation (Ki-67) and metastasis (MMP2).
Table 4.12: Immunofluorescence staining of Ki-67, MMP2, P-Cadherin and caspase 7 in tumour constructs treated with 0.05% OxBu solution and 5% 5-FU (Efudex cream) after single (day 1) and double (day 1 and 3) dose applications within 5 days
Treatment Ki-67 MMP2 P-Cadherin Caspase 7
Control
0.05% OxBu
Single dose
0.05% OxBu
Double dose
5% 5-FU
Single dose
5% 5-FU
Double dose

4. RESULTS
85
To investigate the efficacy of topical treatment with OxBu -loaded and unloaded SLN,
tumour constructs were treated with 10µl/cm2 of 0.05% (10-3 M) OxBu, OxBu Na, or OxBu
loaded SLN. 10-3 M 5-FU served as a positive control whereas the respective solvents,
lacking the active component were used as negative controls. Both the SLN preparation
and the drug solutions were applied on the surface of the constructs 48hrs after seeding
the SCC and repeated once within 5 days (day 1 and 3). At the end of the treatment,
sections were stained with antibodies directed against Ki-67 as proliferation marker,
MMP2 as detector of SCC invasion into the construct, AxL and cytokeratin 10 as SCC
specific markers and Caspase 7 for apoptosis detection. For each marker, staining of three
different tissues was visually evaluated by at least three independent persons who graded
the staining intensity. As summarised in table 4.13, strong presence of markers specific
for SCC, tumour progression, invasion while weak expression of markers specific for
apoptosis was observed in the DMSO solvent control. In contrast apoptosis was induced
by OxBu, OxBu SLN, and to moderate extent by 5-FU and OxBu Na, as indicated by
caspase 7 expression. On the other hand, moderate to strong presence of MMP2 was
observed in all treatment groups with the exception for OxBu and OxBu loaded SLN
where it was reduced. Strong epidermal staining with AxL was observed in both solvent
controls as well as treated constructs but rather moderate after OxBu and OxBu SLN
treatment. OxBu, OxBu Na, OxBu loaded SLN and 5-FU reduced in the mitotic activity
of the SCC construct as demonstrated by less staining in the proliferation marker Ki-67.
Furthermore, the expression of cytokeratin 10 was present in all control constructs but
was less aberrant in OxBu, OxBu Na and OxBu SLN and 5-FU treated groups.
Table 4.13: Evaluation of immunohistochemical staining indicated as strong +++, moderate presence ++, weak presence + or absence – of the respective antigen in the treated tumour constructs Antigen DMSO OxBu OxBuNa OxBuSLN SLN Water 5-FU
Ki-67 +++ ++ ++ ++ +++ +++ ++
MMP2 +++ + ++ + ++ +++ +++
AxL +++ ++ +++ ++ +++ +++ +++
Cytokeratin +++ ++ ++ ++ +++ +++ ++
Caspase 7 + +++ ++ +++ ++ - ++
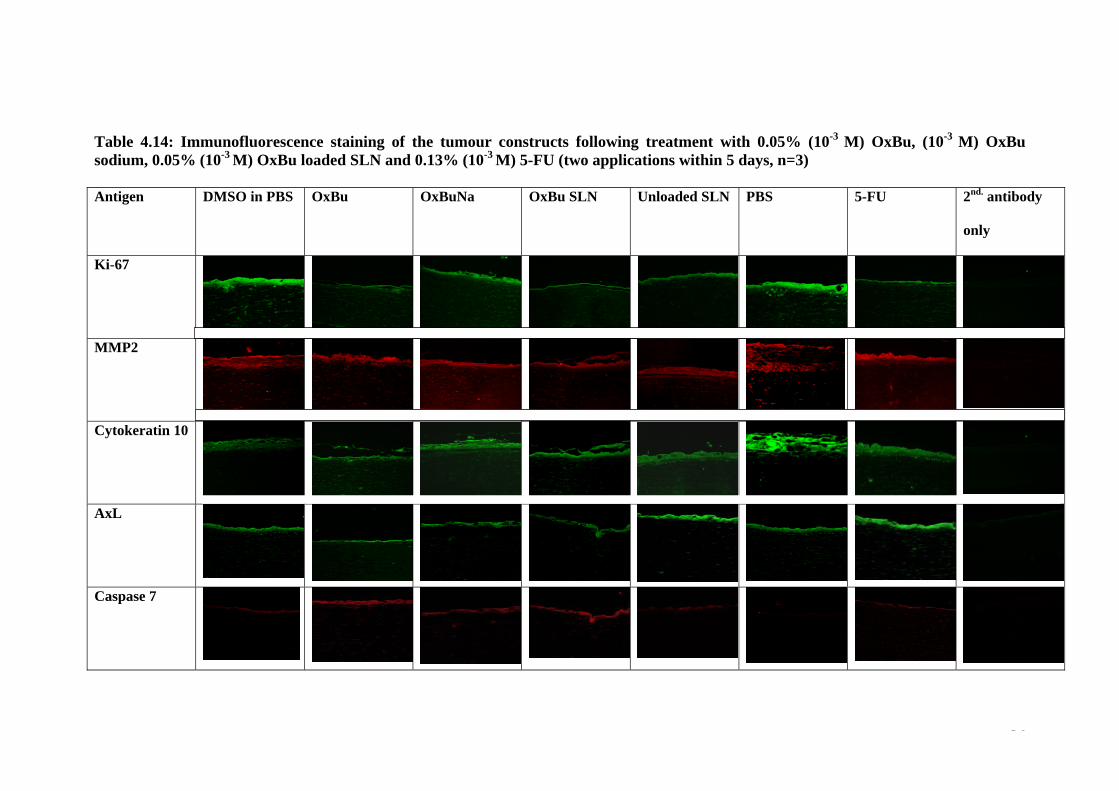
4. RESULTS
86
Table 4.14: Immunofluorescence staining of the tumour constructs following treatment with 0.05% (10-3 M) OxBu, (10-3 M) OxBu sodium, 0.05% (10-3 M) OxBu loaded SLN and 0.13% (10-3 M) 5-FU (two applications within 5 days, n=3) Antigen DMSO in PBS OxBu OxBuNa OxBu SLN Unloaded SLN
PBS
5-FU
2nd. antibody
only
Ki-67
MMP2
Cytokeratin 10
AxL
Caspase 7

4. RESULTS
87
4.7.5 Quantitative detection of apoptosis: Caspase cleaved cytokeratin 18
Skin tumour constructs were topically treated with 10µl/cm2 of 0.05% (10-3 M) OxBu,
OxBu sodium solution, or OxBu SLN as described. Models treated with 0.13% (10-3 M)
5-FU or the respective amount of solvents control were used as positive and negative
controls respectively. Treatment cycles with a total of 2 applications within 5 days or
three applications within 7 days were performed and the response of the tumour
constructs to the different therapies was assessed by measuring cytokeratin 18 (CK18)
and its caspase cleaved fragments (CK18-Asp396) intracellularly and extracellularly
using ELISA.
The secreted CK18-Asp396 was measured in the medium at different time intervals and
the end of the experiment. Intracellular levels were determined only at the end of the
treatment cycle, since it necessitates tissue lysis. CK18-Asp396 levels were found to be
higher (104-149 U/L) in the medium of tumour constructs (48 hrs after seeding SCC
cells) compared to that of the normal constructs (before seeding the SCC cells) where it
ranged between 75-89 U/L (figure 4.14).
Normal SCC 0
50
100
150
200 **
CK
18-A
sp39
6 U
/L
Figure 4.14 CK18-Asp396 released into culture medium before seeding SCC cells (normal constructs) and 48 hrs after seeding SCC cells (tumour constructs) n=12, **p< 0.0001
Day -2 Day 0

4. RESULTS
88
NaOH OxBu Na0
50
100
150
200
250
300
350NoSCCDay 0Day 3Day5Day7
**
CK
18-A
sp39
6
DMSO OxBu0
50
100
150
200
250
300
350NoSCCDay 0Day 3Day5Day7
**
CK
18-A
sp39
6
PBS 5-FU0
50
100
150
200
250
300
350NoSCCDay 0Day 3Day5Day7
CK
18-A
sp39
6
An increase in the secreted CK18-Asp396 levels was observed in the constructs treated
with OxBu and OxBuNa solution reaching peak levels of 266 U/L and 262.5 U/L
respectively at the 7th day after treatment compared to the solvent treated control with
242.3 U/L and 192.9 U/L (figure 4.15). An even more pronounced increase was
observed at day 7 with the OxBu loaded SLN with extracellular CK18-Asp396 level of
313 U/L compared to 172 U/L when treated with the unloaded SLN. In contrast,
constructs treated with 5-FU expressed lower levels CK18-Asp396 reaching only 60
U/L compared to the respective control where 280.9 U/L were found. Figure 4.15 (a-d)
shows the level of released CK18-Asp396 in normal, non treated and treated tumour
constructs.
a) b)
c) d)
Figure 4.15 Level of caspase cleaved cytokeratin 18 fragment (CK18-Asp396) released in culture medium of normal (no SCC), non treated tumour (day 0), and tumour constructs during treatment at day 3 (single application), day 5 (two applications) and day 7 (three applications) of a) OxBu, b) OxBu sodium c) 5-FU and d) OxBu SLN (3.5% compritol). Results represented as mean unit/ litre + SD, n=4
SLN OxBu SLN0
50
100
150
200
250
300
350NoSCCDay 0Day 3Day5Day7
**
* *
CK
18-A
sp39
6

4. RESULTS
89
At the end of the treatment, either 5 days (twice drug applications) or after 7 days (three
times drug application), the intracellular level of Caspase cleaved CK18 fragments were
also measured in the isolated epidermis of the treated tumour constructs. To be able to
compare the level of apoptotic fold induction in the epithelial tumour cells, the
measured amount of CK18-Asp396 in the epidermal extracts was normalised to the total
protein content in each sample, then related to its respective control. As shown in figure
4.16, after 5 days (twice applications), increase in the level of CK18-Asp396 was
observed in the tumour constructs treated with OxBu and 5-FU, while no major change
was observed in case of drug loaded SLN. After 7 days (three applications) however,
the intracellular CK18-Asp396 was induced by 1.2 fold in case of OxBu compared to
the solvent control group, while 5-FU showed an intracellular increase (1.4 fold). On
the other hand, the constructs treated with OxBu loaded SLN showed 1.3 and 1.2 fold
induction in the level of CK18-Asp396 in comparison to the drug solution and the
unloaded SLN respectively.
a b
Figure 4.16 Intracellular level of caspase cleaved cytokeratin 18 fragment (CK18-Asp396) in isolated epidermis of tumour constructs at the end of a) 5 days (two applications) and b) 7 days (three applications). Results represented as mean of amount of CK18-Asp396 normalised (ratio) to total protein content + SD (n=4). Bars represent fold induction.
DMSOOxB
u
NaOH
OxBu N
aSLN
OxBu SLN
PBS5 FU
0
1
2
3
1.2
1.4
1.2
1.3
*
**
*
CK
18 A
sp 3
96/ t
otal
pro
tein
DMSOOxB
u
NaOH
OxBu Na
SLN
OxBu SLN
PBS5 FU
0
1
2
3
1.42.0
1.5**
*
CK
18A
sp39
6/to
tal p
rote
in

4. RESULTS
90
4.7.6 Total Cytokeratin 18: measurement of apoptosis and necrosis
In order to investigate the mode of cell death induced by the different therapies, total
soluble cytokeratin 18 released into the culture medium was measured. It serves as
indicator of total cell death (apoptosis and necrosis) in tumour epithelial cells. This was
assessed on the 5th and 7th day post treatment with OxBu, OxBu sodium; OxBu loaded
SLN and 5-FU as well as their respective solvent controls. The baseline of total CK18
ranged between 130-180 U/L for all SCC constructs before treatment. In the four
control groups no significant change in the CK18 levels were observed before and after
treatment. In contrast, the results showed an increase in the released amount of CK18 on
day 5 after treatment with OxBu or OxBu sodium, while a decrease was observed for
the all the other treated groups. After the 3rd application of OxBu, a significant increase
in the level of CK18 was observed in the SCC constructs at the 7th day compared to the
respective solvent (DMSO) treated control. Similarly, OxBu loaded SLN induced
cytokeratin 18 by 2.1 fold in comparison to the unloaded SLN, while in 5-FU treated
constructs an increase of 1.9 fold was observed.
DMSO
OxBu
NaOH
OxBu N
aSLN
OxBu SLN
Water
5-FU0
100
200
300
400
500 *Day0Day5Day7* * *
Tota
l CK
18 U
/L
Figure 4.17 Total soluble cytokeratin 18 fragment (CK18) released before (day 0) and after treatment of the tumour constructs at the end of 5 days (two applications) and 7 days (three applications). Results represented as mean values of CK18 U/L + SD, (*p value ≤ 0.05)

4. RESULTS
91
4.7.7 p53 Profile in treated tumour constructs
The intracellular level of p53 was determined in the epidermal extracts at day 5 and 7
respectively using ELISA as described in the method section. In OxBu SLN treated
constructs, 22 % reduction in the level of p53 protein was observed on day 7 in
comparison to the unloaded SLN control. In samples treated with the OxBu sodium salt,
a slight increase of 19% was observed on day 5, but then inhibition was found on day 7.
On the contrary, compared to the water treated control, p53 induction was observed in
5-FU treated models, where it was enhanced by 15% at day5 and nearly doubled at day
7 respectively. This is in accordance with the previous findings in the monolayer
culture. Figure 4.18 summarise the result of p53 fold induction at the end of each
treatment cycle.
Figure 4.18: p53 profile in treated tumour constructs. Columns representing mean values + SD of p53 fold induction in epidermal tissue extracts compared to respective controls after 5 days and 7 days.
OxBu
OxBu N
a
OxBu SLN
5-FU
0
1
2
3
4ControlDay 5Day 7
p53
fold
indu
ctio
n

5 DISCUSSION

5. DISCUSSION
93
5.1 Formulation optimisation, characterisation and stability evaluation
In the early 1990s, Lucks and Müller established solid lipid nanoparticles as
pharmaceutical dosage form which offers an attractive new approach for the delivery
of poorly soluble drugs and can be applied topically as well as parenterally, ocularly,
pulmonarily or orally (Cavalli, et al. 2002; Müller et al. 2002; Müller, et al. 2006;
Schäfer-Korting, et al. 2007; Wissing, et al. 2004; Xiang, et al. 2007). To optimise a
nanocarrier system for the poorly soluble compounds, a broad range of solid lipids,
oils and solubilisers was screened.
Given the molecular weight (> 400 g/mol), LogP values (1.36 and 2.34), both OxBu
and OxHex were assumed to be challenging for nanocarrier formulation, but
according to the rule of 5’ (Lipinski, et al. 2001), absorption and permeation were
predicted to be acceptable. The results obtained indicate however that both
compounds were insoluble in aqueous media as well as all tested drug vehicles,
commonly employed in pharmaceutical use. Among the screened solid lipids,
neither long nor medium chains triglycerides were capable of solubilising the drugs.
The screened oils too, did not provide any suitable candidate as carrier system for
the drug. This poor solubility represents a major obstacle for formulation
optimisation, taking into consideration the requirements of the drug approval
process and the resulting limitations on available excipients. Given also the small
scale synthesis, batch variations in purity and composition were a further challenge.
One possibility to solubilise OxBu was its transformation into sodium salt using
NaOH. However, it was not attempted to integrate the latter combination into a
dosage form, given the tendency of lipids and oils to undergo saponification at very
alkaline pH, like in the presence of NaOH.
In previous work for in vitro studies, DMSO was used to dissolve OxBu and OxHex
(Schwanke et al. 2010). However, given the published toxicity profile of DMSO
(Rubin 1983; Savastano 1984) and since it is known to be able to induce transient
burning sensation with urticaria, and erythema during application (Ener, et al. 2004),
it was attempted to identify alternative solubilisers. However, none of those
screened were able to solubilise OxBu or OxHex, with the exception of dimethyl
sulfoxide. Recently, Simon and co-workers conducted a 12-week, double-blind,

5. DISCUSSION
94
double-dummy, randomised controlled trial of topical diclofenac sodium (1.5% w/w)
in a vehicle solution containing 45.5% dimethyl sulfoxide (DMSO) in 775 subjects
with primary osteoarthritis of the knee (Simon, et al. 2009). The results not only
showed that topical diclofenac in DMSO vehicle to be an effective treatment option
for knee osteoarthritis, but also that the tolerability of DMSO was similar to that of
placebo. As a solvent of diclofenac, DMSO is also approved by the FDA (Roth and
Fuller 2011) and it is an excipient in Verrumal®, a topical solution containing 5-FU
and salicylic acid available in Germany (Rote Liste 2011).
Moreover, DMSO is well known penetration enhancer for many active compounds
e.g. prazosin (Reddy and Ghosh 2001) and methyl nicotinate (Remane, et al. 2006).
Williams and co-workers reported that this penetration enhancement might be due to a
temporary reduction in skin resistance thereby enhancing drug passage since DMSO
disrupts lipid organisation in the stratum corneum making the latter more permeable.
Additionally, DMSO may also extract lipids of the horny layer, hence thereby enhance
its permeability (Williams and Barry 2004). In fact, SLN dispersions with 5% DMSO
therefore appear most interesting when aiming for AK treatment. Both the nanoparticles
and the penetration enhancer should favour drug penetration into the viable epidermis –
the target layer of AK treatment and to the viable dermis – the target layer of SCC
treatment, despite of the frequent hyperkeratotic nature of skin.
Therefore combinations of DMSO with other solvents and carrier systems were
tested, resulting in the identification of three potential lipids However the
production of SLN demonstrated that only nanoparticles consisting of
OxBu/DMSO/glyceryl behenate (drug/solubiliser/lipid) appeared suitable with
particle size 200-220 nm (see table 4.7). A similar approach to improve solubility of
tacrolimus was also recently reported by Pople and colleagues (Pople and Singh
2011). They prepared modified nanolipid carrier (MNLC) loaded with tacrolimus
by hot homogenisation using propylene glycol as drug solubiliser and glyceryl
trimyristate as lipid matrix. The MNLC was reported to ensure higher drug
entrapment efficiency, improved stability, had significantly higher drug release and
better in vivo skin permeation compared to commercial ointment. Similarly, a study
(Subedi et al. 2009) reported the use of DMSO to dissolve both lipid and drug
in the preparation of doxorubicin SLN using the solvent emulsification diffusion
method. Hence, the use of solubiliser/drug/lipid mixture was helpful to overcome
the challenging solubility problem.
5. DISCUSSION
95
The use of a high lipid concentration (5% w/w) was initially chosen to maximise
drug loading. This however was shown to compromise the stability of the
nanodispersions which is in accordance with previous results of Freitas and co-
workers, who showed that use of relatively high lipid concentration resulted in
larger particles sizes and a wider size distribution as well as particle agglomeration
(Freitas and Müller 1999). The reason for this instability at higher concentrations
is generally believed to be that upon cooling, lipids tend to first crystallise to
the less structured α form but then convert to the more stable ß-modification
resulting in the formation of more elongated, needle shaped crystals and the
generation of new surfaces. The quantity of surfactant molecules is then not
sufficient anymore to cover the newly formed surfaces, leading to a decrease in
emulsifying efficiency. Moreover, the resulting hydrophobic interactions between
non polar patches on the particles induce aggregation, and finally gelation
(Helgason, et al. 2009).
Drug loading of 0.05% increased the particle size to 200-220 nm but had little effect
on size distribution (PI 0.24). Results by Küchler and colleagues suggest that this
increase in size is unlikely to have any effect on skin penetration characteristics
(Küchler, et al. 2009). Similarly the increase of 0.05% OxBu loaded SLN after 90
days storage at 5°C (261 nm) is unlikely to significantly alter penetration
characteristics, while sizes reached after 180 (378 nm) are. Given the limited
stability of 5% Compritol, stability were also determined with lower lipid
concentrations. Dissolving the drug first in solubiliser (DMSO) and reducing the
concentration of the lipid to 3.5% was found to optimally increase physical stability
of the formulation.
Similarly, drug loading of more than 0.05% was only possible by using Tween 80 as
a second emulsifier, which enabled drug loading of up to 0.25%. Surprisingly,
particle size was still acceptable at (154 nm at day 1 209 nm after 180 days),
however homogeneity was unacceptably high with PI 0.7 and PI 0.5 respectively.
Similar results have been reported for (eg CAT-1) where gelation occurred for
concentrations more than 0.05% (Küchler et al. 2009). Being considered a crucial
factor affecting the formulation’s stability, the effect of storage temperature on the
SLN was also studied. As expected, the increase in particle size was more

5. DISCUSSION
96
pronounced at higher lipid concentrations, but also when loading OxBu. This
physical instability at higher temperature was probably due to a decrease in the
microviscosity of the emulsifier with the consequence of an increase in the particles
diffusion constant. The electrostatic repulsion between the particles was thus more
easily overcome resulted in aggregation and gel formation. Similar results were also
observed by Freitas and colleagues for Compritol based SLN when stored at
different temperature (Freitas and Müller 1999).
The mode of the drug’s interaction with the host lipid matrix is an important factor
influencing both the drug’s release from the formulation as well as its ability to
penetrate into the skin (Schlupp, et al. 2011). Although uptake is enhanced in both
cases up to 4-8 fold, compared to the active ingredient applied as cream, epidermal
targeting can be observed only when the drug molecules are attached to the surface
of the lipid matrix, hence information on the drug’s location in the lipid matrix is of
vital importance (Sivaramakrishnan, et al. 2004b).
Both the near to stable dipole density and especially the OxBu concentration
independent dipole mobility indicate that OxBu molecules were either completely
incorporated into the lipid matrix or alternatively free in the aqueous phase (linear
relationship), and excluded the possibility of association with the surface.
In consideration of the intended dermal drug therapy, incorporation of OxBu loaded
SLN into a semi-solid matrix was predicted to be an approach to prevent aggregation
and improve the physical stability of the nanoparticles. Moreover, high fluidity of
SLN dispersions with low (< 10%) lipid concentration causes problems when used
by patients (Souto and Müller 2010). It was thus decided to develop a hydroxyethyl
cellulose (HEC) gel, which can be generated by a single step
procedure thus avoiding drug dilution and hence maximising OxBu levels in AK
lesions and hyperkeratotic skin. Similar ready-to-use formulations have been
generated by embedding the SLN into a cream or hydrogel and this did not seem to
effect the enhanced drug penetration (Jenning, et al. 2000a; Santos Maia, et al.
2002b).

5. DISCUSSION
97
Previous work by Shahgaldian and co-workers as well as Souto and colleagues
suggested that embedding drug loaded SLN into a gel matrix would not alter
nanoparticle size and size distribution (Shahgaldian, et al. 2003; Souto, et al. 2004a).
These predictions were confirmed since the results obtained showed no relevant
changes in either parameter, when SLN (3.5% lipid) were embedded into the gel
matrix (Fig. 4.9). Moreover, in a recent study by Batheja and colleagues (Batheja, et
al. 2011) a gel formulation containing nanospheres and azone as penetration enhancer
was developed for effective skin application and enhanced permeation. Using Nile red
as model lipophilic drug models, in vivo permeation revealed that the deposition of Nile
red via the nanosphere gel in the upper and lower dermis was 1.4 and 1.8 fold higher,
respectively, than the amount of Nile red deposited via the aqueous nanosphere
formulation.
The use of lipid nanoparticles as carrier system for anti cancer drugs to enhance
cellular uptake and cytotoxicity have been previously described by Miglietta and
colleagues (Miglietta, et al. 2000). The group reported that SLN enhanced the
cytotoxicity of doxorubicin about 10 fold on the human breast cancer cell line
(MCF-7) and more than 40 fold on human promyelocytic leukaemia (HL60) cell
line. They also showed that paclitaxel loaded SLN had 100 fold higher cytotoxicity
in (MCF-7) and attributed this effect to the marked uptake and accumulation of the
drug loaded SLN in the cells. Furthermore, Kang and colleagues (Kang, et al. 2010)
recently reported that doxorubicin/DMSO loaded SLN enhanced the apoptotic
activity of the drug on adriamycin resistant breast cancer cell line (MCF-7/ADR)
and explained this with better uptake of the nanoparticles and greater accumulation
of the drug in the cells. To enable dermal application of this potential actinic
keratosis treatment the biocompatibility of the developed carrier system thus was
tested in vitro, using SCC cell lines and primary NHK cells. Preliminary cytotoxicity
studies, performed in the monolayer cell culture, confirmed the findings of
Schwanke and colleagues (Schwanke et al. 2010) that OxBu selectively reduces the
viability of SCC cells but not that of NHK.
OxBu loaded SLN dramatically decreased the cell viability in comparison to OxBu
alone, with effects detectable even in the micromolar range (0.00005%-0.05%).

5. DISCUSSION
98
However this was to a large extend due to the SLN, which by themselves (unloaded)
had a pronounced effect on cell viability. This was somewhat surprising, since
previous results with higher lipid (5% Compritol) and similar surfactant (2.5%
poloxamer) concentrations suggested only very limited cytotoxic effects on NHK
(Santos Maia, et al. 2002a). It is currently unclear to what extent this difference was
due to the up to 5% DMSO in the formulation or the experimental setup. Santos
Maia and colleagues applied 2-20 times lower amounts of SLN to the medium and
measured viability of 87.5% and 79.5% viability after 6 hrs and 24 hrs, whereas in
this study viability was measured after 48 hrs was used. The latter was chosen to be
able to compare the OxBu toxicity measured in the previously reported study by
(Schwanke et al. 2010), and a time dependent effect seems a plausible explanation
for the differences observed.
Another explanation of the observed results, is that in the presence of DMSO in the
SLN or one of the constituents might inhibit the mitochondrial cytosolic and
microsomal enzymes that are thought to be responsible for the reduction reaction on
which the MTT test is based (Bernas and Dobrucki 2002; Gonzalez and Tarloff
2001). Since the MTT the assay can not distinguish between enzyme activity
inhibition and viability reduction, MTT data have always to be interpreted with
caution (Hamid, et al. 2004).
Interestingly, work on carbon based nanomaterials published recently suggests that
carbon based nanomaterials might interact with the tetrazolium salts, because of the
insoluble nature of MTT-formazan (Worle-Knirsch, et al. 2006). They therefore
recommend verifying toxicity data using alternative test methods. Unfortunately, it
was beyond the scope of this work to further characterise the underlying
mechanisms responsible for the MTT data on unloaded SLN, using complementary
techniques like neutral red, lactate dehydrogenase leakage (LDH) or FACS analysis
(Fotakis and Timbrell 2006; Ibrahim and van den Engh 2003).

5. DISCUSSION
99
5.2 Pharmacodynamics studies Three dimensional skin equivalents provide a link between in vitro monolayer
culture and the in vivo situation. On the one hand, it has the advantage that several
cell types are being brought together resulting in a microenvironment where cell to
cell adhesion or cell to matrix adhesion is provided (el-Ghalbzouri, et al. 2002).
Moreover, cell cell interactions take place in 3 dimensions, hence creating a more
natural environment (Pampaloni, et al. 2009; Schettino, et al. 2010) and the
epidermis of HSE can be exposed to air, making topical application of test
compounds feasible. Therefore HSE models have been used for diseases modelling
of oral candidosis (Korting, et al. 1998; Schaller, et al. 1998; Yadev, et al. 2011),
ichthyosis vulgaris (Mildner, et al. 2010; Oji, et al. 2010) and squamous cell
carcinoma (Commandeur et al. 2009; Höller-Obrigkeit et al. 2009; Margulis, et al.
2005). However, Schäfer-Korting and colleagues recently showed that there are still
marked differences in drug permeability between commercially available models
and human or pig skin (Schäfer-Korting et al. 2008). Interestingly, the protocols
used to create the different disease models varied both among and between the labs,
and it appears that HSE require adaptation to local conditions and optimization for
the particular use. The development of an appropriate skin model is a very
challenging task. Reconstructed skin models have been under development for the
last three decades and been validated for several in vitro and clinical applications
such as skin replacement for burn victims (MacNeil 2007). However, at the moment
there is no reliable skin model that completely matches the barrier function and
physiology of the human skin (Van Gele, et al. 2011).
In line with these published findings, the results obtained in this study indicate that
HSE models are useful tools, but required some adaptation and modifications to
stabilise the epidermis and enhance SC development. The model used, was based on
the one originally developed by Höller-Obrigkeit (Höller, et al. 2001) and shown to
be suitable to both simulate SCC, and to test the effect of photodynamic therapy
(Höller-Obrigkeit et al. 2009). However, a limitation in modelling AK in the
epidermis, as opposed to SCC that has invaded the dermis appears to be
5. DISCUSSION
100
the destabilisation of the former over time. Approximately three to four weeks after
seeding of the epidermis, it starts to disintegrate, thus enhancing significantly the
dermal invasion of the SCC cells. This could be due to the lack of certain nutrient
supplement, the high serum level in the culture medium or the long cultivation
period. Limited lifespans of reconstructed skin constructs have been reported and
efforts over the last years by many research groups to improve their long term
viability by modifying culture conditions have included omission of serum,
reduction of certain growth factors and vitamin supplementation (Gibbs, et al. 1997;
Ponec, et al. 1997). Yet lack of stem cell renewal within the stratum basale appears
particularly likely, because it is known since the early 1980s that NHK cells change
their characteristics and differentiate during cell culture (Karasek 1983). Hence the
formation of distinct epidermal layers, cell death and shedding is expected, whereas
the repletion through the proliferation of keratinocyte stem cells in the stratum
basale, is not.
To further characterise the recently reported cell specific effect of OxBu on SCC12
and SCC25 cells (Schwanke et al. 2010; Zdrazil et al. 2010), its impact on
intracellular levels of p53 levels was measured. The results showed that OxBu and
its respective sodium salt down regulate the protein in both cell lines as well as in
primary NHK, when tested in monolayer culture (Fig 4.11). Interestingly, the level
of down regulation was dose and cell type dependent, with a particularly marked
response in SCC25. Furthermore, OxBu appears to increase p53 levels in NHDF, or
the response is influenced by cell cell interactions, since an upregulation was
observed in 3D HSE (figure 4.18). In contrast 5-FU was found to induce p53 both
in monolayer culture as well as 3D models. This is in accordance with previous
findings in human papillomavirus positive HEp-2 and HeLa cells (Ju et al. 2007;
Singh et al. 2007). It is intriguing to speculate that the varying responses to OxBu
treatment might be influenced by distinct p53 genotypes, present in different batches
of primary cells and lines, as has been suggested for cisplatin (Sangster-Guity et al.
2011). However, it was beyond the scope of this work, to investigate this further.
Given the data obtained with 5-FU, which indicate that the results obtained are
reliable, p53 might not be an ideal marker to monitor treatment effects of OxBu on

5. DISCUSSION
101
AK or SCC, in line with similar reports for a number of other cancer drugs
(Partridge et al. 2007; Partridge et al. 2005).
To better characterise the HSE and in particular the simulation of AK, the presence
and distribution of a number of cell markers was investigated. AxL, a SCC tumour
marker, has been shown to be involved in the development and progression of SCC
(Commandeur et al. 2009), and is thought to inhibit apoptosis through the
mitochondrial-mediated pathway by interfering with Bcl-2 family members and the
inhibition of Bad (Papadakis, et al. 2011). In monolayer cultures, AxL expression
was detectable in the SCC but not NHK cells, thus clearly distinguishing malignant
from normal cells (data not shown). This is in accordance with the findings of
Green and colleagues, who showed that AxL tyrosine kinase receptor is over
expressed in SCC-derived cell lines and tumours (Green et al. 2006). Interestingly,
cytoplasmic staining was observed throughout the epidermis of the tumour
construct, but appears to be stronger in the area where SCC had been seeded. In
normal models, lacking SCC cells, AxL was less apparent in the epidermis
(figure 4.13). This might suggests that the NHK cells are influenced and their
behaviour is modified by the SCC cells, a finding in line with data by Commandeur
and colleagues (Commandeur et al. 2009). They also reported the expression of
AxL in SCC primary cells and human SCC explants, by demonstrating significant
cytoplasmic staining of epidermal keratinocytes. Similarly, they too did not
detected substantial epidermal staining for AxL either in native skin or normal skin
explants. Treatment of the HSE with 0.05% OxBu-SLN and as solution appeared to
decrease the overall intensity of AxL staining, compared to SLN (3.5% compritol)
and the solvent control alone. However, since immunohistochemistry is a
qualitative technique, it is necessary to substantiate these findings using additional
markers and complementary techniques.
Cytokeratin 10 is considered to be also an SCC tumour marker (Vaidya, et al. 1996)
and has been linked to the stage of SCC differentiation (Kee and Steinert 2001).
The differential expression observed, clearly indicates profound differences between
the normal and the tumour model.

5. DISCUSSION
102
While the less aberrant staining of cytokeratin 10 was observed in healthy
constructs, SCC models showed rather patchy cytoplasmic staining with increase
intensity in the differentiated epidermal layers.
Treatment of the tumour constructs with OxBu, OxBu sodium and OxBu-SLN
reduced the overall intensity in cytokeratin 10 staining, when compared to the
respective solvent controls. Similarly, treatment with 5-FU had less effect on
cytokeratin 10 levels, as previously reported (Yoneda, et al. 1999). This might
either be interpreted to add further support to the notion that OxBu and 5-FU differ
in the mode through which they elicit their cytotoxic effects or could also be
attributed to the fact that the used 5-FU concentration was quite low and hence
might not be optimal to induce the desired therapeutic effect. Interestingly, it was
recently reported that cytokeratin 10 and proliferating cell nuclear antigen (PCNA)
differentially co-localises with the tumour necrosis factor-like weak inducer of
apoptosis (TWEAK) a member of the TNF superfamily in a variety of skin
conditions and appear to be useful to differentiate between SCC and AK (Peternel,
et al. 2011). The possibility to easily distinguish AK and SCC on a molecular level
opens up the possibility to determine influencing parameters and though their
adaptation, the development of HSE tumour models that are either more AK like or
resemble more SCC.
Immunohistochemical staining for the proliferation specific nuclear marker Ki-67
revealed a distribution similar to that of cytokeratin 10. Thus proliferation appeared
enhanced throughout the tumour construct, compared to the normal control, as
indicated by the more prominent presence of Ki-67 (Figure 4.13). This is in
accordance with data by Höller-Obrigkeit and colleagues, who also confirmed
enhanced mitotic activity in SCC constructs by the presence of Ki-67.
To unravel OxBu efficacy further, a marker that appears to reflect true clinical
outcome can be measured non-invasively, repeatably and is quantifiable over time
was used. The filament protein cytokeratin 18 (CK18) is an epithelial-cells specific
cytokeratin that undergoes cleavage by caspases during apoptosis.
The observation that CK18 is released in the bloodstream as a consequence of cell
death suggested the potential use of circulating CK18 as a tumour biomarker.
Furthermore, CK18 is cleaved by specific caspases into unique fragments (CK18-
Asp396) during apoptosis (De Petris, et al. 2011; Linder et al. 2004), thus making it

5. DISCUSSION
103
possible to distinguish between programmed cell death and necrosis. Therefore, both
CK18 and its caspase cleaved fragments (CK18-Asp396) are now increasingly being
used to screen for new pro-apoptotic drugs in vitro (Biven et al. 2003; Hagg et al.
2002; Thurnher et al. 2003) as well as determine the effects of chemotherapy while
monitoring clinical outcome.
To evaluate, if CK18-Asp396 release can also be used as an indicator of apoptosis in
HSE, levels were measured in the constructs before and after seeding SCC12 cells.
As shown in figure 4.15, the release of CK18-Asp396 by HSE was significantly
enhanced in the presence of SCC12. This reflects the findings of a number of other
studies where plasma levels of CK18-Asp396 were significantly elevated in diverse
tumour forms when compared with control groups, including colorectal cancer
(Ausch, et al. 2009b), head and neck tumours (Ozturk, et al. 2009), breast cancer
(Ueno, et al. 2003) and lung cancer (Hou, et al. 2009; Ulukaya, et al. 2007). Topical
application of OxBu loaded SLN induced the release of CK18-Asp396 and CK18
compared to the drug free SLN whereas for OxBu in DMSO or as sodium salt, this
effect was somewhat weaker, when compared to their respective controls. This
suggests that the SLN formulation might increase epidermal penetration by OxBu
and thus enhance its activity.
Treatment of tumour models with OxBu-SLN and to a lesser extend OxBu-sodium
increased the amounts of CK18-Asp396 fragments released into the medium, when
compared to those of normal controls (figure 4.15). Treatment cycles of 5 and 7
days were chosen, since Kramer and colleagues (Kramer, et al. 2006) observed
significant increases in CK18–Asp396 usually between days 5 and 7 of each
treatment cycle (ranging from 6.7% to 18.6%) in patients with hormone refractory
prostate cancer (n=82) receiving palliative chemotherapy. Interestingly, only a
moderate increase (1.4 fold) was observed with OxBu in the presence of DMSO, and
5-FU appeared to inhibit the gradual increase in background levels over time. This
was not related to changes in intracellular levels of the CK18-Asp396 fragment,
which were less affected by any of the treatments, except a slight increase observed
in response to 5-FU. To what extend this response is cancer specific or is related to
the model used, remains to be elucidated, since this test has thus far only been
employed in monolayer cultures or in vivo. Whereas the slight intracellular increase

5. DISCUSSION
104
might suggest model specific release inhibition, the inability to show a significant
increase in response to 5-FU suggests some degree of variability between different
tumours, since it was shown, that patients with recurrent breast cancer receiving
cyclophosphamide, epirubicin and 5-FU showed a significant increase in serum
CK18-Asp396 and that this was associated with clinical response (Biven et al.
2003). In another study, an increase in CK18-Asp396 levels in plasma was also
observed when gastrointestinal carcinoma patients were treated with 5-
FU/leucovorin (Brandt et al. 2010). Nevertheless, the differences observed between
the release in response to OxBu-SLN and that after 5-FU treatment suggests that the
measurement of CK18-Asp396 in the medium is a useful non-invasive test to assess
the drug response in HSE. Furthermore, the data support the notion that OxBu-SLN
and 5-FU exert their effects by distinct molecular mechanisms.
In addition to apoptosis mediated cell death, anticancer agents may also induce their
effects by alternative mechanisms, leading to necrosis. This is characterised by
distinct ratios of CK18 and caspase cleaved CK18-Asp396 released into the
extracellular space or the medium (Kramer et al. 2004). Hence to determine the
mode of cell death observed in response to the different treatments the ratio of
extracellular caspase cleaved to total cytokeratin 18 is a useful tool. The results
obtained (Figure 4.15 and 4.17) indicate that the mode of cell death induced by
OxBu in DMSO and especially when loaded to SLN is predominantly mediated by
apoptosis. In contrast treatment with 5-FU predominantly lead to necrosis further
suggest that the mechanisms of action are distinct. A similar, mainly necrotic
response to 5-FU was also described by Yamachika and colleagues (2004). They
investigated the mechanisms of action of artemisinin and 5-FU in SCC and found an
apoptotic response to the former but also mainly necrosis in response to the latter
(Yamachika, et al. 2004).
It is currently unknown, what determines if 5-FU elicits apoptosis or necrosis, yet
recent findings further complicated the picture, since they suggest that the presence
of necrosis might inhibit the action of 5-FU (Lee, et al. 2010). The authors observed
that 5-FU-induced apoptosis is markedly reduced in 3D multicellular tumour
spheroids which had a necrotic core, compared with MCF-7 monolayer cells and

5. DISCUSSION
105
spheroids that had no necrotic core, indicating that the formation of necrotic core
may be linked to acquisition of chemoresistance to 5-FU.
In this respect it is interesting to note that both apoptosis and necrosis can occur
simultaneously in tissues or cell cultures exposed to the same stimulus and, often,
the intensity of the same initial insult decides the prevalence of one or the other
(Nicotera, et al. 1999).
In any case, the distinct ratios of full length and Asp396 cleaved CK18 and
preliminary results with aphidicolin (data not shown) that suggest the induction of
apoptosis and hence are also in line with the literature (Glynn, et al. 1992;
Kuwakado, et al. 1993) further underline the usefulness of the tumour models for
activity testing of new compounds. Since on this basis it is reasonable to assume
that the models provide realistic results for the markers investigated, it can therefore
be concluded that OxBu elicits a variety of responses, on commonly used markers
for tumour prognosis like MMP2, AxL, Ki-67, p53, caspase 7 and cytokeratin 10.
These responses include a reduction of MMP2 and AxL levels, an increase in
intracellular as well as extracellular cytokeratin 18 levels and the induction of cell
death, predominantly by apoptosis. This action is modulated and often enhanced by
SLN, when used as a carrier system. OxBu therefore remains an interesting option
for the treatment of actinic keratosis as well as squamous cell carcinoma. However
future investigation is needed to further unravel the precise mechanism of action.
Furthermore, more sensitive analytical methods or radio labelled OxBu could be
used to better elucidate, if OxBu acts as a pro-drug or not, and the kinetics of any
metabolic changes. Similarly further investigations are required to more fully
characterise the use of cytokeratins as tumour biomarkers in the evaluation of drug
pharmacodynamics in 3D models.

6 SUMMARY

6. SUMMARY
107
6.1 English summary
Cutaneous squamous cell carcinoma (SCC) is a malignant epidermal keratinocyte
tumour, also characterised by its invasion into the dermis. Actinic keratosis (AK) is a
precursor stage of SCC, now generally considered to be a carcinoma in situ that should
be treated. However, shortcomings in current therapies including pain and
unsatisfactory cure rates have raised the need for new treatment options, specifically
targeting the tumour lesions. Recently, a set of promising DNA polymerase α inhibitors
have been identified by molecular modelling and ligand docking. Two molecules
(OxBu and OxHex) were identified as most selective and potent in vitro monolayer
culture with activity exceeding that of 5-FU and aphidicolin 1000 fold. However, their
poor solubility and a relatively large molecular weight (>400 Dalton), make them less
favourable for skin penetration and challenging for topical application.
In order to enable the detection of OxBu and OxHex and their active metabolites, an
HPLC method was established and validated. Next, a modified solid lipid nanocarrier
system was developed which included DMSO as solubiliser to enable drug
incorporation into the lipid matrix. Applying hot homogenisation, SLN with an average
size < 200 nm and good drug entrapment (96%) within the lipid matrix were obtained.
Long term physical stability for drug loaded SLN was found to be highest at 5°C, using
lipid concentrations of 3.5%. In view of a potential dermal application, the developed
SLN were incorporated into a hydrogel, as an approach to prevent agglomeration and
further improve the physical stability of the nanoparticles. During the course of this
work, OxBu emerged as the most promising candidate and became the main focus of
this thesis.
To be able to closely simulate the in vivo situation as well as to better evaluate the
efficacy of the novel drug and the developed carrier system, OxBu activity was tested
using a three dimensional human skin tumour construct which has previously been
characterised and validated for photodynamic therapy of SCC. The results obtained by
immunohistochemistry on treated tumour constructs showed 0.05% OxBu solution to be
at least as active as 5% 5-FU (Efudex cream) when applied twice within 5 days. The
tumour model was then further adapted to mimic AK more closely, before being used to
evaluate the therapeutic effect of OxBu in the context of the new carrier system.

6. SUMMARY
108
Qualitative parameters obtained by further immunohistochemistry experiments were
used to characterise models and describe their homology to the in vivo situation. To this
end, a series of markers, indicating keratinocyte proliferation (Ki67), metastasis
development (MMP2), SCC growth (cytokeratin, AxL), and apoptosis (caspase 7) was
studied. Treatment with OxBu and especially OxBu loaded SLN led to marked changes
in the signal intensity of these markers that were more pronounced than those observed
with 5-FU.
As quantitative read out parameters to monitor response to therapy after topical
treatment, the level of p53 as well as the level of cytokeratin 18 (apoptosis and necrosis
marker) and its caspase cleaved fragments (apoptosis marker) were measured using
ELISA. The results obtained suggest that apoptosis is the more dominant mode of cell
death in OxBu treated models, continuously increasing over the first 7 days of
treatment. In contrast, necrosis seems to be more dominant in case of 5-FU treatment,
as indicated by the ratio of caspase cleaved to non cleaved cytokeratin 18 in the culture
medium.
Taken together, in the framework of the present work, a modified SLN formulation as
carrier system for the novel guanosine phosphonate analogue OxBu was optimised and
studied for its stability. Furthermore, the efficacy of the loaded and unloaded dug was
studied in vitro in a 3D non melanoma skin tumour model, showing that the novel
molecule is a promising candidate for the development of an improved topical therapy
of actinic keratosis and skin cancer.
6. SUMMARY
109
6.1 German summary
Das kutane Plattenepithelkarzinom (Squamous Cell Carcinoma oder SCC) ist ein
maligner Keratinozytentumor, der auch durch deren Eindringen der transoformierten
Zellen in die Lederhaut charakterisiert ist. Aktinische Keratose wird meist als
Frühstadium des Plattenepithelkarzinom oder fakultative Präkanzerose betrachtet und
sollte behandelt werden. Da aktuelle Behandlungen zu oft unerträgliche Schmerzen bei
mäßigem Behandlungserfolg verursachen, besteht der Bedarf nach neuen, speziell auf
die Läsion abzielender Therapien. Durch molekulare Modellierung wurde vor kurzem
eine Gruppe Erfolg versprechender DNS-Polymerase α hemmender Moleküle
entwickelt. Die beiden Vertreter OxBu und OxHex zeigten in Zellkulturversuchen eine
1000 Mal höhere Selektivität und Effektivität als 5-FU and Aphidicolin.
Die schwere Lösbarkeit und das relativ hohe Molekulargewicht (>400 Dalton)
erschweren aber deren Eindringen in die Haut und somit ihre Nutzung für die topische
Anwendung. Um den Nachweis von OxBu und OxHex, sowie deren Metaboliten zu
ermöglichen, wurde zunächst eine HPLC Methode etabliert und validiert. Danach
wurde eine Lipidnanopartikel (Solid Lipid Nanocarrier - SLN) Nanodispersion
entwickelt und OxBu sowie OxHex mit Hilfe des Lösungsmittels DMSO in die
Lipidmatrix integriert. Durch eine Hitzehomogenisierung wurden eine Partikelgröße
unter 200 nm und ein guter 96% Wirkstoffeinschluss in der Lipidmatrix erzielt. Die
größte Langzeitstabilität der Pharmakon beladenen SLN wurde bei 5°C und Benutzung
einer Lipidkonzentration von 3.5% gemessen. Hinsichtlich einer angestrebten dermalen
Anwendung wurden die erstellten SLN in ein Hydrogel integriert, um
Partikelagglomeration zu verhindern und die Stabilität der Nanopartikel weiter zu
verbessern. Im Laufe dieser Arbeiten stellte sich OxBu als der vielversprechendere
Wirkstoff heraus und wurde daher zum Fokus der weiteren Versuche in dieser
Doktorarbeit.
Um die realen Bedingungen in der Haut in vivo best möglich zu simulieren und dadurch
die Wirksamkeit des potentiellen neuen Pharmakons und des Wirkstoff-Trägersystems
zu bestimmen wurde der Effekt von OxBu an einem dreidimensionalen Hautkrebsmodel
getestet, das für die Evaluierung von photodynamischen Therapiemethoden des SCC
entwickelt und validiert worden war. Die mittels immunhistochemischer Methoden
erzielten Ergebnisse eines behandelten Krebsmodells legen nahe, dass bei zweimaliger

6. SUMMARY
110
Applikation in 5 Tagen, 0,05% OxBu Lösung mindestens genauso aktiv ist wie 5% 5-
FU. Das Hautkrebsmodel wurde daraufhin angepasst um eher AK zu simulieren, bevor
mit ihm die Wirksamkeit von OxBu in Verbindung mit dem dafür entwickelten
Trägersystem bestimmt wurde.
Um anhand qualitative Parameter die Homologie des Krebsmodels mit der in vivo
Situation zu Vergleichen wurden weitere immunhistochemische Methoden angewandt.
Hierzu wurde eine Reihe von spezifischen Markern verwendet, die Aufschluss über das
Auftreten von Keratinozyten-Proliferation (Ki67), Metastasierung (MMP2),
Plattenepithelkarzinom-Wachstum (Cytokeratin, AxL) und Apoptose (Caspase 7)
geben. Die Behandlung mit OxBu und insbesondere mit der OxBu-SLN Präparation
führte zu auffälligen Veränderungen in der Signalstärke dieser Marker, die nach einer
5-FU Behandlung weniger stark so ausgeprägter waren.
Als quantitative Messgrößen zur Bestimmung der Pharmakonwirkung wurden der p53-
und sowohl Cytokeratin 18 als auch der Caspase 7 abgebaute Cytokeratin 18-
Fragmentgehalt mit einem ELISA-Verfahren gemessen. Die erzielten Ergebnisse
zeigen, dass die Wirkung von OxBu an den Krebsmodellen hauptsächlich auf Apoptose
vermitteltem Zelltod basiert und sieben Tage nach Behandlungsbeginn maximal ist. Im
Gegensatz dazu weist der Quotient von Caspase abgebaut zu natives
Cytokeratin 18 darauf hin, dass die in diesen Modellen gezeigte Wirkung von 5-FU eher
auf Nekrose beruhte.
Zusammengefasst wurde im Rahmen dieser Arbeit eine modifizierte Lipidnanopartikel-
Dispersion als Wirkstoff-Trägersystem für das Guanosine-Phosphonate-Analogon
OxBu optimiert und seine Stabilität getestet. Des Weiteren wurde die Wirkung des
gelösten und in SLN integrierten Pharmakons in vitro an einem 3D nicht-melanozytären
Tumormodel des hellen Hautkrebs getestet und gezeigt, dass die neue Substanz ein
aussichtsreicher Kandidat für die Entwicklung einer verbesserten topischen aktinischen
Keratose- und SCC Therapie ist.

7 REFERENCES

7. REFERENCES
112
Akkilic-Materna M, Massone C & Komericki P 2011 Imiquimod and lymphatic field
clearance: a new hypothesis based on a remote immune action on skin cancer. Acta Derm Venereol 91 432-435.
Alhaj NA, Abdullah R, Ibrahim S & Bustamam A 2008 Tamoxifen Drug Loading Solid Lipid Nanoparticles Prepared by Hot High Pressure Homogenization Techniques. American Journal of Pharmacology and Toxicology 3 219-224.
Almeida AJ & Souto E 2007 Solid lipid nanoparticles as a drug delivery system for peptides and proteins. Adv Drug Deliv Rev 59 478-490.
Anderson L, Schmieder GJ, Werschler WP, Tschen EH, Ling MR, Stough DB & Katsamas J 2009 Randomized, double-blind, double-dummy, vehicle-controlled study of ingenol mebutate gel 0.025% and 0.05% for actinic keratosis. J Am Acad Dermatol 60 934-943.
Askew DA, Mickan SM, Soyer HP & Wilkinson D 2009 Effectiveness of 5-fluorouracil treatment for actinic keratosis--a systematic review of randomized controlled trials. Int J Dermatol 48 453-463.
Atillasoy ES, Elenitsas R, Sauter ER, Soballe PW & Herlyn M 1997 UVB induction of epithelial tumors in human skin using a RAG-1 mouse xenograft model. J Invest Dermatol 109 704-709.
Ausch C, Buxhofer-Ausch V, Olszewski U, Hinterberger W, Ogris E, Schiessel R & Hamilton G 2009a Caspase-cleaved cytokeratin 18 fragment (M30) as marker of postoperative residual tumor load in colon cancer patients. Eur J Surg Oncol 35 1164-1168.
Ausch C, Buxhofer-Ausch V, Olszewski U, Schiessel R, Ogris E, Hinterberger W & Hamilton G 2009b Circulating cytokeratin 18 fragment m65-a potential marker of malignancy in colorectal cancer patients. J Gastrointest Surg 13 2020-2026.
Barak V, Goike H, Panaretakis KW & Einarsson R 2004 Clinical utility of cytokeratins as tumor markers. Clin Biochem 37 529-540.
Barrera MV & Herrera E 2007 Topical chemotherapy for actinic keratosis and nonmelanoma skin cancer: current options and future perspectives. Actas Dermosifiliogr 98 556-562.
Barzilai A, Lyakhovitsky A, Trau H, Fogel M & Huszar M 2007 Expression of p53 in the evolution of squamous cell carcinoma: correlation with the histology of the lesion. J Am Acad Dermatol 57 669-676.
Bates RR, Wortham JS, Counts WB, Dingman CW & Gelboin HV 1968 Inhibition by actinomycin D of DNA synthesis and skin tumorigenesis induced by 7,12-dimethylbenz(a)anthracene. Cancer Res 28 27-34.
Batheja P, Sheihet L, Kohn J, Singer AJ & Michniak-Kohn B 2011 Topical drug delivery by a polymeric nanosphere gel: Formulation optimization and in vitro and in vivo skin distribution studies. J Control Release 149 159-167.
Beachy SH & Repasky EA 2008 Using extracellular biomarkers for monitoring efficacy of therapeutics in cancer patients: an update. Cancer Immunol Immunother 57 759-775.
Bernas T & Dobrucki J 2002 Mitochondrial and nonmitochondrial reduction of MTT: interaction of MTT with TMRE, JC-1, and NAO mitochondrial fluorescent probes. Cytometry 47 236-242.
Biven K, Erdal H, Hagg M, Ueno T, Zhou R, Lynch M, Rowley B, Wood J, Zhang C, Toi M, et al. 2003 A novel assay for discovery and characterization of pro-apoptotic drugs and for monitoring apoptosis in patient sera. Apoptosis 8 263-268.
7. REFERENCES
113
Blaschke T, Kankate L & Kramer KD 2007 Structure and dynamics of drug-carrier systems as studied by parelectric spectroscopy. Adv Drug Deliv Rev 59 403-410.
Bradford CR, Zhu S, Ogawa H, Ogawa T, Ubell M, Narayan A, Johnson G, Wolf GT, Fisher SG & Carey TE 2003 P53 mutation correlates with cisplatin sensitivity in head and neck squamous cell carcinoma lines. Head Neck 25 654-661.
Braem C, Blaschke T, Panek-Minkin G, Herrmann W, Schlupp P, Paepenmuller T, Muller-Goyman C, Mehnert W, Bittl R, Schäfer-Korting M, et al. 2007a Interaction of drug molecules with carrier systems as studied by parelectric spectroscopy and electron spin resonance. J Control Release 119 128-135.
Braem C, Blaschke T, Panek-Minkin G, Herrmann W, Schlupp P, Paepenmüller T, Müller-Goyman C, Mehnert W, Bittl R, Schäfer-Korting M, et al. 2007b Interaction of drug molecules with carrier systems as studied by parelectric spectroscopy and electron spin resonance. J Control Release 119 128-135.
Brandt D, Volkmann X, Anstatt M, Langer F, Manns MP, Schulze-Osthoff K & Bantel H 2010 Serum biomarkers of cell death for monitoring therapy response of gastrointestinal carcinomas. Eur J Cancer 46 1464-1473.
Bummer PM 2004 Physical chemical considerations of lipid-based oral drug delivery--solid lipid nanoparticles. Crit Rev Ther Drug Carrier Syst 21 1-20.
Cabelguenne A, Blons H, de Waziers I, Carnot F, Houllier AM, Soussi T, Brasnu D, Beaune P, Laccourreye O & Laurent-Puig P 2000 p53 alterations predict tumor response to neoadjuvant chemotherapy in head and neck squamous cell carcinoma: a prospective series. J Clin Oncol 18 1465-1473.
Callen JP, Bickers DR & Moy RL 1997 Actinic keratoses. J Am Acad Dermatol 36 650-653.
Cavalli R, Gasco MR, Chetoni P, Burgalassi S & Saettone MF 2002 Solid lipid nanoparticles (SLN) as ocular delivery system for tobramycin. Int J Pharm 238 241-245.
Choi JS & Shin SC 2007 Preparation and evaluation of pranoprofen gel for percutaneous administration. Drug Dev Ind Pharm 33 19-26.
Cole SP 1986 Rapid chemosensitivity testing of human lung tumor cells using the MTT assay. Cancer Chemother Pharmacol 17 259-263.
Commandeur S, de Gruijl FR, Willemze R, Tensen CP & El Ghalbzouri A 2009 An in vitro three-dimensional model of primary human cutaneous squamous cell carcinoma. Exp Dermatol 18 849-856.
Corcuff P, Bertrand C & Leveque JL 1993 Morphometry of human epidermis in vivo by real-time confocal microscopy. Arch Dermatol Res 285 475-481.
Cosco D, Celia C, Cilurzo F, Trapasso E & Paolino D 2008 Colloidal carriers for the enhanced delivery through the skin. Expert Opin Drug Deliv 5 737-755.
Cummings J, Ranson M, Lacasse E, Ganganagari JR, St-Jean M, Jayson G, Durkin J & Dive C 2006 Method validation and preliminary qualification of pharmacodynamic biomarkers employed to evaluate the clinical efficacy of an antisense compound (AEG35156) targeted to the X-linked inhibitor of apoptosis protein XIAP. Br J Cancer 95 42-48.
de Haas EC, di Pietro A, Simpson KL, Meijer C, Suurmeijer AJ, Lancashire LJ, Cummings J, de Jong S, de Vries EG, Dive C, et al. 2008 Clinical evaluation of M30 and M65 ELISA cell death assays as circulating biomarkers in a drug-sensitive tumor, testicular cancer. Neoplasia 10 1041-1048.
De Petris L, Branden E, Herrmann R, Sanchez BC, Koyi H, Linderholm B, Lewensohn R, Linder S & Lehtio J 2011 Diagnostic and prognostic role of plasma levels of two
7. REFERENCES
114
forms of cytokeratin 18 in patients with non-small-cell lung cancer. Eur J Cancer 47 131-137.
Dodson JM, DeSpain J, Hewett JE & Clark DP 1991 Malignant potential of actinic keratoses and the controversy over treatment. A patient-oriented perspective. Arch Dermatol 127 1029-1031.
Ehrig RM, Taylor WR, Duda GN & Heller MO 2007 A survey of formal methods for determining functional joint axes. J Biomech 40 2150-2157.
el-Ghalbzouri A, Gibbs S, Lamme E, Van Blitterswijk CA & Ponec M 2002 Effect of fibroblasts on epidermal regeneration. Br J Dermatol 147 230-243.
Ener RA, Meglathery SB & Styler M 2004 Extravasation of systemic hemato-oncological therapies. Ann Oncol 15 858-862.
Feldman SR & Fleischer AB, Jr. 2011 Progression of actinic keratosis to squamous cell carcinoma revisited: clinical and treatment implications. Cutis 87 201-207.
Fotakis G & Timbrell JA 2006 In vitro cytotoxicity assays: comparison of LDH, neutral red, MTT and protein assay in hepatoma cell lines following exposure to cadmium chloride. Toxicol Lett 160 171-177.
Freitas C & Müller RH 1999 Correlation between long-term stability of solid lipid nanoparticles (SLN) and crystallinity of the lipid phase. Eur J Pharm Biopharm 47 125-132.
Gallo RL & Nakatsuji T 2011 Microbial Symbiosis with the Innate Immune Defense System of the Skin. J Invest Dermatol doi: 10.1038/jid.2011.1182. [Epub ahead of print].
Gan TJ 2010 Diclofenac: an update on its mechanism of action and safety profile. Curr Med Res Opin 26 1715-1731.
Gandhi V, Huang P, Chapman AJ, Chen F & Plunkett W 1997 Incorporation of fludarabine and 1-beta-D-arabinofuranosylcytosine 5'-triphosphates by DNA polymerase alpha: affinity, interaction, and consequences. Clin Cancer Res 3 1347-1355.
Garidel P 2003 Insights in the biochemical composition of skin as investigated by micro infrared spectroscopic imaging. Physical Chemistry Chemical Physics 5 2673-2679.
Gaspari AA 2007 Mechanism of action and other potential roles of an immune response modifier. Cutis 79 36-45.
Gebauer K, Shumack S & Cowen PS 2009 Effect of dosing frequency on the safety and efficacy of imiquimod 5% cream for treatment of actinic keratosis on the forearms and hands: a phase II, randomized placebo-controlled trial. Br J Dermatol 161 897-903.
Gerlini G, Romagnoli P & Pimpinelli N 2005 Skin cancer and immunosuppression. Crit Rev Oncol Hematol 56 127-136.
Gibbs S, Vicanova J, Bouwstra J, Valstar D, Kempenaar J & Ponec M 1997 Culture of reconstructed epidermis in a defined medium at 33 degrees C shows a delayed epidermal maturation, prolonged lifespan and improved stratum corneum. Arch Dermatol Res 289 585-595.
Gibson GE, O'Grady A, Kay EW, Leader M & Murphy GM 1997 p53 tumor suppressor gene protein expression in premalignant and malignant skin lesions of kidney transplant recipients. J Am Acad Dermatol 36 924-931.
Glynn JM, Cotter TG & Green DR 1992 Apoptosis induced by Actinomycin D, Camptothecin or Aphidicolin can occur in all phases of the cell cycle. Biochem Soc Trans 20 84S.

7. REFERENCES
115
Goldberg LH & Mamelak AJ 2010 Review ofactinic keratosis. Part I: etiology, epidemiology and clinical presentation. J Drugs Dermatol 9 1125-1132.
Gonzalez RJ & Tarloff JB 2001 Evaluation of hepatic subcellular fractions for Alamar blue and MTT reductase activity. Toxicol In Vitro 15 257-259.
Green J, Ikram M, Vyas J, Patel N, Proby CM, Ghali L, Leigh IM, O'Toole EA & Storey A 2006 Overexpression of the Axl tyrosine kinase receptor in cutaneous SCC-derived cell lines and tumours. Br J Cancer 94 1446-1451.
Gupta AK 2002 The management of actinic keratoses in the United States with topical fluorouracil: a pharmacoeconomic evaluation. Cutis 70 30-36.
Guy RH & Hadgraft J 1983 Physicochemical interpretation of the pharmacokinetics of percutaneous absorption. J Pharmacokinet Biopharm 11 189-203.
Hachem JP, Crumrine D, Fluhr J, Brown BE, Feingold KR & Elias PM 2003 pH directly regulates epidermal permeability barrier homeostasis, and stratum corneum integrity/cohesion. J Invest Dermatol 121 345-353.
Hagg M, Biven K, Ueno T, Rydlander L, Bjorklund P, Wiman KG, Shoshan M & Linder S 2002 A novel high-through-put assay for screening of pro-apoptotic drugs. Invest New Drugs 20 253-259.
Hamid R, Rotshteyn Y, Rabadi L, Parikh R & Bullock P 2004 Comparison of alamar blue and MTT assays for high through-put screening. Toxicol In Vitro 18 703-710.
Helgason T, Awad TS, Kristbergsson K, McClements DJ & Weiss J 2009 Effect of surfactant surface coverage on formation of solid lipid nanoparticles (SLN). J Colloid Interface Sci 334 75-81.
Hennings H, Smith HC, Colburn NH & Boutwell RK 1968 Inhibition by actinomycin D of DNA and RNA synthesis and of skin carcinogenesis initiated by 7,12-dimethylbenz[a]anthracene or beta-propiolactone. Cancer Res 28 543-552.
Hensen P, Muller ML, Haschemi R, Stander H, Luger TA, Sunderkotter C & Schiller M 2009 Predisposing factors of actinic keratosis in a North-West German population. Eur J Dermatol 19 345-354.
Höller D, Huppertz B, Roos TC, Poblete Gutierrez P, Merk HF, Frank J & Jugert FK 2001 An improved and rapid method to construct skin equivalents from human hair follicles and fibroblasts. Exp Dermatol 10 264-271.
Höller-Obrigkeit D, Jugert FK, Beermann T, Baron JM, Frank J, Merk HF, Bickers DR & Abuzahra F 2009 Effects of photodynamic therapy evaluated in a novel three-dimensional squamous cell carcinoma organ construct of the skin. Photochem Photobiol 85 272-278.
Hou JM, Greystoke A, Lancashire L, Cummings J, Ward T, Board R, Amir E, Hughes S, Krebs M, Hughes A, et al. 2009 Evaluation of circulating tumor cells and serological cell death biomarkers in small cell lung cancer patients undergoing chemotherapy. Am J Pathol 175 808-816.
Houben E, De Paepe K & Rogiers V 2007 A keratinocyte's course of life. Skin Pharmacol Physiol 20 122-132.
Ibrahim SF & Brown MD 2009 Actinic keratoses: a comprehensive update. J Clin Aesthet Dermatol 2 43-48.
Ibrahim SF & van den Engh G 2003 High-speed cell sorting: fundamentals and recent advances. Curr Opin Biotechnol 14 5-12.
ICH 2005 Validation of Analytical Procedures: Text and Methodology. International Conference on Harmonisation of Technical Requirements for Registration of Pharmaceuticals for Human Use.

7. REFERENCES
116
Jenning V, Schäfer-Korting M & Gohla S 2000a Vitamin A-loaded solid lipid nanoparticles for topical use: drug release properties. J Control Release 66 115-126.
Jenning V, Thünemann AF & Gohla SH 2000b Characterisation of a novel solid lipid nanoparticle carrier system based on binary mixtures of liquid and solid lipids. Int J Pharm 199 167-177.
Jiang HY, Hickey RJ, Abdel-Aziz W & Malkas LH 2000 Effects of gemcitabine and araC on in vitro DNA synthesis mediated by the human breast cell DNA synthesome. Cancer Chemother Pharmacol 45 320-328.
Johnson MR, Hageboutros A, Wang K, High L, Smith JB & Diasio RB 1999 Life-threatening toxicity in a dihydropyrimidine dehydrogenase-deficient patient after treatment with topical 5-fluorouracil. Clin Cancer Res 5 2006-2011.
Jorizzo J 2004a Topical treatment of actinic keratosis with fluorouracil: is irritation associated with efficacy? J Drugs Dermatol 3 21-26.
Jorizzo J, Dinehart S, Matheson R, Moore JK, Ling M, Fox TL, McRae S, Fielder S & Lee JH 2007 Vehicle-controlled, double-blind, randomized study of imiquimod 5% cream applied 3 days per week in one or two courses of treatment for actinic keratoses on the head. J Am Acad Dermatol 57 265-268.
Jorizzo J, Weiss J, Furst K, VandePol C & Levy SF 2004a Effect of a 1-week treatment with 0.5% topical fluorouracil on occurrence of actinic keratosis after cryosurgery: a randomized, vehicle-controlled clinical trial. Arch Dermatol 140 813-816.
Jorizzo JL 2004b Current and novel treatment options for actinic keratosis. J Cutan Med Surg 8 Suppl 3 13-21.
Jorizzo JL, Carney PS, Ko WT, Robins P, Weinkle SH & Werschler WP 2004b Fluorouracil 5% and 0.5% creams for the treatment of actinic keratosis: equivalent efficacy with a lower concentration and more convenient dosing schedule. Cutis 74 18-23.
Ju J, Schmitz JC, Song B, Kudo K & Chu E 2007 Regulation of p53 expression in response to 5-fluorouracil in human cancer RKO cells. Clin Cancer Res 13 4245-4251.
Juzeniene A, Juzenas P & Moan J 2010 Application of 5-aminolevulinic acid and its derivatives for photodynamic therapy in vitro and in vivo. Methods Mol Biol 635 97-106.
Kang KW, Chun MK, Kim O, Subedi RK, Ahn SG, Yoon JH & Choi HK 2010 Doxorubicin-loaded solid lipid nanoparticles to overcome multidrug resistance in cancer therapy. Nanomedicine 6 210-213.
Karasek MA 1983 Culture of human keratinocytes in liquid medium. J Invest Dermatol 81 24s-28s.
Kee SH & Steinert PM 2001 Microtubule disruption in keratinocytes induces cell-cell adhesion through activation of endogenous E-cadherin. Mol Biol Cell 12 1983-1993.
Khan MA, Jenkins GR, Tolleson WH, Creek KE & Pirisi L 1993 Retinoic acid inhibition of human papillomavirus type 16-mediated transformation of human keratinocytes. Cancer Res 53 905-909.
Kipp JE 2004 The role of solid nanoparticle technology in the parenteral delivery of poorly water-soluble drugs. Int J Pharm 284 109-122.
Ko CJ 2010 Actinic keratosis: facts and controversies. Clin Dermatol 28 249-253. Korting HC, Patzak U, Schaller M & Maibach HI 1998 A model of human cutaneous
candidosis based on reconstructed human epidermis for the light and electron microscopic study of pathogenesis and treatment. J Infect 36 259-267.

7. REFERENCES
117
Kose O, Koc E, Erbil AH, Caliskan E & Kurumlu Z 2008 Comparison of the efficacy and tolerability of 3% diclofenac sodium gel and 5% imiquimod cream in the treatment of actinic keratosis. J Dermatolog Treat 19 159-163.
Kramer G, Erdal H, Mertens HJ, Nap M, Mauermann J, Steiner G, Marberger M, Biven K, Shoshan MC & Linder S 2004 Differentiation between cell death modes using measurements of different soluble forms of extracellular cytokeratin 18. Cancer Res 64 1751-1756.
Kramer G, Schwarz S, Hagg M, Havelka AM & Linder S 2006 Docetaxel induces apoptosis in hormone refractory prostate carcinomas during multiple treatment cycles. Br J Cancer 94 1592-1598.
Küchler S, Abdel-Mottaleb M, Lamprecht A, Radowski MR, Haag R & Schäfer-Korting M 2009 Influence of nanocarrier type and size on skin delivery of hydrophilic agents. Int J Pharm 377 169-172.
Kuwakado K, Kubota M, Hirota H, Adachi S, Matsubara K, Kasai Y, Akiyama Y & Mikawa H 1993 Aphidicolin potentiates apoptosis induced by arabinosyl nucleosides in human myeloid leukemia cell lines. Biochem Pharmacol 46 1909-1916.
Lavrijsen AP, Higounenc IM, Weerheim A, Oestmann E, Tuinenburg EE, Bodde HE & Ponec M 1994 Validation of an in vivo extraction method for human stratum corneum ceramides. Arch Dermatol Res 286 495-503.
Leary T, Jones PL, Appleby M, Blight A, Parkinson K & Stanley M 1992 Epidermal keratinocyte self-renewal is dependent upon dermal integrity. J Invest Dermatol 99 422-430.
Lee SY, Jeong EK, Jeon HM, Kim CH & Kang HS 2010 Implication of necrosis-linked p53 aggregation in acquired apoptotic resistance to 5-FU in MCF-7 multicellular tumour spheroids. Oncol Rep 24 73-79.
Leers MP, Kolgen W, Bjorklund V, Bergman T, Tribbick G, Persson B, Bjorklund P, Ramaekers FC, Bjorklund B, Nap M, et al. 1999 Immunocytochemical detection and mapping of a cytokeratin 18 neo-epitope exposed during early apoptosis. J Pathol 187 567-572.
Linder S, Havelka AM, Ueno T & Shoshan MC 2004 Determining tumor apoptosis and necrosis in patient serum using cytokeratin 18 as a biomarker. Cancer Lett 214 1-9.
Lipinski CA, Lombardo F, Dominy BW & Feeney PJ 2001 Experimental and computational approaches to estimate solubility and permeability in drug discovery and development settings. Adv Drug Deliv Rev 46 3-26.
Longley DB, Harkin DP & Johnston PG 2003 5-fluorouracil: mechanisms of action and clinical strategies. Nat Rev Cancer 3 330-338.
Lubritz RR & Smolewski SA 1982 Cryosurgery cure rate of actinic keratoses. J Am Acad Dermatol 7 631-632.
Mac-Mary S, Sainthillier JM & Humbert P 2004 Dry Skin and the Environment. Exogenous Dermatology 3 72-80.
Machnik M, Hegger I, Kietzmann M, Thevis M, Guddat S & Schanzer W 2007 Pharmacokinetics of altrenogest in horses. J Vet Pharmacol Ther 30 86-90.
MacNeil S 2007 Progress and opportunities for tissue-engineered skin. Nature 445 874-880.
Margulis A, Zhang W, Alt-Holland A, Crawford HC, Fusenig NE & Garlick JA 2005 E-cadherin suppression accelerates squamous cell carcinoma progression in three-dimensional, human tissue constructs. Cancer Res 65 1783-1791.
Marks JG, Miller JJ & Lookingbill DP 2006 Lookingbill and Marks' Principles of Dermatology Saunders Elsevier.

7. REFERENCES
118
McIntyre WJ, Downs MR & Bedwell SA 2007 Treatment options for actinic keratoses. Am Fam Physician 76 667-671.
Mehnert W & Mader K 2001 Solid lipid nanoparticles: production, characterization and applications. Adv Drug Deliv Rev 47 165-196.
Merk HF 2007 Topical diclofenac in the treatment of actinic keratoses. Int J Dermatol 46 12-18.
Miglietta A, Cavalli R, Bocca C, Gabriel L & Gasco MR 2000 Cellular uptake and cytotoxicity of solid lipid nanospheres (SLN) incorporating doxorubicin or paclitaxel. Int J Pharm 210 61-67.
Mildner M, Jin J, Eckhart L, Kezic S, Gruber F, Barresi C, Stremnitzer C, Buchberger M, Mlitz V, Ballaun C, et al. 2010 Knockdown of filaggrin impairs diffusion barrier function and increases UV sensitivity in a human skin model. J Invest Dermatol 130 2286-2294.
Mizutani Y, Mitsutake S, Tsuji K, Kihara A & Igarashi Y 2009 Ceramide biosynthesis in keratinocyte and its role in skin function. Biochimie 91 784-790.
Molina BD, Leiro MG, Pulpon LA, Mirabet S, Yanez JF, Bonet LA, Vilchez FG, Delgado JF, Manito N, Rabago G, et al. 2010 Incidence and risk factors for nonmelanoma skin cancer after heart transplantation. Transplant Proc 42 3001-3005.
Moriarty M, Dunn J, Darragh A, Lambe R & Brick I 1982 Etretinate in treatment of actinic keratosis. A double-blind crossover study. Lancet 1 364-365.
Müller RH, Mehnert W, Lucks JS, Schwarz C, Zur Muhlen A, Weyhers H, Freitas C & Ruhl D 1995 Solid lipid nanoparticles (SLN) - An alternative colloidal carrier system for controlled drug delivery. European Journal of Pharmaceutics and Biopharmaceutics 41 62-69.
Müller RH, Radtke M & Wissing SA 2002 Solid lipid nanoparticles (SLN) and nanostructured lipid carriers (NLC) in cosmetic and dermatological preparations. Adv Drug Deliv Rev 54 Suppl 1 S131-155.
Müller RH, Runge S, Ravelli V, Mehnert W, Thünemann AF & Souto EB 2006 Oral bioavailability of cyclosporine: solid lipid nanoparticles (SLN) versus drug nanocrystals. Int J Pharm 317 82-89.
Muston D, Downs A & Rives V 2009 An economic evaluation of topical treatments for actinic keratosis. J Dermatolog Treat 20 266-275.
Nicotera P, Leist M, Single B & Volbracht C 1999 Execution of apoptosis: converging or diverging pathways? Biol Chem 380 1035-1040.
Nogues MR, Giralt M, Cervello I, Del Castillo D, Espeso O, Argany N, Aliaga A & Mallol J 2002 Parameters related to oxygen free radicals in human skin: a study comparing healthy epidermis and skin cancer tissue. J Invest Dermatol 119 645-652.
Novak N, Yu CF, Bieber T & Allam JP 2008 Toll-like receptor 7 agonists and skin. Drug News Perspect 21 158-165.
Ogbourne SM, Suhrbier A, Jones B, Cozzi SJ, Boyle GM, Morris M, McAlpine D, Johns J, Scott TM, Sutherland KP, et al. 2004 Antitumor activity of 3-ingenyl angelate: plasma membrane and mitochondrial disruption and necrotic cell death. Cancer Res 64 2833-2839.
Oji V, Eckl KM, Aufenvenne K, Natebus M, Tarinski T, Ackermann K, Seller N, Metze D, Nurnberg G, Folster-Holst R, et al. 2010 Loss of corneodesmosin leads to severe skin barrier defect, pruritus, and atopy: unraveling the peeling skin disease. Am J Hum Genet 87 274-281.

7. REFERENCES
119
Ozturk B, Coskun U, Sancak B, Yaman E, Buyukberber S & Benekli M 2009 Elevated serum levels of M30 and M65 in patients with locally advanced head and neck tumors. Int Immunopharmacol 9 645-648.
Page M, Bejaoui N, Cinq-Mars B & Lemieux P 1988 Optimization of the tetrazolium-based colorimetric assay for the measurement of cell number and cytotoxicity. Int J Immunopharmacol 10 785-793.
Pampaloni F, Stelzer EH & Masotti A 2009 Three-dimensional tissue models for drug discovery and toxicology. Recent Pat Biotechnol 3 103-117.
Papadakis ES, Cichon MA, Vyas JJ, Patel N, Ghali L, Cerio R, Storey A & O'Toole EA 2011 Axl promotes cutaneous squamous cell carcinoma survival through negative regulation of pro-apoptotic Bcl-2 family members. J Invest Dermatol 131 509-517.
Pardeike J, Hommoss A & Muller RH 2009 Lipid nanoparticles (SLN, NLC) in cosmetic and pharmaceutical dermal products. Int J Pharm 366 170-184.
Park MY, Sohn S, Lee ES & Kim YC 2009 Photorejuvenation induced by 5-aminolevulinic acid photodynamic therapy in patients with actinic keratosis: a histologic analysis. J Am Acad Dermatol 62 85-95.
Partridge M, Costea DE & Huang X 2007 The changing face of p53 in head and neck cancer. Int J Oral Maxillofac Surg 36 1123-1138.
Partridge M, Gaballah K & Huang X 2005 Molecular markers for diagnosis and prognosis. Cancer Metastasis Rev 24 71-85.
Peternel S, Manestar-Blazic T, Brajac I, Prpic-Massari L & Kastelan M 2011 Expression of TWEAK in normal human skin, dermatitis and epidermal neoplasms: association with proliferation and differentiation of keratinocytes. J Cutan Pathol Jul 29. doi: 10.1111/j.1600-0560.2011.01762.x.
Ponec M, Weerheim A, Kempenaar J, Mulder A, Gooris GS, Bouwstra J & Mommaas AM 1997 The formation of competent barrier lipids in reconstructed human epidermis requires the presence of vitamin C. J Invest Dermatol 109 348-355.
Pople PV & Singh KK 2011 Development and evaluation of colloidal modified nanolipid carrier: Application to topical delivery of tacrolimus. Eur J Pharm Biopharm.
Potts RO & Guy RH 1992 Predicting skin permeability. Pharm Res 9 663-669. Prados C, Alvarez-Sala R, Gomez de Terrero J, Callol L, Garcia Rio F, Gomez Carrera
L, Gomez de Terreros Caro J, Alvarez-Sala JL, Espinos D & Villamor J 2000 An evaluation of tissue polypeptide antigen (TPA) in the two bronchoalveolar lavage fractions of lung cancer patients. Jpn J Clin Oncol 30 215-220.
Quaedvlieg PJ, Tirsi E, Thissen MR & Krekels GA 2006 Actinic keratosis: how to differentiate the good from the bad ones? Eur J Dermatol 16 335-339.
Quatresooz P, Pierard-Franchimont C, Paquet P, Hubert P, Delvenne P & Pierard GE 2008 Crossroads between actinic keratosis and squamous cell carcinoma, and novel pharmacological issues. Eur J Dermatol 18 6-10.
Rai-el-Balhaa G, Pellerin JL, Bodin G, Abdullah A & Hiron H 1985 Lymphoblastic transformation assay of sheep peripheral blood lymphocytes: a new rapid and easy-to-read technique. Comp Immunol Microbiol Infect Dis 8 311-318.
Rao GC, Kumar MS, Mathivanan N & Rao ME 2004 Nanosuspensions as the most promising approach in nanoparticulate drug delivery systems. Pharmazie 59 5-9.
Reddy LH & Ghosh B 2001 Enhancer aided in vitro permeation of atenolol and prazosin hydrochloride through mice skin. Indian J Exp Biol 39 47-51.
Remane Y, Leopold CS & Maibach HI 2006 Percutaneous penetration of methyl nicotinate from ointments using the laser Doppler technique: bioequivalence and enhancer effects. J Pharmacokinet Pharmacodyn 33 719-735.
7. REFERENCES
120
Rheinwald JG & Beckett MA 1981 Tumorigenic keratinocyte lines requiring anchorage and fibroblast support cultures from human squamous cell carcinomas. Cancer Res 41 1657-1663.
Richartz A, Höltje M, Brandt B, Schäfer-Korting M & Höltje HD 2008 Targeting human DNA polymerase alpha for the inhibition of keratinocyte proliferation. Part 1. Homology model, active site architecture and ligand binding. J Enzyme Inhib Med Chem 23 94-100.
Robins P 2002 Pulse therapy with 5-FU in eradicating actinic keratoses with less than recommended dosage. J Drugs Dermatol 1 25-30.
Rote Liste 2011. Roth SH & Fuller P 2011 Diclofenac topical solution compared with oral diclofenac: a
pooled safety analysis. J Pain Res 4 159-167. Rowert-Huber J, Patel MJ, Forschner T, Ulrich C, Eberle J, Kerl H, Sterry W &
Stockfleth E 2007 Actinic keratosis is an early in situ squamous cell carcinoma: a proposal for reclassification. Br J Dermatol 156 Suppl 3 8-12.
Rubin LF 1983 Toxicological Update of Dimethyl Sulfoxide. Annals of the New York Academy of Sciences 411 6-10.
Sanders DSA & Carr RA 2007 The use of immunohistochemistry in the differential diagnosis of common epithelial tumours of the skin 13 237-251.
Sangster-Guity N, Conrad BH, Papadopoulos N & Bunz F 2011 ATR mediates cisplatin resistance in a p53 genotype-specific manner. Oncogene 30 2526-2533.
Sanna V, Gavini E, Cossu M, Rassu G & Giunchedi P 2007 Solid lipid nanoparticles (SLN) as carriers for the topical delivery of econazole nitrate: in-vitro characterization, ex-vivo and in-vivo studies. Journal of Pharmacy and Pharmacology 59 1057-1064.
Santos Maia C, Mehnert W, Schaller M, Korting HC, Gysler A, Haberland A & Schäfer-Korting M 2002a Drug targeting by solid lipid nanoparticles for dermal use. J Drug Target 10 489-495.
Santos Maia C, Mehnert W, Schaller M, Korting HC, Gysler A, Haberland A & Schäfer-Korting M 2002b Drug targeting by solid lipid nanoparticles for dermal use. J Drug Targeting 10 489-495.
Santos P, Watkinson AC, Hadgraft J & Lane ME 2008 Application of microemulsions in dermal and transdermal drug delivery. Skin Pharmacol Physiol 21 246-259.
Sargent JM & Taylor CG 1989 Appraisal of the MTT assay as a rapid test of chemosensitivity in acute myeloid leukaemia. Br J Cancer 60 206-210.
Savastano AA 1984 Clinical experiences with dimethyl sulfoxide (DMSO) in human subjects. Approval must be withheld until safety in extended use is established. R I Med J 67 119-121.
Schäfer-Korting M, Bock U, Diembeck W, Dusing HJ, Gamer A, Haltner-Ukomadu E, Hoffmann C, Kaca M, Kamp H, Kersen S, et al. 2008 The use of reconstructed human epidermis for skin absorption testing: Results of the validation study. Altern Lab Anim 36 161-187.
Schäfer-Korting M, Bock U, Gamer A, Haberland A, Haltner-Ukomadu E, Kaca M, Kamp H, Kietzmann M, Korting HC, Krachter HU, et al. 2006 Reconstructed human epidermis for skin absorption testing: results of the German prevalidation study. Altern Lab Anim 34 283-294.
Schäfer-Korting M, Mehnert W & Korting HC 2007 Lipid nanoparticles for improved topical application of drugs for skin diseases. Adv Drug Deliv Rev 59 427-443.

7. REFERENCES
121
Schaller M, Schäfer W, Korting HC & Hube B 1998 Differential expression of secreted aspartyl proteinases in a model of human oral candidosis and in patient samples from the oral cavity. Mol Microbiol 29 605-615.
Schettino G, Johnson GW, Marino SA & Brenner DJ 2010 Development of a method for assessing non-targeted radiation damage in an artificial 3D human skin model. Int J Radiat Biol 86 593-601.
Schlaak M, von Bartenwerffer W & Mauch C 2011 Current therapy of non-melanoma skin cancer. Hautarzt 62.
Schlupp P, Blaschke T, Kramer KD, Höltje HD, Mehnert W & Schäfer-Korting M 2011 Drug Release and Skin Penetration from Solid Lipid Nanoparticles and a Base Cream: A Systematic Approach from a Comparison of Three Glucocorticoids. Skin Pharmacol Physiol 24 199-209.
Schmid-Wendtner MH & Korting HC 2006 The pH of the skin surface and its impact on the barrier function. Skin Pharmacol Physiol 19 296-302.
Schneider JJ, Unholzer A, Schaller M, Schäfer-Korting M & Korting HC 2005 Human defensins. J Mol Med (Berl) 83 587-595.
Schutte B, Henfling M, Kolgen W, Bouman M, Meex S, Leers MP, Nap M, Bjorklund V, Bjorklund P, Bjorklund B, et al. 2004 Keratin 8/18 breakdown and reorganization during apoptosis. Exp Cell Res 297 11-26.
Schwanke A, Murruzzu C, Zdrazil B, Zuhse R, Natek M, Höltje M, Korting HC, Reissig HU, Höltje HD & Schäfer-Korting M 2010 Antitumor effects of guanosine-analog phosphonates identified by molecular modelling. Int J Pharm 397 9-18.
Scott LC, Evans TR, Cassidy J, Harden S, Paul J, Ullah R, O'Brien V & Brown R 2009 Cytokeratin 18 in plasma of patients with gastrointestinal adenocarcinoma as a biomarker of tumour response. Br J Cancer 101 410-417.
Sellheyer K & Bergfeld WF 2006 Differences in biopsy techniques of actinic keratoses by plastic surgeons and dermatologists: a histologically controlled pilot study. Arch Dermatol 142 455-459.
Shahgaldian P, Quattrocchi L, Gualbert J, Coleman AW & Goreloff P 2003 AFM imaging of calixarene based solid lipid nanoparticles in gel matrices. Eur J Pharm Biopharm 55 107-113.
Shoimer I, Rosen N & Muhn C 2010 Current management of actinic keratoses. Skin Therapy Lett 15 5-7.
Silapunt S, Goldberg LH & Alam M 2003 Topical and light-based treatments for actinic keratoses. Semin Cutan Med Surg 22 162-170.
Siller G, Gebauer K, Welburn P, Katsamas J & Ogbourne SM 2009 PEP005 (ingenol mebutate) gel, a novel agent for the treatment of actinic keratosis: results of a randomized, double-blind, vehicle-controlled, multicentre, phase IIa study. Australas J Dermatol 50 16-22.
Simon LS, Grierson LM, Naseer Z, Bookman AA & Zev Shainhouse J 2009 Efficacy and safety of topical diclofenac containing dimethyl sulfoxide (DMSO) compared with those of topical placebo, DMSO vehicle and oral diclofenac for knee osteoarthritis. Pain 143 238-245.
Singh S, Upadhyay AK, Ajay AK & Bhat MK 2007 Gadd45alpha does not modulate the carboplatin or 5-fluorouracil-induced apoptosis in human papillomavirus-positive cells. J Cell Biochem 100 1191-1199.
Sivaramakrishnan R, Nakamura C, Mehnert W, Korting HC, Kramer KD & Schäfer-Korting M 2004a Glucocorticoid entrapment into lipid carriers--characterisation by parelectric spectroscopy and influence on dermal uptake. J. Control. Release 97 493-502.

7. REFERENCES
122
Sivaramakrishnan R, Nakamura C, Mehnert W, Korting HC, Kramer KD & Schäfer-Korting M 2004b Glucocorticoid entrapment into lipid carriers--characterisation by parelectric spectroscopy and influence on dermal uptake. J Control Release 97 493-502.
Sliwowska I, Kopczynski Z & Grodecka-Gazdecka S 2006 Diagnostic value of measuring serum CA 15-3, TPA, and TPS in women with breast cancer. Postepy Hig Med Dosw (Online) 60 295-299.
Souto EB & Müller RH 2010 Lipid nanoparticles: effect on bioavailability and pharmacokinetic changes. Handb Exp Pharmacol 115-141.
Souto EB, Wissing SA, Barbosa CM & Muller RH 2004a Evaluation of the physical stability of SLN and NLC before and after incorporation into hydrogel formulations. Eur J Pharm Biopharm 58 83-90.
Souto EB, Wissing SA, Barbosa CM & Müller RH 2004b Development of a controlled release formulation based on SLN and NLC for topical clotrimazole delivery. Int J Pharm 278 71-77.
Spencer JM, Hazan C, Hsiung SH & Robins P 2005 Therapeutic decision making in the therapy of actinic keratoses. J Drugs Dermatol 4 296-301.
Stockfleth E 2009 Topical management of actinic keratosis and field cancerisation. G Ital Dermatol Venereol 144 459-462.
Stockfleth E & Kerl H 2006 Guidelines for the management of actinic keratoses. Eur J Dermatol 16 599-606.
Subedi RK, Kang KW & Choi HK 2009 Preparation and characterization of solid lipid nanoparticles loaded with doxorubicin. Eur J Pharm Sci 37 508-513.
Szeimies RM, Karrer S, Radakovic-Fijan S, Tanew A, Calzavara-Pinton PG, Zane C, Sidoroff A, Hempel M, Ulrich J, Proebstle T, et al. 2002 Photodynamic therapy using topical methyl 5-aminolevulinate compared with cryotherapy for actinic keratosis: A prospective, randomized study. J Am Acad Dermatol 47 258-262.
Szeimies RM, Radny P, Sebastian M, Borrosch F, Dirschka T, Krahn-Senftleben G, Reich K, Pabst G, Voss D, Foguet M, et al. 2010 Photodynamic therapy with BF-200 ALA for the treatment of actinic keratosis: results of a prospective, randomized, double-blind, placebo-controlled phase III study. Br J Dermatol 163 386-394.
Thurnher D, Turhani D, Pelzmann M, Wannemacher B, Knerer B, Formanek M, Wacheck V & Selzer E 2003 Betulinic acid: a new cytotoxic compound against malignant head and neck cancer cells. Head Neck 25 732-740.
Torres A, Storey L, Anders M, Miller RL, Bulbulian BJ, Jin J, Raghavan S, Lee J, Slade HB & Birmachu W 2007 Immune-mediated changes in actinic keratosis following topical treatment with imiquimod 5% cream. J Transl Med 5 7.
Twentyman PR, Fox NE & Rees JK 1989 Chemosensitivity testing of fresh leukaemia cells using the MTT colorimetric assay. Br J Haematol 71 19-24.
Tyler LN, Ai L, Zuo C, Fan CY & Smoller BR 2003 Analysis of promoter hypermethylation of death-associated protein kinase and p16 tumor suppressor genes in actinic keratoses and squamous cell carcinomas of the skin. Mod Pathol 16 660-664.
Ueno T, Toi M, Biven K, Bando H, Ogawa T & Linder S 2003 Measurement of an apoptotic product in the sera of breast cancer patients. Eur J Cancer 39 769-774.

7. REFERENCES
123
Ulrich M & Stockfleth E 2009 Field treatment of actinic keratoses - focus on COX-2-inhibitors. Actas Dermosifiliogr 100 Suppl 2 55-58.
Ulukaya E, Yilmaztepe A, Akgoz S, Linder S & Karadag M 2007 The levels of caspase-cleaved cytokeratin 18 are elevated in serum from patients with lung cancer and helpful to predict the survival. Lung Cancer 56 399-404.
Vaidya MM, Borges AM, Pradhan SA & Bhisey AN 1996 Cytokeratin expression in squamous cell carcinomas of the tongue and alveolar mucosa. Eur J Cancer B Oral Oncol 32B 333-336.
Van Gele M, Geusens B, Brochez L, Speeckaert R & Lambert J 2011 Three-dimensional skin models as tools for transdermal drug delivery: challenges and limitations. Expert Opin Drug Deliv 8 705-720.
Vavrova K, Lorencova K, Klimentova J, Novotny J & Hrabalek A 2007 HPLC method for determination of in vitro delivery through and into porcine skin of adefovir (PMEA). J Chromatogr B Analyt Technol Biomed Life Sci 853 198-203.
Wang C, Tammi M & Tammi R 1992 Distribution of hyaluronan and its CD44 receptor in the epithelia of human skin appendages. Histochemistry 98 105-112.
Wertz PW 1996 The nature of the epidermal barrier: biochemical aspects. Advanced Drug Delivery Reviews 18 283-294.
Williams AC & Barry BW 2004 Penetration enhancers. Adv Drug Deliv Rev 56 603-618.
Williams S, Davids M, Reuther T, Kraus D & Kerscher M 2005 Gender difference of in vivo skin surface pH in the axilla and the effect of a standardized washing procedure with tap water. Skin Pharmacol Physiol 18 247-252.
Wilson EC 2010 Cost effectiveness of imiquimod 5% cream compared with methyl aminolevulinate-based photodynamic therapy in the treatment of non-hyperkeratotic, non-hypertrophic actinic (solar) keratoses: a decision tree model. Pharmacoeconomics 28 1055-1064.
Wissing SA, Kayser O & Muller RH 2004 Solid lipid nanoparticles for parenteral drug delivery. Adv Drug Deliv Rev 56 1257-1272.
Worle-Knirsch JM, Pulskamp K & Krug HF 2006 Oops they did it again! Carbon nanotubes hoax scientists in viability assays. Nano Lett 6 1261-1268.
Xiang QY, Wang MT, Chen F, Gong T, Jian YL, Zhang ZR & Huang Y 2007 Lung-targeting delivery of dexamethasone acetate loaded solid lipid nanoparticles. Arch Pharm Res 30 519-525.
Xu H, Cheepala S, McCauley E, Coombes K, Xiao L, Fischer SM & Clifford JL 2006 Chemoprevention of skin carcinogenesis by phenylretinamides: retinoid receptor-independent tumor suppression. Clin Cancer Res 12 969-979.
Yadev NP, Murdoch C, Saville SP & Thornhill MH 2011 Evaluation of tissue engineered models of the oral mucosa to investigate oral candidiasis. Microb Pathog 50 278-285.
Yamachika E, Habte T & Oda D 2004 Artemisinin: an alternative treatment for oral squamous cell carcinoma. Anticancer Res 24 2153-2160.
Yaman E, Coskun U, Sancak B, Buyukberber S, Ozturk B & Benekli M 2010 Serum M30 levels are associated with survival in advanced gastric carcinoma patients. Int Immunopharmacol 10 719-722.
Yoneda K, Yamamoto T, Ueta E & Osaki T 1999 The inhibitory action of BOF-A2, a 5-fluorouracil derivative, on squamous cell carcinoma. Cancer Lett 137 17-25.
Zdrazil B, Schwanke A, Schmitz B, Schäfer-Korting M & Höltje HD 2010 Molecular modelling studies of new potential human DNA polymerase alpha inhibitors. J Enzyme Inhib Med Chem 26 270-279