Novel Loci Underlie Natural Variation in Vitamin E Levels ... · ! 2! association-mapping panel....
50
1 LARGE-SCALE BIOLOGY ARTICLE Novel Loci Underlie Natural Variation in Vitamin E Levels in Maize Grain Christine H. Diepenbrock 1 , Catherine B. Kandianis 1,2 †, Alexander E. Lipka 3 †, Maria Magallanes- Lundback 2 , Brieanne Vaillancourt 4 , Elsa Góngora-Castillo 4 †, Jason G. Wallace 3 †, Jason Cepela 4 , Alex Mesberg 2 , Peter J. Bradbury 3,5 , Daniel C. Ilut 1 , Maria Mateos-Hernandez 6 †, John Hamilton 4 , Brenda F. Owens 6 , Tyler Tiede 6 †, Edward S. Buckler 1,3,5 , Torbert Rocheford 6 , C. Robin Buell 4 , Michael A. Gore 1* , and Dean DellaPenna 2* 1 Cornell University, Plant Breeding and Genetics Section, School of Integrative Plant Science, Ithaca, NY 14853. 2 Michigan State University, Department of Biochemistry and Molecular Biology, East Lansing, MI 48824. 3 Cornell University, Institute for Genomic Diversity, Ithaca, NY 1s4853. 4 Michigan State University, Department of Plant Biology, East Lansing, MI 48824. 5 United States Department of Agriculture-Agricultural Research Service (ARS), Robert W. Holley Center for Agriculture and Health, Ithaca, NY 14853. 6 Purdue University, Department of Agronomy, West Lafayette, IN 47907. †Present addresses: Advancing Eco Agriculture, Middlefield, OH 44062 (C.B.K.); University of Illinois at Urbana-Champaign, Department of Crop Sciences, Urbana, IL 61801 (A.E.L.); Yucatan Center for Scientific Research, Department of Biotechnology, Merida, Yucatan, Mexico. 97200 (E.G.-C.); University of Georgia, Department of Crop & Soil Sciences, Athens, GA 30602 (J.G.W.); Monsanto Company, Stonington, IL, 62567 (M. M.-H.); University of Minnesota, Department of Agronomy and Plant Genetics, St. Paul, MN 55108 (T.T.). *Corresponding authors: [email protected], [email protected]. Short title: Novel vitamin E loci in maize grain One-sentence summary: This joint linkage and genome-wide association study comprehensively investigates natural variation in maize grain vitamin E levels using the 5,000- line U.S. nested association-mapping (NAM) panel. The authors responsible for distribution of materials integral to the findings presented in this article in accordance with the policy described in the Instructions for Authors (www.plantcell.org) are: Michael Gore ([email protected]) and Dean DellaPenna ([email protected]). ABSTRACT Tocopherols, tocotrienols and plastochromanols (collectively termed tocochromanols) are lipid- soluble antioxidants synthesized by all plants. Their dietary intake, primarily from seed oils, provides vitamin E and other health benefits. Tocochromanol biosynthesis has been dissected in the dicot Arabidopsis thaliana, which has green, photosynthetic seeds, but our understanding of tocochromanol accumulation in major crops, whose seeds are non-photosynthetic, remains limited. To understand the genetic control of tocochromanols in grain, we conducted a joint linkage and genome-wide association study in the 5,000-line U.S. maize (Zea mays) nested Plant Cell Advance Publication. Published on October 2, 2017, doi:10.1105/tpc.17.00475 ©2017 American Society of Plant Biologists. All Rights Reserved
Transcript of Novel Loci Underlie Natural Variation in Vitamin E Levels ... · ! 2! association-mapping panel....

! 1!
LARGE-SCALE BIOLOGY ARTICLE Novel Loci Underlie Natural Variation in Vitamin E Levels in Maize Grain Christine H. Diepenbrock1, Catherine B. Kandianis1,2†, Alexander E. Lipka3†, Maria Magallanes-Lundback2, Brieanne Vaillancourt4, Elsa Góngora-Castillo4†, Jason G. Wallace3†, Jason Cepela4, Alex Mesberg2, Peter J. Bradbury3,5, Daniel C. Ilut1, Maria Mateos-Hernandez6†, John Hamilton4, Brenda F. Owens6, Tyler Tiede6†, Edward S. Buckler1,3,5, Torbert Rocheford6, C. Robin Buell4, Michael A. Gore1*, and Dean DellaPenna2*
1Cornell University, Plant Breeding and Genetics Section, School of Integrative Plant Science, Ithaca, NY 14853. 2Michigan State University, Department of Biochemistry and Molecular Biology, East Lansing, MI 48824. 3Cornell University, Institute for Genomic Diversity, Ithaca, NY 1s4853. 4Michigan State University, Department of Plant Biology, East Lansing, MI 48824. 5United States Department of Agriculture-Agricultural Research Service (ARS), Robert W. Holley Center for Agriculture and Health, Ithaca, NY 14853. 6Purdue University, Department of Agronomy, West Lafayette, IN 47907. †Present addresses: Advancing Eco Agriculture, Middlefield, OH 44062 (C.B.K.); University of Illinois at Urbana-Champaign, Department of Crop Sciences, Urbana, IL 61801 (A.E.L.); Yucatan Center for Scientific Research, Department of Biotechnology, Merida, Yucatan, Mexico. 97200 (E.G.-C.); University of Georgia, Department of Crop & Soil Sciences, Athens, GA 30602 (J.G.W.); Monsanto Company, Stonington, IL, 62567 (M. M.-H.); University of Minnesota, Department of Agronomy and Plant Genetics, St. Paul, MN 55108 (T.T.). *Corresponding authors: [email protected], [email protected]. Short title: Novel vitamin E loci in maize grain One-sentence summary: This joint linkage and genome-wide association study comprehensively investigates natural variation in maize grain vitamin E levels using the 5,000-line U.S. nested association-mapping (NAM) panel. The authors responsible for distribution of materials integral to the findings presented in this article in accordance with the policy described in the Instructions for Authors (www.plantcell.org) are: Michael Gore ([email protected]) and Dean DellaPenna
([email protected]). ABSTRACT Tocopherols, tocotrienols and plastochromanols (collectively termed tocochromanols) are lipid-soluble antioxidants synthesized by all plants. Their dietary intake, primarily from seed oils, provides vitamin E and other health benefits. Tocochromanol biosynthesis has been dissected in the dicot Arabidopsis thaliana, which has green, photosynthetic seeds, but our understanding of tocochromanol accumulation in major crops, whose seeds are non-photosynthetic, remains limited. To understand the genetic control of tocochromanols in grain, we conducted a joint linkage and genome-wide association study in the 5,000-line U.S. maize (Zea mays) nested
Plant Cell Advance Publication. Published on October 2, 2017, doi:10.1105/tpc.17.00475
©2017 American Society of Plant Biologists. All Rights Reserved

! 2!
association-mapping panel. Fifty-two quantitative trait loci (QTL) for individual and total tocochromanols were identified, and of the 14 resolved to individual genes, six encode novel activities affecting tocochromanols in plants. These include two chlorophyll biosynthetic enzymes that explain the majority of tocopherol variation, which was not predicted, given that, like most major cereal crops, maize grain is non-photosynthetic. This comprehensive assessment of natural variation in vitamin E levels in maize establishes the foundation for improving tocochromanol and vitamin E content in seeds of maize and other major cereal crops.
INTRODUCTION 1! Tocochromanols are synthesized by all plant tissues but are most abundant in seeds, 2!where they limit the oxidation of membrane and storage lipids, making them essential for seed 3!viability (Sattler et al., 2004; Mène-Saffrane et al., 2010) and overall plant fitness (Maeda et al., 4!2006; Maeda and DellaPenna, 2007; DellaPenna and Mène-Saffrané, 2011; Inoue et al., 2011). 5!In the human diet, tocochromanols serve as both lipid-soluble antioxidants and the essential 6!nutrient vitamin E (Hussain et al., 2013; Ahsan et al., 2015), with α-tocopherol having the 7!highest vitamin E activity, α-tocotrienol and γ-tocopherol 3- and 6-fold lower activity, 8!respectively, and other tocochromanols being negligible (Kamal-Eldin and Appelqvist, 1996; 9!DellaPenna and Mène-Saffrané, 2011). While plant seed oils are the major source of dietary 10!vitamin E, seeds of most crops predominantly contain tocochromanols with low vitamin E 11!activity (DellaPenna and Mène-Saffrané, 2011). 12!
Tocochromanols are synthesized in plastids using various prenyl-diphosphates derived 13!from the plastidic isopentenyl pyrophosphate (IPP) pathway and homogentisic acid (HGA), an 14!intermediate in aromatic amino acid catabolism (Figure 1). Condensation of HGA with phytyl-15!diphosphate (phytyl-DP), geranylgeranyl-diphosphate (GGDP) or solanesyl-diphosphate 16!(solanesyl-DP) yields committed intermediates that are cyclized and methylated to produce the α, 17!β, γ and δ isoforms of tocopherols and tocotrienols, and plastochromanol-8 (PC-8), respectively. 18!Tocochromanol biosynthesis is fully elucidated in Arabidopsis thaliana and involves 36 19!enzymatic activities (encoded by 53 genes) for the biosynthesis of HGA, prenyl-diphosphates 20!and the core tocochromanol pathway itself [vitamin E (VTE) loci 1 through 6] (DellaPenna and 21!Mène-Saffrané, 2011; Lipka et al., 2013). Genes encoding these enzymatic reactions are 22!considered a priori candidates in the Arabidopsis genome that may influence natural variation 23!for tocochromanol traits. Because these 36 enzymatic reactions are conserved across the plant 24!kingdom (Cheng et al., 2003; Sattler et al., 2004; Karunanandaa et al., 2005; Gilliland et al., 25!

! 3!
2006; Tang et al., 2006; DellaPenna and Mène-Saffrané, 2011; Fritsche et al., 2012; Wang et al., 26!2012) a priori homologs can be readily identified in both monocot and dicot species (e.g., the 27!maize (Zea mays) genome contains 80 such a priori candidates that encode these 36 activities, 28!Supplemental Data Set 1). In addition, like most monocots, maize also encodes homogentisate 29!geranylgeranyl transferase (HGGT), the committed step in tocotrienol biosynthesis (Cahoon et 30!al., 2003). 31!
The cloning of Arabidopsis VTE genes allowed the core tocochromanol pathway to be 32!engineered for improved nutritional content and composition in various plants (Shintani and 33!DellaPenna, 1998; Savidge et al., 2002; Collakova and DellaPenna, 2003; Karunanandaa et al., 34!2005; Kumar et al., 2005; Raclaru et al., 2006; Hunter and Cahoon, 2007; Li et al., 2010; 35!DellaPenna and Mène-Saffrané, 2011; Lu et al., 2013; Zhang et al., 2013). Altering the 36!expression of the pathway methyltransferase genes, vte3 and vte4, has profound impacts on the 37!qualitative profiles of specific tocopherols and tocotrienols in leaves and seed without affecting 38!total tocochromanol levels (Shintani and DellaPenna, 1998; Cheng et al., 2003; Van Eenennaam 39!et al., 2003; Karunanandaa et al., 2005; DellaPenna and Mène-Saffrané, 2011; Lu et al., 2013). 40!Engineering total tocotrienol content has proven relatively straightforward, with hggt1 41!overexpression increasing tocotrienols to levels several times that of tocopherols (Cahoon et al., 42!2003; Kim et al., 2011; Yang et al., 2011; Zhang et al., 2013; Tanaka et al., 2015). In contrast, 43!engineering total tocopherol content is more difficult, and even with coordinate overexpression 44!of multiple pathway steps, the increases achieved were modest (Savidge et al., 2002; Collakova 45!and DellaPenna, 2003; Karunanandaa et al., 2005; Raclaru et al., 2006; Lu et al., 2013). 46!Identification of the tocopherol-deficient Arabidopsis vte5 and vte6 mutants (Valentin et al., 47!2006; Vom Dorp et al., 2015), encoding kinases that sequentially phosphorylate phytol to 48!generate phytyl-DP, suggested a mechanism underlying the divergent engineering results for 49!tocotrienols and tocopherols: while tocotrienol biosynthesis can directly utilize GGDP, 50!tocopherol biosynthesis requires phytol to be produced from GGDP and then phosphorylated. 51!
Recent genome-wide association studies (GWAS) in maize and rice (Oryza sativa) grain 52!(Li et al., 2012; Lipka et al., 2013; Wang et al., 2015) showed strong associations of γ-tocopherol 53!methyltransferase (vte4) with α-tocopherol concentrations and much weaker associations of 54!tocopherol cyclase (vte1), hggt1, and an arogenate/prephenate dehydratase with tocotrienol traits 55!in maize grain (Lipka et al., 2013). The panel sizes and density of single-nucleotide 56!

! 4!
polymorphisms (SNPs) in these studies limited both the identification of controlling loci and 57!gene-level resolution of causal variants. In this study, we leveraged the superior statistical power 58!and mapping resolution of the maize nested association mapping (NAM) panel of ~5,000 59!recombinant inbred lines (RILs) (Yu et al., 2008; McMullen et al., 2009) and the ~29 million 60!sequence variants of maize HapMap v1 and v2 (Gore et al., 2009; Chia et al., 2012) to 61!comprehensively investigate of the quantitative trait loci (QTL) and underlying genes 62!responsible for natural variation in tocochromanol and vitamin E levels in maize grain, one of the 63!most abundantly consumed food staples on the planet. 64!!65!RESULTS 66!Genetic dissection of tocochromanol accumulation in maize grain 67!
We assessed the genetic basis of tocochromanol traits across the 25 RIL families of the 68!U.S. maize NAM population. Physiologically mature grain samples were quantified for seven 69!tocochromanol compounds by HPLC with fluorescence detection, and the data used to calculate 70!best linear unbiased estimators (BLUEs) for the seven compounds, total tocopherols (ΣT), total 71!tocotrienols (ΣT3), and total tocochromanols (ΣTT3) (Table 1, Supplemental Data Set 2a,b). 72!With the exception of PC-8, all traits had high estimates of heritability (0.71 to 0.89; Table 1). 73!Although the seven tocochromanols are synthesized by a shared biosynthetic pathway (Figure 1), 74!only three pairs of compounds had correlations greater than ~0.4 (Supplemental Figure 1). 75!
We mapped QTL across the 25 NAM families by joint-linkage (JL) analysis using a 76!composite genetic map of ~14,000 markers (Ogut et al., 2015). This identified 162 QTL, with 77!eight to 21 QTL per trait (Table 2, Supplemental Data Set 3) and phenotypic variance explained 78!(PVE) of 0.6-48.2% (Supplemental Data Set 4, 5). Given the biosynthetic relationships of 79!tocochromanols (Figure 1), it seemed likely that multiple traits could be affected by individual 80!QTL and indeed, 84% of overlapping QTL support intervals were also significantly pleiotropic 81!(Supplemental Data Set 6, Supplemental Figure 2). When overlapping QTL were merged, their 82!numbers were reduced from 162 to 52 unique QTL intervals, of which 31 affected multiple traits 83!(Supplemental Data Set 4). 84!
To more finely resolve these 52 unique QTL, we conducted a GWAS using the ~29 85!million variants of maize HapMap v1 and v2 imputed onto the ~4900 NAM RILs. A total of 86!1,752 marker-trait associations achieved a resample model inclusion probability (RMIP) value 87!
! 5!
(Valdar et al., 2009) >0.05 (Supplemental Data Set 7). Of these, 34.5% localized to a 88!corresponding trait JL interval (Table 2), with 47 markers having associations with 2-4 traits, for 89!a total of 605 marker-trait associations. Linkage disequilibrium (LD) decays rapidly in the NAM 90!panel, with the majority of HapMap v1 and v2 polymorphisms (Gore et al., 2009; Chia et al., 91!2012) showing average LD decay in genic regions to background levels (r2<0.2) by 1 kb, but 92!with large variance dependent on allele frequencies (Wallace et al., 2014). As our GWAS-93!detected markers showed a similar trend of LD decay (Supplemental Figure 3), we limited our 94!candidate gene search space to ±100 kb of GWAS-detected variants, which is appropriate given 95!the high marker density and reported localization of NAM GWAS signals to within a few 96!kilobases of causal variants (Wallace et al., 2014). 97!
To aid in the identification of genes underlying QTL, we employed a triangulation 98!approach (Ritchie et al., 2015) that tested for correlations between a) genotype of GWAS 99!marker(s), b) log2-transformed RNA-seq expression levels across six developing kernel stages of 100!the NAM parents for all genes in a search space (Supplemental Figure 4, Supplemental Table 1, 101!Supplemental Data Set 8), and c) transformed allelic effect estimates of individual-trait QTL for 102!each family compared to B73, the maize reference genome and recurrent parent of the U.S. 103!maize NAM population. We initially focused on the 23 unique QTL whose intervals contained 104!one or more of the 81 a priori genes (Supplemental Data Set 1) reasoning they provide a high-105!quality set of known targets, which if positively identified in an interval, could guide application 106!of the approach to intervals that lacked a priori candidate genes. Based on the narrow search 107!space defined by LD and GWAS signals in combination with the triangulation data sets, eight a 108!priori genes were determined to underlie a unique QTL (Figure 2, Supplemental Figure 5). These 109!include three genes involved in prenyl group biosynthesis, two in aromatic head group 110!biosynthesis, and three core tocochromanol pathway enzymes (Figure 1, Figure 3). 111!The role of a priori pathway genes 112!
The prenyl diphosphates for tocochromanol biosynthesis are made using five-carbon 113!building blocks from the plastidic IPP pathway (eight activities encoded by 16 genes in maize). 114!Only two IPP pathway genes were found to underlie QTL; both encode 1-deoxy-D-xylulose 5-115!phosphate synthase (DXS), the first and committed step of the pathway. dxs2 affected five traits 116!(2.5-5.7% PVE), and dxs3 was specific for PC-8 (2.6% PVE), but unexpectedly, neither was 117!associated with tocopherol traits. Allelic effect estimates and the expression of dxs2, but not 118!

! 6!
dxs3, were strongly correlated from mid-grain development onward, indicating dxs2 is an 119!expression QTL (eQTL, Figure 2, 3). The maize genome encodes 11 prenyl synthases capable of 120!producing phytyl-DP, GGDP, and solanesyl-DP for the biosynthesis of tocopherols, tocotrienols, 121!and PC-8, respectively, but only one locus, solanesyl-DP synthase (sds), was identified in this 122!study. SDS produces the prenyl tail group for PC-8 and affected PC-8 and two other traits, all 123!with small PVEs. Taken together, these findings indicate that dxs2 and dxs3 function in the 124!primary steps controlling provision of IPP for the biosynthesis of tocotrienol and PC-8 prenyl 125!groups, but surprisingly not for tocopherol prenyl groups.!126!
The aromatic head group for all tocochromanols, HGA, is an intermediate in tyrosine 127!metabolism, and two genes in this pathway were identified as underlying QTL. p-128!Hydroxyphenylpyruvate dioxgenase1 (hppd1) showed association with eight traits, with PVEs 129!for tocotrienol traits (7.9-10.7% for δT3, γT3, and ΣT3) being much higher than those for the 130!corresponding tocopherol traits. Also identified, with smaller PVEs for αT3 and ΣT3 only, was 131!arogenate dehydrogenase2 (arodeH2); the encoded enzyme carries out the oxidative 132!decarboxylation of L-arogenate to L-tyrosine, which in one additional enzymatic step is 133!converted to HPPD, the substrate for hppd1. Thus, these two genes are the key regulated steps 134!for producing the aromatic head group of individual and total tocochromanols that accumulate in 135!mature maize grain. Two other loci of relevance previously found to be weakly associated with 136!tocochromanol traits in a maize inbred association panel (Lipka et al., 2013), vte1 and one of 137!seven prephenate dehydratases (GRMZM2G437912), were not detected in this study. vte1 was 138!present in multiple JL intervals in the same recombination-suppressed pericentromeric region as 139!hppd1, but signals specific to vte1 could not be resolved due to long-range LD. Prephenate 140!dehydratase association signals were extremely weak in the prior study (Lipka et al., 2013), and 141!this gene was not detected in NAM JL-GWAS.!142!
The three remaining a priori genes identified in this study encode the core tocochromanol 143!pathway enzymes, HGGT1, VTE4 and VTE3. HGGT1 is a prenyl transferase that condenses 144!HGA and GGDP for the biosynthesis of all tocotrienols and had large PVEs for tocotrienols and 145!moderate PVEs for tocopherols (Figure 3), a result consistent with its kinetic preference for 146!GGDP over PDP (Yang et al., 2011). hggt1 was a strong eQTL—i.e., expression QTL, meaning 147!that the contribution of this QTL to trait variation is significantly associated with variation in 148!expression of the identified gene—through all developing kernel stages analyzed. This gene is 149!

! 7!
strongly expressed in endosperm, the major site of tocotrienol accumulation, and showed little to 150!no expression in other tissues, as also reported for the genes encoding HGGT in rice and barley 151!(Hordeum vulgare) (Cahoon et al., 2003). Consistent with this expression pattern, 83% of the 152!tocochromanols in endosperm of 30 DAP seed of NAM parents were tocotrienols, while only 153!2.5% were tocotrienols in embryos (Supplemental Data Set 9a, b). Notably, HGGT was found to 154!have the largest PVEs for three traits, approximately 40% for γT3 and ΣT3 and 24% for 155!δΤ3, suggesting that this locus is indeed the key player for tocotrienol traits, with the exception 156!of αT3. VTE4 catalyzes the final step in αT and αT3 biosynthesis and had the largest PVE for 157!these traits at 48.2% and 32.0%, respectively. This gene was an eQTL with particularly strong 158!correlations with αT allelic effects. These effects spanned a range of 11.58 µg/g, suggesting that 159!vte4 is key for increasing vitamin E levels, a finding concordant with the large PVEs and clear 160!GWAS results obtained for vte4 in this and previous studies (Li et al., 2012; Lipka et al., 2013). 161!The final gene, vte3, encodes a methyltransferase at the branchpoint for δ- and γ-tocochromanols 162!and was the largest-effect a priori QTL for δΤ (8.2% PVE), with smaller PVEs for four other 163!traits. 164!
165!Novel large-effect loci control total tocopherol and vitamin E accumulation 166!
These eight identified a priori genes guided the application of our approach for gene-167!level resolution in the remaining 44 QTL, which define novel loci affecting tocochromanol traits 168!in maize grain. Like the identified a priori genes, for a gene to be identified in these 44 QTL 169!intervals, it must meet at least two of three criteria: have at least one significant GWAS variant 170!within ±100 kb of the gene, at least two significant FPKM x JL allelic effect estimate 171!correlations, and a compelling biological function for involvement in tocochromanol 172!biosynthesis/accumulation. Applying these criteria to the 44 remaining QTL resulted in the 173!identification of six genes not known to affect tocochromanol traits in any plant system that fall 174!into three categories: metabolism, metabolite transport/storage, and transcriptional regulation. 175!
Both metabolic genes identified for QTL5 and QTL24 encode homeologs!of 176!protochlorophyllide reductase (POR), a highly regulated step in chlorophyll biosynthesis (Figure 177!4a). Notably, por2 (QTL24) had the highest PVEs in the panel for γΤ, δΤ, ΣT, and ΣTT3 and 178!por1 (QTL5) the second highest PVEs for γΤ and ΣT (Figure 3); together, they account for the 179!largest allelic effects observed (well beyond those of a priori genes) for tocopherol traits (Figure 180!

! 8!
3 and Supplemental Figure 6). The two por loci were the most robust eQTL in this study and had 181!the largest epistatic interactions (Figure 5), contributing 2.2-4.0% additional PVE to the four 182!tocopherol traits. 183!
The strong and specific association of two chlorophyll biosynthetic genes with 184!tocopherols was unexpected for a monocot seed like maize that lacks obvious green coloration 185!during development and is chlorophyll-deficient at physiological maturity (i.e., in dry grain). To 186!assess whether, despite the lack of green coloration in developing grain, chlorophylls might still 187!be present, we dissected embryos and endosperm from the NAM parents at 16, 20, 24, 30 and 36 188!DAP to quantify the levels of tocochromanols and four major classes of chlorophyll metabolites: 189!chlorophylls a and b, chlorophyllides a and b, pheophytins a and b and pheophorbides a and b 190!(Supplemental Data Set 9a, b). Embryo tocochromanols are composed of >90% tocopherols, 191!whose absolute levels reflect the extreme diversity of NAM parents, varying by 10-100 fold at 192!each developmental stage (Supplemental Figure 7). Surprisingly, developing embryos also 193!contain extremely low, but detectable, levels of chlorophylls a and b, chlorophyllide a, and 194!pheophytin a (Figure 4b), while the other four chlorophyll metabolites assessed were below 195!detection in all samples. Though detectable, total chlorophyll metabolite levels are ~500 times 196!lower in embryos than in leaves (Ma et al., 2008), and 100-1,000 fold lower than embryo 197!tocopherols (Figure 4b). The correlation of total tocopherols with chlorophyll a, chlorophyll b, 198!and chlorophyllide a was strong at 16 DAP (r=0.71-0.76); chlorophyll a correlations with total 199!tocopherols peaked at r=0.93 at 20 DAP, and with the exception of 30 DAP remained above 200!r=0.7. Correlations with chlorophyllide a and chlorophyll b with total tocopherols gradually 201!decreased to r=0.48 and r=0.36, respectively, at 30 DAP, after which chlorophyll b correlation 202!increased. Pheophytin a is a key intermediate and metabolite marker for the chlorophyll 203!degradation pathway in senescing leaves (Schelbert et al., 2009; Hörtensteiner and Kräutler, 204!2011; Hortensteiner, 2013), where it provides phytol for senescence-associated tocopherol 205!biosynthesis (Schelbert et al., 2009; Zhang et al., 2014; Vom Dorp et al., 2015), but pheophytin a 206!only showed weak correlations with total tocopherols at 16 and 20 DAP (r=0.23 and 0.31, 207!respectively) and was negatively correlated at later developmental stages. Tocopherol 208!accumulated in endosperm to levels <2% that in embryos, and endosperm chlorophyll metabolite 209!levels were similarly reduced, with only chlorophyll a being consistently above the limits of 210!detection (Supplemental Data Set 9b, Figure 4b). Nonetheless, correlations of chlorophyll a with 211!

! 9!
total tocopherols in endosperm ranged from r=0.50 to 0.74 at three stages of development 212!(Figure 4a). 213!
A second group of novel genes has predicted roles in the transport and storage of 214!lipophilic molecules. The identified gene in QTL10, affecting five traits, is one of 12 genes in 215!maize encoding plastid-localized fibrillins, structural proteins that bind hydrophobic molecules 216!and play various roles in their biosynthesis and accumulation in other systems (Deruère et al., 217!1994; Kim et al., 2015). Fibrillins are prominent components of plastoglobules (Ytterberg et al., 218!2006; Bréhélin et al., 2007), subcompartments of the chloroplast that also contain 219!tocochromanols, carotenoids, lipids and various biosynthetic enzymes including tocopherol 220!cyclase. The genetic association of a fibrillin gene family member with tocochromanol content is 221!thus consistent with prior biochemical knowledge that other members of the fibrillin family bind 222!hydrophobic metabolites (e.g., carotenoids). QTL30 also affected multiple traits, and its 223!identified gene encodes a cytosolic glycol(neutral)lipid transfer protein that could participate in 224!the transport of tocochromanols to oil bodies for storage. Finally, QTL6 only affects αT3, and its 225!underlying gene encodes a type of SNARE protein predicted to be plastid-targeted and whose 226!function is consistent with a role in vesicular transport. Of these three genes, only QTL10 was an 227!eQTL. The final gene identified, in QTL39, was an eQTL that affected αT3 and encodes a 228!predicted transcription factor with plant homeodomain (PHD) zinc finger domains. 229!
230!DISCUSSION 231!This study, a comprehensive assessment of natural variation in vitamin E levels in maize grain, 232!provides important insights into the control of tocochromanol content and composition in a 233!global staple crop, with major implications for human nutrition. In total, 52 unique QTL were 234!identified with PVEs as large as 48.2%. We resolved 14 QTL to the gene level using an approach 235!integrating JL-QTL effect estimates, localization of GWAS signals, and RNA-seq data from six 236!stages of developing kernels for the NAM parental genotypes. Only two of the 14 genes 237!identified in this study had been previously associated with natural variation for tocochromanols 238!in maize grain (Li et al., 2012; Lipka et al., 2013). These 14 genes included seven of the nine 239!intervals with largest PVEs (Figure 3, Supplemental Table 2) and in an additive model explained 240!56-93% of phenotypic variation attributed to QTL for the traits analyzed in this study 241!(Supplemental Figure 8). This degree of gene-level resolution of JL-GWAS signals was much 242!

! 10!
greater than in earlier NAM studies (Buckler et al., 2009; Brown et al., 2011; Kump et al., 2011; 243!Poland et al., 2011; Tian et al., 2011; Cook et al., 2012; Peiffer et al., 2014; Wallace et al., 2014; 244!Yan et al., 2015; Zhang et al., 2015) due to three main factors: clear molecular evidence of 245!functional involvement through the incorporation of RNA-seq data, increased marker density 246!provided by the additional 27.4 million HapMap v2 variants, and the tractable genetic 247!architecture of tocochromanol traits (oligogenic and highly heritable). Eight of the 14 identified 248!genes were on a list of 81 a priori maize candidate genes generated based on prior elucidation of 249!precursor and core tocochromanol pathways, primarily in Arabidopsis, while the remaining six 250!encode functions not previously demonstrated to affect tocochromanols in any plant species 251!despite over two decades of molecular genetic studies (Shintani and DellaPenna, 1998; Savidge 252!et al., 2002; Cahoon et al., 2003; Cheng et al., 2003; Sattler et al., 2004; Valentin et al., 2006; 253!DellaPenna and Mène-Saffrané, 2011). With the exception of HGGT, which is only present in 254!the monocot lineage, and the plant homeodomain (PHD) transcription factor, all other genes 255!identified in this study have clear homologs in major monocot and dicot crop species, providing 256!clear targets to assess in other crops for potential association with desired tocochromanol traits. 257!
In most cases, the eight a priori genes affected tocochromanol traits in ways consistent 258!with the known biochemical activities of their encoded enzymes (Shintani and DellaPenna, 1998; 259!Cahoon et al., 2003; Cheng et al., 2003; Collakova and DellaPenna, 2003; Van Eenennaam et al., 260!2003; Karunanandaa et al., 2005; Kumar et al., 2005; Tang et al., 2006; Hunter and Cahoon, 261!2007; DellaPenna and Mène-Saffrané, 2011). For example, the two pathway methyltransferases, 262!vte3 and vte4 (Shintani and DellaPenna, 1998; Cheng et al., 2003; Van Eenennaam et al., 2003), 263!were key for determining the degree of methylation, and hence the types of tocochromanols 264!accumulated (i.e., α, γ or δ), but had no impact on total tocochromanol levels. Similarly, the 265!aromatic head group for all tocochromanols, HGA, is produced by hppd1 (Norris et al., 1998; 266!Rippert et al., 2004; DellaPenna and Mène-Saffrané, 2011), which affected nearly every 267!tocochromanol trait, though with larger contributions for tocotrienols. As a group, the eight a 268!priori genes also highlight major differences in the genetic control of tocopherol vs. tocotrienol 269!traits in maize grain, particularly in the generation and coupling of their prenyl tail groups to 270!HGA. A single gene for the first and regulated step of the plastidic IPP pathway, dxs2, was 271!strongly and specifically associated with tocotrienol traits, but neither it nor any other IPP 272!pathway gene was associated with tocopherol traits. HGGT, the committed enzyme for 273!

! 11!
tocotrienol biosynthesis, showed extremely strong tocotrienol associations and limited 274!associations with tocopherol traits, a result consistent with its overexpression conferring high 275!levels of tocotrienol production in numerous plant tissues and systems (Cahoon et al., 2003; 276!DellaPenna and Mène-Saffrané, 2011; Zhang et al., 2013; Tanaka et al., 2015) and with the 277!enzyme preferentially condensing HGA with GGDP (Yang et al., 2011). In contrast, the 278!corresponding enzyme that condenses HGA with phytyl-DP for tocopherol biosynthesis, 279!homogentisate phytyltransferase (HPT), lacked association with tocopherol traits. This was 280!unexpected as like hggt overexpression, hpt overexpression increases total tocopherol content in 281!a number of dicot plant systems and tissues (Savidge et al., 2002; Collakova and DellaPenna, 282!2003; Karunanandaa et al., 2005; Lu et al., 2013). While the genetic control of total tocotrienol 283!content in maize grain is relatively simple, with three, large-effect a priori genes (dxs2, hppd1, 284!and hggt1) collectively accounting for 81% of trait variation, a priori genes account for only 8% 285!of variation in total tocopherol content. Instead, the trait is controlled primarily by novel loci 286!(Supplemental Figure 8), indicating that in maize grain and likely other monocot seed, a 287!fundamentally different process regulates biosynthetic flux to total tocopherols. 288!
Key insight into the regulation of tocopherol biosynthesis in maize grain comes from our 289!finding that two major determinants of tocopherol natural variation in maize grain are homeologs 290!encoding protochlorophyllide reductase (POR), a key reaction in chlorophyll biosynthesis. The 291!two identified por genes accounted for 46% of total tocopherol variation attributed to QTL in an 292!additive model (Supplemental Figure 8), the largest PVEs for δT, γT and ΣT and a substantial 293!pairwise epistatic effect that is roughly one-third the dynamic range of their additive effects. The 294!key role of protochlorophyllide reductases in tocopherol biosynthesis in maize grain was 295!especially surprising given that this tissue, like most monocot seed, is non-photosynthetic and 296!lacks any obvious green coloration. 297!
Our identification of two chlorophyll biosynthetic genes (por homeologs) as major 298!determinants of tocopherol content in maize grain and supporting metabolite and expression data 299!in developing embryo are consistent with chlorophyll degradation playing a minor role at best in 300!tocopherol biosynthesis in non-photosynthetic tissues like maize grain. First, of the four 301!chlorophyll metabolites detectable in developing embryos, pheophytin a, a committed 302!intermediate and metabolic marker for chlorophyll degradation, had the lowest correlation with 303!total tocopherol levels (Figure 4a), opposite of what would be expected if chlorophyll 304!

! 12!
degradation provided the majority of phytol for tocopherol biosynthesis. Instead, chlorophylls a 305!and b and chlorophyllide a, late-stage intermediates in chlorophyll biosynthesis, were strongly 306!and positively correlated with total tocopherol levels throughout embryo development. 307!Additionally, in developing maize embryos (i.e., 30 DAP), the chlorophyll:tocopherol molar 308!ratio is ~1:800, and as only a single molecule of phytol is released for each chlorophyll degraded, 309!degradation would only provide a trace of the phytol needed for tocopherol biosynthesis, unless 310!massive flux to degradation occurs. While we cannot eliminate this possibility, it seems unlikely, 311!as expression of chlorophyll biosynthetic enzymes prior to POR is extremely low (e.g., 0.1-1% 312!that in leaves, Supplemental Data Set 10) and consistent with the low levels of chlorophyll 313!metabolites in developing embryos (~0.3% of leaf levels (Ma et al., 2008)). In contrast, the two 314!enzymes downstream of POR, chlorophyll synthase (which esterifies GGDP to chlorophyllides a 315!and b) and geranylgeranyl reductase (which reduces the geranylgeranylated intermediates to 316!chlorophylls a and b) are the most highly expressed steps of the pathway in embryos (e.g., 9-317!18% that in leaves, Supplemental Data Set 10). This suggests that their reactions are strongly 318!favored, which is consistent with chlorophyll a levels being 10-100 fold higher than those of 319!other chlorophyll metabolites. Taken together, these findings suggest that aspects of chlorophyll 320!biosynthesis, likely a cycle involving repeated removal of phytol from chlorophyll a followed by 321!efficient re-esterification of the resulting chlorophyllides with GGDP and reduction of the 322!geranylgeranylated intermediates to (“phytyl”)-chlorophylls, generates the large amounts of 323!phytol needed for tocopherol biosynthesis in maize embryos (Figure 4c). 324!
Unlike maize grain, developing Arabidopsis seed are green, photosynthetic and contain 325!high levels of tocopherol at a 2-4 fold molar excess to chlorophylls47 while in unstressed leaves, 326!tocopherol levels are much lower and chlorophyll is often at 20-50 fold molar excess to 327!tocopherols22. As each mole of chlorophyll contains one mole of esterified phytol, bulk 328!chlorophyll degradation has long been proposed as the source of phytol for tocopherol 329!biosynthesis in such green, photosynthetic tissues (Rise et al., 1989; Chrost et al., 1999; Valentin 330!et al., 2006). The chlorophyll degradation pathway has recently been elucidated in Arabidopsis 331!(Schelbert et al., 2009; Hörtensteiner and Kräutler, 2011; Hortensteiner, 2013) (Figure 4c), and 332!the phytol released from pheophytin a by pheophytinase could be esterified to fatty acids to yield 333!fatty acid phytyl esters (FAPEs) or phosphorylated by VTE5 and VTE6 to yield phytyl-DP 334!(Valentin et al., 2006; Tanaka et al., 2010; DellaPenna and Mène-Saffrané, 2011; Lippold et al., 335!

! 13!
2012; Zhang et al., 2014; Vom Dorp et al., 2015) (Figure 4c). This latter route clearly provides 336!phytyl-DP for the large amounts of tocopherol synthesized by senescing Arabidopsis leaves, as 337!mutation of the pheophytinase gene eliminates both chlorophyll degradation and the senescence-338!associated increases in tocopherol and FAPE levels (Schelbert et al., 2009; Zhang et al., 2014; 339!Vom Dorp et al., 2015). If flux through this chlorophyll degradation pathway provided the 340!majority of phytol for tocopherol biosynthesis in other tissues and leaf development stages, one 341!would expect a similarly severe impact on tocopherol levels in these tissues. However, in non-342!senescing leaves and mature seed, tocopherol content in the pheophytinase mutant was 343!unchanged (Zhang et al., 2014). Chlorophyllases can also remove phytol from chlorophyll a and 344!have been proposed as an alternate route for generating phytol, but mutations disrupting the two 345!Arabidopsis chlorophyllases, singly or in combination with the pheophytinase mutant, again had 346!no effect on seed tocopherol levels (Zhang et al., 2014). These combined data indicate that 347!though phytol is released by chlorophyll degradation late in Arabidopsis seed maturation, this 348!phytol contributes little to tocopherol biosynthesis in developing seed, and instead phytol for 349!tocopherol biosynthesis in seed and non-senescing leaves of Arabidopsis is provided from 350!another source. Tocopherol biosynthesis from this alternative source of phytol is still dependent 351!on VTE5 (phytol kinase activity), as in vte5 mutants, tocopherol levels are reduced by 80% and 352!leaf tocopherol contents by 65% (Valentin et al., 2006). We suggest that like maize grain, 353!Arabidopsis operates a chlorophyll-based cycle for generating phytol for tocopherol biosynthesis 354!in most tissues and developmental stages that is separate from the bulk chlorophyll pool. !355!
In addition to the por loci, the other novel genes identified in this study provide important 356!insights into the accumulation of tocochromanols in plants, but especially for tocopherols, which 357!have higher vitamin E activities than tocotrienols (Kamal-Eldin and Appelqvist, 1996; 358!DellaPenna and Mène-Saffrané, 2011). For example, we identified proteins with transport and 359!storage functions that are associated with tocochromanols at the genetic level. Three of the novel 360!loci encode such functions, including two, a fibrillin and a lipid transfer protein, affecting 361!multiple tocopherol and tocotrienol traits. Fibrillins are encoded by moderate-sized gene 362!families, with individual members having diverse functions ranging from storage of xanthophylls 363!in fruit and flower chromoplasts to interaction with enzymes involved in plastoquinone 364!biosynthesis (Deruère et al., 1994; Singh and McNellis, 2011; Kim et al., 2015). Tocopherols 365!were reported as minor constituents of fibrillins isolated from red bell pepper (Capsicum 366!

! 14!
annuum) fruit (Deruère et al., 1994), and several members localize to plastoglobuli along with 367!various lipid-soluble compounds and enzymes, including tocopherol cyclase (Ytterberg et al., 368!2006; Bréhélin et al., 2007). The association of multiple tocochromanol traits with a single 369!member of the maize fibrillin family (GRMZM2G031028) suggests that the encoded protein 370!specializes in tocochromanol storage in grain. Finally, lipid transfer proteins (LTPs) are encoded 371!by large gene families in plants and have likewise been implicated in the movement of various 372!lipophilic compounds between membranes. Here, we show that GRMZM2G060870 is an LTP 373!implicated in the transport of tocochromanols. Overexpression and knockout studies of a priori 374!genes in other systems have yielded important insight into their roles in tocochromanol 375!biosynthesis (DellaPenna and Mène-Saffrané, 2011). Analogous experiments with the six novel 376!genes identified in this study would provide additional insights into their roles and functions.!377!
Allelic variation at the 14 genes identified in this study, responsible for 56-93% of 378!phenotypic variation attributed to QTL for tocochromanols in maize grain, establishes a near-379!complete foundation for the genetic improvement of vitamin E and non-vitamin E 380!tocochromanol levels in this major food crop and likely in seed of the other major cereals, which 381!are also non-green, non-photosynthetic tissues that synthesize tocochromanols. That a moderate 382!number of genes exerts large control over headgroup and tail biosynthesis and the core 383!tocochromanol pathway itself holds great promise for both breeding and engineering of 384!tocochromanols in staple crops. Because tocopherols and tocotrienols are largely under 385!independent genetic control by seven major-effect loci, genomics-assisted breeding approaches 386!can target total tocotrienols (hggt1, hppd1, and dxs2), total tocopherols (two por homeologs), or 387!vitamin E content (vte3 and vte4), separately or in combinatorial fashion. It remains an open 388!question whether the levels of other vitamins and essential nutrients in major crop species are 389!under similarly tractable control. If true, this would greatly accelerate global efforts to 390!simultaneously enhance and balance the levels of multiple essential micronutrients in staple 391!crops to benefit human health. 392!
!393!METHODS 394!Field environments and plant materials for genetic mapping 395!The genetic and genomic approaches used to design and construct the maize (Zea mays) nested 396!association mapping (NAM) population have been previously described (Yu et al., 2008; Buckler 397!

! 15!
et al., 2009; McMullen et al., 2009). In brief, 25 families of 200 recombinant inbred lines (RILs) 398!per family were generated by crossing maize inbred line B73 in a reference design to 25 other 399!diverse inbred lines. These 25 NAM families, the intermated B73 × Mo17 (IBM) family (Lee et 400!al., 2002), and an association mapping panel of 281 diverse inbred lines (Flint-Garcia et al., 401!2005) were evaluated at the Purdue University Agronomy Center for Research and Education in 402!West Lafayette, IN, under standard agronomic practices in the summers of 2009 and 2010. The 403!experimental field design has been previously described (Chandler et al., 2013). In brief, a sets 404!design was used in each of the two environments, with each set including all lines of a family or 405!the association panel. Each family set was arranged in a 10 × 20 incomplete block α-lattice 406!design, and each incomplete block was augmented by the addition of both parental lines as 407!checks. The association panel had a 14 × 20 incomplete block α-lattice design, with each 408!incomplete block augmented by the inclusion of maize inbred lines B73 and Mo17 as checks. A 409!single replicate of the entire experiment of 5,481 lines from the NAM and IBM families as well 410!as the 281-member association panel plus repeated check lines was grown in each environment. 411!An experimental unit consisted of a single line planted in a one-row plot that was 3.05 m in 412!length, with an average of 10 plants per plot. In both environments, a minimum of four plants 413!within a plot was self-pollinated by hand. Self-pollinated ears were harvested at physiological 414!maturity and dried to a grain moisture content of ~15%. Afterwards, the ears of each plot were 415!shelled and bulked to generate a representative, composite grain sample for quantifying 416!tocochromanol levels. 417! 418!Phenotypic data analysis 419!Tocochromanols were extracted from approximately 50 ground kernels for each plot and 420!quantified by high-performance liquid chromatography (HPLC) and fluorometry as previously 421!described (Lipka et al., 2013). We assessed three types of tocochromanols based on HPLC data 422!passing internal quality control measures that were collected on 10,306 grain samples from 4,862 423!NAM and 198 IBM RILs, as well as the repeated parental check lines. The 10 evaluated 424!tocopherol, tocotrienol, and plastochromanol phenotypes were as follows: α-tocopherol (αT), δ-425!tocopherol (δT), γ-tocopherol (γT), α-tocotrienol (αT3), δ-tocotrienol (δT3), γ-tocotrienol (γT3), 426!total tocopherols (αT + δT + γT), total tocotrienols (αT3 + δT3 + γT3), total tocochromanols 427!(total tocopherols + total tocotrienols), and plastochromanol-8 (PC-8) in µg·g−1 seed. When the 428!
! 16!
level of a tocochromanol compound for a grain sample was below the minimum detection limit 429!of HPLC, a µg·g−1 value was approximated for the sample by assigning a uniform random 430!variable ranging from 0 to the minimum HPLC detection value for that given compound within a 431!family for each environment. The IBM RILs were not included in the joint-linkage analysis and 432!genome-wide association study (GWAS) of the 10 tocochromanol traits, as they were produced 433!through intermating and thus exhibit a differential recombination rate relative to NAM RILs. 434!However, the IBM family was still included in the following mixed linear model analysis along 435!with the 25 NAM families to provide additional information on genotype-by-environment 436!variation and within-environment spatial variation. 437!
To screen the 10 traits for phenotypic outliers, we initially performed mixed linear model 438!selection with custom Java code invoking ASReml-W version 3.0 (Gilmour et al., 2009) for each 439!trait that followed the same steps of the two-stage model fitting process previously described 440!(Peiffer et al., 2014). In brief, in the first stage, mixed linear models separately fit for each of the 441!two environments included a fixed effect for the grand mean and random effects including the 442!genotypic effects of family and RIL within family, a laboratory effect for HPLC auto-sampler 443!plate, and spatial effects for field, set within field, and block within set within field. Genetic, 444!HPLC plate, and spatial effects were not confounded because the repeated parental check lines 445!were considered to be from the association panel. Thus, the experimental design allowed for the 446!estimation of genetic effects separate from the laboratory and spatial effects. A first-order 447!autoregressive (AR1 × AR1) correlation structure was also fitted to account for spatial variation 448!in the direction of rows and columns among plots within each environment. For each 449!environment, a backward elimination procedure based on the likelihood ratio test (Littell et al., 450!2006) was conducted to remove non-genetic random effects and AR1 × AR1 error structures 451!from the model that were not significant (α = 0.05). 452!
In the second stage, a single mixed linear model across both environments was fitted that 453!included and nested the significant laboratory and spatial effects from the individual first stage 454!models. Additional random effects entering the multi-environment model included environment, 455!the interaction between family and environment, and the interaction between RIL within family 456!and environment. Additionally, the significant AR1 × AR1 error structures within each 457!environment were included in the model. From the final fitted model for each trait, influential 458!phenotypic outliers were detected using the DFFITS criterion (Neter et al., 1996; Belsley et al., 459!

! 17!
2005), and observations were deleted if they exceeded a conservative DFFITS threshold 460!
previously suggested for this experimental design of 2!!!2!! !!! where p� is model degrees of 461!
freedom (df) + 1 and n the sample size (Hung et al., 2012) (Supplemental Data Set 2 and 11a, 462!Supplemental File 1). 463!
Once influential outliers were removed, the two-stage model fitting process was 464!conducted again with minor modifications to estimate a best linear unbiased estimator (BLUE) 465!for each RIL across environments. In this implementation, the genotypic effects of family and 466!RIL within family were fitted as fixed effects. Additionally, unique error variances were not 467!separately modeled for each environment when fitting the interaction between family and 468!environment and between RIL within family and environment. To obtain variance component 469!estimates, all terms except for the grand mean were then fitted as random effects. These variance 470!components were used to estimate heritability on a line-mean basis ( ) across only the 25 471!NAM families (Hung et al., 2012), and the standard errors of these estimates were approximated 472!using the delta method (Holland et al., 2003). 473!
Prior to conducting joint-linkage mapping of QTL in the NAM population, the BLUEs of 474!each trait were screened to detect any remaining statistical outliers using PROC MIXED in SAS 475!version 9.3 (SAS Institute 2012). Specifically, the Studentized deleted residuals (Kutner et al., 476!2004) were examined, which were obtained from a parsimonious linear model fitted with fixed 477!effects for the grand mean and a single randomly sampled, representative single-nucleotide 478!polymorphism (SNP) marker (PZA02014.3) from the NAM genetic linkage map of 1,106 SNP 479!markers (McMullen et al., 2009). For each trait, a BLUE of each RIL was considered an outlier 480!and removed if it generated a Studentized deleted residual, with n – p – 1 df, that had an absolute 481!value greater than the Bonferroni critical value of t(1 – α/2n; n – p – 1), where t denotes the t-482!distribution, α the significance level of 0.05, n the sample size of 5,460 RILs, and p the number 483!of predictor variables (Supplemental Data Set 2 and 11b, Supplemental Figure 9 and 484!Supplemental File 2). Finally, for the trait dT3, a single RIL was removed that was seen to exert 485!unduly high leverage within the trait JL model, particularly upon the inclusion of interaction 486!terms in epistasis analyses. The observed inflation of allelic effect estimates and PVEs was most 487!severe for a JL peak marker with low alternate allele frequency, as has been previously observed 488!(Rao and Province, 2016). 489!
2l̂h

! 18!
Next, for each trait, the Box-Cox power transformation (Box and Cox, 1964) was 490!performed on BLUEs with the aforementioned parsimonious model to identify the most 491!appropriate transformation that corrected for unequal variances and non-normality of error terms. 492!This process was conducted using PROC TRANSREG in SAS version 9.3 (SAS Institute 2012), 493!and tested lambda values ranging from -2 to +2 in increments of 0.05 before applying the 494!optimal lambda for each trait. Of the 10 traits, six had a variable number of RILs (range: 3 to 495!258) with a BLUE of negative value. Negative values were a product of the shift in location 496!(mean) and scale (standard deviation) of the metabolite trait distributions that takes place in the 497!generation of BLUEs (Burkschat, 2009). A constant of the lowest possible integer needed to 498!make all values positive—a requirement of the Box-Cox power transformation—was added to 499!the BLUEs for a given trait before conducting the transformation procedure. The constants and 500!Box-Cox lambda values applied for each trait are provided in Supplemental Table 3. 501! 502!Joint linkage analysis 503!A consensus genetic linkage map comprising 14,772 markers and derived across the 25 NAM 504!families was used for joint linkage (JL) analysis. The map was constructed by scoring 4,892 505!available NAM RILs with a genotyping-by-sequencing (GBS) protocol (Elshire et al., 2011; 506!Glaubitz et al., 2014) and imputing SNP markers at evenly spaced 0.1 cM intervals following a 507!previously described procedure (Ogut et al., 2015). Using this consensus map, a previously 508!described JL analysis procedure (Buckler et al., 2009) was conducted across the 25 families of 509!the NAM population to identify and define positions of QTL controlling phenotypic variability 510!of the 10 tocochromanol traits. In brief, a joint stepwise regression procedure was implemented 511!using modified source code in TASSEL version 3.0 (provided on Github), in which transformed 512!tocochromanol trait BLUEs were the response variable, the family main effect forced into the 513!model first was an explanatory variable, and each of the 14,772 possible marker effects nested 514!within family terms considered for inclusion into the final model were explanatory variables. The 515!model entry or exit selection criterion of marker-by-family effects was based on a permutation 516!procedure, where the transformed BLUEs of each tocochromanol trait were permuted 1000 times 517!and the entry P-value thresholds (from a partial F-test) were chosen to control the Type I error 518!rate at α = 0.05. These thresholds are listed in Supplemental Table 3. To prevent the 519!

! 19!
simultaneous entry and exit of an effect in the same step, exit thresholds were set equal to twice 520!the value of entry thresholds. 521!
Given that strong linkage between these high-density genetic markers could introduce 522!extensive collinearity among marker genotypes, we developed an additional model fitting 523!approach to correct for multicollinearity and more precisely determine QTL locations and effect 524!estimates thereafter. For the three tocotrienol compounds, their sum, and total tocochromanols, at 525!least one pair of peak JL markers (i.e., the markers in the optimal model determined from 526!stepwise model selection) exhibited an absolute Pearson correlation coefficient (r) greater than 527!0.8 in their SNP genotype states, calculated using the “pearson” method within the ‘cor’ base 528!function in R. In these cases, the marker with smaller sum of squares within each pair in the 529!corresponding JL model was removed. For each of the remaining peak markers in the JL model 530!for that trait, a re-scan procedure was then implemented to test if any closely adjacent markers 531!were more significantly associated with the trait than the peak marker identified in stepwise 532!model selection. Specifically, if a marker on either side was showing, after the multicollinearity 533!correction, a larger sum of squares than the original peak marker, that adjacent marker would 534!replace the original peak marker in the model. This process was repeated until the peak marker 535!under consideration showed the highest sum of squares compared to both of its neighbors, 536!representing a local maximum. All final peak JL markers following re-scan, along with the 537!family term, were then re-fitted to obtain a final JL model for each trait. Allelic effect estimates 538!of these QTL within each family were generated by fitting final trait models using the ‘lm’ 539!function within the lme4 package in R, which also tests the significance of each effect within a 540!family term in two-sided independent t-tests. The Benjamini-Hochberg procedure (Benjamini 541!and Hochberg, 1995) was used to control the false discovery rate (FDR) at 0.05 when identifying 542!potentially significant QTL effects. 543!
For each joint QTL in the final models for all traits, a support interval (using P-value 544!threshold of 0.01) was calculated as previously described (Tian et al., 2011). Logarithm of the 545!odds (LOD) scores were calculated using the ‘logLik’ base function in R. The phenotypic 546!variance explained (PVE) by each joint QTL was calculated using previous methods (Li et al., 547!2011), with some modifications. This modified method accounted for within-family variation of 548!allele frequencies by taking a weighted average of an allelic effect of a marker based on its allele 549!frequency within each family and the population size of that family. Solely to assess the true 550!

! 20!
magnitude and direction of QTL allelic effects both within and across NAM families, allelic 551!effect estimates were also generated using untransformed BLUEs, re-fitting the family term and 552!final JL markers derived from the transformed BLUE model without further model selection or 553!re-scan. 554! 555!Genome-wide association study 556!For each chromosome and each trait, residuals for conducting a GWAS were obtained from the 557!final full JL models with the family term and any joint QTL from that chromosome removed. 558!The genotypic data set used to perform the GWAS in the NAM population consisted of 28.9 559!million variants (SNPs and short indels of 15 or fewer bp in length) contained in HapMap 560!versions 1 and 2, as well as ~0.8 million copy number variants, as previously described (Wallace 561!et al., 2014). To conduct a GWAS for each trait, these 29.7 million segregating variants were 562!projected onto the NAM RILs based on their genotypic data and the dense 0.1 cM resolution 563!linkage map. Using these projected variants, a forward selection regression procedure was 564!repeated 100 times for each chromosome. This procedure sub-sampled 80% of the RILs from 565!each family without replacement; this procedure was run separately on chromosome-specific 566!residuals using the NAM-GWAS plugin in TASSEL version 4.1.32 (Bradbury et al., 2007) as 567!previously described (Wallace et al., 2014). For each trait, the significance threshold for the entry 568!of a marker in the model was empirically determined using a permutation procedure run 1000 569!times on chromosome-specific residuals. The results of permutations were then averaged across 570!chromosomes (Wallace et al., 2014) to control the genome-wide Type I error rate at (α = 0.05). 571!The entry thresholds determined from permutations and used in GWAS are provided in 572!Supplemental Table 3. For each trait and marker, the resample model inclusion probability 573!(RMIP) value, defined as the proportion of 100 subsamples in which a tested marker was 574!included in the final, forward selection-derived regression model, was calculated. Only markers 575!having an RMIP value of 0.05 or greater were further examined in triangulation analyses. 576! 577!Growth environments and plant materials for RNA sequencing 578!A total of three biological replications of the NAM founders were planted on May 10 (rep 1), 579!May 20 (rep 2) and June 1 (rep 3), 2011, at Purdue University’s Agronomy Center for Research 580!and Education (ACRE) in West Lafayette, IN, with approximately 15 plants per plot. All plants 581!

! 21!
in each plot were self-pollinated, and pollination dates were recorded. A single ear from a given 582!plot was harvested at (each of) 12, 16, 20, 24, 30 and 36 days after pollination. Immediately after 583!harvest, whole ears were frozen in liquid nitrogen. The ears were stored at -80 °C until kernels 584!could be removed from the still-frozen ears, placed in test tubes, and maintained at -80 °C. 585!Kernels from each sample were packed in dry ice and shipped to Michigan State University, 586!from which 30 kernels were randomly sampled and bulked across replicates. For the majority of 587!samples, three biological replicates were available, and 10 seeds were taken from each. In a 588!small number of instances, two or only one replicate was available; in these cases, 15 and 30 589!seeds were taken from the replicates, respectively. 590!
For root and shoot tissues, seed from the NAM founders were surface-sterilized and 591!germinated on wet filter paper for 4 to 5 days under grow lamps at room temperature. Next, three 592!germinated seedlings were transplanted to 18.93 L containers with SureMix potting mix 593!(Michigan Grower Products, Inc., Galesburg, MI) and fertilized with 1 X Hoagland’s solution. 594!Plants were grown in the greenhouse under long-day conditions for 14 days at 30-33 °C at which 595!time the plants were removed from pots and rinsed with water to remove the soil. Roots and 596!shoots were harvested separately, immediately frozen in liquid nitrogen, and stored at -80 °C 597!until RNA extraction. Equal weights of shoots or roots from the three individual plants were 598!combined into a single sample for RNA isolation. 599! 600!RNA sequencing and sample quality assessment 601!Frozen samples were ground to a fine powder in liquid nitrogen. Total RNA from 100 mg of 602!frozen kernel, shoot and root tissues was isolated using the hot borate protocol (Wan and 603!Wilkins, 1994) except that a Qiagen shredder column (Qiagen, Germantown, MD) was used to 604!filter the lysate prior to the LiCl precipitation step. To assess the quality and concentration of 605!RNA, samples were analyzed using a NanoDrop (Thermo Fisher Scientific, Waltham, MA) and 606!Bioanalyzer 2100 (Agilent Technologies, Santa Clara, CA). mRNA-Seq libraries were 607!constructed from total RNA using the Illumina RNASeq kit (Illumina, San Diego, CA) following 608!the manufacturer’s instructions. Sequencing was performed on the Illumina GAIIx and 609!HiSeq2000 instruments at the Michigan State University Research Technology Support Facility. 610!Reads (50 to 55 nucleotides; 11-140 M reads per sample) were generated and their quality 611!evaluated using FastQC (http://www.bioinformatics.babraham.ac.uk/projects/fastqc/). A small 612!

! 22!
number of libraries were sequenced in paired-end mode, but all downstream analyses treated 613!reads as single-end. 614! 615!Identification of SNPs in RNA-seq data 616!For SNP detection, RNA-seq reads were cleaned for quality using Cutadapt (v 1.4.1) (Martin, 617!2011). Specifically, Illumina adapter and primer sequences were removed (using the –b option), 618!as well as bases at the 3′ end that had a quality score less than 20 and reads that were fewer than 619!30 bases in length after cleaning. RNA-seq reads were then aligned to the maize B73 reference 620!genome (AGPv2; http://ftp.maizesequence.org/) using TopHat (v1.4.1) (Langmead et al., 2009) 621!and SAMTools (v0.1.12a) (Li et al., 2009). TopHat was run with a minimum and maximum 622!intron size of five and 60,000 bp, respectively. Indel detection was disabled, and only unique 623!alignments were reported using the -g option; all other options were set to default. BAMTools (v 624!1.0.2) (Barnett et al., 2011) was used to calculate mapping result statistics. The BAM file for 625!each sample was sorted by leftmost coordinates using the SAMTools sort function (v 0.1.12a) 626!(Li et al., 2009). This file was then indexed using SAMTools index, and a pileup file generated 627!using SAMTools pileup with options –Bcf. An unfiltered matrix file was made and filtered to 628!detect SNPs. SNPs were filtered according to the following requirements: 1) five reads per 629!individual; 2) for an allele to be called within an individual, it had to be in 20% or more of the 630!reads with at least two reads supporting it; 3) be homozygous (monoallelic) in each individual; 4) 631!support by two individuals for an allele to exist; and 5) the position had to be polymorphic (at 632!least two alleles) (Hirsch et al., 2014). The identified SNPs, i.e. those passing all of these filters, 633!were analyzed and clustered by genotype to identify any mis-labeled samples. In addition, 634!genetic distances between all samples were calculated as previously described and clustered with 635!seedling transcriptome-derived SNPs identified in the WiDiv 1.0 panel (Hirsch et al., 2014) to 636!further confirm genotype authenticity. All samples passing these quality control steps for an 637!individual genotype were then merged using the SAMTools merge function, and the pipeline 638!repeated from the sort and index step. A total of 175 samples representing 21 root, 21 shoot, and 639!133 kernel samples (12, 16, 20, 24, 30, and 36 DAP) from 24 of the 26 NAM parents passed 640!quality assessments and were used for SNP detection, and 172 of these were used for 641!triangulation analyses (Supplemental Table 1, Supplemental Data Set 8). 642! 643!

! 23!
Gene expression analysis 644!RNA-seq reads were aligned to the maize B73 reference genome (AGPv2; 645!http://ftp.maizesequence.org/) using TopHat (v 1.4.1) (Langmead et al., 2009) and SAMTools (v 646!0.1.12a) (Li et al., 2009); expression abundances were estimated using Cufflinks (v 1.3.0) 647!(Trapnell et al., 2010) using the RefGen_v2 5b Filtered Gene Set (FGS) 648!(http://ftp.maizesequence.org/release-5b/filtered-set/). When running TopHat, the minimum and 649!maximum intron length was set to five and 60,000 bp, respectively, and the same maximum 650!intron length was used for running Cufflinks. The –G and –b options were used when running 651!Cufflinks; all other parameters were left at default. Boundaries of gene models in the AGPv2 652!annotation were corrected for GRMZM2G012966 (lycopene epsilon cyclase) and 653!GRMZM2G084942 (arogenate dehydrogenase), both which were incorrectly fused with a 654!flanking gene. GRMZM2G012966 (lycopene epsilon cyclase) was split, resulting in a new locus 655!labeled as GRMZM6G010010 (kinase-domain containing protein). GRMZM2G084942 656!(arogenate dehydrogenase) was split, resulting in a new locus labeled as GRMZM6G010020 657!(CBF1 interacting corepressor) and the FPKM values recalculated just for these modified loci. 658!Expression data were reported in fragments per kilobase exon model per million fragments 659!mapped (FPKM) values. A Pearson correlation coefficient (r) was calculated for all pairwise 660!comparisons of all samples using FPKM data. Raw FPKM data were input into R (version 3.1.0) 661!and transformed into a data matrix. Correlations for all observations were calculated using the 662!“pearson” method of the ‘cor’ base function in R. The calculated correlation coefficients were 663!then visualized for all pairwise comparisons using the ‘heatmap.2’ function within the gplots 664!package in R (Supplemental Figure 4). 665! 666!FPKM filtering 667!FPKM reads were annotated by gene not transcripts, mapping to a total of 39,455 loci. The 5b 668!FGS gene set was filtered such that at least one of the kernel developmental samples in at least 669!one sampled founder line had an FPKM greater than 1.0; a total of 27,187 genes remained upon 670!filtering with this criterion. Expression data for genes passing the specified threshold were 671!transformed according to log2(FPKM + 1), where the constant of 1 was added to allow the 672!transformation of ‘0’ values. These log2-transformed values are herein specified as “gene 673!expression.” Within the filtered and transformed transcriptomic data set, early kernel samples 674!

! 24!
correlated more closely in expression abundances with root and shoot samples than with mid- to 675!late-kernel samples (Supplemental Figure 4). The number of aligned 50 or 55-bp reads per 676!sample, both unique and multiple-mapping, had a median of 40 million reads (median 86% of 677!total reads) with standard deviation of 16 million reads (Supplemental Table 1, and Supplemental 678!Data Set 8). 679! 680!Triangulation analysis 681!Genomic regions in which both JL and GWAS associations co-localized were further 682!investigated using the following procedure. First, JL support intervals from two or more 683!individual-trait models that showed physical overlap were merged to form common support 684!intervals. Support intervals detected for a single trait, with no physical overlap within other trait 685!models, were also retained. For each final distinct support interval, Pearson correlations were 686!tested in all pairwise comparisons between (1) QTL effect estimates for that interval in 687!individual-trait JL model(s); (2) genotype state of significant GWAS marker(s) in the interval for 688!the respective trait(s); and (3) log2-transformed expression values of candidate gene(s) directly 689!hit by or within ± 100 kb of any of these significant GWAS markers. The use of 100 kb to define 690!the candidate gene search range was established through examination of LD decay and is further 691!elaborated in the results section. 692!
To test for significance of the correlation between JL allelic effect estimates and 693!expression values of each candidate gene proximal to significant GWAS markers, a multiple 694!testing correction to control FDR at 0.05 was imposed on P-values of the correlation obtained for 695!each gene. Namely, the Benjamini-Hochberg method (Benjamini and Hochberg, 1995) based on 696!the total number of genes proximal to the GWAS marker (within ± 100 kb) was applied using the 697!GAPIT package (Lipka et al., 2012) in R. For those correlations involving one of the two traits 698!with a negative optimal lambda for the Box-Cox transformation (i.e., an inverse power 699!transformation was applied for dT and dT3), the sign of the correlation was flipped in graphical 700!and tabular representations (Fig. 2 and Fig. S5 for master gene summaries, Fig. S2 and Table S6 701!for pleiotropy) to represent the true directionality of the relationship between traits. 702! 703!Epistasis 704!
! 25!
For each trait, all possible pairwise interactions (additive x additive) between markers 705!comprising the final JL model were individually tested for significance in a model containing all 706!marker main (additive) effects. The P-value threshold required for an interaction to enter the 707!model was determined by modeling 1000 null permutations of transformed trait BLUEs with 708!only additive terms in the model to approximate a Type I error rate at α = 0.05. Interaction 709!effects passing this threshold were used together with the main effects of markers comprising the 710!final JL model to fit the final epistatic model. Calculations of PVE were performed using effect 711!estimates and allele frequencies within families as described above, except that pairwise 712!genotype scores were collapsed into three classes for interaction terms due to insufficient degrees 713!of freedom to model all possible genotype states in the two-locus case. Specifically, the two 714!vectors of genotype state scores were multiplied to obtain composite scores of -1 (one locus is 715!homozygous for reference allele and the other for minor), 0 (at least one heterozygote, meaning 716!the two alleles are assumed to cancel any interaction), or 1 (both loci are homozygous for 717!reference, or both for minor). Interactions were graphically depicted using the Circos software 718!package (Krzywinski et al., 2009) (Figure 5). 719! 720!Pleiotropy 721!Pleiotropy, or shared genetic basis, was assessed between pairs of traits as previously described 722!(Buckler et al., 2009), by applying the JL QTL model for each trait to every other trait. Pearson 723!correlations between allelic effect estimates derived from the final JL model for a trait itself and 724!the model applied from every other trait were evaluated for significance at α = 0.01, which with 725!23 d.f. means a cutoff of |r| > 0.504. The sharedness, or percentage of shared QTL, between two 726!traits was calculated as the sum of the percentage of significant correlations when the trait 1 727!model was applied to trait 2 and the percentage when vice versa. Connections among QTL 728!showing sharedness were visualized using the network R package (Butts, 2008, 2015) 729!(Supplemental Figure 2). 730!
Pleiotropy was also examined within common support intervals to validate the merging 731!of individual-trait intervals, a step conducted in previous NAM JL analyses (Tian et al., 2011). In 732!contrast to the above-described pleiotropy analysis, this QTL-level analysis fit the single peak JL 733!marker within the common interval for each trait to every other trait that had a peak JL marker in 734!the interval. 735!

! 26!
736!Linkage disequilibrium analysis 737!For each marker showing an RMIP of 0.05 or higher for one or more traits in GWAS, pairwise 738!linkage disequilibrium (LD) with all other markers within ± 1 Mb was estimated through custom 739!Python and R scripts using squared allele-frequency correlations (r2) as previously described 740!(Weir, 1996). A null distribution for LD was generated by performing the same estimation for 741!50,000 markers selected at random. The same imputed genotypic data set of 29.7 million 742!segregating markers used in JL-GWAS was used to estimate LD. 743! 744!Standardized effect sizes 745!To more fully compare JL results across traits, effect sizes of JL peak markers were standardized 746!and visualized in relation to the allele frequencies at these markers (Supplemental Figure 6). 747!Given that 12 was the smallest number of QTL detected for a tocochromanol trait aside from PC-748!8, an outlier in both JL model size (eight QTL) and line-mean heritability (lowest by four-fold), 749!JL was re-run constraining the number of markers per trait to 12 using transformed BLUEs. 750!Allelic effect estimates were obtained by subsequently re-fitting these 12-QTL models with 751!untransformed BLUEs and scaled by multiplying by the total heritable variance for each trait 752!(Brown et al., 2011). Total heritable variance was estimated on a by-trait basis, as the line-mean 753!heritability in NAM divided by the standard deviation of untransformed trait BLUEs in the 754!Goodman-Buckler inbred diversity panel (Lipka et al., 2013). Allele frequencies were derived 755!based on founders exhibiting NAM JL allelic effect estimates significantly different from those 756!of B73, using estimates from transformed BLUEs given the involvement of statistical inference. 757! 758!Preparation and identification of standards for chlorophylls and their derivatives 759!Chlorophylls a and b were isolated from fresh spinach (Spinacia oleracea) leaves as previously 760!described (Canjura and Schwartz, 1991). Chlorophyllides were prepared by grinding fresh 761!spinach leaves in 80% acetone with 20% 40 mM sodium citrate, pH 8, and incubating overnight 762!at room temperature in darkness (Holden, 1961). After centrifuging to pellet debris, the 763!supernatant was extracted twice with diethyl ether. The diethyl ether extracts were pooled, dried 764!over anhydrous sodium sulfate, evaporated, and dissolved in 80:20 methanol:acetone. 765!Pheophytins a and b and pheophorbides a and b were prepared by acidification of their 766!

! 27!
corresponding purified chlorophylls and chlorophyllides, respectively, as described (Schwartz et 767!al., 1981; Canjura and Schwartz, 1991). Each compound was isolated by semi-preparative HPLC 768!using a Shimadzu Prominence HPLC and 5 µm Spherisorb ODS-2 column (250 x 4.6 mm) 769!(Orochem Technologies, Inc.). Pigments were eluted using a linear gradient at 1 mL/min in 770!which Solvent A was 80% methanol in acetone and Solvent B was 80% methanol in 1 M 771!ammonium acetate. The gradient used was 0-100% solvent A for 15 minutes, hold solvent A at 772!100% for 15 minutes and then return to solvent B and re-equilibrate for 7 minutes. Individual 773!compounds were identified and quantified by a combination of their retention and spectral 774!characteristics (Camara, 1985; Lichtenthaler, 1987; Zapata et al., 1987; Milenković et al., 2012). 775! 776!Extraction and analysis of chlorophylls and derivatives 777!Embryos and endosperm from each NAM parent were dissected from frozen kernels on a metal 778!plate on dry ice to ensure all tissues remained frozen. Embryo and endosperm tissues were 779!ground in liquid nitrogen and 50-60 mg tissue was extracted with 600 µL 10% (v/v) 0.2 M Tris-780!HCL, pH 8 in acetone precooled to -20 °C (Schelbert et al., 2009; Christ et al., 2012) that 781!contained 1 mg/mL butylated hydroxytoluene, and 1 mg/mL bixin and 1 mg/mL DL-α-782!tocopherol acetate as internal recovery controls. Three 3-mm glass beads were added and 783!extraction was done for 5 min by shaking using a commercial paint shaker (HERO, BC, Canada). 784!Samples were centrifuged for 5 min at 13,000 RPM in a microfuge, and the supernatant was 785!transferred to a new tube. 300 µL of HPLC grade water and 500 µL of diethyl ether were added, 786!vortexed and centrifuged at 13,000 RPM for two minutes to allow for phase separation. The 787!upper (diethyl ether) fraction was transferred to a new microcentrifuge tube, evaporated and 788!dissolved in 200 µL 100% acetone, which was divided into two aliquots and evaporated. One 789!aliquot was dissolved in 100 µL of 3:1 (v/v) methanol:methyl tert-butyl ether for analyses of 790!tocochromanols as previously described (Lipka et al., 2013). The second aliquot was dissolved in 791!100 µL of 80:20 (v/v) methanol:acetone and assessed by HPLC for levels of the eight target 792!chlorophyll metabolites as described above. Pheophorbide b and pheophytin b, whose presence 793!indicates artifactual conversions during extraction, were below detection levels in all samples 794!analyzed. For each of the detected chlorophyll metabolites, Pearson correlations with total 795!tocopherol levels were calculated within each time point after removing values (concentration, 796!

! 28!
pmol g-1) that were more than three standard deviations from the mean for the respective 797!compound (the chlorophyll metabolite and/or total tocopherols) within that time point. 798! 799!Accession numbers 800!Genes identified in this study are as listed in Figure 3, using the following accession numbers as 801!available in MaizeGDB: GRMZM2G084942, GRMZM2G493395, GRMZM2G173358, 802!GRMZM2G173641, GRMZM2G112728, GRMZM2G082998, GRMZM2G088396, 803!GRMZM2G035213, GRMZM2G036455, GRMZM2G073351, GRMZM2G039373, 804!GRMZM2G060870, GRMZM2G128176, and GRMZM2G031028. 805!HapMap sequence data, as described in Chia et al. (2012) and Gore et al. (2009), can be found in 806!the NCBI Short Read Archive with accession numbers SRA051245 (HapMap v. 2) and 807!SRP001145 (HapMap v. 1). Both SNP data sets are also available at www.panzea.org. 808!The data reported in this paper are tabulated in Supplemental Data and archived in the following 809!places: all RNA-seq reads are available at the National Center of Biotechnology Information 810!Sequence Read Archive under BioProject Number PRJNA174231. Single nucleotide 811!polymorphisms and expression abundances (FPKMs) are available from the Dryad Digital 812!Repository (DOI provided at publication). Scripts used in this study are available on GitHub 813!(repository URL to be provided at time of publication). 814! 815!Supplemental Data 816!Supplemental Figure 1. Pairwise phenotypic correlations between untransformed best linear 817!unbiased estimators (BLUEs) of 10 tocochromanol grain traits. 818! 819!Supplemental Figure 2. Pleiotropy of 162 quantitative trait loci (QTL) identified in joint-820!linkage (JL) analysis for 10 grain tocochromanol traits in the U.S. maize nested association 821!mapping (NAM) population. 822! 823!Supplemental Figure 3. Linkage disequilibrium estimates between GWAS variants in the NAM 824!population. 825! 826!

! 29!
Supplemental Figure 4. Heatmap displaying Pearson’s (r2) correlation coefficient of expression 827!abundances across all samples in this study. 828! 829!Supplemental Figure 5. Master summaries for the remaining genes identified in this study. 830! 831!Supplemental Figure 6. Frequency distributions of standardized joint-linkage allelic effect 832!estimates (absolute values) for A, tocopherol traits, and B, tocotrienol traits, for quantitative trait 833!loci (QTL) in each of three classes. 834! 835!Supplemental Figure 7. Concentrations (pmol g-1, log scale) of chlorophyll pathway 836!compounds and total tocopherols in embryos and endosperm of NAM parents analyzed across 837!developing kernel stages. 838! 839!Supplemental Figure 8. Relative explanation of phenotypic variance for 10 tocochromanol 840!grain traits by each of three classes of joint-linkage quantitative trait loci (JL-QTL).!!841! 842!Supplemental Figure 9. Distribution of untransformed best linear unbiased estimators (BLUEs) 843!for 10 grain tocochromanol traits across the U.S. maize nested association mapping (NAM) 844!population. 845! 846!Supplemental Table 1. Summary of samples used for RNA isolation in this study. 847! 848!Supplemental Table 2. Percent phenotypic variance explained (PVE) for unresolved joint-849!linkage quantitative trait loci (JL-QTL). 850! 851!Supplemental Table 3. Lambda values used in Box-Cox transformation and joint-linkage (JL) 852!and genome-wide association study (GWAS) entry thresholds determined from permutations for 853!each trait. 854! 855!Supplemental Data Set 1. Genomic information for the 81 a priori candidate genes. 856! 857!

! 30!
Supplemental Data Set 2. Transformed and untransformed best linear unbiased estimators 858!(BLUEs) for the U.S. maize nested association mapping (NAM) population used in the present 859!study. 860!
861!Supplemental Data Set 3. Final joint-linkage models for the 10 tocochromanol traits evaluated 862!in the U.S. maize nested association mapping (NAM) population. 863!
864!
Supplemental Data Set 4. Summary of joint linkage-quantitative trait loci (JL-QTL) and 865!associated GWAS signals for 10 tocochromanol grain traits evaluated in the U.S. maize nested 866!association mapping (NAM) population. 867!
Supplemental Data Set 5. Summary of joint-linkage quantitative trait locus (JL-QTL) allelic 868!effect estimates for the 10 tocochromanol traits evaluated in the U.S. maize nested association 869!mapping (NAM) population. 870!
Supplemental Data Set 6. Summary of pleiotropy analyses. 871!
Supplemental Data Set 7. Complete list of genome wide association study (GWAS) results. 872!
Supplemental Data Set 8. Tissue and RNA-seq information for samples used in this study. 873!
Supplemental Data Set 9. Concentrations (pmol g-1) of tocochromanol and chlorophyll 874!metabolites in developing embryo and endosperm tissue. 875!
Supplemental Data Set 10. Chlorophyll-related gene expression in developing B73 embryos. 876!
Supplemental Data Set 11. Summary of observations and genotypes removed in the 'difference 877!in fits' (DFFITs) and Studentized deleted residuals outlier detection stages, conducted pre- and 878!post-generation of best linear unbiased estimators (BLUEs), respectively. 879!
Supplemental File 1. Distribution of raw HPLC phenotypic values for 10 grain tocochromanol 880!traits across and within the U.S. maize nested association mapping (NAM) population. 881!
882!883!
! 31!
Supplemental File 2. Distribution of untransformed best linear unbiased estimators (BLUEs) for 884!10 grain tocochromanol traits across and within the U.S. maize nested association mapping 885!(NAM) population. 886! 887!
ACKNOWLEDGMENTS 888!This research was supported by National Science Foundation (NSF) DBI-0922493 (D.D.P., 889!C.R.B, E.S.B. and T.R.R.), DBI-0820619 and IOS-1238014 (E.S.B.), USDA-ARS (E.S.B.), 890!Cornell University startup funds (M.A.G.) and a USDA National Needs Fellowship (C.H.D.). 891!We gratefully acknowledge Evan Klug and Emily McKinney for assistance with sample 892!processing and HPLC, Elodie Gazave for initial Circos scripts, Jason Peiffer for custom Java 893!code calling ASReml, and Pat Brown for pleiotropy plot scripts. 894! 895!AUTHOR CONTRIBUTIONS 896!C.H.D., M.A.G., and D.D.P co-wrote the manuscript; C.H.D., C.B.K., and A.E.L. co-led data 897!analysis; M.M.-L. performed HPLC analyses and metabolite quantifications; B.V., E.G.-C., J.H. 898!and J.C. performed transcriptome analysis; J.G.W. generated marker data sets; J.G.W. and D.C.I. 899!coded GWAS, GWAS permutation, and figure scripts; J.C. created website/databases; A.M. 900!made RNA and RNAseq libraries; P.J.B. modified TASSEL source code and oversaw epistasis 901!calculations; T.R. overall management of NAM population growth; M.M.-H. managed planting, 902!pollination, harvesting, processing of NAM population; B.F.O. and T.T. generated developing 903!kernels for transcriptome analysis; E.S.B. oversaw germplasm, genotyping, and imputation, and 904!advised on mapping analysis; C.R.B. oversaw RNAseq and transcriptome analysis, managed all 905!informatics; M.A.G. oversaw data analysis, project management, design, coordination; D.D.P. 906!overall project management and coordination, oversaw data and metabolite analyses, biological 907!interpretation. 908! 909!

! 32!
910!Table 1. Sample sizes, ranges, and heritabilities for tocochromanol traits. Medians and 911!ranges (in µg g-1 grain) for untransformed best linear unbiased estimators (BLUEs) of ten 912!tocochromanol grain traits evaluated in the U.S. maize nested association mapping (NAM) 913!population, and estimated heritability on a line-mean basis across two years. 914! 915!Trait No.
Lines
BLUEs Heritabilities Median SDa Rangeb Estimate SEc
α-Tocopherol (αT) 4,786 8.68 5.22 -2.97 - 33.19 0.82 0.01 δ-Tocopherol (δT) 4,724 1.43 1.71 -1.74 - 10.05 0.71 0.02 γ-Tocopherol (γT) 4,789 40.08 19.63 -2.78 - 128.49 0.75 0.02 Total Tocopherols (ΣT) 4,790 51.97 22.30 1.50 - 153.19 0.72 0.02 α-Tocotrienol (αT3) 4,784 10.15 4.18 -7.62 - 28.61 0.74 0.02 δ-Tocotrienol (δT3) 4,689 0.76 1.15 -0.86 - 7.86 0.89 0.01 γ-Tocotrienol (γT3) 4,770 18.49 11.69 -12.23 - 73.86 0.85 0.01 Total Tocotrienols (ΣT3) 4,765 28.91 13.87 -10.33 - 93.83 0.82 0.02 Total Tocochromanols (ΣTT3) 4,779 86.14 28.88 13.96 - 221.78 0.76 0.02 Plastochromanol-8 (PC-8) 4,787 1.06 0.29 0.05 - 2.38 0.18 0.02
916!aSD, Standard deviation of the BLUEs. 917!bNegative BLUE values are a product of the statistical analysis. Specifically, it is possible for 918!BLUEs to equal any value from -∞ to +∞. 919!cSE, Standard error of the heritability estimate. 920!
921! 922!

! 33!
923!Table 2. Genetic association results for tocochromanol traits. Summary of joint-linkage 924!quantitative trait loci (JL-QTL) and genome-wide association study (GWAS) variants identified 925!for ten tocochromanol grain traits evaluated in the U.S. maize nested association mapping 926!(NAM) population. 927!!928!
929!a SD, standard deviation. 930!b GWAS variants residing within JL-QTL support intervals for each trait that exhibited a 931!resample model inclusion probability (RMIP) of 0.05 or greater. 932! 933! 934! 935!REFERENCES 936!Ahsan, H., Ahad, A., and Siddiqui, W.A. (2015). A review of characterization of tocotrienols 937!
from plant oils and foods. J. Chem. Biol. 8, 45-59. 938!Barnett, D., Garrison, E., Quinlan, A., Strömberg, M., and Marth, G. (2011). BamTools: a 939!
C++ API and toolkit for analyzing and managing BAM files. Bioinformatics 27, 1691-940!1692. 941!
Trait Number of JL-QTL
Median size (SDa) of α = 0.01 JL-QTL
support interval (Mb)
Number of JL-QTL intervals
containing a priori genes
Number of GWAS-
associated variants in JL-QTL intervalsb
Maximum RMIP
α-Tocopherol (αT) 13 4.17 (13.38) 4 57 0.98 δ-Tocopherol (δT) 18 3.36 (16.84) 7 65 0.92 γ-Tocopherol (γT) 21 7.21 (22.64) 10 72 0.95 Total Tocopherols (ΣT) 18 8.00 (21.48) 8 58 0.90 α-Tocotrienol (αT3) 17 4.65 (14.76) 4 49 0.92 δ-Tocotrienol (δT3) 21 5.74 (22.20) 7 68 0.91 γ-Tocotrienol (γT3) 14 8.35 (31.01) 8 52 0.98 Total Tocotrienols (ΣT3) 12 15.47 (24.02) 8 49 0.98 Total Tocochromanols (ΣTT3) 20 6.05 (21.32) 6 95 0.70 Plastochromanol-8 (PC-8) 8 5.05 (21.37) 4 40 0.66 JL-QTL TOTAL 162 5.90 (21.43) 66 605

! 34!
Belsley, D.A., Kuh, E., and Welsch, R.E. (2005). Regression Diagnostics: Identifying 942!Influential Data and Sources of Collinearity. (Hoboken, New Jersey: John Wiley & 943!Sons). 944!
Benjamini, Y., and Hochberg, Y. (1995). Controlling the false discovery rate: a practical and 945!powerful approach to multiple testing. J. Roy. Stat. Soc. B Met. 57, 289-300. 946!
Box, G.E.P., and Cox, D.R. (1964). An Analysis of Transformations. J. Roy. Stat. Soc. B Met. 947!26, 211-252. 948!
Bradbury, P.J., Zhang, Z., Kroon, D.E., Casstevens, T.M., Ramdoss, Y., and Buckler, E.S. 949!(2007). TASSEL: software for association mapping of complex traits in diverse samples. 950!Bioinformatics 23, 2633-2635. 951!
Bréhélin, C., Kessler, F., and van Wijk, K.J. (2007). Plastoglobules: versatile lipoprotein 952!particles in plastids. Trends Plant Sci. 12, 260-266. 953!
Brown, P.J., Upadyayula, N., Mahone, G.S., Tian, F., Bradbury, P.J., Myles, S., Holland, 954!J.B., Flint-Garcia, S., McMullen, M.D., Buckler, E.S., and Rocheford, T.R. (2011). 955!Distinct genetic architectures for male and female inflorescence traits of maize. PLoS 956!Genet. 7, e1002383. 957!
Buckler, E.S., Holland, J.B., Bradbury, P.J., Acharya, C.B., Brown, P.J., Browne, C., 958!Ersoz, E., Flint-Garcia, S., Garcia, A., Glaubitz, J.C., Goodman, M.M., Harjes, C., 959!Guill, K., Kroon, D.E., Larsson, S., Lepak, N.K., Li, H., Mitchell, S.E., Pressoir, G., 960!Peiffer, J.A., Rosas, M.O., Rocheford, T.R., Romay, M.C., Romero, S., Salvo, S., 961!Sanchez Villeda, H., da Silva, H.S., Sun, Q., Tian, F., Upadyayula, N., Ware, D., 962!Yates, H., Yu, J., Zhang, Z., Kresovich, S., and McMullen, M.D. (2009). The genetic 963!architecture of maize flowering time. Science 325, 714-718. 964!
Burkschat, M. (2009). Linear estimators and predictors based on generalized order statistics 965!from generalized Pareto distributions. Commun. Stat.-Theor. M. 39, 311-326. 966!
Butts, C. (2008). Network: a package for managing relational data in R. J. Stat. Softw. 24. 967!Butts, C. (2015). Network: Classes for Relational Data. In The Statnet Project 968!
(http://statnet.org). 969!Cahoon, E.B., Hall, S.E., Ripp, K.G., Ganzke, T.S., Hitz, W.D., and Coughlan, S.J. (2003). 970!
Metabolic redesign of vitamin E biosynthesis in plants for tocotrienol production and 971!increased antioxidant content. Nat. Biotechnol. 21, 1082-1087. 972!

! 35!
Camara, B. (1985). Prenylation of chlorophyllide a in Capsicum plastids. Method. Enzymol. 973!110, 274-281. 974!
Canjura, F.L., and Schwartz, S.J. (1991). Separation of chlorophyll compounds and their polar 975!derivatives by high-performance liquid chromatography. J. Agr. Food Chem. 39, 1102-976!1105. 977!
Chandler, K., Lipka, A.E., Owens, B.F., Li, H., Buckler, E.S., Rocheford, T., and Gore, 978!M.A. (2013). Genetic analysis of visually scored orange kernel color in maize. Crop Sci. 979!53, 189-200. 980!
Cheng, Z., Sattler, S., Maeda, H., Sakuragi, Y., Bryant, D.A., and DellaPenna, D. (2003). 981!Highly divergent methyltransferases catalyze a conserved reaction in tocopherol and 982!plastoquinone synthesis in cyanobacteria and photosynthetic eukaryotes. Plant Cell 15, 983!2343-2356. 984!
Chia, J.M., Song, C., Bradbury, P.J., Costich, D., de Leon, N., Doebley, J., Elshire, R.J., 985!Gaut, B., Geller, L., Glaubitz, J.C., Gore, M., Guill, K.E., Holland, J., Hufford, 986!M.B., Lai, J., Li, M., Liu, X., Lu, Y., McCombie, R., Nelson, R., Poland, J., 987!Prasanna, B.M., Pyhäjärvi, T., Rong, T., Sekhon, R.S., Sun, Q., Tenaillon, M.I., 988!Tian, F., Wang, J., Xu, X., Zhang, Z., Kaeppler, S.M., Ross-Ibarra, J., McMullen, 989!M.D., Buckler, E.S., Zhang, G., Xu, Y., and Ware, D. (2012). Maize HapMap2 990!identifies extant variation from a genome in flux. Nat. Genet. 44, 803-807. 991!
Christ, B., Schelbert, S., Aubry, S., Süssenbacher, I., Müller, T., Kräutler, B., and 992!Hörtensteiner, S. (2012). MES16, a member of the methylesterase protein family, 993!specifically demethylates fluorescent chlorophyll catabolites during chlorophyll 994!breakdown in Arabidopsis. Plant Physiol. 158, 628-641. 995!
Chrost, B., Falk, J., Kernebeck, B., Mölleken, H., and Krupinska, K. (1999). Tocopherol 996!Biosynthesis in Senescing Chloroplasts - A Mechanism to Protect Envelope Membranes 997!against Oxidative Stress and a Prerequisite for Lipid Remobilization. In The Chloroplast: 998!From Molecular Biology to Biotechnology, J.H. Argyroudi-Akoyunoglou and H. Senger, 999!eds (Dordrecht: Springer Netherlands), pp. 171-176. 1000!
Collakova, E., and DellaPenna, D. (2003). Homogentisate phytyltransferase activity is limiting 1001!for tocopherol biosynthesis in Arabidopsis. Plant Physiol. 131, 632-642. 1002!

! 36!
Cook, J.P., McMullen, M.D., Holland, J.B., Tian, F., Bradbury, P., Ross-Ibarra, J., 1003!Buckler, E.S., and Flint-Garcia, S.A. (2012). Genetic architecture of maize kernel 1004!composition in the nested association mapping and inbred association panels. Plant 1005!Physiol. 158, 824-834. 1006!
DellaPenna, D., and Mène-Saffrané, L. (2011). Vitamin E. In Advances in Botanical Research, 1007!F. Rebeille and R. Douce, eds (Amsterdam, The Netherlands: Elsevier Ltd.), pp. 179-227. 1008!
Deruère, J., Römer, S., d'Harlingue, A., Backhaus, R.A., Kuntz, M., and Camara, B. 1009!(1994). Fibril assembly and carotenoid overaccumulation in chromoplasts: a model for 1010!supramolecular lipoprotein structures. Plant Cell 6, 119-133. 1011!
Elshire, R.J., Glaubitz, J.C., Sun, Q., Poland, J.A., Kawamoto, K., Buckler, E.S., and 1012!Mitchell, S.E. (2011). A robust, simple genotyping-by-sequencing (GBS) approach for 1013!high diversity species. PloS One 6, e19379. 1014!
Flint-Garcia, S.A., Thuillet, A.C., Yu, J., Pressoir, G., Romero, S.M., Mitchell, S.E., 1015!Doebley, J., Kresovich, S., Goodman, M.M., and Buckler, E.S. (2005). Maize 1016!association population: a high-resolution platform for quantitative trait locus dissection. 1017!Plant J. 44, 1054-1064. 1018!
Fritsche, S., Wang, X., Li, J., Stich, B., Kopisch-Obuch, F.J., Endrigkeit, J., Leckband, G., 1019!Dreyer, F., Friedt, W., Meng, J., and Jung, C. (2012). A candidate gene-based 1020!association study of tocopherol content and composition in rapeseed (Brassica napus). 1021!Front. Plant Sci. 3, 1-24. 1022!
Gilliland, L.U., Magallanes-Lundback, M., Hemming, C., Supplee, A., Koornneef, M., 1023!Bentsink, L., and DellaPenna, D. (2006). Genetic basis for natural variation in seed 1024!vitamin E levels in Arabidopsis thaliana. Proc. Natl. Acad. Sci. USA 103, 18834-18841. 1025!
Gilmour, A.R., Gogel, B.J., Cullis, B.R., and Thompson, R. (2009). ASReml User Guide: 1026!Release 3.0 (Hemel Hempstead, HP1 1ES, UK: VSN International Ltd.). 1027!
Glaubitz, J.C., Casstevens, T.M., Lu, F., Harriman, J., Elshire, R.J., Sun, Q., and Buckler, 1028!E.S. (2014). TASSEL-GBS: a high capacity genotyping by sequencing analysis pipeline. 1029!PloS One 9, e90346. 1030!
Gore, M.A., Chia, J.M., Elshire, R.J., Sun, Q., Ersoz, E.S., Hurwitz, B.L., Peiffer, J.A., 1031!McMullen, M.D., Grills, G.S., Ross-Ibarra, J., Ware, D.H., and Buckler, E.S. (2009). 1032!A first-generation haplotype map of maize. Science 326, 1115-1117. 1033!

! 37!
Hirsch, C.N., Foerster, J.M., Johnson, J.M., Sekhon, R.S., Muttoni, G., Vaillancourt, B., 1034!Peñagaricano, F., Lindquist, E., Pedraza, M.A., Barry, K., de Leon, N., Kaeppler, 1035!S.M., and Buell, C.R. (2014). Insights into the maize pan-genome and pan-1036!transcriptome. Plant Cell 26, 121-135. 1037!
Holden, M. (1961). The breakdown of chlorophyll by chlorophyllase. Biochem. J. 78, 359-364. 1038!Holland, J.B., Nyquist, W.E., and Cervantes-Martínez, C.T. (2003). Estimating and 1039!
interpreting heritability for plant breeding: an update. In Plant Breeding Reviews, J. 1040!Janick, ed (John Wiley & Sons, Inc. 1041!
Hortensteiner, S. (2013). Update on the biochemistry of chlorophyll breakdown. Plant Mol. 1042!Biol. 82, 505-517. 1043!
Hörtensteiner, S., and Kräutler, B. (2011). Chlorophyll breakdown in higher plants. Biochim. 1044!Biophys. Acta 1807, 977-988. 1045!
Hung, H.Y., Browne, C., Guill, K., Coles, N., Eller, M., Garcia, A., Lepak, N., Melia-1046!Hancock, S., Oropeza-Rosas, M., Salvo, S., Upadyayula, N., Buckler, E.S., Flint-1047!Garcia, S., McMullen, M.D., Rocheford, T.R., and Holland, J.B. (2012). The 1048!relationship between parental genetic or phenotypic divergence and progeny variation in 1049!the maize nested association mapping population. Heredity 108, 490-499. 1050!
Hunter, S.C., and Cahoon, E.B. (2007). Enhancing vitamin E in oilseeds: unraveling 1051!tocopherol and tocotrienol biosynthesis. Lipids 42, 97-108. 1052!
Hussain, N., Irshad, F., Jabeen, Z., Shamsi, I.H., Li, Z., and Jiang, L. (2013). Biosynthesis, 1053!structural, and functional attributes of tocopherols in planta; past, present, and future 1054!perspectives. J. Agr. Food Chem. 61, 6137-6149. 1055!
Inoue, S., Ejima, K., Iwai, E., Hayashi, H., Appel, J., Tyystjärvi, E., Murata, N., and 1056!Nishiyama, Y. (2011). Protection by α-tocopherol of the repair of photosystem II during 1057!photoinhibition in Synechocystis sp. PCC 6803. Biochim. Biophys. Acta 1807, 236-241. 1058!
Kamal-Eldin, A., and Appelqvist, L.-Å. (1996). The chemistry and antioxidant properties of 1059!tocopherols and tocotrienols. Lipids 31, 671-701. 1060!
Karunanandaa, B., Qi, Q., Hao, M., Baszis, S.R., Jensen, P.K., Wong, Y.-H.H., Jiang, J., 1061!Venkatramesh, M., Gruys, K.J., Moshiri, F., Post-Beittenmiller, D., Weiss, J.D., and 1062!Valentin, H.E. (2005). Metabolically engineered oilseed crops with enhanced seed 1063!tocopherol. Metab. Eng. 7, 384-400. 1064!

! 38!
Kim, E.H., Lee, Y., and Kim, H.U. (2015). Fibrillin 5 is essential for plastoquinone-9 1065!biosynthesis by binding to solanesyl diphosphate synthases in Arabidopsis. Plant Cell 27, 1066!2956-2971. 1067!
Kim, Y.H., Lee, Y.Y., Kim, Y.H., Choi, M.S., Jeong, K.H., Lee, S.K., Seo, M.J., Yun, H.T., 1068!Lee, C.K., Kim, W.H., Lee, S.C., Park, S.K., and Park, H.M. (2011). Antioxidant 1069!activity and inhibition of lipid peroxidation in germinating seeds of transgenic soybean 1070!expressing OsHGGT. J. Agr. Food Chem. 59, 584-591. 1071!
Krzywinski, M., Schein, J., Birol, I., Connors, J., Gascoyne, R., Horsman, D., Jones, S.J., 1072!and Marra, M.A. (2009). Circos: an information aesthetic for comparative genomics. 1073!Genome Res. 19, 1639-1645. 1074!
Kumar, R., Raclaru, M., Schüßeler, T., Gruber, J., Sadre, R., Lühs, W., Zarhloul, K.M., 1075!Friedt, W., Enders, D., Frentzen, M., and Weier, D. (2005). Characterisation of plant 1076!tocopherol cyclases and their overexpression in transgenic Brassica napus seeds. FEBS 1077!Lett. 579, 1357-1364. 1078!
Kump, K.L., Bradbury, P.J., Wisser, R.J., Buckler, E.S., Belcher, A.R., Oropeza-Rosas, 1079!M.A., Zwonitzer, J.C., Kresovich, S., McMullen, M.D., Ware, D., Balint-Kurti, P.J., 1080!and Holland, J.B. (2011). Genome-wide association study of quantitative resistance to 1081!southern leaf blight in the maize nested association mapping population. Nat. Genet. 43, 1082!163-168. 1083!
Kutner, M.H., Nachtsheim, C.J., Neter, J., and Li, W. (2004). Applied Linear Statistical 1084!Models. (Boston: McGraw Hill Irwin). 1085!
Langmead, B., Trapnell, C., Pop, M., and Salzberg, S.L. (2009). Ultrafast and memory-1086!efficient alignment of short DNA sequences to the human genome. Genome Biol. 10, 1087!R25. 1088!
Lee, M., Sharopova, N., Beavis, W.D., Grant, D., Katt, M., Blair, D., and Arnel, H. (2002). 1089!Expanding the genetic map of maize with the intermated B73 x Mo17 (IBM) population. 1090!Plant Mol. Biol. 48, 453-461. 1091!
Li, H., Bradbury, P., Ersoz, E., Buckler, E.S., and Wang, J. (2011). Joint QTL linkage 1092!mapping for multiple-cross mating design sharing one common parent. PloS One 6, 1093!e17573. 1094!

! 39!
Li, H., Handsaker, B., Wysoker, A., Fennell, T., Ruan, J., Homer, N., Marth, G., Abecasis, 1095!G., Durbin, R., and Subgroup, G.P.D.P. (2009). The Sequence Alignment/Map format 1096!and SAMtools. Bioinformatics 25, 2078-2079. 1097!
Li, Q., Yang, X., Xu, S., Cai, Y., Zhang, D., Han, Y., Li, L., Zhang, Z., Gao, S., Li, J., and 1098!Yan, J. (2012). Genome-wide association studies identified three independent 1099!polymorphisms associated with α-tocopherol content in maize kernels. PloS One 7, 1100!e36807. 1101!
Li, Y., Zhou, Y., Wang, Z., Sun, X., and Tang, K. (2010). Engineering tocopherol biosynthetic 1102!pathway in Arabidopsis leaves and its effect on antioxidant metabolism. Plant Sci. 178, 1103!312-320. 1104!
Lichtenthaler, H.K. (1987). Chlorophylls and carotenoids: pigments of photosynthetic 1105!biomembranes. Method. Enzymol. 148, 350-382. 1106!
Lipka, A.E., Tian, F., Wang, Q., Peiffer, J., Li, M., Bradbury, P.J., Gore, M.A., Buckler, 1107!E.S., and Zhang, Z. (2012). GAPIT: genome association and prediction integrated tool. 1108!Bioinformatics 28, 2397-2399. 1109!
Lipka, A.E., Gore, M.A., Magallanes-Lundback, M., Mesberg, A., Lin, H., Tiede, T., Chen, 1110!C., Buell, C.R., Buckler, E.S., Rocheford, T., and DellaPenna, D. (2013). Genome-1111!wide association study and pathway-level analysis of tocochromanol levels in maize 1112!grain. G3:Genes|Genomes|Genetics 3, 1287-1299. 1113!
Lippold, F., vom Dorp, K., Abraham, M., Hölzl, G., Wewer, V., Yilmaz, J.L., Lager, I., 1114!Montandon, C., Besagni, C., Kessler, F., Stymne, S., and Dörmann, P. (2012). Fatty 1115!acid phytyl ester synthesis in chloroplasts of Arabidopsis. Plant Cell 24, 2001-2014. 1116!
Littell, R.C., Milliken, G.A., Stroup, W.W., Wolfinger, R.D., and Schabenberger, O. (2006). 1117!SAS® for Mixed Models, Second Edition (Cary, NC: SAS Institute Inc.). 1118!
Lu, Y., Rijzaani, H., Karcher, D., Ruf, S., and Bock, R. (2013). Efficient metabolic pathway 1119!engineering in transgenic tobacco and tomato plastids with synthetic multigene operons. 1120!Proc. Natl. Acad. Sci. USA 110, E623-632. 1121!
Ma, Y., Baker, R.F., Magallanes-Lundback, M., DellaPenna, D., and Braun, D.M. (2008). 1122!Tie-dyed1 and sucrose export defective1 act independently to promote carbohydrate 1123!export from maize leaves. Planta 227, 527-538. 1124!

! 40!
Maeda, H., and DellaPenna, D. (2007). Tocopherol functions in photosynthetic organisms. 1125!Curr. Opin. Plant Biol. 10, 260-265. 1126!
Maeda, H., Song, W., Sage, T.L., and DellaPenna, D. (2006). Tocopherols play a crucial role 1127!in low-temperature adaptation and phloem loading in Arabidopsis. Plant Cell 18, 2710-1128!2732. 1129!
Martin, M. (2011). Cutadapt removes adapter sequences from high-throughput sequencing 1130!reads. EMBnet.journal 17, 10-12. 1131!
McMullen, M.D., Kresovich, S., Villeda, H.S., Bradbury, P., Li, H., Sun, Q., Flint-Garcia, 1132!S., Thornsberry, J., Acharya, C., Bottoms, C., Brown, P., Browne, C., Eller, M., 1133!Guill, K., Harjes, C., Kroon, D., Lepak, N., Mitchell, S.E., Peterson, B., Pressoir, G., 1134!Romero, S., Oropeza Rosas, M., Salvo, S., Yates, H., Hanson, M., Jones, E., Smith, 1135!S., Glaubitz, J.C., Goodman, M., Ware, D., Holland, J.B., and Buckler, E.S. (2009). 1136!Genetic properties of the maize nested association mapping population. Science 325, 1137!737-740. 1138!
Mène-Saffrane, L., Jones, A.D., and DellaPenna, D. (2010). Plastochromanol-8 and 1139!tocopherols are essential lipid-soluble antioxidants during seed desiccation and 1140!quiescence in Arabidopsis. Proc. Natl. Acad. Sci. USA 107, 17815-17820. 1141!
Milenković, S.M., Zvezdanović, J.B., Anđelković, T.D., and Marković, D.Z. (2012). The 1142!identification of chlorophyll and its derivatives in the pigment mixtures: HPLC-1143!chromatography, visible and mass spectroscopy studies. Adv. Technol. 1, 16-24. 1144!
Neter, J., Kutner, M.H., Nachtsheim, C.J., and Wasserman, W. (1996). Applied linear 1145!statistical methods. (Chicago: Irwin). 1146!
Norris, S.R., Shen, X., and DellaPenna, D. (1998). Complementation of the Arabidopsis pds1 1147!mutation with the gene encoding p-hydroxyphenylpyruvate dioxygenase. Plant Physiol. 1148!117, 1317-1323. 1149!
Ogut, F., Bian, Y., Bradbury, P.J., and Holland, J.B. (2015). Joint-multiple family linkage 1150!analysis predicts within-family variation better than single-family analysis of the maize 1151!nested association mapping population. Heredity 114, 552-563. 1152!
Peiffer, J.A., Romay, M.C., Gore, M.A., Flint-Garcia, S.A., Zhang, Z., Millard, M.J., 1153!Gardner, C.A., McMullen, M.D., Holland, J.B., Bradbury, P.J., and Buckler, E.S. 1154!(2014). The genetic architecture of maize height. Genetics 196, 1337-1356. 1155!
! 41!
Poland, J.A., Bradbury, P.J., Buckler, E.S., and Nelson, R.J. (2011). Genome-wide nested 1156!association mapping of quantitative resistance to northern leaf blight in maize. Proc. Natl. 1157!Acad. Sci. USA 108, 6893-6898. 1158!
Raclaru, M., Gruber, J., Kumar, R., Sadre, R., Lühs, W., Zarhloul, M.K., Friedt, W., 1159!Frentzen, M., and Weier, D. (2006). Increase of the tocochromanol content in 1160!transgenic Brassica napus seeds by overexpression of key enzymes involved in 1161!prenylquinone biosynthesis. Mol. Breeding 18, 93-107. 1162!
Rao, T.J., and Province, M.A. (2016). A framework for interpreting type I error rates from a 1163!product-term model of interaction applied to quantitative traits. Genet. Epidemiol. 40, 1164!144-153. 1165!
Rippert, P., Scimemi, C., Dubald, M., and Matringe, M. (2004). Engineering plant shikimate 1166!pathway for production of tocotrienol and improving herbicide resistance. Plant Physiol. 1167!134, 92-100. 1168!
Rise, M., Cojocaru, M., Gottlieb, H.E., and Goldschmidt, E.E. (1989). Accumulation of α-1169!tocopherol in senescing organs as related to chlorophyll degradation. Plant Physiol. 89, 1170!1028-1030. 1171!
Ritchie, M.D., Holzinger, E.R., Li, R., Pendergrass, S.A., and Kim, D. (2015). Methods of 1172!integrating data to uncover genotype-phenotype interactions. Nat. Rev. Genet. 16, 85-97. 1173!
Sattler, S.E., Gilliland, L.U., Magallanes-Lundback, M., Pollard, M., and DellaPenna, D. 1174!(2004). Vitamin E is essential for seed longevity and for preventing lipid peroxidation 1175!during germination. Plant Cell 16, 1419-1432. 1176!
Savidge, B., Weiss, J.D., Wong, Y.-H.H., Lassner, M.W., Mitsky, T.A., Shewmaker, C.K., 1177!Post-Beittenmiller, D., and Valentin, H.E. (2002). Isolation and characterization of 1178!homogentisate phytyltransferase genes from Synechocystis sp. PCC 6803 and 1179!Arabidopsis. Plant Physiol. 129, 321-332. 1180!
Schelbert, S., Aubry, S., Burla, B., Agne, B., Kessler, F., Krupinska, K., and Hörtensteiner, 1181!S. (2009). Pheophytin pheophorbide hydrolase (pheophytinase) is involved in chlorophyll 1182!breakdown during leaf senescence in Arabidopsis. Plant Cell 21, 767-785. 1183!
Schwartz, S.J., Woo, S.L., and von Elbe, J.H. (1981). High-performance liquid 1184!chromatography of chlorophylls and their derivatives in fresh and processed spinach. J. 1185!Agr. Food Chem. 29, 533-535. 1186!

! 42!
Shintani, D., and DellaPenna, D. (1998). Elevating the vitamin E content of plants through 1187!metabolic engineering. Science 282, 2098-2100. 1188!
Singh, D.K., and McNellis, T.W. (2011). Fibrillin protein function: the tip of the iceberg? 1189!Trends Plant Sci. 16, 432-441. 1190!
Tanaka, H., Yabuta, Y., Tamoi, M., Tanabe, N., and Shigeoka, S. (2015). Generation of 1191!transgenic tobacco plants with enhanced tocotrienol levels through the ectopic expression 1192!of rice homogentisate geranylgeranyl transferase. Plant Biotechnol. 32, 233-238. 1193!
Tanaka, R., Rothbart, M., Oka, S., Takabayashi, A., Takahashi, K., Shibata, M., Myouga, 1194!F., Motohashi, R., Shinozaki, K., Grimm, B., and Tanaka, A. (2010). LIL3, a light-1195!harvesting-like protein, plays an essential role in chlorophyll and tocopherol biosynthesis. 1196!Proc. Natl. Acad. Sci. USA 107, 16721-16725. 1197!
Tang, S., Hass, C.G., and Knapp, S.J. (2006). Ty3/gypsy-like retrotransposon knockout of a 2-1198!methyl-6-phytyl-1,4-benzoquinone methyltransferase is non-lethal, uncovers a cryptic 1199!paralogous mutation, and produces novel tocopherol (vitamin E) profiles in sunflower. 1200!Theor. Appl. Genet. 113, 783-799. 1201!
Tian, F., Bradbury, P.J., Brown, P.J., Hung, H., Sun, Q., Flint-Garcia, S., Rocheford, T.R., 1202!McMullen, M.D., Holland, J.B., and Buckler, E.S. (2011). Genome-wide association 1203!study of leaf architecture in the maize nested association mapping population. Nat. Genet. 1204!43, 159-162. 1205!
Trapnell, C., Williams, B.A., Pertea, G., Mortazavi, A., Kwan, G., van Baren, M.J., 1206!Salzberg, S.L., Wold, B.J., and Pachter, L. (2010). Transcript assembly and 1207!quantification by RNA-Seq reveals unannotated transcripts and isoform switching during 1208!cell differentiation. Nat. Biotechnol. 28, 511-515. 1209!
Valdar, W., Holmes, C.C., Mott, R., and Flint, J. (2009). Mapping in structured populations 1210!by resample model averaging. Genetics 182, 1263-1277. 1211!
Valentin, H.E., Lincoln, K., Moshiri, F., Jensen, P.K., Qi, Q., Venkatesh, T.V., 1212!Karunanandaa, B., Baszis, S.R., Norris, S.R., Savidge, B., Gruys, K.J., and Last, 1213!R.L. (2006). The Arabidopsis vitamin E pathway gene5-1 Mutant Reveals a Critical Role 1214!for Phytol Kinase in Seed Tocopherol Biosynthesis. Plant Cell 18, 212-224. 1215!
Van Eenennaam, A.L., Lincoln, K., Durrett, T.P., Valentin, H.E., Shewmaker, C.K., 1216!Thorne, G.M., Jiang, J., Baszis, S.R., Levering, C.K., Aasen, E.D., Hao, M., Stein, 1217!

! 43!
J.C., Norris, S.R., and Last, R.L. (2003). Engineering vitamin E content: from 1218!Arabidopsis mutant to soy oil. Plant Cell 15, 3007-3019. 1219!
Vom Dorp, K., Hölzl, G., Plohmann, C., Eisenhut, M., Abraham, M., Weber, A.P.M., 1220!Hanson, A.D., and Dörmann, P. (2015). Remobilization of phytol from chlorophyll 1221!degradation is essential for tocopherol synthesis and growth of Arabidopsis. Plant Cell 1222!27, 2846-2859. 1223!
Wallace, J.G., Bradbury, P.J., Zhang, N., Gibon, Y., Stitt, M., and Buckler, E.S. (2014). 1224!Association mapping across numerous traits reveals patterns of functional variation in 1225!maize. PLoS Genet. 10, e1004845. 1226!
Wan, C.Y., and Wilkins, T.A. (1994). A modified hot borate method significantly enhances the 1227!yield of high-quality RNA from cotton (Gossypium hirsutum L.). Anal. Biochem. 223, 7-1228!12. 1229!
Wang, X., Zhang, C., Li, L., Fritsche, S., Endrigkeit, J., Zhang, W., Long, Y., Jung, C., and 1230!Meng, J. (2012). Unraveling the genetic basis of seed tocopherol content and 1231!composition in rapeseed (Brassica napus L.). PloS One 7, e50038. 1232!
Wang, X.Q., Yoon, M.Y., He, Q., Kim, T.S., Tong, W., Choi, B.W., Lee, Y.S., and Park, 1233!Y.J. (2015). Natural variations in OsγTMT contribute to diversity of the α-tocopherol 1234!content in rice. Mol. Genet. Genomics 290, 2121-2135. 1235!
Weir, B.S. (1996). Genetic data analysis II. (Sinauer Associates). 1236!Yan, J., Lipka, A.E., Schmelz, E.A., Buckler, E.S., and Jander, G. (2015). Accumulation of 1237!
5-hydroxynorvaline in maize (Zea mays) leaves is induced by insect feeding and abiotic 1238!stress. J. Exp. Bot. 66, 593-602. 1239!
Yang, W., Cahoon, R.E., Hunter, S.C., Zhang, C., Han, J., Borgschulte, T., and Cahoon, 1240!E.B. (2011). Vitamin E biosynthesis: functional characterization of the monocot 1241!homogentisate geranylgeranyl transferase. Plant J. 65, 206-217. 1242!
Ytterberg, A.J., Peltier, J.B., and van Wijk, K.J. (2006). Protein profiling of plastoglobules in 1243!chloroplasts and chromoplasts. A surprising site for differential accumulation of 1244!metabolic enzymes. Plant Physiol. 140, 984-997. 1245!
Yu, J., Holland, J.B., McMullen, M.D., and Buckler, E.S. (2008). Genetic design and 1246!statistical power of nested association mapping in maize. Genetics 178, 539-551. 1247!

! 44!
Zapata, M., Ayala, A.M., Franco, J.M., and Garrido, J.L. (1987). Separation of chlorophylls 1248!and their degradation products in marine phytoplankton by reversed-phase high-1249!performance liquid chromatography. Chromatographia 23, 26-30. 1250!
Zhang, C., Cahoon, R.E., Hunter, S.C., Chen, M., Han, J., and Cahoon, E.B. (2013). Genetic 1251!and biochemical basis for alternative routes of tocotrienol biosynthesis for enhanced 1252!vitamin E antioxidant production. Plant J. 73, 628-639. 1253!
Zhang, N., Gibon, Y., Wallace, J.G., Lepak, N., Li, P., Dedow, L., Chen, C., So, Y.S., 1254!Kremling, K., Bradbury, P.J., Brutnell, T., Stitt, M., and Buckler, E.S. (2015). 1255!Genome-wide association of carbon and nitrogen metabolism in the maize nested 1256!association mapping population. Plant Physiol. 168, 575-583. 1257!
Zhang, W., Liu, T., Ren, G., Hörtensteiner, S., Zhou, Y., Cahoon, E.B., and Zhang, C. 1258!(2014). Chlorophyll degradation: the tocopherol biosynthesis-related phytol hydrolase in 1259!Arabidopsis seeds is still missing. Plant Physiol. 166, 70-79. 1260!
1261!

Figure 1. Tocochromanol biosynthetic pathways in maize. Precursor pathways are summarized in gray boxes. The seven quantified compounds are shown in black text with their corresponding structures. Key a priori genes are in bold italicized text at the pathway step(s) executed by their encoded enzyme with the 8 a priori genes identified in this study highlighted in red text. Compound abbreviations: SDP, solanesyl diphosphate; Phytyl-DP, phytyl diphosphate; GGDP, geranylgeranyl diphosphate; HGA, homogentisic acid; MSBQ, 2-methyl-6-solanyl-1,4-benzoquinol; MPBQ, 2-methyl-6-phytyl-1,4-benzoquinol; MGGBQ, 2-methyl-6-geranylgeranyl-1,4-benzoquinol; PQ-9, plastoquinone-9; DMPBQ, 2,3-dimethyl-5-phytylbenzoquinol; DMGGBQ, 2,3-dimethyl-5-geranylgeranyl-1,4-benzoquinol. Gene abbreviations: 1-deoxy-D-xylulose-5-phosphate synthase (dxs2 and 3); arogenate/prephenate dehydrogenase family protein 2 (arodeH2); solanesyl diphosphate synthase (sds); phytol kinase (vte5); phytol phosphate kinase (vte6); p-hydroxyphenylpyruvate dioxygenase (hppd1); homogentisate geranylgeranyltransferase (hggt1); MPBQ/MGGBQ methyltransferase (vte3); and γ-tocopherol methyltransferase (vte4).
!

Figure 2. Master summaries for selected identified genes. Marker shapes correspond to trait class: circles, tocopherols; triangles, tocotrienols; squares, total tocochromanols, and diamonds, PC-8. Marker colors indicates compound type: yellow, alpha (α); orange, delta (δ); cyan, gamma (γ); purple, PC-8; brown, summed traits (Σ). Gene names are as they appear in Figure 3. Left panels: Directional gene models are depicted as black arrows and the identified gene as a green arrow. Lines with trait names above gene models indicate resample model inclusion probability (RMIP) of significant GWAS hits ± 100 kb of the peak RMIP variant. Lines below gene models indicate pairwise linkage disequilibrium (LD; r2) of each GWAS variant with the peak RMIP variant (dark blue line). The blue ribbon depicts the highest LD, per 200-bp window, to the peak RMIP variant while black ribbons indicate the density of variants tested in GWAS in the 200-bp window (log2 scale). Darker colors correspond to higher values. Right panels: Correlations (r) between JL-QTL allelic effect estimates and expression of the identified gene across six developing kernel time points. Significant correlations are indicated by trait abbreviations above the respective time point. Traits with both JL and GWAS associations appear in black text to the right of the graph and have solid trend lines and symbols, while those with only JL associations are in gray with dashed trend lines and open symbols.

Geneclass eQTLa
CommonSupportInterval
RefGen_v2 ID Annotated Gene FunctionPVE (%) of QTL by Trait'
Tocopherols (T) Tocotrienols (13)ET13 PC-8oT 61 yT IT aT3 613 yT3 113
hc..5?
b•al
No 2 5 GRMZM2G084942 arogenate dehydrogenase (aradd-12)Yes 3 5 GRMZM2G493395 1-deoxy-D-xylu ose 5-phosphate synthase 2 (dxs2)Yes 4 5 GRMZM2G1733513 homogentisate geranylgerany transferase (hggtl)Yes 4 4 GRMZM2G173641 1-deoxy-D-xylu ose 5-phosphate synthase 3 (dxs3)No 2 GRMZM2G112728 solanesyl diphosphate synthase (sds)No 4 GRMZM2G082998 MPBQNSBQ methyitransferase (vte3)No 2 6 GRMZM2G088396 p-hydroxypheny[pyrdvate dioxygenase (hppdl )Yes 2 8 GRMZM2G035213 y-tocopherol methyltrans'erase (vte4)
1.6 2.05.7 5.5 5.6 2.5 3.6
1.7 3.5 2.8 12 3.2 24.. 9.02.6
1.0 1.2 2.18.2 2.1 2.0 1.0 1.34.6 1.3 1.5 10.7 7.9 9.7 3.2 3.7
2.8 32.0 4.2
tb
Yes 5 GRMZM2G036455 protochlorophyl ide reductase (port)Yes 2 4 GRMZM2G073351 protochlorophyl' ide reductase (por2)No 6 GRMZM2G039373 snare protein (snare)No 3 0 GRMZM2G060870 lipid transfer protein (ftp)Yes 3 9 GRMZM2G128176 PHD finger transcription factor (phd)Yes 1 0 GFtMMI2G031028 fibrillin (fbn)
1.1 5.9 10.8 10.0 1.2 0.6 5.51.1 14.4 17.5 17_9 1.1 1.0 12.3
1.81.0 1.0 2.7 2.5 2.7 1.4
1.21.3 1.4 1.0 0.7 0.9
Trait class':
13PC-8
Multiple
Figure 3. Percent phenotypic variance explained (PVE) by a priori and novel causal genes
underlying joint-linkage quantitative trait loci (JL-QTL).aeQTL (expression QTL) indicates significant correlations between expression values and JL-QTL allelic effect estimates at >2 time points for at least one trait.bBlue shading corresponds to range of PVEs for JL-QTL, with darker blue indicating higher PVEs.
cColor coding indicates QTL predominantly affects a trait class (having at least two-thirds of
summed PVE).
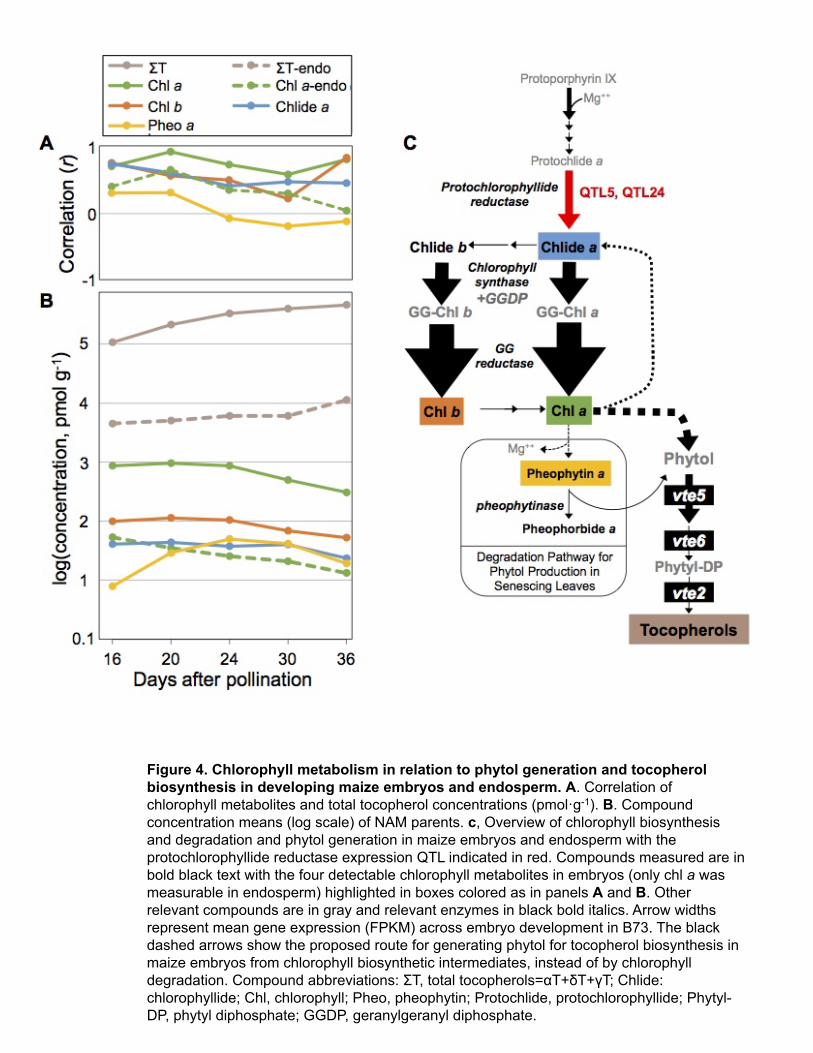
Figure 4. Chlorophyll metabolism in relation to phytol generation and tocopherol biosynthesis in developing maize embryos and endosperm. A. Correlation of chlorophyll metabolites and total tocopherol concentrations (pmol·g-1). B. Compound concentration means (log scale) of NAM parents. c, Overview of chlorophyll biosynthesis and degradation and phytol generation in maize embryos and endosperm with the protochlorophyllide reductase expression QTL indicated in red. Compounds measured are in bold black text with the four detectable chlorophyll metabolites in embryos (only chl a was measurable in endosperm) highlighted in boxes colored as in panels A and B. Other relevant compounds are in gray and relevant enzymes in black bold italics. Arrow widths represent mean gene expression (FPKM) across embryo development in B73. The black dashed arrows show the proposed route for generating phytol for tocopherol biosynthesis in maize embryos from chlorophyll biosynthetic intermediates, instead of by chlorophyll degradation. Compound abbreviations: ƩT, total tocopherols=αT+δT+γT; Chlide: chlorophyllide; Chl, chlorophyll; Pheo, pheophytin; Protochlide, protochlorophyllide; Phytyl-DP, phytyl diphosphate; GGDP, geranylgeranyl diphosphate.
!

Figure 5. Genome-wide distribution of tocochromanol joint-linkage quantitative trait loci (JL-QTL) and their pairwise epistatic interactions. From the outermost ring to the center: Black arcs show chromosomes labeled in 20 Mb increments, with small open circles marking centromeres. Gene names are as they appear in Figure 3, and are adjacent to purple and green capsules that indicate a priori and novel gene classes, respectively. Radial, light blue lines show the positions of peak markers for the 162 individual-trait QTL. Lines linking markers show significant epistatic (additive x additive) interactions, with line thickness proportional to phenotypic variance explained by the interaction term (which range from 0.3% to 4.0%). Links are colored by trait class for the interaction: yellow, tocopherols (T); orange, tocotrienols (T3); black, total tocochromanols (ΣTT3).

DOI 10.1105/tpc.17.00475; originally published online October 2, 2017;Plant Cell
S. Buckler, Torbert Rocheford, C. Robin Buell, Michael A. Gore and Dean DellaPennaBradbury, Daniel C Ilut, Maria Mateos-Hernandez, John Hamilton, Brenda F Owens, Tyler Tiede, Edward
Brieanne Vaillancourt, Elsa Góngora-Castillo, Jason G Wallace, Jason Cepela, Alex Mesberg, Peter Christine H Diepenbrock, Catherine B Kandianis, Alexander E Lipka, Maria Magallanes-Lundback,
Novel Loci Underlie Natural Variation in Vitamin E Levels in Maize Grain
This information is current as of July 6, 2018
Supplemental Data /content/suppl/2017/10/02/tpc.17.00475.DC1.html
Permissions https://www.copyright.com/ccc/openurl.do?sid=pd_hw1532298X&issn=1532298X&WT.mc_id=pd_hw1532298X
eTOCs http://www.plantcell.org/cgi/alerts/ctmain
Sign up for eTOCs at:
CiteTrack Alerts http://www.plantcell.org/cgi/alerts/ctmain
Sign up for CiteTrack Alerts at:
Subscription Information http://www.aspb.org/publications/subscriptions.cfm
is available at:Plant Physiology and The Plant CellSubscription Information for
ADVANCING THE SCIENCE OF PLANT BIOLOGY © American Society of Plant Biologists