
Novel High-Temperature Experimental Setup to Study Dynamic Surface Tension Phenomena in Oxide Melts
13
Novel High-Temperature Experimental Setup to Study Dynamic Surface Tension Phenomena in Oxide Melts Mirco Wegener,* Luckman Muhmood, Shouyi Sun, and Alex V. Deev CSIRO Process Science and Engineering, Clayton, VIC 3169, Australia * S Supporting Information ABSTRACT: In many pyrometallurgical applications, subprocesses such as emulsification, droplet, bubble or jet formation, coalescence, and surfactant adsorption occur at small time scales (typically milliseconds to fractions of seconds), both at slag/ metal and slag/gas interfaces. These phenomena are surface tension driven anddue to the high-temperature environment very difficult to investigate in a quantitative manner. Under these dynamic conditions, the instantaneous surface tension of slags may vary in time as well as along its surface and may change dramatically the rate of the involved processes. This paper presents a new high-temperature experimental setup to study and measure the dynamic surface tension of slags, the mechanisms of slag jet and droplet formation, and the capillary breakup of molten slag jets. It features a three zone furnace with optical access, and a droplet generation device incorporating a back-pressure system in combination with a stopper for precise slag flow control. The first successful results of controlled formation of calcia/alumina droplets and coherent jets in an argon environment are discussed. Various time-dependent phenomena such as droplet formation and elongation, necking, breakup, oscillation, satellite formation, and jet disintegration were investigated and quantified using a high-speed camera system. A dynamic pendant drop method was applied to determine the surface tension. The obtained values are in excellent agreement with literature data. ■ INTRODUCTION Interfacial phenomena are of fundamental importance for iron and steelmaking applications, since they have significant effect on the mass transfer and fluid dynamics and hence on the diverse reactions occurring across the interfaces. 1 For decades, the importance of interfacial phenomena has been demon- strated by numerous researchers in this field. 2−8 Detailed knowledge of those interfacial phenomena and the involved physical properties of slags is constantly accumulating, and there is a demand for reliable experimental data, including the interfacial and surface tension of the melt phases in pyrometallurgical processes. 9 In iron and steelmaking, molten slag is used for different purposes such as protection of the metal phase against atmosphere (sealing the metal from oxygen, nitrogen); removal of undesired impurities (e.g., sulfur, phosphorus), nonmetallic inclusions; reduction of heat losses; melting point reduction through optimum slag composition; low refractory interaction (e.g., protection of the lining from the arc in an Electric Arc Furnace). 10−13 Slag has a lesser density than metal and floats above the molten metal, forming an interface with the metal underneath it and an interface with the gas above it. Thus, slag is involved in most mass transfer and fluid dynamic related operations. Slags exhibit a unique range of physical properties. For example, the surface tension is usually lower than that of most metals, but far higher compared to aqueous systems, typically in the range 300−700 mN/m. 14 By contrast, the viscosity is usually far higher than that of metals, increasing drastically with decreasing temperature and increasing polymerization, or structural networking. Much attention has been paid to the metal/slag interface where the most important reactions and mass transfer processes take place, e.g. steel refining. A prominent example is the basic oxygen furnace where a jet of oxygen is blown into the steel melt to remove carbon. In vacuum degassing or refining, an inert gas is used as a stirrer to increase surface area and promote mass transfer between steel and slag during desulphurisation for instance. In both cases an emulsion of metal, slag and gas is formed. Hence, the slag/gas interface is also of particular interest. Either by the formation of carbon monoxide or by the presence of oxygen in the melt, gas bubbles form and eventually burst at the melt surface leading to the ejection of droplets or jets, as schematically shown in Figure 1, left. If the kinetic energy is high enough, a penetration crater forms at whose upper end a ligament may form with consecutive droplet detachment. The processes are quite dynamic and are controlled to a large extent by the interfacial or surface tension σ of the system. 15 Thus, its knowledge is essential for all subsequent calculations, developments of analytical models, and computational fluid dynamic (CFD) calculations. For example in emulsions, to calculate the specific surface area available for chemical reactions and heat and mass transfer, the Sauter mean diameter is required which results from the population balance equation in which surface tension plays a significant role in the breakup and coalescence kernels. 16,17 Another example of an application with strong involvement of surface tension driven phenomena at slag/gas interfaces is the granulation of blast furnace slag droplets into then amorphous (glassy) particles by a rotating disc atomizer. Received: July 15, 2013 Revised: October 23, 2013 Accepted: October 24, 2013 Published: November 8, 2013 Article pubs.acs.org/IECR © 2013 American Chemical Society 16444 dx.doi.org/10.1021/ie4022623 | Ind. Eng. Chem. Res. 2013, 52, 16444−16456
Transcript of Novel High-Temperature Experimental Setup to Study Dynamic Surface Tension Phenomena in Oxide Melts

Novel High-Temperature Experimental Setup to Study DynamicSurface Tension Phenomena in Oxide MeltsMirco Wegener,* Luckman Muhmood, Shouyi Sun, and Alex V. Deev
CSIRO Process Science and Engineering, Clayton, VIC 3169, Australia
*S Supporting Information
ABSTRACT: In many pyrometallurgical applications, subprocesses such as emulsification, droplet, bubble or jet formation,coalescence, and surfactant adsorption occur at small time scales (typically milliseconds to fractions of seconds), both at slag/metal and slag/gas interfaces. These phenomena are surface tension driven anddue to the high-temperature environmentvery difficult to investigate in a quantitative manner. Under these dynamic conditions, the instantaneous surface tension of slagsmay vary in time as well as along its surface and may change dramatically the rate of the involved processes. This paper presents anew high-temperature experimental setup to study and measure the dynamic surface tension of slags, the mechanisms of slag jetand droplet formation, and the capillary breakup of molten slag jets. It features a three zone furnace with optical access, and adroplet generation device incorporating a back-pressure system in combination with a stopper for precise slag flow control. Thefirst successful results of controlled formation of calcia/alumina droplets and coherent jets in an argon environment arediscussed. Various time-dependent phenomena such as droplet formation and elongation, necking, breakup, oscillation, satelliteformation, and jet disintegration were investigated and quantified using a high-speed camera system. A dynamic pendant dropmethod was applied to determine the surface tension. The obtained values are in excellent agreement with literature data.
■ INTRODUCTION
Interfacial phenomena are of fundamental importance for ironand steelmaking applications, since they have significant effecton the mass transfer and fluid dynamics and hence on thediverse reactions occurring across the interfaces.1 For decades,the importance of interfacial phenomena has been demon-strated by numerous researchers in this field.2−8 Detailedknowledge of those interfacial phenomena and the involvedphysical properties of slags is constantly accumulating, andthere is a demand for reliable experimental data, including theinterfacial and surface tension of the melt phases inpyrometallurgical processes.9
In iron and steelmaking, molten slag is used for differentpurposes such as protection of the metal phase againstatmosphere (sealing the metal from oxygen, nitrogen); removalof undesired impurities (e.g., sulfur, phosphorus), nonmetallicinclusions; reduction of heat losses; melting point reductionthrough optimum slag composition; low refractory interaction(e.g., protection of the lining from the arc in an Electric ArcFurnace).10−13 Slag has a lesser density than metal and floatsabove the molten metal, forming an interface with the metalunderneath it and an interface with the gas above it. Thus, slagis involved in most mass transfer and fluid dynamic relatedoperations.Slags exhibit a unique range of physical properties. For
example, the surface tension is usually lower than that of mostmetals, but far higher compared to aqueous systems, typically inthe range 300−700 mN/m.14 By contrast, the viscosity isusually far higher than that of metals, increasing drastically withdecreasing temperature and increasing polymerization, orstructural networking.Much attention has been paid to the metal/slag interface
where the most important reactions and mass transfer
processes take place, e.g. steel refining. A prominent exampleis the basic oxygen furnace where a jet of oxygen is blown intothe steel melt to remove carbon. In vacuum degassing orrefining, an inert gas is used as a stirrer to increase surface areaand promote mass transfer between steel and slag duringdesulphurisation for instance. In both cases an emulsion ofmetal, slag and gas is formed. Hence, the slag/gas interface isalso of particular interest. Either by the formation of carbonmonoxide or by the presence of oxygen in the melt, gas bubblesform and eventually burst at the melt surface leading to theejection of droplets or jets, as schematically shown in Figure 1,left. If the kinetic energy is high enough, a penetration craterforms at whose upper end a ligament may form withconsecutive droplet detachment. The processes are quitedynamic and are controlled to a large extent by the interfacialor surface tension σ of the system.15 Thus, its knowledge isessential for all subsequent calculations, developments ofanalytical models, and computational fluid dynamic (CFD)calculations. For example in emulsions, to calculate the specificsurface area available for chemical reactions and heat and masstransfer, the Sauter mean diameter is required which resultsfrom the population balance equation in which surface tensionplays a significant role in the breakup and coalescencekernels.16,17
Another example of an application with strong involvementof surface tension driven phenomena at slag/gas interfaces isthe granulation of blast furnace slag droplets into thenamorphous (glassy) particles by a rotating disc atomizer.
Received: July 15, 2013Revised: October 23, 2013Accepted: October 24, 2013Published: November 8, 2013
Article
pubs.acs.org/IECR
© 2013 American Chemical Society 16444 dx.doi.org/10.1021/ie4022623 | Ind. Eng. Chem. Res. 2013, 52, 16444−16456

Molten slag is tapped onto a spinning disc18−20 or into a cup orcylinder.21−24 Centrifugal forces push the liquid along the discto the edge where, depending on geometrical parameters andphysical properties, droplets, ligaments, or liquid sheets form(see Figure 1, upper right). Only in the ligament regime, areasonable throughput with a relatively narrow drop sizedistribution may be achieved.25 Depending on the viscous andcapillary forces (i.e., surface tension forces), the length and thecross-section of the ligaments vary. Instabilities occur which willeventually lead to ligament disintegration and consecutivedroplet formation (see Figure 1, right). The droplet size is veryimportant for process control, since the liquid droplets shouldbe as small as possible to allow for quick solidification to obtainamorphous particles, but should be large enough to avoidentrainment by off-gas flow. Particle size is also important inthe second heat recovery stage of the process whereagglomeration or formation of lumps should be avoided.19,26,27
It is well-known that solutes such as oxygen, sulfur, nitrogen,phosphorus, etc. are strongly surface active in liquid metals,and, to a lesser extent, in some slags.8 For example, sulfurlowers the surface tension of silica/alumina slags containinglime, magnesia, or barium oxide. Silica itself is surface active,much stronger effect has been observed for addition of fluorides(CaF2, NaF).
28
Yakushev et al.31 found the strongest influence on the surfacetension of CaO−Al2O3−SiO2−MgO slags by adding K2O andNa2O. In these investigations, the surface tension was halved byadding 5% of these surfactants. Skupien and Gaskell32
measured the surface tension in CaO−FeO−SiO2 slags andfound that an addition of 5% P2O5 decreased the surfacetension by roughly 17%.These examples show that surface active components change
the equilibrium surface tension. If a fresh surface is created, itmay take a finite time for the surfactant to attain theequilibrium distribution through diffusion and Marangoniconvection. The Marangoni convection is a transient effectwhich only occurs in nonequilibrium conditions. TheMarangoni convection is a chaotic, inherently three-dimen-sional andso faranalytically unpredictable phenomenonwhich in turn significantly affects the fluid dynamics and masstransfer in the respective systems.33−35
If we apply these considerations to the above examples ofdroplet breakup in slag splashing or the breakup of slag dropletsfrom ligaments in the granulation process, the time scale has tobe taken into consideration. If the time scale of theequilibrating transport processes between bulk and surface ofthe considered slag system are of the same order of magnitude(or larger) as the time scale of droplet breakup, which is likelyto be in the order of milliseconds,36,37 the equilibrium surfacetension values will not be applicable and would consequentlylead to erroneous calculations. After reviewing a considerableamount of literature data, to the authors’ best knowledge, notime-resolved surface tension measurements for molten oxideswith additions of surfactants have been published so far.However, the breakup of liquid metal jets at moderatetemperatures (<500 °C) has been investigated, for example inhigh-precision solder printing technology,38,39 dynamic surfacetension measurements of Sn/Pb jets,40,41 or influence of oxygenon the breakup of metal jets.42,43 For example, Howell et al.41
deduced from oscillating slender elliptic solder jets in oxygenatmosphere that the time scale of oxygen adsorption at theinterface is indeed of the order of 1 ms.The scope of our work is focused on the investigation of the
dynamics of surface tension driven phenomena at slag/gasinterfaces at small time scales. A high-temperature experimentaltest rig has been conceived, designed, and built, allowing opticalaccess to the hot zone for a high-speed camera system. Withthat device, time-dependent phenomena of droplets andcoherent jets of slags of various compositions at differenttemperatures can be observed optically and quantified in termsof properties such as surface tension and viscosity. Simulta-neously, droplet formation and breakup phenomena can bequantified. The experimental design allows to accomplish inprinciple four different measurement techniques: the pendantdrop method, the oscillating drop method, the drop weightmethod, and the oscillating jet method. Some first dataobtained from the pendant drop method along withquantifiable results of the drop formation, elongation, andbreakup stage with and without satellite droplet formation willbe shown. Additionally, some aspects and phenomena ofdisintegrating coherent slag jets will be presented.To summarize, the focus of this paper is to demonstrate that
the new high-temperature experimental setup is able to producesingle droplets and jets of molten slag under controlledconditions. We will show results from calcia/alumina slagswithout surfactant addition.
■ EXPERIMENTAL SETUPIn the following, the experimental device is explained whichallows the production of droplets and jets of molten slag issuingfrom a graphite capillary in a controlled manner and to recordthe phenomena by means of a high-speed camera. Thereto, fourmajor components were used: a high temperature furnace toprovide the heat, an alumina cross tube to provide opticalaccess and atmosphere control, a graphite droplet/jetgenerating device, and a high-speed camera. A number ofauxiliary items were also required, such as positioning devicesand many others.Figure 2, left, shows the electrically heated three zone vertical
tube furnace (Tetlow Kilns & Furnaces, Australia) with amaximum temperature of 1750 °C (1). It was equipped with 18Kanthal Super 1900 °C elements (molybdenum disilicide), sixin each zone. The heated length per zone is around 233 mmwhich gives a total heated zone of 700 mm. The furnace has
Figure 1. (left) Bubble bursting with consecutive formation of film orjet droplets (Reprinted with permission from the work of Hahn andNeuschutz.29 Copyright 2002 Maney Publishing, www.maneypublishing.com/journals/irs). (upper right) CSIRO’s dry slaggranulation process. Molten slag is tapped onto a spinning disc, theslag forms ligaments which consequently break into droplet cascades.(lower right) Droplets detach from long curved ligaments. Rightbefore droplet pinch-off, instabilities occur which finally lead to dropletbreakup (Reprinted with permission from the work of Dombrowskiand Lloyd.30 Copyright 1974 Elsevier).
Industrial & Engineering Chemistry Research Article
dx.doi.org/10.1021/ie4022623 | Ind. Eng. Chem. Res. 2013, 52, 16444−1645616445

provision to fit a special designed alumina tube in the form of across (2a and b) (McDanel Advanced Ceramic Technologies,USA), which is described in more details in the SupportingInformation, in order to provide optical access to the capillaryat which the droplets and jets were formed.Figure 2, right, shows the bottom section of the graphite
crucible (205 mm long, V ≈ 200 mL) with a knife-edgedcapillary (Dcap = 2 mm, length to diameter ratio L/D = 10), ahollow graphite stopper (L = 920 mm, OD = 20 mm, ID = 8mm), and a B-type thermocouple. All graphite pieces weremanufactured by Mersen Oceania. A fine grain graphite, G348grade, with high strength and density, including high resistanceto thermal shock and oxidation was used. The bottom sectionwas connected via a connector piece with the main graphitetube (L = 850 mm, OD = 80 mm). The whole graphiteassembly was attached via a water cooling cap to the liftingdevice (3), a Linak LA 28 actuator, and then loaded into thevertical alumina tube (2a). The actuator controlled the verticalposition of the graphite capillary within the vertical alumina
tube in such a way that the capillary was visible through thequartz window (4).In this crucible section, approximately 500 g of crushed
calcia/alumina slag was filled before loading into the furnacewith the stopper in its lowest position. The slag preparationprocedure is explained in the Supporting Information. Thegraphite crucible has been cleaned and dried thoroughly beforeloading.The purpose of the graphite stopper was to obstruct the
entry to the capillary section. By adjusting its vertical position,the gap between stopper and capillary inlet could be increasedor decreased. The graphite stopper was connected to a stainlesssteel rod which in turn was connected to a DC linear precisionstepper actuator (5) (Physik Instrumente GmbH, Germany).Additionally, the hollow graphite stopper housed a B-typethermocouple in twin-bore configuration sheathed by analumina tube in order to measure the temperature of the slagbath in the crucible.The slag volume flow rate was controlled by a back-pressure
system. The crucible could be pressurized by ultra high purity
Figure 2. (left) Schematic of the three zone furnace and auxiliary parts. 1: Heating chamber with 18 Kanthal Super 1900 °C elements, 700 mmheated zone. 2a: Vertical alumina tube. 2b: Horizontal alumina tube with water cooling flanges and protection gas inlets. 3: Graphite crucible liftingassembly, 4: Quartz window. 5: Precision linear actuator to position graphite stopper. 6: Precision pressure regulator. 7: Differential pressuretransducer. 8: Safety relief valve. 9: Needle valve. 10: Bubbler L2 line. 11: Ultra high purity argon supply. 12: Balance chamber with stainless steel cupto collect slag droplets, protection gas inlet, and water cooling flange. 13: Top water cooling end-cap of vertical alumina tube. 14: Bubbler L1 line. 15:Bottom water cooling end-cap of vertical alumina tube, main support flange, connected to the furnace body. 16: Metal bellows. 17: High-speedcamera and computer. 18: Oxygen probe with R-type thermocouple. (right) Bottom section of graphite crucible. This section may contain up to 500g of slag. The stopper obstructs the entry to the capillary. Within the stopper, a thermocouple type B sheathed by an alumina tube was kept. Thetapered base facilitated the slag flow to the capillary section.
Industrial & Engineering Chemistry Research Article
dx.doi.org/10.1021/ie4022623 | Ind. Eng. Chem. Res. 2013, 52, 16444−1645616446
argon up to 2 bar. The pressure was adjusted and controlled bya precision pressure regulator (6) (Norgren, Australia). Adifferential pressure transducer (7) (First Sensor, Germany)measured the pressure difference between graphite crucible andalumina tube. A pressure relief valve (8) was located at theoutlet, as well as a needle valve (9) and a bubbler (10).Figure 2, left, also gives an overview of the gas delivery
system (11). For all experiments, ultra high purity argon (BOC,Australia) was used. The flow was divided in two separate lines,L1 and L2. L1 was used to purge the alumina cross tube withargon via three inlets: one at the balance chamber (12), andtwo at each of the horizontal cooling end-caps. The purging gasexited at the top flange (13) and passed through a bubbler (14).The second line, L2, was used to provide the pressure for thegraphite crucible as explained above.Below the furnace, a collection and weighing chamber is
located (12). The lower end of the vertical alumina tube sits onan O-ring assembly enclosed by a water cooling jacket (15). Amultiple flange sealing assembly provides the connection to theweighing chamber via metal bellows (16). Inside this chamber,a precision balance (Sartorius, Germany) with a readability of10 mg and a weighing capacity of 3200 g was located andconnected to a computer via gastight cable connectors. Thebalance was operated using the Sartorius SartoCollect softwarev1.03 with a sample rate of ten readings per second.The balance chamber was purged with argon, and the
balance pan was protected by a deflector. On the balance panrested a graphite stand onto which a stainless steel cup was kept(not visible in Figure 2). The graphite stand was made of threepieces to fit through a narrow water cooled body to form a heatshield to keep the temperature inside the balance chamberbelow 50 °C. The stainless steel cup was used to collect theslag. Its inner surface has been polished carefully in order tofacilitate slag recovery after completion of experiments.Data Acquisition. The high-speed camera (17) used for
the experiments was a Phantom v3.11 (Vision Research). It wasequipped with a 1280 × 800 pixels monochrome CMOS sensor(25.6 × 16.0 mm) with a maximum speed of 3250 fps at fullresolution (and up to 500 000 fps at reduced resolutions). Thepixel size is 20 μm. In this study, all experiments were carriedout at 12 bit. The camera had a high-speed internal RAM of 16GB. The internal memory could be shifted to the PhantomCineMag interface, a nonvolatile storage device with a capacityof 128 GB within approximately 30 s. Eight data packages of 16GB could be stored in the CineMag which allowed to capture arelatively large amount of data without significant time loss.After completion of experiments, the data were transferredfrom the CineMag to the hard disc of a computer. For dataanalysis, the image processing tool Image-Pro Plus 6.3 (MediaCybernetics) was used. The general automated image treatmentprocedure is explained in more detail in the section Methods,Data, and Image Analysis.As can be seen in the general experimental setup, the
distance from the quartz window (4) to the capillary in thecenter of the furnace was around 500 mm; hence, a longworking distance lens with high magnification was required. AnInFocus KC/ST Video Microscope lens system (Infinity, USA)was used. The lens was equipped with a MidOpt short-passSP700 hot mirror block filter to block IR radiation.Experimental Procedure and Data Analysis. The
furnace was heated up to target temperature with a heatingrate of 5 °C min−1. During this process, argon was purgedthrough the crucible assembly to remove other gases.
Overpressure was verified optically by the bubblers. At targettemperature, the stopper was attached carefully to the precisionactuator after thermal expansion of the graphite and aluminaparts. In order to initiate slag flow, the pressure was increasedto a desired pressure difference. The stopper was lifted and slagpenetrated through the gap between stopper and bottom hole.A sequence was recorded to the RAM of the high-speedcamera. The maximum frame rate used in the experiments was11 000 fps at 90 μs exposure time, but in principle considerablyhigher frame rates were possible as the slag droplets/jets wereso bright at the experimental temperature that additionallighting was not required. The resolution was set to 1280 pixel× 288 pixel with 1280 pixel representing the drop falling axis(camera was turned by 90°). The resulting scale was 31.02 pixelmm−1 corresponding to a field of view of 41.26 mm × 9.28 mm.After recording, the stopper was then lowered to stop the flowand data transfer was initiated. A new sequence could then berecorded with a new set of parameters.
Methods, Data, and Image Analysis. The images ofinterest were extracted from the original video file and storedseparately after adjusting brightness, contrast, gain, andsensitivity to minimize blurring effects. Depending on framerate and length of the part of the sequence of interest, severalthousand images had to be analyzed. This was achieved by anautomated and macro assisted image processing step. Withinthe macro-environment of the image processing software,interactions with Microsoft EXCEL was enabled for furthercalculations.
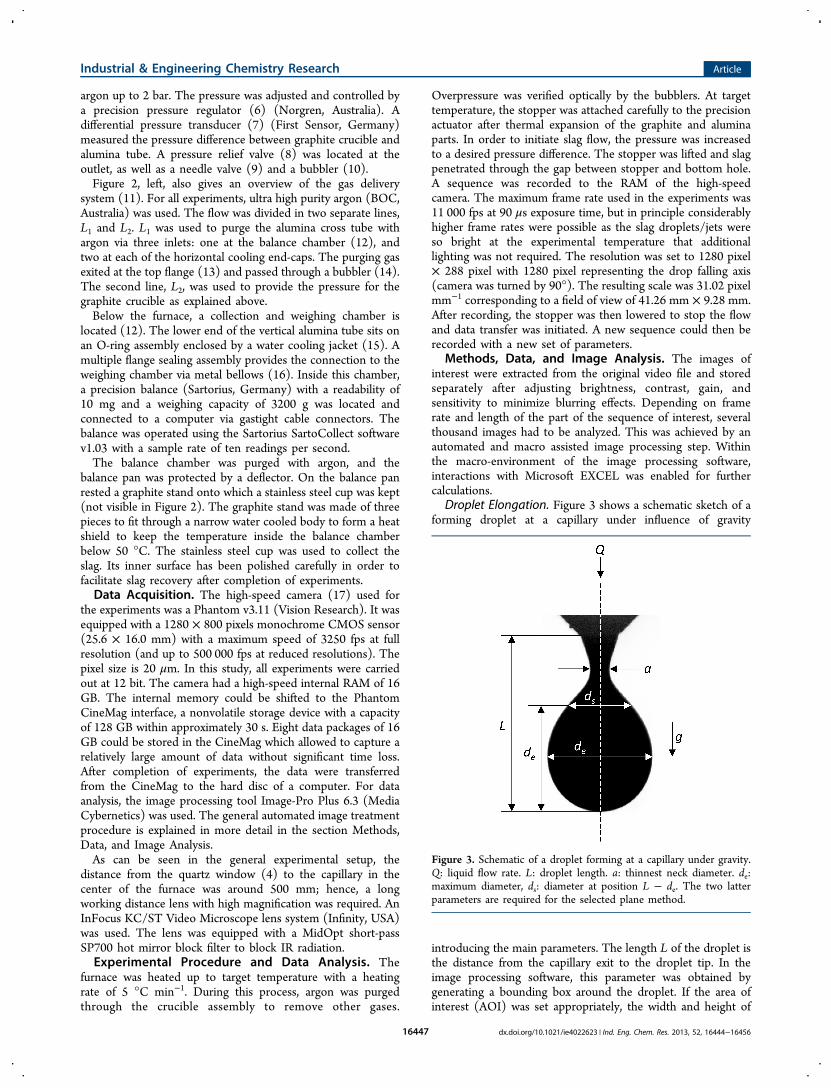
Droplet Elongation. Figure 3 shows a schematic sketch of aforming droplet at a capillary under influence of gravity
introducing the main parameters. The length L of the droplet isthe distance from the capillary exit to the droplet tip. In theimage processing software, this parameter was obtained bygenerating a bounding box around the droplet. If the area ofinterest (AOI) was set appropriately, the width and height of
Figure 3. Schematic of a droplet forming at a capillary under gravity.Q: liquid flow rate. L: droplet length. a: thinnest neck diameter. de:maximum diameter, ds: diameter at position L − de. The two latterparameters are required for the selected plane method.
Industrial & Engineering Chemistry Research Article
dx.doi.org/10.1021/ie4022623 | Ind. Eng. Chem. Res. 2013, 52, 16444−1645616447

the bounding box represented length and width of the droplet,respectively. This gave L = f(t).Necking. The parameter a in Figure 3 represents the
minimum diameter of the liquid thread (or neck) whichconnects the main droplet with the remaining liquid at thecapillary at a given point in time. To obtain this parameter in anautomated manner, an area of interest with two pixels widthiterated over each image covering the range from capillary tip todroplet tip. The bounding box height of each AOI section wasthen written to EXCEL, and a Visual Basic based macro foundthe minimum bounding box height for each image. This gave a= f(t).Pendant Drop Method. We used the selected plane method
with tabulated data reflecting the droplet shape parame-ters.44−47 Bidwell et al.48 extended the tables to a largerparameter range, taking also droplets with high surface tension(like metals or likewise) into account. Using the selected planemethod, the only droplet shape parameters required were themaximum droplet width de and the diameter ds at the height deabove the droplet tip, as shown in Figure 3. The ratio S = ds/deis a function of the physical properties of the liquid. With S onegets the parameter H−1, which is available in tabulated form.48
With H−1, the surface tension can be calculated with
σ ρ= −g d He2 1
(1)
Figure 4 shows H−1 as a function of S. Within the range of S= [0.5−0.98], the data points can be approximated with
negligible error using the power law function H−1 = mSn, withm = 0.3143 and n = −2.6278. A macro procedure wasdeveloped which extracted the values de and ds for every image.Finally, the surface tension was calculated as a function of timeassuming the dynamic pressure associated with the inflow ofthe liquid was small and the shape of the droplet wasdetermined by the surface tension alone.The surface tension is in general sensitive to impurities or the
presence of surfactants. Also the wetting behavior at thecapillary has to be taken into consideration. The latter issometimes circumvented by melting droplets from a rod of thesame material using a focused heat source14 or by dropletshanging on inert rods.47 Mukai and Ishikawa49 used thependant drop method for slags. They examined droplet sizes ofaround 2.8 mm. The results for surface tension of calcia/alumina melts with different silica concentrations at 1600 °C in
argon show reasonable agreement within the scatter ofpresented data from other authors. Experiments in oxidisingatmosphere showed only a slight effect on the surface tensionvalues. The temperature coefficient changed from negative topositive above silica concentrations of 40 mol % in inertatmosphere for a fixed calcia/alumina ratio.The pendant drop method gives surface tension values for
surface ages of the order of fractions of seconds and older. Thependant drop method is an optical measurement technique andgives additional insight of the fluid dynamics of dropletformation and separation.
Satellite Droplets. The satellite droplet formation occursfrom secondary breakup of the liquid thread connecting themain droplet and the remaining liquid at the capillary within avery limited number of frames (within the order of 10 frames at9000 fps) at small length scales. Satellites did not appear in allsequences, so it was decided to obtain the length of the liquidthread before breakup, the speed of the retreating thread, andthe diameter and number of satellites using the imageprocessing software manually for every image.
Drop Size Distribution. The number frequency distributionof formed main and satellite droplets from a verticaldisintegrating slag jet is finally presented. Again, a macro waswritten to facilitate the analysis of the relevant parameters suchas area, aspect ratio and diameter, the first two were mainlyused to filter already formed droplets from elongated orstretched objects not suitable for diameter determination. Inthis regard, only objects with an aspect ratio between 0.5 and1.5 were taken into consideration in the analysis. Furthermore,counting and analysis were carried out on a subsample of one of150 images. The 150 images gap was chosen to avoid dropletsto be counted multiple times.
■ RESULTS AND DISCUSSIONDroplet Formation. Figure 5 shows a sequence of a slag
droplet forming at a 2.0 mm graphite capillary in argonatmosphere. The pattern was found to be highly repetitive forall droplets formed in a recorded sequence. The volume flowrate in this case was 15.8 mL min−1 which corresponds to acapillary Reynolds number Re ≈ 3. The temperature measuredby the thermocouple within the graphite stopper was 1570 °C,and the oxygen partial pressure was of the order of 10−8 atm.For all subsequent calculations, the density and viscosity werecalculated according to interpolations using data from Mukaiand Ishikawa49 and Urbain,50 respectively, who performedmeasurements of calcia/alumina slags with nearly identicalcomposition. We used the following equations
ρ = − ϑ +− 0.38 3350(CaO Al O )2 3 (2)
μ = × ϑ−−4.26 10(CaO Al O )
28 9.2082 3 (3)
with [ρ] = kg m−3, [μ] = Pa s, and [ϑ] = °C. With time, thedroplet elongates. The droplet length L is shown in Figure 6 asa function of the reversed time, i.e. the time counting backwardfrom the droplet detachment for three different temperaturesfor the same pressure difference (0.1 bar). The lower thetemperature, the longer the droplet formation time. For highertemperatures, the viscosity is lower; hence, the droplet growsfaster. The droplet length at detachment is about twice as largeas the diameter of the corresponding sphere of the detachedmain droplet. The mean diameter of the main droplets has beenfound to be around 6.2 mm. The volume of the formed droplet
Figure 4. Parameter H−1 as a function of S = ds/de as tabulated byBidwell et al.48
Industrial & Engineering Chemistry Research Article
dx.doi.org/10.1021/ie4022623 | Ind. Eng. Chem. Res. 2013, 52, 16444−1645616448

can be predicted with the empirical equation by Scheele andMeister,51 although initially developed for water droplets inair:52
πσρ π
σ
ρ= Φ − +
⎡
⎣⎢⎢
⎛⎝⎜⎜
⎞⎠⎟⎟
⎤
⎦⎥⎥V
R
gQ
gR
Q R
g
2 43
7.14P HBcap
2
cap2
2cap
2
2
1/3
(4)
With the Harkins and Brown correction factor ΦHB (Rcap/VP
1/3 = 0.2) = 0.8, calculated from the Lee−Chang−Pogaku(LCP) model,53 ρ = 2753 kg m−3 (eq 2), σ = 0.6 N m−1,54 Q =15.8 mL min−1, and Rcap = 1 mm, the predicted volumecorresponds to a droplet with the diameter dpred = 6.45 mm,which is in agreement with the observed diameter within 4%.As the droplet elongates, the liquid thread which connects
the main droplet with the remaining liquid attached to thecapillary gets thinner with time, stretched by the weight of the
primary droplet; see t = 441.7 ms in Figure 5. The Laplacepressure is highest at largest curvature which appears at thelower end of the thread which connects with the main droplet.It is here where the breakup occurs. The thread is now free atone end, see t = 442.5 ms in Figure 5 and is retracted quickly bysurface tension forces until it coalesces completely with theremaining liquid at the capillary with subsequent oscillation ofthe formed hanging droplet. The length of the thread in thiscase was 2.1 mm at detachment time, and the maximum threadretraction velocity was found to be around 4.2 m s−1.Figure 7 shows the temporal change of the diameter of the
liquid thread at its thinnest point as a function of time for the
three different temperatures. Again, the influence of viscosity isapparent. The lower the temperature, the thinner the threadbefore detachment. For the lowest temperature (1470 °C),there is a relatively long period of stretching. The diameter atdetachment is comparable to the 1520 °C case (around 32μm), but three times smaller than for the 1570 °C case. For allthree cases, it seems that the stretching process can be divided
Figure 5. Time sequence of a calcia/alumina droplet forming at a graphite capillary (Dcap,i = 2 mm) in argon atmosphere at 1570 °C. No satelliteswere formed in this case. The time of the first frame was set arbitrarily to 0 ms. The diameter of the detached main droplet is ≈6.2 mm.
Figure 6. Droplet length L as a function of the reversed time td − twith td being the time of detachment for different temperatures. Again,the figure shows results of a calcia/alumina droplet formed at agraphite capillary (Dcap,i = 2 mm) in argon atmosphere. The amount ofdata points has been reduced to ensure clearness of the figure. Foreach temperature, only one sequence is shown for convenience, but alldroplets in one sequence behave likewise.
Figure 7. Minimum thread diameter as a function of the reversed timetd − t for three different temperatures. Similar to Figure 6, the amountof data points has been reduced to ensure clearness of the figure.Again, the pattern shown here was found to be highly repetitive.
Industrial & Engineering Chemistry Research Article
dx.doi.org/10.1021/ie4022623 | Ind. Eng. Chem. Res. 2013, 52, 16444−1645616449
in two sections, as indicated by the two lines for the datarepresenting the highest temperature. The slope increasestoward the detachment, which underlines the faster dynamics inthe last 5 ms.This two stage droplet formation process was described
previously by different authors.51,52,55,56 In these works, the twostage process was described as follows: During the first stage,the droplet growth is purely static. The droplet elongates untilthe gravity force balances the surface tension force. Finally, thefirst stage ends with the loss of equilibrium of forces whennecking phenomena become important. In the followingsecond stage, the necking occurs which eventually leads todroplet detachment from the capillary. During detachmentfrom the capillary, the drop continues to grow.After detachment, both liquid bodies are oscillating. The
remaining liquid oscillates by the force of the retracting thread,and the main droplet oscillates to recover from its elongation.In both cases, the oscillations are dampened quickly due to thehigh viscosity of the liquid slag. In contrast to the remainingliquid, the main droplet is now in free fall, accelerated bygravity.Within the visible path, the droplet does not reach its
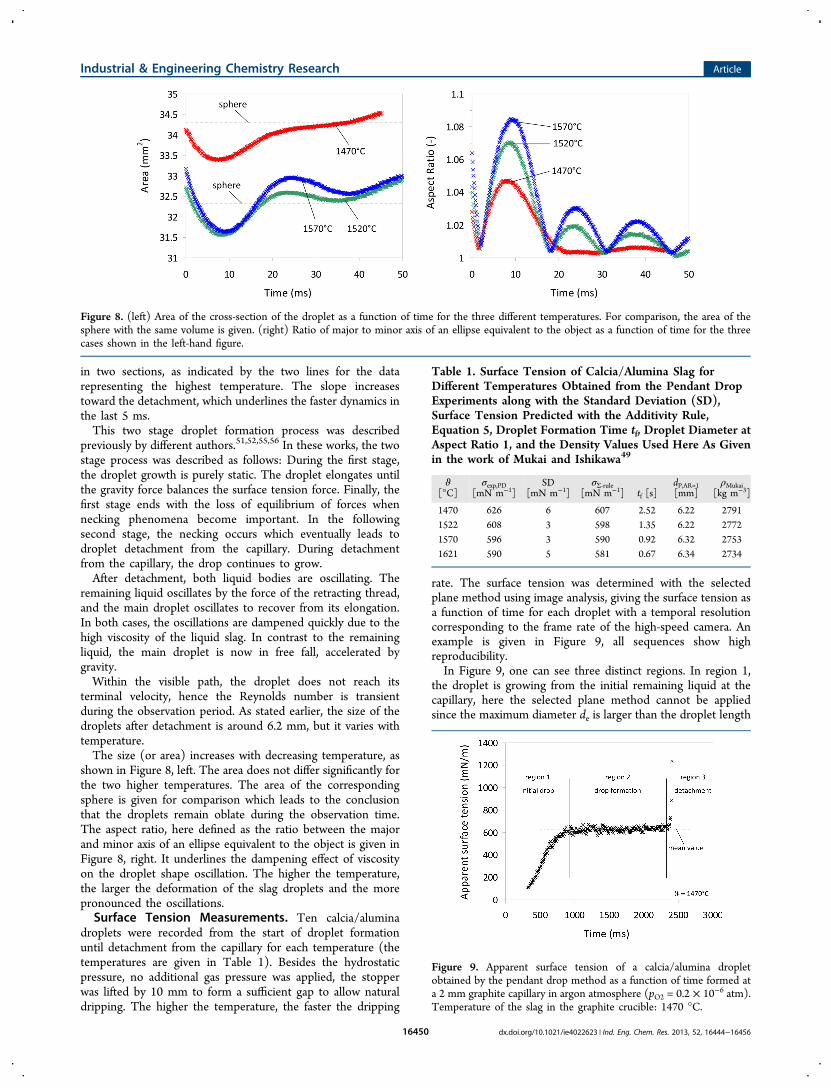
terminal velocity, hence the Reynolds number is transientduring the observation period. As stated earlier, the size of thedroplets after detachment is around 6.2 mm, but it varies withtemperature.The size (or area) increases with decreasing temperature, as
shown in Figure 8, left. The area does not differ significantly forthe two higher temperatures. The area of the correspondingsphere is given for comparison which leads to the conclusionthat the droplets remain oblate during the observation time.The aspect ratio, here defined as the ratio between the majorand minor axis of an ellipse equivalent to the object is given inFigure 8, right. It underlines the dampening effect of viscosityon the droplet shape oscillation. The higher the temperature,the larger the deformation of the slag droplets and the morepronounced the oscillations.Surface Tension Measurements. Ten calcia/alumina
droplets were recorded from the start of droplet formationuntil detachment from the capillary for each temperature (thetemperatures are given in Table 1). Besides the hydrostaticpressure, no additional gas pressure was applied, the stopperwas lifted by 10 mm to form a sufficient gap to allow naturaldripping. The higher the temperature, the faster the dripping
rate. The surface tension was determined with the selectedplane method using image analysis, giving the surface tension asa function of time for each droplet with a temporal resolutioncorresponding to the frame rate of the high-speed camera. Anexample is given in Figure 9, all sequences show highreproducibility.In Figure 9, one can see three distinct regions. In region 1,
the droplet is growing from the initial remaining liquid at thecapillary, here the selected plane method cannot be appliedsince the maximum diameter de is larger than the droplet length
Figure 8. (left) Area of the cross-section of the droplet as a function of time for the three different temperatures. For comparison, the area of thesphere with the same volume is given. (right) Ratio of major to minor axis of an ellipse equivalent to the object as a function of time for the threecases shown in the left-hand figure.
Table 1. Surface Tension of Calcia/Alumina Slag forDifferent Temperatures Obtained from the Pendant DropExperiments along with the Standard Deviation (SD),Surface Tension Predicted with the Additivity Rule,Equation 5, Droplet Formation Time tf, Droplet Diameter atAspect Ratio 1, and the Density Values Used Here As Givenin the work of Mukai and Ishikawa49
ϑ[°C]
σexp,PD[mN m−1]
SD[mN m−1]
σΣ‑rule[mN m−1] tf [s]
dP,AR=1[mm]
ρMukai[kg m−3]
1470 626 6 607 2.52 6.22 27911522 608 3 598 1.35 6.22 27721570 596 3 590 0.92 6.32 27531621 590 5 581 0.67 6.34 2734
Figure 9. Apparent surface tension of a calcia/alumina dropletobtained by the pendant drop method as a function of time formed ata 2 mm graphite capillary in argon atmosphere (pO2 = 0.2 × 10⁻⁶ atm).Temperature of the slag in the graphite crucible: 1470 °C.
Industrial & Engineering Chemistry Research Article
dx.doi.org/10.1021/ie4022623 | Ind. Eng. Chem. Res. 2013, 52, 16444−1645616450
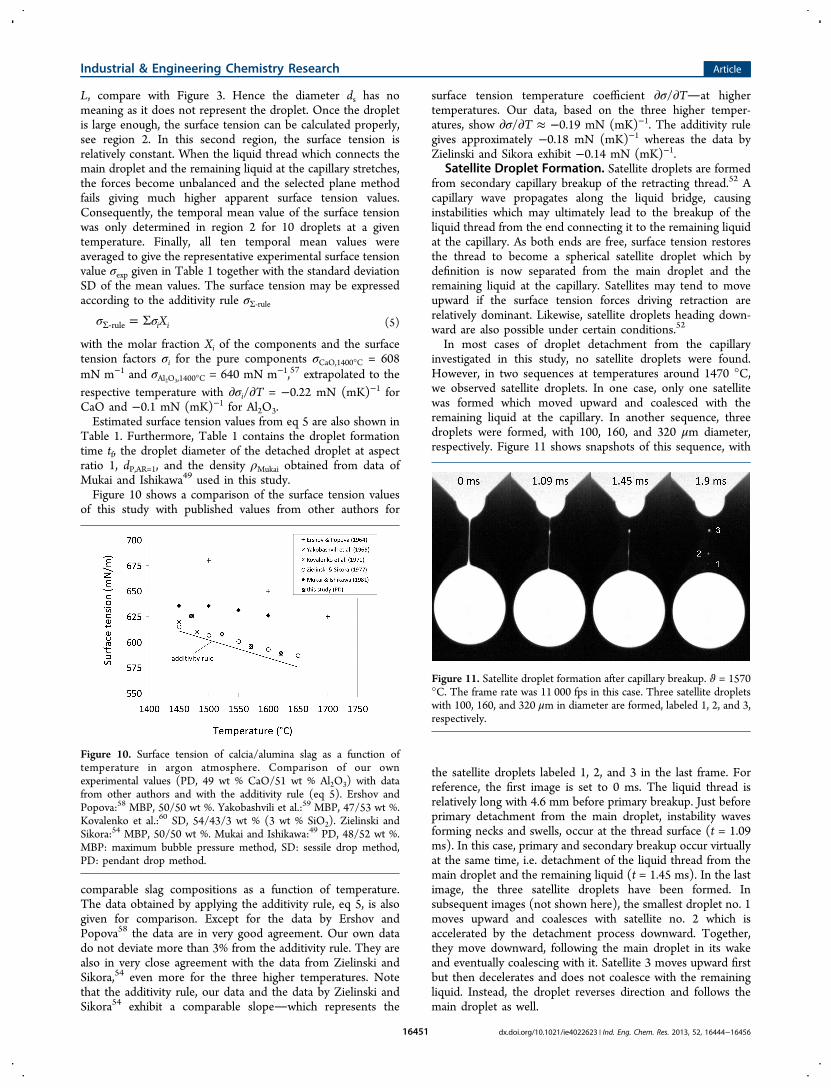
L, compare with Figure 3. Hence the diameter ds has nomeaning as it does not represent the droplet. Once the dropletis large enough, the surface tension can be calculated properly,see region 2. In this second region, the surface tension isrelatively constant. When the liquid thread which connects themain droplet and the remaining liquid at the capillary stretches,the forces become unbalanced and the selected plane methodfails giving much higher apparent surface tension values.Consequently, the temporal mean value of the surface tensionwas only determined in region 2 for 10 droplets at a giventemperature. Finally, all ten temporal mean values wereaveraged to give the representative experimental surface tensionvalue σexp given in Table 1 together with the standard deviationSD of the mean values. The surface tension may be expressedaccording to the additivity rule σΣ‑rule
σ σ= ΣΣ‐ Xi irule (5)
with the molar fraction Xi of the components and the surfacetension factors σi for the pure components σCaO,1400°C = 608mN m−1 and σAl2O3,1400°C = 640 mN m−1,57 extrapolated to therespective temperature with ∂σi/∂T = −0.22 mN (mK)−1 forCaO and −0.1 mN (mK)−1 for Al2O3.Estimated surface tension values from eq 5 are also shown in
Table 1. Furthermore, Table 1 contains the droplet formationtime tf, the droplet diameter of the detached droplet at aspectratio 1, dP,AR=1, and the density ρMukai obtained from data ofMukai and Ishikawa49 used in this study.Figure 10 shows a comparison of the surface tension values
of this study with published values from other authors for
comparable slag compositions as a function of temperature.The data obtained by applying the additivity rule, eq 5, is alsogiven for comparison. Except for the data by Ershov andPopova58 the data are in very good agreement. Our own datado not deviate more than 3% from the additivity rule. They arealso in very close agreement with the data from Zielinski andSikora,54 even more for the three higher temperatures. Notethat the additivity rule, our data and the data by Zielinski andSikora54 exhibit a comparable slopewhich represents the
surface tension temperature coefficient ∂σ/∂Tat highertemperatures. Our data, based on the three higher temper-atures, show ∂σ/∂T ≈ −0.19 mN (mK)−1. The additivity rulegives approximately −0.18 mN (mK)−1 whereas the data byZielinski and Sikora exhibit −0.14 mN (mK)−1.
Satellite Droplet Formation. Satellite droplets are formedfrom secondary capillary breakup of the retracting thread.52 Acapillary wave propagates along the liquid bridge, causinginstabilities which may ultimately lead to the breakup of theliquid thread from the end connecting it to the remaining liquidat the capillary. As both ends are free, surface tension restoresthe thread to become a spherical satellite droplet which bydefinition is now separated from the main droplet and theremaining liquid at the capillary. Satellites may tend to moveupward if the surface tension forces driving retraction arerelatively dominant. Likewise, satellite droplets heading down-ward are also possible under certain conditions.52
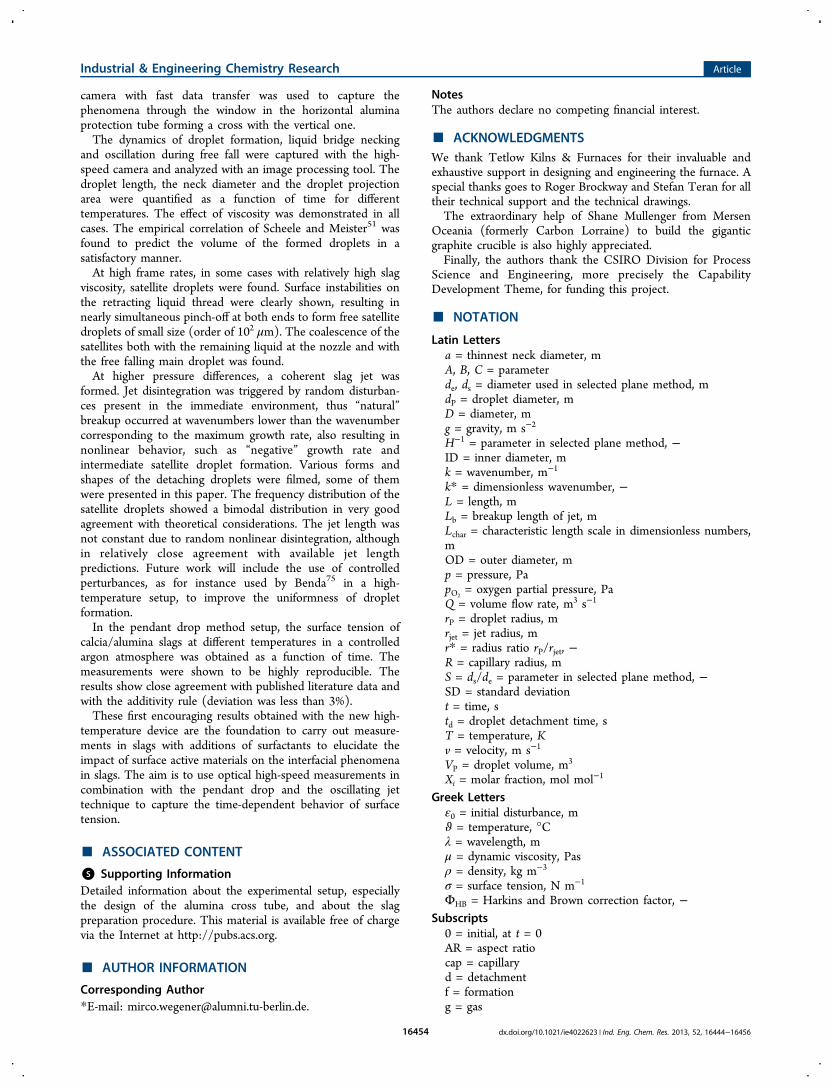
In most cases of droplet detachment from the capillaryinvestigated in this study, no satellite droplets were found.However, in two sequences at temperatures around 1470 °C,we observed satellite droplets. In one case, only one satellitewas formed which moved upward and coalesced with theremaining liquid at the capillary. In another sequence, threedroplets were formed, with 100, 160, and 320 μm diameter,respectively. Figure 11 shows snapshots of this sequence, with
the satellite droplets labeled 1, 2, and 3 in the last frame. Forreference, the first image is set to 0 ms. The liquid thread isrelatively long with 4.6 mm before primary breakup. Just beforeprimary detachment from the main droplet, instability wavesforming necks and swells, occur at the thread surface (t = 1.09ms). In this case, primary and secondary breakup occur virtuallyat the same time, i.e. detachment of the liquid thread from themain droplet and the remaining liquid (t = 1.45 ms). In the lastimage, the three satellite droplets have been formed. Insubsequent images (not shown here), the smallest droplet no. 1moves upward and coalesces with satellite no. 2 which isaccelerated by the detachment process downward. Together,they move downward, following the main droplet in its wakeand eventually coalescing with it. Satellite 3 moves upward firstbut then decelerates and does not coalesce with the remainingliquid. Instead, the droplet reverses direction and follows themain droplet as well.
Figure 10. Surface tension of calcia/alumina slag as a function oftemperature in argon atmosphere. Comparison of our ownexperimental values (PD, 49 wt % CaO/51 wt % Al2O3) with datafrom other authors and with the additivity rule (eq 5). Ershov andPopova:58 MBP, 50/50 wt %. Yakobashvili et al.:59 MBP, 47/53 wt %.Kovalenko et al.:60 SD, 54/43/3 wt % (3 wt % SiO2). Zielinski andSikora:54 MBP, 50/50 wt %. Mukai and Ishikawa:49 PD, 48/52 wt %.MBP: maximum bubble pressure method, SD: sessile drop method,PD: pendant drop method.
Figure 11. Satellite droplet formation after capillary breakup. ϑ = 1570°C. The frame rate was 11 000 fps in this case. Three satellite dropletswith 100, 160, and 320 μm in diameter are formed, labeled 1, 2, and 3,respectively.
Industrial & Engineering Chemistry Research Article
dx.doi.org/10.1021/ie4022623 | Ind. Eng. Chem. Res. 2013, 52, 16444−1645616451

Observations on Jet Formation and Disintegration. Inthis section, first results of molten slag jets showing Rayleighinstabilities and consecutive breakup are presented. Thetemperature was ϑ = 1570 °C. Sequences of around 3 s at aframe rate of 9000 fps and 60 μs shutter speed were recorded.The field of view and all experimental boundary conditionswere the same as described above. Only the pressure differencewas increased to effect the transition from dripping to jettingregime. Following Lindblad and Schneider,61 the minimumvelocity necessary to form a jet can be calculated with vmin =(8σ/[ρjetdjet])
1/2. With ρ = 2750 kg m−3 and σ = 0.6 N m−1, weobtain a minimum velocity vmin = 0.93 m s−1 for a 2 mmdiameter capillary, assuming that the jet diameter is equal to theinner capillary diameter. At minimum velocity, the expectedbreakup length Lb can be calculated according to the followingequation:62,63
ε= +
⎛⎝⎜
⎞⎠⎟⎡⎣⎢⎢
⎤⎦⎥⎥
Ld
RWe
We
Reln 3b
jet 0jet
jet
jet (6)
which gives an anticipated breakup length of ≈8.5 cm if the slagviscosity μ is set to 0.16 Pas, see eq 3, and ln(R/ε0) = 12.64
According to Lindblad and Schneider61 referring to theHagen−Poiseuille equation, the required pressure is equal topmin = 32Lcapμνmindjet
−2 = 0.23 bar with a capillary length Lcap =20 mm. In our setup, however, a jet could only be obtainedwith pressures >0.25 bar, hence we chose a pressure differenceof p = 0.35 bar for our experiments.There was no imposed external excitation, hence “natural”
breakup was observed triggered by the inherently presentperturbations from the surroundings (e.g., heating elements,fans in outer shell, pressure fluctuations of purging gas,vibrations, etc.) in all sequences. Consequently, the jet lengthis not constant as it would be using an external perturbation at aspecified frequency corresponding to the maximum growth rateof the system. Hence, in our case, the unbroken jet length variesconsiderably depending on the actual degree of external“arbitrary” perturbations. The shortest jet length found fromthe recorded sequence was 9.5 cm which is slightly above butclose the predicted value from eq 6.Figure 12 shows a sequence of images of a disintegrating
calcia/alumina jet. The time difference between each image is1.55 ms, the camera position is constant. Necks and swells havedeveloped as a consequence of the growth of instabilities. The
wavelength λ is the distance between two necks (or swells) andis marked in the figure. The wavelength does not changedramatically with time. In the first image, λ was measured to be13.25 mm. The corresponding dimensionless wavenumber is k*= kR = 0.47. The theoretical wavenumber corresponding to themaximum growth rate applying the long-wave description forthe viscous case65
* = =+
k k ROh
1
2 3 2max
(7)
with the Ohnesorge number Oh = μ(ρσR)−1/2 ≈ 0.12 (basedon the capillary radius R), yields k* = 0.63, a clear indicationthat the natural breakup triggered by the backgrounddisturbances does not lead to optimal breakup with minimumbreakup length.The growth of the first swell leads to droplet separation as
shown in the last frame in Figure 12. The remaining liquidunderneath the formed droplet will retract and form also aseparate droplet, resulting in multiple droplet formation.According to Rayleigh’s theory,66 the most unstable wavecauses the jet breakup in the case of a naturally breaking jet.Jets break into droplets when the perturbation amplitude
exceeds the jet radius, and ideally, one droplet is formed byeach wavelength of the disturbance.67 Hence, the resultingdroplet diameter can be estimated with67−69
=d d1.89P jet (8)
which gives a theoretical droplet diameter of 3.78 mm for a 2mm jet. Figure 13 shows the frequency distribution of dropletsformed from a disintegrating calcia/alumina jet, again with djet =2 mm at 1570 °C.
Every 150th frame out of 27 000 frames (corresponding to a3 s sequence at 9000 fps) has been analyzed. Only objects withan aspect ratio between 0.5 and 1.5 have been measured. 312objects meeting these criteria have been found, the maximumfrequency being in the interval 3.4−3.5 mm which is onlyslightly smaller than the theoretical value. 67% of all dropletswere between 3.2 and 3.8 mm.
Figure 12. Sequence of a liquid calcia/alumina slag jet exhibiting necksand swells due to instability growth. The wavelength λ is given as anexample in the first image with λ = 13.25 mm (k* = kR = 0.47). Thetime difference between each image is 1.55 ms, the temperature was1570 °C, the pressure difference was set to 0.35 bar.
Figure 13. Number frequency distribution of a disintegrating calcia/alumina jet emerging from a 2 mm graphite capillary plotted over thedroplet mean diameter. The theoretical diameter of the main dropletas predicted by the linear stability analysis can be obtained from eq 8and gives 3.78 mm. The peak representing the main droplet is around3.4−3.5 mm. The distribution is bimodal, the peak at around 1.8−1.9mm reflects the size of the satellite droplets.
Industrial & Engineering Chemistry Research Article
dx.doi.org/10.1021/ie4022623 | Ind. Eng. Chem. Res. 2013, 52, 16444−1645616452

A smaller peak representing the satellite droplets is locatedaround the class 1.8−1.9 mm, thus very close to the jet orcapillary diameter, respectively. One finds dmain/dsat ≈ 1.9. Thenumber of satellite droplets is considerably smaller, roughly 7%of the total number of droplets belong to this group, 21% of alldroplets are smaller than 3 mm. The linear stability analysis failsat the point of jet breakup and cannot predict the occurrenceand size of satellite droplets,67 and nonlinear terms have to beintroduced to predict satellite droplet formation fromdisintegrating liquid jets.70 Theoretical considerations weresupported by water jet experiments and showed that the ratioof the size of main droplets to the size of satellite droplets variesin a characteristic manner with the dimensionless wavenumberof the perturbation. The larger the wavenumber (the shorterthe wavelength), the smaller the satellite droplets become. Forvery low wavenumbers, the satellites were found to be evenbigger than the main droplets.70−72 Viscosity has stabilizingeffects on the liquid thread which leads to fewer and smallersatellite droplets than compared to less viscous liquids.72
If the theoretical curves in Figure 4 in the paper presented byLafrance70 were applied with the therein defined ordinate r* =rP/rjet, one would obtain r* ≈ 1.7 for the main droplet, andhence k* > 1 which suggests that no satellites could be formed.It seems that the figure cannot be applied for highly viscousslags, but interestingly, if k* = kR = 0.47 from our experimentsis used and if the ratio of the sizes of main to satellite dropletsfrom the theoretical curves from Figure 4 in the paper byLafrance70 at that wavenumber is calculated, one obtainsapproximately r* = rmain/rsat = dmain/dsat ≈ 2.05/1.075 = 1.9,which is in astonishing agreement with the ratio between mainand satellite droplets obtained from the disintegrating slag jet(see Figure 13).Unfortunately, the images obtained from the sequences did
not permit the determination of the growth rate. As can be seenfrom Figure 12, the sequence is a nonlinear example for a“negative” growth rate since the diameter of the lower swells issmaller than the diameter of the upper swells. Or, in otherwords, the swell further upstream grows faster in time than theone further downstream leading finally to intermediate dropletbreakup as described above. Hence, a surface tensioncalculation based on the evolution of neck and swell diameteralong the jet axis as described in literature (see, e.g., inDonnelly and Glaberson73 or Ronay74) was not possible.Figure 14 shows the intermediate breakup in more detail.
Again, breakup between two swells occurred, and a dumbbell-
shaped liquid thread with two loose ends is formed. With time,the thread retracts and forms an oblate droplet which oscillatesshortly around its spheroidal shape. Below the dumbbell-shapeddroplet, two more droplets have already formed. The threedroplets are quite different in size, the mean diameter are 2.16,3.74, and 1.41 mm, from top to bottom, respectively.Another example of a breakup mechanism is shown in Figure
15. Here, the middle droplet detaches from the droplet above it
which is still connected via a liquid ligament with the main jet.The middle droplet exhibits a bulbous or an upside down“microphone”-like shape, a more or less cone-shaped dropletwhich relaxes quickly to form an oblate shaped droplet. The lastexample, Figure 16, shows coalescence between a smaller and a
larger droplet. After reviewing a large number of differentcoalescence phenomena, it never occurred that coalescence wasnot successful. In other words, a rebound was never observed inall screened cases.
■ SUMMARY AND OUTLOOKWe presented in this paper a new high-temperature measure-ment device which has been designed to investigate thedynamics of surface tension driven phenomena of dropletformation and jet disintegration of liquid slags. Thesephenomena comprise droplet elongation, liquid bridge necking,satellite droplet formation, detachment, formation of insta-bilities, oscillation, and coalescence. The test liquid system inthis study was a 49/51 wt % calcia/alumina slag kept in agraphite crucible emerging from a nonwetting graphite capillaryinto the argon purged heating chamber. Slag flow and dropletformation could be controlled precisely and in a highlyrepetitive manner using a back-pressure system in combinationwith an accurate stopper positioning device. A high-speed
Figure 14. Retracting dumbbell-shaped liquid thread occurring frommultiple jet breakup. The mean diameter of the small droplet on thebottom of the first image is 1.41 mm, the bigger one above it is 3.74mm in size, and the one formed from the dumbbell-shaped body 2.16mm. The time difference between each image is 1.55 ms.
Figure 15. Another example of multiple droplet breakup from a slagjet. In this example, three droplets are formed with mean diameterranging from 2.66 to 3.76 mm. The time difference between eachimage is here 0.77 ms.
Figure 16. Coalescence of two slag droplets, 2.2 and 3.45 mm. Aftersuccessful merging, the resulting droplet oscillates from prolate tooblate shape. The time difference between each image is 1.55 ms.
Industrial & Engineering Chemistry Research Article
dx.doi.org/10.1021/ie4022623 | Ind. Eng. Chem. Res. 2013, 52, 16444−1645616453
camera with fast data transfer was used to capture thephenomena through the window in the horizontal aluminaprotection tube forming a cross with the vertical one.The dynamics of droplet formation, liquid bridge necking
and oscillation during free fall were captured with the high-speed camera and analyzed with an image processing tool. Thedroplet length, the neck diameter and the droplet projectionarea were quantified as a function of time for differenttemperatures. The effect of viscosity was demonstrated in allcases. The empirical correlation of Scheele and Meister51 wasfound to predict the volume of the formed droplets in asatisfactory manner.At high frame rates, in some cases with relatively high slag
viscosity, satellite droplets were found. Surface instabilities onthe retracting liquid thread were clearly shown, resulting innearly simultaneous pinch-off at both ends to form free satellitedroplets of small size (order of 102 μm). The coalescence of thesatellites both with the remaining liquid at the nozzle and withthe free falling main droplet was found.At higher pressure differences, a coherent slag jet was
formed. Jet disintegration was triggered by random disturban-ces present in the immediate environment, thus “natural”breakup occurred at wavenumbers lower than the wavenumbercorresponding to the maximum growth rate, also resulting innonlinear behavior, such as “negative” growth rate andintermediate satellite droplet formation. Various forms andshapes of the detaching droplets were filmed, some of themwere presented in this paper. The frequency distribution of thesatellite droplets showed a bimodal distribution in very goodagreement with theoretical considerations. The jet length wasnot constant due to random nonlinear disintegration, althoughin relatively close agreement with available jet lengthpredictions. Future work will include the use of controlledperturbances, as for instance used by Benda75 in a high-temperature setup, to improve the uniformness of dropletformation.In the pendant drop method setup, the surface tension of
calcia/alumina slags at different temperatures in a controlledargon atmosphere was obtained as a function of time. Themeasurements were shown to be highly reproducible. Theresults show close agreement with published literature data andwith the additivity rule (deviation was less than 3%).These first encouraging results obtained with the new high-
temperature device are the foundation to carry out measure-ments in slags with additions of surfactants to elucidate theimpact of surface active materials on the interfacial phenomenain slags. The aim is to use optical high-speed measurements incombination with the pendant drop and the oscillating jettechnique to capture the time-dependent behavior of surfacetension.
■ ASSOCIATED CONTENT
*S Supporting InformationDetailed information about the experimental setup, especiallythe design of the alumina cross tube, and about the slagpreparation procedure. This material is available free of chargevia the Internet at http://pubs.acs.org.
■ AUTHOR INFORMATION
Corresponding Author*E-mail: [email protected].
NotesThe authors declare no competing financial interest.
■ ACKNOWLEDGMENTSWe thank Tetlow Kilns & Furnaces for their invaluable andexhaustive support in designing and engineering the furnace. Aspecial thanks goes to Roger Brockway and Stefan Teran for alltheir technical support and the technical drawings.The extraordinary help of Shane Mullenger from Mersen
Oceania (formerly Carbon Lorraine) to build the giganticgraphite crucible is also highly appreciated.Finally, the authors thank the CSIRO Division for Process
Science and Engineering, more precisely the CapabilityDevelopment Theme, for funding this project.
■ NOTATION
Latin Lettersa = thinnest neck diameter, mA, B, C = parameterde, ds = diameter used in selected plane method, mdP = droplet diameter, mD = diameter, mg = gravity, m s−2
H−1 = parameter in selected plane method, −ID = inner diameter, mk = wavenumber, m−1
k* = dimensionless wavenumber, −L = length, mLb = breakup length of jet, mLchar = characteristic length scale in dimensionless numbers,mOD = outer diameter, mp = pressure, PapO2
= oxygen partial pressure, PaQ = volume flow rate, m3 s−1
rP = droplet radius, mrjet = jet radius, mr* = radius ratio rP/rjet, −R = capillary radius, mS = ds/de = parameter in selected plane method, −SD = standard deviationt = time, std = droplet detachment time, sT = temperature, Kv = velocity, m s−1
VP = droplet volume, m3
Xi = molar fraction, mol mol−1
Greek Lettersε0 = initial disturbance, mϑ = temperature, °Cλ = wavelength, mμ = dynamic viscosity, Pasρ = density, kg m−3
σ = surface tension, N m−1
ΦHB = Harkins and Brown correction factor, −Subscripts
0 = initial, at t = 0AR = aspect ratiocap = capillaryd = detachmentf = formationg = gas
Industrial & Engineering Chemistry Research Article
dx.doi.org/10.1021/ie4022623 | Ind. Eng. Chem. Res. 2013, 52, 16444−1645616454
i = innerjet = jetmain = main dropletmin = minimumpred = predictedP = dropletsat = satellite dropletw = water
Dimensionless NumbersOh = Ohnesorge number, Oh = (We)1/2Re−1 =μ(ρσLchar)
−1/2
Re = Reynolds number, Re = ρvLcharμ−1
We = Weber number, We = ρv2Lcharσ−1
■ REFERENCES(1) Olette, M. Surface Phenomena: A Cornerstone of Iron andSteelmaking Processes. ISIJ Int. 1993, 33, 1113−1124.(2) Chung, Y.; Jimbo, I.; Sharan, A.; Kolbeinsen, L.; Byrne, M.;Cramb, A. W. Dynamic interfacial phenomena in liquid steel-slagsystems. Metall. Mater. Trans. B 2000, 31, 951−957.(3) Gaye, H.; Lucas, L. D.; Olette, M.; Riboud, P. V. Metal slaginterfacial properties - equilibrium values and dynamic phenomena.Can. Metall. Q. 1984, 23, 179−191.(4) Hondros, E. D. Introduction: significance of capillary driven flowsin materials processing. Philos. T. R. Soc. A 1998, 356, 815−818.(5) Kozakevitch, P.; Urbain, G.; Sage, M. Sur la tension interfacialefonte/laitier et le mecanisme de desulfuration. Rev. Metall. 1955, LII,161−172.(6) Mills, K.; Hondros, E.; Li, Z. Interfacial phenomena in hightemperature processes. J. Mater. Sci. 2005, 40, 2403−2409.(7) Mukai, K. In Fundamentals of Metallurgy; Seetharaman, S., Ed.;Woodhead Publishing: Cambridge, England, 2005; pp 237−269.(8) Richardson, F. D. Interfacial phenomena in metallurgicalreactions. Trans. Iron Steel Inst. Jpn. 1974, 14, 1−8.(9) Matsushita, T.; Watanabe, T.; Hayashi, M.; Mukai, K. Thermal,optical and surface/interfacial properties of molten slag systems. Int.Mater. Rev. 2011, 56, 287−323.(10) Ehrenberg, A. Huttensand - Ein leistungsfahiger Baustoff mitTradition und Zukunft, Teil 1. Beton-Inf. 2006, 4, 35−63.(11) Holappa, L.; Nurmi, S.; Louhenkilpi, S. Role of slags in steelrefining: is it really understood and fully exploited? Rev. Metall. 2009,106, 9−20.(12) Mills, K. C.; Sridhar, S. Viscosities of ironmaking andsteelmaking slags. Ironmak. Steelmak. 1999, 26, 262−268.(13) Mills, K. The estimation of slag properties. Southern AfricanPyrometallurgy 2011; Cradle of Humankind, South Africa, March 6−9,2011(14) Keene, B. J. In Slag Atlas; Eisenhuttenleute, V. D., Ed.; VerlagStahleisen mbH, 1995; pp 403−462.(15) Olette, M. Interfacial Phenomena and Mass Transfer inExtraction Metallurgy. Steel Res. 1988, 59, 246−256.(16) Gabler, A.; Wegener, M.; Paschedag, A. R.; Kraume, M. Theeffect of pH on experimental and simulation results of transient dropsize distributions in stirred liquid-liquid dispersions. Chem. Eng. Sci.2006, 61, 3018−3024.(17) Lin, Z. J. The Modelling of Emulsification, Slag Foaming andAlloy Addition Behaviour in Intensively Stirred Metallurgical Reactors.Ph.D. thesis, McGill University, Montreal, Canada, 1997.(18) Nexhip, C.; Davidson, R.; Norgate, T.; Sanetsis, S.; Washington,B. Dry Granulation of Slags for Producing Cement Binder.Proceedings of Green Processing 2004; Freemantle, Australia, May10−12, 2004(19) Xie, D.; Jahanshahi, S.; Norgate, T. Dry granulation to provide asustainable option for slag treatment. Proceedings of Sustainable Mining2010, Kalgoorlie, WA, Aug 17−19, 2010.
(20) Yoshinaga, M.; Fujii, K.; Shigematsu, T.; Nakata, T. Drygranulation and solidification of molten blast furnace slag. T. Iron SteelI. Jpn. 1982, 22, 823−829.(21) Kashiwaya, Y.; In-Nami, Y.; Akiyama, T. Development of arotary cylinder atomizing method of slag for the production ofamorphous slag particles. ISIJ Int. 2010, 50, 1245−1251.(22) Kashiwaya, Y.; In-Nami, Y.; Akiyama, T. Mechanism of theformation of slag particles by the rotary cylinder atomization. ISIJ Int.2010, 50, 1252−1258.(23) Liu, J.; Yu, Q.; Qin, Q. System for recovering waste heat fromhigh temperature molten blast furnace slag Energy Technology 2011:Carbon Dioxide and Other Greenhouse Gas Reduction Metallurgy andWaste Heat Recovery; Cleveland, OH, May 25−26, 2011(24) Pickering, S. J.; Hay, N.; Roylance, T. F.; Thomas, G. H. Newprocess for dry granulation and heat recovery from molten blast-furnace slag. Ironmak. Steelmak. 1985, 12, 14−21.(25) Frost, A. R. Rotary atomization in the ligament formation mode.J. Agric. Eng. Res. 1981, 26, 63−78.(26) Jahanshahi, S.; Xie, D.; Pan, Y. H.; Ridgeway, P.; Mathieson, J.Dry slag granulation with integrated heat recovery1st InternationalConference on Energy Efficiency and CO2 Reduction in the Steel Industry(EECR Steel 2011); Dusseldorf, Germany, June 27−July 1, 2011.(27) Xie, D.; Jahanshahi, S. Waste heat recovery from molten slags;International Congress on Steel 2008 (ICS2008), Gifu, Japan, October6−8, 2008.(28) Evseev, P. P.; Fillipov, A. F. Physico-chemical properties of slagsystems CaO-Al2O3-MexAy−Surface tension and density of slags. Izv.V.U.Z. Chem. Met. 1967, 10, 55−59.(29) Hahn, I.; Neuschutz, D. Ejection of steel and slag droplets fromgas stirred steel melts. Ironmak. Steelmak. 2002, 29, 219−223.(30) Dombrowski, N.; Lloyd, T. L. Atomisation of liquids byspinning cups. Chem. Eng. J. 1974, 8, 63−81.(31) Yakushev, A. M.; Romashin, V. M.; Ivanova, N. V. Surfaceproperties and density of CaO-Al2O3-SiO-MgO-base slags. Steel USSR1985, 15, 425−426.(32) Skupien, D.; Gaskell, D. R. The surface tensions and foamingbehavior of melts in the system CaO-FeO-SiO2. Metall. Mater. Trans.B 2000, 31, 921−925.(33) Wegener, M.; Grunig, J.; Stuber, J.; Paschedag, A. R.; Kraume,M. Transient rise velocity and mass transfer of a single drop withinterfacial instabilities - experimental investigations. Chem. Eng. Sci.2007, 62, 2967−2978.(34) Wegener, M.; Eppinger, T.; Baumler, K.; Kraume, M.;Paschedag, A. R.; Bansch, E. Transient rise velocity and mass transferof a single drop with interfacial instabilities-Numerical investigations.Chem. Eng. Sci. 2009, 64, 4835−4845.(35) Wegener, M.; Paschedag, A. R. The effect of soluble anionicsurfactants on rise velocity and mass transfer at single droplets insystems with Marangoni instabilities. Int. J. Heat Mass Transfer 2012,55, 1561−1573.(36) Carbery, D.; McMillan, N. D.; Neill, M. O.; Riedel, S.; Kennedy,D.; Nicholls, T. Experimental observations with ultra-speed imagingrevealing new complex detail of drop separation processes from a largediameter drophead. J. Phys.: Conf. Ser. 2011, 307, 012046.(37) Maaß, S.; Kraume, M. Determination of breakage rates usingsingle drop experiments. Chem. Eng. Sci. 2012, 70, 146−164.(38) Liu, Q.; Orme, M. High precision solder droplet printingtechnology and the state-of-the-art. J. Mat. Proc. Techn. 2001, 115,271−283.(39) Orme, M.; Courter, J.; Liu, Q.; Zhu, J.; Smith, R. Chargedmolten metal droplet deposition as a direct write technology.MRS2000 Spring Meeting; San Francisco, April, 2000.(40) Bellizia, G.; Megaridis, C. M.; McNallan, M.; Wallace, D. B. Acapillary-jet instability method for measuring dynamic surface tensionof liquid metals. Proc. R. Soc. Lond. A. Mat. 2003, 459, 2195−2214.(41) Howell, E. A.; Megaridis, C. M.; McNallan, M. Dynamic surfacetension measurements of molten Sn/Pb solder using oscillatingslender elliptical jets. Int. J. Heat Fluid Fl. 2004, 25, 91−102.
Industrial & Engineering Chemistry Research Article
dx.doi.org/10.1021/ie4022623 | Ind. Eng. Chem. Res. 2013, 52, 16444−1645616455
(42) Artem’ev, B. V.; Kochetov, S. G. Capillary breakup of a liquid-metal jet in an oxidizing medium. J. Eng. Phys. Thermophys. 1991, 60,425−429.(43) Lai, W.-H.; Chen, C.-C. Effect of oxidation on the breakup andmonosized droplet generation of the molten metal jet. AtomizationSpray 2005, 15, 81−102.(44) Bashforth, F.; Adams, J. C. An attempt to test the theories ofcapillary action by comparing the theoretical and measured forms of dropsof fluid; Cambridge University Press: Cambridge, 1883.(45) Davis, J. K.; Bartell, F. E. Determination of surface tension ofmolten materials: Adaptation of the pendent drop method. Anal.Chem. 1948, 20, 1182−1185.(46) Fordham, S. On the Calculation of Surface Tension fromMeasurements of Pendant Drops. Proc. R. Soc. Lond. A. Mat. 1948,194, 1−16.(47) Kingery, W. D. Surface Tension of Some Liquid Oxides andTheir Temperature Coefficients. J. Am. Ceram. Soc. 1959, 42, 6−10.(48) Bidwell, R. M.; Duran, J. L.; Hubbard, G. L. Tables for thedetermination of the surface tensions of liquid liquid metals by the pendantdrop method; Los Almos Scientific Lab, 1964.(49) Mukai, K.; Ishikawa, T. Surface tension measurements on liquidslags in CaO-SiO2, CaO-Al2O3 and CaO-Al2O3-SiO2 systems by apendant drop method. Nippon Kinzoku Gakkai-si 1981, 45, 147−154.(50) Urbain, G. Viscosity of silicate melts. Rev. Int. Hautes Temp.1983, 20, 135−139.(51) Scheele, G. F.; Meister, B. J. Drop formation at low velocities inliquid-liquid systems: Part I. Prediction of drop volume. AIChE J.1968, 14, 9−15.(52) Zhang, X.; Basaran, O. A. An experimental study of dynamics ofdrop formation. Phys. Fluids 1995, 7, 1184−1203.(53) Lee, B.-B.; Ravindra, P.; Chan, E.-S. New drop weight analysisfor surface tension determination of liquids. Colloid Surf. A 2009, 332,112−120.(54) Zielinski, M.; Sikora, B. Surface tension of the calcium oxide-alumina system with additions of silica, iron(III) oxide, calciumfluoride, sodium. Prace Instytutu Metalurgii Zelaza 1977, 29, 229−232.(55) Heertjes, P. M.; de Nie, L. H.; de Vries, H. J. Drop formation inliquid-liquid systems - I prediction of drop volumes at moderate speedof formation. Chem. Eng. Sci. 1971, 26, 441−449.(56) Heertjes, P. M.; de Nie, L. H.; de Vries, H. J. Drop formation inliquid-liquid systems - II testing of the considerations given in Part I,for drop volumes below the jetting velocity a criterion for the jettingvelocity. Chem. Eng. Sci. 1971, 26, 451−459.(57) Nakajima, K. Estimation of Surface Tension for Multi-component Silicate Melts. Tetsu to Hagane 1994, 80, 599−604.(58) Ershov, G. S.; Popova, E. A. The effects of vanadium additionson the surface tension of soda lime silicate melts. Zh. Neorg. Khim.1964, 9, 654−686.(59) Yakobashvili, S. B.; Mudzhiri, T. G.; Sklyarov, A. V. Surfacetension of slags of the CaO-Al2O3 system. Avtom. Svarka 1965, 18, 44.(60) Kovalenko, A. M.; Novokhatsky, I. A.; Petrov, A. K.; Ershov, G.S. Effect of gases on the surface tension of oxide melts. Fiz. Khim.Poverkh. Yavlenii Rasplavakh 1971, 186.(61) Lindblad, N. R.; Schneider, J. M. Production of uniform-sizedliquid droplets. J. Sci. Instr. 1965, 42, 635−638.(62) Leroux, S.; Dumouchel, C.; Ledoux, M. The stability curve ofNewtonian liquid jets. Atomization Spray 1996, 6, 623−647.(63) McCarthy, M. J.; Molloy, N. A. Review of stability of liquid jetsand the influence of nozzle design. Chem. Eng. J. 1974, 7, 1−20.(64) Weber, C. Zum Zerfall eines Flussigkeitsstrahles. ZAMM - J.Appl. Math. Mech. 1931, 11, 136−154.(65) Eggers, J.; Villermaux, E. Physics of liquid jets. Rep. Prog. Phys.2008, 71, 036601.(66) Rayleigh, L. On the Stability, or Instability, of certain FluidMotions. P. Lond. Math. Soc. 1879, s1−11, 57−72.(67) Ashgriz, N.; Yarin, A. L. In Handbook of Atomization and Sprays:Theory and Applications; Ashgriz, N., Ed.; Springer: New York, 2011;pp 3−53.
(68) Malot, H.; Dumouchel, C. Experimental investigation of thedrop size distribution of sprays produced by a low-velocity newtoniancylindrical liquid jet. Atomization Spray 2001, 11, 227−254.(69) Tyler, E. XL. Instability of liquid jets. Philos. Mag Ser. 7 1933,16, 504−518.(70) Lafrance, P. Nonlinear breakup of a laminar liquid jet. Phys.Fluids 1975, 18, 428−432.(71) Lafrance, P. Nonlinear breakup of a liquid jet. Phys. Fluids 1974,17, 1913−1914.(72) Rutland, D. F.; Jameson, G. J. Theoretical prediction of the sizesof drops formed in the breakup of capillary jets. Chem. Eng. Sci. 1970,25, 1689−1698.(73) Donnelly, R. J.; Glaberson, W. Experiments on the CapillaryInstability of a Liquid Jet. Proc. R. Soc. Lond. A. Mat. 1966, 290, 547−556.(74) Ronay, M. Determination of the dynamic surface tension ofliquids from the instability of excited capillary jets and from theoscillation frequency of drops issued from such jets. Proc. R. Soc. Lond.A Mat. 1978, 361, 181−206.(75) Benda, P. H. Experimental Investigation of Droplet Formation withHigh Temperature Molten Slag. M.Sc. thesis, University of Washington,1983.
Industrial & Engineering Chemistry Research Article
dx.doi.org/10.1021/ie4022623 | Ind. Eng. Chem. Res. 2013, 52, 16444−1645616456