A Novel Scintillator Detector for the Mu2e Experiment and ...

REPORT SERIES IN PHYSICS
HU-P-D254
UNIVERSITY OF HELSINKI
Novel Detector Technologies forMedical Applications
at the Example of TumorDetection in BNCT
Author:Alexander DieterWINKLER
Supervisor:Prof. Dr. SauliSAVOLAINEN
Department of PhysicsFaculty of Science
and Helsinki Institute of Physics
ACADEMIC DISSERTATION
To be presented for public criticism, with the permission of theFaculty of Science of the University of Helsinki, in the
auditorium D101 of the Physicum building,Gustaf Hällströmin katu 2a, on
Friday, October 20th, 2017, at 12:00 o’clock.
Helsinki, 2017

ii
Supervisor:Prof. Sauli Savolainen, Ph.D.Department of PhysicsUniversity of HelsinkiFinland
Reviewers:Prof. Ari Virtanen, Ph.D.Research director RADEF facilityUniversity of JyväskyläFinland
Adj. Prof. Jani Keyriläinen, Ph.D.Medical PhysicsTurku University HospitalFinland
Opponent:Prof. Ari Jokinen, Ph.D.Department of PhysicsUniversity of JyväskyläFinland
ISBN 978-951-51-3691-6 (Paperback)ISSN 0356-0961Helsinki University Print (Unigrafia OY)Helsinki 2017
ISBN 978-951-51-3692-3 (PDF)http://ethesis.helsinki.fiElectronic Publications at the University of HelsinkiHelsinki 2017

iii
“No government has the right to decide on the truth of scientific prin-ciples, nor to prescribe in any way the character of the questions in-vestigated. [...] Instead it [the government] has a duty to its citizensto maintain the freedom, to let those citizens contribute to the furtheradventure and the development of the human race.”
Richard Feynman


v
University of Helsinki
AbstractFaculty of Science
Department of PhysicsFaculty of Science
and Helsinki Institute of Physics
Doctor of Philosophy
Novel Detector Technologies for Medical Applicationsat the Example of Tumor Detection in BNCT
by Alexander Dieter WINKLER
The next evolutionary step in medical imaging and radiationtherapy is to employ novel detector technologies capable of pho-ton counting operations. These detectors allow to acquire thespectrum of the radiation for each pixel. Currently used energyintegrating detectors do not allow this. Two types of detectormaterials capable of photon counting operation are discussed inthis work. With the result that the detector technology based onCdTe and CdZnTe is more matured than GaAs. The spectral in-formation of photon counting detectors can be used for numer-ous applications and diagnostic improvements. A distinct ex-ample is presented for boron neutron capture therapy (BNCT).This therapy lacks an accurate real time method to determinethe 10B concentration within the patient. Previous approachesfailed because of the low signal to noise ratio of the used sig-nal. A method has been proposed to improve this therapy byemploying CdTe based photon counting detectors. These de-tectors allow detection of a secondary signal with a higher sig-nal to noise ratio. Additionally, efforts to produce CdTe basedphoton counting detector arrays, for medical applications, aredescribed.


vii
AcknowledgementsA PhD thesis is in most cases a group work, therefore it is mydeepest desire to acknowledge the people that have in one wayor the other contributed to this process.
I wish to thank the Department of Physics at the Univer-sity of Helsinki, the Helsinki Institute of Physics (HIP) and it’sDetector Laboratory for providing the resources and the frame-work for the research that is presented in this thesis.
In particular, I wish to that Prof. Sauli Savolainen whokindly accepted me to the medical physics studies within theDoctoral Programme in Materials Research and Nanosciences(MATRENA) and is continuing to provide invaluable supportfor the continuation of the long path towards the hospital physi-cist. I am equally indebted to Dr. Jaakko Häkönen for acceptingme to the CMS upgrade project, even though my official stud-ies were not within the Doctoral Programme of Particle Physicsand Universe Sciences (PAPU). He saw the synergy that the bothfields — medical- and particle physics — can gain, when work-ing together. For this and the guidance that he and later Dr.Panja Luukka kindheartedly granted, I am most grateful.
On the research side, I owe my thanks to Dr. HannaKoivunoro who has taken the time to plan, realize and improveour research in countless discussions. She is one of the few peo-ple that has endured these discussions from the beginning. Sim-ilarly, I like to thank Iiro Auterinen for his support and his cre-ative input.
At the Detector laboratory of HIP, I like to thank Dr. EijaTuominen and the laboratory engineers Jouni Heino and RaimoTurpeinen for helping to organize the needed resources andto solve problems quickly. Similarly, our colleague RaunoLauhakangas, will always have my innermost gratitude forteaching immeasurable knowledge about detectors, a sustain-able way of thinking and the many cheerful discussions.
I sincerely thank my colleagues Dr. Jaakko Häkönen, Dr.Panja Luuka and Dr. Erik Brücken for their helpful suggestionsand comments that improved this thesis and it’s contend sub-stantially. Equally, I thank Adj. Prof. Jani Keyrilainen and Prof.Ari Virtanen for their agreement to conduct the pre-examinationof this thesis. Their numerous comments helped to focus the

viii
message I like to convey. Furthermore, I like to thank DonaldSmart for providing the language review.
The research related travels and other support was partiallyprovided by the MATRENA doctoral programme, for which Iam grateful. Special thanks are owed to PharmD. Alma Kartal-Hodzic for her ever open ear to solve the little problems of doc-toral students.
On a personal level I like to thank my friends and colleaguesDr. Erik Brücken, Dr. Aneliya Karadzhinova-Ferrer and TiinaNaaranoja for their motivation, distractions, the vast amountscoffee and their shoulders to cry on. Finally, I wish to thank myfamily and friends for their endless support on this part of myjourney.

ix
For Birgitt.


xi
Contents
Abstract v
Acknowledgements vii
1 Introduction 11.1 Boron Neutron Capture Therapy . . . . . . . . . . 31.2 Modified BNCT-SPECT . . . . . . . . . . . . . . . . 6
2 Aim of this Work 7
3 Background and Methods 93.1 Radiation Detection . . . . . . . . . . . . . . . . . . 9
3.1.1 Principles of Radiation Detection . . . . . . 93.1.2 Functionality of Semiconductor Detectors . 10
Depletion Layer . . . . . . . . . . . . . . . . 11Energy Resolution . . . . . . . . . . . . . . 11Signal to Noise Ratio . . . . . . . . . . . . . 12
3.1.3 CdTe Detectors . . . . . . . . . . . . . . . . 12CdTe Material Quality and Processing . . . 14
3.1.4 GaAs Detectors . . . . . . . . . . . . . . . . 163.1.5 Photon Counting Detectors . . . . . . . . . 17
3.2 Monte Carlo Simulations . . . . . . . . . . . . . . . 183.2.1 Tallies F8 and F4 . . . . . . . . . . . . . . . 20
3.3 Experimental Setups Used in this Work . . . . . . 203.3.1 BNCT-SPECT . . . . . . . . . . . . . . . . . 203.3.2 Transient Current Technique Test Setup for
GaAs Diodes . . . . . . . . . . . . . . . . . 223.3.3 CMS Pixel Phase I Module Testing Setup . 23
3.4 Tools Used in this Work . . . . . . . . . . . . . . . 243.4.1 Nuclear Reactions Required for the
Modified BNCT-SPECT Method . . . . . . 243.4.2 Data Analysis . . . . . . . . . . . . . . . . . 25
xii
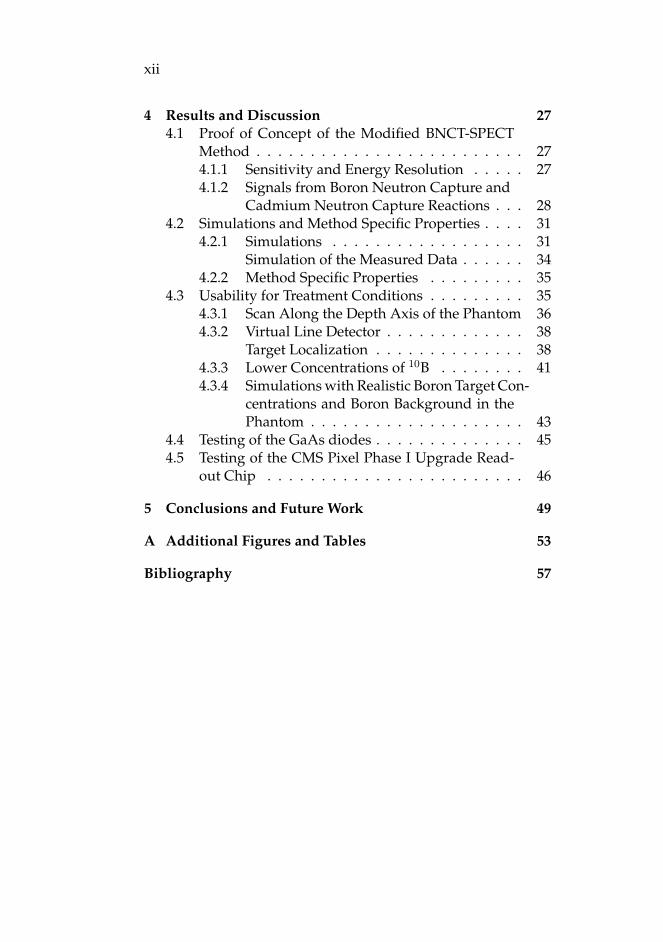
4 Results and Discussion 274.1 Proof of Concept of the Modified BNCT-SPECT
Method . . . . . . . . . . . . . . . . . . . . . . . . . 274.1.1 Sensitivity and Energy Resolution . . . . . 274.1.2 Signals from Boron Neutron Capture and
Cadmium Neutron Capture Reactions . . . 284.2 Simulations and Method Specific Properties . . . . 31
4.2.1 Simulations . . . . . . . . . . . . . . . . . . 31Simulation of the Measured Data . . . . . . 34
4.2.2 Method Specific Properties . . . . . . . . . 354.3 Usability for Treatment Conditions . . . . . . . . . 35
4.3.1 Scan Along the Depth Axis of the Phantom 364.3.2 Virtual Line Detector . . . . . . . . . . . . . 38
Target Localization . . . . . . . . . . . . . . 384.3.3 Lower Concentrations of 10B . . . . . . . . 414.3.4 Simulations with Realistic Boron Target Con-
centrations and Boron Background in thePhantom . . . . . . . . . . . . . . . . . . . . 43
4.4 Testing of the GaAs diodes . . . . . . . . . . . . . . 454.5 Testing of the CMS Pixel Phase I Upgrade Read-
out Chip . . . . . . . . . . . . . . . . . . . . . . . . 46
5 Conclusions and Future Work 49
A Additional Figures and Tables 53
Bibliography 57
xiii
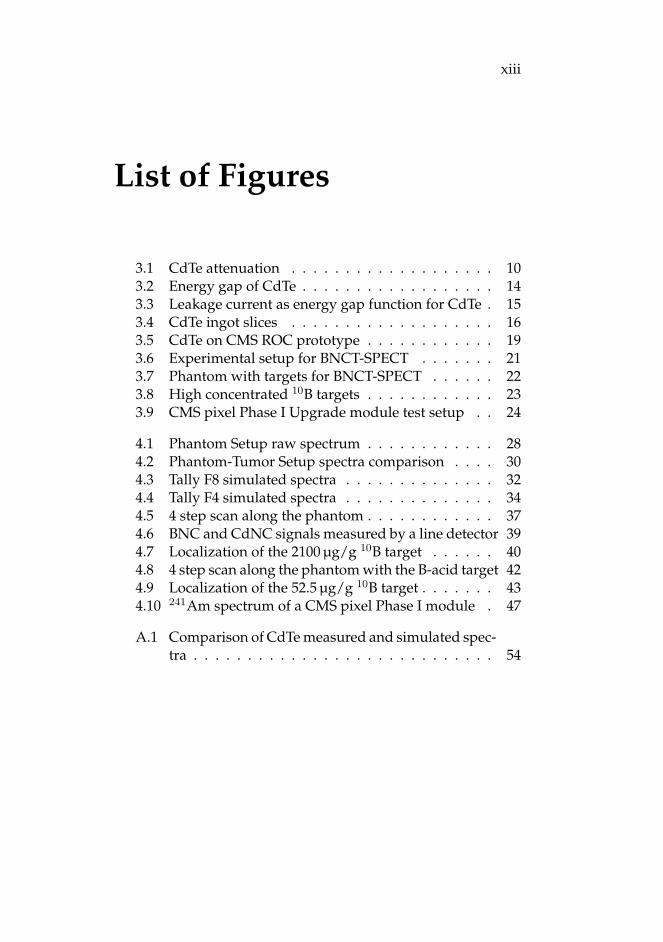
List of Figures
3.1 CdTe attenuation . . . . . . . . . . . . . . . . . . . 103.2 Energy gap of CdTe . . . . . . . . . . . . . . . . . . 143.3 Leakage current as energy gap function for CdTe . 153.4 CdTe ingot slices . . . . . . . . . . . . . . . . . . . 163.5 CdTe on CMS ROC prototype . . . . . . . . . . . . 193.6 Experimental setup for BNCT-SPECT . . . . . . . 213.7 Phantom with targets for BNCT-SPECT . . . . . . 223.8 High concentrated 10B targets . . . . . . . . . . . . 233.9 CMS pixel Phase I Upgrade module test setup . . 24
4.1 Phantom Setup raw spectrum . . . . . . . . . . . . 284.2 Phantom-Tumor Setup spectra comparison . . . . 304.3 Tally F8 simulated spectra . . . . . . . . . . . . . . 324.4 Tally F4 simulated spectra . . . . . . . . . . . . . . 344.5 4 step scan along the phantom . . . . . . . . . . . . 374.6 BNC and CdNC signals measured by a line detector 394.7 Localization of the 2100 μg/g 10B target . . . . . . 404.8 4 step scan along the phantom with the B-acid target 424.9 Localization of the 52.5 μg/g 10B target . . . . . . . 434.10 241Am spectrum of a CMS pixel Phase I module . 47
A.1 Comparison of CdTe measured and simulated spec-tra . . . . . . . . . . . . . . . . . . . . . . . . . . . . 54


xv
List of Tables
4.1 Identified peaks in the raw spectrum from the Phan-tom setup . . . . . . . . . . . . . . . . . . . . . . . . 29
4.2 Peak height difference of the Phantom and TumorSetups . . . . . . . . . . . . . . . . . . . . . . . . . 31
4.3 Localization results of 10B targets inside a phantom 45
A.1 Properties of various semiconduictors . . . . . . . 55


xvii
List of OriginalPublications
I Alexander Winkler, Hanna Koivunoro, Vappu Reijonen,Iiro Auterinen, and Sauli Savolainen (2015). “Promptgamma and neutron detection in BNCT utilizing a CdTedetector”. In: Applied Radiation and Isotopes 106, pp. 139–144. DOI: http : / / dx . doi . org / 10 . 1016 / j .apradiso.2015.07.040
II Alexander Winkler, Hanna Koivunoro, and SauliSavolainen (2017a). “Analysis of MCNP simulatedgamma spectra of CdTe detectors for Boron NeutronCapture Therapy”. In: Applied Radiation and Isotopes 124,pp. 114–118. DOI: http://dx.doi.org/10.1016/j.apradiso.2017.03.018
III Alexander Winkler, Hanna Koivunoro, Iiro Auterinen,and Sauli Savolainen (2017b). “Evaluation of a methodto localize 10B in a phantom with a CdTe spectrometerfor Boron Neutron Capture Therapy”. In: Journal of In-strumentation. Under review.
IV X Wu, T Peltola, T Arsenovich, A Gädda, J Härkönen,A Junkes, A Karadzhinova, P Kostamo, H Lipsanen, PLuukka, M Mattila, S Nenonen, T Riekkinen, E Tuomi-nen, and A Winkler (2015). “Processing and character-ization of epitaxial GaAs radiation detectors”. In: Nu-clear Instruments andMethods in Physics Research Section A:Accelerators, Spectrometers, Detectors and Associated Equip-ment 796, pp. 51–55. DOI: http://dx.doi.org/10.1016/j.nima.2015.03.028

xviii
V S. Spannagel on behalf of CMS Tracker Collaboration(2017). “Test Beam Performance Measurements for thePhase I Upgrade of the CMS Pixel Detector”. In: Journalof Instrumentation 12 (05), P05022. DOI: 10.1088/1748-0221/12/05/P05022
The author (Alexander Dieter WINKLER) has coordinated andparticipated in the experimental work for Publications I - III, hewas supported by the co-authors of Publication I and III. Allof the analytic work and the result presentation has been car-ried out by the author for Publications I - III. The formation ofthe idea of the proposed modification for BNCT-SPECT, wasdone in cooperation with the co-author Iiro Auterinen. Further-more, all of the simulations were performed by the author forall, but Publications IV and V. The author has also written themanuscripts for Publications I - III. The contribution by the co-authors for Publications I - III were guidelines to results inter-pretation, improvements on the explanatory content as well assuggestions for additional topics of investigation.
The author’s contributions to Publication IV were assistancein the design and preparation of the PCB boards, on which theGaAs detectors were tested with the TCT-setup at HIP. Further-more, substantial efforts were undertaken by the author, to re-duce the electrical noise of the TCT-setup, in order to allow therecording of the published data. Finally, the author contributedactively to the manuscript writing process.
Publication V is a report by Simon Spannagel and the CMSTracker community, of which the author is a member. The re-port discusses the full system quality assurance, functionalityand the technical verification, the performance and capabilitiesof the new pixel readout CMOS ASIC chip of the CMS pixeltracker. The authors contribution to Publication V and the CMSPhase I Upgrade -project was to set up and test the measurementsystem, necessary to perform the verification of the pixel detec-tor modules that were produced at HIP. These modules are nowinstalled in the CMS experiment at LHC, CERN. In addition,electrical measurements for a large quantity of these moduleswere performed. The measurements were essential for the de-termination and replacement of malfunctioning detectors. Thisallowed HIP to deliver its contractual agreed number of detec-tor modules to the CMS project in time and on budget. The

xix
author’s position in the author list of Publication V follows thecommon practise for publications of large collaborations and isdetermined by the alphabetical orders of the countries, institu-tions and contributing members of the institutions.


xxi
List of Abbreviations
ALARA As Low As Reasonably AchievableAs ArsenicB BoronBM Bridgman Method growthBNC Boron Neutron CaptureBNCT Boron Neutron Capture TherapyBPA Boronophenylalanine10B(n,α)7Li* BNC reaction equation
(the asterisk is usually omitted)C Czochralski growthCd CadmiumCdNC Cadmium Neutron CaptureCdTe Cadmium TellurideCERN Conseil Européenne pour la
Recherche NucléaireCMS Compact Muon SolenoidCT Computed TomographyCVD Chemical Vapor Deposition growthCVPE Chloride Vapor Phase Epitaxy growth113Cd(n,γ)114Cd* CdNC reaction equationemis emissioneV electron VoltF4 Tally F4F8 Tally F8FWHM Full Width at Half MaximumGa GalliumGaAs Gallium ArsenideGe GermaniumHIP Helsinki Institute of PhysicsHPB High-Pressure Bridgman growthILO International Labour OrganizationIR InfraredLEC Liquid Encapsulated Czochralski growth
xxii
LHC Large Hadron ColliderMC Monte CarloMCNP Monte Carlo N-Particle Transport codeNCT Neutron Capture TherapyPC Photon CountingPE PolyethylenePET Positron Emission TomographyPG Prompt GammaPIN p-type/ intrinsic/ n-type diodePMMA Poly (methyl methacrylate) - acrylic glassrel relativeROC Readout ChipSi Siliconsgl singleSNR Signal to Noise RatioSPECT Single-Photon Emission Computed Tomographystrg strongestTCT Transient Current TechniqueTe TelluriumTHM Traveling Heater Method grwothVAM Vertical Ampoule Method growthVGF Vertical Gradient Freeze growthyld yield2D Two-dimensional

xxiii
List of Symbols
σ neutron capture cross section b137Cs Caesium-137, main γ- emission at 661.657 keV133Ba Barium-133, main γ- emissions at 276.398 keV
302.8508 keV356.0129 keV
241Am Americium-241, main γ- emissions at 59.54 keVZ atomic numberZeff effective atomic number for compounds
of more than one elementBNC PG BNC reaction prompt gamma at 477.59(5) keVCdNC PG CdNC reaction main prompt gamma at 558.46 keV


1
Chapter 1
Introduction
Imaging technologies are part of the most essential tools used inmodern medicine. The first diagnostic devices were employed,within a year of Röntgen’s description of X-rays in 1895, leadingto the numerous applications of ionizing radiation that we havein medicine today.
Soon after the discovery of X-rays, reports of adverse effectssuch as hair loss or deep skin burns were reported. Neverthe-less, it took until 1960 that the International Labour Organiza-tion (ILO) restricted workers from exposure to ionizing radia-tion in their Radiation Protection Convention (ILO, 1960). Par-tially based on this convention, the ALARA principle was de-veloped. It states that the exposure to ionizing radiation (orother occupational health risks) should be As Low As Reason-ably Achievable. This principle is one of the essential drivingforces in the development of every new generation of ionizingradiation devices in medicine. In medical imaging the aim isto reduce the exposure for both the patient and the operator,while simultaneously increasing the image quality and diag-nostic value. Through this effort we have come from photo-graphic plates, via fluorescence screens to scintillator coupledphoto diodes. Allowing us to quickly transfer the informationobtained through ionizing radiation into digital signals that areused in medical applications. Nowadays, patient doses are onlya fraction of the doses that were given with the first diagnos-tic images in 1886. Additionally, the image quality has dramat-ically improved. However, there is still room for further im-provement.
The current imaging technology largely employed in med-ical imaging applications, is scintillator based (Bushberg et al.,2001; Nikl, 2006; Beckert et al., 2016; Pani et al., 2016). These

2 Chapter 1. Introduction
are energy-integrating detectors, thus energy of the absorbedradiation is not measured per single quantum, but integratedover a time interval. The next technological step is to employdirect conversion techniques, allowing the measurement of theabsorbed radiation per single quantum. Detectors capable ofthis technique are called photon counting (PC) detectors in med-ical physics, as described by Hasegawa et al. (1991) for example.The development of these kinds of detectors requires substan-tial technological effort, but first prototypes have already beentested with positive results (Kalender et al., 2016; Pourmortezaet al., 2016).
The development of direct conversion detectors with pho-ton counting capability will lead to profound improvements inmedical (e.g. X-ray) imaging. By having access to the full de-tected spectrum, a single exposure can improve image contrastby revealing conventionally hidden differences in anatomic im-ages (Roessl et al., 2007; Muenzel et al., 2016). Similarly, ananalysis of the spectral composition of the recorded data canbe used to efficiently separate different tissue types of similardensity. This enables new diagnostic possibilities and increasesaccuracy (Schlomka et al., 2008; Wang et al., 2011).
However, the development of PC detectors for medical ap-plications is heavily dependent on the detector material that isused. The basic functionality of such a detector is based on adiode structure, made from doped semiconductor materials (seeSections 3.1.2 and 3.1.3 for details). Although a number of semi-conductor materials are known, only a small number qualify forthe use as radiation detectors. Table A.1 in the Appendix liststhe most promising candidates for the usage in medical applica-tions, while basic physical principles and concepts for the usageof these candidates are provided in Section 3.1. The two mostfavored materials are Cadmium Telluride (CdTe) and CadmiumZinc Telluride (CdZnTe/ CZT)1. These materials allow a goodcompromise between the requirements and the restrictions ofionizing radiation that is used in medicine. This is discussed inSection 3.1.3.
A remarkable example of the benefits of PC detection inmedicine is presented in this thesis. It gives a glimpse of the
1Cadmium Telluride and Cadmium Zinc Telluride detectors are technolog-ically similar to each other. All results of this work apply equally to both theCdTe and CdZnTe detector types.

1.1. Boron Neutron Capture Therapy 3
possibilities that become available with the PC detector technol-ogy, but is not restricted to the given example.
1.1 Boron Neutron Capture Therapy
Boron Neutron Capture Therapy (BNCT) is a binary radiother-apy that has been under development for certain malignant tu-mors (Savolainen et al., 2013), since the 1930’s. As in other ra-diotherapies, a lethal or accumulated lethal radiation dose isdelivered to tumor cells, while the surrounding healthy tissuesare exposed to non-lethal doses. For external radiotherapy thisdose is delivered via high energy (∼MeV) photons, electrons orheavier particles, and radiation beams are generated outside thepatient usually by an accelerating device. Brachytherapy is anexample of a common internal radiation therapy. A sealed radi-ation source is usually placed (for example surgically) in or nearthe area of treatment. The lethal dose is then released to a local-ized volume, while tissues further away are not affected.Neutron capture therapy (NCT) can be considered a third cat-egory. The lethal radiation dose is released locally by nuclearreactions that are occurring in a tumor seeking compound, ifthat compound is exposed to an external neutron radiationfield (Locher, 1936). In boron neutron capture therapy (BNCT)this compound carries boron-10 (10B) atoms that have a highneutron capture cross section of 3843 b at thermal energies ofE < 0.4 eV (Chadwick et al., 2011).
BNCT has been evaluated in several clinical trials in the sec-ond half of the last century with good success rates (Mishimaet al., 1989; Slatkin, 1991; Nakagawa et al., 1997). It may alsobe suited in combinations with traditional treatments such aschemotherapy, or surgery. The therapy can also be a last resortfor patients that have exhausted all other therapeutic options.Newer clinical studies have demonstrated the safety and effec-tiveness of BNCT (Kankaanranta et al., 2012; Savolainen et al.,2013). In spite of the advantages of the therapy, three main is-sues remain to be solved before its general acceptance as an ad-ditional tool in radiation therapy (Wikipedia, 2017).
1. The development of more tumor-selective boron deliveryagents for BNCT.

4 Chapter 1. Introduction
2. An accurate, real time dosimetry to better estimate the ra-diation doses delivered to the tumor and normal tissues.
3. The evaluation of recently constructed accelerator-basedneutron sources as an alternative to nuclear reactors.
The first problem is mostly a pharmaceutical task and is notdiscussed further in this work. The last problem is currentlyunder investigation as more accelerator based neutron facilitiesare being planned or come into operation (Kumada et al., 2011;Tanaka et al., 2011; Kreiner et al., 2014; Phoenix et al., 2015;Horiike et al., 2015; Biomedicum Helsinki Foundation, 2016).The application example of PC detectors of this work concen-trates on the second issue, which requires the development ofimaging and detector technologies. One possible method forthe real time dosimetry is a similar approach to that applied insingle photon emission computed tomography (SPECT). That isby imaging the prompt gammas (PG) resulting from the boronneutron capture (BNC) reaction and analyzing them for inten-sity and distribution. Several research groups have proposedBNCT specific SPECT methods, called BNCT-SPECT (Verbakelet al., 1997; Kobayashi et al., 2000; Rosenschöld et al., 2001; Min-sky et al., 2009) with all aiming to provide the online dosimet-ric data, i.e. by counting and localizing the absolute number ofBNC reactions within the patient.
However, a conclusion of the proposed BNCT-SPECT meth-ods is that the signal background requires further reduction inorder to identify the PG photons from the boron neutron cap-ture reaction within the gamma and neutron induced gammabackground spectrum (Kobayashi et al., 2000; Minsky et al.,2009). Thus, a poor signal to noise ratio (SNR) prevents activeexploitation of the proposed BNCT-SPECT approaches. The log-ical course to increase the SNR, is to employ highly sensitivedetectors with good energy resolution (hence PC detectors).
Common candidates are Germanium (Ge) detectors, whichare counted among the most sensitive detectors with the best en-ergy resolution available. However, their cooling and spatial re-quirements are not suited for clinical environments (Kobayashiet al., 2000; Savolainen et al., 2013). Section 3.1.3 outlines thiscircumstance. Furthermore, the lack of two dimensional (2D)detector arrays (e.g. detectors of 20 x 20 cm size, consisting of
1.1. Boron Neutron Capture Therapy 5
hundreds or thousands of pixels) disqualifies Ge detectors forBNCT-SPECT.
The second detector type often evaluated for BNCT-SPECTare CdTe detectors. These detectors do not require excessivecooling and can be produced in 2D detector arrays. In the2000s some groups started to investigate the usability of CdTedetectors in BNCT-SPECT (Kobayashi et al., 2000; Valda et al.,2005), with the conclusion that about 4% energy resolution issufficient (Valda et al., 2005). Furthermore, appropriate neutronshielding and collimation techniques are required for its suc-cessful usage (Kobayashi et al., 2000). Back then, CdTe detec-tors did not fulfill all of these requirements. Devices with suffi-cient energy resolution were available, but at high prices and thenon-availability of multi-pixel-spectrometers prohibited furtherinvestigations. Here, multi-pixel-spectrometers are referred toas 2D arrays capable of PC operation. These kind of detectorsare required for SPECT like operations. Moreover, the shieldingof the neutron background, which requires large filter structuresmade these detector types unfeasible for BNCT-SPECT.
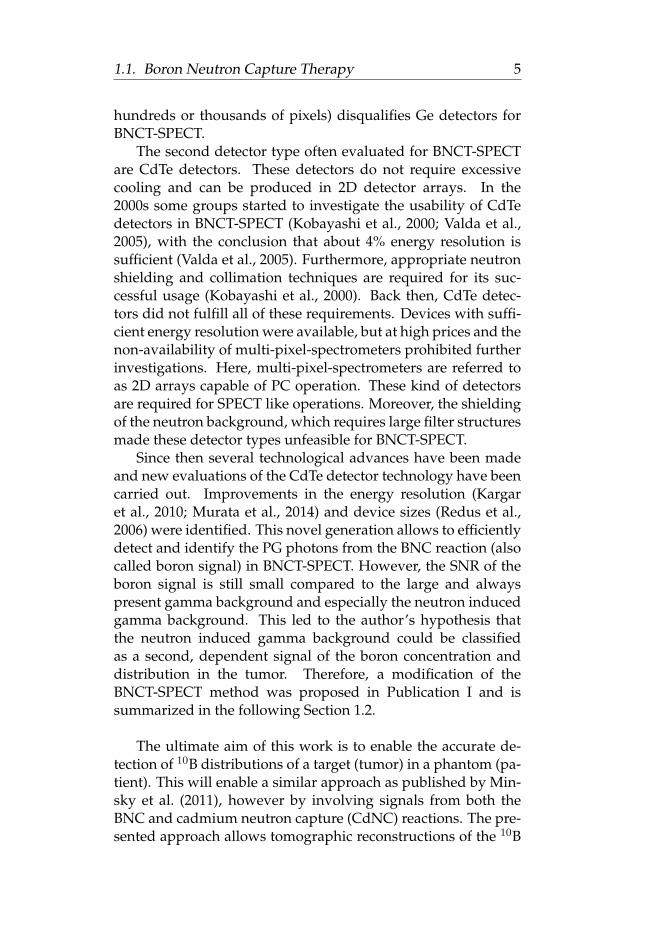
Since then several technological advances have been madeand new evaluations of the CdTe detector technology have beencarried out. Improvements in the energy resolution (Kargaret al., 2010; Murata et al., 2014) and device sizes (Redus et al.,2006) were identified. This novel generation allows to efficientlydetect and identify the PG photons from the BNC reaction (alsocalled boron signal) in BNCT-SPECT. However, the SNR of theboron signal is still small compared to the large and alwayspresent gamma background and especially the neutron inducedgamma background. This led to the author’s hypothesis thatthe neutron induced gamma background could be classifiedas a second, dependent signal of the boron concentration anddistribution in the tumor. Therefore, a modification of theBNCT-SPECT method was proposed in Publication I and issummarized in the following Section 1.2.
The ultimate aim of this work is to enable the accurate de-tection of 10B distributions of a target (tumor) in a phantom (pa-tient). This will enable a similar approach as published by Min-sky et al. (2011), however by involving signals from both theBNC and cadmium neutron capture (CdNC) reactions. The pre-sented approach allows tomographic reconstructions of the 10B
6 Chapter 1. Introduction
distributions within a patient to become achievable. Further-more, the determination of the radiation dose to tumor andhealthy tissues as well as ascertaining the 10B concentration inthe tumor become feasible, if these calculations are based on theinformation obtained through both reaction types.
1.2 Modified BNCT-SPECT
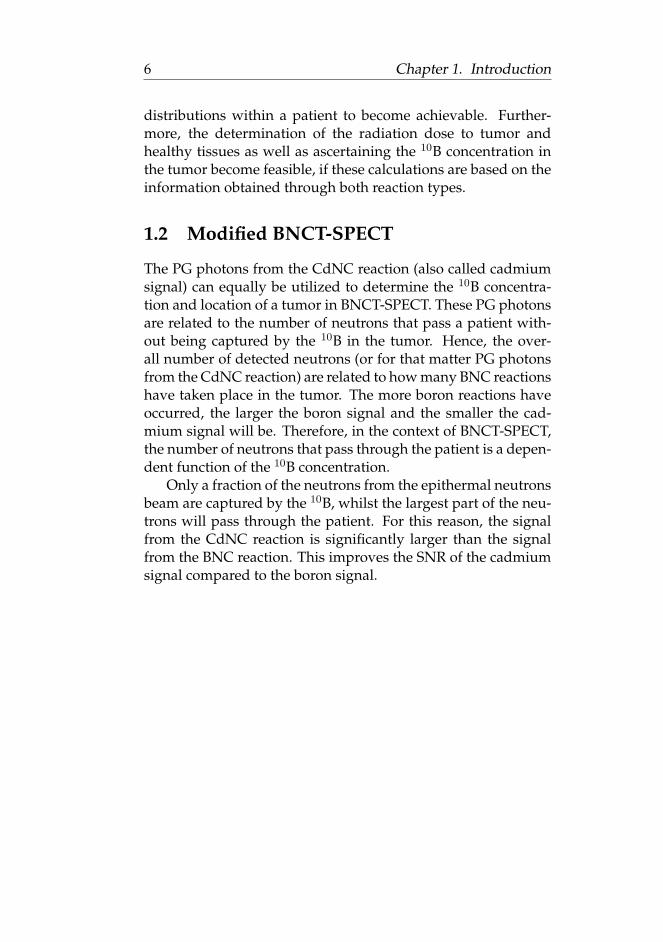
The PG photons from the CdNC reaction (also called cadmiumsignal) can equally be utilized to determine the 10B concentra-tion and location of a tumor in BNCT-SPECT. These PG photonsare related to the number of neutrons that pass a patient with-out being captured by the 10B in the tumor. Hence, the over-all number of detected neutrons (or for that matter PG photonsfrom the CdNC reaction) are related to how many BNC reactionshave taken place in the tumor. The more boron reactions haveoccurred, the larger the boron signal and the smaller the cad-mium signal will be. Therefore, in the context of BNCT-SPECT,the number of neutrons that pass through the patient is a depen-dent function of the 10B concentration.
Only a fraction of the neutrons from the epithermal neutronsbeam are captured by the 10B, whilst the largest part of the neu-trons will pass through the patient. For this reason, the signalfrom the CdNC reaction is significantly larger than the signalfrom the BNC reaction. This improves the SNR of the cadmiumsignal compared to the boron signal.
7
Chapter 2
Aim of this Work
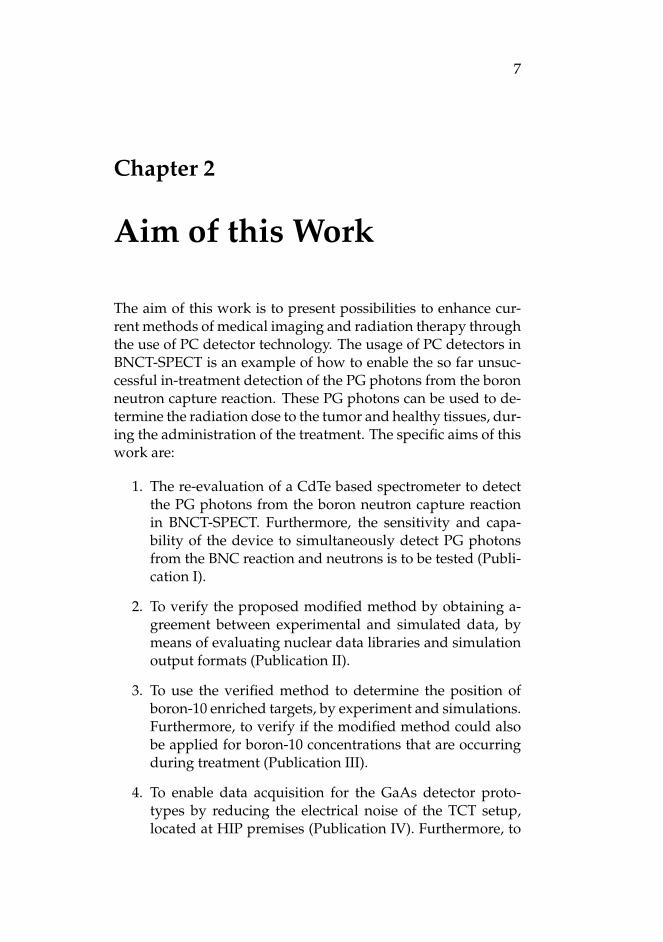
The aim of this work is to present possibilities to enhance cur-rent methods of medical imaging and radiation therapy throughthe use of PC detector technology. The usage of PC detectors inBNCT-SPECT is an example of how to enable the so far unsuc-cessful in-treatment detection of the PG photons from the boronneutron capture reaction. These PG photons can be used to de-termine the radiation dose to the tumor and healthy tissues, dur-ing the administration of the treatment. The specific aims of thiswork are:
1. The re-evaluation of a CdTe based spectrometer to detectthe PG photons from the boron neutron capture reactionin BNCT-SPECT. Furthermore, the sensitivity and capa-bility of the device to simultaneously detect PG photonsfrom the BNC reaction and neutrons is to be tested (Publi-cation I).
2. To verify the proposed modified method by obtaining a-greement between experimental and simulated data, bymeans of evaluating nuclear data libraries and simulationoutput formats (Publication II).
3. To use the verified method to determine the position ofboron-10 enriched targets, by experiment and simulations.Furthermore, to verify if the modified method could alsobe applied for boron-10 concentrations that are occurringduring treatment (Publication III).
4. To enable data acquisition for the GaAs detector proto-types by reducing the electrical noise of the TCT setup,located at HIP premises (Publication IV). Furthermore, to

8 Chapter 2. Aim of this Work
evaluate the GaAs detectors for their usability in medicalapplications.
5. To verify the operational functionality of pixel detectormodules for the CMS pixel Phase I Upgrade -project. Thistask allows the evaluation of the usability of the CMS read-out chip for applications in medical physics. The verifica-tion of the detector’s functionality for the CMS project wasachieved simultaneously (Publication V).
The results of Publication I led to the proposition for themodification of BNCT-SPECT. This had been discussed furtherin Publications I - III. The contribution to Publication V led tothe production of the PC prototype at HIP. This prototype, de-scribed in Section 3.1.5, is ideally suited for its application in thenext generation of medical imaging systems and the proposedmodified method of BNCT-SPECT.

9
Chapter 3
Background and Methods
3.1 Radiation Detection
High energy radiation that is produced from nuclear decays,relaxations, cosmic radiation or in particle accelerators aredetected by radiation detectors. Several kinds of detectorsbased on different physical effects, such as momentum, spin,charge and energy are used for specialized tasks of detection.The most common detection principles are based on ionizationand scintillating effects, but other principles like Cherenkov-radiation, or simple defect induction are also used. This work isfocused on radiation detection by ionization that occurs in solidstate semiconductor detectors.
The outline of the physical processes of radiation detectionand detectors is following the line of argumentation of Knoll(2010) and the Diploma thesis of the author (Winkler, 2017).
3.1.1 Principles of Radiation Detection
The basic interactions that occur in ionizing detectors are photoelectrical- and Compton-effect, as well as pair production. De-pending on the energy of the ionizing event, all three can oc-cur simultaneously and are a function of the detection mate-rial. A typical interaction diagram is plotted for CdTe in Fig-ure 3.1. The relative cross sections of the photo electrical effect(σph), Compton-effect (σc) and pair production processes (σp) area function of the energy of the absorbed photon (Eγ) and theatomic number (Z) of the absorbing material. The formulas of

10 Chapter 3. Background and Methods
10-4 10-2 100 102 104 106
Energy [MeV]
10-4
10-2
100
102
104
Atte
nuat
ion
[cm
2 /g]
Compton ScatteringPhotoelectric AbsorptionPair ProductionTotal Attenuation
FIGURE 3.1: Attenuation of the three main interaction processes andthe total attenuation in CdTe. Plotted with data from NIST, 2017.
Equation 3.1 approximate these relations (Knoll, 2010):
σph ∼= aph · Zn
E3.5γ
σc ∝ ac · Z σp ∝ ap · Z2 (3.1)
with aph, ac and ap being constants for the photoelectric, Comp-ton and pair production effect, respectively. From these relationsone can see that photoelectric absorption is the major processof interaction in CdTe (Zeff(CdTe) = 50 with ZCd = 48, ZTe = 52)at photo energies that are relevant for medical imaging devicesand the proposed modified method of BNCT-SPECT. These en-ergies are < 600 keV1.
3.1.2 Functionality of Semiconductor Detectors
Semiconductor radiation detectors are mainly based on pn- junc-tions, which are biased in one way or the other with an electricalpotential (see Section 3.1.3 for variations with CdTe detectors).Due to this process, the area that is sensitive to radiation de-tection covers the semiconductor volume and in ideal cases thecomplete volume. The ionizing radiation creates charge carriersin the form of electron-hole pairs that travel within the electricalfield to their respective electrodes. Consecutive read out elec-tronics collect the charge carriers and process the informationinto a signal.
1Pair production does not occur for energies < 1022 keV.

3.1. Radiation Detection 11
Depletion Layer
A depletion layer forms after charge compensation at the inter-section of a p- and n-type semiconductor. The resulting electricalfield prevents further electrons and holes from entering the re-gion. Any newly generated electron-hole pair (e.g. by ionizingradiation) will be pushed by the electric field out of the deple-tion region towards the collecting electrodes. This makes thedepletion layer the active region where the process of radiationto signal conversion occurs.
The phrase ionizing radiation indicates the process of interest.A highly energetic particle (e.g. an X-ray photon) that passesthrough the depletion layer will lose its energy by the meansof photoelectric absorption, Compton effect or pair production.These processes create electron-hole pairs along the path of theincident radiation. Further charge carrier pairs can be created bysecondary events. However, the overall number of charges cre-ated is constant for a certain particle energy and material. Thismakes it possible to record energy spectra that refer to specificcharacteristics of an ionizing radiation event.
Energy Resolution
The energy needed to create one electron-hole pair in a semicon-ductor detector is of the order of a few electron volts (eVs). ForCdTe and Gallium Arsenide (GaAs) these energies are 4.43 eVand 4.20 eV, respectively (Del Sordo et al., 2009); also listed inTable A.1. These low pair-creation energies enable the measure-ment of high energy resolution spectra with these materials, be-cause even a low energetic ionizing event (a few keV) createsseveral thousand electron-hole pairs. Assuming complete col-lection of the created pairs, a count at a specific energy in thespectrum is recorded. Several counts at the same energy accu-mulate to peaks. Incident events of different energies create dif-ferent numbers of electron-hole pairs and thus different peaksappear in a spectrum. These peaks can be used to identify thesource or a nuclear reaction that has occurred.
The energy of the recorded event can vary dependent on fur-ther physical interactions such as Doppler broadening, or scat-tering effects. Additional, imperfections of the detector materialcan also change the number of electron-hole pairs that are cre-ated by the event. Finally, the readout electronics add further

12 Chapter 3. Background and Methods
distortions and noise to the recorded event. All these effectslead to a statistical distribution of the energy that is detected forincident events of a certain energy. If the energy of two adjunctpeaks is closer than the average broadening of the detecting sys-tem, then these peaks can not be distinguished anymore. Thisleads to the definition of energy resolution. The higher the en-ergy resolution of a detector system is, the closer two adjunctpeaks can be, while still being distinguishable. The most com-mon way to measure the energy resolution of radiation detec-tors is to evaluate the full width at half of the maximum centerenergy value (FWHM) of a peak. A guideline is that two peakscan still be distinguished if they are at least one value of FWHMat the measured energy apart.
Signal to Noise Ratio
The signal to noise ratio (SNR) is used to describe the efficiencyof separating a signal from the background. It can be used tocompare different devices and measurement setups. Its defini-tion is the ratio of a signal divided by the noise of the signal.Within the scope of the results of this work, a signal is defined asthe pulse peak height count number from either the BNC, or theCdNC reaction. Whilst noise is defined as the number of regis-tered counts up to the baseline threshold, at the position of thesignal. For example, the SNR of the BNC reaction of Figure 4.5on page 37 (top part) at 45 mm is 1.4. This means that the boronsignal is 40% larger than the noise at this position.
3.1.3 CdTe Detectors
Detectors made of CdTe have successfully been establishedas common room temperature radiation detectors and are al-ready evaluated for clinical applications such as computed to-mography (CT) and positron emission tomography (PET) scan-ners (Mikhaylova et al., 2013; Barber et al., 2015). Their energygap of 1.44 eV is large enough to broadly prevent thermally gen-erated charge carriers to be exited into the conduction band andthus reduce the thermal noise to acceptable levels. For compari-son, detectors made of Ge have an energy gap of 0.67 eV, whichallows significant thermal excitation of charge carriers into theconduction band at room temperatures. Therefore, Ge detectors

3.1. Radiation Detection 13
are cooled with liquid nitrogen (77 K), which reduces the ther-mal noise excitation to negligible levels. The larger energy gapof CdTe allows the omission of the bulky mechanics required byliquid nitrogen cooling systems. Therefore, more compact de-tector systems can be built.
The energy gap and the resulting leakage current of a de-tector are functions of the temperature. Varshni’s approxima-tion describes the energy gap of semiconductors as a function oftemperature (T), (Equation 3.2 and Varshni, 1967):
Egap(T ) = Egap(0)− αT 2
β + T(3.2)
where α is dEg/dT and β in approximation the Debye tempera-ture. Egap(0) and Egap(T) are the gaps energies at zero and theevaluation temperature. Figure 3.2 shows the energy gap ofCdTe as a function of temperature leading to 1.44 eV at roomtemperature. The obtained energy gap value can then be usedto calculate the leakage current Ileak of a semiconductor, Equa-tion 3.3.
Ileak(T ) ∝ T 2 · e−Egap2kBT (3.3)
With kB being the Boltzmann constant. Equation 3.3 illustratesthe exponential dependence of the leakage current on the energygap, and thus on the temperature. At 1.44 eV it is a relativelysmall value of approximately 10 nA (Figure 3.3). Conventionalsilicon (Si) based detectors and hadron irradiated Si detectorsshow currents of several μA, partially due to their smaller en-ergy gap of 1.12 eV (Moll et al., 1999; Sze et al., 2006).
The higher effective atomic number of CdTe is the main rea-son for the substantially more effective absorption of higher en-ergetic radiation compared to Si or Ge (see Equation 3.1). Fur-thermore, the electron-hole pair creation energy is small enoughto allow for a good energy resolution. The crystal growth ofcompound semiconductors however, is not as simple as it isfor elementary semiconductor materials, such as for instance Si.This results in a low production yield and a high price per de-tector (Su, 2015). Additionally, conventional doping as done forSi, to obtain p- or n-type materials is not possible with CdTe,

14 Chapter 3. Background and Methods
0 50 100 150 200 250 300Temperature [K]
1.45
1.5
1.55
Ene
rgy
gap
[eV
]
FIGURE 3.2: Energy gap of CdTe as a function of temperature, leadingto a gap of 1.44 eV at room temperature (293 K).
due to the formation of opposite-charged defects or defect com-plexes and the low solubility of possible donor materials (Weiet al., 2001). Thus, pn-junctions are generally not available forCdTe. However, the diode effect and therefore, the depletionlayer can be obtained with a blocking electrode. This is real-ized with a Schottky-diode type construction (Takahashi et al.,2002), allowing bias voltages up to a few kV and full depletioneven for several millimeter thick devices. Alternatively, simpleohmic-type detectors are also available. The latter however, areless effective and are not used within the context of this work.
Suitable pieces of CdTe are usually cuboid volumes of afew millimeteres side length. The detector used in this work(Amptek X-123 CdTe, Amptek Inc., Bedford, MA, USA) employsa crystal of 3 x 3 x 1 mm3 volume that is large enough to absorba substantial part of the radiation it is exposed to; assuming en-ergies of < 600 keV (Amptek Inc., 2016). In combination withsuitable readout electronics, a clear identification of the radia-tion source is possible.
CdTe Material Quality and Processing
The reason for the comparably small sizes of CdTe detectors lieswithin the quality of the material. Unlike Si or Ge, the crys-tal growth process is substantially more complicated and re-quires precise control over numerous growth parameters (Li etal., 2016). Despite considerable efforts during the last decades,

3.1. Radiation Detection 15
1.42 1.44 1.46 1.48 1.5 1.52 1.54 1.5610-300
10-200
10-100
100Le
akag
e cu
rren
t [A
]
Band gap [eV]
1.435 1.44 1.445 1.45 1.45510-9
10-8
10-7
FIGURE 3.3: Leakage current of CdTe as a function of the energy gapwith a closeup of smaller energies that are related to higher temper-atures. The leakage current at room temperature (293 K) is typically
some tens of nanoamperes.
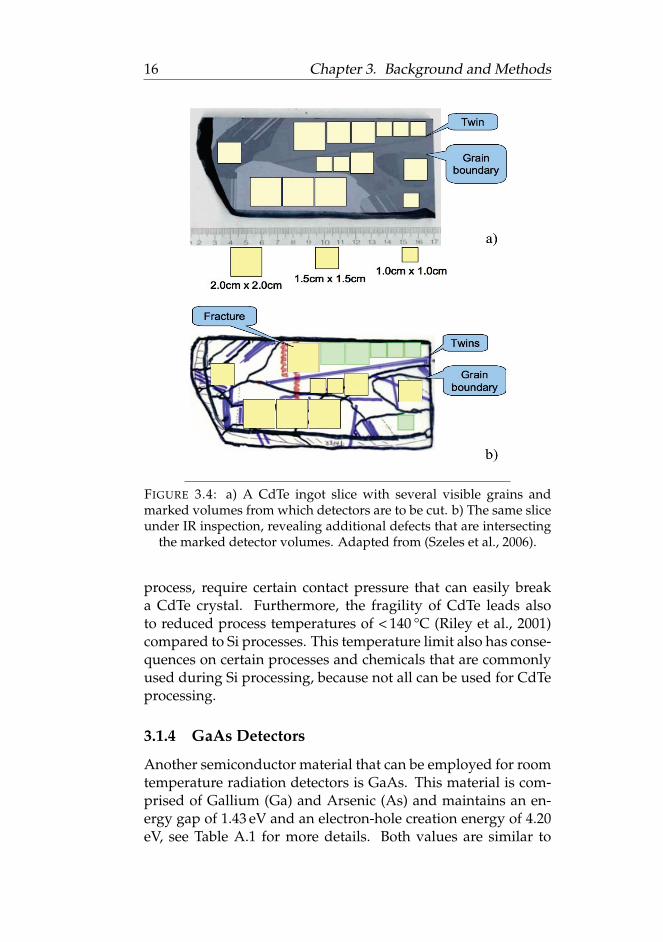
only 2 inch diameter ingots are available (Jeong et al., 2014) thatare containing a few large grains. Larger diameters still con-tain numerous smaller grains, which result in low single crystalproduction yields. This non-availability of large diameter in-gots (and wafers) has a substantial impact on the detector pro-duction chain, as most devices and techniques of the semicon-ductor industry are designed for Si wafers of 6 inch diameteror larger and 300 μm thickness. Automated chip-scale process-ing, hence the processing of small cuboids of a few millimetersside length is largely impossible and thus requires manual han-dling. This increases the price further as well as the chancefor errors. A slice of an CdTe ingot containing several largergrains is shown in Figure 3.4. In addition to the visible grains(Figure 3.4a), more defects that were revealed by infrared (IR)inspection are marked in Figure 3.4b. Several additional grainboundaries and crystallographic defects are visible, partially in-tersecting the volumes from which the detector are to be cut. De-fects, such as grain boundaries or fractures inevitably lead to re-duced detector performance. Therefore, intensive quality assur-ance is required for constant, detector performance (Szeles et al.,2006; Winkler, 2017). The mechanical properties of CdTe includefragility (Stahle et al., 1999) and low hardness (Zhang et al.,2008), which further complicate detector production processes.For example mask aligners that are used during the lithography
16 Chapter 3. Background and Methods
FIGURE 3.4: a) A CdTe ingot slice with several visible grains andmarked volumes from which detectors are to be cut. b) The same sliceunder IR inspection, revealing additional defects that are intersecting
the marked detector volumes. Adapted from (Szeles et al., 2006).
process, require certain contact pressure that can easily breaka CdTe crystal. Furthermore, the fragility of CdTe leads alsoto reduced process temperatures of < 140 °C (Riley et al., 2001)compared to Si processes. This temperature limit also has conse-quences on certain processes and chemicals that are commonlyused during Si processing, because not all can be used for CdTeprocessing.
3.1.4 GaAs Detectors
Another semiconductor material that can be employed for roomtemperature radiation detectors is GaAs. This material is com-prised of Gallium (Ga) and Arsenic (As) and maintains an en-ergy gap of 1.43 eV and an electron-hole creation energy of 4.20eV, see Table A.1 for more details. Both values are similar to

3.1. Radiation Detection 17
the properties of CdTe and a similar performance might be ex-pected. However, the effective atomic number Zeff(GaAs) = 32(ZGa = 31, ZAs = 33) of GaAs is smaller than that of CdTe. Thishas direct impact on the relative cross sections of the photoelectrical-, Compton-effect and pair production processes andthus, the effectiveness to convert ionizing radiation into chargecarriers. The relations of Equation 3.1 allow an assessment ofGaAs detectors for their usage in medical applications and forBNCT-SPECT. Therefore, an evaluation of the absorption coeffi-cients for energies of < 600 keV is performed in Section 4.4.
The growth of the material is better understood than it isfor CdTe and various growth techniques exist. For example,Liquid Encapsulated Czochralski (LEC), Chemical Vapor De-position (CVD), Vertical Gradient Freeze (VGF) are commonlyused (Scheel et al., 2009). In addition, sufficient control overthe growth techniques can be achieved to allow the produc-tion of single crystal ingots of 2 inch diameters or larger. Themechanical properties of GaAs are similar to Si although at alower temperature range (Yonenaga et al., 1987). Devices madeof these semiconductors are also thermally stable (Sun et al.,2016). Therefore, many standard processes and instruments thatare used for Si processing are compatible with GaAs semicon-ductors. Another advantage of GaAs over CdTe is that thesesemiconductors can be doped, hence p- and n-type materialsare commercially available and thus various pn-junctions can bedesigned. The devices characterized for Publication IV were p-type/ intrinsic/n-type (PIN) structured diodes, grown with acustom-made Chloride Vapor Phase Epitaxy (CVPE) method.The diodes had a diameter of 1.75 mm and a thickness of 110 -130 μm.
3.1.5 Photon Counting Detectors
A spectrometer for radiation requires a large volume to ef-ficiently stop the ionizing event. In addition, sophisticatedreadout electronics are necessary for high resolution spec-troscopy. The latter usually contains only one input channel.Thus, spectrometers are usually made out of single planar elec-trodes (Knoll, 2010), which do not allow position sensitivity.Tracking and spatially resolved detectors, on the other hand, aresimple counters of larger, but thin areas comprised of millions of

18 Chapter 3. Background and Methods
pixel or strip electrodes. The Si particle tracking detector system(Dominguez et al., 2012) of the Compact Muon Solenoid (CMS)experiment at the Large Hadron Collider (LHC) at CERN (Con-seil Européen pour la Recherche Nucléaire, Meyrin, Switzer-land), is a distinct example of a counting detector. However, nospectral identification is possible, as the ionizing event is usu-ally not completely stopped within the detector. In addition, thesubsequent readout chain is not designed to provide the spectralinformation, as the tracking detector is followed by calorime-ters that measure the energy. The combination of spectrometricand position sensitivity is part of active research and is a crucialfunctionality for the proposed modification of the BNCT-SPECTmethod of this work. Devices in astro- and particle physics, thatare capable of recording spatial resolved spectra, are referredto as pixelated spectrometers (Alvarez et al., 2011). In medi-cal physics these devices are called photon counting detectors,although describing essentially the same device (Shikhaliev etal., 2011; Yu et al., 2015; Kalender et al., 2016). The discussionof technical details of these combined instruments goes beyondthe scope of this work and the reader is kindly referred to thededicated literature; for example Wilson et al. (2013), Macias-Montero et al. (2015), Muenzel et al. (2016), and Symons et al.(2017). The terms detector and spectrometer are used interchange-ably in this work, however this may not apply outside of thiswork.
A prototype of a photon counting detector based on CdTethat was build at the detector laboratory of the Helsinki Insti-tute of Physics (HIP, Helsinki, Finland) and is presented in Fig-ure 3.5. A readout chip (ROC) designed for the CMS pixel phaseI upgrade Publication V at the LHC was flip chip bonded to aCdTe crystal. The extensive measurements required to charac-terize the ROC and its functionality for the CMS pixel phase Iupgrade Publication V revealed that the chip is in principle com-patible with CdTe detectors and allows operation in PC mode.
3.2 Monte Carlo Simulations
Monte Carlo (MC) simulations are widely used to help to under-stand and analyze nuclear processes. In medical physics, partic-ularly in radiotherapy, the MC simulations are used to calculate

3.2. Monte Carlo Simulations 19
FIGURE 3.5: Prototype of a PC capable detector for the use in e.g. med-ical applications. The CMS ROC is on the bottom and the CdTe ele-ment on the top. The active detector material has a thickness of 1 mm.
the patient dose and to simulate the detector response, e.g. ex-pected counts. In MC and in particular MCNP (Monte Carlo N-Particle code, Monte Carlo Team, 2003a) simulations rely heav-ily on input libraries that contain data for the nuclear processesand their products that are to be simulated. Several researchgroups have specialized in maintaining and extending these li-braries (Chadwick et al., 2011; Koning et al., 2012; Shibata et al.,2012), but discrepancies between measured and simulated dataare found regularly (El Kanawati et al., 2011; Chadwick et al.,2011, Publication II). Furthermore, depending on the softwareversion used, not all nuclear process can be simulated simulta-neously. This leads to inconsistent results for mixed radiationfields, in which the products of one type of radiation influencethe results of another type. The mixed neutron and photon ra-diation field of BNCT is a particular example for that. The useof correct data libraries and results calculations are essential forMC simulations in medical physics and especially for the pro-posed modified BNCT-SPECT method. MCNP5 version 1.4 isused in this work (Monte Carlo Team, 2005).

20 Chapter 3. Background and Methods
3.2.1 Tallies F8 and F4
Depending on the problem, several calculation options can bechosen in MCNP. These are called tallies and are indicated withthe letter F in MCNP. The F8 tally for example allows to simu-late the pulse height spectrum measured by the detector. Fur-thermore, patient doses can be calculated with the energy de-position version (∗F8) of this tally (DeMarco et al., 2002; Ye etal., 2004). The F4 tally on the other hand, provides the totaltrack length flux of particles (including photons) of a cell (MonteCarlo Team, 2003a). The cell, is in the context of MCNP andthis work, the volume of the object, for which the flux is sim-ulated. The F8 tally is most useful for radiation therapy as thedose deposited to a medium can be calculated, although withpossibly less accuracy than with comparable codes (Koivunoroet al., 2012). However, the F8 tally does not allow the calcula-tion of mixed radiation fields with neutrons. For BNCT-SPECTsimulations this means that the pulse height spectrum of a com-bined electron, photon and neutron field can not be calculateddirectly. An error will be returned if simulations of the F8 tallyof a neutron field is attempted (Monte Carlo Team, 2003b). Thecorrect calculation of pulse height spectra for mixed radiationfields with neutrons is however essential for the proposed mod-ified BNCT-SPECT method (Section 1.2). The F4 tally does allowthis combination, but is not designed to provide pulse heightspectra of detectors. Nonetheless, it is still possible to simulatea pulse height spectrum of CdTe with the F4 tally. The requiredprocedures are presented in Section 4.2 and Publication II.
3.3 Experimental Setups Used in this Work
3.3.1 BNCT-SPECT
The experimental data of the Publications I - III of this work,were obtained with the epithermal neutron beam at the TRIGAMark II (FiR 1) reactor in Espoo, Finland (Auterinen et al., 2001).In each case a cylindrical plastic phantom made of polymethyl-methacrylate (PMMA, length 240 mm, diameter 200 mm) wasused to represent a patient’s head (see Figures 3.6 and 3.7).For each setup, different inserts were placed along the centralaxis (also referred to as the depth axis) of the phantom. First,

3.3. Experimental Setups Used in this Work 21
plain PMMA inserts representing the patient before the boronagent has been given. Second, some of these inserts were re-placed with boronated polyethylene (PE, 3-wt% B, which is≈ 2100 μg/g of 10B) cylinders (length 19 mm, diameter 30 mm),representing a patient’s tumor enriched with 10B, Figure 3.8.These PE cylinders were placed at a depth of 19 - 57 mm fromthe phantom’s surface, which is a typical working distance forepithermal neutron beams (Monshizadeh et al., 2015). Duringexperiments using the third setup, the PE cylinders were re-placed by a PE phial (length 108 mm, diameter 27 mm) contain-ing boric acid water with 400 μg/g 10B concentration. The phialwas placed to start from the surface of the phantom. The threesetups will be referred to as Phantom, Tumor and B-water in thiswork. An experimental configuration similar to the one pre-sented in Figure 3.6 was used for all setups.
FIGURE 3.6: General experimental setup used for Publications I - III.The detector is located inside the silver lead shielding on the left thatalso acts as a collimator. For the first experiments, the detector waskept stationary and was moved along the depth axis of the phantom
for later experiments.
The detector used in all experiments is an Amptek X-123CdTe spectrometer (Amptek Inc., 2016). For Publications I, thedetector was placed at a fixed position and distance from thephantom, as illustrated in Figure 3.6. For Publication III the de-tector was moved in several steps parallel along the phantoms

22 Chapter 3. Background and Methods
FIGURE 3.7: Close up of the phantom with boronated target inserts.The (white) PE targets used for the Tumor setup are visible on the left
hand side of the phantom.
depth axis. The detector itself was shielded with a 6 mm leadhousing encasing the whole device and acting as a collimatorwith a length of 22 mm. Further, a linear energy calibration wasperformed using 133Ba and 137Cs isotopes. This resulted in reso-lutions (FWHM) of 2.56 keV at 356 keV and 5.99 keV at 662 keV,respectively. The detector efficiency at 500 keV is approximately5.6% (Amptek Inc., 2002).
3.3.2 Transient Current Technique Test Setup for GaAsDiodes
A custom design Transient Current Technique (TCT) setup wasused for Publication IV. The TCT is used for measuring the ef-fective concentrations of charge carriers in pn-junction detectorsmade of various materials (Eremin et al., 1996). The TCT setupat HIP contains measurement specific, low-noise preamplifiers,bias-Ts2 as well as a red and an IR laser. The later are used tocreate charge carries in the semiconductors under test. All com-ponents are located inside a light-tight metal enclosure. After
2Bias-Ts are devices that allow to combine (separate) signals from (into)their components of direct- and alternating current.

3.3. Experimental Setups Used in this Work 23
FIGURE 3.8: Boronated PE (3-wt% B) targets used for the Tumor setup.
preamplification, signal amplitudes of the order of mV are ex-pected for the GaAs diodes. These are significantly smaller thanthe signals of Si diodes. This is partially due to the higher re-sistivity of GaAs (see Table A.1). Significant efforts were un-dertaken to reduce the electrical noise of the system, in order toenable the acquisition of the data that were presented in Publi-cation IV.
3.3.3 CMS Pixel Phase I Module Testing Setup
The setup used for Publication V is a standard probe station thatis available at the clean room facilities of HIP. A custom made,multichannel probe card was used to allow temporary electri-cal connection to the CMS ROC PSI46DIG (Dominguez et al.,2012); see Figure 3.9. Once a connection was established, a seriesof electrical tests were run to determine the functionality of theROC. Besides the large amount of ROCs that were tested, sub-stantial effort was put into noise reduction of the testing system.Both have led to a deeper understanding of the ROCs function-ality and its possible usage with CdTe detectors.

24 Chapter 3. Background and Methods
FIGURE 3.9: A CMS pixel Phase I Upgrade module (middle) undertest in the HIP probe station.
3.4 Tools Used in this Work
This section briefly describes the principles and relations re-quired to follow this work. All these principles are well-knownand are discussed in depth by various sources in the literature.
3.4.1 Nuclear Reactions Required for the ModifiedBNCT-SPECT Method
The nuclear reaction on which BNCT-SPECT is based on, is theBNC reaction 10B(n,α)7Li. A thermalized neutron (En≤ 25 meV)is captured by a 10B atom, followed by the release of anα particle and an excited 7Li atom. This occurs with 94% proba-bility. The relaxation process of the 7Li atom takes place quickly(∼ 10−13 s) under the release of a PG photon of the energyof 477.59 keV (IAEA, 2007; Knoll, 2010). The nuclear captureprocess ends with a 6% probability directly in the ground stateof the 7Li atom. The neutron capture cross section (σ [b]) of 10Bis with 3843 b comparably large at thermal energies (Chadwicket al., 2011), while most of the other isotopes possess a neutroncapture cross section in the scale of 10 b or less.

3.4. Tools Used in this Work 25
Equally important for this work is the nuclear reaction thatoccurs if a thermalized neutron is captured by a 113Cd atom ofthe detector. This transmutes the 113Cd atom into an excited114Cd atom, which relaxes under the release of a PG photonor conversion electrons of 558.46 keV, within ∼ 10−12 s (Castenet al., 1992). The PG photon is released with a probabilityof 74.4% (NNDC et al., 2017). This is the CdNC reaction113Cd(n,γ)114Cd. The probability that a thermal neutron iscaptured is very large (20609 b) at thermal energies (Koninget al., 2012). A CdTe detector made of natural Cd and Tepossesses about 6.11% 113Cd in its volume. The large neutroncapture cross section and detector thicknesses of 1 mm or largerallow a near total absorption of all thermal neutrons reachingthe detector. The PG photons released from the capture processare captured with approximately 66% probability in the samedetector volume. Due to the production and capture of the PGphotons in the same medium and the short travel distances,a virtually undistorted signal (e.g. by Doppler-broadening)can be observed. This leads to sharp and clear peaks in thespectrum that can easily be identified with known PG emissionsfrom the CdNC process.
3.4.2 Data Analysis
All raw data obtained from the CdTe spectrometer, such as pre-sented in Figure 4.1, have been filtered with a moving averagefilter to compensate for noise and statistical fluctuation. Addi-tionally, a baseline correction is performed to compensate thelower attenuation efficiency of higher energy photons. Finally,besides Figure 4.1, all spectra are plotted within an energy win-dow of 440 - 590 keV, which is the window of interest for the pro-posed modified method of BNCT-SPECT. The measurement er-ror of the spectrometer is based on an estimation of the detectorresponse to the calibration sources. A small error is observedfor larger count numbers (> 50). This error increases linearly forpeaks with count numbers close to the background level (< 10).
The uncertainty of the simulations is the statistical relativeerror (with confidence level of 1 standard deviation) providedby the MCNP results and is � 5% for the BNC and approxi-mately 1% for the CdNC reaction. Higher accuracy would have

26 Chapter 3. Background and Methods
required the extension of the simulation time beyond reason-able length. Furthermore, all simulated results have also beensmeared with the energy resolution measured for the CdTe de-tector and were plotted in the same energy windows of interestas the measured data.
27
Chapter 4
Results and Discussion
4.1 Proof of Concept of the Modified BNCT-SPECT Method
In this section, the usability of modern CdTe spectrometers forBNCT-SPECT and a proof of concept for the proposed methodis presented. The evaluation of modern CdTe spectrometers ingamma and neutron radiation fields is done with a focus on theevaluation of adequacy of the energy resolution and sensitivityof the detector for BNCT-SPECT. In addition, the ability to detectthe signals from both BNC and CdNC reactions is studied. Theresults of these discussions are presented briefly here, a moredetailed analysis can be reviewed in Publication I.
4.1.1 Sensitivity and Energy Resolution
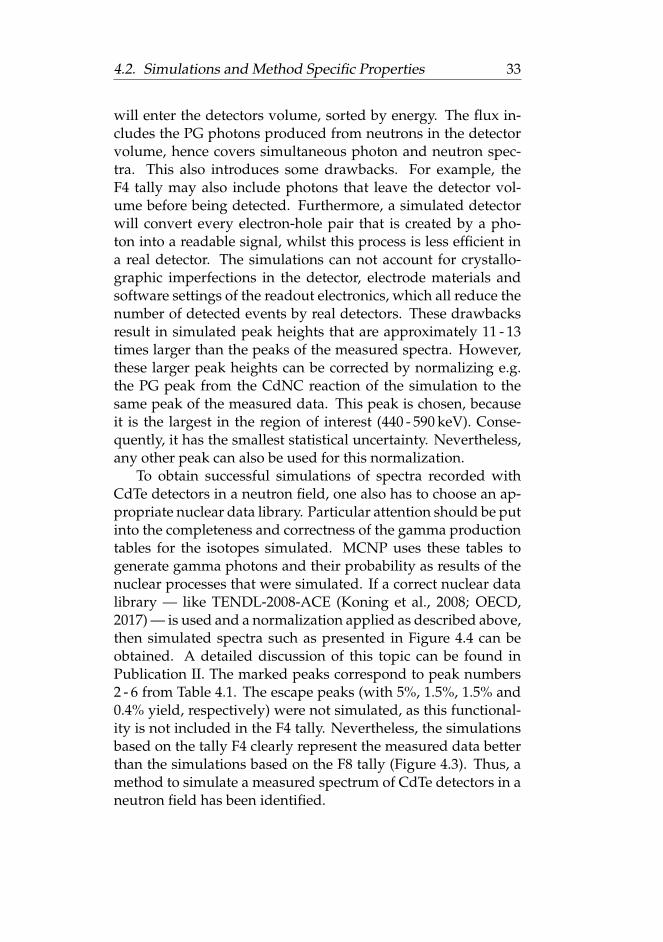
The raw spectrum obtained from the CdTe spectrometer, withthe Phantom Setup and in the neutron field of the FiR1, is pre-sented in Figure 4.1. The presence of distinct peaks is an evi-dent sign of a sufficient energy resolution for BNCT-SPECT. Themost important peaks are marked (from left to right) in Fig-ure 4.1 and in Table 4.1. The energy resolution at the largestpeak (# 5) is 4% (22 keV), which is equal to resolution requiredby Valda et al. (2005) and below the minimum of 33 keV thatwas estimated by Murata et al. (2014). The difference betweenthe centroids of peaks # 5 and 6 is with 19.62 keV the smallestdifference between all the peaks in the area of interest. It is with≈ 4% also within the requirement for the energy resolution setby Valda et al. (2005). In addition, peak # 5 and 6 can clearlybe distinguished from each other in Figure 4.1. Therefore, CdTespectrometers of the present technological level possess a high

28 Chapter 4. Results and Discussion
0 100 200 300 400 500 600 700Energy [keV]
103
104
105C
ount
s
1) Compton
2*) 478 keV
3) 511 keV
4) 535 keV
5) 558 keV
6) 578 keV
7) 651 keV
CdTe (measured)
FIGURE 4.1: Raw spectrum of the Phantom setup recorded with anepithermal neutron flux of 1.07 · 107 n/cm2s for 15 min. The important
peaks for this work are marked with their energies.
enough energy resolution for their usage in BNCT-SPECT. Fur-thermore, the presence of the discrete peaks # 2*, 4 - 7 proves thatit is possible to define neutrons as a signal and not as back-ground with this detector. Hence, it can be used for simulta-neous gamma and neutron detection.
The spectrum of Figure 4.1 has been obtained with 1% reac-tor power, which relates to a epithermal neutron flux of 1.07 · 107
n/cm2s, at an accumulation time of 15 minutes. This flux pro-duced a well pronounced spectrum with sufficient statistics toclearly identify the peaks and their energy. Shorter accumula-tion time (approximately 1/10 length), or lower reactor powerare still likely to produce sufficiently large peaks. Hence, thespectrometer is sensitive enough for the desired purpose.
4.1.2 Signals from Boron Neutron Capture andCadmium Neutron Capture Reactions
The signal from the BNC reaction is the most essential informa-tion for BNCT-SPECT, while the signal from the CdNC reactionis additionally important for the proposed modification of themethod. Both signals can be measured if a reference situationwithout boron is available. The raw spectrum of Figure 4.1 that

4.1. Proof of Concept of the Modified BNCT-SPECT Method 29
TABLE 4.1: Peaks, corresponding energies and relative productionyields (rel. yld.) marked in the spectrum of Figure 4.1.
Peak # Energy Description[keV]
1 380.00 Compton edge2 477.59 BNC PG (main emis. 94% rel. yld.)2* 477.60 CdNC PG (minor emis. ≤ 1% rel. yld.)3 511.00 Annihilation peak4 535.26 Cd, Te sgl. escape (strg. 5% rel. yld.)5 558.46 CdNC PG (main emis. 100% rel. yld.)6 578.08 CdNC PG (minor emis. 6% rel. yld.)7 651.26 CdNC PG (minor emis. 19% rel yld.)
has been taken with the Phantom setup can be considered assuch a reference situation. During the actual therapy, this infor-mation could be obtained by illuminating (low neutron flux of≤ 107 n/ cm2s) the patient for some time, before the boron agentboronophenylalanine (BPA) is administered. The accumulatedadditional patient dose at these fluxes is < 1% and thus, can beconsidered negligible. Spectra that are obtained after the boronagent has been given contain the desired information. The dif-ference between both spectra reveals the signal that is producedby the 10B. This difference can be used to calculate the 10B con-centration and location within the phantom (patient).
The Tumor setup is obtained by placing a boronated target(2100 μg/g of 10B) into the phantom. This represents the ad-ministration of the boron agent to the patient. The spectrumobtained from this setup is compared to the Phantom setup andis plotted in Figure 4.2. The difference between both spectra isemphasized with a shaded area. The peak from the CdNC re-action is decreased by approximately 2200 counts and the peakfrom the BNC reaction is increased by about 900 counts, if 10Bis present in the phantom. The peak details are listed in Ta-ble 4.2 for comparison. As described in Section 1.2, the signalfrom the CdNC is larger than the BNC signal, as the numberof neutrons that pass through the patient is substantially largerthan the number of neutrons that are captured by the 10B. Thisis the reason why the CdNC signal can be detected easier and

30 Chapter 4. Results and Discussion
FIGURE 4.2: Comparison spectrum of the Phantom and Tumor setups.The difference (shaded area) at the BNC and CdNC reaction peaks is
clearly visible, if 10B is present in the phantom.
has a larger SNR with less statistical fluctuation. Therefore, themeasurement of the CdNC signal is more accurate than the mea-surement of the BNC signal. This opens the possibility for moreaccurate patient dose calculations. Additionally, the CdNC sig-nal from the Phantom setup is larger than the CdNC signal fromthe Tumor setup, which proves that less neutrons are scatteredtowards the detector if 10B is present in the phantom. The op-posite situation is observed for the BNC reaction peak, whichincreases, if 10B is present in the phantom.
The presence of a peak at the BNC reaction energy, eventhough 10B is not present in the Phantom setup, is no contra-diction. The peak # 2*, at the energy of approximately 480 keV,shown in Figure 4.2, originates from several minor PG emissionsof the CdNC reaction (NNDC et al., 2017). The strongest emis-sion is at 477.60 keV, which is almost exactly at the same locationas the PG peak from the BNC reaction itself (477.59 keV). The in-tensities of these minor CdNC emissions are ≤ 1% compared tothe main PG emission at 558.46 keV, but are significant (≈ 50%)compared to the number of detected BNC reaction events. Theseadditional PG emissions are, however, always present if a CdTe

4.2. Simulations and Method Specific Properties 31
TABLE 4.2: Comparison of peak heights (in counts), energy resolu-tions (ΔE in keV) and peak height differences (Δ in counts) of the BNC
and CdNC reaction peaks, presented in the spectrum of Figure 4.2.
Phantom Tumor
BNC 876 1780ΔEBNC 3.10± 0.04 0.90± 0.02CdNC 22148 19944ΔECdNC 13.10± 0.17 10.50± 0.20ΔBNC + 904ΔCdNC - 2204
spectrometer is used in a neutron field. Therefore, these emis-sions are added towards the systematic background of the pro-posed method.
The sufficient energy resolution, the sensitivity and the abil-ity to detect both BNC and CdNC reaction peaks demonstratethe feasibility of the proposed approach for BNCT-SPECT, be-cause it is possible to detect signals from both gamma and neu-tron radiation fields. The difference between the two setups isclearly visible and the sensitivity of the detector for low neu-tron fluxes (compared to the therapy) is sufficiently high for theproposed modified method for BNCT-SPECT to be formulated.
4.2 Simulations and Method SpecificProperties
This section focuses on discussion of the simulations that are re-quired to verify the data measured with the CdTe detector andexplains how to obtain such simulations. The discussion is ex-tended to some specific properties of the modified BNCT-SPECTmethod.
4.2.1 Simulations
A pulse height response spectrum of the Tumor setup has beensimulated (Figure 4.3) in order to obtain a spectrum similar tothe one that was measured. The standard MCNP nuclear datalibrary ENDL92 (Los Alamos National Laboratory, 2004) and

32 Chapter 4. Results and Discussion
the tally F8 were used. The PG peak from the BNC reactionat 478 keV, which is most important for BNCT SPECT, is presentin all spectra, but underestimated compared to the measuredpeak. In addition, the PG peaks from the CdNC reaction arecompletely missing from the simulated spectra. Yet, these weremeasured simultaneously with the rest of the gamma spectrum,as the indicated by the graph CdTe, (measured) of Figure 4.3. Thereason for the missing PG peaks from the CdNC reaction is thatMCNP5 in version 1.4 is not simulating the energy depositionof neutrons with the F8 tally. In addition, simultaneous simula-tions of the photo and neutron spectra are not possible. Hence,the F8 tally cannot reproduce the PG photons that occur as aresult of neutron capture within the detector.
Since the pulse height spectrum of CdTe detectors in a neu-tron field can not be simulated correctly, a detour via tally F4 isinvestigated. The F4 tally is defined as the flux over the detec-
440 460 480 500 520 540 560 580Energy [keV]
101
102
103
104
Cou
nts
2) 478 keV
3) 511 keV 4) 5
35 keV
5) 558 keV
6) 578 keV
CdTe, (measured)CdTe, (simulated) F8 tally, ENDL92Ge, (simulated) F8 tally, ENDL92
FIGURE 4.3: Example of simulated PG spectra of CdTe and Ge detec-tors for the Tumor setup, simulated with the ENDL92 library and tallyF8. The peaks from the CdNC reaction (# 4 - 6) are completely missingand the BNC peak (# 2) is underestimated, compared to the measured
spectrum. The peak numbers refer to Table 4.1.
tor volume. This is in principle the number of net photons that
4.2. Simulations and Method Specific Properties 33
will enter the detectors volume, sorted by energy. The flux in-cludes the PG photons produced from neutrons in the detectorvolume, hence covers simultaneous photon and neutron spec-tra. This also introduces some drawbacks. For example, theF4 tally may also include photons that leave the detector vol-ume before being detected. Furthermore, a simulated detectorwill convert every electron-hole pair that is created by a pho-ton into a readable signal, whilst this process is less efficient ina real detector. The simulations can not account for crystallo-graphic imperfections in the detector, electrode materials andsoftware settings of the readout electronics, which all reduce thenumber of detected events by real detectors. These drawbacksresult in simulated peak heights that are approximately 11 - 13times larger than the peaks of the measured spectra. However,these larger peak heights can be corrected by normalizing e.g.the PG peak from the CdNC reaction of the simulation to thesame peak of the measured data. This peak is chosen, becauseit is the largest in the region of interest (440 - 590 keV). Conse-quently, it has the smallest statistical uncertainty. Nevertheless,any other peak can also be used for this normalization.
To obtain successful simulations of spectra recorded withCdTe detectors in a neutron field, one also has to choose an ap-propriate nuclear data library. Particular attention should be putinto the completeness and correctness of the gamma productiontables for the isotopes simulated. MCNP uses these tables togenerate gamma photons and their probability as results of thenuclear processes that were simulated. If a correct nuclear datalibrary — like TENDL-2008-ACE (Koning et al., 2008; OECD,2017) — is used and a normalization applied as described above,then simulated spectra such as presented in Figure 4.4 can beobtained. A detailed discussion of this topic can be found inPublication II. The marked peaks correspond to peak numbers2 - 6 from Table 4.1. The escape peaks (with 5%, 1.5%, 1.5% and0.4% yield, respectively) were not simulated, as this functional-ity is not included in the F4 tally. Nevertheless, the simulationsbased on the tally F4 clearly represent the measured data betterthan the simulations based on the F8 tally (Figure 4.3). Thus, amethod to simulate a measured spectrum of CdTe detectors in aneutron field has been identified.

34 Chapter 4. Results and Discussion
440 460 480 500 520 540 560 580Energy [keV]
101
102
103
104
105
Cou
nts
2) 478 keV
3) 511 keV 4) 5
36 keV
5) 558 keV
6) 576 keV
CdTe, (measured)CdTe, (simulated), F4 tally, TENDL-2008-ACEGe, (simulated), F4 tally, ENDL92
FIGURE 4.4: Simulated PG spectrum of the same configuration as inFigure 4.3, but with tally F4 and the TENDL-2008-ACE library. Be-sides peak # 4, all the relevant peaks are present (see the text for a
discussion). Peak numbers refer to Table 4.1.
Simulation of the Measured Data
Spectra that allow a comparison between Phantom and Tumorsetups can be obtained, if the method above is applied. Theresulting simulated spectra are compared to the measuredspectra in Figure A.1a on page 54. This figure shows that thegraphs of the simulations represent the measured situationadequately. The BNC reaction peak is larger if 10B is presentin the phantom (Tumor setup) and simultaneously the CdNCreaction peak is smaller. On the other hand, if 10B is not present(Phantom setup), then the peak height of the BNC reactionpeak is decreased, while simultaneously the peak of the CdNCreaction is increased. Figures A.1b and A.1c are closeups of theBNC and CdNC reaction peaks, respectively.
The spectra presented in Figure A.1a - c show that it is pos-sible to simulate measured spectra appropriately, as they would

4.3. Usability for Treatment Conditions 35
occur in the proposed modified BNCT-SPECT method. There-fore, verification of treatment data and more important predic-tion of patient doses become possible.
4.2.2 Method Specific Properties
In order to measure spectra from CdTe detectors, as presentede.g. in Figures 4.1 – 4.4, certain requirements for the detectorsize must be fulfilled. These spectra can only be obtained ifthe detector volume and especially its thickness are small com-pared to typical Ge detectors (>50 cm3). A CdTe cube of 1 cmside length (1 cm3), will already produce a spectrum with lessenergy resolution and a substantially larger annihilation peak,compared to the spectra presented in Figures 4.2 – 4.4. Photonsof higher energy, like the 2.2 MeV photons from the 1H(n,γ)2Dreaction will be captured with significant efficiency, which addsmore peaks to the spectrum. Annihilation and escape events in-duced by these photons can create additional smaller peaks thatmight interfere with peaks of interests (e.g. the BNC reactionspeak). Furthermore, it can be more challenging to design readout and bias electronics for the detector. Last, the raw materialprice of cubes of CdTe of 1 cm length is considerably larger thanfor square detectors of 1 cm length and only 1 mm thickness. Interms of these disadvantages, thicknesses of 1 - 5 mm are a goodcompromise.
Thin detectors on the other hand, have the advantage of be-ing cheaper and easier to handle for the readout electronics.Moreover, these detectors are nearly transparent for high en-ergy photons such as the ones from the 1H(n,γ)2D reaction. Thisallows lighter device structures, as less shielding is required.Additionally, the detectors life time is prolonged due to less in-duced radiation damage. Thin detectors (approximately 1 mm)also reduce the energy range of the spectrum to a maximum ofabout 800 keV, which is sufficient for the energy range of interest(400 - 600 keV) of the proposed modified BNCT-SPECT method.
4.3 Usability for Treatment Conditions
The previous section discussed the topic of data verification bymeans of simulations. Based on these, the usability of the pro-posed modification for BNCT-SPECT is discussed in this section.

36 Chapter 4. Results and Discussion
A potential method to localize a boronated target, utilizing ei-ther of the two nuclear reactions is presented together with fur-ther simulations. In addition, an evaluation of the SNR and thedependency of the signals to the 10B concentrations are made.All the figures of this section that consist of 2 subfigures showthe results from the BNC reaction on the top half of the figure,while the results of the CdNC reaction are presented on bottomhalf of the figure.
4.3.1 Scan Along the Depth Axis of the Phantom
The first verification of the usability has been done by measur-ing spectra at 4 different positions along the depth axis of thephantom. These 4 positions are approximating a line detectorof 4 pixels. The results of the measurements and correspondingsimulations are presented in Figure 4.5.
The difference between the setups (Phantom and Tumor) ofthe BNC reaction peak at step 1 (depth = 45 mm) is 11 counts(Figure 4.5, top). The BNC reaction peaks from both setupscan clearly be distinguished from each other, which indicatesthat the target is present in this area. This difference decreaseswith increasing distance along the phantom depth. Outside thetarget area (depth ≥ 95 mm) a count drop following an inversesquare function (fitted graphs of Figure 4.5) is measured. Usingthe fitted graphs, a decrease of 21 counts for the Tumor Setupis measured, compared to the position at 45 mm, whilst thecounts of the (fitted) Phantom Setup are reduced by 17 countsat this position. The signal from the boronated target thereforehas a difference of 4 counts. The measurement at 95 mm depthof the Phantom Setup has higher counts than expected and itcan not be completely ruled out that this measurement pointis an outliner due to unknown processes in the experiment.Therefore, the values of the fitted graphs have been used forthe calculations of the signal difference at this location. For theCdNC reaction a similar, but inverted situation can be observed(bottom of Figure 4.5). The CdNC reaction peak height of thePhantom setup is larger than the same peak of the Tumor setup,as more neutrons reach the detector. A difference between bothsetups can be observed at step 1. For steps 2 - 4, this differencegradually decreases, suggesting that no target is present at thesesteps. The decrease in counts is less abrupt as they were for

4.3. Usability for Treatment Conditions 37
FIGURE 4.5: PG peak heights of the BNC- (top) and CdNC- (bot-tom) reactions peaks for different positions along the depth axis of
the phantom.
the PG photons from the BNC reaction, because the neutronsare not affected by the lead collimator of the detector. Apartfrom the outliner at depth = 95 mm, the simulations of these ex-periments support our findings. The count difference betweenboth setups is also at step 1 the largest for the simulations. Thisapplies equally for both reaction types. The SNR of the CdNCreaction is at the target position approximately 7.1, while itis only 1.4 for the BNC reaction. In addition, the SNR dropsdown to approximately unity (1) at positions 2 - 4 for the BNCreaction, whilst it is always larger than 1 for the CdNC reaction.This further supports the assumption that the SNR of the CdNCreaction is superior to that of the BNC reaction, if the CdNC

38 Chapter 4. Results and Discussion
reaction is used as a signal. A detailed discussion of all aspectsof Figure 4.5 can be found in Publication III.
4.3.2 Virtual Line Detector
Clear signal differences in the spectrum can be measured withonly 4 locations along the depth axis of the phantom, howeverhigher spatial resolution is required to locate the target. For thisreason, a line detector consisting of 42 pixels separated by leadcollimators was simulated for the Phantom and Tumor setups.The resulting spectra are presented in Figure 4.6. The location ofthe boronated target and the end of the phantom are indicatedin the Figure, as well as the measured data that was describedin the section above. The first data point of the 4 step scan is ap-proximately located at pixel number 8, when counting from thebeginning of the depth axis. The differences in counts betweenthe Phantom and Tumor setups are clearly visible for both reac-tion types. Especially, the signal from the BNC reaction benefitsfrom the inter-pixel collimators, as the area of elevated countsfrom the Tumor Setup is placed in the area of the actual tar-get location. This already allows a coarse localization between10 - 70 mm along the depth axis of the phantom. The SNRs ofboth Phantom and Tumor Setups of the BNC reaction reach thenoise level (SNR = 1) at about 100 mm depth. The CdNC reac-tion reaches this level at a depth value of 200 mm. A clear sep-aration between the counts of the Phantom and Tumor Setupof the CdNC reaction is also visible. However, a coarse local-ization is not easily possible due to the gradual decrease of thecount difference of the Phantom and Tumor setup.
Target Localization
A localization of the target from a data set such as the one ofFigure 4.6 can be performed by applying the algorithm below.Whereas, the algorithm of Equation 4.1 is a naïve example toindicate the similar treatment of the photons and neutrons bythe algorithm. The fields of inverse mathematics (e.g. Muelleret al., 2012) and statistical signal processing (e.g. Särkkä, 2013)offer more sophisticated methods. Essentially, the algorithm Ltakes the second derivative of the absolute count difference, that

4.3. Usability for Treatment Conditions 39
FIGURE 4.6: PG peak heights of the BNC- (top) and CdNC (bottom)reactions measured by a simulated line detector with 42 segments of3 x 3 x 1 mm3 along the depth axis of the phantom. Each pixel was
simulated with a 22 mm collimator and 3 mm of lead spacing.
is obtained when subtracting the results from the Tumor andPhantom Setups.
L(n) =d2
d2counts
(|Phantom − Tumor|
)(4.1)
Here n indicates the n-th simulated detector element (pixel)along the line detector. The target identification is performedby choosing the detector element located before the global min-imum of L as the starting point of the target. While the detectorelement before the global maximum of L identifies the end of the

40 Chapter 4. Results and Discussion
target. The results from this calculation are shown in Table 4.3(top) on page 45 and in Figure 4.7. The target location is markedwith a shaded gray area and the detector elements that indi-cate the beginning and end of the target are marked with a boldline. The relative uncertainty of L is dependent on the detec-tor element being evaluated and is the sum of the correspond-ing uncertainties obtained from the simulations of the Phantomand Tumour Setups. The uncertainties are plotted as errorbarsin Figure 4.7. The largest error is 1.9% and < 0.3% for the BNCand CdNC reactions, respectively. The spatial uncertainty of L isdominated by the pixel size, a value of ± 1.5 mm is assumed forall pixels. The algorithm L allows the localization of the targetat (20 - 56± 1.5) mm depth of the phantom based on the BNC re-action (asterisk markers) and at (8 - 116± 1.5) mm depth basedon the CdNC reaction (diamond markers). Especially, the re-sults based on the BNC reaction are in good agreement with thereal location of the target, which was simulated at (19 - 57) mmdepth. The localization based on the CdNC reaction is less ac-curate, however, possible even with this naïve approach. Thus,
FIGURE 4.7: Visualization of the localization function L as describedin Section 4.3.2. For the BNC reaction (asterisk markers), the targetlocation coincidences with the detector element before the global min-imum and maximum of L. For the CdNC reaction (diamond markers),
the localization is less accurate.
an approximate target localization, based solely on the neutrons

4.3. Usability for Treatment Conditions 41
that pass through the phantom (patient) is feasible. The accu-racy can be increased by taking neutron scatter effects into con-sideration when evaluating the CdNC signal (Hassanein et al.,2005). Even though the presented simple target localization thatis based on the CdNC reaction does not provide additional accu-racy compared to the localization based on the BNC reaction, itcan still be used for the purpose of validation. A combination ofboth localization results might also improve the accuracy. Addi-tionally, a redundant validation source will become increasinglyimportant at the 10B concentration levels that are actually usedduring BNCT. The results presented up to this point were ob-tained with a high 10B concentration target of 2100 μg/g, whiletreatment levels are substantially lower (approximately 1/40), aswill be discussed next.
4.3.3 Lower Concentrations of 10B
Further reactor tests and simulations were performed, to answerthe question if lower 10B concentrations can still be detectedwith modern CdTe spectrometers. A boric acid phial containing400 μg/g of 10B was employed as a target. The correspondingresults are presented in Figure 4.8 and are comparable to the 4step scan along the depth axis obtained with the high concen-tration target.
After correction of the simulated data, results close to theexpected and measured values were obtained (details in Pub-lication III). The concentration of 400 μg/g 10B in the B-waterphial is 81% smaller than the 10B concentration in the PE target(2100 μg/g) of the Tumor setup. Therefore, a BNC reaction sig-nal from the B-water setups that is 81% smaller than the signalfrom the Tumor setup is expected, simulated and measured. Incase of the BNC reaction with the boronated target, this relatesto a net signal of 2 counts, at 58 counts. For the CdNC reactionthe 81% signal reduction results in an increase of 22 counts, at253 counts. Both compared to the signals that are obtained withthe high boron concentration target that is used in the TumorSetup. Both the measured and simulated data match these ex-pectations well. For the BNC and CdNC reaction 59 counts and253 counts are obtained. The SNR of the BNC and CdNC reac-tions at 95 mm depth (length of the boric acid phial) is 1.3 and

42 Chapter 4. Results and Discussion
FIGURE 4.8: PG peak heights of the BNC- (top) and CdNC (bottom)reactions for different positions along the depth axis of the phantom.The counts from the B-water phial (400 μg/g 10B) are located between
the Tumor (2100 μg/g 10B) and Phantom setups.
4.6, respectively. Additional accuracy can be obtained by apply-ing further corrections as described in Publication III. Supple-mentary discussions of the remaining measurement positions ofthe B-water setup are also done in Publication III. Either-way,400 μg/g of 10B lie well within the range of sensitivity of the de-tector and the signal strength can be predicted accurately.
The typical real treatment concentration of 10B however arestill smaller in BNCT. Concentrations up to about 50 μg/g havebeen reported (Coderre et al., 1998). In order to determineif these realistic low concentrations can still be detected withmodern CdTe spectrometers, further simulations of the B-water

4.3. Usability for Treatment Conditions 43
setup were performed. The results of these simulations suggestthat 10B concentrations of < 5 μg/g can still be detected with theproposed approach. The details of this discussion can also befound in Publication III.
4.3.4 Simulations with Realistic Boron TargetConcentrations and Boron Background in thePhantom
The experiment of Section 4.3.2 was repeated, to investigate if itis possible to detect realistic concentrations of 10B with the linedetector. A target concentration of 52.5 μg/g 10B and additionalof 15 μg/g 10B, homogeneously distributed in the phantom weresimulated. This represents a boron concentrations of 3.5:1 fortumor and healthy tissue as described by Kankaanranta et al.(2012). The through L determined difference (B-water phial mi-
FIGURE 4.9: Simulated PG peak height differences from the BNC- (as-terisk markers) and CdNC- (diamond markers) reactions for 52.5 μg/g10B in the B-water target and 15 μg/g 10B in the phantom, represent-ing a tumor to tissue boron ratio of 3.5:1. Localization is still possible
for both reactions.
nus pure water target) is presented in Figure 4.9 and is with < 1and with < 0.1% uncertainty, small for both reaction types. Nev-ertheless, a difference can still be identified. A localization of thetarget was attempted based on algorithm L of Section 4.3.2. The

44 Chapter 4. Results and Discussion
detector segments that identify the beginning and end of the tar-get are indicated. A localization based on the BNC reaction suc-ceeds, despite the small difference of 0.05 provided by L. The tar-get is located at a calculated phantom depth of (8 - 86± 1.5) mm,while the real target location is modeled from (19 - 57) mm, i.e.,the shaded gray area of Figure 4.9. This is a lower accuracy com-pared to the high concentration target and is expected due to thesmall signal difference. The flattened incline of the L function inFigure 4.9 represents this lower signal difference. It also showsthat the differences of the BNC reaction are close to the detec-tion limit as the global maximum of L is not significantly largerthan the rest of the graph. Therefore, an additional target local-ization and/ or confirmation is desirable. The difference fromthe CdNC reaction on the other hand is larger (0.7, < 0.1% un-certainty), which also allows a successful localization based onthis reaction type. The beginning of the target is calculated tobe at (8± 1.5) mm and the end at (98± 1.5) mm. All results arelisted in Table 4.3 (bottom). Again the CdNC results are lessaccurate than the location obtained with the BNC reaction, asthe neutrons are not affected by the lead collimator of the de-tector. However, the minimum and maximum of the L functionare more distinct, which shows that the difference of the CdNCsignal is larger. Thus, it is easier to detect. Dedicated neutronlocalization algorithms are required for better results.
These results show that a potential target localization by us-ing the BNC or the CdNC signal alone is also possible at re-alistic 10B concentration levels in tumor and the surroundinghealthy tissues (10B concentration ratio of tumor to healthy tis-sue of 3.5:1), if modern CdTe spectrometers are used. The resultsalso show that the information of the neutrons that pass throughthe patient can be used to locate, or confirm the location of a tu-mor. This is especially important under treatment conditionsand at smaller SNRs, because the localization based on the BNCreaction of the realistic target is significantly less accurate thanthe localization obtained with the high concentration target thatwas used in Section 4.3.2.

4.4. Testing of the GaAs diodes 45
TABLE 4.3: Calculated localization of a 2100μg/ g 10B target inside aphantom (top) and for a boric acid in water target of 52.5μg/ g 10Binside a phantom with 15μg/ g 10B concentration (bottom). The local-ization is calculated with the algorithm 4.1. All numbers are in mm.
Beginningbetween
pixelslocated at
Averagelocation
Endbetween
pixelslocated at
Averagelocation
BNC(2100μg/g 10B)
17 – 23 20± 1.5 53 – 59 56± 1.5
CdNC(2100μg/g 10B)
5 – 11 8± 1.5 113 – 119 116± 1.5
BNC(52.5μg/g 10B)
5 – 11 8± 1.5 83 – 89 86± 1.5
CdNC(52.5μg/g 10B)
5 – 11 8± 1.5 95 – 101 98± 1.5
Actual targetlocation
19 57
4.4 Testing of the GaAs diodes
In order to measure the TCT signal from the GaAs diodes, thecorresponding setup, required improvements to reduce the elec-trical noise interference. Several sources of noise were identi-fied for this setup. First, a large opening acting as a cable feedthrough. Second, the preamplifier was not on the same electri-cal ground level as the metal enclosure. Last, the signal cableconnecting the GaAs diode and the preamplifier had a lengthof about 40 cm. Especially, the last issue is of importance asOhmic losses and electrical interference (cable acting as an an-tenna) can reduce the signal amplitude below the noise level.These sources of noise were eliminated by the closing the Fara-day cage with conductive tape, electrically connecting the chas-sis of the preamplifier to the metal Faraday cage and reducingthe detector – preamplifier cable length to 10 cm. After elimina-tion of these noise sources, the data presented in Publication IVwere collected.

46 Chapter 4. Results and Discussion
Several GaAs diodes and detectors were produced into ra-diation detectors for Publication IV. These can also be oper-ated in PC mode, assuming appropriate readout electronics areused (Wu et al., 2014). However, due to the lower absorption ef-ficiency of GaAs compared to CdTe, larger detector thicknessesare required for effective usage in medical applications. In or-der to achieve a similar absorption efficiency as 1 mm CdTe at100 keV X-ray energy, a GaAs crystal of 15 mm thickness is re-quired. The produced prototypes on the other hand, were only110 and 130 μm thick. Thus, the resulting detector’s efficiency istoo low for use in most medical applications including BNCT-SPECT. Larger thicknesses require further optimization of thecustom-made CVPE method, in order to reduce intrinsic stressesand wafer bowing (Wu et al., 2015). Hence, a more matured de-tector production process is required. The application in the softX-ray range (≤ 33 keV) as used in mammography, might how-ever still be feasible. For these applications, GaAs could be a vi-able solution, as production costs for large panel detectors (typ-ical mammography imaging cassettes are 24 x 30 cm2) are likelyto be lower than for CdTe detectors.
4.5 Testing of the CMS Pixel Phase I UpgradeReadout Chip
HIP constructed 250 of the 672 sensor modules required for thepixel Phase I Upgrade of the CMS tracker at the LHC. Each mod-ule consists of 16 ROCs, with each one required to pass dedi-cated electrical and noise tests. These were described in the cor-responding technical design report (Dominguez et al., 2012). Aprobe-station with a custom made probe card is required to es-tablish temporary electrical connection to the ROCs and to con-duct the module tests. It is essential that Both the probe stationand -card are operated in a low noise environment. Thus, ex-tensive efforts were undertaken to identify the sources of theelectrical noise and their reduction. Such noise sources are sys-tem specific and therefore require individual solutions for everydevice and location.
Two large sources of noise were identified. First, an incom-plete Faraday cage of the probe-station and second, electricalnoise induced by surrounding devices through the power grid.

4.5. Testing of the CMS Pixel Phase I Upgrade Readout Chip 47
These sources were eliminated by reinforcing and adding ad-ditional electrical connections to each component of the probe-station housing and thus closing the Farraday cage. The secondnoise source was eliminated by adding an isolation transformerto the power line of the measurement devices.
The CMS module testing was performed after successful re-duction of the noise. More than 1000 ROCs have been tested fortheir functionality. These tests revealed the additional PC oper-ation mode that was intended as a debug function during thedesign phase of the ROC. This mode was tested by irradiatingone CMS pixel Phase I Upgrade module with an 241Am source.The obtained spectrum is presented in Figure 4.10.
0 10 20 30 40 50 60 70Energy [keV]
100
101
Cou
nts
FIGURE 4.10: An 241Am spectrum recorded with a CMS pixel Phase IUpgrade module. The main photopeak at 59.54 keV is indicated. The
detector is a 300 μm Si detector, flip chip bonded to a CMS ROC.
The main photopeak of the 241Am source is dominating thespectrum at 59.54 keV. The energy resolution is approximately17%, which is only a fraction of values achieved by standard Si-PIN detectors (Amptek Inc., 2017). A direct comparison how-ever, should be made with caution, because standard Si-PINdiodes are designed as cylindrical volumes similar to Ge detec-tors and not as 300 μm thin tiles. Thus, only a qualitative com-parison is possible.
Nevertheless, testing the CMS pixel Phase I Upgrade mod-ules revealed that the employed ROC is a suitable candidate for

48 Chapter 4. Results and Discussion
PC operation in medical applications. In combinations with aCdTe detecting element, these ROC are a suitable option for a2D detector array that can be used in BNCT-SPECT. Therefore,HIP started to investigate if PC detectors based on CdTe andCMS ROCs can be produced. The processes required for theproduction of electrodes on the CdTe crystals and to flip chipbond these to the ROCs, were developed by HIP and AdvacamOy at Micronova (Espoo, Finland). The prototype presented inFigure 3.5 on page 19 is a result of these efforts. The evaluationof this prototype has been set for future work.

49
Chapter 5
Conclusions and FutureWork
The first major task of this work was to test the suitability ofa modern, PC CdTe spectrometer for BNCT. It was found thatthe detector is highly sensitive and produces good signal statis-tics, even at neutron fluxes as low as 1% of the values that areused during the treatment. Furthermore, the energy resolutionof the detector is good enough to allow the identification ofthe photo peaks relevant for the proposed modified method ofBNCT-SPECT. Additionally, it was verified that both the BNCand CdNC reactions are dependent on the presence of 10B in thephantom (Publication I). These results led to the formulation ofthe proposed modification of the BNCT-SPECT (Section 1.2).
After the principle of the proposed method had been shown,the topic of verification by means of simulations was addressed(Publication II). It was found that simulations of the pulse heightresponse spectra (tally F8 in MCNP code) for CdTe detectors inneutron fields did not reproduce the measured data. An inves-tigation of this topic revealed that the PG peaks from the CdNCreaction are missing in standard nuclear libraries. A secondarycause was found to be a restriction of the employed version ofMCNP5 version 1.4, which does not allow the simulation of re-sponse spectra, if photon and neutrons fields are simulated si-multaneously. This situation was resolved by using a combi-nation of an alternative output tally (F4 instead of F8), a specificnuclear library (TENDL-2008-ACE; Koning et al., 2008) and nor-malization of the received results to measured data. This com-bination allowed verifications of the measured data that werepresented in Publication I.

50 Chapter 5. Conclusions and Future Work
After both, the proof of the concept and the numerical verifi-cation of the proposed modification to BNCT-SPECT were achie-ved, an evaluation of a closer-to-treatment situation was per-formed. The primary task was to assess if the boronated targetof a high 10B concentration (2100 μg/g) can be localized in thecylindrical phantom. A 4-point scan along the central axis ofa phantom was performed, coarsely localizing the target withboth reaction types. Based on these results, a line detector con-sisting of 42 CdTe pixels was simulated and a target localizationwas performed using the signal from either reaction type. Themost accurate results were received with the information of theBNC reaction, whilst the CdNC reaction results were less ac-curate, but still allowed successful localization. Nevertheless,the signal from the BNC reaction suffered from low SNR values,just as previous BNCT-SPECT attempts had suffered. The signalfrom the CdNC reaction on the other hand, showed up to fivetimes larger SNR values, which allowed better distinction fromthe background.
Further experiments confirmed that the modern CdTe sec-trometer is capable of detecting signals from a target of approx-imately 80% lower 10B concentration. Supplementary simula-tions suggest that realistic target treatment concentrations of≈ 50 μg/g 10B can also be detected. Therefore, additional sim-ulations were performed to investigate if the signals of a realis-tic treatment concentration are still detectable. These concentra-tions were 52.5 μg/g 10B in the target and an additional 15 μg/gof 10B homogeneously distributed in the phantom. A localiza-tion of the target was possible for both reaction types. However,the location obtained through the BNC reaction was substan-tially less accurate so that confirmation through the CdNC reac-tion is required (Publication III).
The results suggest that improvements in target localizationcan be achieved if the detector area is increased, which allowsthe detection of more events from the BNC reaction. Addition-ally, neutron collimators and dedicated localization algorithmsfor each reaction type are likely to contribute further improve-ments. A 2D detector array will also allow image reconstructionin three dimensions.
The reduction of electrical noise for the TCT setup at HIPwas successfully achieved, allowing the measurement of smallsignal amplitudes. The feasibility of GaAs detector for medical

Chapter 5. Conclusions and Future Work 51
applications was discussed with the result that these materialsmight be an option for soft X-ray applications, assuming thickerdetectors can be produced.
Finally, a measurement setup to test the detector modulesfor the CMS pixel Phase I Upgrade -project was installed andtested at the clean room facilities of HIP. The test setup wasthoroughly adjusted to reduce the electrical noise backgroundand allow high precision measurements. Over a thousand CMSROCs have been tested and their functionality was evaluated.This allowed a deeper understanding of the chip and its possibleusage as a PC detector in medical applications. A prototype of aCdTe element on a CMS ROC has been build by the CMS groupof HIP. An evaluation of the prototype and its performance is setfor future studies.
Research Conclusion
The main goal of this thesis was to investigate novel detectortechnologies for medical applications. The next step in med-ical imaging and therapy, is the employment of PC detectors.These kinds of detectors allow the acquisition of spectra of theapplied radiation for each pixel of the detector. Whilst the ma-jority of currently used detectors record the intensity only. Thespectral information can be used for numerous applications anddiagnostic improvements. A distinct example that benefits fromthe usage of PC detectors was presented for BNCT. This ther-apy lacks an accurate method to determine the 10B concentra-tion and distribution within the patient and during the treat-ment. A SPECT like approach, has been favored to determinethe 10B concentration and is called BNCT-SPECT. This approachemploys the PG signal of the BNC reaction, but fails because ofthe low SNR ratio of this signal. This is due to the small numberof PGs from the BNC reaction, as compared to the overall num-ber of background photons and the number of neutron inducedphotons from the epithermal neutron beam.
A method has been proposed (Publication I and Section 1.2)to improve BNCT-SPECT by employing PC detectors based onCdTe. In addition, to the high sensitivity for the PGs from theBNC reaction, these detectors are also sensitive to the PGs fromthe CdNC reaction, which occurs within the detector itself. The

52 Chapter 5. Conclusions and Future Work
signal from the CdNC reaction is, like the signal from the BNCreaction, dependant on the amount of 10B present in the patient.The CdNC signal however, possesses a larger SNR value andis therefore easier to detect in BNCT-SPECT. Both the BNC andCdNC signals can then be used for dose determination and lo-calization efforts.
It is the PC ability of the detector however, which allows thismodification to the therapy, because only through the PC oper-ation, the distinction of both reaction types and the backgroundfrom one another, become possible.
Recommendation for Future Research
For the future, it is suggested that further verification of theproposed modified BNCT-SPECT method should be performed.Mainly, the experimental evaluation of the target localizationbased on both reaction types is required for further develop-ments. This can be achieved by repeating the experiments as de-scribed in Publication III and employing a line detector, or a 2Ddetector array comprised of PC CdTe detectors. Such an arraywill also enable tomographic image reconstruction. In coopera-tion with the development of dedicated localization algorithms,real time target localization and dose calculations become pos-sible in BNCT-SPECT.
Unfortunately, such a detector array did not exist at the timeof writing this thesis. Therefore, efforts should be invested tofurther the development of CdTe based PC detector arrays. TheCMS group at the detector laboratory of HIP has started theseefforts and the evaluation of the first prototype is expected tocontribute not only to BNCT, but to the entire field of radiationdetection in medicine.

53
Appendix A
Additional Figures andTables

54 Appendix A. Additional Figures and Tables
440460
480500
520540
560580
Energy [keV
]
101
102
103
104
Counts
a) Co
mp
arison
of m
easured
vs. simu
lated d
ata from
Tu
mo
r and
Ph
anto
m setu
ps
2) 478 keV
3) 511 keV4) 535 keV
5) 558 keV
6) 578 keV
CdT
e, (measured), T
umor
CdT
e, (measured), P
hantomC
dTe, (sim
ulated) Tum
orC
dTe, (sim
ulated) Phantom
470475
480485
Energy [keV
]
101
102
103
Counts
b) C
loseu
p: 478 keV
, BN
C reactio
n
557558
559560
Energy [keV
]
2.1
2.2
2.3
2.4
2.5
2.6
Counts
104
c) Clo
seup
: 558 keV,C
dN
C reactio
n
FIG
UR
EA
.1:a)Com
parisonofsim
ulatedand
measured
dataofthe
Tumor
andPhantom
setups,recordedfor
PublicationI.The
BNC
andC
dNC
peaksare
simulated
inthe
correctorderofm
agnitude.Closeup
oftheBN
Cand
CdN
Cpeaks
inFigures
b)andc),respectively.A
countdifferencebetw
eenthe
Phantomand
Tumor
Setupsis
presentforboth
measured
andsim
ulateddata.

Appendix A. Additional Figures and Tables 55
TAB
LE
A.1
:Ph
ysic
alpr
oper
ties
ofth
ese
mic
ondu
ctor
san
dco
mpo
und
sem
icon
duct
ors
that
qual
ify
for
radi
atio
nde
tect
ors
inm
edic
ine
atT
=25
°C.A
dapt
edfr
omD
elSo
rdo
etal
.(20
09).
Mat
eria
lSi
Ge
GaA
sC
dTe
Cd 0
.9Z
n 0.1
TeH
GI 2
TlB
r
Cry
stal
stru
ctur
eC
ubic
Cub
icC
ubic
(ZB)
Cub
ic(Z
B)C
ubic
(ZB)
Tetr
agon
alC
ubic
(CsC
l)G
row
thm
etho
d*
CC
CV
DTH
MH
PB,T
HM
VAM
BMA
tom
icnu
mbe
r14
3231
,33
48,5
248
,30,
5280
,53
81,3
5D
ensi
ty(g
/cm
3)
2.33
5.33
5.32
5.85
5.78
6.40
7.56
Ener
gyga
p(e
V)
1.12
0.67
1.43
1.44
1.57
2.13
2.68
Pair
crea
tion
ener
gy(e
V)
3.62
2.96
4.20
4.43
4.60
4.20
6.50
Res
isti
vity
(Ωcm
)10
450
107
109
1010
1013
1012
μ eτ e
(cm
2/V
)>
1>
110−5
10−3
10−3
-10−
210−4
10−5
μ hτ h
(cm
2/V
)≈
1>
110−6
10−4
10−5
10−5
10−6
The
mor
eco
mm
ongr
owth
met
hods
:C=
Czo
chra
lski
,CV
D=
Che
mic
alV
apor
Dep
osit
ion,
THM
=Tr
avel
ing
Hea
ter
Met
hod,
BM=
Brid
gman
Met
hod,
HPB
=H
igh-
Pres
sure
Brid
gman
and
VAM
=Ve
rtic
alA
mpo
ule
Met
hod,
μ eτ e
and
μ hτ h
are
the
elec
tron
-and
hole
mob
ility
-lif
etim
es.


57
Bibliography
Alvarez, Jose-Manuel, Jose Luis Galvez, Margarita Hernanz,Jordi Isern, Manuel Lozano, Giulio Pellegrini, MokhtarChmeissani, Ezio Caroli, and Rui M Curado da Silva (2011).“CdTe/ CZT pixel detector for gamma-ray spectrometrywith imaging and polarimetry capability in astrophysics”.In: 2011 IEEE Nuclear Science Symposium and Medical ImagingConference (2011 NSS/MIC). IEEE, pp. 4611–4615.
Amptek Inc. (2002). Efficiency of Amptek XR-100T-CdTe and -CZT Detectors Application Note ANCZT-1 Rev 2. Online; ac-cessed 13-January-2017. URL: http://amptek.com/pdf/cztapp1.pdf.
— (2016). Website of the Amptek company. Online; accessed 13-January-2017. URL: http://amptek.com.
— (2017). Website of a Si-PIN detector from the Amptek company.Online; accessed 12-May-2017. URL: http : / / amptek .com / products / xr - 100cr - si - pin - x - ray -detector/.
Auterinen, Iiro, Pekka Hiismäki, Petri Kotiluoto, Rolf J. Rosen-berg, Seppo Salmenhaara, Tiina Seppälä, Tom Serén, VesaTanner, Carita Aschan, Mika Kortesniemi, Antti Kosunen,Juhad Lampinen, Sauli Savolainen, Matti Toivonen, andPetteri Välimäki (2001). “Metamorphosis of a 35 Year-OldTRIGA Reactor into a Modern BNCT Facility”. In: Fron-tiers in Neutron Capture Therapy: Volume 1. Ed. by M. Fred-erick Hawthorne, Kenneth Shelly, and Richard J. Wiersema.Boston, MA: Springer US, pp. 267–275. ISBN: 978-1-4615-1285-1. DOI: 10.1007/978-1-4615-1285-1_36. URL:http://dx.doi.org/10.1007/978-1-4615-1285-1_36.
Barber, W C, J C Wessel, E Nygard, and J S Iwanczyk (2015).“Energy dispersive CdTe and CdZnTe detectors for spectralclinical CT and NDT applications”. In: Nuclear Instruments

58 BIBLIOGRAPHY
and Methods in Physics Research Section A: Accelerators, Spec-trometers, Detectors and Associated Equipment 784, pp. 531–537.
Beckert, M Brooke, Sabrina Gallego, Yong Ding, Eric Elder, andJason H Nadler (2016). “Medical imaging scintillators fromglass-ceramics using mixed rare-earth halides”. In: OpticalMaterials 60, pp. 513–520.
Biomedicum Helsinki Foundation (2016). Helsinki UniversityHospital receives a novel type of neutron source for cancer ther-apy. Online; accessed 2-April-2017. URL: http : / / www .biomedicum.fi/index.php?page=2826&lang=2.
Bushberg, Jerrold T., J. Anthony Seibert, Edwin M. Leidholdt,and John M. Boone (2001). The Essential Physics of MedicalImaging (2nd Edition). 2nd ed. Lippincott Williams & Wilkins.ISBN: 0683301187.
Casten, R F, J Jolie, H G Börner, D S Brenner, N V Zamfir, WT Chou, and A Aprahamian (1992). “The enigma of 114Cd.A classical case of ambiguities in quantum mechanical statemixing”. In: Physics Letters B 297.1-2, pp. 19–24.
Chadwick, M.B., M. Herman, P. Obložinský, M.E. Dunn, Y.Danon, A.C. Kahler, D.L. Smith, B. Pritychenko, G. Arbanas,R. Arcilla, R. Brewer, D.A. Brown, R. Capote, A.D. Carl-son, Y.S. Cho, H. Derrien, K. Guber, G.M. Hale, S. Hoblit,S. Holloway, T.D. Johnson, T. Kawano, B.C. Kiedrowski,H. Kim, S. Kunieda, N.M. Larson, L. Leal, J.P. Lestone,R.C. Little, E.A. McCutchan, R.E. MacFarlane, M. MacInnes,C.M. Mattoon, R.D. McKnight, S.F. Mughabghab, G.P.A. No-bre, G. Palmiotti, A. Palumbo, M.T. Pigni, V.G. Pronyaev,R.O. Sayer, A.A. Sonzogni, N.C. Summers, P. Talou, I.J.Thompson, A. Trkov, R.L. Vogt, S.C. van der Marck, A.Wallner, M.C. White, D. Wiarda, and P.G. Young (2011).“ENDF/B-VII.1 Nuclear Data for Science and Technology:Cross Sections, Covariances, Fission Product Yields and De-cay Data”. In: Nuclear Data Sheets 112.12. Special Issue onENDF/B-VII.1 Library, pp. 2887 –2996. ISSN: 0090-3752. DOI:10 . 1016 / j . nds . 2011 . 11 . 002. URL: http : / /www.sciencedirect.com/science/article/pii/S009037521100113X.
Coderre, Jeffrey A, Arjun D Chanana, Darrel D Joel, EricH Elowitz, Peggy L Micca, Marta M Nawrocky, Man-jeet Chadha, Jan-Olaf Gebbers, Magdy Shady, Nancy SPeress, and Daniel N Slatkin (1998). “Biodistribution of

BIBLIOGRAPHY 59
Boronophenylalanine in Patients with Glioblastoma Multi-forme: Boron Concentration Correlates with Tumor Cellular-ity”. In: Radiation Research 149.2, p. 163.
Del Sordo, Stefano, Leonardo Abbene, Ezio Caroli, Anna MariaMancini, Andrea Zappettini, and Pietro Ubertini (2009).“Progress in the Development of CdTe and CdZnTe Semi-conductor Radiation Detectors for Astrophysical and Medi-cal Applications”. In: Sensors 9 (5), pp. 3491–3526.
DeMarco, John J, Robert E Wallace, and Kirsten Boedeker (2002).“An analysis of MCNP cross-sections and tally methods forlow-energy photon emitters”. In: Physics in Medicine and Bi-ology 47.8, pp. 1321–1332.
Dominguez, A, D Abbaneo, K Arndt, N Bacchetta, A Ball, EBartz, W Bertl, G M Bilei, G Bolla, H W K Cheung, M Cher-tok, S Costa, N Demaria, Daniel Dominguez Vazquez, K Eck-lund, W Erdmann, K Gill, G Hall, K Harder, F Hartmann, RHorisberger, W Johns, H C Kaestli, K Klein, D Kotlinski, SKwan, M Pesaresi, H Postema, T Rohe, C Schäfer, A Starodu-mov, S Streuli, A Tricomi, P Tropea, J Troska, F Vasey, and WZeuner (2012). CMS Technical Design Report for the Pixel Detec-tor Upgrade. Tech. rep. CERN-LHCC-2012-016. CMS-TDR-11.URL: http://cds.cern.ch/record/1481838.
El Kanawati, W, B Perot, C Carasco, C Eleon, V Valkovic, D Su-dac, J Obhodas, and G Sannie (2011). “Acquisition of promptgamma-ray spectra induced by 14MeV neutrons and com-parison with Monte Carlo simulations”. In: Applied Radiationand Isotopes 69.5, pp. 732–743.
Eremin, V, N Strokan, E Verbitskaya, and Z Li (1996). “Develop-ment of transient current and charge techniques for the mea-surement of effective net concentration of ionized charges(Neff) in the space charge region of p-n junction detectors”.In: Nuclear Instruments andMethods in Physics Research SectionA: Accelerators, Spectrometers, Detectors and Associated Equip-ment 372.3, pp. 388–398.
Hasegawa, Bruce H, Benno Stebler, Brian K Rutt, Alberto Mar-tinez, Eric L Gingold, Craig S Barker, Kenneth G Faulkner,Christopher E Cann, and Douglas P Boyd (1991). “A pro-totype high-purity germanium detector system with fastphoton-counting circuitry for medical imaging”. In: MedicalPhysics 18.5, pp. 900–909.

60 BIBLIOGRAPHY
Hassanein, Rene, Eberhard Lehmann, and Peter Vontobel (2005).“Methods of scattering corrections for quantitative neutronradiography”. In: Nuclear Instruments and Methods in PhysicsResearch Section A: Accelerators, Spectrometers, Detectors andAssociated Equipment 542.1-3, pp. 353–360.
Horiike, H, I Murata, T Iida, S Yoshihashi, E Hoashi, I Kato, NHashimoto, S Kuri, and S Oshiro (2015). “Liquid Li basedneutron source for BNCT and science application”. In: Ap-plied Radiation and Isotopes 106, pp. 92–94.
IAEA (2007). Database of Prompt Gamma Rays from Slow NeutronCapture for Elemental Analysis. Non-serial Publications. On-line; accessed 13-January-2017. URL: http://www-pub.iaea.org/MTCD/Publications/PDF/Pub1263_web.pdf.
ILO, International Labour Organization (1960). Radiation Pro-tection Convention C115. Online; accessed 7-May-2017. URL:http : / / www . ilo . org / dyn / normlex / en / f ? p =NORMLEXPUB : 12100 : 0 :: NO :: P12100 _ ILO _ CODE :C115.
Jeong, Manhee, Han Soo Kim, Young Soo Kim, and Jang HoHa (2014). “Characteristics of a planar-type Cd0.9Zn0.1Teradiation detector grown by using the low-pressure bridg-man method”. In: Journal of the Korean Physical Society 64.8,pp. 1105–1109. ISSN: 1976-8524. DOI: 10.3938/jkps.64.1105. URL: http://dx.doi.org/10.3938/jkps.64.1105.
Kalender, Willi A, Daniel Kolditz, Christian Steiding, VeikkoRuth, Ferdinand Lück, Ann-Christin Rößler, and Eve-lyn Wenkel (2016). “Technical feasibility proof for high-resolution low-dose photon-counting CT of the breast”. In:European Radiology 27.3, pp. 1081–1086.
Kankaanranta, Leena, Tiina Seppälä, Hanna Koivunoro, KaukoSaarilahti, Timo Atula, Juhani Collan, Eero Salli, Mika Ko-rtesniemi, Jouni Uusi-Simola, Petteri Välimäki, Antti Mäki-tie, Marko Seppänen, Heikki Minn, Hannu Revitzer, MauriKouri, Petri Kotiluoto, Tom Seren, Iiro Auterinen, SauliSavolainen, and Heikki Joensuu (2012). “Boron NeutronCapture Therapy in the Treatment of Locally Recurred Head-and-Neck Cancer: Final Analysis of a Phase I/II Trial”. In: In-ternational Journal of Radiation Oncology*Biology*Physics 82.1,e67–e75.

BIBLIOGRAPHY 61
Kargar, Alireza, Mark J Harrison, Adam C Brooks, and DouglasS McGregor (2010). “Characterization of charge carrier col-lection in a CdZnTe Frisch collar detector with a highly colli-mated source”. In: Nuclear Instruments and Methods in PhysicsResearch Section A: Accelerators, Spectrometers, Detectors andAssociated Equipment 620.2-3, pp. 270–278.
Knoll, Glenn (2010). Radiation detection and measurement. 4th.Hoboken, N.J: John Wiley. ISBN: 978-0-470-13148-0.
Kobayashi, Tooru, Yoshinori Sakurai, and Masayori Ishikawa(2000). “A noninvasive dose estimation system for clinicalBNCT based on PG-SPECT—Conceptual study and funda-mental experiments using HPGe and CdTe semiconductordetectors”. In: Medical Physics 27.9, p. 2124.
Koivunoro, Hanna, Teemu Siiskonen, Petri Kotiluoto, Iiro Au-terinen, Eero Hippeläinen, and Sauli Savolainen (2012). “Ac-curacy of the electron transport in mcnp5 and its suitabilityfor ionization chamber response simulations: A comparisonwith the egsnrc and penelope codes”. In: Medical Physics 39.3,pp. 1335–1344.
Koning, A J and D Rochman (2012). “Modern Nuclear DataEvaluation with the TALYS Code System”. In: Nuclear DataSheets 113.12, pp. 2841–2934.
Koning, A.J. and D. Rochman (2008). TENDL-2008: "TALYS-based Evaluated Nuclear Data Library". Nuclear Research andConsultancy Group (NRG), Petten, The Netherlands. Online;accessed 13-January-2017. URL: http://www.talys.eu/tendl-2008/.
Kreiner, A J, M Baldo, J R Bergueiro, D Cartelli, W Castell, VThatar Vento, J Gomez Asoia, D Mercuri, J Padulo, J C SuarezSandin, J Erhardt, J M Kesque, A A Valda, M E Debray, HR Somacal, M Igarzabal, D M Minsky, M S Herrera, M ECapoulat, S J Gonzalez, M F del Grosso, L Gagetti, M SuarezAnzorena, M Gun, and O Carranza (2014). “Accelerator-based BNCT”. In: Applied Radiation and Isotopes 88, pp. 185–189.
Kumada, H, A Matsumura, and H Sakurai (2011). “New chal-lenge for advanced BNCT in University of Tsukuba. In thefront edge of BNCT development.” In: Proceedings of SixthYoung Researchers BNCT Meeting. YBNCT, pp. 132–6. ISBN:978-986-03-0321-6.

62 BIBLIOGRAPHY
Li, Zaoyang, Jeffrey H Peterson, Andrew Yeckel, and Jeffrey JDerby (2016). “Analysis of the effects of a rotating magneticfield on the growth of cadmium zinc telluride by the travel-ing heater method under microgravity conditions”. In: Jour-nal of Crystal Growth 452, pp. 17–21.
Locher, G.L. (1936). “Biological effects and therapeutic possibili-ties of neutrons”. In: Am. J. Roentgenol. Radium Ther 36, pp. 1–13.
Los Alamos National Laboratory (2004). MCB-DLC200. Includesthe ENDL92 nuclear data library. URL: https : / / www .oecd-nea.org/tools/abstract/detail/dlc-0200.
Macias-Montero, Jose-Gabriel, Maher Sarraj, Mokhtar Chmeis-sani, Ricardo Martinez, and Carles Puigdengoles (2015). “A2D 4x4 Channel Readout ASIC for Pixelated CdTe Detectorsfor Medical Imaging Applications”. In: IEEE Transactions onNuclear Science 62.5, pp. 2327–2333.
Mikhaylova, Ekaterina, Gianluca De Lorenzo, Mokhtar Chmeis-sani, Machiel Kolstein, Mario Canadas, Pedro Arce, YonatanCalderon, Dilber Uzun, Gerard Arino, Jose-Gabriel Macias-Montero, Ricardo Martinez, Carles Puigdengoles, and En-ric Cabruja (2013). “Simulation of the Expected Performanceof a Seamless Scanner for Brain PET Based on Highly Pixe-lated CdTe Detectors”. In: IEEE Transactions on Medical Imag-ing 33.2, pp. 332–339.
Minsky, D M, A A Valda, A J Kreiner, S Green, C Wojnecki, and ZGhani (2009). “Experimental feasibility studies on a SPECTtomograph for BNCT dosimetry”. In: Applied Radiation andIsotopes 67.7-8, S.179 –S182.
— (2011). “First tomographic image of neutron capture ratein a BNCT facility”. In: Applied Radiation and Isotopes 69.12,pp. 1858–1861.
Mishima, Yutaka, Chihiro Honda, Masamitsu Ichihashi, Hide-fumi Obara, Junichi Hiratsuka, Hiroshi Fukuda, Hi-roshi Karashima, Tooru Kobayashi, Keiji Kanda, andKazuo Yoshino (1989). “TREATMENT OF MALIGNANTMELANOMA BY SINGLE THERMAL NEUTRON CAP-TURE THERAPY WITH MELANOMA-SEEKING 10B-COMPOUND”. In: The Lancet 334.8659, pp. 388–389.
BIBLIOGRAPHY 63
Moll, M, E Fretwurst, and G Lindström (1999). “Leakage cur-rent of hadron irradiated silicon detectors – material depen-dence”. In: Nuclear Instruments and Methods in Physics Re-search Section A: Accelerators, Spectrometers, Detectors and As-sociated Equipment 426.1, pp. 87–93.
Monshizadeh, M, Y Kasesaz, H Khalafi, and S Hamidi (2015).“MCNP design of thermal and epithermal neutron beam forBNCT at the Isfahan MNSR”. In: Progress in Nuclear Energy83, pp. 427–432.
Monte Carlo Team (2003a). X-5 Monte Carlo Team, “MCNP - AGeneral N-Particle Transport Code, Version 5”. Report No. LA-UR-03-1987.
— (2003b). X-5 Monte Carlo Team, “MCNP - A General N-ParticleTransport Code, Version 5”. Report No. LA-CP-03-0245.
— (2005). X-5 Monte Carlo Team, “MCNP - A General N-ParticleTransport Code, Version 5”. URL: https://laws.lanl.gov/vhosts/mcnp.lanl.gov/mcnp5.shtml.
Mueller, Jennifer L. and Samuli Siltanen (2012). Linear and Non-linear Inverse Problems with Practical Applications. Vol. 10.Computational science and engineering. SIAM. ISBN: 978-1-61197-233-7. DOI: 10.1137/1.9781611972344. URL:http://dx.doi.org/10.1137/1.9781611972344.
Muenzel, Daniela, Daniel Bar-Ness, Ewald Roessl, Ira Blevis,Matthias Bartels, Alexander A Fingerle, Stefan Ruschke, Phi-lippe Coulon, Heiner Daerr, Felix K Kopp, Bernhard Bren-del, Axel Thran, Michal Rokni, Julia Herzen, Loic Boussel,Franz Pfeiffer, Roland Proksa, Ernst J Rummeny, PhilippeDouek, and Peter B Noël (2016). “Spectral Photon-countingCT: Initial Experience with Dual–Contrast Agent K-EdgeColonography”. In: Radiology, p. 160890.
Murata, Isao, Soichiro Nakamura, Masanobu Manabe, HiroyukiMiyamaru, and Itsuro Kato (2014). “Characterization mea-surement of a thick CdTe detector for BNCT-SPECT – Detec-tion efficiency and energy resolution”. In: Applied Radiationand Isotopes 88.C, pp. 129–133.
Nakagawa, Yoshinobu and Hiroshi Hatanaka (1997). “Boronneutron capture therapy: Clinical brain tumor studies”. In:Journal of Neuro-Oncology 33.1-2, pp. 105–115.
Nikl, Martin (2006). “Scintillation detectors for x-rays”. In: Mea-surement Science and Technology 17.4, R37–R54.

64 BIBLIOGRAPHY
NIST (2017). XCOM: Photon Cross Sections Database. PhysicalMea-surement Laboratory. URL: https://www.nist.gov/pml/xcom-photon-cross-sections-database.
NNDC, National Nuclear Data Center and Brookhaven Na-tional Labratory BNL (2017). Thermal Neutron Capture Gam-mas — Target Nucleus 113Cd. Internet database. Online; ac-cessed 13-January-2017. URL: http://www.nndc.bnl.gov/capgam/byn/page128.html.
OECD (2017). OECDNuclear Energy Agency. Online; accessed 13-January-2017. URL: https://www.oecd-nea.org.
Pani, R, M Colarieti-Tosti, M N Cinti, C Polito, C Trigila, and SRidolfi (2016). “Investigation of radiation detection proper-ties of CRY-018 and CRY-019 scintillators for medical imag-ing”. In: Journal of Instrumentation 11.09, P09010–P09010.
Phoenix, B, S Green, M C Scott, J R J Bennett, and T R Edgecock(2015). “Development of a higher power cooling system forlithium targets”. In: Applied Radiation and Isotopes 106, pp. 49–52.
Pourmorteza, Amir, Rolf Symons, Veit Sandfort, MarissaMallek, Matthew K Fuld, Gregory Henderson, ElizabethC Jones, Ashkan A Malayeri, Les R Folio, and DavidA Bluemke (2016). “Abdominal Imaging with Contrast-enhanced Photon-counting CT: First Human Experience”.In: Radiology 279.1, pp. 239–245.
Redus, R., A Huber, J Pantazis, T Pantazis, and D Sperry (2006).“Design and performance of the X-123 compact X-ray andgamma-ray spectroscopy system”. In: 2006 IEEE Nuclear Sci-ence Symposium Conference Record. IEEE, pp. 3794–3797.
Riley George, A. and Steven Bornstein (2001). “Room tempera-ture flip chip assembly of CdZnTe pixel detector arrays”. In:High-density interconnect and systems packaging. (Apr. 17–20, 2001). Online; accessed 8-May-2017. Santa Clara CA: So-ciety of Photo-Optical Instrumentation Engineers. ISBN: 0-8194-4139-2. URL: http://cat.inist.fr/?aModele=afficheN&cpsidt=1020928.
Roessl, E and R Proksa (2007). “K-edge imaging in x-ray com-puted tomography using multi-bin photon counting detec-tors”. In: Physics in Medicine and Biology 52.15, pp. 4679–4696.
Rosenschöld, P M Munck af, W F A R Verbakel, C P Ceberg, FStecher-Rasmussen, and B R R Persson (2001). “Toward clin-ical application of prompt gamma spectroscopy for in vivo

BIBLIOGRAPHY 65
monitoring of boron uptake in boron neutron capture ther-apy”. In: Medical Physics 28.5, p. 787.
Särkkä, S. (2013). Bayesian Filtering and Smoothing. CambridgeUniversity Press. ISBN: 9781107619289.
Savolainen, Sauli, Mika Kortesniemi, Marjut Timonen, VappuReijonen, Linda Kuusela, Jouni Uusi-Simola, Eero Salli,Hanna Koivunoro, Tiina Seppälä, Nadja Lönnroth, PetteriVälimäki, Heini Hyvönen, Petri Kotiluoto, Tom Seren, AnttiKuronen, Sami Heikkinen, Antti Kosunen, and Iiro Auteri-nen (2013). “Boron neutron capture therapy (BNCT) in Fin-land: Technological and physical prospects after 20 years ofexperiences”. In: Physica Medica 29.3, pp. 233–248.
Scheel, Hans J. and Tsuguo Fukuda (2009). Crystal Growth Tech-nology. Online; accessed 12-May-2017. Wiley. ISBN: 97804714-90593. URL: http : / / onlinelibrary . wiley . com /book/10.1002/0470871687.
Schlomka, J P, E Roessl, R Dorscheid, S Dill, G Martens, T Is-tel, C Bäumer, C Herrmann, R Steadman, G Zeitler, A Livne,and R Proksa (2008). “Experimental feasibility of multi-energy photon-counting K-edge imaging in pre-clinical com-puted tomography”. In: Physics in Medicine and Biology 53.15,pp. 4031–4047.
Shibata, Keiichi, Osamu Iwamoto, Tsuneo Nakagawa,Nobuyuki Iwamoto, Akira Ichihara, Satoshi Kunieda,Satoshi Chiba, Kazuyoshi Furutaka, Naohiko Otuka,Takaaki Ohasawa, Toru Murata, Hiroyuki Matsunobu,Atsushi Zukeran, So Kamada, and Jun-ichi Kayakura(2012). “JENDL-4.0: A New Library for Nuclear Science andEngineering”. In: Journal of Nuclear Science and Technology.
Shikhaliev, Polad M and Shannon G Fritz (2011). “Photon count-ing spectral CT versus conventional CT: comparative evalu-ation for breast imaging application”. In: Physics in Medicineand Biology 56.7, pp. 1905–1930.
Slatkin, D.N. (1991). “A history of boron neutron capture ther-apy of brain tumours. Postulation of a brain radiation dosetolerance limit”. In: Brain 114, pp. 1609–21.
Stahle, C M, B H Parker, A M Parsons, L M Barbier, S DBarthelmy, N A Gehrels, D M Palmer, S J Snodgrass, andJ Tueller (1999). “CdZnTe and CdTe detector arrays for hardX-ray and gamma-ray astronomy”. In: Nuclear Instruments

66 BIBLIOGRAPHY
and Methods in Physics Research Section A: Accelerators, Spec-trometers, Detectors and Associated Equipment 436.1-2, pp. 138–145.
Su, Ching-Hua (2015). “A method of promoting single crystalyield during melt growth of semiconductors by directionalsolidification”. In: Journal of Crystal Growth 410, pp. 35–38.
Sun, Y., J. Faucher, D. Jung, M. Vaisman, C. McPheeters, P.Sharps, E. Perl, J. Simon, M. Steiner, D. Friedman, and M.L. Lee (2016). “Thermal stability of GaAs solar cells for hightemperature applications”. In: 2016 IEEE 43rd PhotovoltaicSpecialists Conference (PVSC), pp. 2385–2388. DOI: 10.1109/PVSC.2016.7750068.
Symons, Rolf, Tyler E Cork, Pooyan Sahbaee, Matthew KFuld, Steffen Kappler, Les R Folio, David A Bluemke, andAmir Pourmorteza (2017). “Low-dose lung cancer screeningwith photon-counting CT: a feasibility study”. In: Physics inMedicine and Biology 62.1, pp. 202–213.
Sze, Simon M. and Kwok K. Ng (2006). Physics of SemiconductorDevices. Wiley-Interscience. ISBN: 0471143235. URL: http:/ / onlinelibrary . wiley . com / book / 10 . 1002 /04700\-68329.
Szeles, Csaba, Derek Bale, Joseph Grosholz Jr., Gary L. Smith,Michael Blostein, and John Eger (2006). “Fabrication of high-performance CdZnTe quasi-hemispherical gamma-ray CAP-ture plus detectors”. In: vol. 6319, pp. 631909–631909–9. DOI:10.1117/12.683552. URL: http://dx.doi.org/10.1117/12.683552.
Takahashi, T, T Mitani, Y Kobayashi, M Kouda, G Sato, S Watan-abe, K Nakazawa, Y Okada, M Funaki, R Ohno, and K Mori(2002). “High-resolution Schottky CdTe diode detector”. In:IEEE Transactions on Nuclear Science 49.3, pp. 1297–1303.
Tanaka, H, Y Sakurai, M Suzuki, S Masunaga, T Mitsumoto, KFujita, G Kashino, Y Kinashi, Y Liu, M Takada, K Ono, and AMaruhashi (2011). “Experimental verification of beam char-acteristics for cyclotron-based epithermal neutron source (C-BENS)”. In: Applied Radiation and Isotopes 69.12, pp. 1642–1645.
Valda, A, D M Minsky, A J Kreiner, A A Burlon, and H Somacal(2005). “Development of a tomographic system for onlinedose measurements in BNCT (Boron Neutron Capture Ther-apy)”. In: Brazilian Journal of Physics 35.3B, pp. 785–788.

BIBLIOGRAPHY 67
Varshni, Y P (1967). “Temperature dependence of the energy gapin semiconductors”. In: Physica 34.1, pp. 149–154.
Verbakel, W F A R and F Stecher-Rasmussen (1997). “A γ-raytelescope for on-line measurements of low boron concentra-tions in a head phantom for BNCT”. In: Nuclear Instrumentsand Methods in Physics Research Section A: Accelerators, Spec-trometers, Detectors and Associated Equipment 394.1-2, pp. 163–172.
Wang, Xiaolan, Dirk Meier, Katsuyuki Taguchi, Douglas J Wage-naar, Bradley E Patt, and Eric C Frey (2011). “Material sep-aration in x-ray CT with energy resolved photon-countingdetectors”. In: Medical Physics 38.3, pp. 1534–1546.
Wei, S.-H. and S.B. Zhang (2001). “Theoretical Study of DopingLimits of CdTe”. In: NCPV Program Review Meeting. (2001).
Wikipedia (2017). Neutron capture therapy of cancer — Wikipedia,The Free Encyclopedia. Online; accessed 13-January-2017. URL:https://en.wikipedia.org/w/index.php?title=Neutron _ capture _ therapy _ of _ cancer & oldid =758\-650459.
Wilson, Matthew D, Steven J Bell, Robert J Cernik, ChristianaChristodoulou, Christopher K Egan, Daniel O’Flynn, SimonJacques, Silvia Pani, James Scuffham, Paul Seller, Paul JSellin, Robert Speller, and Matthew C Veale (2013). “Multi-ple Module Pixellated CdTe Spectroscopic X-Ray Detector”.In: IEEE Transactions on Nuclear Science 60.2, pp. 1197–1200.
Winkler, Alexander (2017). “Comparison of characterizationmethods for CdTe/ CdZnTe radiation detector materialsand development of an automated test system”. Diplomar-beit, Friedrich - Schiller - Universität Jena, 2011. Jena. URL:https://www.db-thueringen.de/receive/dbt_mods_00031853.
Wu, X, P Kostamo, A Gädda, S Nenonen, T Riekkinen, J Härkö-nen, J Salonen, H Andersson, Y Zhilyaev, L Fedorov, S Era-nen, M Mattila, H Lipsanen, M Prunnila, J Kalliopuska, andA Oja (2014). “ Radiation detectors fabricated on high-purityGaAs epitaxial materials”. In: Journal of Instrumentation 9.12,pp. C12024–C12024.
Ye, Sung-Joon, Ivan A Brezovich, Prem Pareek, and ShahidA Naqvi (2004). “Benchmark of PENELOPE code for low-energy photon transport: dose comparisons with MCNP4

68 BIBLIOGRAPHY
and EGS4”. In: Physics in Medicine and Biology 49.3, pp. 387–397.
Yonenaga, Ichiro, Utako Onose, and Koji Sumino (1987). “Me-chanical properties of GaAs crystals”. In: Journal of MaterialsResearch 2.2, 252–261. DOI: 10.1557/JMR.1987.0252.
Yu, Z, S Leng, S M Jorgensen, Z Li, R Gutjahr, B Chen, X Duan,A F Halaweish, L Yu, E L Ritman, and C H McCollough(2015). “Initial results from a prototype whole-body photon-counting computed tomography system”. In: SPIE MedicalImaging. Ed. by Christoph Hoeschen, Despina Kontos, andThomas G Flohr. SPIE, 94120W–14.
Zhang, Zhenyu, Hang Gao, Wanqi Jie, Dongming Guo, RenkeKang, and Yan Li (2008). “Chemical mechanical polish-ing and nanomechanics of semiconductor CdZnTe singlecrystals”. In: Semiconductor Science and Technology 23.10,p. 105023.