
Novel and Ancient Technologies for Heating and Cooling - Pure
127
DOCTORAL THESIS Novel and Ancient Technologies for Heating and Cooling Buildings Sofiane Amara
Transcript of Novel and Ancient Technologies for Heating and Cooling - Pure

DOCTORA L T H E S I S
Novel and Ancient Technologies for Heating and Cooling Buildings
Sofiane Amara
Sofiane Am
ara Novel and A
ncient Technologies for Heating and C
ooling Buildings
Department of Civil, Environmental and Natural Resources EngineeringDivision of Architecture and Water
ISSN: 1402-1544 ISBN 978-91-7439-316-3
Luleå University of Technology 2011


Doctoral Thesis
Novel and Ancient Technologies
for Heating and Cooling Buildings Sofiane AMARA
2011-10-28
Renewable Energy Group
Division of Architecture and Water
Dept. of Civil, Environmental and Natural Resources Eng.
Luleå University of Technology (LTU)
SE-97187 Luleå, Sweden

Printed by Universitetstryckeriet, Luleå 2011
ISSN: 1402-1544 ISBN 978-91-7439-316-3
Luleå 2011
www.ltu.se

ERRATA PAGE
This corrigendum is to precise that the three first paragraphs of page 47 and 48 and in Figure 6.3 of page 48 in section 6.1 have been taken and translated from French from [1]. [1] Thiers, S (2008) Bilans énergétiques et environnementaux de bâtiments á énergie positive. Thèse de doctorat. Ecole nationale Supérieure Des Mines De Paris

Novel and ancient technologies for heating and cooling buildings
Table of Contents
Acknowledgements ............................................................................................................... - 7 -
Thesis Outline ..................................................................................................................... - 11 -
1. Introduction ................................................................................................................. - 13 -
1.1. The building ................................................................................................................ - 14 -
1.2. Renewable energy in Algeria ...................................................................................... - 14 -
1.3. Solar radiation ............................................................................................................. - 14 -
1.4. Wind energy ................................................................................................................ - 15 -
1.5. Hydropower................................................................................................................. - 15 -
1.6. Geothermal .................................................................................................................. - 15 -
1.7. Bioclimatic house........................................................................................................ - 16 -
2. Objectives and Scope .................................................................................................. - 17 -
2.1. Characteristic energy load for single-family house in Algeria ................................... - 17 -
2.2. Thermal stratification in the buffer tank ..................................................................... - 17 -
2.3. Solar collector and optical fibers for direct solar radiation......................................... - 18 -
2.4. Fouggara for heating and cooling buildings in Sahara................................................ - 18 -
3. Heating and cooling demand at the Tlemcen site ....................................................... - 19 -
3.1. State of the art of thermal comfort .............................................................................. - 19 -
3.2. Thermal comfort.......................................................................................................... - 19 -
3.3. Geographical characteristics ....................................................................................... - 20 -
3.4. Solar radiation ............................................................................................................. - 20 -
3.5. Relative humidity ........................................................................................................ - 21 -
3.6. Air temperature ........................................................................................................... - 21 -
3.7. Energy requirements ................................................................................................... - 22 -
3.7.1. Heating and cooling degree days ........................................................................ - 22 -
3.8. Building....................................................................................................................... - 23 -
3.9. Adaptation of the resource to requirements ................................................................ - 25 -

Novel and ancient technologies for heating and cooling buildings
4. Experimental study of the thermal behaviour of a domestic hot water storage .......... - 26 -
4.1. System description ...................................................................................................... - 27 -
4.2. Field experiments ........................................................................................................ - 29 -
4.3. Drawing off influence in tank thermal behaviour ....................................................... - 32 -
4.4. Exchangers .................................................................................................................. - 32 -
4.5. Conclusion................................................................................................................... - 36 -
5. System for hot water production and storage.............................................................. - 37 -
5.1. Prototype concentrator design..................................................................................... - 38 -
5.2. Outline of Studied system, .......................................................................................... - 39 -
5.3. Experimental study of the prototype ........................................................................... - 42 -
5.4. Results and discussion................................................................................................. - 43 -
5.5. Concluding remarks .................................................................................................... - 45 -
6. Using Fouggara for Heating and Cooling Buildings in Sahara................................... - 46 -
6.1. Heating and cooling using the ground......................................................................... - 47 -
6.2. Fouggara: An ancient system for underground transport of water.............................. - 48 -
6.3. Characteristics ............................................................................................................. - 49 -
6.4. Conclusion................................................................................................................... - 52 -
7. General Conclusion ..................................................................................................... - 53 -
7.1. Further research........................................................................................................... - 54 -
References ........................................................................................................................... - 55 -

Novel and ancient technologies for heating and cooling buildings
Il faut distinguer pour les décennies à venir le prévisible, le probable et l'incertain, en tenant compte que très souvent l'inattendu arrive
Edgar Morin
C'est une triste chose de songer que la nature parle et que le genre humain ne l'écoute pas
Victor Hugo
Une nouvelle manière de penser est nécessaire si l'humanité veut survivreAlbert Einstein
Agir dès maintenant, c’est l’urgence Hubert Reeves
Dans la vie, il y a deux catégories d’individus : Ceux qui regardent le monde tel qu’il est et se demandent pourquoi.
Ceux qui imaginent le monde tel qu’il devrait être et se disent: pourquoi pas ? George-Bernard Shaw

Novel and ancient technologies for heating and cooling buildings

Novel and ancient technologies for heating and cooling buildings
In memory of Professor Torbjörn Jilar, SLU, Alnarp, Sweden

Novel and ancient technologies for heating and cooling buildings

Novel and ancient technologies for heating and cooling buildings
- 7 -
Acknowledgements The works covered in this thesis were made at: * The Department of Civil, Environmental and Natural Resources Engineering, Luleå University of Technology under the supervision of Professor Bo Nordell. I would like to express my profound and sincere gratitude for the clarity of his teaching, advice and ongoing support provided to me during the preparation of this thesis, and the spirit of initiative and research he was able to give me. * The Materials and Renewable Energy Research Unit - Tlemcen, Physics Department, Faculty of Sciences - Université Abou Bakr Belkaid Tlemcen, under the direction of M. Boumediene Benyoucef, Professor Emeritus, for the financial support given to me. I am most gratitude for the highly educational and scientific advice he has not hesitated to provide during the process of this work. My thanks to everyone who helped and supported me during the completion of this work, particularly those who have made some contribution to its achievement and whose names appear on various publications. I express my sincere appreciation to my wife and family for help and support multiple and encouragement throughout the preparation of this Doctoral Thesis.

Novel and ancient technologies for heating and cooling buildings
- 8 -

Novel and ancient technologies for heating and cooling buildings
- 9 -
ABSTRACT The basic issue of this thesis concerns one of the fundamental problems of the future of our society: How to meet the energy requirements for a large and growing world population while preserving our environment? This question is important for the world and the answers are complex and interwoven. Conventional energy sources, fossil and fissile, are polluting in the present and in the future: they erode the environment and their resources are limited. Renewable energy (hydro, wind, solar, geothermal) constitutes a minimum of pollution in the different energy systems. The technologies for using renewable energy are well known though further development and progress are made. This development also requires behavioural change, adaptation, and above all political will. The transition from an economy based on fossil energy to an economy based on renewable energy appears necessary for the protection of the environment. The cost of renewable energy is often represented as an obstacle but remains competitive in the long run. The development and availability of renewable energy, which varies because of its spatial and temporal distribution, require an adaptation of lifestyle, habits, habitat design (passive bioclimatic houses), urban planning and transportation. The focus of this thesis was to apply renewable energy in an area with hot summers and cold winter, a climate like that in the northwest of Algeria. In order to provide improved comfort in the buildings and also economic development in this area, the energy demand for heating and cooling was analyzed in the ancient city of Tlemcen. To supply domestic hot water and space heating, water must be simultaneously available at two different temperature levels. Cold water temperature, close to that of the atmosphere, and hot water between 50 and 60°C. An interesting feature of the preparation of hot water is the small variation of requirements during the year, unlike that to heating. The preparation of hot water is one of the preferred applications of solar energy in the building for several reasons. For this reason an experimental study of the thermal behaviour of a domestic hot water storage tank was undertaken. The phenomena that affect the thermal behaviour of tank especially the coupling between the solar collector and storage tank was studied. This study included concentrating solar collector in which optical fibers were used to transport the energy to the storage tank. Another technology was introduced and developed for the heating and cooling of buildings in the desert involving an existing ancient irrigation system called Fouggara. The novel idea is to use the Fouggara as an air conditioner by pumping ambient air through this underground system. Then air at a temperature of about 21°C would be supplied to the building for heating in the winter and cooling in the summer. This study shows the feasibility of using this ancient irrigation system of Fouggara and contributes to reducing and eliminating the energy demand for heating and cooling buildings in the Sahara desert. Key words: Heating/cooling, design, solar energy, simulation, optimization, modelling, optical fiber, concentration, Fouggara.

Novel and ancient technologies for heating and cooling buildings
- 10 -
RESUME La question fondamentale de cette thèse concerne l'un des problèmes fondamentaux de l'avenir de notre société: Comment répondre aux besoins énergétiques d'une population mondiale importante et croissante tout en préservant notre environnement? Cette question est importante pour le monde et les réponses sont complexes et imbriqués. Sources d'énergie conventionnelles, fossiles et fissiles, sont polluantes dans le présent et l'avenir: ils érodent l'environnement et leurs ressources sont limitées. Les énergies renouvelables (hydraulique, éolienne, solaire, géothermique) constitue un minimum de pollution dans les différents systèmes énergétiques. Les technologies pour l'utilisation des énergies renouvelables sont bien connues mais encore le développement et le progrès sont réalisés. Ce développement nécessite également un changement de comportement, l'adaptation, et surtout une volonté politique. La transition d'une économie basée sur les énergies fossiles à une économie basée sur les énergies renouvelables apparaît nécessaire pour la protection de l'environnement. Le coût de l'énergie renouvelable est souvent représenté comme un obstacle mais reste compétitif sur le long terme. Le développement et la disponibilité des énergies renouvelables, qui varie en raison de sa distribution spatiale et temporelle, nécessitent une adaptation du mode de vie, les habitudes, la conception de l'habitat (maisons passives bioclimatiques), la planification urbaine et le transport. L'objectif de cette thèse était d'utiliser les énergies renouvelables dans une zone avec des étés chauds et des hivers froids, tel le climat dans le nord-ouest de l'Algérie. Afin d'apporter une amélioration du confort dans les bâtiments et le développement économiques dans ces secteurs, la demande d'énergie pour le chauffage et le refroidissement a été analysée dans l'ancienne ville de Tlemcen. Pour produire l'eau chaude sanitaire et le chauffage, l’eau doit être disponible simultanément à deux niveaux de température différents. Basse température, eau froide à température proche de l’ambiance; et l’eau chaude entre 50 et 60°C. La préparation de l’eau chaude sanitaire constitue une des applications privilégiées de l’énergie solaire dans le bâtiment pour plusieurs raisons. La première caractéristique intéressante est la faible variation des besoins au court de l’année, contrairement au chauffage. Les phénomènes qui affectent le comportement thermique du réservoir en particulier le couplage capteur solaire et ballon de stockage ont été étudiés. Cette étude comprend un capteur solaire à concentration dans lequel les fibres optiques ont été utilisés pour le transport de l'énergie jusqu’au réservoir de stockage. Une autre technologie a été introduite et développée pour le chauffage et la climatisation des bâtiments dans le désert impliquant un ancien système d'irrigation appelé Fouggara. L'idée originale est d'utiliser la Fouggara comme source d‘énergie en pompant l'air ambiant à travers ce système souterrain. L'air à une température d'environ 21°C serait fourni à l'édifice pour le chauffage en hiver et refroidissement en été. Cette étude montre la faisabilité d'utiliser ce système d'irrigation antique de Fouggara et contribue à réduire et à éliminer la demande d'énergie pour le chauffage et le refroidissement des bâtiments dans le désert du Sahara. Mots clés: chauffage / refroidissement, conception, énergie solaire, simulation, optimisation, modélisation, fibre optique, concentration, Fouggara.

Novel and ancient technologies for heating and cooling buildings
- 11 -
Thesis Outline
This thesis is presented as the partial fulfilment of the requirements for the degree of Doctor of Philosophy (PhD) in Water Resources Engineering. The research was carried out at:
� The Division of Architecture and Water, Luleå University of Technology, Sweden. � The Renewable Energy and Materials Research Unit, Faculty of Sciences, Tlemcen
University, Algeria. � The Renewable Energy Research Unit in Saharan Middle, Adrar, Algeria.
This thesis is articulated into an experimental study of a new conception system for high efficiency solar heat production using the Fouggara system and hot water energy storage for buildings. The thesis consists of a short introduction and the following papers:
I. Amara. S, Virgone. J, Bouia. H et Krauss. G, (2005), Stratification dans les ballons d’eau chaude sanitaire: Comparaison de modèles existants, 12ème Journées Internationales de Thermique (JITH), 15-16-17 Novembre 2005, Tanger Maroc
II. Amara. S, Zidani. C, Benaissa. D, Benyarou. F, Benyoucef. B, (2006), Diurnal and nocturnal temperatures modelling for Tlemcen site, Physical and Chemical News, Volume 27, 59-64.
III. Amara. S, Virgone. J and Benyoucef. B, (2007), Etude d’un système de production et stockage d’eau chaude sanitaire pour le site de Tlemcen, Comples heliothechnique, 36B, 3-7.
IV. Amara. S, Benmoussat. A, Bouguima. S, Benyoucef. B, Nordell. B, (2007), Requirements energy estimate of heating & cooling for a dwelling in the site of TLEMCEN, Revue des Energies Renouvelables, Numéro special, Mai 21-24, 2007, ICRESD_07, Tlemcen, ALGERIE,
V. Amara. S, Benyoucef. B, Benhamou. M, Moungar. H and Touzi. A, (2009), Experimental study of a domestic hot water storage tank thermal behaviour, Physical and Chemical News, Volume 46 (2009).
VI. Amara. S, Nordell. B, Benyoucef. B, Benmoussat. A, (2011) Concentration heating system with optical fiber supply, Energy Procedia 6 (2011) p.805–814
VII. Amara. S, Nordell. B, Benyoucef. B, (2011) Using Fouggara for Heating and Cooling Buildings in Sahara, Energy Procedia 6 (2011) 55–64

Novel and ancient technologies for heating and cooling buildings
- 12 -

Novel and ancient technologies for heating and cooling buildings
- 13 -
1. Introduction
The oil crisis in 1973 raised awareness in industrialized countries of the precariousness of their energy supplies and the need to focus on energy conservation and new technologies. During less than two years the world oil price tripled (from $14 to $42 per barrel) and a few years later in July 2008 it reached almost $144/bbl. (Price per barrel – official oil rate.). According to the International Energy Agency (IEA), world oil demand is estimated at 88.3 million barrels/day in 2011. The countries of the OECD (Organisation for Economic Cooperation and Development) are the main focus of consumption in the world and represent nearly 60% of global demand. It is instructive to learn that in 1985 the demand in the world was only 10.7 billion TOE (tons oil equivalent) against 4.5 in 1970 which represents an increase of 138% in 15 years (Entreprises, 1973). In 2008 it reached 15.35 billion TOE, as illustrated in Fig.1.1. (IFP, Samuel.B). Since 2004, operators in the oil markets have been concerned about the fluctuating demand and supply of oil and the strong trend of increasing prices. The current oil shock (2008) is different from other oil shocks because of its magnitude and duration. The oil shocks in 1973 and 1979 were supply shocks while the current crisis is a demand shock (Kalinowski, 2008). The evolution of oil consumption is structurally related to economic growth with climatic factors having an influence in the short term. Moreover, the flexibility of demand is becoming weaker. To address this energy crisis, it is necessary to devise and develop a more efficient use of energy and the replacement of fossil fuels with alternative energy sources. Renewable energies that fall within this context, including reduced consumption of fossil fuels, have lead to other models of energy production, effectively contributing to sustainable development.
Fig. 1.1 Population growth and global energy demand (Source : IEA) (Rojey, 2008)
1.92 TOE/Inhabitant
20081.78 TOE/Inhabitant
19851.21 TOE/Inhabitant
1970
8.2 Billion Inhabitants 15.5 Billion TOE
6 Billion Inhabitants 10.7 Billion TOE
3.7 Billion Inhabitants 4.5 Billion TOE

Novel and ancient technologies for heating and cooling buildings
- 14 -
The transition from coal to oil and gas in the industry has reduced emissions of carbon into the atmosphere. However, slowly and inexorably, the rate of carbon dioxide continues to increase steadily in the atmosphere. This increase has raised fears of irreversible climate change (global warming) and it is internationally accepted that we have to reduce the greenhouse gas emissions in order to slow down the climate change (Bernard et al. 1983). The main challenge is found in the sectors of transport, industry and housing, which account for 90% of emissions of greenhouse gases (Fig. I.3), (ECOHABITAT, CITEPA). For this reason, we will review the energy options for a sustainable future, focusing on options that could reduce or better limit the level of carbon dioxide emissions in buildings.
1.1. The building Regarding habitat, enhancing the thermal regulation and the emergence of effective insulation materials has already reduced energy consumption from 372kWh/m²/year in 1973 to 245kWh/m²/year today (2007) in France. However, much remains to be done to achieve the performance of low-energy buildings and bioclimatic homes, also known as passive or positive energy or sustainable buildings (Sabonnadière and Quenard (2007), Maugard et al. (2005)). The best way to save energy in new housing, while retaining a significant degree of comfort for the resident is to define a basic concept based on two main criteria: the bioclimatic parameters of comfort and an adequate system of construction.
1.2. Renewable energy in Algeria In order to build energy efficient housing, identification of the best environmentally and economically viable energy solutions is essential. Today, all eyes are moving to renewable energy (RE) and to the recovery and recycling of waste for energy. Renewable energies are involved in the security of our energy supplies and contribute to a better balance in regional planning. They do not generate waste and emissions and are environmentally benign. Algeria is ranked third in the Mediterranean in terms of capacity of renewable energy. Its potential is estimated at 10 times of the annual world consumption (ECOMED21). The techniques, materials and processes related to renewable energies, are very numerous and have higher levels of technological advancement, price and performance.
1.3. Solar radiation Because of its location Algeria is very favourable for the utilization of solar radiation. The duration of sunshine over almost the entire national territory exceeds 2000 hours annually and can reach 3370 hours in the Sahara (Adrar). The energy received daily on a horizontal surface of 1m2 is about 5 kWh in most of the country or near 1700 kWh/m2 year in the north and 2250 kWh/m2 year in the south of Algeria. (MEM-Algeria, Encarta (2008)).

Novel and ancient technologies for heating and cooling buildings
- 15 -
1.4. Wind energy There are wind turbines of high power (1.2 to 5 MW) that are connected to the electrical grid, but also smaller wind turbines that supply electricity to detached houses. The turbines operate at full power from 2000 to 3000 hours per year, or about 1/3 of the time. Wind maps show that the wind velocity is low in the north (1.5m/s in Algiers) while it is considerably greater in the south (6.3 m/s in Adrar). (MEM-Algeria, Remund and Kunz (2004)).
1.5. Hydropower Worldwide hydropower accounts for about one quarter of the total production of electricity. This is the main source of electricity in many countries such as Norway (99% of its energy supply), the Democratic Republic of Congo (97%) and Brazil (96%). The plant of Itaipu in Brazil has the largest production capacity in the world (12 600 MW). Among the largest facilities, we can also cite the Grand Coulee Dam in the United States (7 000 MW) and Great Canadian with 7 300 MW (Lako et al. 2003). In Algeria, there are many dams built for small scale hydro. The capacity of these plants varies between 200 and 300 MW/year according to the intensity of rainfall (MEM-Algeria).
1.6. Geothermal Geothermal energy meant for a long time high temperature geothermal heat as reservoirs of steam or hot water or hot rocks. Such sources could be used for electricity production or as a direct source for district heating. Because of the technological development during the last decades on thermal energy storage and heat extraction from the ground the term “geothermal” is now divided into deep and shallow geothermal energy. Still, available data is confusing since “installed geothermal power” sometimes refers to electricity production by hot steam and sometimes by low temperature heat for indoor heating. A heat pump is normally used to raise the water temperature to a suitable level. When the geothermal reservoir is in a moderate temperature, it is used to generate heat in turn distributed by a pipeline network. The world production of geothermal energy (electricity) was about 5 800 MWe in 1990, over 7900 MWe in 2000, and around 10 700 MWe in 2010 (Bertani, 2007). In 2007, the United States was the largest producer of geothermal energy, with 2 687 MWe, followed by Philippines (1 970 MWe), Indonesia (992 MWe), Mexico (953 MWe), Italy (810 MWe), Japan (535 MWe). In Algeria more than 200 hot springs have been investigated in the north, including about one third that have temperatures above 45°C, for example in Hammam Meskoutine with a temperature of 98°C which is used to provide heating for greenhouses (Bertani, 2007). At the end of 2006, the installed electrical capacity for the countries of European Union was 854.6 MWe and the thermal capacity was 9 564.6 MWth, including 7 328.3 MWth of geothermal heat pumps (GEB, 2007).

Novel and ancient technologies for heating and cooling buildings
- 16 -
1.7. Bioclimatic house The bioclimatic house is a healthy house where one feels comfortable and which fits perfectly within the environmental framework in which one lives. This includes harmonising key elements such as soil, relief, vegetation, orientation, the sun and wind, that is all the natural elements, using simple truths and realities that we have forgotten and that our ancestors reflected. The second focus of the house is bioclimatic architecture; the third is the use of natural materials. All this leads to a traditional habitat in harmony with the site, climate and the people who will live there. As required, a bioclimatic house offers site specific solutions with renewable energy for example Canadian wells, geothermal, photovoltaic, solar, recovery of rainwater, etc. To develop these systems, solar homes should be based on three considerations: • Requirements to be met. • Available solar (renewable) energy. • Adaptation the specific site conditions.

Novel and ancient technologies for heating and cooling buildings
- 17 -
2. Objectives and Scope The overall objective is to study and develop energy-efficient systems for domestic hot water production in climates similar to that of Algeria. The considered energy supply system contains a high-temperature solar collector combined with a buffer tank and an ancient existing irrigation system called Fouggara know used for air conditioning. The objectives are divided into four important sections:
2.1. Characteristic energy load for single-family house in Algeria In order to utilise naturally stored heat or cold in the ground, seasonal temperature variations are required. In North Africa the mean temperature difference between the coldest and warmest month is about 20°C. In Algeria this difference is even greater, which is favourable. (Grein et al. 2007). The heating and cooling demand in northern Africa varies considerably in the different countries, with the greatest cooling demand being in Egypt and the greatest heating demand in Algeria. In Section 3, the required heating and/or cooling demand was estimated for a dwelling in the Tlemcen site. To supply the two heat consumers (domestic hot water and indoor heating), water should be simultaneously available at two different temperature levels. This can be achieved by operating two different storage tanks with a ‘clever’ control unit acting on valves and pumps. However, it is also possible to use a single storage tank if care is taken to avoid mixing water of different temperatures. As hot water has a lower density than cold water, hot water is always located in the upper part of the storage tank; conversely, cold water is found at the bottom. This feature is called stratification of the storage tank.
2.2. Thermal stratification in the buffer tank The total energy consumption related to domestic hot water is considerable all over the world. The production of hot water is certainly the most interesting application for solar energy systems due to the extensive needs and use throughout the year. Energy used for domestic hot water production corresponds to 40-70% of the households’ energy consumption (ENERGIEPLUS). The efficient use of solar energy requires the use of accumulator tanks. Efficient performance of such storage tanks means promotion of a stratified water temperature in the tank. Indeed, stratification allows a high temperature at the top, which results in a reduced energy booster. In addition a lower temperature at the bottom of the tank improves the performance of the solar collector. The thermal stratification in the hot water storage tank was therefore paid special attention, see Section 4. It is necessary to take into account all the phenomena that influence the stratification in solar applications especially the coupling between the solar collector and storage tank. To reach this objective it is interesting to connect the storage tank with a concentrating solar collector using an optical fiber.
Novel and ancient technologies for heating and cooling buildings
- 18 -
2.3. Solar collector and optical fibers for direct solar radiation Solar energy systems are used throughout the world in particular for heating of water. Such systems are relatively small and we do not see any development on an industrial scale. Some reasons include the high investment cost and the energy losses during transportation to the user. To solve this latter problem, we transport a concentrated solar energy to the place of conversion. The idea of transmission of concentrated solar energy via optical fibers was put forward in 1980 by a group of French investigators. The technology of optical fibers was developed and industry offers high quality of fibers with large diameter for light transmission (Cariou et al. 1982). In this work we use optical fibers that have the advantage of weak attenuation and small conversion losses. Another technology was introduced and developed for the heating and cooling of buildings in the desert involving an existing system called Fouggara as an energy source see section 6.
2.4. Fouggara for heating and cooling buildings in Sahara The idea of using the Fouggara system as an energy source for heating and cooling buildings in the Sahara desert was a result of ongoing studies on Underground Thermal Energy Storage (UTES) systems at Luleå University of Technology. The Fouggara is an ancient water transportation and irrigation technique that was first used in Iran. It was introduced in Algeria desert by Arabs at the time of their conquest of Algeria about the year 700. This underground system is characterized by a constant mean air temperature about 21°C (ABH Sahara). As the temperature in the desert of Algeria (Adrar) varies from 0°C to 47°C this ancient underground duct system can be used as a source for heating, cooling and ventilation, see Fig.6.4. This part of the work involves experiments and theoretical analyses of an existing Fouggara system (El Faiz and Ruf 2006). Major findings are to be incorporated in a realistic system simulation model to investigate the feasibility of the concentration heating system with optical fiber supply and ancient Fouggara systems. The model can then be used to design the system under various conditions.

Novel and ancient technologies for heating and cooling buildings
- 19 -
3. Heating and cooling demand at the Tlemcen site The essential points in the building design are directed towards estimation of energy consumption and more particularly the precise prediction of the interior environment. These criteria are not adapted for the evaluation of natural ventilation and the risk of discomfort when the energy consumption is the principal consideration. The actual design of the building is mainly based on energy economy criteria. It associates insulation, solar contributions and inertia while often omitting the comfort concept that plays two important functions in energy conservation (Norton 1992, Santamouris 2003): 1. The energy consumption of any building is critically dependent on the indoor
temperatures which the building and its services must deliver, because the heat lost from the building either through its surfaces or by ventilation depends essentially on the difference between indoor and outdoor temperature. The sensitivity of occupants to the indoor climate also has deep implications for the manner in which the environment is controlled.
2. The building is considered successful only if a comfortable indoor environment is
achieved. Thermal comfort is generally regarded by occupants as one of the most important requirements for any building. In addition, there is evidence that the thermal comfort of occupants is closely linked to their perception of indoor air quality (Humphreys and Nicol (2002)) and productivity (McCartney and Humphreys (2002)). The comfort is also important because the occupants will react to any discomfort by taking actions to restore their comfort. These actions may themselves have an energy cost e.g. opening a window when the heating is on, for instance, can be a costly way to cool an overheated building.
3.1. State of the art of thermal comfort The thermal interaction between humans and their environment is highly complex and has been the subject of a great deal of studies. The internal processes by which we produce and respond to heat and processes of heat transfer between humans and the immediate environment. The study dealing with thermal comfort therefore has to take all these considerations into account (McIntyre 1980; Parsons 2002; Darby and White 2005). For any construction type, it is necessary to define the conditions within building which will provide a comfortable indoor climate («comfort conditions» or «comfort temperature»). Because some factors influence the heat balance of the human body, including humidity and air movement in addition to the radiant and air temperatures.
3.2. Thermal comfort Beyond air temperature, the thermal comfort also depends on wall surface temperatures, calculated from the incidental solar radiations, relative humidity and air velocity. Humphreys and Nicol (2000) established a relationship between comfort temperature and external average temperature (To), the equation for comfort temperature Tc, is given by:

Novel and ancient technologies for heating and cooling buildings
- 20 -
054.05.13 TTc �� (1) They showed that this relationship is markedly stable between Humphreys’ (1978) data and deDear's (1998) ASHRAE database. In the current study, the focus is on dwellings located in Tlemcen, Algeria.
3.3. Geographical characteristics Tlemcen is located in north-west Algeria, at 580 km from Algiers, with latitude of 34.56°, a longitude of -1.19° and an altitude of 830 m, see Fig.3.1. It is characterized by hot and dry summers and cold and harsh winters. It is important to remark that its climate is somewhat softened by the influence of the Mediterranean Sea, 45 km to the North.
3.4. Solar radiation Any use of solar radiation must take into account the local and regional climatic conditions. It is widely known that all the observed atmospheric processes are the consequences of the received solar radiation. Thus, the measurement of the solar radiation is of special interest for environmental researchers (Santamouris and Asimakopoulos 2001). As shown in Fig.3.2, the largest increase in total radiation occurs between February and March and the maximum for the horizontal radiation is obtained in July, with a slight stability for the global collector slope between March and October. The annual values of diffuse solar radiation represent 35 – 44% of the global radiation.
Fig.3.1 Tlemcen site situation (Encarta 2008)

Novel and ancient technologies for heating and cooling buildings
- 21 -
3.5. Relative humidity The prevailing atmospheric humidity also plays a significant role in building comfort. High air temperatures coupled to high values of atmospheric humidity can create discomfort, mainly in the respiratory system. Tlemcen site is characterized by a relatively moderate humidity varies from 55% in summer to 74% in winter (ranging around 66%), which, in general does not create discomfort. (Meteonorm 6.1, 2008)
3.6. Air temperature It is difficult to define exact comfort conditions in buildings. Thermal comfort is therefore a function of the change as well as the temperature achieved; the ‘comfort zone’ width will depend on the balance between the two. The adaptive relationship between comfort temperature and the outdoor temperature can be used to help design comfortable buildings (Fig.3.3). Here the indoor comfort temperature (Tc) is calculated from the outdoor temperature mean (Tm) and plotted on a monthly basis together with the monthly mean of the daily maximum (Temax), minimum (Temin) and mean outdoor temperature (Tm).
J a n . F e b . M a r. A p r . M a y . J u n . J u l. A u g . S e p t. O c t. N o v . D e c .
468
1 01 21 41 61 82 02 22 42 62 83 03 23 4
Tem
pera
ture
s (°
C)
T m T c T e m a x T e m in
Fig.3.3 Typical variation of monthly temperatures in Tlemcen, (Meteonorm 6.1, 2008)
Fig.3.2 Variation of global, diffuse horizontal radiation and global inclined plane, (Meteonorm 6.1, 2008)
J a n . F e b . M a r . A p r . M a y . J u n . J u l . A u g . S e p t . O c t . N o v . D e c .0
5 0
1 0 0
1 5 0
2 0 0
2 5 0
3 0 0
Sol
ar ra
diat
ions
(KW
h/m
²)
Horizontal total radiationsDiffuse radiationsInclined plane total radiations

Novel and ancient technologies for heating and cooling buildings
- 22 -
Such diagrams help the designer to judge whether passive heating and/or cooling is possible for such a climate. The relationship between the comfort temperature and the range of outdoor temperatures shows whether, for instance, night cooling is likely to be a viable way to keep the building comfortable during the day in summer or to calculate whether passive solar heating will be sufficient in winter. This method has been used by Roaf et al, (2001) to define indoor comfort. However, Eq. (1) does not apply in cold climates since an air temperature of -25oC gives the comfort temperature Tc=0oC.
3.7. Energy requirements
3.7.1. Heating and cooling degree days Independently of the ambient air temperature variations, the temperature variations inside buildings are fundamental for the occupants comfort. For energy need assessment and to maintain indoor comfort the temperature variations are essential. The Degree Day (DD) Method is commonly used to estimate the heating and cooling demand in buildings. The Degree Day Method is used for various applications e.g. the adequate design of photo thermal generators, greenhouses, and heating and cooling of buildings. The number of Degree Days (or Degree Hours) for heating (DDh) and cooling (DDc) are calculated as the accumulated difference between a defined indoor base temperature and the ambient diurnal or hourly mean temperatures. Fig.3.4 and 3.5 shows the average of 3 years data of the ambient (Ta) and ground (Ts) temperatures in Tlemcen obtained from National Office of Meteorology (Paper II).
In the light of the results obtained and shown in Fig.3.4, it is seen that the difference between the maximum and minimum ambient and in the ground temperatures in Tlemcen site never exceeds 10°C. Fig.3.5 shows the daily mean air temperature used in the DD calculation during the whole year for a considered building in Tlemcen. The result of the DD calculation is summarized in Table 3.1.
Fig.3.4 Daily ambient air temperature and ground temperature variations (Max and Min) in Tlemcen site.
Fig.3.5 Day (TMD) and night (TMN) temperatures in Tlemcen.
-50 0 50 100 150 200 250 300 350 400
-5
0
5
10
15
20
25
30
35
40
45
50
Tem
pera
ture
s (°
C)
N° of day
Tamax Tamin Tsmax Tsmin
-50 0 50 100 150 200 250 300 350 400
5
10
15
20
25
30
35
Ave
rage
am
bien
t tem
pera
ture
s (°
C)
N° of day
TMD TMN

Novel and ancient technologies for heating and cooling buildings
- 23 -
DD for heating (DDh) DD for cooling (DDc) Month Tc
Averageambient
temperatures 15°C Tc 18°C 22°C Tc 25°C
January 19.4 10.4 141.4 192.5 234.4February 20.2 12.0 83.5 134.0 167.5March 21.4 14.0 50.0 146.0 128April 22.2 15.2 24.0 125.5 92.5May 23.7 18.0 5.2 91.0 34June 26.0 22.0 30.0 30.0 3.5July 27.3 24.5 78.0 8.0 12.5August 27.2 24.2 69.0 19.0 12.0September 26.1 22.4 18.0 27.0 1.5October 24.0 18.5 13.0 93.5November 22.1 15.6 19.0 117.5 76.3December 20.5 13.0 65.0 152.0 156.5Total 402.0 1052 889 195.2 84.0 30.0
According to this table, the Tlemcen site is characterized by a long duration of heating (October to May), with the following degree day number: � For comfort temperature (15°C), DDh = 402 � For comfort temperature (18°C), DDh = 890 � For comfort temperature calculated every day, DDh = 1052 And a short duration of cooling from June to September, of which: � Comfort temperature (22°C), DDc = 195 � Comfort temperature (25°C), DDc = 30 � Comfort temperature calculated every day, DDc= 84 Based on the calculated number of degree days, the building’s energy demands for heating and/or cooling were calculated.
3.8. Building On the architectural plan the building is designed in the following way (Paper IV). As shown in Fig.3.6, the living surface is 165m2. In these conditions it is necessary to take into account, on the one hand the liveable volume Vh = 448 m3, and on the other hand the volumetric coefficient of losses G considering the thickness of the walls, materials used and the number of openings (Table.3.2), (Paper III).
Table 3.1 Monthly Degree Days in Tlemcen.
Fig.3.6 Drawing plan of building.
Room1 16.45m2
Lounge 24.83m2
Room2 16.5m2
Kitchen 17.69m2
Hall 18.14m2

Novel and ancient technologies for heating and cooling buildings
- 24 -
Walls Windows Floor roofing Total losses (W/°C)
K 3.5 6 4 4 S
(surface) 62 7 35 35 Lounge
KS 217 39.5 140 140 536.4 S 36.5 11.2 20 20 Hall KS 127.5 65 80 80 352.4 S 52 4 25 25 Room 1 KS 182 23.2 100 100 405.2 S 50 6 25 25 Room 2
KS 175.7 34.2 100 100 410 S 53 8.7 30 30 Kitchen
KS 185 50.5 120 120 475.6 S 52.5 32 15 15 Passageway
KS 183.5 185.6 60 60 489 S 31 4.2 15 15 Bathroom
KS 108.5 24.4 60 60 253 Then the total sum of losses (for �T=1°C) for the building is P = 2922 W/°C which gives the volumetric heat loss coefficient G as:
)/(5.6 3 CmWVPG
h
��� (2)
It is difficult to take into account the inhabitants’ thermal requirements in the building. Would they agree to not use certain rooms in winter for heating or summer for cooling? Taking all this into consideration, we can evaluate the annual energy requirements C. C = 24 * G * Vh *DD (3)
� Annual requirements for heating :
- For a comfort temperature of 15°C, October to May: DDh = 402 Where C = 2815 kWh.
- For a comfort temperature of 18°C, November to May: DDh = 889 Where C = 6232 kWh.
- For a calculated comfort temperature Tc, October to May: DDh = 1052 Where C = 7375 kWh.
� Annual requirements for cooling : - For a comfort temperature of 22°C, June to September: DDc = 195
Where C = 1369 kWh. - For a comfort temperature of 25°C, June to September: DDc = 30
Where C = 209 kWh. - For a calculated comfort temperature Tc, June to September: DDc = 84
Where C = 589 kWh.
Table 3.2 Total energy losses in building by degree

Novel and ancient technologies for heating and cooling buildings
- 25 -
3.9. Adaptation of the resource to requirements The aim of this section is to have buildings with a surplus energy balance to maintain a stable interior temperature. The solar radiation is the biggest contributor to the superficial and volumetric energy balances during the daylight hours. In fact, it is the main contributor to heat gains in buildings, especially residential buildings. It becomes necessary, therefore, in many cases to limit these gains for solar radiation, using elements that shadow the external surfaces of the buildings, resulting in improvement of the interior comfort, and the air conditioning costs reduction. The current study focuses on the energy demand calculation for a building situated in Tlemcen, which gave a: � Maximum energy requirement for heating: 7375 kWh. � Maximum energy requirement for cooling: 590 kWh. Solar energy is mainly available when the heat demand is low and this is what constitutes the main disadvantage of solar heating. Fig.3.7 is a good illustration of how the solar energy resource is out of phase with the demand. In order to lead to low yearly consumption, an objective accessible in the shorter term is to set up solids bases on the envelope (walls, grounds and roofs). In particular, it will be interesting to introduce the positive energy which fits fully in the current context of energy control, use of renewable energies within sustainable development framework. If a fraction of the available summer energy could be stored until its utilisation in the winter, the requirements for non-solar energy for heating could be reduced or even eliminated. For this reason it was decided to launch a study of the thermal behaviour of a domestic hot water storage tank.
M a y J u n e J u l. A u g . S e p t. O c t. N o v . D e c . J a n . F e b . M a r. A p r . M a y
R e q u ire m e n ts
Ener
gy
R e s o u rc e s
Fig.3.7 Available solar energy is out of phase with the heating demand, (Bernard et al. 1983)

Novel and ancient technologies for heating and cooling buildings
- 26 -
4. Experimental study of the thermal behaviour of a domestic hot water storage
There are many reports on the necessity of thermal stratification to get the best performance of hot water storage applications. Moreover, Van Koppen et al. (1979) showed that a stratified storage was able to assure a high energetic gain particularly in combination with a reduced flow rate. Other studies (Lavan and Thompson (1977), Phillips and Pate (1977), Wu and Hun (1978), Gupta and Jaluria (1981)) showed that stratification in a thermal storage tank depends mainly on the volume, height, inlet diameter, inlet and outlet design, flow rate, and the difference between inlet and outlet temperatures. Therefore there are four "primary factors of de-stratification" which contribute to loss and/or degradation of stored energy: � Heat loss to the surroundings; � Heat conduction within the tank, from hot layer to cold layer; � Vertical conduction in tank walls and heat loss induced convection (mixing); � Mixing of water as a result of charge and discharge, which is generally the principal cause
of de-stratification. The performance of hot water storage systems is improved by a highly stratified water temperature, which is made evident by temperature and velocity measurements in such storage. A good knowledge of the thermal behaviour of the storage is essential both for proper design of the storage tank and for prediction of their behaviour when they are installed in a system. Such predictions are needed for design and operation optimization (storage included). Several numerical and experimental studies have been conducted on hot water storage, where the phenomena which affect the thermal degree of stratification and the thermal behaviour of low flow rate solar water heating are highlighted (Hermansson, 1983). The experimental results show the thermo-hydraulic behaviour in various phases of the storage cycle (injection of the fluid on several levels, drawing-off, auxiliary heaters) (Kenjo, 2003). Bouhdjar (2005) studied numerically the stratification phenomenon in a thermal storage tank, in order to determine the thermal performances and the best configurations in relation to the thermal storage efficiency. Regarding the inlet temperature influence, a high storage performance is obtained with high inlet temperatures and minimal temperatures in the tank as low as possible (Johannes et al. 2004). A study undertaken by Ouzzane et al. (1990), permitted to understand the thermo circulation phenomenon through the temperature distribution in the collector. Sharp and Loehrke (1997) showed that the flows through a stratified solar water heater deliver appreciably more energy than the entirely mixed tanks. A simulation of similar systems shows that an optimum collector flow improves the performance by 37% compared to that of an entirely mixed tank (Wüstling et al. 1985).

Novel and ancient technologies for heating and cooling buildings
- 27 -
Duffie and Beckman (1991) undertook works which led to a much more rigorous model founded on the "entrainment viscosity" theory. Later, Wu and Han (1978) presented another model compatible with TRNSYS. In the same context Chan et al. (1983) studied the mixed convection in a parallelepiped-shaped storage tank and examined the influence of some physical and geometrical parameters (Reynolds number, inlet and outlet positions) on the storage tank performance. Thermal stratification in tanks requires prevention of convection heat transfer within the water. The mixing depends on tank geometry and functioning conditions (for example flow rate, inlet-outlet water temperature and temperature distribution inside the tank), as well as vertical conduction which can also induce convection streams (Davidson et al. 1994). Chandreskhar (1961) and Turner (1973) indicated on this subject that the Richardson number has an impact in the formation and thermocline growth. Veltkamp (1981) asserted that the mixture occurs for Richardson numbers lower than 0.25. Experiments led by Loehrke et al. (1979), for a good stratification in tank, showed that the Richardson number was equal to or higher than 4.7. We limited ourselves in this work to thermal behaviour study of a domestic hot water storage tank (Paper I and Paper V).
4.1. System description
The system considered included all the elements related to Fig.4.1 and Fig.4.2. We measured water temperature for different tank positions in Fig. 4.3. These temperatures are measured using 15 type K thermocouples connected to a FLUKE HYDRA SERIES II recorder. Water flow rate circulating in the system was measured by a flow meter.

Novel and ancient technologies for heating and cooling buildings
- 28 -
Fig.4.1 Experimental set up at Renewable Energy Research Unit in Adrar region
Fig.4.2 System synoptic scheme.
Tank
Valve
Reservoir
Pump
Flow meter
Valve anti return
Electric heater

Novel and ancient technologies for heating and cooling buildings
- 29 -
The system consists of: � A 150 litre storage tank, with a the heat loss coefficient UA=2.75W/K. Primary fluid is
injected from the bottom of the tank; � A pump of a maximum 550 W; � A reservoir of (60*60*45 cm3) 160 litre; � A flow meter; � Two electric heaters (max 5 kW). In order to understand the thermal behaviour of the tank experiments were carried out on a traditional tank corresponding to both of the following scenarios:
� Charge of tank with electric heaters; � Charge and discharge of tank with drawing off water.
4.2. Field experiments The storage tank is a key element for the performance of the solar-water heater and its thermal behaviour was therefore studied by numerical modelling and experiments. The first scenario was to inject fluid from the bottom of tank. At the end of manipulation, the temperature is nearly uniform whatever the inlet temperature. However, we noted the absence of stratification in the enclosure (Paper I).
In order to determine the fluid inlet temperature effect in tank, we carried out three tests which characteristics are given below in tables 4.1, 4.2 and 4.3.
Fig.4.3 Thermocouples distribution in tank

Novel and ancient technologies for heating and cooling buildings
- 30 -
Table 4.1: Test N°1 characteristics Date 31/12/2007
Test duration 3 hours Time step 30 s
Temperature constraints 55 ± 3°C Flow constraints 1.6 ± 0.1 l/min
Table 4.2: Test N°2 characteristics Date 02/01/2008
Test duration 2 hours 30 min Time step 30 s
Temperature constraints 60 ± 3°C Flow constraints 1.6 ± 0.1 l/min
Table 4.3: Test N°3 characteristics Date 06/01/2008
Test duration 2 hours 30 min Time step 30 s
Temperature constraints 40 ± 3°C Flow constraints 1.6 ± 0.1 l/min
Figs.4.4, 4.5 and 4.6 present the measured mean water temperature variation in the tank for various inlet water temperatures (55°C, 60°C and 40°C). Here, we can immediately notice that the curves shapes are very similar. However, to well appreciate the system dynamics, we traced and modelled the temperature evolution for these tests. Since we can assimilate the tank to only one node, the heat balance could be written:
)(.
TTCmdtdTCM epp �� (4)
The solution of this equation led us to the theoretical model:
��
�� ����� )*)/((1)(
.
00 tMmExpTTTT e (5)
However, the experimental results gave a second model (two exponentials):
)(*)(*2
21
1 ttExpA
ttExpATT e ����� (6)
0 20 40 60 80 100 120 140 160 180
25
30
35
40
45
50 T10 T8 T5 T6 T7 T9 T11 T12 T13 T14 T15 T16 T17 T18 T19
Tem
pera
ture
s (°
C)
Time (Minutes)
Fig.4.4: Temperature evolution in tank for 55°C inlet temperature
Fig.4.5: Temperature evolution in tank (inlet temperature: 60°C)
-20 0 20 40 60 80 100 120 140 160 180 20020
25
30
35
40
45
50
55
60 T10 T8 T5 T6 T7 T9 T11 T12 T13 T14 T15 T16 T17 T18 T19
Tem
pera
ture
s (°
C)
Time (Minutes)0 20 40 60 80 100 120 140
24
26
28
30
32
34
36
38 T10 T8 T5 T6 T7 T9 T11 T12 T13 T14 T15 T16 T17 T18 T19
Tem
pera
ture
s (°
C)
Time (Minutes)
Fig.4.6: Temperature evolution in tank (inlet temperature: 40°C)

Novel and ancient technologies for heating and cooling buildings
- 31 -
where: Te : Inlet fluid temperature r2 : Correlation factor. A1, A2, t1, t2 Constants given in Table 4.4:
Table 4.4: Constants variation according to the inlet temperatures Te A1 A2 t1 t2 R2
40°C 39.5 -6.96 -6.96 80.91 80.91 0.99 50°C 50 -12.34 -12.34 71.11 71.10 0.99 60°C 59.1 -16.76 -16.76 62.52 62.52 0.99
The results represented in Fig.4.7, permitted to validate the two exponentials model behaviour towards the theoretical model. The system dynamics is correctly reproduced, contrary to the theoretical model, where the maximum gap observed is about 3.02°C for a temperature of 50°C, and a very significant gap after 70 minutes for a temperature of 60°C.
Fig.4.7: Temperature temporary evolution at top centre of tank (T6) for different inlet temperatures
-20 0 20 40 60 80 100 120 140 160 180 200
25
30
35
40
45
50
55
60
65
Tem
pera
ture
s (°
C)
Time (Minutes)
4016Theo 4016Exp 4016Mod 5016Theo 5016Exp 5016Mod 6016Theo 6016Exp 6016Mod

Novel and ancient technologies for heating and cooling buildings
- 32 -
4.3. Drawing off influence in tank thermal behaviour The temperature profiles in Fig.4.8 and Fig.4.9 result from two hot water extractions of 20 min each, with a flow rate of 2.8 l/min. This means that the quantity of drawn water is 112 litres. In this second case, (Fig.4.8 and Fig.4.9) the temperature at the top of the tank decreases by 7°C after the first drawing off and 9°C after the second, whereas the temperatures in the lower layers decrease from 37°C to approximately 28°C, with the appearance of a small degree of stratification due to the two drawings off. After this dynamic phase and after a while it will be a balance within the tank due to the mixture by convection of water and the temperature is about 29°C. The confrontation of numerical results with experimental data showed that the two exponentials model correctly reproduces the storage tank thermo-hydraulic behaviour for various stresses. Furthermore, we can see an absence of the stratification phenomenon within the tank.
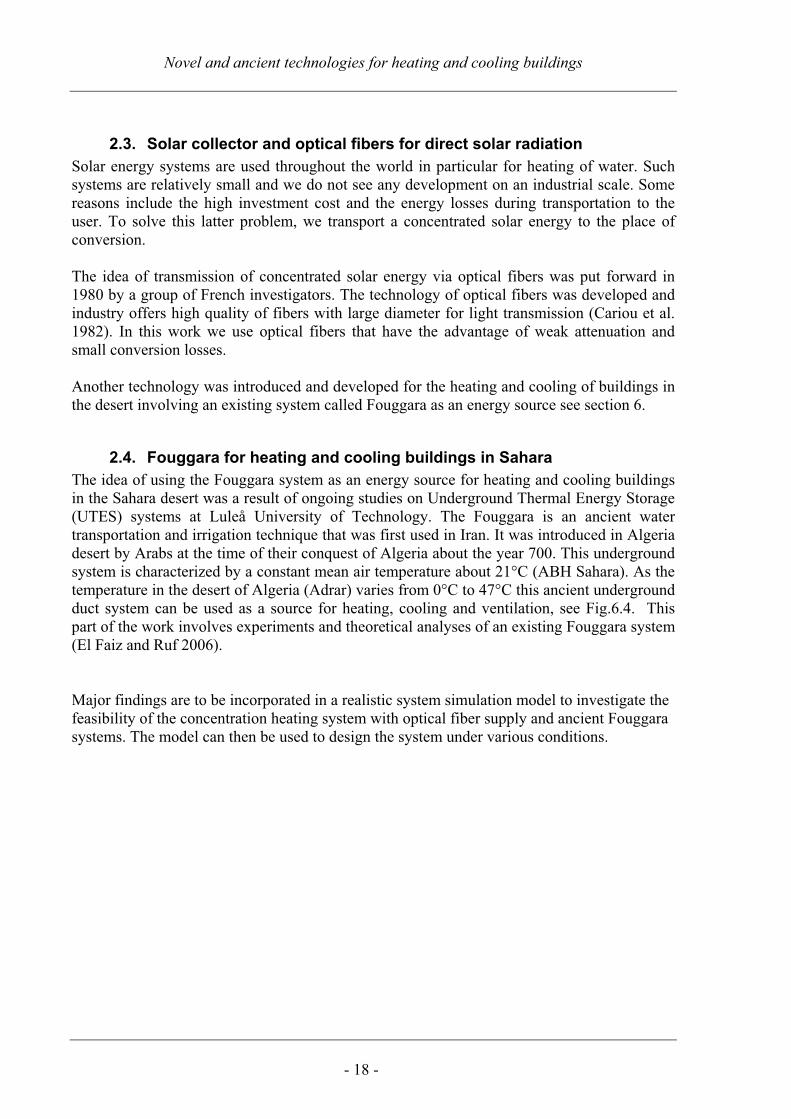
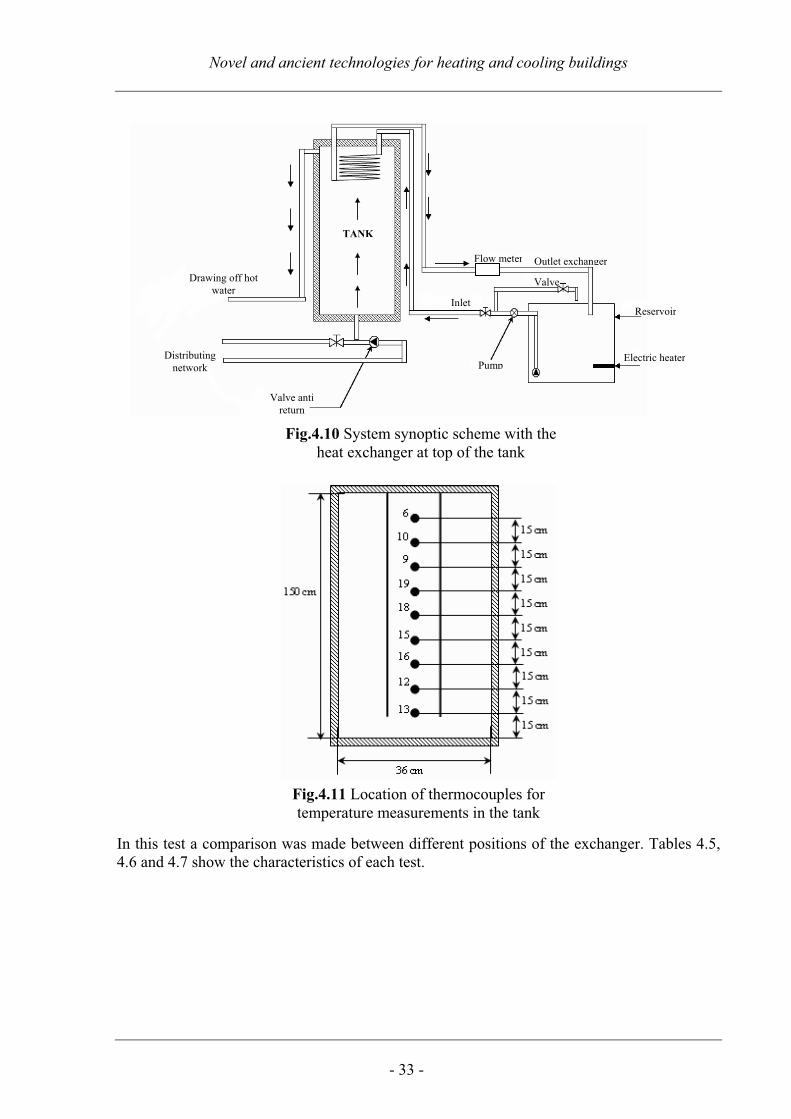
4.4. Exchangers The storage tank and its heat exchanger are the essential elements that contribute to optimize the performance of low flow solar water heaters. The exchangers used were made of copper with a diameter of 15 to 20 mm and 1m in length. This type of system significantly improves the thermal stratification in the storage tank. For that, we undertook other tests on a new configuration of tank, equipped with an exchanger (Fig.4.10), and thermocouples measuring nine fluid temperatures at different heights of the tank (Fig.4.11).
Fig.4.8 Temperature profiles during charge and discharge
0 100 200 300 400 500
15
20
25
30
35
40
Tem
pera
ture
s (°
C)
Time (Minutes)
T6 T9 T13 T15 T18
0
20
40
60
80
100
120
140
28 30 32 34 36 38Temperatures (°C)
Hei
ght (
cm)
Fig.4.9 Temporary temperature evolution in tank during the two hot water extractions
Novel and ancient technologies for heating and cooling buildings
- 33 -
In this test a comparison was made between different positions of the exchanger. Tables 4.5, 4.6 and 4.7 show the characteristics of each test.
Fig.4.11 Location of thermocouples for temperature measurements in the tank
Fig.4.10 System synoptic scheme with the heat exchanger at top of the tank
Reservoir
Outlet exchanger
Inlet
Valve
TANK
Drawing off hot water
Electric heaterPump
Valve anti return
Distributing network
Flow meter

Novel and ancient technologies for heating and cooling buildings
- 34 -
Table 4.5: Test N°4 characteristics (exchanger in the top of tank) Date 11/05/2008
Test duration 80 min Time step 1 min
Temperature constraints 50 ± 3°C First loop, flow constraints 6.2 ± 0.1 l/min
Table 4.6: Test N°5 characteristics (exchanger in middle of tank) Date 11/05/2008
Test duration 110 min Time step 1 min
Temperature constraints 50 ± 3°C First loop, flow constraints 5.8 ± 0.1 l/min
Table 4.7: Test N°6 characteristics (exchanger in the bottom of tank) Date 11/04/2008
Test duration 3 hours Time step 1 min
Temperature constraints 50 ± 3°C First loop, flow constraints 5.6 ± 0.1 l/min
Figs 4.12, 4.13 and 4.14 show temporary temperatures inside the tank and exchanger inlet/outlet temperature for various positions of the heat exchanger. By comparing the three configurations, we note that (Fig.4.12) a volume of 33 litres of the fluid reached the temperature of 45°C in 80 min. For the second configuration (Fig.4.13), 76 litres reaches 45°C in 95 min, with a high degree of stratification. Regarding Fig.4.14, the whole volume of the tank warmed up in almost three hours. As the stratification is a significant phenomenon for storage, it is preferable to put the exchanger either at the middle or in the top of tank.

Novel and ancient technologies for heating and cooling buildings
- 35 -
0 20 40 60 80
30
35
40
45
50
55
Tem
pera
ture
(°C
)
Temps (Minutes)
Inl-EXCHN T10 Out-EXCHN T6 T9 T12 T13 T15 T16 T18 T19
Fig.4.12: Temperatures profile in tank with exchanger at the top
0 20 40 60 80 100 12025
30
35
40
45
50
55
Tem
pera
ture
s(°C
)
Time (Minutes)
Inl-EXCHN T10 Out-EXCHN T6 T9 T12 T13 T15 T16 T18 T19
Fig.4.13: Temperatures profile in tank with exchanger at the centre
-20 0 20 40 60 80 100 120 140 160 180
30
35
40
45
50
Tem
pera
ture
s (°
C)
Time (Minutes)
Inl-EXCHN T10 Out-EXCHN T6 T9 T12 T13 T15 T16 T18 T19
Fig.4.14: Temperatures profile in tank with exchanger at the bottom

Novel and ancient technologies for heating and cooling buildings
- 36 -
4.5. Conclusion The tanks most commonly used for hot water storage have a cylindrical form. The first series of tests was carried out in order to highlight the system thermal behaviour, when it is subjected to various controlled loads. The resolution method of the two exponentials model was validated, compared to the theoretical model. The thermal performances were determined and the most effective configurations compared to the thermal storage efficiency were identified. It shows, not unexpectedly, that the highest efficiency is obtained when the hot fluid is injected into the top and the cold fluid is drawn from the bottom of tank. Regarding the influence of the exchanger position, the stratification in the middle of the tank is very well reproduced with better performances for storage. It is necessary to take into account all these phenomena in solar applications especially the coupling between the solar collector and storage tank. To reach this objective it is interesting to combine the storage tank with a concentrating solar collector using an optical fiber.

Novel and ancient technologies for heating and cooling buildings
- 37 -
5. System for hot water production and storage Solar energy has for many centuries been harvested by various methods. Different types of solar collectors, normally producing hot water at temperatures between 30oC to 90oC, are commonly used. Large areas of mirrors are used to concentrate the solar heat to very high temperatures in order to drive boilers for production of electricity. The other main development is solar cells (photo-voltaic) for direct production of electricity. More recent development concerns the collection and transmission of visible light through optical fibers for direct illumination (André and Schade, 2002).
Optical fibers play an important part in the fields of both long distance telecommunications and short link networks (LAN’s, etc.). More recently, designers have successfully applied less expensive, more mechanically robust fibers to various problems of illumination, such as safety lighting, background lighting, and medical lighting, among others. Typically, optical fiber for communications purposes used glass fiber with very small core diameters. On the other hand, more recent development work has concentrated on improving the light-propagating properties of larger core diameter fiber made out of plastic (William and Charles, 2002).
In the current study hot water production is achieved by a solar (light) collector (Fig.5.1) from which the visible light is transported though an optical fiber (Fig.5.2) to a water tank where the light dissipates into heat.
Since light collectors have the advantage of low attenuation, and no losses in the conversion from light to heated water (Cariou et al, 1985) it is an energy efficient way to produce hot water. The efficiency of conventional flat plate solar collectors means that approximately 60% of incident solar energy is collected and transformed into 60oC water.
The objective of this study was to design a new light collector system for hot water production with considerably higher efficiency than that of conventional systems.
The idea of carrying concentrated solar energy via optical fibers was first suggested in 1980 by a group of French researchers (Cariou et al., 1982). Kandilli and Ulgen (2007), who reviewed performed work in this field, showed that experimental studies began more recently as summarized below:
Fig.5.1: A SOLUX collector without the protecting acrylic dome [André and
Schade (2002)].
Fig.5.2: Construction of optical fiber [ATIS Telecom Glossary, 2007].

Novel and ancient technologies for heating and cooling buildings
- 38 -
- Khatri et al. (1993) discussed a solar energy collection system in which optical fibers are used to transport energy from a single-stage and a double-stage compound parabolic concentrator (CPC).
- Liang et al. (1997) emphasized the high flux solar energy transmission by a flexible optical fiber bundle and the research on the associated CPC could greatly expand the existing field of solar energy concentrator applications.
- Gordon (2001) showed that optical fibers used to transport sunlight exhibit considerable light leakage within their nominal numerical aperture and this leakage depends on (i) the incidence angle, (ii) the optical properties of the core and the cladding and (iii) the fiber length.
- Kato and Nakamura (1976) show that the technology for optical fiber transmission offers a high quality production with a large diameter of the core.
- Feuermann and Gordon (1998) in studying solar surgery used remote fiber-optic irradiation with highly concentrated sunlight in lieu of lasers.
- Jaramillo et al. (1999) developed a theoretical thermal study of optical fibers transmitting concentrated solar energy.
- Kribus et al. (2000) presented a study on the potential use of optical fibers for solar thermal power generation. The main performance characteristics (numerical aperture and attenuation) and typical costs of currently available fibers were discussed.
5.1. Prototype concentrator design
The effective incoming radiation to the aperture plane is the beam radiation. An incident beam of solar radiation is a cone with an angular width of 0.53° (Duffie and Beckman 1991). The focal length is a determining factor in image size, and the aperture is the determining factor in total energy. It is assumed that the beam radiation is normal to the aperture and the reflection is specular and perfect.
Each optical fiber has a pure transparent inner core and a thin transparent outer cladding. The total internal reflection allows us to guide the sunlight through the fiber. The fiber core has an index of refraction n1, which is greater than that of the cladding n2. The ratio of the core index and cladding index determines the acceptance/admission angle of radiation �max at which total internal reflection occurs:
222
21max )(sin nnNA ��� (7)
Here, NA is the numerical aperture. On the other hand, the energy rate Qp hitting a flat receiver of a paraboloidal concentrator, where the optical fiber inlet is placed, is given by
bmsrp GfQ ���� )sin(sin 222 �� (8)

Novel and ancient technologies for heating and cooling buildings
- 39 -
Where f is the focal length, �m is the reflectance of the surface, r� is the rim angle of the paraboloidal dish, s� is the shading angle because of the receptor size and Gb is the solar beam irradiance (Jaramillo and Del Rio 2002). It is important to mention that the rim angle
r� should be equal to or smaller than the optical fiber admission angle.
In optimum conditions, to ensure that the whole radiation gets into the fiber, the maximum rim angle of the paraboloidal dish must be
max � �r (9)
This corresponds to the maximum admission angle of the optical fiber.
On the other hand, from the definition of decibel losses per unit length, the energy rate Q0 at the end of the optical fiber can be expressed as:
10/0 10 lossdBL
pQQ �� (10)
5.2. Outline of Studied system,
The studied light collector system for hot water production, which is outlined in Fig.5.3, contains:
� Light concentrator represented by a parabolic mirror that has the following geometrical characteristics: Diameter (D) = 1.5 m.
� Optical fiber SPCH 1000/1035/1400Z from Fiberguide company:
o Length = 3 m,
o Silica core with a diameter of 1 mm,
o Average attenuation � = 6.2*10-3 dB/m on all solar spectrum,
o Numerical aperture f=20°.
� Cylindrical storage tank:
o Height = 1.5m ,
o Volume = 0,15 m3,

Novel and ancient technologies for heating and cooling buildings
- 40 -
Table.5.1 Parameters of parabolic dish
Parameters Parameters Da (aperture diameter (m)) 1.5 Cmax (maximum ratio of geometrical
concentration) 1858
Dr (receptor diameter (m)) 0.035 NA (Numerical aperture) 0.4 f (focal length (m)) 0.88 gmax (combined expression of the view factor
and concentration ratio) 8309
f0(optimal focal length (m)) 0.9 dmin (minimal focal spot diameter (m)) 0.020�r (paraboloidal dish rim angle(°)) 46 dmax (maximum focal spot diameter (m)) 0.034
�s (paraboloidal dish shading angle(°)) 0 �m (reflectivity of the paraboloidal dish) 0.85 �max (admission/acceptance angle(°)) 45 �of (efficiency of the fiber-optic bundle (%)) 99.7
�/2 (dispersion angle) 0.4 �o (optimum optical efficiency (%)) 61.7 dBloss (attenuation of optical fiber
(dB/km)) 6.2*10-3 �s (overall system efficiency (%)) 61
L (fiber-optic bundle length (m)) 2 Table 5.1 presents measured and calculated parameters of the parabolic dish. The optical fiber used is the type SPCH 1000/1035/1400Z from Fiberguide Company. It has a length of 3m and its diameter is 0.001m. The maximum admission angle of optical fiber was determined by Eq. (7). The attenuation of the optical fiber is indicated as 6.2*10-3dB/m by the manufacturer data. The ideal transmission efficiency of the optical fiber was found to be 99.7%. For maximum concentration ratio, the rim angle was found to be 1858 and used. In this case and using �max the view factor Fs was found to be 0.728. Consequently, optical efficiency of the whole system was calculated as 61.7% in optimum condition. Overall system efficiency was found to be 61%. These losses are due to the absorptivity and reflectivity of the dish, sun tracking, to the transport by optical fibers and by pipes contact with the atmosphere. The size of the image has uniform flux as given by dmin. As indicated in Table 5.1, dmin was calculated as 2.0 cm. If the aim is to receive all flux concentrated on the focal point, it should be considered maximum image size. For the existing system, dmax was calculated as 3.4 cm by considering dispersion effects.
Fig.5.3: Light collector for hot water production and storage
Inlet cold water
Optical fiber
Absorber
Air for heat circulation
Outlet hot water
Light Concentrator

Novel and ancient technologies for heating and cooling buildings
- 41 -
The cylindrical storage tank is composed of four parts as shown in Fig.5.4.
� Part 1 : External wall of the tank made of galvanized steel(H=1.50m; D=0.60m),
� Part 2 : 5cm of thermal insulating foam,
� Part 3 : Internal wall of tank made of galvanized steel (H=1.45m; D=0.50m),
� Part 4 : Absorber of galvanized steel with (H=0.50m; D=0.46m).
Part 1 Part 2 Part 3 Part 4
Vertical cut, Front view
Vertical cut, Profile view
Horizontal cut, Top view
Fig.5.4 Description of how the cylindrical tank is assembled.

Novel and ancient technologies for heating and cooling buildings
- 42 -
5.3. Experimental study of the prototype
The prototype design was based much more on the materials available on the market. Flow measurements were initially made by a flow meter, but after it was destroyed it was replaced by the much more accurate old system “bucket and stopwatch”.
After designing and assembling the two modules (concentrator + storage tank) (Fig.5.5), we undertook an experimental study.
Practical considerations militate against large and small dish rim angles. At small rim angles, relatively high efficiency can be realized at peak concentration; but for a given fiber size, smaller diameter dishes must be used. Dish focal length is large relative to the diameter, which creates a practical problem in terms of module depth (Paper VI).
To estimate realistic system performance, we reduce the theoretical limits by the following factors:
1. An absorptive loss in the dish mirror of 5%; (Feuermann and Gordon, 1999).
2. Fresnel reflective losses at the module glazing (3% with an AL coating); (Feuermann and Gordon, 1999).
3. Fresnel reflective losses at the fiber ends (a total of 5% with AL coatings); (Feuermann and Gordon, 1999).
4. Ray rejection in the secondary concentrator (in the range of 1 to 4% depending on the dish rim angle, and about 2% at � =45°) (Welford and Winston, 1989);
5. Absorption in a remote second stage of about 2 to 4%, depending on � (absorptive losses in a dielectric proximate second stage are negligible) (Welford and Winston, 1989);
Fig.5.5 Photos of the designed system and sunlight in the optical fiber outlet

Novel and ancient technologies for heating and cooling buildings
- 43 -
5.4. Results and discussion
Adrar city is located in south-west of Algeria, at 1600 km from Algiers capital, with a latitude of 27.88°, a longitude of -0.88° and an altitude of 270 m. It is characterized by particular climate conditions, i.e. hot and dry summers, cold and harsh winters.
Any use of solar radiations must take into account the local and regional climatic conditions. It is widely known that all the observed atmospheric processes are the consequences of the received solar radiation. Thus, the measurement of the solar radiation presents special interest for the environmental researchers (Santamouris and Asimakopoulos 2001).
As shown in Fig.5.6, the great increase for whole radiations is located between February and March; and a slight stability for the global collector slope between March and October.
0 30 60 90 120 150 180 210 240 270 300 330 3600
100
200
300
400
500
600
700
800
900
1000
1100
Bea
m ra
diat
ion
(w/m
²)
Time (Day)
Hourly global irradiance data of 2004 obtained from meteorological stations were used to predict the hourly normal beam radiation reaching the aperture plane of the paraboloidal dish. Global irradiance data were separated to beam and diffuse component by using the Clear Sky Model [Meteonorm 6.1, 2008]. The calculated hourly beam radiation was used to evaluate the monthly average hourly output power obtained from the paraboloidal dishes.
These data were presented to estimate the output power of the system. Taking into account all the factors that reduce the system performance, Eq.(8) and Eq.(10) give the annual mean of the output power from optical fiber .
After the determination of the output power quantity transported by the optical fiber to the storage tank, where it is absorbed then transmitted by the selective surface, the temperature in Fig.5.7 can reach 170°C at the equinoxes and 150°C at the solstice.
Fig.5.6 Calculated hourly solar beam radiation (W/m²)

Novel and ancient technologies for heating and cooling buildings
- 44 -
In performed tests the water flow rate through the accumulator tank was 0.6 l/min. Fig.5.8 shows the inlet and outlet temperature on 22 January 2009. In the light of these results, we noted the existence of a gap in the beginning of the manipulation of over 10 °C which became 50 °C at noon. It took approximately four hours to fill the storage tank with a flow rate of 0.6 l/min to obtain an average daily temperature of 36.5 °C. The decreases observed in Fig.5.8 for the outlet temperature Ts resulted from the manual sun tracking system.
Fig.5.8 Measured water inlet and outlet temperatures, 22 Jan 2009.
10,5 11,0 11,5 12,0 12,5 13,0
10
20
30
40
50
60
70
Temps (heures)
Te Ts
Tem
pera
ture
(°C
)
Time (Hours)
Fig.5.7 Temperatures reached on a selective surface at the solstices and the equinoxes
Summer solstice Winter solstice Equinoxes

Novel and ancient technologies for heating and cooling buildings
- 45 -
5.5. Concluding remarks
The major finding of the current analysis is that the use of optical fibers in solar thermal concentrating systems for heating is technically feasible, under specific circumstances. In the first phase of our solar fiber-optic paraboloidal dish program the main conclusions of the performed study are:
1. A solar fiber-optic heating system was designed, constructed and tested
2. Collection, concentration and transmission of sunlight were demonstrated.
3. The mathematical model of paraboloidal dish system was described.
4. The measured output power from the dish was evaluated against radiation data from the local meteorological station supplied by the Renewable Energy Research Unit (URER/MS) in Adrar.
5. Optimizing the receiver and dish size is important in order to maximize the system efficiency.
6. The calculated optical efficiency of the system was 62% at optimum conditions.
7. The calculated mean power from the paraboloidal dish was 885 kW which for an aperture area of 1.7 m2 means 520 kW/m2.
8. The heat was stored in a 0.15 m3 water storage tank.
9. The temperature of outlet water from the storage tank reached 70oC.
During the experimentation we encountered some difficulties e.g.
� Dust accumulation on the mirror and at the fiber tip.
� The parabolic mirror was made from a satellite dish, the surface of which was clothed by a foil tape. Its aluminium plies reduced the reflectivity that meant extra energy loss.
� The optical fiber was aligned at the concentrator focus by placing a cone (Length = 0.15m Diameter = 0.075 m) in the parabolic focus, mouthing the mirror. It was problematic to attach the fiber exactly at the focus.
� The manual measurements meant fewer measurements and more errors.
� Instead of using the desired optical fiber with relatively large diameter and high numerical aperture (NA), two optical fibers with a NA=0.4 manufactured by FiberGuide Company, USA, was used.
The current study showed that concentrated solar energy can be transferred as light by optical fibers to a selective surface (absorber) inside a storage tank, where the light is converted to heat. Such systems should have great potential in a wide range of solar energy applications.
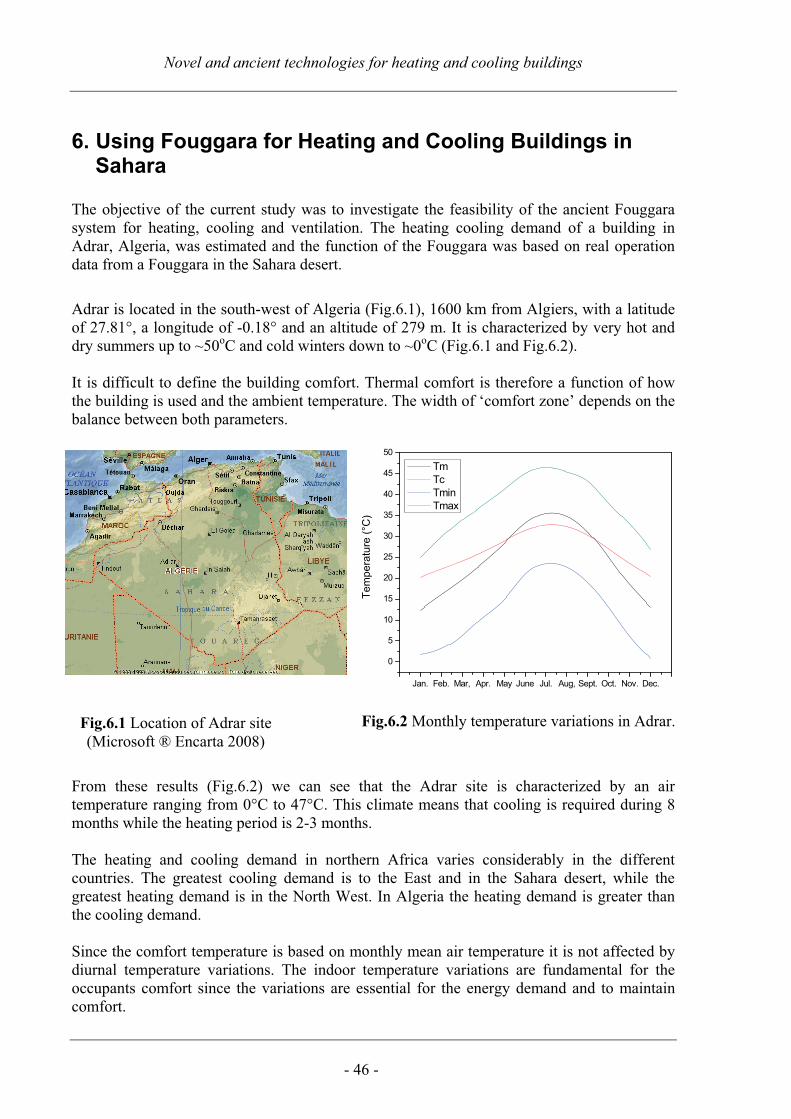
Novel and ancient technologies for heating and cooling buildings
- 46 -
6. Using Fouggara for Heating and Cooling Buildings in Sahara
The objective of the current study was to investigate the feasibility of the ancient Fouggara system for heating, cooling and ventilation. The heating cooling demand of a building in Adrar, Algeria, was estimated and the function of the Fouggara was based on real operation data from a Fouggara in the Sahara desert.
Adrar is located in the south-west of Algeria (Fig.6.1), 1600 km from Algiers, with a latitude of 27.81°, a longitude of -0.18° and an altitude of 279 m. It is characterized by very hot and dry summers up to ~50oC and cold winters down to ~0oC (Fig.6.1 and Fig.6.2). It is difficult to define the building comfort. Thermal comfort is therefore a function of how the building is used and the ambient temperature. The width of ‘comfort zone’ depends on the balance between both parameters.
From these results (Fig.6.2) we can see that the Adrar site is characterized by an air temperature ranging from 0°C to 47°C. This climate means that cooling is required during 8 months while the heating period is 2-3 months. The heating and cooling demand in northern Africa varies considerably in the different countries. The greatest cooling demand is to the East and in the Sahara desert, while the greatest heating demand is in the North West. In Algeria the heating demand is greater than the cooling demand. Since the comfort temperature is based on monthly mean air temperature it is not affected by diurnal temperature variations. The indoor temperature variations are fundamental for the occupants comfort since the variations are essential for the energy demand and to maintain comfort.
Fig.6.2 Monthly temperature variations in Adrar.
Jan. Feb. Mar, Apr. May June Jul. Aug, Sept. Oct. Nov. Dec.
0
5
10
15
20
25
30
35
40
45
50
Tem
pera
ture
(°C
)
Tm Tc Tmin Tmax
Fig.6.1 Location of Adrar site (Microsoft ® Encarta 2008)
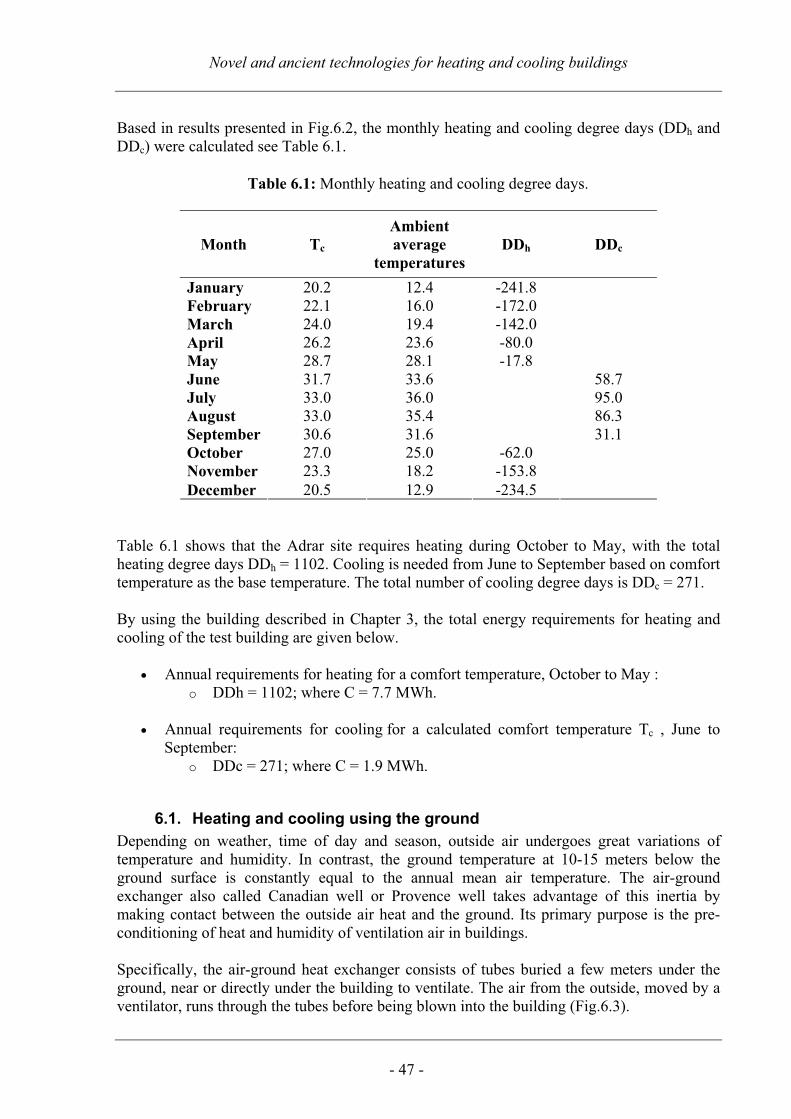
Novel and ancient technologies for heating and cooling buildings
- 47 -
Based in results presented in Fig.6.2, the monthly heating and cooling degree days (DDh and DDc) were calculated see Table 6.1.
Month Tc
Ambientaverage
temperaturesDDh DDc
January 20.2 12.4 -241.8 February 22.1 16.0 -172.0 March 24.0 19.4 -142.0 April 26.2 23.6 -80.0 May 28.7 28.1 -17.8
June 31.7 33.6 58.7 July 33.0 36.0 95.0 August 33.0 35.4 86.3 September 30.6 31.6
31.1 October 27.0 25.0 -62.0 November 23.3 18.2 -153.8 December 20.5 12.9 -234.5
Table 6.1 shows that the Adrar site requires heating during October to May, with the total heating degree days DDh = 1102. Cooling is needed from June to September based on comfort temperature as the base temperature. The total number of cooling degree days is DDc = 271.
By using the building described in Chapter 3, the total energy requirements for heating and cooling of the test building are given below.
� Annual requirements for heating for a comfort temperature, October to May : o DDh = 1102; where C = 7.7 MWh.
� Annual requirements for cooling for a calculated comfort temperature Tc , June to
September: o DDc = 271; where C = 1.9 MWh.
6.1. Heating and cooling using the groundDepending on weather, time of day and season, outside air undergoes great variations of temperature and humidity. In contrast, the ground temperature at 10-15 meters below the ground surface is constantly equal to the annual mean air temperature. The air-ground exchanger also called Canadian well or Provence well takes advantage of this inertia by making contact between the outside air heat and the ground. Its primary purpose is the pre-conditioning of heat and humidity of ventilation air in buildings. Specifically, the air-ground heat exchanger consists of tubes buried a few meters under the ground, near or directly under the building to ventilate. The air from the outside, moved by a ventilator, runs through the tubes before being blown into the building (Fig.6.3).
Table 6.1: Monthly heating and cooling degree days.

Novel and ancient technologies for heating and cooling buildings
- 48 -
During the passage through the ground tubes, the air flow is warmed or cooled by exchanging heat with the ground. Thus, the air can also be dehumidified when cooled. The ground-air heat exchanger thus reduces thermal variations and air humidity, which corresponds to pre-conditioned air. This system uses very little driving energy, so, it is almost passive.
Air-ground exchangers are available on the market. The performance of this type of integrated equipment is benign for sustainable building development The Canadian well-pipe system was chosen as the ventilation system of reference for this study. However, several studies address the technology of air-ground heat exchangers, either as a main subject [Mihalakakou et al. (1995a and 1995b); Benkert et al.(1997); Boji� et al. (1997); Benkert and Heidt (2000); Kunetz and Lefebvre (2001); Hollmuller (2002); Gehlin (2002); De Paepe and Janssens (2003); Dibowski (2003) and (2005), Zweifel (2004); Al Ajmi et al. (2005); Ghosal and Tiwari (2006); Badescu and Sicre (2003) and (2007), or as a specific study on cooling of buildings. Such systems are used for cooling of buildings and industrial applications e.g. greenhouses (Gauthier et al. 1997; Hollmuller and Lachal 2001, Ghosal and Tiwari op. cit. 2006).
6.2. Fouggara: An ancient system for underground transport of water
The Fouggara is known under various names; “Kariz” in Afghanistan, “Qanat” in Iran, “Fouggara” in Algeria and “Khettara” in Morocco. The water flow through the Fouggara is gravity driven. At the mouth of the underground channels it reaches the surface where it is used for irrigation and as drinking water, see Fig.6.4a and Fig.6.4b.
Fig.6.3 Simplified diagram of a Canadian well-pipe(Example of operation preheating)

Novel and ancient technologies for heating and cooling buildings
- 49 -
Fig.6.4b Vertical section along the Fouggara. (Khettara)
This Fouggara technique is very old and was first used in Iran. It was introduced in Algeria by Arabs at the time of their conquest of Algeria about the year 700. This technique was adopted by farmers of the area for the following reasons:
� The construction of the Fouggara (Khettara) does not require any financial
expenditure, but simply an effort of work. � Underground transportation of water minimises the water loss due to evaporation and
prevents the accumulation of the sediment caused by sandstorms (El Faiz and Ruf 2006).
6.3. Characteristics
The Fouggara is made up of: � The source where the water seeps into the channel from a ground water source, � An underground channel which brings the water to its intended destination, � An on-ground main channel which leads to a network of channels feeding the water to
particular areas or fields for irrigation.
Fig.6.4a Outline of the Fouggara principle. (El FAiz and Ruf 2006)

Novel and ancient technologies for heating and cooling buildings
- 50 -
Fig.6.5 Many wells represent the Fouggara
It is characterised by;
� The length of Fouggara varies from a few hundred meters to tens of kilometres. � The Fouggara is gravity driven as the water source is situated at a higher elevation
then the area to be irrigated. � The underground channel is wide enough to allow the clearing out and cleaning by
hand. � The depth of the shaft at the source varies from 10 to 25 meters. � The distance between two consecutive shafts depends in the stability of the terrain and
varies between 10 and 15 meters. � The water flow rate varies from 0.002 to 0.020 m3/s � It is located at a depth where the temperature is constantly at the annual mean air
temperature (i.e. 21oC in Adrar), (ABH Sahara). In Algeria the Fouggara is extended in all the Sahara and in Adrar there are 900 Fouggaras, more than 2/3 of them are not in operation. Today, the land area irrigated by Fouggaras is estimated at 8500 ha even though only 1/3 of them are in operation. (Fig.6.5). (Bouzidi, 1999) The existing Fouggaras, active or inactive, mean available underground duct systems that could be used as a source for heating and cooling. In the remote Saharan villages of the Saharawi people (Fig.6.6), which lack resources for expensive drilling, available Fouggaras offer an inexpensive alternative. Such a system would be made simply by pumping air through the Fouggara and conducting this air to the air conditioned building. The ambient air then approaches the temperature of the ground (~21°C) during the passage through the ground before used for ventilation, heating, and cooling of buildings (Fig.6.7 and Paper VII).

Novel and ancient technologies for heating and cooling buildings
- 51 -
Fig.6.6 Fouggara in Adrar.
Fig.6.7 The ground-air conditioning system.

Novel and ancient technologies for heating and cooling buildings
- 52 -
The suggested Fouggara air conditioning system, for cooling in the summer and heating in the winter of the URER test house consists of:
� One room characterised by a volume of 70 m3 � A pipe system connected to an air convector � A pump with an air flow rate of 0.02 m3/h from the Fouggara.
Fig.6.8 shows the ambient temperature and the air conditioned indoor temperatures during the year, given that the difference between the ambient and indoor temperatures in Adrar is approximately ±20°C.
6.4. Conclusion In this chapter we presented an ancient system called Fouggara for heating and cooling of a building in the desert. It is characterised by a constant annual temperature of 21°C in Adrar. This site is also characterised by very hot temperatures in summer which can exceed 40°C and can reach 0°C in winter. For this reason the novel idea is to use this energy source of Fouggara (not in operation) for heating and cooling of buildings in Adrar. It involves pumping the air from the source at a temperature of 21°C to the building for heating in winter and cooling in summer. From this study a very important conclusion can be drawn. Using the ancient system of Fouggara would contribute to reducing and eliminating the energy demand for heating and cooling buildings in the Sahara desert.
Fig.6.8 Ambient and Indoor temperature variation
0 2000 4000 6000 8000 10000
0
10
20
30
40
50
Tem
pera
ture
(°C
)
T im e (Hour)
Am bient Tem perature Indoor Tem perature Room
Novel and ancient technologies for heating and cooling buildings
- 53 -
7. General Conclusion The overall objective was to study and develop energy-efficient systems for domestic hot water production in Algerian similar climates. The considered energy supply system contains a high-temperature solar collector combined with a storage tank. An ancient irrigation system (Fouggara) was also studied for the possible purpose of air conditioning. The work was divided into four parts:
� Characteristic energy load for single-family house in Algeria � Thermal stratification in the buffer tank � Solar collector and optical fibers for direct solar radiation � Fouggara for heating and cooling buildings in Sahara
In the first stage, we defined the bioclimatic house with the various existing sources of positive energy. In order to contribute more information on buildings a study was undertaken on a house located in Tlemcen. The calculated energy demands for heating and/or cooling were:
� Energy demand for heating: 7375 kWh. � Energy demand for cooling: 589 kWh.
Moreover, we introduced the concept of positive energy which fits fully in the current context of energy management, renewable energy use, heat storage, and sustainable development. Thus, it appeared interesting to model the storage tank by stressing the various technologies used in these systems as well as the research carried out in this field. Initially, we studied the influence of intrinsic parameters (inlet temperatures, flow rate and the exchanger position). In the light of the obtained results, the confrontation of numerical results with the experimental data for storage tank proved the coherence of a two exponentials model compared to the theoretical model. It also shows that the highest efficiency is obtained when hot fluid is injected into the top and cold fluid is drawn from the bottom of tank. The performance of a solar system, containing a parabolic mirror, an optical fiber for heat transport and water tank for heat storage were also studied:
� The idea of transporting concentrated solar energy (light) via optical fibers has been a source for numerous studies conducted on different areas since the 1980s.
� The use of optical fibers for (short distance) energy transportation is efficient. � The maximum water temperature reached was about 70°C. � The comparison between our system and a conventional system of CSTB, the
developed system is more advantageous and reliable.
The gains produced vary with the climate and the type of materials used.
In order to utilise naturally stored heat or cold from the ground, seasonal temperature variations are required. The ground temperature, which is equal to the annual mean air temperature, is warmer than the air temperature during winter and colder during summer. In the north of Libya the mean temperature difference between the coldest and warmest month is about 20°C. In Algeria this difference is even greater, which is favourable.

Novel and ancient technologies for heating and cooling buildings
- 54 -
The heating and cooling demand in northern Africa varies considerably in the different countries, with the greatest cooling demand in the Sahara and the greatest heating demand in the north-west. The annual energy cooling demand of the test building situated in Adrar gave:
� Heating demand for comfort temperature, o October to May: DD = 1102; where C = 7.7 MWh.
� Cooling demand for comfort temperature, o June to September: DD = 271; where C = 1.9 MWh.
The study of the ancient Fouggara system aimed to investigate its possible use as a source for heating, cooling and ventilation of buildings. The Fouggara consists of:
� The source where the water seeps into the channel from a ground water source, � An underground channel which brings the water to its intended destination, � An over ground channel which leads to a network of channels feeding the water to
particular areas or fields for irrigation. Since the Fouggara is at a depth below the ground surface where the seasonal temperature changes do not reach, the Fouggara temperature is close to the annual mean air temperature. In Adrar in the south of Algeria the mean annual temperature is 21oC. Pumping air through the Fouggara means that the air temperature will approach this temperature.
� This novel idea of using an ancient construction as a source for heating, cooling and ventilation has not yet been tested.
� It would be attractive to realise such a test on the test building in Adrar. � However, before performing such a test simulations of how the operation affects the
air and ground temperatures should be made.
7.1. Further research The principal future prospects for this research work revolve around:
� The use of optical fibers with large diameter with a large numerical aperture or a whole of optical fibers.
� Improvement of the optical fiber/storage tank system. � To code the model and introduce it into the TRNSYS library. � To look further into the phenomena of solar radiation transport and the concentration
in order to optimize the hot water production. � Using the Fouggara.

Novel and ancient technologies for heating and cooling buildings
- 55 -
References 1. ABH Sahara, Agence de Bassin Hydrographique available: http://www.abhs.dz 2. Al Ajmi, F., Loveday, D.L., Hanby, V.I. (2005), The cooling potential of earth-air heat
exchangers for domestic buildings in a desert climate, Building and Environment. Vol. 41 (3). pp. 235–244.
3. André, E. and Schade, J., (2002), Daylighting by Optical Fiber. MSc Thesis 2002:260,
Luleå University of Technology, Sweden. 4. ASHRAE, (1992), Thermal Environment Conditions for Human Occupancy, ASHRAE
Standard 55, American Society of Heating Refrigeration and Air-Conditioning Engineers, Atlanta, GA.
5. Badescu, V. and Sicre, B. (2003), Renewable energy for passive house heating: II.
Model, Energy and Buildings. Vol. 35 (11). pp. 1085–1096. 6. Badescu, V. (2007), Simple and accurate model for the ground heat exchanger of a
passive house, Renewable energy. Vol 32 (5). pp. 845–855. 7. Benkert, S., Heidt, F. D., Schöler, D. (1997), Calculation tool for earth heat exchangers
GAEA, Proceedings of IBPSA Conference. Prague. 8. Benkert, S. and Heidt, F. D. (2000), Abschlussbericht zum Projekt : Validierung des
Programms "Graphische Auslegung von ErdwärmeAustauschern GAEA" mit Hilfe von Messdaten im Rahmen des Verbundprojekts "Luft-/Erdwärme tauscher" der AG Solar NRW. FG Bauphysik & Solarenergie, Universität Siegen, 89 p. Disponbile en ligne: http://nesa1.uni-siegen.de/softlab/download/abschlussbericht.PDF
9. Bernard. R., Menguy. G., Schwartz. M. (1980), Le rayonnement solaire – Conversion
thermique et applications. Paris, Technique et Documentation, II Edition. 10. Bertani. R. (2007), World Geothermal Generation in 2007, available:
http://geoheat.oit.edu/bulletin/bull28-3/art3.pdf 11. Boji�, M., Trifunovi�, N., Papadakis, G., Kyritsis, S. (1997), Numerical simulation,
technical and economic evaluation of air-to-earth heat exchanger coupled to a building, Energy. Vol. 22 (12). pp. 1151–1158.
12. Bouhdjar. A. (2005), Phénomène de stratification dans une cuve de stockage thermique :
Etude paramétrique, Thèse de Doctorat, Université Abou Bekr Belkaid – TLEMCEN. 13. Boussaid-Benchaa. S, Guide des énergies renouvelables Algérie, Ministère des Energies
et des Mines. 14. Bouzidi, B. (1999), L’Energie Solaire et les Régions Sahariennes : Exemple de la
Région d’Adrar. Revue des Energies Renouvelables : Valorisation. pp101-104.

Novel and ancient technologies for heating and cooling buildings
- 56 -
15. Cariou, J. M., Dugas, J., Martin, L. (1982), Transport of solar energy with optical fibers. Solar Energy 29, 397–406.
16. Cariou, J. M., Dugas, J., Martin, L. (1985), Theoretical limits of optical fibre solar
furnaces. Solar Energy 34, 329. 17. Chan, A.M.C., Smereka, P.S., Giusti, D. (1983), A numerical study of transcient mixed
convection flows in a thermal storage tank, ASME Journal of Heat Transfer, Vol. 105, pp. 246-253.
18. CITEPA (Centre Interprofessionnel Technique d’Etude de la Pollution Atmosphérique),
www.citepa.org/publications/CCNUCC_France_dec2006.pdf 19. Darby, S. and White, R. (2005), Thermal comfort, Background document C for the 40%
House report, Environmental Change Institute University of Oxford. 20. Davidson, J.H., Adams, D.A., Miller, J.A. (1994), A coefficient to characterise mixing
in solar water storage tanks, Vol. 116. 21. deDear, R. J. (1998), A global database of thermal comfort field experiments, in
ASHRAE Transactions, 104(1b), 1141-1152. 22. De Paepe, M. and Janssens, A. (2003), Thermo-hydraulic design of earth-air heat
exchangers, Energy and Buildings. Vol. 35 (4). pp. 389–397. 23. Dibowski, H. G. (2003), Auf Basis umfangreicher Messdatensätze experimentell und
numerisch validierte Regeln zur optimierten Auslegung von Luft-Erdwärmetauschern. Thèse de doctorat. Universität Kassel. Kassel. 225 p.
24. Dibowski, H. G. (2005), Luft-Erdwärmetauscher L-EWT Planungsleitfaden Teil 2:
Testanlagen im Verbundprojekt. Rapport AG Solar. Köln. 102 p. 25. Duffie, J.A. and Beckman W.A. (1991), Solar Engineering of Thermal Processes,
Second Edition, A Wiley – Interscience Publication, New York. 26. ECOHABITAT,
www.ecohabitatsolutions.com/dossier%20energies%20renouvelables.pdf 27. ECOMED, http://ecomed21.org/articles-energie/articles/potentiel-solaire/ 28. El Faiz, M. and Ruf, T. What stakes of development for the systems of khettara (Water
mines) in Morocco, 1st International Conference on Water, Ecosystems and Sustainable Development In Arid And Semi-Arid Zones, 9-15 October 2006, Urumqi China, Disponible en ligne: www.isiimm.agropolis.org/OSIRIS/article/maElFaizRuf2006_khettaras2.pdf
29. ENERGIEPLUS: http://www.energieplus-lesite.be/energieplus/page_11310.htm 30. Entreprises, N° 914, 15-21 mars 1973, http://www.cndp.fr/revueTDC/914-81949.htm
Novel and ancient technologies for heating and cooling buildings
- 57 -
31. Feuermann, D. and Gordon, J. M. (1998), Solar surgery: remote fiber-optic irradiation with highly concentrated sunlight in lieu of lasers. Opt. Eng. 37, 2760–2767.
32. Feuermann, D., Gordon, J. M. (1999), Solar fiber-optic mini-dishes: a new approach to
the efficient collection of sunlight, Solar energy. Vol. 65 (3). pp. 159–170. 33. Gauthier, C., Lacroix, M., Bernier, H. (1997), Numerical simulation of soil heat
exchangerstorage systems for greenhouses, Solar energy. Vol. 60 (6). pp. 333–346. 34. GEB, Geothermal Energy Barometer (2007), Systèmes solaires – Journal des Energies
Renouvelables N°181 – 2007, available : http://www.eurobserv-er.org/pdf/baro181.pdf 35. Gehlin, S. (2002), Thermal response test – Method development and evaluation.
Doctoral Thesis 2002:39, LuTH. 36. Ghosal, M. D. and Tiwari, G. N. (2006), Modeling and parametric studies for thermal
performance of an earth to air heat exchanger integrated with a greenhouse, Energy conversion and management. Vol. 47 (13-14). pp. 1779-1798.
37. Gordon, J. M. (2001), Solar energy engineering: a mini-revolution in Israel. Refocus
March, 34–37. 38. Grein, M., Nordell, B., Almathnani, A., M. (2006), UTES potential for space heating
and cooling in Libya. In: ECOSTOCK 2006 Conference Proceedings. Richard Stockton Collège of NJ.
39. Gupta, S.K. and Jaluria, Y. (1981), An experimental and analytical study of thermal
stratification in an enclosed water region due to thermal energy discharge, Energy Convers. & Mgmt, Vol. 21, pp. 3 – 8, Pergamon Press.
40. Hermansson, R. (1983), Short term water heat storage, An experimental and numerical
investigation of phenomena that affect the degree of thermal stratification, Doctoral Thesis, Lulea University of Technology.
41. Hollmuller, P. and Lachal, B. (2001), Cooling and preheating with buried pipe systems:
monitoring, simulation and economic aspects, Energy and Buildings. Vol. 33 (5). pp. 509–518.
42. Hollmuller, P. (2002), Utilisation des échangeurs air-sol pour le chauffage et le
rafraîchissement des bâtiments. Thèse de doctorat. Faculté des sciences de l'Université de Genève. 125 p. Disponible en ligne. URL : http://www.unige.ch/cyberdocuments/theses2002/HollmullerP/these.html
43. Humphreys, M. A. (1978), Outdoor temperatures and comfort indoors, in Buildings
Research and Practice, 6(2), 92-105. 44. Humphreys, M. A. and Nicol, J. F. (2000), Outdoor temperature and indoor thermal
comfort: raising the precision of the relationship for the 1998 ASHRAE Transactions, 206(2), 493-502.

Novel and ancient technologies for heating and cooling buildings
- 58 -
45. Humphreys, M. A. and Nicol, J. F. (2002), The validity of ISO-PMV for predicting comfort votes in every day thermal environments, in Energy and Buildings, 34(6), 667-684.
46. IFP, Innovation, Energies, Environement, FP, www.ifp.fr/content/download/58672/1280850/file/Energie-et-Climat_A-Rojey_Chapitre2.pdf 47. Jaramillo, OA., del Rio, JA., Huelsz G. (1999), A thermal study of optical fibres
transmitting concentrated solar energy. J Phys D 1999; 32:1000–5.
48. Jaramillo, OA. and del Rio, JA., (2002), Optical fibres for a mini-dish/Stirling system: thermodynamic optimization. J Phys D 2002; 35: 1241–50.
49. Johannes, K., Fraisse, G., Achard, G., Rusaouën, G. (2004), Etude de la stratification thermique dans un ballon d’eau chaude sanitaire, Publication IBPSA Toulouse.
50. Kalinowski, W. (2008), http://www.cdurable.info/Petrole-la-nouvelle-hausse-des-
prix,904.html 51. Kandilli, C. and Ulgen, K. (2007), Review and modelling the systems of transmission
concentrated solar energy via optical fibres. Renewable and Sustainable Energy Reviews 13, 67–84.
52. Kato, D. and Nakamura, T. (1976), Application of optical fibers to the transmission of
solar radiation. J. Appl. Phys. 47, 4528–4531. 53. Kenjo, L. (2003), Etude du comportement thermique d’un chauffe-eau solaire a faible
débit. Thèse DOC, Université de Nice-Sophia Antipolis. 54. Khatri, N., Brown, M., Gerner, F. (1993), Using fiber optics to tap the sun’s power. Int.
Commun. Heat Mass Transfer 20, 771–781. 55. Kribus, A., Zik, O., Karni, J. (2000), Optical fibres and solar power generation. Sol
Energy; 68:405–16. 56. Kunetz, J. and Lefebvre, L. (2001), Les puits provençaux. Etude et méthode de
dimensionnement. Rapport de projet tutoré de 5ème année. INSA de Toulouse. 54 pp. 57. Lako, P., Eder, H., de Noord, M., Reisinger, H. (2003), Hydropower development with a
focus on Asia and western Europe, ECN-C--03-027. 58. Lavan, Z. and Thompson, J., (1977), Experimental study of thermal stratified hot water
storage tanks, Solar Energy, Vol 19, pp. 519 – 524. 59. Liang, D., Nunes, Y., Monteiro, L. F., Monteiro, M. L. F., Collares-Pereira, M. (1997),
200 W solar energy delivery with optical fiber bundles. In Nonimaging Optics: Maximum Efficiency Light Transfer 6, Vol. 3139, pp. 217–224.
60. Loehrke, R.I., Holzer, J.C., Gari, H.N., Sharp, M.K. (1979), Stratification enhancement
in liquid thermal storage tanks, Journal of Energy 3:3:129, May-June 1979.
Novel and ancient technologies for heating and cooling buildings
- 59 -
61. Maugard, A., Visier, J. C., Quénard, D. (2005), Le bâtiment à énergie positive, Futuribles, 304.
62. McCartney, K. J. and Humphreys, M. A, (2002), Thermal comfort and productivity, in
H Levin (ed), Proceedings of the 9th International Conference on Indoor Air, Vol.1, Indoor Air, Santa Cruz, USA, 822-827.
63. McIntyre, D. A. (1980), Indoor Climate, Barking, Applied Science Publishers. 64. Meteonorm version 6.1: www.meteonorm.com 65. Mihalakakou, G., Santamouris, M., Asimakopoulos, D.N., Argiriou, A. (1995), On the
ground temperature below buildings, Solar energy. Vol. 55 (5). pp. 355–362. 66. Mihalakakou, G., Santamouris, M., Asimakopoulos, D. N. (1995), Modelling the
thermal performance of earth-to-air heat exchangers, Solar energy. Vol 53 (3). pp. 301–305.
67. MEM-Algeria, Ministère de l’Energie et des mines, www.mem.algeria.org 68. Microsoft ® Encarta ® (2008), © 1993-2007 Microsoft Corporation. 69. Norton, B. (1992), solar energy thermal technology, Springer-Verlag London Limited. 70. Ouzzane, M., Hamid, A., Zerouki, A. (1990), Expérimental and theoretical studies on
natural circulation solar water heating, 2nd International Symposium on Renewable Energy Sources, Cairo.
71. Parsons, K. C. (2002), Human Thermal Environments, 2nd edn, Oxford, Blackwell
Scientific. 72. Phillips, W.F. and Pate, R.A. (1977), Mass and energy transfer in a hot liquid energy
systems, Proceedings of American Section International Solar Energy Society, pp. 17.6 – 17.10, Orlando, Florida, USA.
73. Price per barrel – official oil rate : http://prixdubaril.com 74. Remund, J. and Kunz, S. (2004), Meteonorm Version 5.1. Global meteorological
database for applied climatology. www.meteonorm.com 75. Roaf, S. C., Fuentes, M., Taylor, S. (2001), The eco-house design guide, London,
Architectural Press. 76. Rojey, A. (2008), Energie et climat : réussir la transition énergétique, Ed. Technip. 77. Sabonnadière, J. C. and Quenard, D. (2007), Nouvelles technologies de l’énergie4,
« Vers les bâtiments à énergie positive », Hermes-Lavoisier.

Novel and ancient technologies for heating and cooling buildings
- 60 -
78. Samuel, B. (Énergies renouvelables + maîtrise de l'énergie), http://samuel.benoit.online.fr/fr/petrole-consommation-mondiale-evolution-pic-petrolier-hubbert-peak-oil-chine-inde-npi
79. Santamouris, M. (2003), Solar Thermal Technologies for buildings – State of the art. 80. Santamouris, M. and Asimakopoulos, D. (2001), passive cooling of buildings. 81. Sharp, M. K. and Loehrke, R. I. (1997), Stratified thermal storage in residential solar
energy application, J of Energy, Vol. 3, pp. 106-112. 82. Turner, J.S. (1973), Buoyancy effects in fluids, internal mixing processess, Cambridge
University press, pp. 313 – 337. 83. Van Koppen, C.W.J., Thomas, J.P.X., Veltkamp, W.B. (1979), The actual benefits of
thermally stratified storage in a small and medium size solar system. Sun II, Proceedings ISES Biennal Meeting Atlanta.
84. Veltkamp, W.B. (1981), Thermal storage of solar energy, C. den Ouden, ed., Martinius
Nijhoff publishers, The Hague, pp. 61 – 72.
85. Welford, W. T. and Winston, R. (1989), High Collection Nonimaging Optics, Academic Press, San Diego.
86. William, G. and Charles, P. (2002), Passive Solar Lighting Using Fiber Optics, Journal of Industrial Technology, Volume19, Number 1, November 2002 to January 2003.
87. Wu, S.T. and Hun, S.M. (1978), A liquid solar energy tank model : I Formulation of a mathematical model, Modeling Simulation, Testing and Measurements for Solar Energy, The Winter Annual Meeting of ASME, pp. 53–60, San Francisco, California, USA.
88. Wüstling, M.D., Klein, S.A., Duffie, J.A. (1985), Promising control alternatives for solar water heating systems, J. of Solar Energy Engineering, Vol. 107, pp. 215-221.
89. Zweifel, G. (2004), A simplified model of a Ground to Air Heat Exchanger. Hochschule für Technik+Architektur Luzern (HTA Luzern). Horw. 6 p.

Stratification dans les ballons d’eau chaude sanitaire : Comparaison de modèles existants
Proceedings, 12èmes Journées Internationales de Thermique (JITH), (2005), pp 219-222, Tanger, Maroc, 2005,
PAPER I


12èmes Journées Internationales de Thermique ------------------------------------------------------------------------------------------------------------------------------------------------
Tanger, Maroc du 15 au 17 Novembre 2005
219
STRATIFICATION DANS LES BALLONS D’EAU CHAUDE SANITAIRE : COMPARAISON DE MODELES EXISTANTS
S. AMARA(1) , J. VIRGONE(2), H. BOUIA(3), G. KRAUSS(2)
(1) Unité de Recherche Matériaux et Energies Renouvelables, BP119 Université de Tlemcen, Algérie Email : [email protected]
(2) Laboratoire Commun « Bâtiment Haute Efficacité Energétique », CETHIL – EDF R&D CETHIL (UMR 5008), INSA de LYON, Université Claude Bernard Lyon 1, EDF R&D
Domaine Universitaire de la Doua, Bât. Freyssinet, 40 rue des arts, 69100 VILLEURBANNE, France Email : [email protected]
(3) Laboratoire Commun « Bâtiment Haute Efficacité Energétique », CETHIL – EDF R&D EDF R&D, Route de Sens, Ecuelles, 77250 Moret sur Loing, France
Email : [email protected]
Résumé – les modèles représentant la stratificatio n thermique dans les ballons d’eau chaude traitent dans leur majorité le cas d’un ballon vertical alimenté en eau froide par le bas et muni d’un puisage d’eau chaude par le haut. La stratification y est modélisée en subdivisant le ballon en tranches horizontales suffisamment fines pour des raison s de stabilité numérique. Pour chaque tranche, sont établies les équations de bilan de masse et d’énergie sachant que l ’écoulement est de t ype piston et se fai t de bas en haut. La résolution du système global obtenu fournit les te mpératures caractérisant chaque couche de ballon en fonction du puisage d’eau, des énergies de chauffage (électricité la nuit et appoint solaire ou gaz le jour), de l’emplacement des points d’apport énergétique…
Ce type de modèle est très restrictif dans le cas o ù le ballon est couplé à un autre ballon de préchauffage ou à un échangeur externe nécessitant un écoulement de haut en bas provenant du côté échangeur.
La présente communication consiste en une ét ude bibliographique sur l’état d e l’art en matière de modélisation des ballons d’eau chaude sanitaire.
La première partie de cette étude présentera différents modèles : multicouches, zonaux, de stockage brassé ou de couches à volumes variables.
La deuxième partie présente une comparaison entre les résultats de 2 modèles de ba llon de type multicouche implantés dans les environnements TRNSYS et Ca-Sis dans des co nfigurations classiques de circuits d’eau chaude couplés au solaire.
Mots Clés :
Modélisation, stockage, ballon d’ECS, stratification, simulation, température.
Introduction
La préparation de l’ea u chaude sanitaire constitue une des applications privilégiées de l’énergie solaire dans le bâtiment. Ceci tien t à la nature du besoin : température de l’eau chaude relativement peu élevée (entre 50 et 60°C), faible variation des besoins au cours de l’année, contrairement au chauffage. Outre
les capteurs, le co mposant essentiel d’un système de production d’eau chaude sanitaire est le ballon de stockage. Pour des raisons d’efficacité, la partie solaire se trouve en partie basse du ballon et l’ap point en partie haute (figure 1).
Eau froide
Appoint
Eau chaude
Capteur solaire
Rayonnement solaire
Figure1 : Schéma d’un système de production d’eau chaude sanitaire
L’énergie exploitable du ballon est augmentée si on améliore la st ratification des températures. En effet, cette dernière permet d’obtenir une température dans le haut du ballon la plus élevée possible, ce qui a pour conséquence de diminuer l ’énergie d’appoint. De plus, une température plus basse dans le bas du ballon améliore le rendement du capteur [1]. Afin d’optimiser un tel systè me il est n écessaire de modéliser chaque composant qui le co nstitue. Pour ce qui concerne les ballons d’eau chaude sanitaire, il ex iste actuellement dans la littérature, 4 grands types de modèles :
� Modèle de stockage brassé � Modèle à volumes variables � Modèle zonal � Modèle multicouches
Après avoir présenté ces m odèles dans la suite, deux d’entre eux sont retenus pour comparer leur résultats dans des co nfigurations classiques. Il s’agit des

12èmes Journées Internationales de Thermique ------------------------------------------------------------------------------------------------------------------------------------------------
Tanger, Maroc du 15 au 17 Novembre 2005
220
modèles multicouches implantés respectivement dans TRNSYS [2] et CA-SIS [3]. Les différents modèles de ballons
Différents auteurs ont mis au p oint plusieurs modèles de ballons d’eau chaude sanitaire s’adaptant à l eurs besoins comme dans TR NSYS (Types 4, 38, 60 par exemple), dans Ca-Sis (type 81) ou dans CLIM2000.
- Modèle de stockage brassé : Ce m odèle considère que l’eau du ballon est caractérisée par une seule température : hypothèse d’un mélange parfait et instantané. De ce fait, la stratificatio n n’est pas représentée.
- Modèle à volumes variables (Type 38) : Ce modèle simule la stra tification thermique dans le b allon en considérant des couches à vo lumes variables dont l’épaisseur s’adapte au pas de temps de calcul ainsi qu’au débit de puisage et débit du fluide. L’avantage de ce modèle est d’utiliser, sans avoir à agir sur le pas de temps, un maillage fin dans les zon es de forte stratification et u n maillage grossier en regroupant, selon le m ode choisi par l’utilisateur, des mailles voisines avec un écart de température n’excédant pas 0,5°C. L’inconvénient de ce modèle est qu’il est limité à deux entrées et deux sorties d’eau [1].
- Modèle zonal (Modèle de Lana Kenjo [4]) :L’hypothèse de base d’un modèle zonal est la division du volume de l’enceinte étudiée en N zones caractérisées par un nœud de température chacune. Le système compte N-1 équations de bilan massique et N équations de bilan énergétique indépendantes avec comme inconnues N tem pératures et autant de dé bits que de frontières entre zones. En général, le nombre d’inconnues dépasse largement le nombre d’équations de bilan. Les équations de quantité de m ouvement ne sont pas prises en compte dans ce type de modèle, c’est pourquoi il est n écessaire d’émettre des hypothèses supplémentaires pour la fermeture du problème [2]. La méthode générale pour cela consiste à i mposer des scénarios d’écoulement du fluide. La figure 2 présente les échanges entre les différentes zones pour un cas général où la température de la paroi est supérieure à celle du fl uide, à di fférents niveaux de l’axe vertical. En introduisant l’énergie échangée obtenue dans le bilan énergétique de chaque couche dans l’équation donnant l’énergie échangée par un élément de paroi, nous pouvons calculer le débit venant de chaque élément central vers la zone pariétale selon la relation :
)(.)]()([)]1()([.)(
)(.)(.)()( 1
..
iiTiTiTiTim
iCiHiSim
ap
cc
p ���
��
Avec : � H(i) est le coefficient de convection de
l’élément i (W/m2 °C) � S(i) la surface de la paroi associée (m2) � Ta la température dans la zone centrale (°C) � Tc la température de la couche limite (°C)
� Tp la te mpérature de la pa roi associée à la zone pariétale (°C)
� (i) représente la te mpérature moyenne adimensionnée de la couche i :
)]()([)]()([)(
iTiTiTiTi
ap
ac
��
�
Figure 2 : schéma des échanges entre zones d’un modèle zonal
- Modèle multicouches (Types 4, 60 dans TRNSYS et 81 dans Ca-Sis) : L’hypothèse retenue pour ce modèle est de diviser le ballon de stockage en N couches de volumes égaux et d’établir un bilan énergétique pour chaque couche. Ce dernie r est réalisé de la façon suivante pour la ième couche correspondant à la figure 3.
flueinjectéauxéchangeurcondenvpi dtdTCM ������ ������)(
Avec : � Mi est la masse du volume i [kg] � Cp la chaleur massique du fluide [J/kg.K]
� )()( ienvsenv TTAUU ����� Flux convectif échangé avec l’ambiance [W]
� )()(
1 iis
cond TTx
AKK�
���
� �� Flux par
conduction entre chaque couche [W]
� DTLMUAhxéchangeur �� Flux convectif lié à l’échangeur interne [W]
� �aux : Flux injecté par la résistance électrique d’appoint = Qaux [W]
�.
1111
.
11
)(
)(
iipupinjectéoutin
iinpininjecté
TTCmoummavec
TTCm
���
��
��
�
Flux lié à une source chaude ou froide [W]
� )( iflueflueflue TTAU ��� Flux convectif échangé avec une éventuelle cheminée [W]
L’augmentation du nombre de n œuds diminue le mélange interne, ce qui permet donc de définir une stratification du ballon plus au moins importante. Le phénomène de convection qui entre en jeu entre les

12èmes Journées Internationales de Thermique ------------------------------------------------------------------------------------------------------------------------------------------------
Tanger, Maroc du 15 au 17 Novembre 2005
221
couches est pris en compte dans le Type 81 développé par EDF dans l’environnement Ca-Sis.
Figure 3 : représentation du bilan du nœud i dans le modèle multicouche du Type 60 de TRNSYS
Comparaison des résultats issus du modèle de ballon installé dans Ca-Sis et du Type 60 de TRNSYS
Pour la comparaison des 2 modèles multicouches, l’un prenant en c ompte la convection et l’aut re pas, un exemple simple est u tilisé sans faire intervenir d’autre modèle extérieur comme celui du ca pteur. Cela risquerait d’introduire d’autres différences dans les résultats. Cet exemple utilise un ballon cylindrique de 1000 litres, de 2 m de hauteur, de coefficient de
transfert thermique égal à 1.5 W/m².K, sans appoi nt électrique ou gaz ni échangeur interne. Le nombre de couches considéré est é gal à 10. Un appoint solaire permet, à cert ains moments de l a journée de faire rentrer de l’eau dans le ballon à 40°C (de 10 h à 14 h avec un débit de 500 l/h) : l’entrée se fait à une hauteur de 1.7 m (couche 9) et le retour a u capteur à une hauteur de 0.3 m (couche 2). Un profil de p uisage simple d’un débit de 100 l/h, eau froide entrant à 10 °C, a été généré : de 12 h à 13 h (pendant la circulation du circuit solaire) et de 18 h à 19 h, quand le circuit solaire est arrêté). La te mpérature initiale du ballon a été choisie égale à 30°C. L’ea u froide pénètre par le bas (couche 1) et l ’eau chaude ressort par le haut (couche 10).
Les résultats comparatifs sont donnés en températures pour les 10 couc hes. Les courbes de température montrent une très bonne concordance au cours des 24h de simulation.
Certains paramètres ne se retrouvent pas exactement dans les deux modes de simulation, et c’est ce qui peut expliquer les lég ères différences : il est défini un coefficient de convection haut et bas dans Ca-sis que l’on ne trouve pas dans le type 60 de TRNSYS qui prend en compte la co nductivité de l’eau et un paramètre de conductivité additionnelle pris par défaut (ce que ne fait pas le modèle de Ca-Sis).
T bas
10
15
20
25
30
35
0 6 12 18 24
heure
°C CASIS
TRNSYS
Couche 2
20
25
30
35
40
45
0 6 12 18 24
heure
°C
CASISTRNSYS
Couche 3
20
25
30
35
40
45
0 6 12 18 24
heure
°C
CASISTRNSYS
Couche 5
20
25
30
35
40
45
0 6 12 18 24
heure
°C
CASISTRNSYS

12èmes Journées Internationales de Thermique ------------------------------------------------------------------------------------------------------------------------------------------------
Tanger, Maroc du 15 au 17 Novembre 2005
222
Couche 9
20
25
30
35
40
45
0 6 12 18 24heure
°C
CASISTRNSYS
T puisage
20
25
30
35
40
45
0 6 12 18 24
heure
°C
CASIS
TRNSYS
Figure 4 : évolution de la température en différentes couches du ballon au cours d’une journée. Comparaison des
Types 81(CASIS) et 60 (TRNSYS) CONCLUSION
Il existe une grande variété de modèles de ballons plus ou moins sophistiqués. Beaucoup d’entre eux ont été développés dans l’environnement TRNSYS et se différentient par les b ilans énergétiques mais au ssi le nombre plus ou moins grand de ports entrée/sortie, de nombre de c ouches maximales ou l e nombre de systèmes auxiliaires d’appoints.
La stratification thermique à l’in térieur du ballon conduit à des résultats sur la quantité d’énergie soutirée plus ou moins grande et donc à une e fficacité plus ou moins grande du ballon.
Des études comparatives basées sur des expérimentations sont encore nécessaires pour adapter au mieux les coefficients de convection haut et bas de chaque couche afin d’obtenir la meilleure description possible des échanges dans le modèle implémenté dans Ca-Sis par exemple.
Références bibliographiques
[1] JOHANNES. K, FRAISSE. G, ACHARD. G, RUSAOUËN. G, « Etude de la stratification thermique dans un ballon d’eau chaude sanitaire », Publication IBPSA Toulouse, (2004).
[2] KLEIN S. A. et al.: « TRNSYS, Version 16 User manual». Solar Energy Laboratory, University of Wisconsin. (1996).
[3]TABARY L., DABRETEAU V. « CA-SIS Software : a design tool for t hermal studies with a grad ual access», IBPSA 1997
[4] KENJO, L. and al. « Etude du comportement thermique d’un cha uffe-eau solaire a faib le débit ». Thèse DOC, Un iversité de Nice-So phia Antipolis. (2003).

Diurnal and nocturnal temperatures modellingof the site of Tlemcen
Physical and Chemical News (PCN), Volume 27, (2006), pp 59-64.
PAPER II


January 2006
Phys. Chem. News 27 (2006) 59-64 PCN
59
DIURNAL AND NOCTURNAL TEMPERATURES MODELLING OF THE SITE OF TLEMCEN
MODELISATION DES TEMPERATURES DIURNES ET NOCTURNES DU SITE DE TLEMCEN
S. Amara*, C. Zidani, D. Benaissa, F. Benyarou, B. Benyoucef Unité de Recherche Matériaux & Energies Renouvelables (URMER), B.P. 119 Tlemcen 13000 Algérie
* Corresponding author. E-mail: [email protected] & [email protected] Received : 10 April 2004; revised version accepted : 14 June 2005
Abstract The hourly and monthly middle temperature knowledge is necessary for an adequate dimensionnement of the thermal photo generators, of the agricultural greenhouses and for the air-conditioning of the site. Our work consists in a modelling of these temperatures on the site of TLEMCE N. The treatment of the gradual measure results on several years permitted us the diurnal and nocturnal middle temperature modelling and their variations during the day of the year. This study permits us an optimization of energy captured and the reduction of losses for the storage of e nergy. This study i s necessary for a dimensionnement adapted to cost reduces the generator. The technique of the fittage used permitted us the modelling of these temperatures and the dimensionnement of a generator photo thermal.
Keywords : Temperature; Photo thermique generator; Modelisation; optimisation; Thermique energy; Energy storage; Dimensionnement.
Résumé La connaissance des températ ures moyennes horaires et mensuelles est nécessaire pour un dimensionnement adéquat des générateurs photo thermiques, des serres agricoles et pour la climatisation d’un site. Notre travail consi ste en une modélisation de ces températures sur le site de TLEMCEN. Le traitement des résultats de mesure échelonnés sur plusieurs années nous a pe rmis la m odélisation des températures moyennes diurnes et nocturnes et leurs variations au cours de la journée de l’année. Cette étude nous permet une optimisation d’énergie captée et la réduction des pertes pour le stockage d’énergie. Cette étude est nécessaire pour un dimensionnement adapté à coût réduit du générateur. La technique du fittage utilisée nous a permis la modélisation de ces températures et le dimensionnement d’un générateur photo thermique.
Mots Clés : Température; Générateur photo therm ique; Modélisation; Optimisation; Energie thermiques; Stockage d’ énergies; Dimensionnement.
1. Introduction Le climat est un état original de l’atm osphère
pour la lati tude de l’endroit considéré. Les données météorologiques permettent de préciser par une étude des moyennes de grandeurs mesurées sur de longues périodes et en des lieux différents, l’importance de ces grandeurs sur les prévisions à envisagées.[1] Un site est caractérisé gé néralement par le s variations de température et d’intensité du rayonnement solaire incident. Ces paramètres sont enregistrés chaque jour en continu ou à in tervalles fixes. Ils co nstituent une banque de données qui permettent d’entreprendre des études statistiques. Pour être capable de c ontrôler la tem pérature de l'air et l 'humidité relative est encore un problème pour les processus du séchage conventionnels,
chauffage des habitations et pour dimensionnement adéquat des capteurs solaires. Dans cet article nous nous limitons aux températures ambiantes et à l’inte nsité du rayonnement.[2] La connaissance de l’intensité du rayonnement incident et des températures d’un site, permettent un bon dimensionnement du générateur photo thermique et du système de stockage d’énergie.[3] 2. Energie et température instantanée
Toute utilisation d’énergie solaire présente par ailleurs une dépendance vis à vis des caractéristiques du climat local et régional [4]. La figure (1) représente les résultats d’un programme de simulation permettant le calcul de l ’énergie

S. Amara et al, Phys. Chem. News 27 (2006) 59-64
60
instantané maximale aux équinoxes et aux solstices.
5 10 15 200
200
400
600
800
1000
HEURE (TSV)
PU
ISS
AN
CE
(K
ca
l/m
²)
EP
0 5 10 15 200
200
400
600
800
1000
HEURE (TSV)
PU
ISA
NC
E (
Kc
al/
m²)
SE
5 10 15 200
200
400
600
800
1000
HEURE (TSV)
PU
ISS
AN
CE
(K
ca
l/m
²)
EA
5 10 15 200
200
400
600
800
HEURE (TSV)
PU
ISS
AN
CE
(K
ca
l/m
²)
SH
Figure 1 : Energie thermique instantanée aux équinoxes et aux
solstices (Site de TLEMCEN – Ciel Bleu clair).
Afin de modéliser les variations de température du site de TLEMCEN, nous présentons le résultat d’une méthodologie de traitement des données de l’office national de la météo (résultats de tro is années de mesure 1999-2000-2001) [5]. Les variations de tem pérature que nous présentons excluent les phénomènes anormaux comme les incendies temporelles ou les anomalies
climatiques. A travers les courbes de variations de températures ambiantes diurnes et nocturnes, nous constatons qu’en général le site d e TLEMCEN rencontre une variation de température de jour très importante avant midi TSV et une décroissance légère après le midi TSV. Cepen dant de g randes variations sont à si gnalées durant les périodes de printemps et d’automne.
4 6 8 10 12 14 16 18 20 226
8
10
12
14
16
18
20
22
24
26
28
30
32
Tem
péra
ture
en
degr
ès c
elsi
us
Heure
Figure 2 : Température instantanée diurne aux équinoxes et aux solstices
au voisinage de midi TL.
SE
SH
EPEA

S. Amara et al, Phys. Chem. News 27 (2006) 59-64
61
Les variations des températures ambiantes diurnes et nocturnes sont très importantes sur le site de TLEMCEN durant les périodes de pri ntemps et
d’été. Elles ren contrent une lég ère stagnation durant la période hivernale.
Le site de Tlemcen est caractérisé par une montée de température diurnes le matin et par u ne décroissance de cette dernière l’après m idi. Alors qu’une décroissance continue est enregistrée pour les températures nocturnes. 3. Energie et température journalière
La figure (4) représente la variation de l’énergie thermique journalière incidente sur un capteur qui suit le so leil durant toute l’année. L’optimisation d’énergie photo therm ique captée et la réduction des pertes de st ockage, nécessite la connaissance
des températures ambiantes et des températures au sol. A travers les résultats de mesure L’écart entre les températures maximales et m inimales du site de Tlemcen ne dépasse pas 10°C quelque soit la saison de l’année. La connaissance des températures ambiantes moyennes journalières joue un rôle très important pour l’étude de l ’isolation des capt eurs photo thermiques. Ces températures permettent une estimation des pertes dans le stockage de l’énergie thermique [6].
0 50 100 150 200 250 300 350 4004000
5000
6000
7000
8000
9000
10000
Figure 4 : Energie thermique journalière maximale reçue par un capteur qui suit le soleil. Figure 5 : Variation des Températures journalières (Max et Min)
ambiantes et au sol
TAmin
TSmax
TSmin
TAmax
-50 0 50 100 150 200 250 300 350 400
-5
0
5
10
15
20
25
30
35
40
45
50
tem
péra
ture
s
N°du jour
-6 -4 -2 0 2 4 6 86
8
10
12
14
16
18
20
22
24
Tem
péra
ture
en
degr
ès C
ELSI
US
heures
SE
EA
EP
SH
Figure 3 : Température instantanée nocturnes aux équinoxes et aux solstices au voisinage de minuit TL.

S. Amara et al, Phys. Chem. News 27 (2006) 59-64
62
4. Température mensuelle Les températures mensuelles (maximales et minimales) d’un site permettent un
dimensionnement économique des systèmes photo thermiques [7].
Températures ambiantes Températures au sol
Mois Maximales minimales Maximales Minimales
Janvier 17.26 4.66 23.03 0.9
Février 19.2 5.57 25.88 0.98
Mars 20.97 8.38 28 4.72
Avril 21.78 10.33 31.28 7.04
Mai 24.88 12.92 33.65 9.27
Juin 29 17 38.6 14.76
Juillet 31.89 19.09 42.24 16.29
Août 30.66 20.04 39.92 17.02
Septembre 29.26 17.44 37.84 14.69
Octobre 25.02 13.81 31.17 10.56
Novembre 21.01 10.71 25.82 7
Décembre 19.03 6.94 24.33 3.97
La connaissance des tem pératures moyennes mensuelles (maximales et minim ales) ambiantes et au sol permettent le dimensionnement adapté d’un générateur photo thermique. On constate que quelque soit la p ériode de l’année les te mpératures au sol m aximales sont supérieures aux températures ambiantes et inversement pour les températures minimales -Pour les températures ambiantes l’écart maximal de température (13.63°C ) est au mois de Février,
tandis que l’écart minimal (10.3°C ) est au mois de Novembre. - Pour les te mpératures au sol l’écart maximal de température (25.95°C ) est au mois de Juillet, tandis que l’écart minimal (18.82°C) est au mois de Novembre. 5. Modélisation
La modélisation des températures moyennes mensuelles (maximales et minimales) ambiantes et
Tableau 1 : Variation mensuelle des températures maximales et minimales du site de Tlemcen.
Figure 6 : Variation des températures journalières moyennes ambiantes Diurnes et Nocturnes
-50 0 50 100 150 200 250 300 350 400
5
10
15
20
25
30
35
tem
péra
ture
moy
enne
N° du jour
TMDj
TMNj

S. Amara et al, Phys. Chem. News 27 (2006) 59-64
63
0 2 4 6 8 10 12
0
5
10
15
20
25
30
35
40
45
tem
péra
ture
s m
oyen
nes
moisFigure 7 : Variation des températures moyennes ambiantes et au sol maximales et minimales.
TSmax
TAmin
TSmin
TAmax
au sol du site de Tl emcen ont donné des allures Lorentzienne de la forme :
� � 2204
2CBM
CATT��
�� � (1)
avec
A,B,C sont des constantes caractéristiques du site. T0 constante caractérisant la grandeur utilisée M Variable représentant le mois de l’année T Variable représentant la grandeur utilisée
Grandeurs T0 A B C
TSmax 17.62653 250.71388 7.11533 6.57942
TSmin -5.03868 262.28394 7.55456 7.47958
TAmax 14.06422 175.40342 7.41058 6.22901
TAmin -0.37205 234.65486 7.55346 7.32958
Le traitement des donnés expérimentales des températures moyennes mensuelles diurnes et nocturnes du site de Tlemcen :
* Pour les températures moyennes mensuelles diurnes :
0 2 4 6 8 10 1212
14
16
18
20
22
24
26
28
TMD Expérimentale TMD Fittage Gaussien TMD Fittage Lorentzian
Tem
péra
ture
s m
oyen
nes
diur
nes
(°C
)
Mois
Tableau 2 : Constantes caractéristiques du site de Tlemcen.

S. Amara et al, Phys. Chem. News 27 (2006) 59-64
64
Modèle Lorentzien
� � 81.3845.7446.8018.9 2��
��M
TMD (2)
Modèle Gaussien
04.11)45.7( 2
exp705.1373.13��
��M
TMD (3)
� Pour les températures moyennes
mensuelles nocturnes :
Figure 9 : Variation des températures moyennes mensuelles nocturnes à TLEMCEN.
Modèle Laurentzien
� � 27.5054.7451.93738.3 2��
��M
TMN (4)
Modèle Gaussien
2.12)54.7( 2
exp22.1456.7��
��M
TMN (5) La modélisation des températures moyennes mensuelles diurnes et nocturnes du site de Tlemcen a do nné une allure Lorentzienne plus précise en période d’été et une allure Gaussienne précise en période hivernale: La connaissance des températures mensuelles moyennes diurnes et nocturnes sont nécessaires pour un dimensionnement adéquat et pour les prévision de stockage. 6. Conclusion
La modélisation des grandeurs caractéristiques d’un site est nécessaire pour un dimensionnement économique du générateur photo thermique. Notre contribution est d’introduire les températures d’un site dans l e dimensionnement adéquat de ces générateurs. La méthode de modélisation appliqué dans ce trav ail est les fittag es Laurentzien et gaussien. La t echnique de fittage basée sur les valeurs mensuelles moyennes de chaque année, et des moyennes de trois années a donné des résultats prometteurs quant aux applications thermiques. L’importance d’introduire les te mpératures d’un
site dans la modélisation est nécessaire pour les prévisions à envisagées(climatisation, stockage...).
Références [1] C. Ch auliaguet, P. Baratcabal, J. P. Batellier, « Energie solaire dans le bâtiment » (1978). [2] R. RaChmat, K. Horibe, « Solar heat collection characteristics of a fiber reinforced plastic drying house », transactions of the ASAE , ISSN 0001-2351 , Coden Taaeaj (1999), USA , Vol.42 , No.1, PP. 149-157, Bibl. 26 ref. [3] R. Bern ard, G. Menguy , M. Sch wartz, « Le rayonnement solaire Conversion thermique et applications » (1980). [4] M. Belaribi, «CAO d’un système de réfrigération solaire», Thèse de magister, Université de Tlemcen (2000). [5] Recueil des données météorologiques et radio métriques « Office National de la Météorologie », 1998-2000. [6] F. Ben yarou, « Conversion d’énergies», cours graduation, 2001-2002, Université de Tlemcen. [7]B. BENYOUCEF, « Les énergies Renouvelables », cours Magister, 2001-2002, Université de TLEMCEN. [8] http://sohowww.nascom.nasa.gov/explore/faq/basics.html [9] http://www.scio.free.fr/comment/micro-ondes.php3.
0 2 4 6 8 10 126
8
10
12
14
16
18
20
22
T M N E xp é rim e n ta le T M N F itta g e G a u ss ie n T M N F itta g e L o re n tz ia n
Tem
péra
ture
s m
oyen
nes
noct
urne
s (°
C)
M o is

Etude d’un système de production et stockage d’eau chaude sanitaire pour le site de Tlemcen
Comples Heliothechnique, 36B, (2007), pp 3-7,
PAPER III


03
ETUDE D’UN SYSTEME DE PRODUCTION ET STOCKAGED’EAU CHAUDE SANITAIRE POUR LE SITE DE TLEMCEN
S. AMARA(1) , J. VIRGONE(2) , B. BENYOUCEF(3)
(1) Unité de Recherche en Energies Renouvelables en Milieu Saharien (URER/MS)(2) Centre Thermique de Lyon (CETHIL)
(3) Unité de Recherche Matériaux et Energies Renouvelables (URMER)Mail : [email protected]
RésuméLa fonction thermique du bâtiment est l’une desfonctions importantes de celui -ci : il faut qu’ausein du bâtiment soit entretenue une ambiance quisatisfasse l’homme du point de vue confortthermique. Que ce soit pour des besoins declimatisation en pays chauds ou saisons chaudesou pour des besoins de chauffage en pays froidsou saisons froides. La préparation de l ’eauchaude sanitaire constitue une des applicationsprivilégiées de l’énergie solaire dans le bâtimentpour plusieurs raisons. La première tient à lanature du besoin. Les températures sont peuélevées : eau froide à température proche del’ambiance ; et l’eau chaude entre 50 et 60°C.Une caractéristique intéressante de lapréparation de l’eau sanitaire est la faiblevariation des besoins au court de l’année,contrairement au chauffage.
Mots clés – Conception, simulation, énergiessolaires, concentrateur, chauffage de l’eausanitaire.
IntroductionL’idée de transporter l’énergie solaire concentréeà commencée en 1980 par un groupe dechercheurs français [1]. Actuellement latechnologie des fibres optiques disponibles pourcette transmission offre une haute qualité deproduction avec un gros diamètre du cœur de cesfibres [2].Dans ce travail, nous utilisons des conducteurs delumière qui ont l’avantage de faibles atténuations,avoir des pertes minimes dans la conversion [3].Le transport de chaleur sous forme d’ondeélectromagnétique s’effectue avec une réduction
considérable de pertes que le transport de chaleuravec fluide caloporteur.Afin de réduire les pertes avant de chaleur d’uncapteur photo thermique et d’augmenterconsidérablement la températu re à l’intérieur duballon.Afin de réduire les pertes thermiques de fluidecaloporteur d’un capteur photo thermique.Afin d’utiliser la conversion photo thermique àun endroit bien précis.Notre travail consiste en une nouvelle conceptiond’un système de production et stockage d’eauchaude sanitaire à pertes réduite et à rendementélevé.Le système est parfaitement isolé du milieuextérieur et alimenté par fibre optique en sonsommet, nous a donné des résultats prometteusespar rapport au capteur plan ph oto thermiqueclassique.L’énergie thermique disponible à partir d’un telcapteur solaire est équivalente à l’énergieincidente diminuée des pertes. Les pertesd’énergie thermique sont dues à la réflexion, laréémission du rayonnement, la convection et laconduction.
REVUE INTERNATIONALE D'HELIOTECHNIQUE ENERGIE-ENVIRONNEMENT- 36B (2007) 03-07 http: \\www.comples.orgICRESD_07

04
Nous constatons d’après la figure (1) que pour unflux de 1000W/m2, au niveau de la vitre presque14% de ce rayonnement qui est perdu parréflexion des faces avant et arrière de la vitre. Etarrivant jusqu’à l’absorbeur presque 21% q ui estperdu et enfin la puissance récupérée est del’ordre de 60% c'est-à-dire que 40% durayonnement global incident qui est perdu.
La question qu’on se pose est : peut on éliminerces pertes ? mais malheureusement la réponse estnon mais nous pouvons les réduires dont le but de
cette etude est la conception d’un nouveausystème de capteur photo thermique à perteréduite et à rendement élevé (Figure2),Il est constitué :
* D’un concentrateur qui est un miroirparabolique qui a les caractéristiquesgéométriques suivantes : R=366mm ; ladistance focale f=R/2.
* Une fibre optique QSF 1000 avec unelongueur de l = 5m composée d’un cœur dequartz et de silice possède un cœur de 1 mmde diamètre, fabriqué en Silice de synthèse,d’atténuation moyenne � égale à 2.10-2 dB/msur l’ensemble du spectre solaire, uneouverture numérique de �F = 20°,
* Un ballon de stockage cylindrique avec unehauteur de 1.5m et d’un volume de 150litres,constitué de quatre pièces (Figure3).

05
Coupe verticale,Vue d’en face
Coupe verticale,Vue de profil
Coupe horizontale,Vue d’en haut
Estimation d’énergie transportée par fibreoptique
L’énergie solaire est concentrée sur une tâche dedimension égale à la surface d’entrée de la fibre[4], [5].Pour l’estimation de l’énergie thermique à l’entreet à la sortie de la fibre solaire, nous avonsmodélisé le rayonnement solaire puis nous avonsmis au point un programme de simulation de lacourse du soleil.
1. L’énergie à l’entrée de la fibre
La variation de l’énergie journalière à l’entrée dela fibre optique en fonction des différentesouvertures du concentrateur est r eprésentée par lafigure 3 :
La figure 3 montre l’influence de l’ouverturedu concentrateur sur l’estimation des énergiesà l’entrée de la fibre optique. Pour une bonneadaptation du concentrateur, l’ouverture de cedernier doit être égale à l’ouverturenumérique de la fibre [6]. Une fibre adapté àl’ouverture du concentrateur transporte un
maximum d’énergie solaire de 44 Wh/mm2
au SE, et un minimum de 24 Wh/mm 2 au SHà Tlemcen et par ciel bleu clair.
2. L’énergie solaire de sortie de la fibreoptique
La simulation de l’énergie instantanée desortie d’une fibre solaire de 5 mètres delongueur adaptée au dispositif étudié etappliqué au site de Tlemcen pour un ciel bleuclair est représenté par la figure 4 ainsi que lacourse du soleil, et nous constatons quel’énergie de sortie après traversée d’une fibreoptique de longueur 5m, au SH ne dépassepas les 4 KWh/mm2. Elle est maximale, sa
valeur est 6 KWh/mm2 au SE.
Après avoir déterminer la quantité de chaleurtransportée par fibre optique jusqu’au ballonde stockage et sachant que toute cettedernière sera absorbé puis transmise par lasurface sélective utilisée sous forme deradiations de grandes longueurs d’onde et

06
dont la température peut atteindre les 16 7°Caux équinoxes et elle est de l’ordre de 150°C
au solstice été (Figure5).
D’après la figure (6) qui montrent le profildes températures calculées à l’intérieur duballon pour différentes couches du ballon,dans la phase dynamique (t<5h) il s’établitdans l’enveloppe une stratification thermiquedue à l’échange thermique entre la surfacesélective et le fluide du ballon. Au -delà decette phase, les températures deviennenthomogènes.
Nous avons aussi simulé le profil destempératures avec puisage de 100 litres(figure7), deux fois par jour et durant une
semaine pour le ballon de stockage dans lapartie supérieure. En effet, à travers lesrésultats, nous remarquons que la températureest de l’ordre de 62°C et des qu’elle diminuede 5°C le chauffage d’appoint commence àfaire sont effet.
ConclusionL’énergie solaire concentrée peut êtretransportée avec des conducteurs de lumière,cette technique s’avère très prometteusequant aux applications thermiques. Elledevrait permettre une utilisation de l’énergiesolaire concentrée avec des rendements depuissance qui peuvent dépasser les 50%.
Notre travail consiste à élaborer unprogramme qui permet d’estimer l’énergieincidente au fil du soleil, sur un concentrateurparabolique. L’énergie concentrée esttransférée puis transportée par une fibreoptique vers une surface sélective située àl’intérieur d’un ballon de stockage oul’échange de chaleur se fait entre la surface etle fluide du ballon.Le programme de simulation réalisédétermine la puissance de sortie d’une fibreoptique, ainsi que les températures àl’intérieure du ballon avec un puisage de 100litres deux fois par jour durant une semaine.
Ainsi, notre contribution consiste en unenouvelle conception de capteur photothermique à pertes réduites et à rendementélevé.
07
Références bibliographiques
[1] J. Robieux 1975 Patent 75-14582 (INPI),international classification F03g 7/02 ; 02KX/G02b5/10.[2] D. Kato and T. Nakamura 1976 J.Appl. Phis.40 4528.[3] Jean-Michel Cariou, « Apport de conducteursde lumière dans l’utilisation de l’énergie solaireconcentrée », Thèse de Doctorat, Université PaulSabatier de Toulouse, 1984.[4] OA. Jaramillo; Del Rio JA ; Huelsz G, « Athermal study of optical fibres transmitting
concentrated solar energy », Journal of physics.D. Applied physics; ISSN 0022-3727; CodenJpapbe 1999; Vol.32; No.9; PP.1000 -1005;Bibl.15 ref.[5] H. Yugami; M. Yano; H. Naito; G. Flamant «Concentration of fiber transmitted solar energy byCPC for solar thermal utilization », journal dephysique. IV; ISSN 1115-4339; Fra ; Da. 1999;Vol.9 ; pr3.545-pr3-549; Bibli.8 ref.[6] J.M.Chasseriaux, « Systèmes àconcentrations », document de cours, UniversitéParis 7, 1984.


Requirements energy estimate of heating & coolingfor a dwelling in the site of TLEMCEN
Revue des Energies Renouvelables, Numéro special, Mai 21-24, 2007, ICRESD_07, Tlemcen, ALGERIE,
PAPER IV

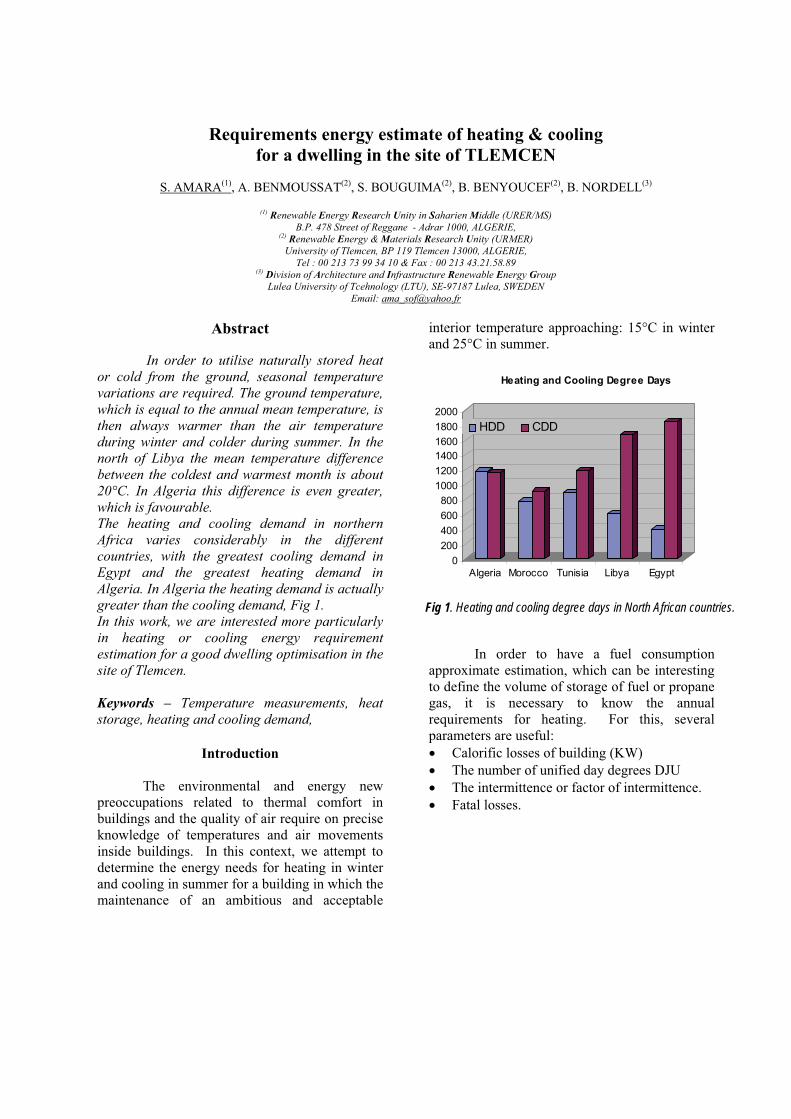
0200400600800
100012001400160018002000
Algeria Morocco Tunisia Libya Egypt
Heating and Cooling Degree Days
HDD CDD
Fig 1. Heating and cooling degree days in North African countries.
Requirements energy estimate of heating & cooling for a dwelling in the site of TLEMCEN
S. AMARA(1), A. BENMOUSSAT(2), S. BOUGUIMA(2), B. BENYOUCEF(2), B. NORDELL(3)
(1) Renewable Energy Research Unity in Saharien Middle (URER/MS)
B.P. 478 Street of Reggane - Adrar 1000, ALGERIE, (2) Renewable Energy & Materials Research Unity (URMER)
University of Tlemcen, BP 119 Tlemcen 13000, ALGERIE, Tel : 00 213 73 99 34 10 & Fax : 00 213 43.21.58.89
(3) Division of Architecture and Infrastructure Renewable Energy GroupLulea University of Tcehnology (LTU), SE-97187 Lulea, SWEDEN
Email: [email protected]
Abstract
In order to utilise naturally stored heat or cold from the ground, seasonal temperature variations are required. The ground temperature, which is equal to the annual mean temperature, is then always warmer than the air temperature during winter and colder during summer. In the north of Libya the mean temperature difference between the coldest and warmest month is about 20°C. In Algeria this difference is even greater, which is favourable. The heating and cooling demand in northern Africa varies considerably in the different countries, with the greatest cooling demand in Egypt and the greatest heating demand in Algeria. In Algeria the heating demand is actually greater than the cooling demand, Fig 1. In this work, we are interested more particularly in heating or cooling energy requirement estimation for a good dwelling optimisation in the site of Tlemcen.
Keywords – Temperature measurements, heat storage, heating and cooling demand,
Introduction
The environmental and energy new
preoccupations related to thermal comfort in
buildings and the quality of air require on precise
knowledge of temperatures and air movements
inside buildings. In this context, we attempt to
determine the energy needs for heating in winter
and cooling in summer for a building in which the
maintenance of an ambitious and acceptable
interior temperature approaching: 15°C in winter
and 25°C in summer.
In order to have a fuel consumption
approximate estimation, which can be interesting
to define the volume of storage of fuel or propane
gas, it is necessary to know the annual
requirements for heating. For this, several
parameters are useful:
� Calorific losses of building (KW)
� The number of unified day degrees DJU
� The intermittence or factor of intermittence.
� Fatal losses.

The building On the architectural plan the building is
designed in the following way (Figure2)
where the livable surface is of 165m2. It is
necessary to take here into account, on the
one hand the livable volume Vh (m3), and on
the other hand the volumic coefficient of loss
G taking account of the thickness of the walls, materials used and the number of the
openings (Table1). [1]
Lounge Hall Room 1 Room 2 Kitchen Passageway Bathroom
Lossesk S(surface) KS S kS S kS S kS S kS S kS S kS
Walls 3.5 62.1 217.3 36.4 127.4 52 182 50.2 175.7 52.9 185.15 52.4 183.4 31 108.5
Windows 5.8 6.8 39.5 11.2 64.96 4 23.2 5.9 34.22 8.7 50.46 32 185.6 4.2 24.36
Floor 4 35 140 20 80 25 100 25 100 30 120 15 60 15 60
Roofing 4 35 140 20 80 25 100 25 100 30 120 15 60 15 60
Total lossess 536.36 352.36 405.2 409.92 475.61 489 252.86
Then the total sum of losses (for �T=1°C) of
building is P = 2921.75W/°C.
Where the volumic coefficient G of loss:
)/(52.6 3 CmWVPG
h
��� (1)
After the total loss coefficient determination
as well as the volumic coefficient G of loss
and for simplifying the problem one
considers primarily the daily ambient temperature Average and the temperature on the ground such as they appear in the
readings taken by the services of national
meteorology during three years of
measurement. The knowledge of these
temperatures is necessary for an adequate
dimensioning of the thermal photo
generators, agricultural greenhouses and for
the heating and cooling of the site. In order
to determine the number of degree day of the
site of TLEMCEN, we present the results of a
processing data methodology of the national
office of the weather (three years results of
measurement).[2]
Table1 : Total losses

According to the results of measurement shown in
the figure (3), the difference between the
maximum and minimal temperatures of the site of
Tlemcen does not exceed 10°C whatever the
season of the year.
The knowledge of the daily ambient
temperatures average takes a very significant role
for the study of the insulation as well as the needs
energy calculation for the heating in winter period
or cooling in summer. [3]
TMD : The daily average temperature ambient
diurnal.
TMN : The daily average temperature ambient
nocturnal.
It is necessary to calculate the number of degree-
days during all the year for our building which is
located at Tlemcen with a volume of 448m3. The
following table presents:
Dj for heating Dj for cooling Month Ambient average
temperatures15°C 18°C 22°C 25°C
January 10.43 -141.41 -234.41
February 12.01 -83.54 -167.54
March 13.9 -50.06 -127.88
April 15.2 -24 -92.48
May 17.89 -5.24 -33.82
June 22.11 30.13 3.48
July 24.46 77.98 12.52
August 24.19 68.93 12.33
September 22.38
18.18 1.53
October 18.5 -12.91
November 15.56 -19.13 -76.31
December 12.95 -65.31 -156.54
Table 2 : Calculation of the monthly number of degrees – days (Dj)

Although it is more difficult to take into account
of the inhabitants thermal requirements in the
building, do they agree not to use certain rooms in
winter for the heating or summer for cooling?
Taking all into account, one can then evaluate:
C = 24 * G * Vh *Dj (2)
� Annual requirements in heating :
- For a temperature of comfort of 15°C, October
to May: Dj = 401.6 where C = 2815.33 KWh
-For a temperature of comfort of 18°C, November
to May: Dj = 888.98 where C = 6232.02 KWh
� Annual requirements in cooling:
- For a temperature of comfort of 22°C, june to
september : Dj = 195.22 where C = 1368.55 KWh
- For a temperature of comfort of 25°C, june to
september : Dj = 29.86 where C = 209.32 KWh
Conclusion
This project goal is to have buildings with surplus
energy balance to maintain a stable interior
temperature. The present study concentrates on
the energy needs calculation for a building
situated in Tlemcen, and which gave:
� Maximum energy requirements for heating
is about 6232.02 KWh.
� Maximum energy requirements for cooling
is about 1368.55 KWh.
In order to lead to low yearly consumptions, an
objective accessible in the shorter term is to set up
solids bases on the envelope (walls, grounds and
roofs). In particular, it will be interesting to
introduce the positive energy which fits fully in
the current context of control of energy, use of
renewable energies and sustainable development.
Bibliographical references [1] R. Bernard, G. Menguy, M. Schwartz, Le
rayonnement solaire, 2ème édition
augmenté1983
[2] S. Amara, « Optimisation d’Un Procédé
Economique de Chauffage d’une Habitation
Par Voie Solaire. Application Au Site de
TLEMCEN », Thèse de Magister, Janvier
2004
[3] Données météorologiques du site de
TLEMCEN.
[4] S. Amara et al, « Modélisation des
températures diurnes et nocturnes du site de
Tlemcen », Physical & Chemical News,
Volume 27, 59-64, 2006
[5] GERES, Le chauffage solaire dans les régions
froides, Editions du GRET, juin 1994
[6] J. F. Sacadura, Initiation aux transferts
thermiques, édition TEC&DOC, 2000
[7] X. Faure, « Enveloppe hybride des bâtiments
à hautes performances énergétiques »,
Journée Rencontre de Projet, 2005.

Experimental study of a domestic hot water storage tank thermal behaviour
Physical and Chemical News (PCN), Volume 46, (2009), pp 15-20.
Effstock2009, June 14-17 2009, Stockholm, Sweden,
PAPER V

March 2009
Phys. Chem. News 46 (2009) 15-20 PCN
15
EXPERIMENTAL STUDY OF A DOMESTIC HOT WATER STORAGE TANK THERMAL BEHAVIOUR
ETUDE EXPERIMENTALE DU COMPORTEMENT THERMIQUE D’UNE CUVE DE STOCKAGE D’EAU CHAUDE SANITAIRE
S. Amara1*, B. Benyoucef2, M. Benhamou1, H. Moungar1, A. Touzi11 Unité de Recherche en Energies Renouvelables en Milieu Saharien (URER/MS),
Adrar – B.P 478, Route de Reggane, Algérie 2 Unité de Recherche Matériaux et Energies Renouvelables (URMER),
Université de Tlemcen, BP 119 Tlemcen 13000, Algérie * Corresponding author. E-mail : [email protected]
Received: 14 January 2008; revised version accepted:28 June 2008
Abstract Many works were carried out on heat storage during the 20-30 last years, particularly on solar heat storage applications. Theoretical and experimental studies on internal behaviour storage were made and carried as well on laboratory installations as on a large scale. In order to understand the stratification phenomena, an experimental study of tank thermal behaviour of charge and discharge of domestic heat water storage is undertaken.
Keywords: Storage; Stratification; Temperature; Charge; Discharge; Thermal behaviour.
Résumé Beaucoup de travaux ont été effectués sur le stockage de chaleur pendant les 20-30 dernières années, particulièrement sur le stockage de chaleur dans des applications solaires. Des études théoriques et expérimentales sur le comportement interne du fluide lors du stockage ont été faites et réalisées aussi bien sur des installations au laboratoire qu’à grande échelle. Afin de comprendre le phénomène de stratification, une étude expérimentale du comportement thermique de charge et de décharge d’une cuve de stockage d’eau chaude sanitaire (ECS) est entreprise.
Mots clés : Stockage; Stratification; Température; Charge; Décharge; Comportement thermique.
1. Introduction Beaucoup de scientifiques ont reconnu que la stratification thermique est nécessaire pour obtenir de meilleures performances lors du stockage de chaleur dans des applications solaires. La stratification dans une cuve de stockage thermique dépend principalement du volume du réservoir, de la taille, de l'endroit, et de la conception des entrées et sorties du fluide. Il y a quatre " facteurs primaires de destratification, " qui contribuent à la perte et/ou à la dégradation de l'énergie stockée: (a) Pertes de chaleur avec l’ambiance; (b) Conduction de la chaleur de la couche chaude à la couche froide; (c) Conduction verticale dans les parois de la cuve qui avec les pertes de chaleur induit des courants convecteurs (mélange); (d) Mélange présenté pendant les cycles de charge et de décharge qui est généralement la cause principale de la destratification. L’amélioration des performances des systèmes thermodynamiques implique le plus grand degrés de stratification qui est étudiée par des mesures des champs de températures et de vitesses dans le
stockage d'eau chaude. La connaissance de la circulation d’un fluide tel que l’eau et des transferts de chaleur dans une enceinte actionnée par un système extérieur ou par écoulement naturel a fait l’objet de plusieurs études tant numériques qu’expérimentales. Des études ont été faites sur les phénomènes qui affectent le degrés de stratification thermique [1], et sur le comportement thermique d’un chauffe – eau solaire à faible débit. Les résultats expérimentaux obtenus ont permis de mettre en évidence les phénomènes thermo-hydrauliques dont le ballon est le siège pour les différentes phases de son fonctionnement (injection du fluide à plusieurs niveaux, soutirage, chauffage par l’énergie d’appoint) [2]. Bouhdjar [3] a étudié numériquement le phénomène de stratification dans une cuve de stockage thermique, afin de déterminer les performances thermiques et les configurations les plus efficaces par rapport à l’efficacité de stockage thermique. En ce qui concerne l’influence de la température d’entrée étudiée à travers l’influence

S. Amara et al, Phys. Chem. News 46 (2009) 15-20
16
du nombre de Richardson, une performance de stockage élevée est obtenue avec des températures d’entrée élevée et des températures minimales dans la cuve aussi basses que possible [4]. Une étude menée par Ouzzane [5], a permis de comprendre le phénomène de la thermo circulation à travers la distribution de la température dans le capteur ainsi que l’absence du phénomène de stratification. Dayan [6] a également optimisé les installations solaires domestiques. Son étude a montré l’influence du nombre de nœuds utilisé pour la simulation du ballon sur la couverture solaire.
Nous nous limitons dans cette étude à l’évaluation du comportement thermique d’un ballon de stockage d’eau chaude sanitaire.
2. Description du système Le système comprend l’ensemble des éléments portés sur la Fig.1. Nous avons mesuré la température de l’eau en différents points de la cuve Fig.2. Ces températures sont mesurées à l’aide de 15 thermocouples de type K reliés à l’enregistreur Fluke Hydra Series II à 20 voies. Le débit d’eau circulant dans le système est mesuré à l’aide d’un débit mètre.
Réservoir
Débit mètre
Pompe
Robinet
Clapet anti retour
CUVE
Résistance
Figure 1 : Système.
Le système est constitué de: � Un ballon de stockage d’une capacité de 150 litres, avec un coefficient de pertes UA de 2.75W/K, avec injection du fluide primaire par le bas de la cuve. � Une pompe de 550 Wmax. � Un réservoir de (60*60*45cm3) 160l. � Un débit mètre. � Deux résistances de 5KW Maximum.
Afin de bien comprendre le comportement thermique de la cuve, nous avons effectué trois expériences (représentatives du fonctionnement des ballons d’ECS) sur un ballon traditionnel correspondant aux deux scénarios suivants : � Charge du ballon grâce à un appoint électrique (Résistances) � Charge + décharge du ballon par puisage d’ECS.
(a) : Système réalisé (b) : Schéma descriptif du système

S. Amara et al, Phys. Chem. News 46 (2009) 15-20
17
Figure 2 : Schéma représentant la distribution des thermocouples au sein de la cuve.
3. Résultats expérimentaux : TEST 1 : charge du ballon avec appoint électrique
Avec une température d’entrée de 50 ± 3°C et un débit de 2.6 ± 0.1 l/Min, nous obtenons les profils de températures suivants :
0 20 40 60 80 100 12015
20
25
30
35
40
45
Temps (Minutes)
Tem
péra
ture
s (°
C)
T10 T8 T5 T6 T7 T9 T11 T12 T13 T14 T15 T16 T17 T18 T19
Figure 3 : Evolution des températures dans la cuve pour différentes positions lors de la charge.
Le premier scénario consiste à injecter le fluide par la partie inférieure du ballon. A la fin de la manipulation, la température dans la cuve est presque uniforme (45°C), (Fig.3). Nous constatons aussi que dans les Fig.4 et Fig.5, l’écart radial ne se fait pas sentir sauf pour les couches 2-3 et 4 de l’ordre de 1.7°C, qui est due à la vitesse d’écoulement du fluide entrant dans la cuve. En ce qui concerne l’écart axial (Fig.6 et Fig.7), il est de l’ordre de 1.5°C maximum quelque soit la distance
avec l’axe. Cependant, nous remarquons l’absence de stratification dans l’enceinte.
TEST 2 : Charge + décharge Température d’entrée de 40 ± 3°C Puisage de 2 fois 2.8 l/Min durant 20 minutes � Le Premier après 145Minutes � Puis un deuxième, après un repos de 10 minutes. Le débit étant de 2.8 ± 0.1 l/Min

S. Amara et al, Phys. Chem. News 46 (2009) 15-20
18
0 2 0 4 0 6 0 8 0 1 00 1 2 01 5
2 0
2 5
3 0
3 5
4 0
4 5
Tem
péra
ture
s (°
C)
T e m p s (M in u te s )
T 1 1 T 1 2 T 1 3
0 2 0 4 0 6 0 8 0 1 0 0 1 2 00 ,0
0 ,2
0 ,4
0 ,6
0 ,8
Eca
rt de
tem
péra
ture
s (°
C)
T e m p s (M in u te s )
T 1 1 -T 1 3
Couche 1
0 2 0 4 0 6 0 8 0 1 00 1 2 01 5
2 0
2 5
3 0
3 5
4 0
4 5
Tem
péra
ture
s (°
C)
T e m p s (M in u te s )
T 1 4 T 1 5 T 1 6
0 2 0 4 0 6 0 8 0 1 0 0 1 2 00 ,0
0 ,2
0 ,4
0 ,6
0 ,8
1 ,0
1 ,2
1 ,4
1 ,6
1 ,8
2 ,0
Eca
rt de
tem
péra
ture
s (°
C)
T e m p s (M in u te s )
T 1 5 -T 1 6
Couche 2
0 2 0 4 0 6 0 8 0 1 00 1 2 01 5
2 0
2 5
3 0
3 5
4 0
4 5
Tem
péra
ture
s (°
C)
T e m p s (M in u te s )
T 1 7 T 1 8 T 1 9
0 2 0 4 0 6 0 8 0 1 0 0 1 2 00 ,0
0 ,2
0 ,4
0 ,6
0 ,8
1 ,0
1 ,2
Eca
rt de
tem
péra
ture
s (°
C)
T e m p s (M in u te s )
T 1 8 -T 1 9
Couche 3
0 2 0 4 0 6 0 8 0 1 00 1 2 01 5
2 0
2 5
3 0
3 5
4 0
4 5
Tem
péra
ture
s (°
C)
T e m p s (M in u te s )
T 1 0 T 8 T 9
0 2 0 4 0 6 0 8 0 1 0 0 1 2 00 ,0
0 ,2
0 ,4
0 ,6
0 ,8
1 ,0
1 ,2
Eca
rt de
tem
péra
ture
s (°
C)
T e m p s (M in u te s )
T 1 0 -T 9
Couche 4
0 2 0 4 0 6 0 8 0 1 0 0 1 2 01 5
2 0
2 5
3 0
3 5
4 0
4 5
Tem
péra
ture
s (°
C)
T e m p s (M in u te s )
T 5 T 6 T 7
0 2 0 4 0 6 0 8 0 1 0 0 1 2 00 ,0
0 ,1
0 ,2
0 ,3
0 ,4
0 ,5
0 ,6
0 ,7
0 ,8
Ecar
t de
tem
péra
ture
s (°
C)
T e m s p (M in u te s )
T 7 -T 6
Couche 5
Figure 4 : Evolution radiale de la température dans la cuve pour différentes couches. Figure 5 : Ecart radial des températures.

S. Amara et al, Phys. Chem. News 46 (2009) 15-20
19
0 20 40 60 80 100 12015
20
25
30
35
40
45
Tem
péra
ture
s (°
C)
Temps (Minutes)
T6 T9 T13 T15 T18
0 20 40 60 80 100 12015
20
25
30
35
40
45
Tem
péra
ture
s (°
C)
Temps (Minutes)
T8 T5 T12 T14 T17
0 20 40 60 80 100 12015
20
25
30
35
40
45
50
Tem
péra
ture
s (°
C)
Temps (Minutes)
T10 T7 T11 T16 T19
0 20 40 60 80 100 1200,0
0,2
0,4
0,6
0,8
1,0
1,2
1,4
Ecar
t de
tem
péra
ture
s (°
C)
Temps (Minutes)
T6-T13
Sur l’axe
0 20 40 60 80 100 1200,0
0,2
0,4
0,6
0,8
1,0
1,2
1,4E
cart
de te
mpé
ratu
res
(°C
)
Temps (Minutes)
T5-T12
A une distance de 5cm de l’axe
0 20 40 60 80 100 1200,0
0,2
0,4
0,6
0,8
1,0
1,2
1,4
Eca
rt de
tem
péra
ture
s (°
C)
Temps (Minutes)
T7-T11
A une distance de 10cm de l’axe
Figure 6 : Evolution axiale de la température dans la cuve pour différentes couches.
Figure 7 : Ecart axial des températures.

S. Amara et al, Phys. Chem. News 46 (2009) 15-20
20
0 100 200 300 400 500
15
20
25
30
35
40
Tem
péra
ture
s (°
C)
Temps (Minutes)
T6 T9 T13 T15 T18
0 20 40 60 80 100 120 140
28
30
32
34
36
38
Tem
péra
ture
s (°
C)
Hauteur (cm)
Figure 8 : Profils des températures durant la charge Figure 9 : Evolution temporelle des températures et décharge. dans le ballon lors des deux puisages d’ECS.
Dans ce second cas, nous constatons que la température de la partie supérieure du ballon diminue de 7°C, alors que les températures des couches inférieures diminuent de 37°C à environ 28°C lors des deux puisages.
4. Conclusion Les cuves de stockages les plus couramment utilisées dans le stockage d’eau chaude sanitaire sont de forme cylindrique. Afin de mettre en évidence le comportement thermique du système, lorsque celui-ci est soumis à diverses sollicitations bien contrôlées, plusieurs essais ont été réalisés sur la distribution de températures. Cette distribution cependant est fortement affectée par le champ de vitesse dans le stockage qui se compose de convection forcée induite par l’entrée et la convection naturelle due au transport de chaleur entre l'eau et les parois. Nous avons pu observer le régime dynamique des températures pour un chauffage par appoint et lors d’un soutirage qui a montré l’effet piston induit par le remplissage du ballon. L’injection du fluide par le bas de la cuve et l’effet de convection mixte induit par la différence de température, crée un mélange à l’intérieur du ballon, d’où l’homogénéité de température sur toute la hauteur. Le phénomène de stratification n’est jamais observé.
En perspective, il sera nécessaire de tenir compte de tous ces phénomènes lors de la modélisation du ballon de stockage d’ECS.
References[1] R. Hermansson, «Short term water heat storage», Doctoral Thesis, Lulea University of Technology, (1993) [2] L. Kenjo, «Etude du comportement thermique d’un chauffe-eau solaire à faible débit», Thèse de Doctorat, Université de Nice – Sophia Antipolis, (2003), [3] A. Bouhdjar, «Phénomène de stratification dans une cuve de stockage thermique : Etude paramétrique», Thèse de Doctorat, Université Abou Bekr Belkaid – Tlemcen, (2005), [4] K. Johannes, G. Fraisse, G. Achard, G. Rusaouën, «Etude de la stratification thermique dans un ballon d’eau chaude solaire», Conférence IBPSA, Toulouse, 8-9 octobre 2004. [5] M. Ouzzane, A. Hamid, A. Zerouki, «Expérimental and theoretical studies on natural circulation solar water heating», 2nd International Symposium on Renewable Energy Sources, Cairo, (1990), [6] M. Dayan, «High performance in low-flow solar domestic hot water systems», Master Thesis, University of Wisconsin-Madison. (1997).

Concentration heating system with optical fiber supply
The 11th Int. Conference on Thermal Energy Storage; Effstock 2009 - Thermal Energy Storage for Energy Efficiency and Sustainability, 14-17 June Stockholm,
Sweden
MEDGREEN-LB 2011: 1st Conference & Exhibition Impact of Integrated Clean Energy on the Future of the Mediterranean Environment
Beirut – Lebanon, April 14th -16th 2011,Energy Procedia Journal 6 (2011) 805-814
PAPER VI


Available online at www.sciencedirect.com
Concentration Heating System with Optical Fiber Supply
S. Amara(a)* , B. Nordell(a), B. Benyoucef(b) and A. Benmoussat(b), a*
(a) Division of Architecture and Infrastructure Renewable Energy GroupLuleå University of Technology (LTU), SE-97187 Luleå, SWEDEN
(b) Unité de Recherche Matériaux et Energies Renouvelables (URMER)Université de Tlemcen, BP 119 Tlemcen, ALGERIA
Abstract
This paper reports on an experimental realization and field testing of a recently proposed solar fiber optic mini dish light concentrator connected to a hot water accumulator. The prototype dish is 150 cm in diameter. In repeated test the collected and concentrated sunlight was transported in a one millimeter diameter optical fiber to a selective surface in the storage tank. This surface absorbs the radiation which remains trapped inside as it heat exchanges with tank fluid which temperature can reach 70°C. © 2010 Published by Elsevier Ltd. Selection and/or peer-review under responsibility of [name organizer] Keywords: Conception, Simulation, Solar Energy, Optical fiber, Hot Water Accumulator;
1. Introduction
Solar energy has for many centuries been harvested by various methods. Different types of solar collectors, normally producing hot water at temperatures between 30oC to 90oC, are commonly used. Large areas of mirrors are used to concentrate the solar heat to very high temperatures in order to drive boilers for production of electricity. The other main development is solar cells (photo-voltaic) for direct production of electricity. More recent development concerns the collection and transmission of visible light through optical fibers for direct illumination [1].
* Corresponding author. Tel.: +213-43-21-5890; fax: +213-43-21-5889. E-mail address: [email protected].
MEDGREEN 2011-LB
1876–6102 © 2011 Published by Elsevier Ltd.doi:10.1016/j.egypro.2011.05.091
Energy Procedia 6 (2011) 805–814
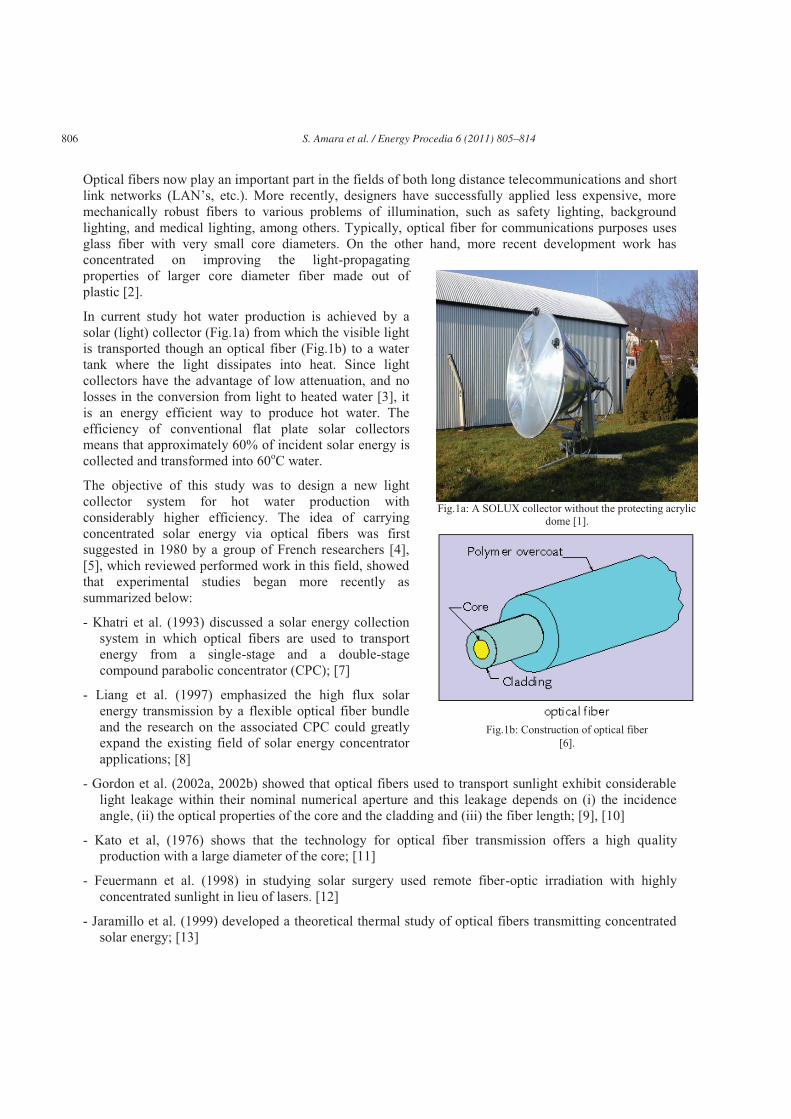
806 S. Amara et al. / Energy Procedia 6 (2011) 805–814
Optical fibers now play an important part in the fields of both long distance telecommunications and short link networks (LAN’s, etc.). More recently, designers have successfully applied less expensive, more mechanically robust fibers to various problems of illumination, such as safety lighting, background lighting, and medical lighting, among others. Typically, optical fiber for communications purposes uses glass fiber with very small core diameters. On the other hand, more recent development work has concentrated on improving the light-propagating properties of larger core diameter fiber made out of plastic [2].
In current study hot water production is achieved by a solar (light) collector (Fig.1a) from which the visible light is transported though an optical fiber (Fig.1b) to a water tank where the light dissipates into heat. Since light collectors have the advantage of low attenuation, and no losses in the conversion from light to heated water [3], it is an energy efficient way to produce hot water. The efficiency of conventional flat plate solar collectors means that approximately 60% of incident solar energy is collected and transformed into 60oC water.
The objective of this study was to design a new light collector system for hot water production with considerably higher efficiency. The idea of carrying concentrated solar energy via optical fibers was first suggested in 1980 by a group of French researchers [4], [5], which reviewed performed work in this field, showed that experimental studies began more recently as summarized below:
- Khatri et al. (1993) discussed a solar energy collection system in which optical fibers are used to transport energy from a single-stage and a double-stage compound parabolic concentrator (CPC); [7]
- Liang et al. (1997) emphasized the high flux solar energy transmission by a flexible optical fiber bundle and the research on the associated CPC could greatly expand the existing field of solar energy concentrator applications; [8]
- Gordon et al. (2002a, 2002b) showed that optical fibers used to transport sunlight exhibit considerable light leakage within their nominal numerical aperture and this leakage depends on (i) the incidence angle, (ii) the optical properties of the core and the cladding and (iii) the fiber length; [9], [10]
- Kato et al, (1976) shows that the technology for optical fiber transmission offers a high quality production with a large diameter of the core; [11]
- Feuermann et al. (1998) in studying solar surgery used remote fiber-optic irradiation with highly concentrated sunlight in lieu of lasers. [12]
- Jaramillo et al. (1999) developed a theoretical thermal study of optical fibers transmitting concentrated solar energy; [13]
Fig.1a: A SOLUX collector without the protecting acrylic
dome [1].
Fig.1b: Construction of optical fiber [6].

S. Amara et al. / Energy Procedia 6 (2011) 805–814 807
- Kribus et al. (2000) presented a study on the potential use of optical fibers for solar thermal power generation. The main performance characteristics (numerical aperture and attenuation) and typical costs of currently available fibers were discussed. [14]
2. Prototype concentrator design
The effective incoming radiation to the aperture plane is the beam radiation. An incident beam of solar radiation is a cone with an angular width of 0.53° [15]. The focal length is a determining factor in image size, and the aperture is the determining factor in total energy. It is assumed that the beam radiation is normal to the aperture and the reflection is specular and perfect. Each optical fiber has a pure transparent inner core and a thin transparent outer cladding. The total internal reflection allows us to guide the sunlight through the fiber. The fiber core has an index of refraction n1, which is greater than that of the cladding n2. The ratio of the core index and cladding index determines the acceptance/admission angle of radiation �max at which total internal reflection occurs:
222
21max )(sin nnNA ��� � (1)
Here, NA is the numerical aperture. On the other hand, the energy rate Qp hitting a flat receiver of a paraboloidal concentrator, where the optical fiber inlet is placed, is given by
bmsrp GfQ ��� )sin(sin 222�� (2)
Where f is the focal length, �m is the reflectance of the surface, r� is the rim angle of the paraboloidal
dish, s� is the shading angle because of the receptor size and Gb is the solar beam irradiance [16]. It is
important to mention that the rim angle r� should be equal to or smaller than the optical fiber admission angle.
In optimum conditions, to ensure that the whole radiation gets into the fiber, the maximum rim angle (Fig.2) of the paraboloidal dish must be
max�� �r (3)
This corresponds to the maximum admission angle of the optical fiber. The focal length f and the aperture diameter Da of the paraboloidal dish are related by
)2/tan(41
Df
ra �� (4)
Fig. 2: Concentration of sunlight by a parabolic dish of focal length f and rim angle r�
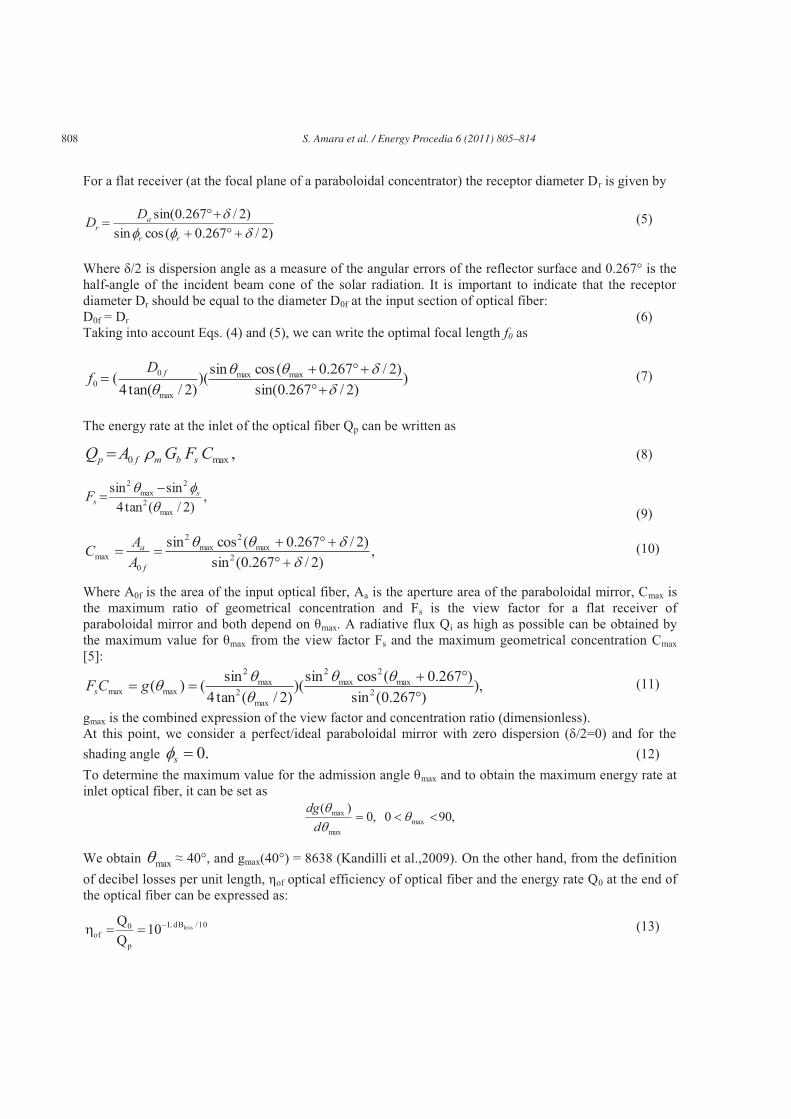
808 S. Amara et al. / Energy Procedia 6 (2011) 805–814
For a flat receiver (at the focal plane of a paraboloidal concentrator) the receptor diameter Dr is given by
)2/267.0(cossin)2/267.0sin(��
���
���
rr
ar
DD (5)
Where �/2 is dispersion angle as a measure of the angular errors of the reflector surface and 0.267° is the half-angle of the incident beam cone of the solar radiation. It is important to indicate that the receptor diameter Dr should be equal to the diameter D0f at the input section of optical fiber: D0f = Dr (6) Taking into account Eqs. (4) and (5), we can write the optimal focal length f0 as
))2/267.0sin(
)2/267.0(cossin)()2/tan(4
( maxmax
max
00
��
� ��
����
fDf (7)
The energy rate at the inlet of the optical fiber Qp can be written as
,max0 CFGAQ sbmfp �� (8)
,)2/(tan4
sinsinmax
2
2max
2
�
�� ssF ��
(9)
,)2/267.0(sin
)2/267.0(cossin2
max2
max2
0max
��
��
�����
f
a
AAC (10)
Where A0f is the area of the input optical fiber, Aa is the aperture area of the paraboloidal mirror, Cmax is the maximum ratio of geometrical concentration and Fs is the view factor for a flat receiver of paraboloidal mirror and both depend on �max. A radiative flux Qi as high as possible can be obtained by the maximum value for �max from the view factor Fs and the maximum geometrical concentration Cmax [5]:
),)267.0(sin
)267.0(cossin)()2/(tan4
sin()( 2max
2max
2
max2
max2
maxmax�
����
��
�
��gCFs (11)
gmax is the combined expression of the view factor and concentration ratio (dimensionless). At this point, we consider a perfect/ideal paraboloidal mirror with zero dispersion (�/2=0) and for the shading angle .0�s� (12) To determine the maximum value for the admission angle �max and to obtain the maximum energy rate at inlet optical fiber, it can be set as
,900,0)(
maxmax
max � �
�
�
ddg
We obtain max� � 40°, and gmax(40°) = 8638 (Kandilli et al.,2009). On the other hand, from the definition of decibel losses per unit length, �of optical efficiency of optical fiber and the energy rate Q0 at the end of the optical fiber can be expressed as:
10/dBL
p
0of
loss10QQ �
��� (13)

S. Amara et al. / Energy Procedia 6 (2011) 805–814 809
Where L is optical fiber length and dBloss is the optical fiber attenuation. The optical efficiency of the collector system for the optimum value can be given as
)(10 max10/
��� sdBL
mopt Floss�� (14)
Where Fs is the view factor. Overall system efficiency can be expressed as
bas GA
Q0�� (15)
Maximum and minimum size of the image on the focal point given firstly by Gordon et al. was reconstructed by modifying the equations with dispersion angle. The diameter dmin of the approximately uniform-flux core region of the focal spot is
)2/267.0sin()2/tan(4
12min �
����
�
��
��
raDd (16)
The focal spot diameter dmax that accepts essentially all reflected rays is:
))2/tan(
1(1)2/(tan
12
)2/267.0sin()2/(tan
11
2
2
2
max
rr
raD
d
��
�
��
�
��
��
����
�
��
��
�
(17)
When designing for maximum flux concentration from the dish, the diameter of the optical fiber should be selected as dmin and for a maximum efficiency design the fiber diameter will be closer to dmax. Optical fibers with large numerical aperture, large core diameter and small attenuation should be used for effective transmission of concentrated solar energy.
3. Outline of Studied system
The studied light collector system for hot water production, which is outlined in Fig.3, contains:
� Light concentrator represented by a parabolic mirror that has the following geometrical characteristics: Diameter (D) = 1.5 m.
� Optical fiber SPCH 1000/1035/1400Z from Fiberguide company with: o Length = 2 m, o Silica core with a diameter of 1 mm, o Average attenuation � = 6.2*10-3 dB/m on all solar spectrum, o Numerical aperture �f=20°.
� Cylindrical storage tank composed with: o Height = 1.5m , o Volume = 0,15 m3
,

810 S. Amara et al. / Energy Procedia 6 (2011) 805–814
Table1: Parameters of parabolic dish
Parameters Parameters Da (m) 1.5 Cmax 1858 Dr (m) 0.035 NA 0.4 f (m) 0.88 gmax 8309 f0(m) 0.9 dmin (m) 0.020 �r (°) 46 dmax (m) 0.034 �s (°) 0 �m 0.85
�max (°) 45 �of (%) 99.7 �/2 0.4 �o (%) 61.7
dBloss (dB/m) 6.2*10-3 �s (%) 61 L (m) 2
Table 1 presents measured and calculated parameters of paraboloidal dish. The optical fiber used in the present study is the type SPCH 1000/1035/1400Z from Fiberguide Company. The length of optical fiber is 3m and the diameter is 0.001m. The maximum admission angle of optical fiber was determined by Eq. (1) and the rim angle of the dish by Eq. (4). The attenuation of the optical fiber is indicated as 6.2*10-
3dB/m by the manufacturer data. The ideal transmission efficiency of the optical fiber was found to be 99.7%. For maximum concentration ratio, the rim angle was used in Eq. (10) and was found to be 1858. In this case and using �max in Eq. (9) the view factor Fs was found to be 0.728. Consequently, optical efficiency of the whole system was calculated as 61.7% in optimum condition. Overall system efficiency was found to be 61% according to Eq. (15).
The size of the image has uniform flux as given by dmin. As indicated in Table 1, dmin was calculated as 2.0 cm according to Eq. (16). If the aim is to receive all flux concentrated on the focal point, it should be considered maximum image size. For the existing system, dmax was calculated as 3.4 cm by considering dispersion effects according to the Eq. (17).
The cylindrical storage tank is composed of four parts as shown in Fig.4.
� Part 1 : External wall of the tank made of galvanized steel(H=1.50m; D=0.60m) � Part 2 : Thermal insulating foam with a height (H=1.55m; D=0.65m) � Part 3 : Internal wall of tank made of galvanized steel (H=1.50m; D=0.50m) � Part 4 : Absorber of galvanized steel with (H=0.50m; D=0.46m)
Fig.3: Light collector for hot water production and storage
Inlet cold water
Optical fiber
Absorber
Air for heat circulation
Outlet hot water
Light Concentrator

S. Amara et al. / Energy Procedia 6 (2011) 805–814 811
4. Experimental study of the prototype After designing and assembling the two modules (concentrator + storage tank) (Fig.5), we undertook an experimental study.
Practical considerations militate against large and small dish rim angles. At small rim angles, relatively high efficiency can be realized at peak concentration; but for a given fiber size, smaller diameter dishes must be used. Dish focal length is large relative to the diameter, which creates a practical problem in terms of module depth.
To estimate realistic system performance, we reduce the theoretical limits by the following factors:
1. An absorptive loss in the dish mirror of 5%; 2. Fresnel reflective losses at the module glazing (3% with an AL coating); 3. Fresnel reflective losses at the fiber ends (a total of 5% with AL coatings); 4. Ray rejection in the secondary concentrator (in the range of 1 to 4% depending on the dish rim angle, and about 2% at � =45°) [17];
Fig.5: Photos of the designed system and sunlight in the optical fiber outlet
Part 1 Part 2 Part 3 Part 4
Vertical cut, Front sight
Vertical cut, Profile sight
Horizontal cut, Top sight
Fig.4: Description of how the cylindrical tank is assembled.

812 S. Amara et al. / Energy Procedia 6 (2011) 805–814
5. Absorption in a remote second stage of about 2 to 4%, depending on � (absorptive losses in a dielectric proximate second stage are negligible) (Welford and Winston, 1989)[17];
5. Results and discussion
Adrar city is located in south-west of Algeria, at 1600 km from Algiers capital, with a latitude of 27,88°, a longitude of -0.88° and an altitude of 270 m. It is characterized by particular climate conditions, i.e. hot and dry summers, cold and rigorous winters.
Any use of solar radiations must take into account the local and regional climatic conditions. It is widely known that all the observed atmospheric processes are the consequences of the received solar radiation. Thus, the measurement of the solar radiation presents special interest for the environmental researchers [18].
As shown in Fig.6, the great increase for whole radiations is located between February and March; and the maximum is obtained in July, with a slight stability for the global collector slope between March and October.
Hourly global irradiance data of 2004 obtained meteorology stations were used to put forward the hourly normal beam radiation reaching the aperture plane of the paraboloidal dish. Global irradiance data were separated to beam and diffuse component by using the Clear Sky Model [Meteonorm]. The normal beam radiation calculated hourly was used to evaluate the monthly average hourly output power obtained from the paraboloidal dishes.
As shown in Fig.5, the great increase for whole radiations is located between February and March; and the maximum is obtained in July, with a slight stability for the global collector slope between March and October. These data were presented to estimate the output power of the system. And taking into account all the factors that reduce the system performance, we can determine with Eq.(8) and Eq.(13) the annual mean of the output power from optical fiber.
After the determination of the output power quantity transported by the optical fiber to the storage tank, where it is absorbed then transmitted by the selective surface, the temperature in Fig.7 can reach 170°C at the equinoxes and 150°C at the solstice.
Fig.6: Hourly average solar beam radiation (W/m²)
-50 0 50 100 150 200 250 300 350 400
0
200
400
600
800
1000
1200
Bea
m ra
diat
ion
(w/m
²)
Time (Day)

S. Amara et al. / Energy Procedia 6 (2011) 805–814 813
In performed tests the water flow rate through the accumulator tank was 0.6 l/min. Fig.7 shows the inlet and outlet temperature variation on 22 January 2009. Under the light of these results, we noted the existence of a gap in the beginning of the manipulation of over 10 °C which became 50 °C at noon. It took approximately four hours to fill the storage tank with a flow rate of 0.6 l/min to obtain an average daily temperature of 36.5 °C. The decreases observed in Fig.8 for the outlet temperature Ts are resulted by the manual sun tracking system.
6. Concluding remarks
The major finding of the current analysis is that the use of optical fibers in solar thermal concentrating systems for heating is technically feasible, under specific circumstances. In the first phase of our solar fiber-optic paraboloidal dish program the main conclusions of performed study are:
1. A solar fiber-optic heating system was designed, constructed and tested 2. Collection, concentration and transmission of sunlight were demonstrated. 3. The mathematical model of paraboloidal dish system was described. 4. The measured output power from the dish was evaluated against radiation data from the local
meteorological station supplied by the Renewable Energy Research Unit (URER/MS) in Adrar. 5. Optimizing the receiver and dish sizes are important in order to maximize the system efficiency. 6. The calculated optical efficiency of the system was 62% at optimum conditions. 7. The calculated mean power from the paraboloidal dish was 885kW which for an aperture area of
1.7 m2 means 520 kW/m2. 8. The heat was stored in a 0.15 m3 storage tank. 9. The temperature of outlet water from the storage tank reached 70oC.
Fig.8: Measured water inlet and outlet temperatures, 22 Jan 2009.
10,5 11,0 11,5 12,0 12,5 13,0
10
20
30
40
50
60
70
Tem
péra
ture
(°C)
Temps (heures)
Te Ts
Tem
pera
ture
Time (Hours)
Fig.7: Temperatures reached on a selective surface at the solstices and the equinoxes
Summer solstice Winter solstice Equinoxes
814 S. Amara et al. / Energy Procedia 6 (2011) 805–814
During the experimentation we encountered some difficulties e.g. � Dust accumulation on the mirror and at the fiber tip. � The parabolic mirror was made from a satellite dish which surface was clothed by a foil tape. Its
aluminum plies reduced the reflectivity that meant extra energy loss. � The optical fiber was aligned at the concentrator focus by placing a cone (Length=0.15m
Diameter=0.075m) in the parabolic focus, mouthing the mirror. It was problematic to attach the fiber exactly at the focus.
� The manual measurements meant fewer measurements and more errors. � Instead of using the desired optical fiber with relatively large diameter and high numerical aperture
(NA), two optical fibers with a NA=0.4 manufactured by FiberGuide Company, USA, was used.
Current study showed that concentrated solar energy can be transferred as light by optical fibers to a selective surface (absorber) inside a storage tank, where the light is converted to heat. Such systems should have great potential in a wide range of solar energy applications.
References
[1] André E., Schade J., Daylighting by Optical Fiber. MSc Thesis 2002:260, Luleå University of Technology, Sweden. [2] William G. and Charles P., Passive Solar Lighting Using Fiber Optics, Journal of Industrial Technology, Volume19, Number
1 November 2002 to January 2003. [3] Cariou JM., Dugas J., Martin L., Theoretical limits of optical fibre solar furnaces. 1985, Solar Energy 34, 329. [4] Cariou JM., Dugas J., Martin L., Transport of solar energy with optical fibers. 1982, Solar Energy 29, 397–406. [5] Kandilli C., Ulgen K., Review and modelling the systems of transmission concentrated solar energy via optical fibres. 2009,
Renewable and Sustainable Energy Reviews 13, 67–84 [6] ATIS Telecom Glossary, 2007, http://www.atis.org/glossary/ [7] Khatri N., Brown M., Gerner F., Using fiber optics to tap the sun’s power. 1993, Int. Commun. Heat Mass Transfer 20, 771–
781. [8] Liang D., Nunes Y., Monteiro LF., Monteiro MLF., Collares-Pereira M., 200 W solar energy delivery with optical fiber
bundles. 1997, In Nonimaging Optics: Maximum Efficiency Light Transfer IV, Vol. 3139, pp. 217–224. [9] Gordon JM., Feuermann D., Huleihil M., Solar fibre-optic mini-dish concentrators: first experimental results and field
experience. 2002, Solar Energy, 72:459–72 [10] Gordon JM., Feuermann D., Huleihil M., Laser surgical effects with concentrated solar radiation. 2002, Appl Phys Lett,
81:2653–5. [11] Kato D., Nakamura T., Application of optical fibers to the transmission of solar radiation. 1976, J. Appl. Phys. 47,4528-4531 [12] Feuermann D., Gordon JM., Solar surgery: remote fiber-optic irradiation with highly concentrated sunlight in lieu of lasers.
1998, Opt. Eng. 37, 2760–2767. [13] Jaramillo OA., del Rio JA., Huelsz G., A thermal study of optical fibres transmitting concentrated solar energy. J Phys D
1999, 32:1000–5. [14] Kribus A., Zik O., Karni J., Optical fibres and solar power generation. 2000, Solar Energy, 68:405–16. [15] Duffie JA, Beckman WA., Solar engineering of thermal processes. 1991, New York: Wiley. [16] Jaramillo OA, del Rio JA., Optical fibres for a mini-dish/Stirling system: thermodynamic optimization. J Phys D 2002; 35:
1241–50. [17] Welford WT., Winston R., High Collection Nonimaging Optics, 1989, Academic Press, San Diego. [18] Santamouris M, Asimakopoulos D, (2001), passive cooling of buildings [19] Feuermann D., Gordon JM., Experimental realization of solar fiber-optic mini-dishes. 2001, Israel Ministry of National
Infrastructures. Final technical report RD-24-2001. [20] Feuermann D., Gordon JM., Huleihil M., Light leakage in optical fibres: experimental results, modeling and the
consequences for solar concentrators. Solar Energy 2002, 72:195–204. [21] Imbert B., Pasquetti R., Détermination de la concentration géométrique d’un capteur solaire a miroir sphérique. J. Optics
(Paris). 1978, vol. 9, no 1, pp. 25-30. [22] Nakamura T., Senior CL., Shoji JM., Waldron RD., Optical waveguide solar energy system for lunar material processing.
1995, In Proceedings ASME Solar Engineering Conference, Vol. 2, pp. 875–884. [23] Polymicro Technologies LLC (2001) 18019 N. 25th Ave., Phoenix, AZ. Private communications. [24] Rabl, A., Comparison of solar concentrators. 1976, Solar Energy 18, 93–111. [25] Yugami H., Yano M., Naito H., Flamant G., Concentration of fiber transmitted solar energy by CPC for solar thermal
utilization, 1995, journal de physique IV, Vol.9 ; pr3.545-549.

Using Fouggara for heating and cooling buildings in Sahara
MEDGREEN-LB 2011: 1st Conference & Exhibition Impact of Integrated Clean Energy on the Future of the Mediterranean Environment
Beirut – Lebanon, April 14th -16th 2011,Energy Procedia Journal 6 (2011) 55-64
PAPER VII


Available online at www.sciencedirect.com
Energy Procedia 06 (2011) 55–64
EnergyProcedia
www.elsevier.com/locate/procedia
MEDGREEN2011-LB
Using Fouggara for Heating and Cooling Buildings in Sahara
S. Amara(a)* , B. Nordell(a) and B. Benyoucef(b), a*
(a) Division of Architecture and Infrastructure Renewable Energy Group Luleå University of Technology (LTU), SE-97187 Luleå, SWEDEN
(b) Unité de Recherche Matériaux et Energies Renouvelables (URMER) Université de Tlemcen, BP 119 Tlemcen, ALGERIA
Abstract
In order to utilise naturally stored heat or cold from the ground, seasonal temperature variations are required. The reason is that the ground temperature is then warmer than the air temperature during winter and colder during summer. The heating and cooling demand in North Africa varies considerably with the greatest cooling demand in the East and the greatest heating demand in the West. In parts of Algeria the mean temperature difference between the coldest and warmest month is greater than 20°C, which is favourable. In current work it was shown that the ancient Fouggara system, even today would be interesting for heating and cooling of buildings in the Sahara desert. © 2010 Published by Elsevier Ltd. Selection and/or peer-review under responsibility of [name organizer] Keywords: Energy, Fouggara, heating and cooling, buildings, temperature;
1. Introduction
The development of sustainable buildings partly means to minimize required energy for heating in the winter and cooling in the summer. Increased thermal insulation and air tightness of the envelope reduce heat losses. However, the renewal of air is necessary to maintain good air quality. Air is also used to distribute heating and cooling to the building. Therefore, improving thermal performance of buildings require the control of air exchange. The ventilation solutions in sustainable buildings provide better control of the air flow, both hygienic and thermal. [1]
* Corresponding author. Tel.: +213-43-21-5890; fax: +213-43-21-5889. E-mail address: [email protected].

56 Sofiane AMARA/ Energy Procedia 06 (2011)55–64
In this context, we attempt to determine the energy needs for heating and cooling for a building to maintain an indoor temperature between 18°C and 25°C. The estimated annual fuel consumption, defines required storage volume of fuel or propane gas. For this, several parameters are useful: � Heat losses from building (kW) � Number of degree days DD � Annual distribution of energy consumption � Uncontrolled losses The heating and cooling demand of any building also depends on its location. In this study the site is in the Adrar region in Algeria.
Objectives
The objective of current study was to investigate the feasibility of the ancient Fouggara system for heating, cooling and ventilation. The heating cooling demand of a building in Adrar, Algeria, was estimated and the function of the Fouggara was based in real operation data from a Fouggara in the Sahara desert.
2. Geographical characteristics
Adrar is located in south-west of Algeria (Fig.1), 1600 km from Algiers, with latitude of 27.81°, a longitude of -0.18° and an altitude of 279 m. It is characterized very hot and dry summers up to ~50oC and cold winters down to ~0oC (Fig.2a and Fig.2b). It is difficult to define the building comfort. Thermal comfort is therefore a function of the building is used and the ambient temperature. The width of ‘comfort zone’ depends on the balance between both parameters.
The relationship between comfort temperature and the outdoor temperature is used to design comfortable buildings (Fig.2). Here the indoor comfort temperature (Tc) is calculated from the outdoor temperature mean (Tm) and plotted on a monthly basis together with the monthly mean of the daily maximum (Tmax), minimum (Tmin) and mean outdoor temperature (Tm). [3]
Fig.1: Situation of Adrar site [2] Fig.2 : Monthly temperatures variations
Jan. Feb. Mar, Apr. May June Jul. Aug, Sept. Oct. Nov. Dec.
0
5
10
15
20
25
30
35
40
45
50
Tem
pera
ture
(°C
)
Tm Tc Tmin Tmax
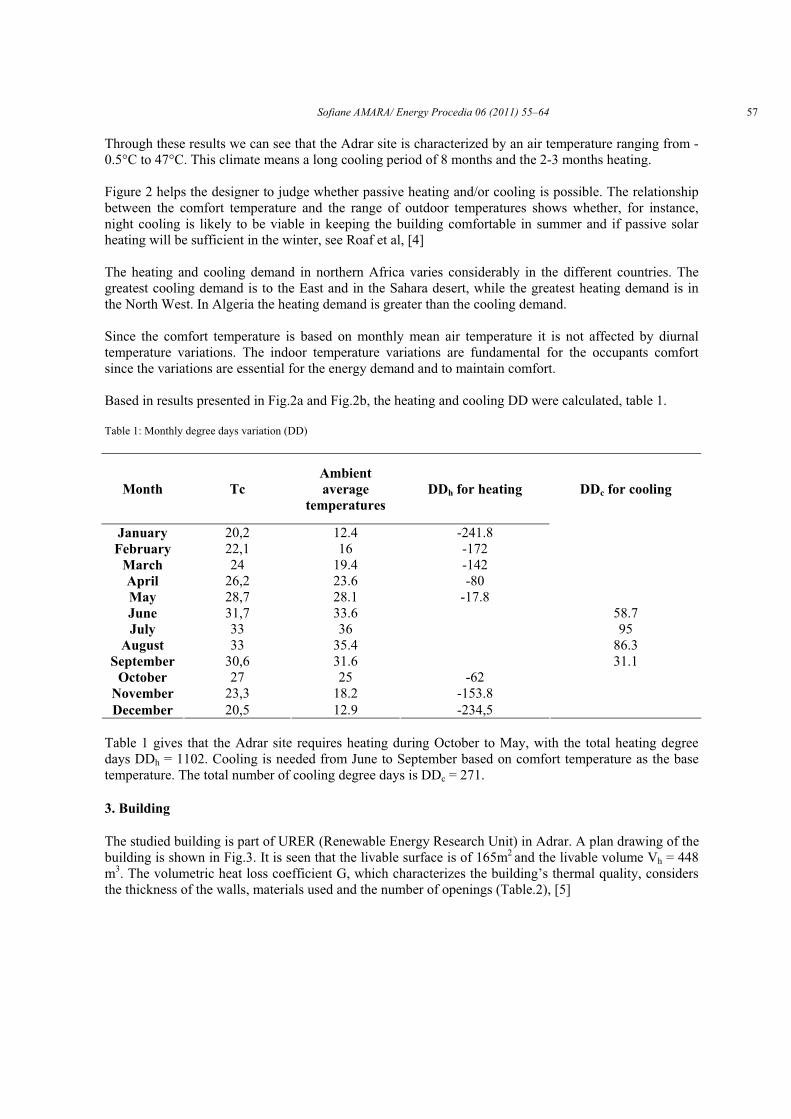
Sofiane AMARA/ Energy Procedia 06 (2011) 55–64 57
Through these results we can see that the Adrar site is characterized by an air temperature ranging from -0.5°C to 47°C. This climate means a long cooling period of 8 months and the 2-3 months heating. Figure 2 helps the designer to judge whether passive heating and/or cooling is possible. The relationship between the comfort temperature and the range of outdoor temperatures shows whether, for instance, night cooling is likely to be viable in keeping the building comfortable in summer and if passive solar heating will be sufficient in the winter, see Roaf et al, [4] The heating and cooling demand in northern Africa varies considerably in the different countries. The greatest cooling demand is to the East and in the Sahara desert, while the greatest heating demand is in the North West. In Algeria the heating demand is greater than the cooling demand. Since the comfort temperature is based on monthly mean air temperature it is not affected by diurnal temperature variations. The indoor temperature variations are fundamental for the occupants comfort since the variations are essential for the energy demand and to maintain comfort. Based in results presented in Fig.2a and Fig.2b, the heating and cooling DD were calculated, table 1. Table 1: Monthly degree days variation (DD)
Month Tc Ambient average
temperatures DDh for heating DDc for cooling
January 20,2 12.4 -241.8 February 22,1 16 -172
March 24 19.4 -142 April 26,2 23.6 -80 May 28,7 28.1 -17.8
June 31,7 33.6 58.7 July 33 36 95
August 33 35.4 86.3 September 30,6 31.6
31.1 October 27 25 -62
November 23,3 18.2 -153.8 December 20,5 12.9 -234,5
Table 1 gives that the Adrar site requires heating during October to May, with the total heating degree days DDh = 1102. Cooling is needed from June to September based on comfort temperature as the base temperature. The total number of cooling degree days is DDc = 271.
3. Building
The studied building is part of URER (Renewable Energy Research Unit) in Adrar. A plan drawing of the building is shown in Fig.3. It is seen that the livable surface is of 165m2 and the livable volume Vh = 448 m3. The volumetric heat loss coefficient G, which characterizes the building’s thermal quality, considers the thickness of the walls, materials used and the number of openings (Table.2), [5]

58 Sofiane AMARA/ Energy Procedia 06 (2011)55–64
Table 2: Total thermal losses from building
Walls Windows Floor Roofing Total losses
K 3.5 5.8 4 4 S (surface) 62.1 6.8 35 35 Lounge
KS 217.3 39.5 140 140 536.4 S 36.4 11.2 20 20 Hall KS 127.4 65 80 80 352.4 S 52 4 25 25 Room 1 KS 182 23.2 100 100 405.2 S 50.2 5.9 25 25 Room 2
KS 175.7 34.2 100 100 410 S 52.9 8.7 30 30 Kitchen
KS 185.1 50.5 120 120 475.7 S 52.4 32 15 15 Passageway
KS 183.4 185.6 60 60 489 S 31 4.2 15 15 Bathroom
KS 108.5 24.4 60 60 253 TOTAL 2922
Then the total sum of losses (for �T=1°C) of the test building is P = 2922 W/°C, see table 2. The volumetric heat loss coefficient G is given by
)/(52.6 3 CmWVPG
h
���
Fig.3: Plan drawing of building
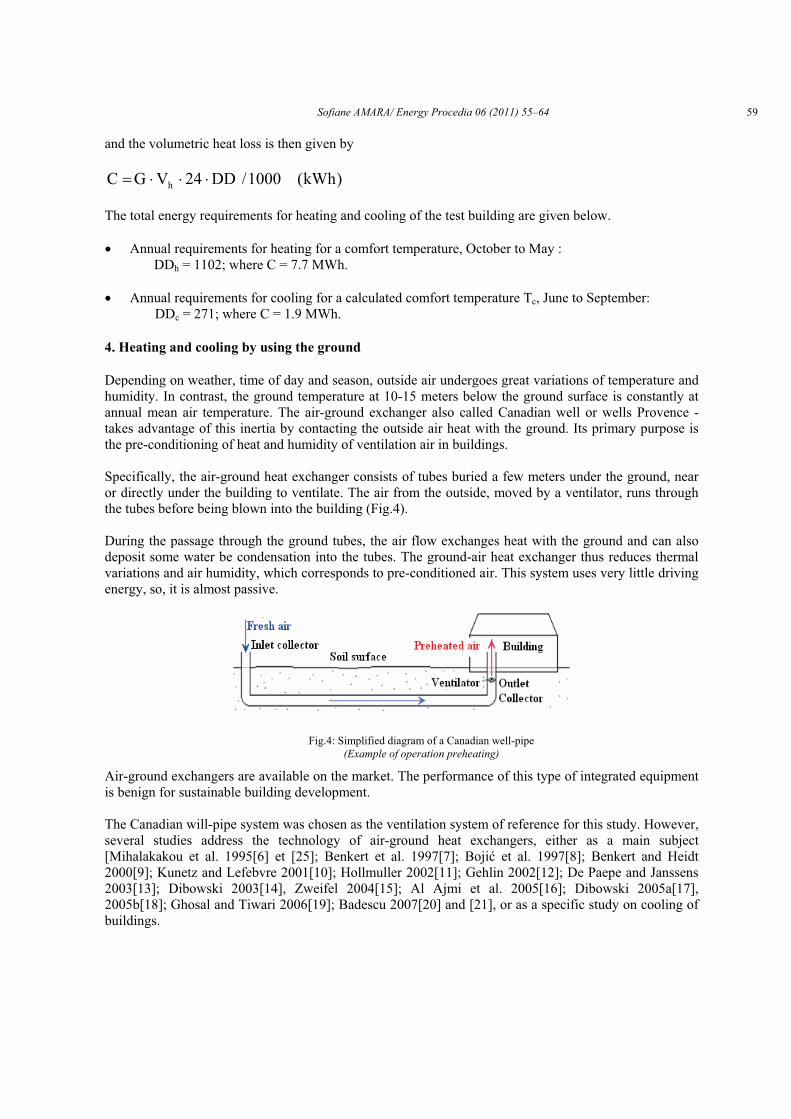
Sofiane AMARA/ Energy Procedia 06 (2011) 55–64 59
and the volumetric heat loss is then given by
)kWh(1000/DD24VGC h ���� The total energy requirements for heating and cooling of the test building are given below. � Annual requirements for heating for a comfort temperature, October to May :
DDh = 1102; where C = 7.7 MWh. � Annual requirements for cooling for a calculated comfort temperature Tc, June to September: DDc = 271; where C = 1.9 MWh.
4. Heating and cooling by using the ground
Depending on weather, time of day and season, outside air undergoes great variations of temperature and humidity. In contrast, the ground temperature at 10-15 meters below the ground surface is constantly at annual mean air temperature. The air-ground exchanger also called Canadian well or wells Provence - takes advantage of this inertia by contacting the outside air heat with the ground. Its primary purpose is the pre-conditioning of heat and humidity of ventilation air in buildings. Specifically, the air-ground heat exchanger consists of tubes buried a few meters under the ground, near or directly under the building to ventilate. The air from the outside, moved by a ventilator, runs through the tubes before being blown into the building (Fig.4). During the passage through the ground tubes, the air flow exchanges heat with the ground and can also deposit some water be condensation into the tubes. The ground-air heat exchanger thus reduces thermal variations and air humidity, which corresponds to pre-conditioned air. This system uses very little driving energy, so, it is almost passive.
Air-ground exchangers are available on the market. The performance of this type of integrated equipment is benign for sustainable building development. The Canadian will-pipe system was chosen as the ventilation system of reference for this study. However, several studies address the technology of air-ground heat exchangers, either as a main subject [Mihalakakou et al. 1995[6] et [25]; Benkert et al. 1997[7]; Boji� et al. 1997[8]; Benkert and Heidt 2000[9]; Kunetz and Lefebvre 2001[10]; Hollmuller 2002[11]; Gehlin 2002[12]; De Paepe and Janssens 2003[13]; Dibowski 2003[14], Zweifel 2004[15]; Al Ajmi et al. 2005[16]; Dibowski 2005a[17], 2005b[18]; Ghosal and Tiwari 2006[19]; Badescu 2007[20] and [21], or as a specific study on cooling of buildings.
Fig.4: Simplified diagram of a Canadian well-pipe (Example of operation preheating)

60 Sofiane AMARA/ Energy Procedia 06 (2011)55–64
Fig.5b: Vertical section along the Fouggara. [28]
Such systems are used for cooling of buildings and industrial applications e.g. greenhouses (Gauthier et al. 1997[22]; Hollmuller and Lachal 2001[23], Ghosal and Tiwari op. cit. [19]).
5. Fouggara: An ancient system for underground transport of water
The Fouggara is known under various names; “Kariz” in Afghanistan, “Qanat” in Iran, “Fouggara” in Algeria and “Khettara” in Morocco. The water flow through the Fouggara is gravity driven. At the mouth of the underground channels it reaches the surface where it is used for irrigation and as drinking water, see Fig.5a. This Fouggara technique is very old and was first used in Iran. It was introduced in Algeria by Arabs at the time of their conquests of Algeria. This technique was adopted by farmers of the area for the following reasons:
� The construction of the Fouggara (Khettara) does not require a financial expenditure, but simply
an effort of work. � Underground transportation of water minimises the water loss due to evaporation and prevents
the accumulation of the sediment caused by sandstorms. [26]
5.1. Characteristics
The Fouggara is made up of: � The source where the water seeps into the channel from a ground water source, � An underground channel which brings the water to its intended destination, � An over ground channel which leads to a network of channels feeding the water to particular
areas or fields for irrigation.
Fig.5a: Outline of the Fouggara principle. [27]

Sofiane AMARA/ Energy Procedia 06 (2011) 55–64 61
It is characterised by;
� The length of Fouggara varies from a few hundred meters to tens of kilometres. � The Fouggara is gravity driven as the water source is situated at a higher elevation then the area
to be irrigated. � The underground channel is wide enough to allow the clearing out and cleaning by hand. � The depth of the shaft at the source varies from 10 to 25 meters. � The distance between two consecutive shafts depends in the stability of the terrain and varies
between 10 and 15 meters. � The water flow rate varies from 0.002 to 0.020 m3/s � It is located at a depth where the temperature is constantly at annual mean air temperature (i.e.
21oC in Adrar). In Algeria the Fouggara is extended over 56000 ha in Naama and in Adrar there are 900 Fouggaras. Today, the land area irrigated by Fouggaras is estimated at 8500 ha though 1/3 of them are in operation. (Fig.6). [24] The existing Fouggaras, active or inactive, means available underground duct systems that could be used as a source for heating and cooling. In the remote Saharan villages of the Saharan people (Fig.7), which lack resources for expensive drilling, available Fouggaras offer an inexpensive alternative. Such a system would be made simply by pumping air through the Fouggara and conducting this air to the air conditioned building. The ambient air then approaches the temperature of the ground (~21°C) during the passage through the ground before used for ventilation, heating, and cooling of buildings (Fig.8).
Fig.6: Many wells represent the Fouggara

62 Sofiane AMARA/ Energy Procedia 06 (2011)55–64
The suggested Fouggara air conditioning system, for cooling in the summer and heating in the winter, of the URER test house consists of:
� One room characterized by a volume of 70 m3 � A pipe system connected to an air convector � A pump with an air flow rate of 0.02 m3/h from the Fouggara.
Fig.7: Fouggara in Adrar.
Fig.8 : The ground-air conditioning system. system

Sofiane AMARA/ Energy Procedia 06 (2011) 55–64 63
Fig.9 shows the ambient temperature and the air conditioned indoor temperatures during the year, give that the difference between the ambient and indoor temperatures in Adrar is approximately ±20°C.
6. Conclusion
The aim was to study the ancient Fouggara system and investigate its possible use as a source for heating, cooling and ventilation of buildings.
The annual energy cooling demand of the test building situated in Adrar gave:
� Heating demand for comfort temperature, - October to May: DDh = 1102; where C = 7.7 MWh.
� Cooling demand for comfort temperature, - June to September: DDc = 271; where C = 1.9 MWh.
The Fouggara consists of:
� The source where the water seeps into the channel from a ground water source, � An underground channel which brings the water to its intended destination, � An over ground channel which leads to a network of channels feeding the water to particular
areas or fields for irrigation. Since the Fouggara is at a depth below ground surface where the seasonal temperature changes do not reach, the Fouggara temperature is close to the annual mean air temperature. In Adrar in the south of Algeria the mean annual temperature is 21oC. Pumping air through the Fouggara means that the air temperature will approach this temperature.
� This novel idea of using an ancient construction as a source for heating, cooling and ventilation has not yet been tested.
� It would be attractive to realize such a test on the test building in Adrar. � However, before performing such test, simulations of how the operation affects the air and
ground temperatures should be made.
Fig.9: Ambient and Indoor temperature variation
0 2000 4000 6000 8000 10000
0
10
20
30
40
50
Tem
pera
ture
(°C
)
T ime (Hour)
Am bient Temperature Indoor Tem perature Room

64 Sofiane AMARA/ Energy Procedia 06 (2011)55–64
References
[1] Thiers, S. (2008). Bilans énergétiques et environnementaux de bâtiments à énergie positive. Thèse de doctorat. Ecole Nationale Supérieure Des Mines De Paris.
[2] Microsoft ® Encarta ® (2008). © 1993-2007 Microsoft Corporation, [3] Amara, S. (2009). Optimisation des apports d’énergies hybrides dans l’habitat économe. Université Abou Bekr Belkaid
Tlemcen. [4] Roaf. S. C, Fuentes. M, Taylor. S, (2001), The eco-house design guide, London, Architectural Press. [5] Amara. S, Benmoussat. A, Bouguima. S, Benyoucef. B, Nordell. B, (2007), Requirements energy estimate of heating and
cooling for a dwelling in the site of TLEMCEN, ICRESD’07, 21 to 24 May 2007, Tlemcen Algérie. [6] Mihalakakou, G., Santamouris, M., Asimakopoulos, D. (1995). Modelling the thermal performance of earth-to-air heat
exchangers, Solar energy. Vol 53 (3). pp. 301–305. [7] Benkert, S., Heidt, F. D., Schöler, D. (1997). Calculation tool for earth heat exchangers GAEA, Proceedings of IBPSA
Conference. Prague. [8] Boji�, M., Trifunovi�, N., Papadakis, G., Kyritsis, S. (1997). Numerical simulation, technical and economic evaluation of air-
to-earth heat exchanger coupled to a building, Energy. Vol. 22 (12). pp. 1151–1158 [9] Benkert, S., Heidt, F. D. (2000). Abschlussbericht zum Projekt : Validierung des Programms "Graphische Auslegung von
ErdwärmeAustauschern GAEA" mit Hilfe von Messdaten im Rahmen des Verbundprojekts "Luft-/Erdwärme tauscher" der AG Solar NRW. FG Bauphysik & Solarenergie, Universität Siegen, 89 p. Disponbile en ligne.
URL : http://nesa1.uni-siegen.de/softlab/download/abschlussbericht.PDF [10] Kunetz, J., Lefebvre, L. (2001). Les puits provençaux. Etude et méthode de dimensionnement. Rapport de projet tutoré de
5ème année. INSA de Toulouse. Janvier 2004. 54 p [11] Hollmuller, P. (2002). Utilisation des échangeurs air-sol pour le chauffage et le rafraîchissement des bâtiments. Thèse de
doctorat. Faculté des sciences de l'Université de Genève. 125 p. Disponible en ligne. URL : http://www.unige.ch/cyberdocuments/theses2002/HollmullerP/these.html
[12] Gehlin, S.: Thermal response test – Method development and evaluation. Doctoral Thesis 2002:39, LuTH, 2002.[13] De Paepe, M., Janssens, A. (2003). Thermo-hydraulic design of earth-air heat exchangers, Energy and Buildings. Vol. 35
(4). pp. 389–397. [14] Dibowski, H. G. (2003). Auf Basis umfangreicher Messdatensätze experimentell und numerisch validierte Regeln zur
optimierten Auslegung von Luft-Erdwärmetauschern. Thèse de doctorat. Universität Kassel. Kassel. 225 p. [15] Zweifel, G. (2004). A simplified model of a Ground to Air Heat Exchanger. Hochschule für Technik+Architektur Luzern (HTA Luzern). Horw. 6 p. [16] Al Ajmi, F., Loveday, D.L., Hanby, V.I. (2005). The cooling potential of earth-air heat exchangers for domestic buildings in
a desert climate, Building and Environment. Vol. 41 (3). pp. 235–244. [17] Dibowski, H. G. (2005). Luft-Erdwärmetauscher L-EWT Planungsleitfaden Teil 2: Testanlagen im Verbundprojekt. Rapport
AG Solar. Köln. 102 p. [18] Dibowski, H. G. (2005). Luft-Erdwärmetauscher L-EWT Planungsleitfaden Teil 2: Technishe Planung. Rapport AG Solar.
Köln. 62 p. [19] Ghosal, M. D., Tiwari, G. N. (2006). Modeling and parametric studies for thermal performance of an earth to air heat
exchanger integrated with a greenhouse, Energy conversion and management. Vol. 47 (13-14). pp. 1779-1798. [20] Badescu, V. (2007). Simple and accurate model for the ground heat exchanger of a passive house, Renewable energy. Vol 32
(5). pp. 845–855. [21] Badescu, V., Sicre, B. (2003). Renewable energy for passive house heating: II. Model, Energy and Buildings. Vol. 35 (11).
pp. 1085–1096. [22] Gauthier, C., Lacroix, M., Bernier, H. (1997). Numerical simulation of soil heat exchangerstorage systems for greenhouses,
Solar energy. Vol. 60 (6). pp. 333–346. [23] Hollmuller, P., Lachal, B. (2001). Cooling and preheating with buried pipe systems: monitoring, simulation and economic
aspects, Energy and Buildings. Vol. 33 (5). pp. 509–518 [24] Bouzidi, B. (1999). L’Energie Solaire et les Régions Sahariennes : Exemple de la Région d’Adrar. Revue des Energies
Renouvelables : Valorisation. pp101-104. [25] Mihalakakou, G., Santamouris, M., Asimakopoulos, D.N., Argiriou, A. (1995) On the ground temperature below buildings,
Solar energy. Vol. 55 (5). pp. 355–362. [26] El Faiz, M., Ruf, T. What stakes of development for the systems of khettara (Water mines) in Morocco. Disponible en ligne: www.isiimm.agropolis.org/OSIRIS/article/maElFaizRuf2006_khettaras2.pdf El Faiz, M., Ruf, T. What stakes of development for
the systems of khettara (Water mines) in Morocco. [27] Khettara : http://jorf.sagya.org/english/thekhettara.htm [28]Khettara : www.jorf.sagya.org/photos/khettara.