Novel Analgesics and the Impact of Route of Administration ...
217
Novel Analgesics and the Impact of Route of Administration in the Horse by Heather Ayn Davis A dissertation submitted to the Graduate Faculty of Auburn University in partial fulfillment of the requirements for the Degree of Doctor of Philosophy Auburn, Alabama December 14, 2019 Keywords: Absorption, Cannabinoid, Equine, Firocoxib, Pharmacokinetics, Peritonitis Copyright 2019 by Heather A. Davis Approved by Dr. Dawn Merton Boothe, Chair, Professor, Anatomy, Physiology Pharmacology Dr. Reid Hanson, Professor, Clinical Sciences Dr. Robert Judd, Professor, Anatomy, Physiology, Pharmacology Dr. John Schumacher, Professor Emeritus, Clinical Sciences Dr. Jennifer Taintor, Associate Professor, Clinical Sciences
Transcript of Novel Analgesics and the Impact of Route of Administration ...

Novel Analgesics and the Impact of
Route of Administration in the Horse
by
Heather Ayn Davis
A dissertation submitted to the Graduate Faculty of
Auburn University
in partial fulfillment of the
requirements for the Degree of
Doctor of Philosophy
Auburn, Alabama
December 14, 2019
Keywords: Absorption, Cannabinoid, Equine,
Firocoxib, Pharmacokinetics, Peritonitis
Copyright 2019 by Heather A. Davis
Approved by
Dr. Dawn Merton Boothe, Chair, Professor, Anatomy, Physiology Pharmacology
Dr. Reid Hanson, Professor, Clinical Sciences
Dr. Robert Judd, Professor, Anatomy, Physiology, Pharmacology
Dr. John Schumacher, Professor Emeritus, Clinical Sciences
Dr. Jennifer Taintor, Associate Professor, Clinical Sciences

2
Table of Contents
Acknowledgments........................................................................................................................... 8
Abstract ........................................................................................................................................... 9
List of Figures ............................................................................................................................... 12
Chapter 1. Clinical Pharmacology and Drug Movement in the Equine Patient .......................... 16
Absorption ................................................................................................................................. 17
Equine Anatomy ..................................................................................................................... 17
Physiochemical Factors Affecting Oral Drug Absorption .................................................... 25
Formulation Effects on Oral Drug Absorption ..................................................................... 27
Physiological Factors Governing Oral Drug Absorption ..................................................... 28
Rectal Absorption in the Equine Patient ............................................................................... 32
Modeling Oral Drug Absorption in the Horse .......................................................................... 35
Modeling Rectal Drug Absorption in the Horse ....................................................................... 39
Distribution................................................................................................................................ 43
Metabolism ................................................................................................................................ 46
Elimination ................................................................................................................................ 49
Chapter 2. Fundamentals of Pain Perception and Transmission in the Equine Patient ............... 52
Effects of Pain ........................................................................................................................... 52
Somatic Pain .............................................................................................................................. 56
Pathway and Transmission .................................................................................................... 56

3
Models of Equine Somatic Pain ................................................................................................ 61
Visceral Pain ............................................................................................................................. 63
Peritoneal Embryology, Anatomy, and Physiology ............................................................... 63
Chapter 3. Pilot Study: Non-septic, transient, peritonitis model for use in evaluating drug
movement in the equine patient .................................................................................................... 71
Abstract ..................................................................................................................................... 71
Introduction ............................................................................................................................... 72
Materials and Methods .............................................................................................................. 73
Animals .................................................................................................................................. 73
Peritonitis Induction Model ................................................................................................... 73
Evaluation of Peritonitis Induction Model ............................................................................ 76
Statistical Analysis ................................................................................................................. 77
Results ....................................................................................................................................... 78
Discussion ................................................................................................................................. 88
Chapter 4. Impact of Route, Volume, and Fed/Fasted State on Acetaminophen Disposition after
Oral Administration in the Horse .................................................................................................. 91
Abstract ..................................................................................................................................... 91
Introduction ............................................................................................................................... 92
Materials and Methods .............................................................................................................. 94
Animals .................................................................................................................................. 94

4
Drug Administration .............................................................................................................. 95
Sample Collection .................................................................................................................. 96
Sample Analysis ..................................................................................................................... 96
Pharmacokinetic Analysis ..................................................................................................... 97
Results ....................................................................................................................................... 98
Discussion ............................................................................................................................... 106
Chapter 5. Clinical Application of Firocoxib Canine Chews in Equine Practice ...................... 109
Abstract ................................................................................................................................... 109
Introduction ............................................................................................................................. 110
Materials & Methods ............................................................................................................... 112
Animals ................................................................................................................................ 112
Sample Collection ................................................................................................................ 113
Sample Analysis ................................................................................................................... 114
Pharmacokinetic Analysis ................................................................................................... 117
Results ..................................................................................................................................... 118
Discussion ............................................................................................................................... 124
Chapter 6. Pilot Study: Pharmacokinetics of the Antiepileptic Drug Zonisamide after Oral and
Rectal Administration in the Horse ............................................................................................. 128
Abstract ................................................................................................................................... 128
Introduction ............................................................................................................................. 130

5
Materials & Methods ............................................................................................................... 132
Animals ................................................................................................................................ 132
Drug Administration ............................................................................................................ 132
Sample Collection ................................................................................................................ 133
Sample Analysis ................................................................................................................... 134
Pharmacokinetic Analysis ................................................................................................... 134
Results ..................................................................................................................................... 136
Discussion ............................................................................................................................... 140
Chapter 7. Cannabinoid Pharmacology ..................................................................................... 142
Cannabinoid Receptor ............................................................................................................. 142
Cannabinoid Ligands ............................................................................................................... 146
Pharmacokinetics of Cannabinoids ......................................................................................... 150
Absorption ........................................................................................................................... 150
Distribution .......................................................................................................................... 155
Metabolism .......................................................................................................................... 157
Elimination .......................................................................................................................... 159
Pharmacodynamic Effects on People ...................................................................................... 161
Pharmacodynamic Effects on Dogs ........................................................................................ 163
Chapter 8. Pharmacokinetic and pharmacodynamics characterization of a CBD oil in the horse
after oral and transmucosal administration ................................................................................. 164

6
Abstract ................................................................................................................................... 164
Introduction ............................................................................................................................. 165
Materials & Methods ............................................................................................................... 167
Pilot Study............................................................................................................................ 167
Animals ................................................................................................................................ 168
Sample Collection ................................................................................................................ 168
Pharmacodynamic Assessment ............................................................................................ 169
Sample Analysis ................................................................................................................... 170
Pharmacokinetic Analysis ................................................................................................... 172
Results ..................................................................................................................................... 173
Discussion ............................................................................................................................... 179
Potential Therapeutic Targets of Cannabinoids ...................................................................... 184
Central Nervous System....................................................................................................... 184
Cancer ................................................................................................................................. 186
Ocular .................................................................................................................................. 187
Chapter 9. Conclusion Chapter and Potential Therapeutic Topics ............................................ 188
Novel Development - Peritonitis Model .................................................................................. 188
Impact of Route and Volume on Drug Absorption in the Equine Patient ............................... 190
Formulation Effect on Drug Absorption ................................................................................. 192
Comparison of Oral to Rectal Administration ........................................................................ 194

7
Further Advances in Equine Pain Management ..................................................................... 197
References ................................................................................................................................... 202

8
Acknowledgments
This manuscript is in honor of my grandparents, Byron “Whitey” and Helyn Madeline
Davis, who taught me the importance of forgiveness, compassion, being kind to animals, and the
value of a dollar. Without your continued guidance and support, I would not have been able to
accomplish all of my dreams.
To the ≥3.75 legged guardian angels who weathered this journey by my side (Jude,
Challenge, Anna May, Firebomb, Eis Vogel, Clarice Starling, and Hannibal Lector). Thank you
for being larger than life personalities, steadfast companions, and giving me a reason to fight.
Drs. Jennifer Taintor and Amanda Crouthamel, Crisanta Cruz-Espindola, Roy Harmon,
as well as the AU LAC Teaching Horses, without your organization, determination, and
cooperation none of the work within this dissertation would have been possible.
Finally, my sincerest gratitude to the patience of my committee – this has been a very
long, sometimes tortuous road, and there are not words to truly express how thankful I am for
your continued faith in my ability to accomplish this goal.

9
Abstract
The primary goal of this dissertation was to describe the disposition of novel analgesics
and the impact of their administration on the equine patient. In order to support this aim, a
novel, non-septic, transient model of peritonitis was characterized for use in evaluating drug
movement in an inflamed abdomen. Using acetaminophen as a marker of oral drug absorption,
the impacts of both route (nasogastric tube administration vs. syringe) and volume (1.5 L vs. 100
mL) administered on drug disposition were compared. From this, placement of a nasogastric
tube and larger volumes of water used for dissolution improved absorption of acetaminophen.
Firocoxib was used to evaluate formulation effect on oral absorption. From this, it was
determined that both the canine chewable tablet and equine paste were found to be equally
bioavailable. Zonisamide was evaluated in a simple crossover study to assess both oral and
rectal administration of the anti-epileptic drug. A pharmacokinetic profile was generated for oral
route; however, the active ingredient did not prove to be rectally absorbed. Finally, two
cannabidiol products were profiled after both oral and transmucosal administration. Consistent
with human and canine studies, it appears transmucosal administration improves absorption of
the product and lends itself for further work. Overall, this dissertation demonstrates the
importance of scientifically studying both route and formulation prior to administration to the
equine patient rather than making assumptions of drug movement based on work performed in
other species.
,

10
List of Tables
Chapter 3. Pilot Study: Non-septic, transient, peritonitis model for use in evaluating drug
movement in the equine patient .................................................................................................... 71
Results ....................................................................................................................................... 78
Table 3.1. Subjective abnormal abdominal ultrasound findings of horses after being treated
with intraabominal infusion of autologous plasma, crystalloid solution and heparin, and
whole blood (n=7). ................................................................................................................ 79
Table 3.2. Peritoneal nucleated cell counts for each treatment group for each time point
post treatment (n=13). ........................................................................................................... 81
Table 3.3. Peritoneal total protein values for each treatment group for each time point post
treatment (n=13). ................................................................................................................... 84
Chapter 4. Impact of Route, Volume, and Fed/Fasted State on Acetaminophen Disposition after
Oral Administration in the Horse .................................................................................................. 91
Materials and Methods .............................................................................................................. 94
Table 4.1. Treatment group descriptions and paired comparisons (n=6) horses per grouping.
............................................................................................................................................... 94
Results ....................................................................................................................................... 98
Table 4.2. Mean pharmacokinetic parameters for acetaminophen when administered in
apparently healthy horses (n=6) ............................................................................................ 99
Chapter 5. Clinical Application of Firocoxib Canine Chews in Equine Practice ...................... 109
Results ..................................................................................................................................... 118

11
Table 5.1. Mean pharmacokinetic parameters for firocoxib when administered as either
canine chews or equine paste in apparently healthy horses (n=8). ...................................... 120
Table 5.2. Percent difference between firocoxib concentrations after being stored in either
glass or plastic tubes for 60 hours. ...................................................................................... 122
Chapter 6. Pilot Study: Pharmacokinetics of the Antiepileptic Drug Zonisamide after Oral and
Rectal Administration in the Horse ............................................................................................. 128
Results ..................................................................................................................................... 136
Table 6.1. Combined pharmacokinetic parameters after oral administration of 10 and 20
mg/kg n of zonisamide in apparently healthy horses (n=8)................................................. 137
Chapter 7. Cannabinoid Pharmacology ..................................................................................... 142
Table 7.1. Cannabinoid and receptor relationships with corresponding response. ............ 149
Chapter 8. Pharmacokinetic and pharmacodynamics characterization of a CBD oil in the horse
after oral and transmucosal administration ................................................................................. 164
Results ..................................................................................................................................... 173
Table 8.1. Mean pharmacokinetic parameters for CBD when administered in apparently
healthy horses (n=10). ......................................................................................................... 174
Table 8.2. Evaluation of sedation for horses (n=13) over the first 24 hours after
administration. ..................................................................................................................... 177

12
List of Figures
Chapter 3. Pilot Study: Non-septic, transient, peritonitis model for use in evaluating drug
movement in the equine patient .................................................................................................... 71
Results ....................................................................................................................................... 78
Figure 3.1. Peritoneal nucleated cell counts comparing treatment groups abdominocentesis
(n=1), whole blood with heparin (n = 2), and whole blood only (n= 6). ............................... 82
Figure 3.2. Peritoneal nucleated cell counts comparing treatment groups crystalloid fluid
infusion (n=1), crystalloid fluid with heparin (n = 2), and autologous plasma (n= 1). ......... 83
Figure 3.3. Peritoneal total protein comparing treatment groups abdominocentesis (n=1),
whole blood with heparin (n = 2), and whole blood only (n= 6). .......................................... 85
Figure 3.4. Peritoneal total protein comparing treatment groups crystalloid fluid infusion
(n=1), crystalloid fluid with heparin (n = 2), and autologous plasma (n= 1). ....................... 86
Chapter 4. Impact of Route, Volume, and Fed/Fasted State on Acetaminophen Disposition after
Oral Administration in the Horse .................................................................................................. 91
Results ....................................................................................................................................... 98
Figure 4.1. Serum acetaminophen concentrations comparing route of administration
between Group 1 (SYR 100 mL) to Group 2 (NGT 100 mL) (n= 6). ................................. 101
Figure 4.2. Serum acetaminophen concentrations comparing volume of administration
Group 2 (NGT 100 mL) to Group 3 (NGT 1.5 L) (n = 6). .................................................. 103
Figure 4.3. Serum acetaminophen concentrations comparing treatment Group 3 (NGT 1.5L)
to Group 4 (NF NGT 1.5L) (n=6). ...................................................................................... 105

13
Chapter 5. Clinical Application of Firocoxib Canine Chews in Equine Practice ...................... 109
Results ..................................................................................................................................... 118
Figure 5.1. Firocoxib mean plasma drug concentrations (with SE) versus time in 8
apparently healthy horses when administered at 0.3 mg/ kg as three different formulations.
............................................................................................................................................. 119
Chapter 6. Pilot Study: Pharmacokinetics of the Antiepileptic Drug Zonisamide after Oral and
Rectal Administration in the Horse ............................................................................................. 128
Results ..................................................................................................................................... 136
Figure 6.1. Combined oral dosing (10 and 20 mg/kg) of serum zonisamide concentrations
plotted against time course of study (n=8). ......................................................................... 138
Figure 6.2. Serum zonisamide concentrations plotted against time in apparently normal
horses receiving zonisamide at either 10 mg/kg (n= 4) or 20 mg/kg (n= 4). ...................... 139
Chapter 8. Pharmacokinetic and pharmacodynamics characterization of a CBD oil in the horse
after oral and transmucosal administration ................................................................................. 164
Results ..................................................................................................................................... 173
Figure 8.1. Serum equine cannabinoid concentrations (CBD and Δ9 THC) with
corresponding standard deviations over the time course of the study (n=13). .................... 175
Figure 8.2. Evaluation of sedation and serum CBD concentration for horses (n=13) over the
first 24 hours after administration in graphical form. .......................................................... 178

14
List of Abbreviations
ANOVA Analysis of Variance
AUC Area Under the Curve
Cmax Maximum Plasma/Serum Drug Concentration
C0 Maximum Plasma/Serum Drug Concentration after Intravenous Administration
°C Degrees Celsius
CL Clearance
F Absolute Bioavailability
°F Degrees Fahrenheit
g Gravity
h Hour
HPLC High Pressure Liquid Chromatography
L Liters
MAT Mean Absorption Time
mg Milligrams
mL Milliliters
MAT Mean Absorbance Time
MRT Mean Residence Time

15
NF Non Fasted
ng Nanograms
nm Nanometers
NSAID Non Steroidal Anti-Inflammatory Drug
NGT Nasogastric Tube
PO Per os
PR Per rectum
rpm Revolutions per Minute
r2 Coefficient of Variation
RSD Relative Measurement of Uncertainty
SPE Solid Phase Extraction
SYR Syringe
Tmax Time to Maximum Plasma/Serum Drug Concentration
t1/2 Elimination Half-Life
UV Ultraviolet

16
Chapter 1. Clinical Pharmacology and Drug Movement in the Equine Patient
“I wanted to be a pharmacologist the day I stood in the ICU,
my patient was on more drugs than I could count,
and we had no idea how they would work together/against one another”
-Dr. Dawn Boothe
In order to achieve a desired clinical effect, such as management of pain in the equine
patient, plasma drug concentrations of the therapeutic agent used for intervention must reach
suitable levels to drive response. Plasma drug concentrations reflect the sum effect of four
simultaneous drug movements: absorption, distribution, metabolism, and excretion. Alterations
in physiology secondary to pathology plays a large role in how drugs move within the body and
jeopardize effectiveness of the drug molecule being administered. Also, use of multiple drugs
within a patient may enhance or inhibit the movement and ultimate effectiveness of a drug
molecule within the patient. As a clinician, understanding the fundamentals of drug movement
is critical to selecting the appropriate therapy in both acute as well as chronic conditions.

17
Absorption
In the eyes of people unfamiliar with medicine or pharmacology, when patients (two or
four legged) receive a medication, once in the body, the drug works “magic” to treat the
pathology of disease. However, the body, human or animal, is not a black box where
pharmacology “magic” occurs. Instead, once a drug formulation is administered to a patient, a
series of very important steps must occur in order for the active ingredient to be effective at the
site of pathology. Similar to life where two things are for certain (death and taxes), a drug
product will undergo all or a portion of four major components of drug movement: absorption,
distribution, metabolism, and excretion.
Depending on how the drug is administer to the patient, there are often multiple steps
required prior to reaching the target tissue for treating pathologies. The first step along this path
is absorption of the formulation itself. Absorption is defined as the movement of the drug from
the site of administration into the blood (Boothe; Riviere). In this dissertation, four routes of
administration have been evaluated as they relate to modulators of pain management in the
equine patient: oral, transmucosal, rectal, and intravenous and the focus of the enclosed chapter
will be focused on characterizing drug movement as it relates to these routes of delivery.
Equine Anatomy
In order to understand oral and rectal absorption, one must first understand the anatomic
configuration as well as function of each of the organs within the equine gastrointestinal tract
and their contributing factors to the digestion and absorption of a drug.
The gastrointestinal tract is unique in that it serves as a protective barrier from the
external environment while also serving to facilitate the absorption of nutrients from the ingested

18
food particulate. No matter if the substance is nutritional, supportive, or a drug, if administered
orally, the molecule must be processed by the gastrointestinal tract prior to absorption into the
blood stream. In so doing, the molecule must be able to withstand the intraluminal
gastrointestinal environment (Florence).
All organs of the gastrointestinal tract are composed of four layers. Extending from the
lumen outward are: the mucosa, submucosa, muscularis mucosa, and serosa. The structure of the
innermost mucosal layer has configurations and cellular components which are organ specific.
The muscularis mucosa is composed of a thin inner lamella and an outer, thicker lamella that
have specific roles in gastrointestinal motility. Finally, the serosal layer is the primary protectant
layer of the gastrointestinal tract (Auer J.A.).
After oral ingestion and transport through the esophagus, the first gastrointestinal organ a
drug encounters are the stomach, which has a capacity of storing 5-15L of ingesta in the equine
patient. The cardia of the equine stomach is attached to the diaphragm by the gastrophrenic
ligament, the fundus lies adjacent to the 14th and 15th rib spaces, and the pylorus being position
on the right side of midline. The equine stomach’s primary arterial blood supply is the celiac
artery and drainage occurs through the gastric veins which feeds primarily into the portal vein
(Auer J.A.).
There are four regions of the equine stomach: cardiac epithelium, non-glandular
stratified squamous epithelium, proper gastric mucosa (glandular mucosa), and pyloric mucosa.
In the equine stomach, approximately half of the mucosal surface area is composed of stratified,
squamous epithelium. This area of the stomach lacks secretory ability, does not frequently come
into contact with the ingesta contents, and may serve as a protective mechanism from abrasion
by roughage consumed by the horse. Unique to the horse, there is a distinct division between the

19
secretory and non-secretory portion of the stomach. This line, the margo plicatus, indicates an
abrupt change from the stratified squamous epithelium to the glandular mucosa. The glandular
mucosa of the equine stomach is composed of a variety of cells responsible for secreting critical
substances necessary for digestion. Within the gastric mucosa, parietal cells secrete hydrochloric
acid and enterochromaffin cells secrete histamine. Within the pyloric region, G-cells secrete
gastrin which enhances gastric acid secretion and D cells secrete somatostatin which is a
negative feedback chemical to decrease gastric acid secretion. The glandular portion of the
stomach is protected from back diffusion of hydrogen ions from the hydrochloric acid by tight
connections between the mucosal lining (high transepithelial electrical resistance) as well as
secretion of mucous and bicarbonate (Auer J.A.). Along the luminal aspect of the cellular lining
of the stomach is a layer of surface mucous which serves as a protective barrier protecting the
self-digestion secondary to exposure of acid and enzyme secretions (Boothe; Riviere).
Following the stomach is the small intestine which is composed of the duodenum,
jejunum, and the ileum, and varies from 10-30 m in length. The duodenum, approximately one
meter in length, extends from the pylorus right of midline along the right dorsal abdomen to a
point caudal the root of the mesentery. Blood flow to the duodenum is split with the cranial half
being supplied by the celiac artery and the caudal half being fed by a branch off of the cranial
mesenteric artery. Despite horses lacking a gall bladder, they are similar to other mammalian
species by having both a major and minor papilla which serve as an opening for the bile as well
as primary and accessory pancreatic ducting (Auer J.A.).
The jejunum, approximately 17-28 m in length, can be found in the left dorsal quadrant
of the abdomen between loops of the small colon. Nutrient digestion as well as the large portion
of drug absorption takes place within the cranial half of the small intestine. In order to facilitate

20
this, the arterial blood supply to the jejunum is extensive. The arterial supply originates from the
cranial mesenteric artery and the subsequent vascular arcades consists of a major jejunal vessel
with several branching vasa recta that pass from the arcuate vessels into the intestinal wall.
Running parallel beside the extensive arterial supply to the jejunum is the venous network, which
enter the portal vein to provide venous drainage from the small intestine (Auer J.A.).
The small intestine is the most important site of absorption in the mammalian body. The
entire lining of the small intestine surface has fingerlike projections, known as villi, which
extend into the lumen of the small intestine. From these villi are secondary projections known as
microvilli, or the brush border, which also represent the final large increase in surface area of the
small intestine. Ninety percent of the brush border is composed of columnar, enterocyte
epithelium capable of absorption. Of these cells, only the upper third are capable of surface
digestion of nutrients and active transport of digestive products. These enterocytes undergo a
process known as restitution, where within two to three days (or two cell divisions) cells migrate
from the villous crypts to the villi tip. The apical surface of the enterocytes is also coated with
weakly acidic sulfated mucopolysaccharides which serve as a relatively impermeable barrier to
bacteria and other foreign materials; however, these substrates do contribute to digestion of
carbohydrates, proteins, as well as transport of molecules (Boothe; Florence; Riviere).
The entire lining of the small intestine is a continuous sheet of epithelial cells
(enterocytes, mucous producing goblet cells, enteroendocrine and Paneth cells), held together at
their base via tight junctions basal plasma membrane. These epithelial cells are equipped with
metabolizing enzymes that can break down drug products at first exposure, resulting in a
decreased amount of drug to be available to the blood stream (Boothe; Riviere).

21
The tight junctions between enterocytes minimize transmucosal flux of large molecules
but are permeable to water as well as low molecular weight molecules. These tight junctions and
intracellular space form a paracellular channel, which expand during water absorption. Beneath
the basal membrane is the lamina propria. The lamina propria serves as a connective tissue
structure that has a variety of cell types including blood and lymph vessels as well as nerve
fibers. Once a drug molecule has reached this area, it may diffuse through the capillary
membrane and enter systemic circulation, or it may penetrate the central lacteal and enter into the
lymph. Central lacteals, a cavernous opening in the villi itself that feeds into the lymphatic
system, are important for the absorption of triglycerides or emulsified fats in the forms of
chylomicrons (larger than 0.5 micron in diameter). Most drugs reach the blood stream through
the capillaries in the villi due to their large number since the area is highly and rapidly perfused
by the blood stream. The capillary membranes themselves are more substantial barrier than
those seen in the lymphatic system. Molecules that have extremely large oil/water partition
coefficients (> 10^5) such as drugs and insecticides will enter the systemic circulation through
the lymph flow. In cases where there is decreased blood flow to the gastrointestinal tract, drug
absorption through the lymphatic system may become more important (Auer J.A.; Boothe;
Florence; Riviere).
The final mucosal layer, the muscularis mucosa, is comprised of smooth muscle layers
three to ten cells thick. As ingesta moves into an area, both muscular layers relax to
accommodate the bolus. Working together, the inner, circular layer contracts around the bolus
while the outer, longitudinal muscle layer propulses the ingesta along the gastrointestinal tract.
The rhythmic segmentation in the circular smooth muscle followed by the synchronous

22
shortening of the longitudinal muscle layer creates the peristaltic movement that moves the food
bolus in an aboral direction (Auer J.A.; Florence).
Below the muscularis mucosa lies the lamina propria, which is composed of connective
tissue, blood and lymph vessels as well as nerve fibers. All of the blood, lymph, and nervous
intervention servicing a particular area of the gastrointestinal tract must pass through the lamina
propria to reach their designated area (Auer J.A.).
Control of motility of the gastrointestinal tract is mediated by hormonal, neuronal, and
mechanical processes. Coordinated release of both excitatory and inhibitory neurotransmitters
coordinate the peristaltic reflex responsible for propulsive activity. The gastrointestinal tract
receives neuronal stimulation from the vagus nerve, components of the sympathetic nervous
system, and the enteric nervous system. The enteric nervous system is composed of both the
myenteric and submucosa plexus. The myenteric plexus, also known as the Auerbach’s plexus,
is the main source of longitudinal muscle innervation and the outer lamella of circular muscle.
The submucosal plexus, Messner’s plexus, innervates the inner lamella of circular muscle
contributing to contraction (Auer J.A.).
Myoelectric activity is based on both slow wave and spike potential wave
neurotransmission that results in the contraction of both circular as well as longitudinal muscle
layers contributing to gastrointestinal motility. Within the longitudinal layers of smooth muscle
are the interstitial cells of cajal, these are the pacemakers of the cell and help create a rhythm of
peristalsis. The rhythmicity of contractions is mediated by the slow wave oscillations generated
by these cells. The slow wave potentials are greater at the duodenum, and less at the ileum. The
frequencies of the slow waves determine the maximal frequency of the action potentials. If the
smooth muscle slow wave oscillation drops below a threshold (amount), there is a rapid

23
depolarization, leading to intestinal contractions. Spike potentials can be initiated through
mechanical stretch, neural, or hormonal stimuli (Auer J.A.).
Migrating motor complex (MMC) is consistently present during the interdigestive state
between meals to facilitate movement of ingesta as well as minimize colonization of the small
intestine. There are three phases of the MMC that facilitate peristalsis. In Phase One, there are
no action potentials or spiking activity and slow wave movements are the only stimulation
present. During Phase Two, there are intermittent or irregular spiking activity (ISA) where the
slow waves are continually present but there are intermittent action potentials. Finally, during
Phase Three, there is regular spiking activity where there is an action potential for every slow
wave. This results in intense, sustained contractions. By using Phases Two and Three, most of a
meal is moved through the small intestine. Motilin, a neurotransmitter released during fasting,
acts on smooth muscle to regulate interdigestive MMC (Auer J.A.).
When a horse is orally dosed, movement of a solid dosage form out into the small
intestine is dependent upon the stomach’s MMC phase at the time of dosing. The gastric
residence time, the amount of time the dosage form stays in the stomach, will vary from minutes
to hours depending on what stage the stomach is in when the form enters. This variability in
residence time may help to explain some of the intersubjective variation in absorption profiles.
For liquid dosage forms, the migrating motor complex does not apply as most of them are able to
empty during all phases of the complex (Florence).
Mixing movements are a result of smooth muscle contractions which narrow the lumen
of the intestine to facilitate the contact of ingesta with intestinal secretions as well as with the
surface epithelium where there is increased surface area to facilitate absorption. The mixing

24
movements will increase the contact area between drug and membrane, causing an increase in
rate of absorption (Auer J.A.; Florence).
After a meal, these peristaltic waves are increased as a result of the gastroenteric reflex
initiated by the distention of the stomach. This movement determines intestinal transit time and
pharmacologically dictates the drug residence time in the intestine. Residence time in the
gastrointestinal tract is important because it determines how long the drug formulation has in
order to release the active ingredient from the formulation state. Thus, the shorter the amount of
time it takes to move through the gastrointestinal tract, the less time the drug has to release.
Shortened transit time will significantly alter absorption of drugs that are poorly water soluble,
enteric or polymer coated dosage forms and sustained release forms.
The last portion of the small intestine, the ileum, is approximately 0.7 m long and is
marked by an ileocecal fold that attaches its antimesenteric side to the dorsal band of the cecum.
The arterial supply of the ileum is provided by the ileocecal artery which is a branch from the
cranial mesenteric artery. In horses, the primary responsibility of the cecum and large colon is to
absorb water and electrolytes as well as serving as the primary site of microbial digestion. In
microbial digestion, soluble and insoluble dietary carbohydrates are digested by microbial
enzymes with the production of volatile fatty acids. In contrast to humans, the colon is thought
to provide a good environment for drug absorption due to its mild pH, little enzymatic activity,
and long residence time. However, limitations of the colon include small surface area, relatively
viscous fluid like environment, and large colonies of bacteria (Auer J.A.; Florence).
Finally, the equine rectum, approximately 20-30 cm long, stretches from the pelvic inlet
to the anus. It has been found to be shorter in young horses and those with little body fat.
Venous drainage of the orad portion occurs via the caudal mesenteric vessels which directly

25
empty into the portal circulation. The distal portion of the rectum is drained by the internal iliac
or pudendal veins which flow into the caudal vena cava. After administration, drugs may be
absorbed across the epithelial cells (transcellular) or through the tight junctions that connect the
mucosal cells (paracellular). In humans, there is a risk of the drug formulation diffusing up from
the rectum into the small colon with an increased amount of fluid volume used in infusion. In
horses, however, this is less of a concern due to the increased physical length and size of the
rectal vault (Auer J.A.; Broome T.A.; d. B. van Hoogdalem E.J.).
Physiochemical Factors Affecting Oral Drug Absorption
Physiochemical characteristics involve the interaction between the dosage form and
anything that would alter the solubility, dissolution, or chemical stability within the
gastrointestinal tract. A drug must possess some aqueous solubility and membrane permeability
in order to enter the systemic circulation and exert a therapeutic effect on the patient. Biologic
membranes act as a lipid barrier to most drugs and allow lipid soluble drug molecules to be
absorbed by passive diffusion and lipid-insoluble substances to diffuse only with difficulty or not
at all. The primary properties influencing passive absorption across biological membranes are its
oil:water partition coefficient, pH of the fluid that it is dissolved in, and the active ingredient’s
molecular weight (Ansel; Boothe; Florence)
The oil:water patrician coefficient is the measure of a molecule’s lipophilic character.
With the exception of small, polar molecules, most compounds pass biological membranes
through the lipid membranes. The ability of the compound to traverse the membrane is based on
the atomic and molecular forces. The ability of a compound to move through a lipid and water
portions of the lipid membrane is based on the forces interacting with the solute in each area. If

26
the solute-water interaction is greater than the solute-membrane interaction, membrane
permeability will be relatively poor and vice versa. The ability of the molecule to move through
the membrane increases as the number of carbons and hydrogens within the structure increases.
With an increased carbon chain length, there is an increased ability of the compound to be
“pushed out” of the aqueous phase and into the cellular membrane.
The rate of diffusion of a compound across a membrane depends on the concentration
gradient across the membrane, the lipid:water patrician coefficient, and diffusion coefficient.
The diffusion coefficient is a function of molecular size, conformation, as well as degree of
ionization. Depending on which membrane the drug molecule is trying to cross, there is a
functional size and/or weight cut off that prevents a molecule from being absorbed across any
membrane. Membranes also favor non-ionized forms of drug molecules. The ionized form of
the drug will be completed prevented from crossing the membrane due to its low lipid solubility
(Ansel; Boothe; Riviere).
If a chemical candidate has two or more of the following, it is likely to have decreased
absorption capabilities: more than five hydrogen bond donors, more than 10 hydrogen bond
acceptors, molecular weight greater than 500, and a Log Ko/w greater than five. In these cases,
chemical modification of the drug into a salt or ester form is frequently used to increase
solubility (Ansel; Boothe; Florence).
Most drug molecules in development are either weak acids or bases and after
administration will to some extent be ionized depending on the drug molecule’s pKa (negative
logarithm of the acidic dissociation constant) and the pH of the biological fluid where it is
dissolved. The rate of penetration of a drug molecule is enhanced if the molecule is present in an
environment with a similar pH. Compounds are able to cross anatomic membranes if they are

27
present in their nonionized form due to nonionic diffusion. This happens when the pH of the
medium is equal to the pKa of the dissolved drug, and at this time 50% of the drug exists in the
ionized state and 50% in the nonionized, lipid soluble state.
Use of the Henderson-Hasselbalch equation enables the determination of the ratio of
protonated (H) to non-protonated molecules. From this, acidic drugs would be best absorbed
from acidic solutions where the pH is less than the pKa. In contrast, basic drugs would be best
absorbed from environments that are more basic such that the pH is greater than the pKa. When
the pH unit is one unit less or more than the pKa, there is tenfold difference in the ratio of
ionized to unionized drug molecules. In this phenomena, it allows for a drug to be differentially
distributed across a membrane in the presence of a pH gradient. Also, it has also been
hypothesized that there are different pH levels depending on the location within the lumen of the
intestine such as in the middle of the visceral structure the ingest may be a more basic than the
pH at the immediate surface of the intestinal membrane. This may be the reason why many
drugs which should be present in the ionic form are still well absorbed from the gastrointestinal
tract. The primary limitation that cannot be over looked is that ionized drug is also absorbed
albeit at a slower rate (Ansel; Boothe; Florence; Riviere).
Formulation Effects on Oral Drug Absorption
Not only do oral dosage forms provide a safe and convenient delivery mechanism for
administration of an active ingredient. Dosage forms are necessary because they: protect the
drug substance from environmental influences (humidity and oxygen), prevent degradation by
gastric acid, conceal the bitter, salty or offensive taste or odor, or provide a rate controlled
release from the products (Ansel). Many factors effect an active ingredient’s ability to be

28
absorbed in a patient’s body. How an active ingredient is formulated, meaning how the drug is
prepared for commercialization, takes three important factors into account: disintegration,
dissolution, and diffusion. Each of these factors directly influence how the matrix is broken
down and the active ingredient becomes liberated in order to be available to absorb into the
patient’s body.
Dissolution of a drug from its formulation is often the slowest process of drug absorption
and the rate is greatly affected by the pH of the environment within the lumen of the
gastrointestinal tract. The pH of the ingesta is important to consider as most drug formulations
are weak acids or bases and the aqueous solubility of these compounds are influenced by the rate
of dissolution from the dosage form. Drugs that are acidic in nature are more readily dissolved
in the basic environment of the small intestine in comparison to the acid environment of the
stomach. In contrast, drugs that have a basic pH will dissolve more readily in gastric fluid.
A variety of preparations using binding agents, disintegrants, various salts, or esters influence
where the formulation is degraded and dissolved in the gastrointestinal tract. Use of polymers
may also be used to coat granules or tablets that are designed to dissolve at a specific desired pH
which ultimately protects the drug from degradation in unwanted pH’s that will maximize
absorption profile for the drug (Ansel; Boothe; Florence; Riviere).
Physiological Factors Governing Oral Drug Absorption
Fundamentals of oral drug absorption include achieving drug concentrations in a rapid,
efficient manner such that the relationship between drug concentration in the body and the
magnitude of therapeutic response can be appreciated. Physiological factors include the time it
takes for the dosage form to pass through the tract (residence time) and blood flow to the

29
membrane. Items that affect the drug molecule moving across the membrane are: size of the
drug molecule, pH of the ingesta, characterization of the drug molecule, and presence of
molecules that can interact or bind the drug molecule (Boothe; Florence; Riviere).
Small, polar molecules (less than 500 Da) with an oil:water coefficient less than one are
able to move between cells lining the gastrointestinal cells through tight junctions. This is
known as the paracellular absorption.
The characteristics of aqueous gastrointestinal fluids will affect the drug dosage form as
well as the pattern of drug absorption. The first of these to consider is pH, which varies
considerably along the length of the gastrointestinal tract. Once released by the pylorus into the
duodenum, the pH of the ingesta rapidly increases due to the release of bicarbonate from the
pancreas that helps to neutralize gastric acid to avoid damage to the epithelial lining of
gastrointestinal tract. The bicarbonate also helps to prevent inactivation of the digestive enzymes
released by the pancreas as well as prevent precipitation of bile acids which are poorly soluble in
acidic pH. The pH gradually increases as the ingesta moves aborally. There are marked
differences in starting and ending point of pH depending on the species (Boothe; Florence;
Riviere).
Passive absorption requires no energy for transport of a drug molecule across a
membrane. This means that the drug components pass from the apical surface through the cell
and to the basolateral membrane. This is known as the transcellular route. The driving force of
diffusion across the membrane is the concentration gradient of the compound across the
membrane itself. This simply means that the rate of absorption should increase directly with an
increase in drug concentration in the gastrointestinal fluids This idea is best described by Fick’s
first law of diffusion where the rate of drug absorption is dependent on the membrane surface

30
area available for diffusion, thus more rapid absorption is achieved through the small intestine in
comparison to the stomach (Boothe; Florence; Riviere).
Drug movement by facilitated diffusion requires no energy, and does not move against
the concentration gradient. The drug’s structure resembles natural ligand in a manner that allows
it to bind to the carrier macromolecule and traverse the membrane. Pinocytosis is a process that
incorporates the drug into a lipid vesicle for carrier mediated transport into the cell cytoplasm
(Currie).
There are also active transport systems in the microvilli of the small intestine that are
responsible for nutrient absorption. In an active transport system, the drug’s chemical
configuration resembles a natural ligand allowing it to bind to carrier macromolecules and be
transported against the concentration at the expense of energy. A few therapeutic drugs (beta-
lactams) may be absorbed by this active transport system (Currie; Riviere).
Opposing drug absorption is a process that works to remove a drug compound from the
cell back into the lumen of the gastrointestinal tract. This process is known as “efflux transport”
and cells capable of this function are present in the epithelial cells of the gastrointestinal tract,
liver, lung, kidney, and brain. On these unique cells, there is a cell surface glycoprotein (p-
glycoprotein) or multi-drug resistance (MDR) protein that attaches to the drug molecule and
escorts it out of the cell and back into the lumen of the gastrointestinal tract. The efflux transport
process may be inhibited, induced, or saturated (Boothe; Florence; Riviere).
Epithelial cells that line the gastrointestinal tract are also very rich in metabolizing
cytochrome P450 (CYP450) enzymes responsible for phase I oxidative metabolism. CYP3A4 is
the most prominent isozyme of the CYP450 family present within the gastrointestinal
epithelium. Due to its minimal selectivity in substrates to process, it accounts for about 50% of

31
all drug-drug and nutrient-drug interactions. In many cases, CYP3A4 and p glycoprotein may
have similar substrates and their activity intermingled in such a manner that it is difficult to
attribute changes of an absorption profile to one mechanism or the other (Boothe; Florence;
Riviere).
Reduced availability of a drug product to systemic circulation can be due to the processes
of efflux transport and intracellular metabolism. Another significant factor affecting decreased
plasma drug concentrations is first pass metabolism. Drugs that are absorbed between the
stomach and proximal to the rectum enter the circulating blood stream and go directly to the liver
where biotransformation and metabolism of the drug molecule may occur. For drugs where
there is extensive metabolism of the molecule in this manner, absorption is significantly reduced
to the point of compromising efficacy of the drug (Riviere). In order to avoid the effects of first
pass metabolism, a product may be administered transmucosally – where the product is applied
to the mucosal membranes of either the mouth or vagina. Mucous membranes are highly
vascular, allowing rapid absorption across epithelium and entry into the systemic circulation and
avoiding the gastrointestinal environment as well as exposure to first pass metabolism (Currie).
In this situation, it becomes critical that the active ingredient is capable of passing through the
mucosal layer which may also be facilitated by the help of vehicles present in the formulations
used for application (Boothe; Riviere).
Drug-drug and drug-food interactions may alter drug absorption. Administration of food
with a drug may reduce the rate of drug absorption due to prolongation of the gastric emptying as
well as altering the viscosity of the ingesta which reduce the rate of dissolution and diffusion.
Also, food may bind to drugs or react with the gastric fluids secreted in response to the presence

32
of food. An example of this is would the reduction of drug absorption secondary to binding of
calcium cations when dairy is administered (Boothe; Florence; Riviere).
Depending on the formulation of the drug, the delay of gastric emptying and exposure of
the drug to the environment of the stomach may inhibit the performance of the drug formulation.
Content that is present within the gastrointestinal lumen may also affect absorption of the drug.
Intrinsic factors that influence the absorption of the drug include: enzymes secreted by the
pancreas, pancreatin and trypsin, can ligate various ester bonds within a drug molecule. Mucin,
a mucopolysaccharide that lines the intestinal epithelium, binds the drug compound and prevents
the absorption. Any delay in gastric emptying will delay dissolution, absorption, and time to
effect of the drug (Florence; Riviere).
Since the gastrointestinal tract is also an excretory organ for elimination of metabolic
byproducts and nonabsorbed solid wastes, some drugs may experience an increased absorption
due to enterohepatic recycling. In enterohepatic recycling, a drug from the systemic circulation
is excreted back into the intestinal tract through the bile and is then reabsorbed from the ingesta
back into the blood stream.
Rectal Absorption in the Equine Patient
As with oral absorption, pH, surface area, and luminal fluid content all play a role in
absorption of a formulation from the rectal cavity. In general, the rate as well as extent of drug
absorption are lower when comparing rectal administration to oral. When comparing anatomy
between the rectum and the small intestine, there is a relatively small surface area for the
formulation to be absorbed in the rectal vault when compared to the small intestine.

33
The ability of a rectally delivered drug formulation to disperse over the rectal mucosa is
affected by the surface area available for drug uptake or action, formulation be being a solid vs. a
liquid, or the components of the suppository (d. B. van Hoogdalem E.J.).
There are four possible methods for improving rectal absorption: addition of surfactants
non-surfactants, use of solvents or cosolvents, and use of solubilizing prodrugs. Addition of
surfactants has been shown to increase rectal absorption in humans; however, it also appears to
damage the rectal membrane which is not desirable in the patient. In equine practice, most of the
formulations used are a suspension or paste which is created by dissolving the oral product
(veterinary or human) in a variable amount of water (A.G. De Bower).
Absorption of a rectal drug formulation is dependent on many factors. First, the
molecular size of the drug as well as partitioning of the drug between the delivered formulation
and the rectal fluid is of key importance. Several dosage forms are available for rectal delivery
of drugs: suppositories (emulsion or suspension), gelatin capsules (solutions and suspensions)
and enemas which are quantified by macro (100 mL) and micro (1 to 20 ml). Formulations that
are aqueous or alcoholic solutions have a greater chance of being absorbed more quickly than
tablet or paste formulations (A.G. De Bower; H. D.-E. Corveleyn S.).
One of the benefits of administering drug products rectally is the potential for avoidance
of hepatic first pass elimination. In humans, three veins drain the rectum. One vein, the superior
rectal, drains the upper part of the rectum and feeds into the portal vein and finally the liver.
However, the middle and inferior rectal veins drain into the inferior vena cava. Therefore, as a
drug is absorbed from the rectum and into the middle and inferior veins, drug then is carried into
systemic circulation by passing the liver and avoiding first pass metabolism. Gut wall
metabolism following rectal administration of drugs has not been full elucidated; however; the

34
presence of enzymes within the gut wall does decrease in an oral to aboral fashion. Metabolism
of a drug formulation by luminal microorganisms may be an important factor to consider when
evaluating rectal presystemic elimination. Microorganism populations increase in numbers
moving in an aboral direction from the jejunum (A.G. De Bower; d. B. van Hoogdalem E.J.).
Inactivation of drug formulations by binding to fecal material has been suggested as a
potential cause for reduced bioavailability. In a study evaluating rectal administration of an
omeprazole paste, all horses defecated within the first two hours of treatment and there was
macroscopic binding of the paste evident on the fecal piles. These effects as well as a small
amount of drug dispensed into the rectum (5 mL) could have had a greater effect on drug
absorption (Rand C. Stanley).

35
Modeling Oral Drug Absorption in the Horse
Currently, there is not a “standard of care” for evaluating drug movement in the equine
patient. Pharmacokinetic studies evaluating oral administration in horses most commonly
involve administration of either a paste or liquid formulation. However, when these are
unavailable, a solid dosing form of the drug (tablet or capsule) is crushed or opened and
administered as a powder and administered: spread over grain, dissolved in a small volume of
water and then administered in a syringe, or as a large volume solution via nasogastric tube.
Pharmacologically, multiple factors can affect a drug’s ability to be absorbed. In humans,
studies have shown the volume in which a drug is administered markedly impacts the rate (time
to maximum drug concentration) and extent that it reaches systemic circulation (maximum
plasma drug concentration, area under the curve, and bioavailability). Depending on the
characteristic of the drug, absorption may also be affected by the presence or absence of food in
the stomach and small intestine (Neirinckx E.).
The Food and Drug Administration has implemented a Strategic Plan for Regulatory
Science which includes a major focus on predicting the behavior of orally administered drugs
through modeling. Among the models that should facilitate an understanding of the complex
interactions and processes that impact drug behavior are those based on quantitative structure-
activity or -property relationships. These models can guide experimental designs of hypothesis
driven research while reducing animal numbers and total study cost while improving the ability
to predict response to a drug among the varied populations (Doherty T.J.)
In support of these efforts, several studies have demonstrated that compounds can be
characterized by solubility and permeability properties. These models can be used to study the
influence of factors or predict how outside variables will alter oral absorption. The

36
Biopharmaceutics Classification System (BCS) is a predictive tool used to identify compounds
whose oral absorption may be sensitive to intrinsic (patient’s physiology – gastrointestinal tract,
blood flow, etc.) and extrinsic (food and formation) factors.
The classification system is as follows:
1. High solubility, high membrane permeability
2. Low solubility, high membrane permeability
3. High solubility, low membrane permeability
4. Low solubility, low membrane permeability
Class 1 Drugs: These drugs are both highly soluble and readily cross a membrane. In
this particular drug class, there is not an expected effect of food on the absorption rate of a
product. The onset or rate of the absorption may be delayed by the presence of food due to a
prolonged gastric emptying rate but food will not compromise the completeness of absorption.
Drugs that fall into this group are acetaminophen, nonsteroidal anti-inflammatory agents,
andvalproic acid.
Class 2 Drugs: Drugs present in this drug class are not soluble in an aqueous solution but
are still able to readily pass through membranes. In this particular group, anything that would
alter the dissolution rate would have an impact on the absorption of the drug. Changes in fluid
pH, volume and viscosity, as well as bile secretion would affect absorption. Consumption of
fatty meals would be expected to exert a significant beneficial effect on the absorption of the
drugs in this class. With the presence of a fatty meal, the gastric emptying would be delayed,
prolonging the time to maximum drug concentration. The drug would be more readily absorbed
due to the secretion of bile acids in response to the fat content. Also, due to the presence of
poorly water-soluble compounds, the secretion of surfactant and solubilizing properties would

37
enable absorption of the drug into the patient. Many drugs in this class; however, are substrates
for metabolism by CYP3A4 as well as efflux transporters.
Class 3 Drugs: Class 3 drugs are highly soluble in aqueous solutions but have poor
membrane permeability. The effect of food on the absorbance of these drugs are limited to
whether or not the food and food components would alter membrane permeability.
The updated Biopharmaceutical Drug Disposition Classification System (BDDCS) has combined
information about the elimination mechanism, the presence of gut transporter proteins and the
predicted effects of food on drug absorption.
Class 4 Drugs: Drugs in the final category have both low aqueous solubility and poor
membrane permeability and are considered as poor candidates for oral administration (Florence).
Application of this system has yet to be fully described in horses. As a first effort to
modeling oral absorption in the horse, the impact of the method and volume of delivery on drug
absorption must be established.1
Much of equine therapeutics reflects off-label (extra-label) use, with alternative routes or
drugs. Ideally, extra-label dosing regimens are supported by clinical research Determining
effects of oral drug administration has been key in developing appropriate models that predict
drug concentrations in animals and people. The effects of food, drug coating, and how the drug
is administered are the cornerstones in evaluating and modeling drug movement. In the horse,
oral administration either in a clinical setting or as part of research studies often varies depending
on the drug, the investigator, or the circumstances under which the drug is administered
(Hatanaka S.; Mizuta H.).
Like humans, the rate at which the equine stomach empties when exposed to the orally
administered fluid is highly dependent on the phase of the MMC, which is the electrical cycle

38
that controls gastrointestinal propulsion (Lammers T.). In people, small volumes of fluid (50
mL) do not exert an effect on the rate of gastric emptying. However, by increasing the amount
of fluid volume administered with a drug (200 mL), the rate of gastric emptying increases
regardless of the MMC (Clements J.A.; Oberle R.L). This relationship can ultimately affect the
bioavailability of a drug and may be critical for drug classes (Class 1 and Class 2) when rapid
dissolution and availability of the drug within the intestinal tract is limited by the rate of gastric
emptying (Hatanaka S.).
Acetaminophen, a centrally- acting analgesic and antipyretic, is a small (151.2 g/mol),
moderately lipid-soluble weak organic acid. It is classified by the BCS as a Class 1 model drug,
which indicates high solubility, high permeability, and an overall ease of absorption into
systemic circulation (Doherty T.J.; Hatanaka S.; Mizuta H.). Although poorly absorbed in the
stomach, acetaminophen is readily absorbed from the small intestine of dogs, rats, and ponies.
As such, a direct relationship has been found between rate of gastric emptying and serum
concentrations of orally administered acetaminophen in horses (Neirinckx E.). Absorption of
acetaminophen powder (dissolved in 350 mL of water) has proven an effective and safe marker
for gastric emptying in ponies after administration by nasogastric intubation (Clements J.A.).
Bioavailability, labeled as F in pharmacokinetic parameters, is the determination of the
extent of absorption in the body. Drugs that are administered intravenously are said to have
absolute systemic absorption since the drug is placed directly into the circulating blood volume
(Currie). Bioavailability only provides an estimate of the extent of absorption, it does not
however, characterize the rate of absorption of the drug into the circulating blood volume.
(Riviere).

39
Modeling Rectal Drug Absorption in the Horse
Modeling of rectal administration of drugs has not been performed in the equine patient;
however, multiple drugs have been administered in a rectal formulation in an effort to treat a
variety of different disease states.
Diazepam – The adequate treatment of status epilepticus is intravenous (IV) delivery of
an anticonvulsant. However, the technical problems associated with intravenous administration
of drugs during a seizure has led to evaluation rectal administration as a practical alternative (van
Hoogdalem 1991a).
Acetylsalicyclic acid (ASA) – Acetylsalicyclic acid (ASA) is nonsteroidal anti-
inflammatory drug (NSAID) that has antipyretic, analgesic, and potent antiplatelet properties.
ASA is used in people for the prevention and treatment of arterial thrombotic disease. In equine
practice, use of ASA was proposed for the treatment of equine disease that have arterial
thrombosis as a part of their pathogenesis such as endotoxemia, disseminated intravascular
coagulation, and thromboembolic coli. However, ASA is rapidly converted to salicylic acid
(SA) thru deacetylation via hepatic mechanisms and endogenous esterases. In horses, the half-
life of ASA after IV administration has been documented at 0.11 hours. In Broome’s study, after
a single rectal dose of 20 mg/kg to horses, a higher peak plasma concentration of ASA and
greater bioavailability was seen (Broome T.A.)
Ketoprofen – Ketoprofen [(+-) 2-(3-benzoylphenly) propionic acid] is a NSAID that has
been approved for use in people and horses for the alleviation of inflammation and pain
associated with musculoskeletal disorders (Corveleyn 1996). In people, rectal administration of
ketoprofen was considered to reduce the risk of gastrointestinal ulceration. The molecule itself
ketoprofen appeared to be absorbed well from the rectal vault with bioavailability approaching

40
oral values in normal adults receiving 75 mg in a fatty or gelatin encapsulated suppository.
Interestingly, both formulations showed a decreased absorption rate in patients undergoing
hemorrhoidectomy (d. B. van Hoogdalem E.J.)
In horses, one gram of ketoprofen was prepared in three different formulations: a
suppository (fatty and hydrophilic) base and a liquid suspension. The absolute bioavailability of
ketoprofen in horses after rectal administration of all three products was relatively low with a
high variability. This study was one of the first to describe the first evidence of clinical
effectiveness of rectal formulations (D. P. Corveleyn S.)
Metronidazole – Metronidazole (1-2 hydroxyethyl-2-methyl-5-nitroimidazole) is a
bactericidal antimicrobial agent used for treatment of anaerobic bacteria and protozoa. In
people, the oral bioavailability of metronidazole approaches 100% whereas rectal administration
approaches 70-80% with alterations in the formulation greatly affecting both the Cmax and Tmax
(d. B. van Hoogdalem E.J.). Metronidazole is also used for prophylaxis and treatment of
anaerobic infections in horses; however, in some cases, due to the concurrent issues affecting
gastrointestinal motility (ileus) or decreased patient compliance due to taste, metronidazole has
been administered rectally (Stein F.). Steinman evaluated the pharmacokinetics of
metronidazole after IV, oral and rectal administration (G. M. Steinman A.). Despite having a
significantly higher maximum plasma drug concentration after oral administration, there were no
statistically significant differences in mean absorption time or the time to reach maximum
plasma drug concentration. In this study, authors concluded that increasing the dose for rectal
administration was needed to achieve serum drug concentrations above MIC90 of the most
commonly treated microbes. When comparing the effects of rectal evacuation on metronidazole
absorption, there was not a difference of drug absorption between non evacuated and evacuated

41
horses. Thus, for metronidazole, it does not appear that the presence of fecal matter or
inactivation by binding affects drug absorption (Stein F.).
Omeprazole - In a study performed by Rand, a commercially available paste was used
for rectal administration of omeprazole to evaluate both the pharmacokinetic profile as well as
pharmacodynamic response (increase in gastric pH). In people, use of rectal omeprazole
suppositories resulted in a bioavailability comparable to that seen with oral formulations. In this
equine study, however, the paste had a tenfold decrease in AUC compared to oral administration
and only 33 % of treated horses showed an increase in gastric fluid indicating a
pharmacodynamic response (Rand C.).
Cisapride – Cisapride, a substituted benzamide, is related to metoclopramide but lacks
the antidopaminergic effects that act on the central nervous system. Cisapride promotes
gastrointestinal motility by enhancing the release of acetylcholine from post-ganglionic nerve
endings. In horses, cisparide has shown to not only restore but enhance motility of the entire
gastrointestinal tract, increase motility at the ileocecocolic junction, and coordinate gastric and
intestinal cycles in a post-operative ileus model (Steel, 1990). In human patients experiencing
post-operative ileus, cisparide has been shown to have prokinetic effects after rectal
administration. In people, orally administered cisapride tablets has a bioavailability of 40-50%.
In comparison, the rectal relative bioavailability has been shown to be 43% of oral
administration (Steel C.M.).
In seizing or obtunded horses, rectal administration of a drug may be necessary due to
altered mentation and safety concerns (Feary D.J.). In seizing horses, it is often difficult to
administer oral medications due to altered mentation and safety concerns. Medications such as
diazepam and metronidazole have been shown to be absorbed readily through the rectal mucosa

42
after administration per rectum in dogs and horses (Feary D.J.; Papich M.G.; G. M. Steinman A.)
In these patients, therapeutic drug levels necessary for seizure control have been achieved
through administering drugs per rectum at two to three times the oral dose recommended in
patients.
In this dissertation, zonisamide, a synthetic sulfonamide, approved for treatment of
epilepsy in people, was used in a pilot study to compare oral and rectal absorption of this novel
molecule in the equine patient. Zonisamide’s mechanism of action is diverse and includes:
blockage of voltage-dependent sodium and type T calcium channels, modulation of the
dopaminergic system, increasing GABA release from the hippocampus, and protecting neuronal
membranes from oxygen free radicals (Dewey C.W.; Boothe D.M.; Yaksh; Atli A.; Backonja).
Its therapeutic success in people has led to its use in companion small animals and birds (Papich
M.G.). With a half-life of 30-48 hours in canine patients, the drug can be administered at 12 to
24 hour intervals (Boothe D.M.; Dewey C.W.). If this long half-life were to occur in horses,
there would be sustained seizure control at convenient dosing intervals in comparison to
levetiracetam (recommended three times a day). In comparison, zonisamide has minimal side
effects that are limited to thyroid hormone suppression when levels are above the therapeutic
range.
In both routes of administration, the serum concentrations were lower than what was
expected in horses where the capsule was administered in an intact fashion, as has been studied
in humans and small animals. One of the limitations in this study as well as in equine practice is
the need to alter dosage forms in order to treat the patient. Further evaluation may need to be
done to look at methods to administer the whole capsules to horses in order to achieve a more
accurate indication of serum drug concentrations.

43
Distribution
In pharmacology, distribution determines whether a drug will reach the site of action at
high enough concentrations to create a biological response. The concentration of drug at the site
of target tissue reflects the total exposure of the patient to the drug. How far a drug is capable of
travelling within a body is dependent on four things;
a.) Physiochemical properties of a compound. This properties include the drug’s pKa,
lipid solubility, and molecular weight.
b.) Concentration gradient established between the circulating blood volume and the
target tissue. Tissues that are high in blood flow per unit tissue include: heart, liver,
kidney, brain, and the endocrine glands. Tissues that are medium blood flow are
muscle and skin whereas adipose tissue and bone have a low rate.
c.) Ratio of how much blood is delivered to the target tissue – In disease states where
patients are vascularly compromised due to blood loss, dehydration, or hemodynamic
imbalances, profusion to tissue sites may decreased.
d.) Affinity of the chemical to bind to the target tissue – If a chemical has a high affinity
and bonding capability for a tissue group, the drug will accumulate regardless of the
blood flow to the area. In these circumstances, it will take longer for drugs to reach
steady state as well as be removed from the body.
A drug may be distributed to three different compartments in the body. Each of these
compartments contributes to a certain percentage of the animal’s body weight – intravascular
(8%), interstitial fluid (20%), and intracellular (40%). Distribution to these areas is also due to a
variety of factors. For drugs that are limited to the intravascular space, this may be due to
binding of the drug to plasma proteins such as albumin (which bind weak acids) and alpha-

44
glycoprotein (which bind weak bases). Once a molecule has bound to plasma proteins, it moves
throughout the circulation until it dissociates and binds to either another biomolecule or a tissue
component. Of the chemical forces most important in plasma protein binding, noncovalent
bonding is of primary importance because it offers the ability of the drug molecule to dissociate
from the carrier protein. Displacement of one drug molecule from carrier proteins mean that
there is a higher concentration of free drug available for tissue absorption. When a second
molecule (drug or protein) is administered and provides competition for binding sites at the level
of the carrier protein, care must be taken by pharmacologists to acknowledge which of the
molecules is most likely to take over residence attached to the carrier protein and which will
have a larger portion of free drug available. The methods for quantifying protein binding are
evaluated both in vivo (ultrafiltration microdialysis, tissue cage) or in vitro (electrophoresis,
equilibrium dialysis, fluorescence, nuclear magnetic resonance) (Riviere; Auer J.A.).
Within the body, there are certain “protected sanctuaries” that are protected by the blood
brain barrier – which is a glial cell layer interposed between capillary endothelium and nervous
tissue. In the body, these sanctuaries are confined to brain, ocular, prostatic, testicular, synovial,
mammary gland, and placenta tissue. The only molecules that can penetrate the blood brain
barrier are those that are nonionized (Riviere).
Other factors that determine distribution despite protein binding are the route of
administration, molecular weight, rate of metabolism, polarity and stereochemistry of the
apparent compound or metabolic products, and rate of excretion.
Pharmacokinetic values that are of clinical importance are that of half –life and volume of
distribution. Volume of distribution (Vd) is defined as the extent of distribution of a compound
within a body. The equation for determining this is:

45
Vd = Dose (mg)/ concentration (mg/l)
In this equation, the calculated volume of distribution is proportionally constant relating the
determined plasma drug concentration to the administered dose. Usually, the volume of
distribution does not actually relate to the real volume of the compartments. It’s used as a model
to help understand the drug’s behavior in the body (Currie).
The second pharmacologic variable to be taken into account here is half–life. A drug’s
half-life is the amount of time it takes for half of the drug’s concentration to leave the body.
Drug’s with a short half usually have a very low volume of distribution meaning that they are
confined to the circulating blood volume such that they have continual exposure to the organs of
elimination. In contrast, drugs with long half-lives, often have large volumes of distribution,
travel to tissues farther away from the circulating blood volume and stay in the target tissue for a
longer period of time. This means that it will take a longer period of time for equilibration to be
reached, and a longer time for the drug to return from the tissue to the circulating blood volume
for elimination (Riviere).

46
Metabolism
In the equine patient, metabolism is necessary for the animal to rid itself of the drug
products administered to avoid adverse effects and tissue toxicity. The liver is responsible for
the majority of biotransformation of drugs from acting on target tissue to preparation for
clearance and excretion from the body. In concert with metabolism, the liver is also responsible
for the production of bile which in pharmacology is also a route of excretion.
Factors affecting the liver’s ability to perform the processes of biotransformation include
hepatic volume/perfusion rate, drug accessibility to and extraction by hepatic metabolizing
enzymes and the activity of the major drug metabolizing enzymes (Riviere).
The ability of the liver to remove a drug from blood is defined as hepatic clearance.
Hepatic clearance is based on two very important things: the amount of blood being supplied to
the liver, and the intrinsic amount of hepatic clearance of the drug. When evaluating the drug
extraction ratio (comparison of the internal clearance of the drug product to hepatic blood flow),
a ratio of 1 or greater, reflects clearance is dependent on the amount of blood that is entering the
liver. This means that the more blood that is passing through the liver, the more drug molecules
will be extracted by the liver for elimination. In the cases of high extraction ratios, these drugs
will also show significant first-pass metabolism after oral administration. In contrast, low
extraction ratios or metabolism limited drugs, are dependent on the internal clearance capabilities
of the hepatic tissues (Riviere).
Biotransformation of drug molecules occur most commonly through two phased reactions
that decreases the molecule’s lipophilicity and increases its water solubility as well as polarity to
facilitate excretion from the body.

47
Phase 1 reactions are responsible for introducing functional groups to drug molecules
through the process of conjugation. Phase 1 metabolism occurs through four major pathways:
oxidation, reduction, hydrolysis and hydration. The ultimate goal of Phase 1 chemical reactions
are to deactivate drugs or prepare the drug molecule for Phase II by introducing a chemically
reactive group. Traditionally, oxidative reactions have been considered most important because
they play a central role in how drugs are metabolized in the body. Oxidation reactions occur in
the hepatic endoplasmic reticulum and are mediated by the microsomal mixed function oxidase
system (cytochrome P450). An extensive amount of research has been performed on these drug
metabolizing enzymes due to their key roles in metabolizing such a high number of different
substances. Across species, the same enzymes are not involved in metabolizing the same drugs,
and often, substrate specifications overlap making the extrapolation difficult (Riviere).
Recently, equine CYP isoforms have been identified and named: CYP2D50, CYP2C92,
CYP3A89, CYP3A96, and CYP3A97 as well as their activity compared to human CYP2D,
CYP2C, and CYP3A isoforms. When comparing people to horses, lower activity of CYP1A,
CYP2A and CYP3A has been detected in horses. However, CYP2C, CYP2D, and CYP2E
activity appears to be increased in comparison to humans. Since the identification and
comparison of isoforms in different species and comparing activity across species is a relatively
new field of development, alterations in these conclusions may change over time (Scarth J.P.)
In people, 50% of known drugs are metabolized by CYP3A4 and CYP3A5. Comparative
analysis between the human and equine chromosome region showed that the equine genome
contains six highly similar genes and two potential pseudogene where as humans have only four
known functional CYP3A genes and two pseudogenes. The three CYP3As: CYP3A89,
CYP3A96, and CYP3A97 have been heterologously expressed in cells. In horses, the CYP3A89

48
was among the most highly expressed CYPs but variations between individual horses have been
appreciated to be high. From this, it was concluded that CYP genes of the same family show
high homology within and between species but can be polymorphic (D. S. Schmitz A.; Z. J.
Schmitz A.)
Phase II reactions, primarily involve conjugation reactions responsible for deactivation of
Phase I metabolites and non-modified parent compounds. The primary reactions present within
Phase II include glucuronidation/glucosidation, sulfation, methylation, and acetylation. Once
Phase II is complete, the molecule is destined for excretion (Riviere).
Several factors may contribute to a difference in drug metabolism between people and
horses. First of this is the diet consumed – people tend to be omnivores while horses are strict
herbivores. Anatomically, horses also have a substantially developed cecum that is responsible
for hind gut fermentation where microbial production and subsequent absorption of monoamines
could affect drug metabolism and physiological values. In horses, the storage capacity of the
spleen in times of inactivity as well as its ability to contract and release red blood cells into the
circulation during exercise and stress having the potential for massive changes in blood volume
resulting in implications for variations in the pharmacokinetics of drugs.

49
Elimination
Drug molecules can be eliminated in urine, bile, sweat, saliva, tears, milk, and air expired
from the lungs. However, the ultimate route of drug elimination from the patient’s body is
through the kidney. In general, the only drugs that are available for excretion from the body are
those dissolved in plasma or those that are not bound to circulating blood proteins. Drug
products that are dissolved in the plasma that are available for secretion first have been bio
transformed by the liver in order to create a more water soluble in order to participate in the
membrane transport system employed by drug movement in the kidney (Boothe).
In an effort to simplify renal anatomy and drug excretion from the body, we must look at
it as a twostep process. First, the circulating blood volume passes through the glomerulus which
acts a filtration unit to retain formed cellular elements (erythrocytes, white blood cells) and
proteins while allowing passage of plasma fluid into the remaining portion of the kidney. The
second step of excretion utilizes a system of segmented tubules to modify the contents of the
filtered plasma depending on the physiological needs of the individual. This includes balancing
fluid, electrolyte, acid-base, and regulation of systemic blood pressure. Drugs are excreted from
the kidney in three processes: glomerular filtration, active tubular secretion and/or reabsorption,
and passive flow dependent nonionic back diffusion. The additive effects of these steps
determines the ultimate elimination of the drug from the body (Boothe; Riviere).
Glomerular filtration is a bulk flow dependent unidirectional movement of drug removal
from the body. Only non-protein bound drugs are eliminated in this process. The rate of
elimination of the drug is dependent on the extent of drug protein binding as well as the
glomerular filtration rate. As the circulating blood volume passes through the glomerulus, it
must work through a system of barriers including Bowman’s capsule, the glomerular basement

50
membrane and the slit pores formed from epithelial foot processes that are arranged in an
overlapping manner. When there is glomerular pathology that compromises these barriers,
plasma proteins are not maintained within the circulating blood volume and are able to pass into
the tubules of the kidney and be excreted as well (Boothe; Riviere).
Active tubular secretion/absorption is an energy dependent, saturable, carrier mediated
process that is driven to either secrete drug products from the plasma into the tubule lumen or
from the lumen back into the circulating plasma volume. There are two separate pairs of
transport proteins which work together to create an overall polarity of tubular cell function and
moderate the flow of molecules. The first is located – on the cell’s brush border, along the
luminal aspect, while the second is located along the basolateral membrane adjacent to the
interstitial space where plasma fluid is located. The primary ion that regulates renal function and
drives ion movement and transport within the renal tubules is sodium. Proximal tubule cells
have a high density of mitochondria to generate adenosine triphosphate (ATP) to help fuel the
sodium-potassium ATPase-coupled transport system near the basal aspect of the cell. Depending
on which transport proteins are active, these pumps will affect if drug molecules are being
actively absorbed or secreted. Due to the high level of oxidative metabolism required to drive
these pumps, if there is a decrease in perfusion to the kidney that leads to hypoxic or anoxic
conditions significant damage to the function of the organ may be seen. In secretion, energy
coupled transport at the basal aspect of the cell generates a buildup of intracellular drug
concentration which is then transported into the tubular fluid by concentration-driven facilitated
transport carriers. In reabsorption, the basolateral active pumps create a low intracellular
concentration gradient which promotes facilitated carrier-mediated transport back through the
brush border tubular membrane. The limited capacity of these carrier-mediated processes means

51
that above certain drug concentrations, transport will proceed at a maximal rate independent of
the concentration in blood. Also, drugs and other endogenous substrates may also compete for
these transport sites causing a competitive inhibition effect (Boothe; Riviere).
Nonionic passive reabsorption, also known as back diffusion, is a process dependent on
the urine flow rate, the lipid solubility of the nonionized drug moiety, and urine pH. At low
urine flow rates and high concentrations of the drug in the urine tubular fluid, the diffusion
follows a concentration gradient back into the interstitial fluid. Drugs that are polar or have low
lipid solubility are not affected as they cannot pass the lipid membrane.
Clearance, the maximal rate at which a body can clear any drug is controlled by blood
flow to the respective clearing organ where complete extraction occurs. For whole body
clearance, it is the summation of the clearance of each organ – renal, hepatic, and other (Boothe;
Riviere).

52
Chapter 2. Fundamentals of Pain Perception and Transmission in the Equine Patient
“It’s a beautiful day to save lives. Let’s have some fun.”
– Grey’s Anatomy
Effects of Pain
As a veterinarian, our oath declares “first, do no harm” however; practicing medicine
means balancing a patient’s state of pain, disease, or systemic compromise with the appropriate
treatment needed to save a life. The first twenty four hours after any surgery is the most critical.
In order to ensure the best outcome for the patient, an extensive knowledge of the patient’s
physiology, pain level, as well as pharmacology of the prescribed drugs is a necessary
requirement. Once the last suture is placed to close the incision, the surgeon by default becomes
a pharmacologist, selecting drugs that will support, manage, and repair the trauma that has been
done to the patient. In the equine patient, pharmacologic interventions for managing both
somatic and visceral pain are limited due to formulations available, cost of administration, and
potential long term adverse events. Equine athletes who compete in regulated events pose a
unique situation where selection of medications to treat pain and inflammation are narrowed due
to concerns of performance enhancement or increased risk of harm to either horse or rider. Due
to these limitations, focus within the field has been driven to evaluate novel analgesics that
moderate the pain pathway while limiting risk of adverse events.
Potential causes of acute pain, felt within 0.1 second, are highly variable and can extend
from environmental stimuli, trauma, surgery, acute medical conditions, as well as normal

53
physiologic processes. Pain of short duration alerts an animal to potential injury and shifts focus
to adapt to survival and signal to stop using injured tissues and promote healing. Responses to
acute pain are usually a quick change in behavioral action and resolves without significant
disruption in homeostasis. Clinical signs associated with acute pain are typically seen in the
following body systems: neurologic (excitement, confusion, tremors, rigidity, and weakness to
immobility), cardiorespiratory (hypertension, tachycardia, tachypnea, vasospasm, and venous
stasis), and gastrointestinal (hypo or hypermotility, urinary retention, sweating, and
hyperthermia). In most cases, acute pain resolves and hemostasis is restored (Guyton A.C.;
Smith).
Unlike acute pain that resolves quickly, extensive tissue injury or disease results in pain
signaling that persists for a day to weeks. Slow pain is characterized by slow burning, aching,
and throbbing. Chronic pain is associated with clinical signs of both allodynia and hyperalgesia.
Allodynia is the production of pain by a stimulus that previously was not painful. On the other
hand, hyperalgesia occurs when previously painful stimuli produce pain of greater magnitude,
duration, or area. Peripheral hyperalgesia occurs at the site of injury and is mediated by
inflammatory mediators such as prostaglandins (mainly PGE2) and leukotrienes (LTB4).
Persistent inflammation may recruit previously inactive neurons or silent nociceptors that are
quiescent in normal tissue. These mediators, together with bradykinin and histamine, cause
nociceptors to be hyper responsive to noxious stimuli. Substance P and norepinephrine release
from adjacent nerves amplify pain signaling and recruit other nerves to become active as well.
In chronic pain, central signaling mirror the peripheral effects seen since they use many of the
same neurotransmitters. Release of substance P and glutamate/aspartate from the intraspinal
terminals of the nociceptors activate the neurokinin 1 (NK-1) and n-methyl-D-aspartate (NMDA)

54
and α-amino-3-hydroxy-5-methyl-4-isoxozolepropionic acid (AMPA) receptors in the dorsal
horn and lower the response threshold of second order dorsal horn neurons (Smith).
Peripheral fibers triggered in peripheral slow-chronic type c pain fibers terminate in
Laminae II and III of the dorsal horns. Signaling then passes through one or more short fiber
neurons within the dorsal horn before entering Lamina V, joins the fast pain pathway, and passes
through the anterior commissure to the opposite side of the cord upward to the brain in the
paleospinothalamic pathway. Ten to 25% of this pathway terminates in the thalamus while the
remainder terminates in the reticular nucleus of the medulla and pons, the tectal area of the
mesencephalon deep to the superior and inferior colliculi, and the periaqueductal grey region.
From the brain stem, the pain signals are transferred upward into the intralaminar and
ventrolateral nuclei of the thalamus into the hypothalamus. Due to this diverse pathway of
signaling, localization of pain is poor (Guyton A.C.; Smith).
Chronic pain also initiates systemic changes such as modifications of behavior,
reproductive capabilities, activity, and food consumption. Clinically, practitioners may see
depression, inappetence, weight loss, as well as reduced growth or milk production. Chronic
pain also stimulates the release of cortisol, catecholamines, and renin which impair normal
cardiovascular function and contribute to hypertension (Smith).
Endogenous inhibition of pain signaling consists of a group of descending neurons from
the hypothalamus, midbrain periqueductal gray, rostral ventromedial medulla and the
dorsolateral pontine tegmentum. Together these structures influence activity in the pain sensitive
spinothalamic tract as well as the dorsal horn. Of this grouping of mediators, the periaqueductal
grey acts as the command center for modulating pain. This occurs through encephalin activation
of the pre and post synaptic inhibition of opiate receptors. Enkephalins are small, short acting

55
peptides that bind to opiate receptors and mimic the actions of morphine. By activating the
receptor, the calcium channel in the nerve terminal’s membranes is blocked preventing the
release of the transmitter at the synapse in presynaptic nerves and decreased ability to transmit
the nerve signaling in post synaptic situations. Enkephalin blockade may occur for minutes to
hours. Once the periaqueductal grey is activated there is subsequent stimulation of the rostral
ventromedial medulla. The rostral ventromedial medulla releases serotonin from its terminals in
the dorsal horn of the spinal cord. Serotonin then stimulates specific dorsal horn interneurons
that contain encephalin. Once released, enkephalins act on opioid receptors located on pain
responsive neurons in the spinal cord. Prompting of these specific neurons inhibits the pain
responsive cells causing them to be less excitable by nociceptive signals from the peripheral
signaling. In coordination with this, norepinephrine is released form the pontine tegmentum
where it acts on the alpha-2 pain receptors on pain sensitive neurons of the dorsal horn causing
inhibition of the pain signaling (Guyton A.C.; Smith).
Management of pain signaling is not only a centrally activating event. At the time of
injury, A-delta and C-polymodal fibers transmit the nociceptive signals of noxious stimulus.
However, when an animal licks or rubs at a fresh wound, large diameter A-beta mechano
afferent fibers at or near the site of injury are activated. Signals from all fibers converge on the
common spinothalamic tract cells. The large A-beta fiber is thought to activate an inhibitory
interneuron and dampen/close down the gate of pain signaling being delivered by the
neighboring receptors (Smith).

56
Somatic Pain
Pathway and Transmission
Somatic pain can be subdivided into three main types: superficial, deep somatic, and
visceral. Superficial pain is cutaneous, well-localized, constant, and may follow the distribution
of somatic nerves. Deep somatic pain is defined as diffuse, dull, poorly localized, and periodic
eliciting a more pronounced autonomic change. Lastly, visceral pain also called deep or pain is
derived from rapid distention, ischemia, high luminal pressure in any viscus, or pulling on the
root of the mesentery (Smith).
Sensory reception of noxious or injurious stimuli is detected through neurons that have
nociceptors, with free, unmyelinated nerve endings. Nociceptors exist in muscles, skin,
periosteum, internal organs, tooth pulp, cornea, and meninges and serve to warn animals of
imminent or ongoing tissue injury that should evoke protective reflexes and behavioral pain
responses. The rate of tissue damage also serves as a stimulus for pain such that the intensity of
pain is closely related to the rate of tissue damage from causes ranging from ischemia, infection,
or contusion. This correlation is due to the local increase in potassium ions or proteolytic
enzymes that attack nerve endings by making the membranes more permeable to ions. In cases
where tissue ischemia is occurring, tissue becomes painful within minutes due to a drastic
increase of lactic acid around the nervous tissue (Guyton A.C.; Smith)
Nociceptors are divided into two classifications: A-delta and C-polymodal. A-delta
fibers respond to deforming mechanical stimuli (such as tissue compression and nitric oxide
(NO) release from tissue damage. These fast-sharp pain signals are transmitted in bursts of 6-30
m/second. They do not respond to excessive temperatures or chemicals unless they have already

57
been sensitized for some reason. Structurally, A-delta fibers are small in diameter, myelinated,
unimodal and have a high threshold (Guyton A.C.; Smith).
C-polymodal nociceptors respond to thermal damage (temperatures greater than 45°C),
noxious chemicals (caustics, acids, bases, hypertonic solutions) as well as inflammatory
mediators (bradykinins, histamine, prostaglandins, serotonin, acetylcholine, proteolytic
enzymes). C-polymodal fibers are also small diameter, however, they are unmyelinated, and
have slowly conducting fibers. Interestingly, prostaglandins as well as substance P enhance a
neurons sensitivity to pain but do not directly excite them (Guyton A.C.; Smith).
Axonal conduction along either an A-delta or a C-polymodal nerve fiber occur in the
same manner. Without stimulation from the nociceptor, the nerve is at rest. When the nerve
experiences a suprathreshold stimulation, a localized change occurs in the permeability of the
axonal membrane. This change, an action potential, is an increased permeability of the nerve
fiber to sodium in relation to potassium. Sodium moves into the nerve along its current and the
membrane potential becomes positive. This action potential is self-propagating, short-lived, and
propagated along the axonal nerve fiber. Once the action potential reaches the nerve terminal,
calcium moves from the superficial membrane or interstitial space and binds to the axonal
terminal which triggers discharge of the neurotransmitter from vesicles into the junctional cleft.
Once the neurotransmitter is released; the mediator then binds to its corresponding receptor on
the post synaptic membrane. After the neurotransmitter has completed its signaling, it can be
taken back up into the nerve terminal, it may diffuse away from the receptor site, or undergo
metabolism by the appropriate metabolizing enzyme (Riviere).
Depending on what neurotransmitter is released, there may be two effects it has on the
post-synaptic nerve. If the neurotransmitter is excitatory, it will trigger a general increase in

58
permeability of the post-synaptic membrane to all ions. This stimulates an action potential to be
conducted along the remainder of the nerve fiber. However, if the neurotransmitter was
inhibitory in nature, the membrane will become only selectively permeable to smaller ions such
as potassium and chloride. The outward movement of potassium from the nerve fiber in
replacement for chloride will increase the net charge within the nerve fiber. In this state, the
nerve fiber is hyper polarized, meaning that the threshold to stimuli will be increased and inhibits
the response of the corresponding cell (Riviere).
Once a noxious stimuli is transduced by A-delta and/or C-polymodal nociceptors, the
signals synapse with the dorsal horn of the spinal cord using glutamate as a neurotransmitter in
several laminae depending on the detected information. Lamina 1 (marginal zone) is the most
superficial layer and receives both A-delta and C-polymodal fibers that carry both pain and
temperature information. Here, they excite second order neurons of the neospinothalamic tract.
Lamina II (substantia gelatinosa) consists mostly of interneurons that integrate information from
A-delta and C fibers from Lissaur’s tract to coordinate signally. Lamina III and IV integrate the
pain signaling from both warm and cold stimuli. Lamina V and VI are both critical for pain
processing and modulation. These lamina receive information from both thermal and
mechanical sensitive nociceptors and project information directly to the thalamus and brain.
Within this lamina, there is also receipt of input from the descending brainstem pathways to help
modulate pain signals. Once the transmission is received in one of these lamina, long fibers
cross to the opposite side of the cord through the anterior commissure and pass upward in the
anterolateral columns (Guyton A.C.; Smith).
Pain signals from the spinal cord to the brainstem or brain are transmitted by the dorsal
column pathway and the spinothalamic tract. The dorsal column-medial lemniscus pathway

59
carries information about touch, pressure, and pain. Within this pathway, some nociceptors
travel directly to the brainstem via this tract to have a rapid feedback between the periphery and
brain. Cells from the spinothalamic tract originate from the Lamina V and carry information
about temperature, touch, and pain. Also, cells from the spinothalamic tract do not synapse with
the brainstem, and instead innervate the ventral posterior and other nuclei of the thalamus
(Guyton A.C.; Smith).
At the level of the thalamus, the lateral thalamus is involved in the discriminative sensory
component of pain while the medial aspect mediates the emotional and motivational aspects of
pain. Most of the spinothalamic pathways terminate in the ventrobasal complex along with the
dorsal column (Guyton A.C.; Smith).
Painful stimuli also activate the subcortical regions of the periaqueductal gray,
hypothalamus, amygdala, and cerebellum. In some cases, activation of insular and cingulate
cortices may also occur; however, these areas also receive stimulus from the thalamus (Smith).
Autonomic, emotional, and motor responses of pain are species-specific. Cerebral cortex
activation plays a central role in interpreting the quality of pain – even though pain
perfection/location might be a function of lower centers. In horses, the most common
appreciated motor responses to pain include moaning, grunting, squealing, changes in facial
expression as well as aggression. Responses to pain are not only limited to outward effects of
pain. Nociceptive activation of the ventral medulla results in increased heart rate, respiratory
rate, and blood pressure. Activation of the hypothalamus causes a release of vasopressin and
adrenocorticotropic hormone (ACTH) which directly affect hemodynamics as well as blood
glucose concentration. Activation of the reticular formation enhances a sense of vigilance and
attention to surroundings. Finally, once the periaqueductal gray is active, there is a recruitment

60
of an endogenous descending pain suppression system. Through this mechanism, attempts are
made to modulate the intensity of painful stimuli at the level of the spinal cord (Guyton A.C.;
Smith).

61
Models of Equine Somatic Pain
Due to the high incidence of lameness in the equine patient as well as the need to control
pain immediately after surgery, there is a constant demand to develop effective treatments for
pain in the equine patient. When developing a research model, a few important factors must be
kept in mind. First, the model must mimic the actual disease that is being developed, it needs to
be repeatable between studies with minimal variation, it must create persistent pain that allows
therapeutic interventions to be evaluated, and it must be reversible in nature such as to preserve
animal welfare (McClure S.R.). Equine pain models have involved application of noxious
stimuli which may be reversible or non-reversible depending on the pathology being evaluated.
These models fall into categories surrounding what type of noxious stimulus was applied.
Currently, the most commonly used models of permanent and transient models of lameness
include use of either chemical injection of a noxious substance, induced mechanical pathology,
or transient application of mechanical discomfort.
Intra articular administration of various chemicals have been found to cause a transient
lameness associate with acute synovitis that allows for gait evaluation as well as therapeutic
intervention. Chemicals evaluated have included botulinum toxin type A and B, endotoxin
(LPS), and recombinant interleukin-1β, (DePuy T.; Gutierrez-Nibeyro S.D.; Khumsap S.; Nelson
B.B.). Depending on the type of substance injected, the duration of activity and subsequent
evaluation is variable.
For osteoarthritis, the use of creating an irreversible osteochondral fragment model
within the selected joint (carpus most frequently used) has become popular for evaluating the
effects of therapeutic interventions (Donnell J.R.; Nixon A.J.). Since this is an irreversible
model, this allows for evaluation of both acute as well as chronic therapeutic interventions.

62
Models of transient lameness induction have involved a variety of techniques including
use of a modified horse shoe that allows for application of sole pressure with a 10 mm diameter,
blunt ended, headless set screw. Depending on the study’s objective, the location of the set
screw is varied and tightness of the set screw allows for pressure application. This model has
been used over shorter periods of time (2-9 hours) to follow responses to therapy. (Hoerdemann
M.; Merkens H.W.; S. J. Schumacher J.).
Wilgenbusch demonstrated that using a circumferential stainless steel pipe clamp
measuring 450, 500, 550 mm in diameter fit over both freshly trimmed fore feet would create a
transient lameness. After baseline measurements were taken on a force platform, the clamps
were applied and adjusted until achieving a subjective AAEP lameness score of 2.5/5. Clamps
were left in place for a total of 120 hours and then released. Serial force platform data was taken
until gait returned to normal. Force platform analysis was performed using a 0.9 m x 0.6 m
biomechanical stationary platform (BP6009000; Advanced Medical Technology, Inc.,
Watertown, MA) placed in the center of a walkway. Five photoelectric cells spaced 0.5 m apart
at the level of the shoulder were used evaluate the velocity as well as acceleration. The whole
study was then repeated on the contralateral forelimb. McClure went on to validate this method
titrating the pressure applied to the clamp until an objective asymmetry index between 25-30%
was appreciated. After 120 hours, clamps were released and serial force platform data was
recorded until the horse returned to soundness. McClure used application of a diclofenac
ointment as treatment effect when challenging his model. This model created a consistent
lameness that provided successful evaluation of a therapeutic intervention (McClure S.R.). By
keeping the clamp in place for five days, the model created a prolonged, quantifiable lameness
that allowed for evaluating interventions for chronic pain (Wilgenbusch C.).

63
Visceral Pain
Peritoneal Embryology, Anatomy, and Physiology
The lateral mesoderm is the embryonic origination of the peritoneal cavity. In
development, the intermediate mesoderm splits and gives rise to the somatic (parietal) and
splanchnic (visceral) mesoderm. The somatic mesoderm is a contributing part of the body wall,
pelvis, and diaphragm while the splanchnic mesoderm remains closely associated to the
endoderm and becomes integrated in the wall of the internal organs. The coelom becomes the
space enclosed by the somatic and splanchnic mesoderm. This space becomes a closed sac in
male horses; however, it communicates with the external environment in females via the
fallopian tubes. The diaphragm serves as the separation between the pleural and peritoneal
cavity (Slatter; Smith).
Both the somatic and splanchnic mesoderm becomes the mesothelial lining of the
peritoneal cavity. This lining is composed of a single layer of mesothelial squamous cells resting
on a basal lamina attached to connective tissue layer. The connective tissue of the peritoneal
cavity contains collagen and elastic fibers that allows for motion of the peritoneal cavity. To
minimize friction, the mesothelial cells are coated with a thin serous film. The somatic
peritoneal lining receives arterial supply from the lower intercostal, lumbar, and iliac vessels
while the venous drainage is managed by the caudal vena cava. Spinal nerves supplying the
abdominal wall innervate corresponding locations on the somatic peritoneum while the phrenic
nerve supplies areas overlying the diaphragm. Irritation of the parietal peritoneum is perceived
as somatic pain which is conducted centrally by the visceral autonomic nervous system. In
contrast to the parietal peritoneum, the splanchnic (visceral) peritoneum does not contain pain
receptors (Smith).

64
The peritoneal cavity is defined as the potential space between the parietal and visceral
peritoneum. The mesothelial cells that make up the lining of the peritoneal cavity produce the
peritoneal fluid as well as surfactant. Surfactant acts as a lubricant to enable the abdominal
viscera to move freely around each other as well as with the movement of the abdominal wall.
Mesothelial cells lining the abdominal cavity are an abundant source of plasminogen activator
which is responsible for normal fibrinolytic activity on the peritoneal surfaces (Slatter) (Smith).
Peritoneal fluid, a dialysate of plasma, is clear to pale yellow and is under constant
production and absorption to maintain a colloid osmotic pressure of 28 mmHg with a nonlinear
relationship between pressure and peritoneal protein concentration (3 g/dL). Under normal
conditions, the peritoneal fluid is relatively acellular, with macrophages being the predominant
cell type present (Latimer K.S.; Sammour T.; Slatter; Smith).
Defenses to the inciting cause of injury rely on the innate immune system as well as other
mechanisms to absorb and localize trauma. The initial reaction to any inflammatory stimulus to
the peritoneal cavity is the release of histamine, serotonin, and prostaglandins from the resident
peritoneal macrophages and mast cells. In response to the histamine and serotonin, there is
vasodilation and increased vascular permeability of the peritoneal vasculature leading to
transudation of fibrinogen rich plasma into the peritoneal cavity.
Peritoneal macrophages also stimulate neutrophil chemotaxis via direct and indirect
pathways. Macrophages release TNF- and IL-1 to stimulate peripheral neutrophil margination
and degranulation, and alter vascular endothelium to promote further leukocyte adherence and
recruitment into the peritoneal cavity. Disruption of the cellular membrane results in
phospholipid products being produced and activation of the inflammatory (arachidonic acid)
cascade leading to increased prostaglandin production.

65
Activation of the extrinsic coagulation pathway, humoral opsonins, antibodies, and
complement (C3a and C5a) further serve to enhance the inflammatory response and stimulate
neutrophil chemotaxis and degranulation of basophils and mast cells. Humoral opsonins coat the
bacteria and promote phagocytosis. Peritoneal associated lymphoid tissue produce
immunoglobulins. Activated T lymphocytes and local antibody production are key in the local
immune response as well (Latimer K.S.; Sammour T.; Slatter; Smith).
During times of effusion, mesothelial cells readily exfoliate, undergo hypertrophy and
hyperplasia, and display characteristics of anisocytosis and anisokaryosis. In their activated
state, activated mesothelial cells may also be difficult to distinguish from macrophages
(Latimer). Disruption and/or loss of the mesothelial cells lining the peritoneal cavity cause a
release of tissue thromboblastin which reduces the fibrinolytic capabilities of the peritoneal
surface shifts the fibrinolysis-coagulation equilibrium. This shift toward fibrin formation aids to
the seal the defect, provide framework for the fibroblasts to lay down collagen, as well as
produce fibrous adhesions to localize bacteria. Disruption in fibrin clearance from the peritoneal
fluid leads to development of fibrin clumps within the peritoneal cavity which occlude the
peritoneal stomatas and impede movement and clearance of fluid and particles. Clumping of the
fibrin also sequesters microbes from defense exposure, seals off any defects in the bowel wall,
and acts as the first step in the process of fibrous adhesions (Davis; Latimer K.S.; Olivier van
Till J.W.; Smith).
If the inflammatory defense response resolves, the mesothelial lining is restored in short
order. Within four hours of injury, round cells of uncertain origin cover the traumatized area.
The origination of mesothelial cells has not been fully determined; however, thoughts are that
they differentiate from fibroblasts in subperitoneal connective tissue or implant from adjacent

66
normal structures or free-floating peritoneal macrophages. Once the peritoneal lining has been
returned to homeostasis, normal fibrinolytic activity of the mesothelial cell returns and initiates
removal of the accumulated fibrin clots (Smith).
Bacterial contamination is capable of spreading throughout the entire peritoneal cavity
within three to six hours due to contractions of the abdominal wall, diaphragm, and intestine
(Davis). During respiration, peritoneal fluid is cleared from the abdominal cavity through
stomata between mesothelial cells covering the diaphragm into unidirectional lymphatic lacunae.
The diaphragmatic lymphatics drain into the mediastinal lymph nodes, thoracic duct, and finally
to the systemic circulation. Particles less than 10 m in diameter are rapidly cleared from the
peritoneal cavity (bacteria are 0.5-2.0 m and red blood cells are 7-8 m in diameter) and appear
quickly in systemic circulation and in the lungs. In dogs, finely particulate graphite administered
into the peritoneal cavity could be observed in the diaphragmatic lymphatics 10-90 minutes after
injection. Factors that affect particle movement from peritoneal fluid into systemic circulation
include: gravity, respiratory and diaphragmatic movements, intestinal activity as well as
intraperitoneal pressure (Auer J.A.; Slatter; Smith).
Commonly, septic peritonitis is characterized by peritoneal fluid >5,000 nucleated cell
count (NCC)/µL of which an increased number of degenerate neutrophils, > 2.5 g/dL total
protein, and microscopically visible bacteria (Hunt E.; Malark J.A.; Reed; Southwood L.).
Diffuse septic peritonitis in horses has been associated with abdominal abscesses, gastrointestinal
ruptures, rectal tears, full thickness gastroduodenal ulcers, accidental intestinal puncture during
abdominocentesis, and anastomotic leakages (Arnold C.E.; Chase J.P.; Elce). Peritonitis is one
of the most common fatal post-operative complications following colic surgery with a 46%
survival rate (Auer J.A.; Gray S.N.). In association with these pathologies, bacteria gain access

67
to the peritoneum and initiate an inflammatory response. The most common organisms cultured
from septic peritoneal fluid in the horse are: Escherichia coli, Klebsiellla aerogenes, and
Streptocoocus faecalis (Dyson; Shearman D.J.).
Visceral pain relies on neuronal signaling from the autonomic nervous system. Which is
composed of both the sympathetic and parasympathetic nervous systems. Most organs are
innervated by both systems which help to mediate the control (Riviere).
In brief, the sympathetic nervous system originates from cell bodies localized within the
intermediolateral columns of the thoracic and lumbar regions of the spinal cord. The
sympathetic nervous system, or the sympathoadrenomedullary axis, monitors the moment to
moment of the body and maintains hemostasis. However, it is also the key originator of the
“fight or flight” stimulation when mass, coordinated action is needed during times of danger or
stress. The adrenal medulla is a key component of this system. It is homologous to a
sympathetic ganglion in the periphery, however, it houses secretory chromaffin cells that release
epinephrine and norepinephrine. The adrenal medulla is innervated by pre-ganglionic fibers
from the mid-thoracic spinal cord. For the rest of the sympathetic nervous system, cell bodies
exit the cord within the bilateral, ventral nerve routes and enter the paravertebral chain of
sympathetic ganglia. These prevertebral ganglia are located in the peripheral tissues and are
grouped according to their location. The cranial, middle, and caudal cervical prevertebral
ganglia provide fibers to the head and neck whereas the thoracic cavity is supplied by the
cervical and anterior thoracic ganglia. Abdominal sympathetic ganglia supply fibers to the
abdominal cavity and pelvic viscera (celiac, cranial mesenteric, caudal mesenteric).
Neurotransmitters within this system include use of acetylcholine at the level of the ganglion and

68
norepinephrine at the post ganglionic effector cell. Due to the release of norepinephrine post
synoptically, the sympathetic nervous system is known as “adrenergic” (Riviere).
In contrast, the parasympathetic nervous system, also known as the cholinergic or
craniosacral outflow, originates in the midbrain, medulla oblongata, and sacral spinal cord.
Different from the overall homeostasis provided by the sympathetic nervous system, the
parasympathetic pathway is not organized for mass action. Instead, it regulates localized organ
changes and reacts to generate and maintain biologic energy. The vagus nerve is the most
important participant in the parasympathetic trunk. It originates from the medulla oblongata and
with efferent fibers running to all thoracic and abdominal viscera. Within the sacrum, nerve
fibers originate from the sacral spinal cord and terminate in the ganglion cells located in the
colon, bladder and sex organs. Contrasting to the sympathetic nervous system, the
parasympathetic nerves have a discreet discharge and affect specific effector organs. Unlike the
adrenergic system, the parasympathetic also uses acetylcholine as a neurotransmitter both at the
ganglion as well as the postganglionic effector cell (Riviere).
Integration of the autonomic nervous system is crucial. Afferent fibers as well as brain
nuclei influence peripheral motor function. Afferent fibers transmit information concerning
visceral pain, cardiovascular activity and respiration from the peripheral receptive areas to the
central nervous system. These fibers are non-myelinated and pass into the central nervous
system using autonomic nerve trunks such as the vagus cranial nerve and the pelvic nerves.
Afferent fibers provide signaling predominantly to the hypothalamus which then modulates both
sympathetic and parasympathetic outflow. The hypothalamus is primarily involved in the
function of blood pressure, body temperature, carbohydrate metabolism, electrolyte balance,

69
sexual responses, emotions and sleep. The medulla oblongata integrates the signaling from
hypothalamus to help regulate blood pressure and respiration (Riviere).
As has been stated, viscera have many different types of sensory receptors. The
parenchyma of the liver and lungs are insensitive to pain; however, the liver capsule as well as
the bronchi and parietal pleura of the lungs are extremely sensitive to pain. What is interesting
though is that highly localized damage to the viscera seldom cause severe pain. However, any
stimulus that causes diffuse stimulation of pain nerve endings throughout a viscous structure
(occluding the blood supply to a large area of intestine) causes pain that can be severe. All true
visceral pain that originates from either the thoracic or abdominal cavities is transmitted through
the autonomic nervous system. In cases where there is an ischemic event, the formation of acidic
metabolic products or degradative products (bradykinin or proteolytic enzymes) serve to signal
activation of broad areas along autonomic nerve fibers. Mechanical stimulation of a viscous
structure and subsequent activation of pain signaling may occur due to over distention/filling of
the hollow viscous structure, and smooth muscle spasms. (Guyton A.C.)
The brain is unable to determine which internal organs are the source of visceral pain.
Sensations of pain from the abdomen and the thorax are transmitted through two pathways into
the central nervous system – the true visceral pathway using the sensory fibers of the autonomic
nerves (both sympathetic and parasympathetic) and the referred pain sensations on surface areas
of the body. These referred pain sensations result when a visceral structure appreciates pain
followed by signaling that usually spreads to the parietal pleura or peritoneum. Parietal surfaces
are supplied with extensive pain innervation from peripheral nerves. Once the peripheral nerves
of the parietal pleura/peritoneum/pericardium perceive pain, it is conducted directly into the local

70
spinal nerves directly over the painful area. Due to this dual transmission, pain from the viscera
is localized to a surface area of the body at the same time (Guyton A.C.).
Treatment of acute, visceral pain is a key component of equine practice. Even more
critical is the treatment and management of post-operative pain after an exploratory laparotomy.
Due to the animal size, vascular compromise secondary to underlying pathology as well as risk
associated with general anesthesia, recovery and immediate post-operative management of the
equine patient is a challenge. The vast majority of work describing the pharmacology behind
drug disposition, movement and effect has been performed in healthy animals with limited levels
of pain and inflammation. Assumptions are then made and applied to practice using these
“healthy” animal studies where, in truth and practice, when these agents are being used for
therapeutic intervention characteristics of drug movement are very different.

71
Chapter 3. Pilot Study: Non-septic, transient, peritonitis model for use in evaluating drug
movement in the equine patient
“I’ll bet you a beer this will work”
– Dr. John Schumacher
Abstract
Thirteen adult healthy horses (geldings and mares) weighing approximately 900-1,300
lbs. (409-590 kg) were selected for use in this study. Horses were screened for inclusion into
this study based on complete blood count, serum biochemistry profile, screening abdominal
ultrasound as well as abdominal examination per rectum. Horses were assigned to one of the
treatment groups: abdominocentesis only (n=1), 500 mL of balanced crystalloid solution (n=1),
500 mL balanced crystalloid solution containing 50 mL heparin sodium citrate infusion (n=2),
autologous plasma infusion with 50 mL of heparin sodium citrate (n=1), autologous whole blood
with 50 mL heparin sodium citrate (n=2), or 500 mL autologous whole blood without anti-
coagulant (n=6). Horses were monitored with physical examinations, urine/fecal output and
water/food consumption monitored three times daily during the study. Peritoneal fluid and
whole blood was also collected for a complete blood count and serum biochemistry in order to
assess evidence of systemic response to peritoneal inflammation. Horses did not display any
signs of systemic disease and all physical examinations were within clinical normal limits. In the
group where whole blood was infused, horses showed evidence of mild abdominal discomfort, as
well as a transient increase in peritoneal fluid nucleated cell count and total protein.

72
Introduction
In horses, peritoneal inflammation has been evaluated after repeated abdominocentesis
(teat cannula or 18 gauge needle) with or without a planned enterocentesis. Post castration, there
is an accumulation of a small amount of blood secondary to castration that causes a self-limiting
peritonitis characterized by a transient increase in nucleated cells of peritoneal fluid without
causing systemic disease (S. J. Schumacher J.; S. J. Schumacher J.) To date, there is no
validated aseptic peritonitis model developed in the horse that produces predictable abdominal
inflammation for a period of time sufficient to allow for evaluation of the effects of treatment. .
The objective of this study was to produce a minimally invasive and painful model for non-septic
peritonitis that is self-limiting and does not develop into systemic disease or require treatment
with analgesic drugs.

73
Materials and Methods
Animals
This project was approved by our Institutional Care and Use Committee. Thirteen adult
healthy horses (geldings and mares) weighing approximately 900-1,300 lbs. (409-590 kg) were
selected for use in this study. A physical examination, complete blood count, serum
biochemistry profile, transabdominal ultrasonography, and abdominal examination per rectum
was performed to ensure that each horse was healthy with no evidence of concurrent systemic or
abdominal disease prior to being admitted into the study. Transabdominal ultrasound evaluated
the amount and character of the peritoneal fluid present, motility of the small intestine, and
intestinal wall thickness (<3 mm). Horses were excluded prior to study initiation if there was
any evidence of systemic disease; increased abdominal fluid volume, echogenicity, or intestinal
wall thickness on ultrasound examination; or any abnormalities detected during the abdominal
examination per rectum.
Peritonitis Induction Model
Peritoneal fluid was collected from each horse prior to the initiation of the study with
either manual (lip twitch) restraint or detomidine sedation (5 mg intravenously). Peritoneal fluid
was collected at the most dependent part of the abdominal wall, distal to the xiphoid process of
the sternum and approximately three cm to the right of midline. This area was clipped and
aseptically prepared using alternating chlorhexidine scrub and alcohol rinse. The site of centesis
was locally anesthetized using three mL of lidocaine (2%) deposited in the subcutaneously. A
1.5 inch 18-gauge hypodermic needle (Monoject, Cardinal Health, and Dublin, OH, USA) was

74
inserted at the surgically prepared area through the abdominal wall. In cases where fluid could
not be collected using the hypodermic needle, a stab skin incision using a #15 scalpel blade was
made in the anesthetized skin and muscle tunic. A 5-cm blunt-tipped, bovine teat infusion
cannula was inserted through the stab incision and gently advanced through muscle and the
peritoneum. Horses were excluded from the study if the baseline peritoneal NCC was >5,000
cells/µL and/or total protein greater than >2.5 g/dL. If a horse was withdrawn from the study as
a result of preliminary screening, a replacement horse was used for pre-study evaluation.
Horses within the infusion treatment groups had a two inch x two inch area in the left
paralumbar fossa half way between the last rib and tuber coxae aseptically prepared with
alternating chlorhexidine scrub and alcohol rinse. The skin at the center of the scrubbed area
was locally anesthetized using three mL of lidocaine (2%). After a stab skin incision using a
#15 scalpel blade was made in anesthetized skin, a 3.5-inch bovine teat cannula was inserted
through the stab incision and gently advanced through muscle and the peritoneum by the
investigators. A three-way stop cock was used to keep the abdominal cavity unexposed to room
air between infusions. The abdominocentesis group did not receive the infusion procedure.
On the day of pilot study initiation, horses were assigned to one of the following
treatment group: abdominocentesis only (n=1), 500 mL of balanced crystalloid solution
(Plasmalyte, Baxter HealthCare Corporation, Deerfield, IL) (n=1), 500 mL balanced crystalloid
solution (Plasmalyte, Baxter HealthCare Corporation, Deerfield, IL) containing 50 mL heparin
sodium citrate infusion (n=2), autologous plasma infusion with 50 mL of heparin sodium citrate
(n=1), autologous whole blood with 50 mL heparin sodium citrate (n=2), and 500 mL autologous
whole blood without anti-coagulant (n=6).

75
Crystalloid Fluid Infusion - One horse was infused with 500 mL of a balanced crystalloid
electrolyte solution (Plasmalyte, Baxter HealthCare Corporation, Deerfield, IL) as a baseline
control for both the infusion process as well as fluid volume. Two horses were infused with 500
mL of a commercial, balanced crystalloid electrolyte solution (Plasmalyte, Baxter HealthCare
Corporation, Deerfield, IL) containing 50 mL of the anticoagulant heparin sodium citrate. This
treatment group would help assess the contribution of the anticoagulant for initiating the
inflammatory response.
Autologous Plasma - One horse was infused with autologous plasma (500 mL) combined
with 50 mL of heparin sodium citrate. In order to accomplish this, aseptic collection of three L
whole blood (minimum amount necessary to ensure collection of 500 mL of plasma after
processing) into a blood collection bag containing 120 mL heparin sodium citrate. Once the
whole blood was collected, it was immediately centrifuged and 500 mL of plasma was
aseptically harvested and infused back into the respective horses under aseptic conditions.
Whole Blood - To assess the contribution of the anticoagulant present with whole blood
in its ability to initiate an inflammatory response, 500 mL whole blood was collected into a
sterile bag containing 50 mL heparin sodium citrate. In the final treatment group, six horses
were infused with autologous whole blood without anticoagulant present. Autologous whole
blood (500 mL) aseptically collected from the horse’s jugular vein immediately before injection
into the peritoneal cavity. A 14-gauge, 1.5 inch needle (Monoject, Cardinal Health, Dublin, OH,
USA) was used to sterilely collect 500 mL of whole blood into sterile 60 mL syringes by the
investigators. As the whole blood was collected from the jugular vein, it was immediately
infused into the peritoneal cavity to avoid clot formation.

76
Evaluation of Peritonitis Induction Model
After intraperitoneal infusions (where applicable) had been performed, horses were
returned to their stalls for further evaluation. At days 1 through 5 post infusion, abdominal
ultrasounds were performed to evaluate peritoneal fluid accumulation, gastrointestinal motility
and intestinal wall thickness. Abdominal examinations per rectum were performed daily to
detect changes within the abdominal cavity. Peritoneal fluid was collected daily as previously
described. If peritoneal fluid parameters were normal or had returned to normal (<5,000 NCC/
µL and <2.5 g/dL total protein) on any of these days, or failed to increase to > 10,000 NCC/µl,
the horse was returned to pasture and no further evaluation was performed. All peritoneal fluid
samples were collected in two EDTA tubes, and immediately refrigerated (4oC) and stored for
evaluations of peritoneal nucleated cell counts and total protein. Twenty milliliters of whole
blood was also collected for a complete blood count and serum biochemistry profile in order to
assess evidence of systemic response to peritoneal inflammation.
Horses were monitored with physical examinations, urine and fecal output, and water and
food consumptions three times daily during the study. Physical examination parameters
including increased heart and respiratory rate, prolonged capillary refill time, mucosal character,
and skin tent were used to assess pain, perfusion, and hydration. Assessment of abdominal
discomfort was monitored based on the criteria and grading scale set forth previously by
(Southwood L.L.).

77
Statistical Analysis
Parameters (nucleated cell count and total protein) were evaluated using a one-way
ANOVA (SAS/IML 9.1, User’s Guide: statistics, Cary, NC) and Tukey’s test for multiple
comparison for repeated measures. Significance was considered at P<0.05.

78
Results
At no point during the pilot study did horses develop signs of systemic illness with
temperature, heart and respiration rates, capillary refill time, and mucous membrane color being
within clinical normal limits. Complete blood cell counts and serum chemistries also stayed
within reference ranges between baseline and completion of the study.
Decreased gastrointestinal sounds were appreciated in three treatment groups: balanced
crystalloid solution with anticoagulant (48 hours post treatment; n = 1), plasma (60 hours post
treatment; n = 2), and whole blood (60 hours post treatment; n = 3). Splinting of the abdominal
muscles were noted in three abdominal infusion treatment groups: balanced crystalloid solution
with anticoagulant (12, 36, and 48 hours post treatment; n=1), plasma (36 and 48 hours post
treatment; n = 1), and whole blood infusion (12, 36, and 48 hours post treatment; n = 3). All
gastrointestinal sounds as well as splinting of the abdomen returned to clinical normal levels
prior to completion of the study.
Transabdominal ultrasound findings considered consistent with peritonitis included:
increased volume of peritoneal fluid, thickened small intestinal wall (> 3 mm in diameter), and
decreased evidence of motility. Eight horses showed evidence of decreased gastrointestinal
motility in this study. The description of this population is found within Table 3.1. Thickened
small intestinal walls (4 mm, n = 2; 5 mm, n=1) were appreciated in three horses, and occurred
24 hours post whole blood intra-abdominal infusion.

79
Table 3.1. Subjective abnormal abdominal ultrasound findings of horses after being treated with
intra-abdominal infusion of autologous plasma, crystalloid solution and heparin, and whole
blood (n=7).
Treatment
Group
Number
Horses
Affected
Hours Post
Infusion
(horse number)
Characterization
of Motility
Autologous
Plasma
1 48 (1) Decreased
motility
Crystalloid
Heparin
2 24 (1), 48 (1) Decreased
motility
Whole Blood 4 24 (4), 48 (3) Decreased
motility

80
All palpations of the abdomen per rectum were performed by a single clinician (HAD).
In four horses treated with intra-abdominal infusion of whole blood only, the large colon
subjectively felt firmer and more pronounced at 24 hours (n = 1), 48 hours (n = 3), and 72 hours
(n = 3).
Peritonitis in the equine patient has been defined as NCC >5-10,000 /µL and a total
protein >2.5 g/dL depending on the literature. Only one sample from the whole blood group at
72 hours reached peritoneal white blood cell and total protein concentration consistent with the
clinicopathologic diagnosis of peritonitis. Data for peritoneal NCC count and total protein are
summarized in Tables 3.2 and 3.3 as well as Figures 3.1, 3.2, 3.3, and 3.4.

81
Table 3.2. Peritoneal nucleated cell counts for each treatment group for each time point post
treatment (n=13). Values are reported as the mean and range.
Hours
Post
Infusion
Abdomino-
centesis
(n=1)
Autologous
Plasma
(n=1)
Crystalloid
(n=1)
Crystalloid
Heparin
(n=2)
Whole
Blood
(n=6)
Whole
Blood
Heparin
(n=2)
0
(Prior) 1750 1900 600
745 ±
35
1238.33
± 570
570 ±
874.61
24 1550 2450 2220 12650 ± 10830
5086.67
± 8745
12015 ±
8057.06
48 2460 23540 1140 6640 ± 4640
822 ±
20730
38410 ±
8802.50
72 2350
8911
± 825
10685 ±
6181
96 10705
11510 ±
3305
108 7400 4690

82
Figure 3.1. Peritoneal nucleated cell counts comparing treatment groups abdominocentesis
(n=1), whole blood with heparin (n = 2), and whole blood only (n= 6). Values represent mean
values for horses where applicable. Error bars are standard deviation.
-10000
0
10000
20000
30000
40000
50000
0 24 48 72 96 108
Per
iton
eal
Nu
clea
ted
Cel
l C
ou
nt
NC
C/µ
L
Hours
Abdominocentesis Blood Heparin Blood Only

83
Figure 3.2. Peritoneal nucleated cell counts comparing treatment groups crystalloid fluid
infusion (n=1), crystalloid fluid with heparin (n = 2), and autologous plasma (n= 1). Values
represent mean values for horses where applicable. Error bars are standard deviation.
0
5000
10000
15000
20000
25000
30000
0 24 48 72
Per
iton
eal
Nu
clea
ted
Cel
l C
ou
nt
NC
C/µ
L
Hours
Crystalloid Cystalloid Heparin Plasma

84
Table 3.3. Peritoneal total protein values for each treatment group for each time point post
treatment (n=13). Values are reported as the mean and range.
Hour
Abdomino-
centesis
(n=1)
Autologous
Plasma
(n=1)
Crystalloid
(n=1)
Crystalloid
Heparin
(n=2)
Whole
Blood
(n=6)
Whole
Blood
Heparin
(n=2)
0 0.9 0.8 0.2 1.65 ± 0.35
1.42
± 0.41 0.65 ± 0.45
24 0.9 1.3 0.7 0.75 ± 0.35
1.03
± 0.58 1.9 ± 0.1
48 0.5 1.6 0.5
1.7
± 0.3
1.03 ±
0.73 1.05 ± 0.25
72 0.7 2.45 ± 0.15

85
Figure 3.3. Peritoneal total protein comparing treatment groups abdominocentesis (n=1), whole
blood with heparin (n = 2), and whole blood only (n= 6). Values represent mean values for
horses where applicable.
0
0.5
1
1.5
2
2.5
0 24 48 72 96 108
Per
iton
eal
To
tal
Pro
tein
g/d
L
Hours
Abdominocentesis Blood Heparin Blood Only

86
Figure 3.4. Peritoneal total protein comparing treatment groups crystalloid fluid infusion (n=1),
crystalloid fluid with heparin (n = 2), and autologous plasma (n= 1). Values represent mean
values for horses where applicable.
0
0.5
1
1.5
2
2.5
0 24 48 72
Per
ito
nea
l T
ota
l P
rote
in
g/d
L
Hours
Crystalloid Cystalloid Heparin Plasma

87
Adverse events during the course of the study were limited to two horse with inadvertent
enterocentesis at 24 and 48 hours which no further samples were taken. Development of a
ventral edema plaque around the sites of sample collection occurred in five horses and might
have been due to an allergic reaction secondarily to the use of chlorhexidine scrub solution when
performing sterile preparations to the area.
Based on these 13 horses, there were no significant differences in the peritoneal nucleated
cell counts and total protein between the treatment groups.

88
Discussion
The goal of using models for evaluation of disease states is to develop a model that
mimics the severity of the natural disease. After an initial insult to the abdominal cavity, the
resident peritoneal macrophages and mast cells release histamine and serotonin. These
mediators act on the peritoneal vasculature to cause increased permeability and transudation of
proteins and fluids into the abdominal cavity. The inflammatory response is continually
propagated by release of various chemokines (TNFα, IL-1), prostaglandins, and leukotrienes
(Barton M.H.; Davis). Animal models for peritonitis have been used to mimic all facets of sepsis
in people including speed of onset, range of clinical signs, hemodynamic changes, immunologic
changes associated with treatment, and histologic changes in abdominal organs secondary to
sepsis (Doi K.). These studies are often performed using the rodent model. Creation of
peritonitis in the rat is typically created using one of three methods: injection of an exogenous
toxin, alteration of the animal’s endogenous protective peritoneal barrier, or infusion of
exogenous bacteria into the peritoneal cavity. Under sterile conditions, injection of
lipopolysaccharide (LPS) causes an early and transient increase in inflammatory mediators more
intense than seen in human peritoneal sepsis. By ligating the cecum and subsequently
puncturing the visceral surface, the abdominal cavity is exposed to multiple types of bacteria
flora creating a model of peritonitis similar to that often encountered in rodent research to model
human sepsis. Finally, peritonitis created by infusion of exogenous bacteria can be somewhat
regulated by controlling type and amount of bacteria instilled into the peritoneal cavity; however,
clinical response to this model of peritonitis has been variable in horses (Brocco M.C.; Doi K.;
M. L. Mendes L.C.N.).

89
Peritonitis modeling may also occur under aseptic conditions including chemical serosal
irritation and vascular compromise to the viscera. Exposure of the abdominal cavity to gastric
contents, bile, pancreatic enzymes, or whole blood results in irritation to the serosal surface of
the abdominal cavity. Depending on the type and amount of chemical used, extent and time of
exposure, the serosal irritation may result in erosion and subsequent visceral rupture leading
secondary bacterial infection of the abdomen (Chase J.P.; Shearman D.J.).
No matter which model is used to initiate pathology, once the animal (most likely rodent)
begins to show signs of systemic disease, therapeutic agents or treatment interventions are
administered for evaluation (Chase J.P.). From rodent models, researchers have been able to
evaluate medical management of peritonitis using systemic drugs as well as peritoneal infusions
of drug and lavage techniques. For instance, Mendes et al, used direct infusion of E.coli or
Bacteroides fragillis to create peritoneal inflammation in rats. In that study, the researchers were
able to appreciate both systemic and local response indicative of inflammation (M. L. Mendes
L.C.N.; M. L. Mendes L.C.N.). Recently, intraperitoneal infusion of LPS has been shown to
initiate a response sufficient to study the inflammatory mediators both in the peripheral blood as
well as in the peritoneal fluid (Peiro J.R.).
Horses in this study did develop evidence of a mild, transitory inflammatory response
after infusion of whole blood into the abdomen; however, levels of both NCC and total protein
did not meet acceptable levels to be classified as clinicopathological peritonitis. Despite this,
patients treated with whole blood showed evidence of peritoneal inflammation on
ultrasonographic evaluation with decreased motility, thickened loops of small intestine, and
increased/alterations of the peritoneal fluid character. Also, horses showed mild evidence of
abdominal pain (abdominal splinting) which would correspond to what was being appreciated

90
clinically. Subjectively, examinations also confirmed decreased motility as increased turgidity
of the wall of the large colon was appreciated during abdominal palpations per rectum. Further
studies should also monitor peritoneal pH as well as peripheral and peritoneal D-Dimer, glucose,
and lactose levels as these have become valuable diagnostic aids in assessing systemic disease in
the equine patient. (Auer J.A.; M. L. Delgado M.A.; M. L. Delgado M.A.).
In this pilot study, investigators did not detect a significant difference between the
treatment groups. This may be due to the volume (500 mL) of infusion that was used. The
volume may not be sufficient enough to elicit an inflammatory response due to decreased ability
to contact the serosal surfaces of the abdominal cavity. Despite there not being a statistical
difference between groups, the whole blood infusions (with and without the anticoagulant
present) did appear to be more likely to initiate a response than the other treatments. Based on
the horse’s tolerability to the various treatment modalities, further studies should be considered
using larger volumes of blood to further evaluate this aseptic model of peritonitis. This may also
include the evaluation of a variety of endogenous intraperitoneal cytokine (TGF-β) release as
well as the effects of pharmacotherapy on their levels (Arguelles D.).
Studies evaluating the concentration of antimicrobial drugs within the peritoneal cavity
are limited to healthy horses with intact, non-inflamed peritoneal mesothelial linings. In the
majority of research studies, the pharmacologic effects of antimicrobial and anti-inflammatory
drugs are evaluated in healthy, normal animals; however, the effects of therapeutic interventions
often behave differently under inflammatory conditions. By creating a mild chemical
inflammatory peritonitis in horses, the risks of causing systemic disease is minimized and allows
for evaluation of performance of therapeutic options within the inflamed abdomen.

91
Chapter 4. Impact of Route, Volume, and Fed/Fasted State on Acetaminophen Disposition
after Oral Administration in the Horse
“Live by the words of Aaron Tippin –
You’ve got to stand for something, or you’ll fall for anything…”
-Dr. Haden Bunn
Abstract
To investigate the impact of: route, volume, and fasting versus fed state on orally
administered acetaminophen using six healthy adult horses in a randomized, cross-over study
design. All six horses received a 20 mg/kg dose of acetaminophen using two different oral
routes of administration (nasogastric versus syringe), two different volumes (100 vs 1500 mL),
and in the fed versus fasted state. Whole blood was intermittently collected from an indwelling
intravenous catheter at designated time points over a 24-hour period. Acetaminophen was
quantitated in serum using an ACTM Flex® reagent on a Siemens Dimension Xpand Plus®
general chemistry analyzer. Data was subjected to non-compartmental analysis and key
parameters were compared between methods of administration. Maximum plasma drug
concentration (Cmax: 11 µg/mL ± 4) as well as area under the curve (AUC: 1916.9 µg/mL/hr ±
1117) were higher when given with 1.5 L of water via nasogastric tube vs dissolved in 100 mL
through a syringe and in the fasted versus fed state. Systemic exposure of acetaminophen was
increased when the drug was given dissolved in a large volume via a nasogastric tube in a fasted
state.

92
Introduction
Currently, there is not a “standard of care” for evaluating drug movement in the equine
patient. Pharmacokinetic studies evaluating oral administration in horses most commonly
involve administration of either a paste or liquid formulation. However, when these are
unavailable, a solid dosing form of the drug (tablet or capsule) is crushed or opened and
administered as a powder one of several ways: spread over grain, dissolved in a small volume of
water and then administered in a syringe, or as a large volume solution via nasogastric tube.
Pharmacologically, multiple factors can affect a drug’s ability to be absorbed. In people, studies
have shown the volume in which a drug is administered markedly impacts the rate (time to
maximum drug concentration) and extent that it reaches systemic circulation (maximum plasma
drug concentration, area under the curve, and bioavailability) (Neirinck E.). Depending on the
characteristics of the drug, absorption may also be affected by the presence or absence of food in
the stomach and small intestine.
Acetaminophen, a centrally-acting analgesic and antipyretic, is a small (151.2 g/mol),
moderately lipid-soluble weak organic acid. It is classified by the Biopharmaceutics
Classification System as a Class 1 model drug indicating high solubility, high permeability, and
with an overall ease of absorption into systemic circulation (Hatanaka S.). Although poorly
absorbed in the stomach, acetaminophen is readily absorbed from the small intestine of dogs,
rats, and ponies (Clements J.A.; Doherty T.J.; Mizuta H.). As such, a direct relationship has been
found between rate of gastric emptying and serum concentrations of orally administered
acetaminophen in horses (Lammers T.) Absorption of acetaminophen powder (dissolved in 350
mL of water) has proven an effective and safe marker for gastric emptying in ponies after
administration by nasogastric intubation (Clements J.A.).

93
The purpose of this study was to demonstrate that the method of oral drug delivery in
horses impacts drug disposition. Investigators hypothesized the oral bioavailability of
acetaminophen, specifically maximum plasma drug concentrations and area under the curve,
would be less when administered to horses via a syringe compared to nasogastric tube, in a small
versus large volume via nasogastric tube, and in a fasted versus non-fasted state. Results from
this study will allow researchers to be able to establish a foundation for drug evaluation in the
horse.

94
Materials and Methods
Animals
This study was approved by the university’s Institutional Animal Care and Use
Committee. The study was implemented using a randomization table in a four-way cross-over
design. Six adult healthy horses (five geldings and one mare), weighing 454-590 kg were
selected from the equine teaching herd. The entirety of the study was comprised of four
treatment groups (Table 4.1).
Table 4.1. Treatment group descriptions and paired comparisons (n=6) horses per grouping.
Treatment Group Treatment
Group 1 SYR 100 mL
Group 2 NGT 100 mL
Group 3 NGT 1.5 L
Group 4 NF NGT 1.5 L
NGT = nasogastric tube, NF = non-fasted, SYR = syringe.
Comparison Treatment
Groups
Method
Effects of route of
administration
1
2
SYR 100 mL
NGT 100 mL
Effects of volume of
administration
1
3
NGT 100 mL
NGT 1.5 L
Effects of fed vs.
fasted
3
4
NGT 1.5 L
NF NGT 1.5 L

95
Apparent health of the horses was determined by physical examination, complete blood
count and serum biochemistry profile. All horses received acetaminophen (powder at a dose of
20 mg/kg [Alfa Aesar]) dissolved in water with methods varying among the four treatment
groups. The horses in treatment Groups 1-3 were fasted for 8 hours prior to treatment and for 4
hours after drug administration. The horses in Group 4 were not fasted prior to or during the
study. Immediately prior to drug administration, a 4-inch diameter area in the jugular groove
was clipped and prepared in an aseptic manner for five minutes using a chlorhexidine scrub and
isopropyl alcohol for catheter placement. A 14-gauge 5.5 inch intravenous catheter (Abbocath,
Hospira, Lake Forest, IL) was placed in jugular vein using sterile technique.
Drug Administration
The volume and method of delivery were randomly assigned to one of four groups as
follows: Group 1 (SYR 100mL) –the dose was dissolved with 100 mL of water and
administered orally through a syringe to fasted horses; Group 2 (NGT 100 mL) – the dose was
dissolved in 100 mL of water and administered to fasted horses via funnel through a preplaced
nasogastric tube followed by 800 mL of air to empty all liquid from the nasogastric tube (3/8
inches internal diameter, 9 feet long). Group 3 (NGT 1.5L) – the dose was dissolved in 1.5 L of
water and administered to fasted horses via funnel through a preplaced nasogastric tube. The
dose was followed by 800 mL of air to empty all liquid from the nasogastric tube (3/8 inches
internal diameter, 9 feet long). Group 4 (NF NGT 1.5L) - the dose was dissolved in 1.5 L of
water and administered to non-fasted horses via funnel through a preplaced nasogastric tube. The
dose was followed by 800 mL of air to empty all liquid from the nasogastric tube (3/8 inches

96
internal diameter, 9 feet long). In groups 2, 3, and 4, the nasogastric tube was placed with the use
of manual restraint and removed immediately after drug administration.
Sample Collection
Blood samples were collected through the indwelling jugular catheter of each horse at
pre-determined, timed intervals. Whole blood was collected at times 0, 10, 20, 30, 45, 60, 75,
120, 150, 180, 270, 360 minutes (1, 1.25, 2, 2.5, 3, 4.5 hours), 6, 9, 12, and 24 hours after
treatment and placed in red topped tubes (BD Vacutainer, Sodium Heparin, BD, Franklin Lakes,
NJ, USA). Once a sample was collected, the catheter was flushed thoroughly with heparinized
saline (Monoject PreFill IV Flush, Cardinal Health, and Dublin, OH). Blood samples were
separated into their components (packed red blood cells and serum) by centrifugation at 1900 g
(3000 rpm) for 15 minutes and serum was stored at 0°F until samples processed. Catheters were
removed, and horses were returned to their paddocks after the 24-hour sample. After at least a
72-hour washout period, the study was repeated using a different dosing technique and the
opposite jugular vein.
Sample Analysis
Acetaminophen equine serum concentrations were quantitated using an ACTM Flex®
reagent (Siemens) which enzymatically hydrolyzes acetaminophen into acetate and p-
aminophenol. The concentration of p-aminophenol is then detected colorimetrically and
quantitated using a bi-chromatic endpoint technique (Siemens Dimension Xpand Plus® general
chemistry analyzer; New York, NY). Unknown concentrations of acetaminophen in each sample
were predicted by comparing the signal to a calibration curve (2, 10, 25, 50, 100, 150, and 300

97
µg/mL) generated by fortifying equine serum with known amounts of acetaminophen that ranged
from 2-300 µg/mL. A calibration curve was accepted if the coefficient of determination (r2) was
at least 0.998 and the predicted concentrations were within 10% of the actual concentrations.
Assay guidelines were followed to determine the lower and upper limits of quantification (LOQ)
for acetaminophen as 2 µg/mL and 300 µg/mL respectively, based on the lowest and highest
control that was studied and was accurately and precisely predicted within 15%. Intra and inter
assay variability was less than 10% for all controls.
Pharmacokinetic Analysis
Serum acetaminophen concentration versus time data samples were subjected to non-
compartmental analysis (Phoenix Winnonlin, Cetera,®, Version 8, Sunnyvale, CA, USA) using
the log-linear trapezoidal method. Parameters included AUC from time zero extrapolated to
infinity (µg*hr/mL), Cmax (oral, µg/mL) at time (Tmax;h); terminal half-life (t1/2: h), mean
residence time (MRT; h), and elimination rate constant (kel) . Relative bioavailability for each
group was based on the ratio of AUC of that group relative to the group with the greatest AUC.
Descriptive statistics (mean, 95% confidence interval) were generated for each parameter. PK
parameters were compared by route of administration (Table 1) using repeated measures analysis
of variance (RM-ANOVA; =0.05) with post-hoc testing via Tukey’s method in SAS v9.1 (SAS
Institute, Cary, NC).

98
Results
Pharmacokinetic parameters for each group are listed in Table 2.2. The AUC (µg/mL/hr)
for each route of administration are as follows: Group 1 (SYR 100 mL) (652.89 ± 336.83),
Group 2 (NGT 100 mL) (1393.67± 630.91), Group 3 (NGT 1.5L) (3445.87±1116.72), and Group
4 (NF NGT 1.5L) (1916.86 ± 847.20). The Cmax (µg/mL) for the formulations were as follows:
Group 1 (SYR 100 mL) (8.12± 6.31), Group 2 (NGT 100 mL) (11.10 ±6.57), Group 3 (NGT
1.5L) (21.92 ± 3.91), Group 4 (NF NGT 1.5) (11.37±3.29). Relative bioavailability (%) was
based on the ratio of AUC of Groups 1, 2 and 4 to AUC of Group 3 (the highest mean AUC): for
Group 1, 18.9%, Group 2, 40% and Group 4, 57%.

99
Table 4.2. Mean pharmacokinetic parameters for acetaminophen when administered in
apparently healthy horses (n=6). Data is reflected as the geometric mean and the 95%
Confidence Interval.
Group 1
(SYR 100 mL)
Group 2
(NGT 100 mL)
Group 3
(NGT 1.5 L)
Group 4
(NF NGT 1.5 L)
AUC (µg/mL/min) 652.9 (299-
1006)
1393.7 (610-
2177)
3445.9 (2274-
4618)*
1916.9 (1028-
2806)*
Cmax (ng/mL) 8.1 (2-15) 11.1 (4-18) 21.9 (18-26)* 11.4 (8-15)
t1/2 (min) 41.9 (26-58) 115.2 (-2-232) 81.7 (32-132) 81.2 (3-160)
MRT (min) 100.2 (80-120) 210 (-45-465) 134.6 (97-172) 150.3 (62-239)
CL/F
(mL/min/kg)
45.2 (4-87) 20.4 (0-41) 6.4 (4-9)* 13.1 (5-22)
Vd/F (mL/kg) 2710.6 (-2-5423) 2582.2 (562-
4602)
651.8 (441-863) 1105.9 (238-1974)
Kel (1/min) 0.02 (0.01-0.03) 0.01 (0-0.02) 0.01 (0.01-0.02) 0.02 (0-0.04)
F (relative) - 2.4 (1.4-4.2) 6.1 (3.5-10.6) 3.2 (1.9-5.6)
*Indicates a statistically significant difference (p < 0.05) between the specified group and Group
1 (SYR 100 mL).
*F (relative) comparison between the specified group and Group 1 (SYR 100 mL). Values
indicate a fold difference
AUC = area under the curve; Cmax =maximum plasma drug concentration; t1/2 = elimination half-
life; MRT = mean resonance time; CL/F = apparent oral clearance; Vd/F = apparent oral volume
of distribution; kel = disappearance kel; NGT = nasogastric tube; NF = non-fasted; SD =
standard deviation; CI = confidence interval; * indicates significant differences. Apparent oral
clearance and apparent oral volume of distribution do not take into account the bioavailability of
the drug.

100
The effects of method of oral delivery on acetaminophen absorption were based on
comparison of Group 1 (SYR 100 mL) to Group 2 (NGT 100 mL) (p<0.05) (Figure 1). The AUC
and Cmax tended to be significantly greater for Group 2 (NGT 100 mL) when compared to Group
1 (SYR 100 mL). Relative bioavailability of the SYR method compared to NGT was 18.9%.

101
Figure 4.1. Serum acetaminophen concentrations comparing route of administration between
Group 1 (SYR 100 mL) to Group 2 (NGT 100 mL) (n= 6). Data is reflected as the geometric
mean and the 95% Confidence Interval. Accompanying pharmacokinetic data is found in Table
4.2. Cmax and AUC were significantly different between groups (p<0.05).
AUC = area under the curve; Cmax =maximum plasma drug concentration; NGT = nasogastric
tube
0.1
1
10
100
0 100 200 300 400 500 600Ser
um
Ace
tam
ino
ph
en C
on
centr
atio
n
(µg
/mL
)
Time (minutes)
Syringe NGT 100mL

102
The effects of volume on acetaminophen absorption were based on comparison of Group
2 (NGT 100 mL) to Group 3 (NGT 1.5L) (Figure 4.2). The AUC and Cmax were statistically
significantly greater for Group 3 (NGT 1.5L) when compared to Group 2 (NGT 100 mL)
(p<0.05). Relative bioavailability of the lower compared to higher volume was 40%.

103
Figure 4.2. Serum acetaminophen concentrations comparing volume of administration Group 2
(NGT 100 mL) to Group 3 (NGT 1.5 L) (n = 6). Data is reflected as the geometric mean and the
95% Confidence Interval. Accompanying pharmacokinetic data is found in Table 4.2. Cmax and
AUC were significantly different between groups (p<0.05).
AUC = area under the curve; Cmax =maximum plasma drug concentration; NGT = nasogastric
tube
1
10
100
0 100 200 300 400 500 600
Ser
um
Ace
tam
ino
ph
en C
on
cen
trat
ion
(µg
/mL
)
Time (minutes)
NGT 100mL NGT 1.5 L

104
The effects of fasting on drug absorption were based on comparing Group 3 and 4. A
non-fasted state had an improved effect of drug bioavailability as Group 3 (NGT1.5 L) had a
significantly increased AUC and Cmax in comparison to Group 4 (NF NGT 1.5 L) (p<0.05)
(Figure 2.3). Relative bioavailability of fasted versus fed state was 57%.

105
Figure 4.3. Serum acetaminophen concentrations comparing treatment Group 3 (NGT 1.5L) to
Group 4 (NF NGT 1.5L) (n=6). Data is reflected as the geometric mean and the 95%
Confidence Interval. Accompanying pharmacokinetic data is found in Table 4.2. Cmax and AUC
were significantly different between groups (p<0.05).
AUC = area under the curve; Cmax =maximum plasma drug concentration; NGT = nasogastric
tube; NF = non fasted
No statistically significant differences could be detected when comparing other
pharmacokinetic variables.
1
10
100
0 100 200 300 400 500 600
Ser
um
Ace
tam
ino
ph
en C
on
cen
trat
ion
(µg
/mL
)
Time (minutes)
NGT 1.5 L NGT 1.5 L NF

106
Discussion
The Food and Drug Administration has implemented a Strategic Plan for Regulatory
Science which includes a major focus on predicting the behavior of orally administered drugs
through modeling. Among the models that should facilitate an understanding of the complex
interactions and processes that impact drug behavior are those based on quantitative structure-
activity or -property relationships. These models can guide experimental designs of hypothesis
driven research while reducing animal numbers and total study cost and improving the ability to
predict response to a drug among the varied populations (Doherty).
Much of equine therapeutics reflects off-label (extra-label) use with alternative routes or
drugs. Ideally, extra-label dosing regimens are supported by clinical research (Hatanaka
S.). Determining effects of oral drug administration has been key in developing appropriate
models that predict drug concentrations in animals and people. The effects of food, drug coating,
and how the drug is administered are the cornerstones in evaluating and modeling drug
movement (Mizuta H.). In the horse, oral administration either in a clinical setting or as part of
research studies often varies depending on the drug, the investigator, or the circumstances under
which the drug is administered.
Like people, the rate at which the equine stomach empties when exposed to the orally
administered fluid is highly dependent on the phase of the migrating motor complex, the
electrical cycle which controls gastrointestinal propulsion (Lammers T.). In people, small
volumes of fluid (50 mL) do not exert an effect on the rate of gastric emptying. However, by
increasing the amount of fluid volume administered with a drug (200 mL), the rate of gastric
emptying increases regardless of the motor complex phase (Clements J.A.; Oberle R.L). This
relationship can ultimately affect the bioavailability of a drug and may be critical for drug classes

107
(Class 1 and Class 2) where there is rapid dissolution and the availability of the drug within the
intestinal tract is limited by the rate of gastric emptying (Hatanaka S.).
Acetaminophen is a Class 1 model drug indicating high solubility, high permeability, and
overall ease of absorption. Historically, it has been used for assessing and tracking gastric
emptying as it is readily absorbed in the small intestine of ponies (Hatanaka S.). Clinically, oral
dosing in horses is most commonly done by making a “slurry” of a small volume of liquid (100
mL) and syringing the dose into the horse’s mouth (SYR 100 mL). There are many variables
that can have an effect results when administering a drug orally via a syringe. If the horse does
not like the taste of the drug, they often will not swallow it. This can reflect in serum samples
collected during a pharmacokinetic study. In this study, a secondary peak was appreciated in the
absorption portion of the curve. Authors concluded that this may have been due to horses
holding the dose in the oral cavity and only partially swallowing the dose initially. This would
result in a delayed Cmax and slight fluctuation in absorption rates in this treatment group.
A statistical difference could not be found when comparing acetaminophen
administration with the syringe versus NGT. However, this may reflect the small volume that
was used for this comparison: as with people, when the volume of the solution was increased
from 100 mL to 1.5 L and administered using a NGT, both Cmax and AUC significantly increased
indicating an increased bioavailability secondary to increased volume of water used in
administration. For this study, the smaller volume was chosen for comparison of delivery method
since administration of 1.5 mL through a dosing syringe could not be accomplished in a timely
fashion and thus was not feasible. The sample size also likely contributed to our inability to find
a statistical difference since the AUC numerically was more than fourfold higher and the Cmax
was almost 50% higher in the NGT group compared to the syringe (Figure 2.1, Table 2.2).

108
Administering the acetaminophen directly through a NGT with 100 mL water showed a
significant increase in drug absorption over syringe administration with 100 mL. This increase
in absorption, this is most likely due to bypassing the issues associated with oral product
administration such as product loss delayed swallowing. Though clinically this would not be
possible, in the academic arena where drug movement is often studied this would be the most
direct method of assessing drug movement without the compounding issues of administration.
Similar to people, the effect of volume of administration also affects the extent to which a
drug may be absorbed as was illustrated with the comparison of NGT 100 mL vs. 1.5L. In future
endeavors where drug movement is being evaluated, it would be prudent to take this into account
when planning the amount of volume to be used during administration.
Animals that were non-fasted had a statistically significant increased AUC and Cmax, both
indicating that the effects of food being present in the stomach or small intestine greatly affects
the absorption of drug into the blood stream. Depending on the drug structure, this may be due
to binding of the drug in food material, alteration of intraluminal pH, or decreased
gastrointestinal motility and exposure of the drug to the blood stream.
In conclusion, investigators were able to establish the most accurate determination of oral
drug absorption in the horse: animals should be fasted for eight hours prior to study initiation,
and drug should be administered via a nasogastric tube with the formulation (tablet or capsule)
dissolved in 1.5L of water.

109
Chapter 5. Clinical Application of Firocoxib Canine Chews in Equine Practice
“Just because you can – doesn’t mean you should.”
– Dr. Reid Hanson
Abstract
The purpose of this study was to compare the bioavailability of equine firocoxib to
canine chews in horses as well as evaluate therapeutic levels with clinical response. Horses
(n=8) received a single loading dose of firocoxib (0.3 mg/kg) as an oral paste, chew, or
intravenously in a randomized triple cross over study. Firocoxib was quantitated by high
performance liquid chromatography (25-2,500 ng/mL). Data was subjected to non-
compartmental analysis. An in vitro analysis was performed to determine appropriate handling
of firocoxib during collection and storage. Samples from client horses (n=44) treated with
firocoxib chews were evaluated for drug levels and clinical response. This study failed to find
statistically significant differences in Cmax and absolute oral bioavailability at a power of greater
than or equal to 90%. Firocoxib should be transported and stored in glass vials. Clinical
patients appear to respond favorably to treatment with chews without adverse effects.

110
Introduction
Firocoxib is a member of the coxib class of NSAIDs. Firocoxib, described as COX-2
selective, has recently been approved for use in both horses as a paste and for dogs as a chew
by the United States Department of Agriculture and European Union (P. M. Kvaternick V.).
However, the preparations differ, with the paste (56.8 mg of firocoxib/tube, able to be
administered in 11.4 mg increments (250 lb. doses) and chew as a tablet (57 to 227 mg tablets
that can be scored in half). Firocoxib made its debut in veterinary medicine in dogs,
demonstrating efficacy for treatment of experimental induced synovitis and naturally
occurring osteoarthritis (McCann ME; Pollmeier M. Toulemonde C.).
According to the Policy of Extra-Label Drug Use, which describes the criteria for extra-
label drug use in food animals, the substitution of the canine chew for the equine paste is
illegal in the United States (Canada; P. M. Kvaternick V.) However, substitution of the chew
for paste is none-the-less becoming increasingly popular in equine practice. Despite improved
safety, the therapeutic index of COX-2 selective drugs remains sufficiently narrow, suggesting
use should be based on disposition studies in the target species. The purpose of this study
was three-fold: to determine, in horses, the disposition of firocoxib when administered at the
recommended (labeled) loading dose (0.3 mg/kg) in equine formulations, either as the
intravenous solution or as the oral paste, and with the canine chew tablets; compare the
absolute bioavailability of the two oral products; collect clinical samples from equine patients
who were being treated with the canine chew and compare response of therapy to firocoxib
plasma levels.

111
Initially, the authors anticipated the firocoxib product prepared as a chewable tablet might
not be a readily absorbed in horses, and thus hypothesized that the chews would be 30% less
bioavailable compared to the paste at an equivalent dose.

112
Materials & Methods
Animals
Eight healthy, adult horses (7 geldings, 1 mare) were studied using a randomized, triple
cross-over design. The sample size (8 horses) was based on the number necessary to
demonstrate a 50% difference in Cmax based on a reported variability of 31% around the
mean. Animals included both client owned animals and horses from the equine teaching
herd. All procedures were approved for use by the Institutional Animal Care and Use
Committee, which included approval of a client-informed consent form which was signed by
participating clients.
Drug Administration
Horses were randomly assigned to one of three initial treatment groups, with each
group receiving (0.3 mg/kg oral [PO] and 0.2 mg/kg intravenous (IV)) firocoxib (Equioxx®;
equine IV or paste formulations), Merial, Duluth, GA): Group 1 - a single intravenous dose,
Group 2 – single dose of oral paste, and Group 3 – single dose of chewable tablets. The
chewable tablets (Previcox®, canine formulation, Merial, Duluth, GA) were offered by hand
(n=6) or, if the horse was reluctant to eat the tablets, were administered by syringe
application after mixing the tablets with 30 mL water (n=2).

113
Sample Collection
Prior to drug administration (day 0), 20 mL of blood was withdrawn from the
jugular vein for a complete blood count and serum chemistry profile to ensure the animal
had no underlying systemic disease. A 14 gauge 13.75 cm intravenous catheter
(Abbocath, Hospira, Lake Forest, IL, USA) was then placed in the jugular vein using
sterile technique. Once the catheter was placed, the horse received its pre-assigned
treatment and blood samples (10 mL) were collected through the indwelling catheter. If
the horse assigned to the intravenous treatment group, the loading dose of the intravenous
solution was administered through a percutaneous injection into the opposite external
jugular vein from where the catheter was placed. After each sample collection, the
catheter was flushed thoroughly with heparinized saline.
Samples were collected at 30 minutes, 1, 2, 4, 8, 16, 24, 48, 72, and 96 hours after
dosing. Blood was placed in heparinized glass collection tubes (BD Vacutainer®,
Sodium Heparin, BD, Franklin Lakes, NJ). After the 24-hour sample time point, the
indwelling catheter was removed and the remaining samples were collected through a 20
gauge needle and 12 mL syringe (Monoject, Cardinal Health, Dublin, OH). A from
alternate right or left jugular veins. Blood samples were separated into their components
(packed red blood cells and plasma) by centrifugation, and plasma was stored frozen at -
80 °F in glass vials (Borosilicate Glass Disposable Culture Tube, VWR®, Radnor, PA,
USA) until analyzed. Following a washout period (approximately 5 drug half-lives),
animals were crossed over to their next study group and the process repeated until each
animal had received all three treatments. After the last sample was collected for the last
study in each horse, a complete blood cell count and serum chemistry profile was

114
repeated.
In addition to pre- and post-complete blood cell count and serum biochemistry
monitoring, a physical examination was per- formed twice daily during the study period.
Horses were also observed for evidence of NSAID toxicity, including, abdominal
discomfort, weight loss, fever, or diarrhea. Any horses that elicited any of the above
clinical signs would result in the immediate discontinuation of the study for that horse,
confirmed diagnosis of gastric ulceration or NSAID toxicity, and initiation of necessary
treatment.
Sample Analysis
Horse plasma was analyzed for firocoxib concentrations by high pressure liquid
chromatography (HPLC) with ultraviolet (UV) detection. The HPLC system consisted of
a Waters 2695 separation module and a 2489 UV-Visible detector (Waters Oasis® HLB,
Waters Corporation™, Milford, MA, USA). Separation was achieved with a Sunfire C18,
5 µm, 150 x 4.6 mm column (Waters Oasis® HLB, Waters Corporation™, Milford, MA,
USA) maintained at 40 °C (M. T. Kvaternick V.; P. M. Kvaternick V.). The mobile phase
consisted of 45:55:0.025 acetonitrile/ water/trifluoroacetic acid (VWR®, Radnor, PA,
USA) with the flow rate set to 1 mL/ min (Cox S.; M. T. Kvaternick V.; P. M. Kvaternick
V.). The standard curve was generated ranging from 25 to 2,500 ng/mL by fortify- ing
equine plasma with known amounts of firocoxib (Toronto Research Chemicals Inc.
(TRC), Toronto, Ontario, Canada) reference standard and accepted if the coefficient of
determination (r2) was at least 0.999 and the predicted concentrations were within 10% of
the actual concentrations.

115
Firocoxib was extracted from horse plasma with solid phase extraction (SPE)
cartridges (3 mL, 60 mg) (Waters Oasis® HLB, Waters Corporation™, Milford, MA,
USA). Briefly, previously frozen plasma samples were thawed and vortexed. The SPE
cartridges were conditioned with 2 mL acetonitrile and then 2 mL water. Aqueous
plasma samples (1 mL of plasma plus 2.0 mL water) were loaded and allowed to elute by
gravity. The cartridges were rinsed with 2.0 mL of 5% acetonitrile in water (gravity
elution) and a vacuum of ~10 in of Hg was used to remove the residual solvent.
Firocoxib was eluted with 2.0 mL acetonitrile which was then evaporated to dryness
under a stream of nitrogen during 25 min at 40°C. The residue was reconstituted with
250 µL of 40% acetonitrile/water, with vortex/mixing for 20 sec and then the solution was
centrifuged at 1900 x g (M. T. Kvaternick V.; P. M. Kvaternick V.). The injection volume
was 100 µL. The retention time for firocoxib was 8.6 minutes and UV absorbance was
monitored at 290 nm (Cox S.; M. T. Kvaternick V.; P. M. Kvaternick V.).
Unknown concentrations of firocoxib in each sample were determined by
comparing the signal to a calibration curve. The standard curve was generated by
fortifying equine plasma with known amounts of firocoxib that ranged from 25-2,500 ng/
mL (Cox S.). A calibration curve was accepted if the coefficient of determination (r2)
was at least 0.999 and the predicted concentrations were within 10% of the actual
concentrations. The linear correlation coefficient for firocoxib was 0.9999. The lower
limit of detection was 10 ng/mL and the lower and upper limits of quantification (LOQ)
for firocoxib were 25 ng/mL and 2,500 ng/mL respectively. The relative measurement of
uncertainty (RSD %) for firocoxib 25, 100, 1,000, 2,500 and 5,000 ng/mL were 9.1%,
4.9%, 2.1%, 1.1% and 1.1% respectively. Intra and inter assay variability was less than

116
10% for all controls.
In order to determine appropriate handling, processing and storing of the firocoxib,
a bench top in vitro analysis was performed to determine whether or not firocoxib was
capable of binding to plastic tubes (especially important for sample collection and
storage). To do this, whole blood (6 mL) was collected from a horse and transferred into
a heparin glass containers (BD Vacutainer, Sodium Heparin, BD, Franklin Lakes, NJ,
USA). Plasma was separated by centrifugation at 1,900 g (3,000 rpm) for 30 min at room
temperature, and then transferred to either a glass or plastic disposable culture tubes and
spiked with firocoxib standard at 50, 1,000 and 10,000 ng/mL to test the binding of the
drug to the storage vial.
Plasma samples were allowed to sit 60 hours inside of refrigerator (4 °C) and then
tested under the same sample preparation procedure and HPLC chromatographic
conditions previously described. From this analysis, the area under the curve (AUC)
from time 0 (time of firocoxib injection into plasma) to 60 hours (time of completion of in
vitro study) of firocoxib was determined for both glass and plastic tubes.
In the second phase of this study, plasma samples were collected from private
practice veterinarians who were currently prescribing firocoxib as the canine preparation.
Samples were admitted into the study as long as the horse had been on a maintenance dose
of firocoxib (0.1 mg/kg once daily by mouth) for a period of 3 to 5 days, and were not
concurrently on any other medications at the time of the sample collection. Along with the
sample for submission, veterinarians were asked to record the horse’s age, breed, collection
time, time of last dose, reason for treatment, and perceived response. Whole blood
samples (10 mL) were collected from the external jugular vein at either a peak (2 hours

117
post dose) or trough (prior to the next dose). Once returning to the clinic, the whole blood
was separated into its components and the plasma achieved was frozen for transport to the
Auburn University Clinical Pharmacology laboratory for the samples to be evaluated with
HPLC as described above. A total of 42 samples were evaluated from the submitting
practices. Combining the therapeutic levels achieved from these samples with the
veterinarians submitting information (indicating reason for treatment, clinical response, or
adverse events), authors were able to quantify firocoxib levels plasma levels and compare
them to therapeutic response.
Pharmacokinetic Analysis
Plasma firocoxib concentration versus time data (both in vitro and in vivo) samples
were subjected to non-compartmental analysis (Phoenix Winnonlin,® Pharsight,®
Sunnyvale, CA, USA) using the log-linear trapezoidal method. Parameters of interest
included AUC (ng*hr/mL), Cmax (oral, mcg/mL) at time (Tmax;h); t1/2 (h); mean residence
time (MRT; h), mean absorption time (MAT [h] where MAT = MRT oral – MRTIV), and
absolute (AUCoral/AUCIV) and relative (AUCoral paste/AUCoral chews) bioavailability.
For in vitro samples, only AUC were determined. Descriptive statistics (mean + standard
error of the mean and 95th upper and lower confidence intervals) were generated for each
parameter. Parameters were compared between oral paste and chew using Proc GLM
(SAS/IML 9.1, User’s Guide: statistics, Cary, NC) using Tukey’s test for multiple
comparison for repeated measures. A one way ANOVA was used to compare differences
in the firocoxib plasma levels between sample collection groups.

118
Results
During the time course of the pharmacokinetic study, no animals appeared to experience any
adverse events. Further, physical examinations and clinical laboratory blood work did not
statistically differ and were within clinical reference ranges.
Pharmacokinetic parameters for each preparation are listed in (Table 5.1, Figure 5.1).
Relevant parameters with corresponding standard errors were: C0 (ng/mL): 268 ± 58; Cmax
(ng/mL): 143 ± 21 (paste); 135± 17 (chew); t1/2 (hr): 58 ± 19 (paste), 49± 11 (chew); 61 ± 42
(IV); AUC (ng/mL/hr): 8898 ± 2254 (paste); 8686 ± 2498 (chew); 8028 ± 3856 (IV). The
absolute bioavailability (F) of firocoxib was 90% ± 24% (paste) vs 91% ± 27% (chew). Relative
bioavailability for paste vs. chews was 108% ± 35%, indicating unity of absorption between the
two products. This study failed to find statistically significant differences in Cmax and absolute
oral bioavailability at a power of greater than or equal to 90%.

119
Figure 5.1. Firocoxib mean plasma drug concentrations (with SE) versus time in 8 apparently
healthy horses when administered at 0.3 mg/ kg as three different formulations.
Red = IV Equioxx®, Green = Equioxx® paste, Blue = Previcox®; SE = standard error of the
mean

120
Table 5.1. Mean pharmacokinetic parameters for firocoxib when administered as either canine
chews or equine paste in apparently healthy horses (n=8).
Parameter Route Mean SE Lower
CI
Upper
CI
AUC(ng/mL
/ hr)
IV 8028 3856 4172 11884
Chew 8686 2498 6187 11184
Paste 8898 2254 6645 11152
C0 (ng/mL) IV 268 58 210 326
Cmax
(ng/mL)
Chew 135 17 117 152
Paste 143 21 122 165
t1/2 (hours) IV 61 42 19 102
Chew 49 11 38 59
Paste 58 19 40 77
MRT IV 87 56 31 143
Chew 70 12 58 83
Paste 85 26 59 111
MAT Chew 13 13 -11 37
Paste 24 14 -2 50
Tmax (hours) Chew 4 1 -2 10
Paste 2 1 -4 8
CL (hours) IV 47 6 40 53
F Chew 91% 27% 64% 118%
Paste 90% 24% 66% 114%
Relative F 108% 35% 73% 143%
AUC = area under the curve; C0 = maximum plasma drug concentration after intravenous
infusion; Cmax =maximum plasma drug concentration; t1/2 = elimination half-life; MRT = mean
resonance time; MAT = mean absorbance time; Tmax =time to maximum plasma drug
concentration; CL = clearance; F = bioavailability
Significant differences could not be detected for any parameters between paste and chews. C0 =
maximum plasma drug con- centration after IV administration; Cmax =maximum plasma drug

121
concentration; AUC = area under the curve; t1/2 = elimination half life; CL = clearance; MRT =
mean resonance time, MAT = mean absorption time; F = bioavailability, Relative F (paste vs.
chews)

122
For the in vitro study, the AUC in plastic tubes was less than the AUC in glass tubes. The
percent difference for firocoxib AUC for 50, 1,000, and 10,000 ng/mL were 21.26%, 41.18%,
and 50.45% respectively (Table 5.2). From this methodology, we were able to determine the
necessity that the samples be collected and stored within glass tubes.
Table 5.2. Percent difference between firocoxib concentrations after being stored in either glass
or plastic tubes for 60 hours.
Glass
Tubes
Plastic
Tubes
AUC
(ng/mL/hr)
Firocoxib
Concentration
(ng/mL)
AUC AUC Glass vs.
Plastic
Percent
Difference
50 21151 16654 -4497 21.26%
1000 515677 303324 -212353 41.18%
1000
0
521849
3
2585592 -2632901 50.45%
AUC = area under the curve

123
A total of 42 samples were evaluated from submitting private practices. Of the samples
being submitted, all samples were evaluated from patients receiving the canine formulation of
firocoxib. Of the submitting horses, ages ranged from 5-26 years of age (mean = 14. 2 years, +/-
5.5 years). Breeds represented in the sample pool included: Domestic warm blood (n= 19),
Thoroughbred (n= 12), Quarter Horse (n= 4), Irish Sport Horse (n= 2), Standard Bred (n=1),
Irish Draft (n=1), Arabian (n=1), Morgan (n=1), Welsh cross (n=1), Quarter Horse/Thoroughbred
(n=1), and Thoroughbred/Warm Blood (n=1).
Sample collection times were broken down into three different groups: peak (0-2 hours
post- dose administration) n=7, mid dosing period (3-21 hours) n=28, and trough
concentration (22-26 hours) n = 9. Firocoxib concentrations for the peak dosing group were
65.16 ± 32.35 ng/mL; mid dosing 80.26 ± 54.65, and 60.38 ± 27.39 ng/mL. A statistical
difference of firocoxib drug concentrations between the treatment groups could not be
detected. The reason for treatment were broken down into soft tissue (n=12),
musculoskeletal (n=15), and generalized lameness (n=17). A favor- able response to
treatment was recorded in (n=35) and unknown in (n= 9).

124
Discussion
Although this study may have established equivalent bioavailability between the two
products, this study is not intended to support such extra label drug use. Indeed, other
considerations should be taken when using canine chews in horses. Accordingly, the
veterinarian prescribing or administering canine chews to horses in lieu of an equine
formulation is placing him or herself in a position to be held both criminally and civilly
liable for such use. Although this study may have established bioequivalence when an
equal mg/kg dose is administered, the canine preparation may not allow for the same level
of dosing accuracy that the equine paste presents. Thus, for a small horse (miniature, foal,
pony), an accurate dose can be metered out from the paste tube, but the smallest tablet size
of the canine chew is 57 mg. The tablets are only half scored, and the risk of unequal
distribution of drug within a tablet may prevent an equivalent dose from being administered
should a fraction of a tablet be administered. Thus, extra precaution is recommended when
smaller horses are being dosed.
The heme containing COX enzyme plays an important role in the production of
prostaglandins and thromboxane molecules that are responsible for the maintenance of normal
physiology of multiple organ systems, including inflammation, hemostasis, joint heath, renal
function, and the gastro- intestinal system. As such, nonselective inhibition of the COX
isoenzymes results in a narrow therapeutic window for these traditional drugs. Not
surprisingly, their use is associated with serious adverse events, including gastrointestinal
ulceration (both gastric and right dorsal colitis), renal and hepatic toxicity (dogs), and prolonged
bleeding times (Chapman; Cook V.L.; M. T. Kvaternick V.; Pollmeier M. Toulemonde C.;

125
Videla R.)
Although long-term use of firocoxib in horses at the recommended dose has not yet been
effectively assessed, the Adverse Event Reporting site at the Food and Drug Administration’s
Center for Veterinary Medicine indicates that oral ulcerations is the 3rd most common adverse
event thus far reported (Medicine). However, animal safety studies performed in horses during
the equine formulations approval process demonstrated that a 3- to 5-fold dose increase was
associated with ulceration of the oral gingiva and stomach, pathology associated with the
kidneys (tubulointerstitial nephropathy and papillary necrosis), and elevations in liver enzymes.
The chemical structure of firocoxib (a weak acid) facilitates efficient absorption from the
gastrointestinal tract at the level of the stomach. In the horse, firocoxib administered as the
paste has an absolute bioavailability of 79%, due to low first pass metabolism (via dealkylation
and glucuronidation) (Merial). In contrast, bioavailability of the drug in the dog based on the
package insert is cited at 38% (Merial). It is not clear if the differences between bioavailability
between the species are due to the active ingredient’s activity in the different gastrointestinal
systems or differences in the preparation itself (ie, chew tablet versus paste).
Once in circulation, firocoxib is highly protein bound (98%) to albumin. Despite this
high protein binding in horses, the unbound drug is characterized by a large volume of
distribution, which contributes to a long t1/2 (30 to 40 hours) in horses (Merial). The half-life in
horses is 3 to -10x longer than the t1/2 reported for other non-selective NSAIDs currently used to
control pain in horses (eg, phenylbutazone, flunixin meglumine, naproxen) (Letendre L.T.; P.
M. Kvaternick V.).
In contrast to horses, the elimination half-life of firocoxib in dogs is only 8 hours. The
longer half- life in horses impacts therapeutic use of firocoxib in several ways. First, it allows

126
once a day dosing in horses, facilitating owner compliance, as well as providing longer pain
relief. Second, the longer half-live firocoxib results in a 50- fold oral dose differential between
the two species: horses are dosed at 0.1 mg/kg/day compared to 5 mg/kg/day in dogs. It is this
50-fold difference in dose that has led equine practitioners to administer the canine preparation
rather than the approved horse product to equine patients. Despite the size difference, the
canine preparation is cheaper (approximately 50% more expensive) when dosed in horses.
Third, the longer t1/2 in horses also results in different times to steady-state between the
species. In dogs, firocoxib does not reach a true steady-state when using the labeled dosing
interval. However, in horses, with a 40-hour half-life, drug concentrations in horses will
minimally fluctuate during a 24-hour dosing interval. Further, because little drug is eliminated
during each interval, drug will accumulate with each subsequent dose until steady-state is
reached. Thus, the full effect of the drug in horses will not be realized until 3 to 5 drug half-
lives – or approximately 5 to 7 days – have lapsed once a dosing regimen is implemented. This
delay to steady-state necessitates a loading dose (0.3 mg/kg) in horses if a rapid onset in effect is
desired. By administering an initial loading dose, the patient reaches therapeutic drug levels
after the first dose and a clinical response is appreciated within the first 24 hours of treatment.
The Federation Equestre Internationale (FEI) has listed firocoxib as a controlled medication for
equine competitors. Firocoxib is commonly administered prior to sanctioned athletic
competitions and as such, studies at that loading dose are prudent.
Among the more important reasons to study firocoxib after IV administration of a loading
dose is the United States Equestrian Federation has established that maximum permitted plasma
concentration of firocoxib be less than 0.240 µg/mL at competition time (Internationale).
Compared to this standard, when firocoxib is administered at the manufacturer’s recommended

127
loading dose, drug levels were below the standard of limitations 30 minutes to an hour after IV
administration. After an oral loading dose, neither preparation (paste or chew) achieved levels
higher than USEF standards at any time point after the administration of medication.
In horses, NSAIDs are generally well absorbed from the gastrointestinal tract through oral
dosing. However, we were concerned that firocoxib would be less bioavailable when
administered as the chew compared to the paste for two reasons. First, in herbivores, and
specifically horses, oral medication may bind to hay or other ingesta, thus affecting oral
absorption and the ability of the drug to reach effective levels. Second, studies have
demonstrated variable oral absorption of NSAIDs in horses, depending on the formulation used.
For example, after administration of ketoprofen in an oil-based formulation, bioavailability in
horses was <5%. When the formulation was changed to a gelatin capsule, bioavailability
increased to 50% (Agency). A major difference between the paste and the chew are the inactive
ingredients; these could negatively impact oral absorption thus increasing potential for
therapeutic failure, or increased absorption, which would increase potential for an adverse event.
This study confirmed that despite the different formulations available for firocoxib, once
administered at the same mg/ kg dose, they are similarly bioavailable, and based on the
clinical samples collected, are capable of controlling both soft tissue and orthopedic pain.

128
Chapter 6. Pilot Study: Pharmacokinetics of the Antiepileptic Drug Zonisamide after Oral
and Rectal Administration in the Horse
“Every time you conduct a study, you run in front of the pharmacokinetic canon.
Sometimes you miss, other days you take a direct hit”
– Dr. Ralph Claxton
Abstract
The purpose of this study was to describe the disposition and time course of drug
concentrations of zonisamide when administered either orally or per rectum in the healthy horse.
Eight healthy adult horses were used in a randomized, crossover study. Under fasted conditions,
horses received zonisamide orally via nasogastric tube (20 mg/kg, PO), and per rectum (PR, 40
mg/kg) via a Foley catheter. Whole blood was collected intermittently for 72 hours post
administration. Zonisamide was quantitated in equine plasma using a homogeneous particle
enhanced turbidimetric immunoassay and time versus concentration data was subjected to non-
compartmental pharmacokinetic analysis. Descriptive statistics were reported for measurable
parameters. All animals appeared to tolerate zonisamide well at the doses administered. After
oral administration Cmax was 7.4 ± 9.6 µg/mL at Tmax: 4 ± 1.7 hours. MRT and disappearance
half-life were 21 ± 512.4 µg/mL and 14 ± 5.7 hours, respectively. AUC was 162 ± 278
µg/mL/hour. Zonisamide was not consistently detected after rectal administration. Zonisamide
(20 mg/kg PO) maintains serum concentrations in the human therapeutic range for 13 hours in
healthy horses and might be effective for treatment of seizures. In contrast, zonisamide was not

129
consistently detected after 40 mg/kg after rectal administration which does not support use of this
current dosing form in this route.

130
Introduction
Epilepsy in horses is relatively uncommon and occurs most frequently in foals or due to a
secondary condition in adults. Foals are more subject to seizures as they can be caused by
genetics, neonatal septicemia, hypoxic ischemic encephalopathy, metabolic disturbances such as
hypoglycemia and electrolyte abnormalities, bacterial meningitis or abscess, viral encephalitis,
medications, liver failure, trauma, and congenital anomalies (Aleman M.; Beaufrere H.;
Lacombe V.A.) In adult equine patients, brain injury secondary to a traumatic event is the most
common cause for seizure development. Common clinical signs associated with traumatic brain
injury include but are not limited to ataxia, aniscoria, flaccid paralysis, and abnormal mentation
such as hyperexcitability or lethargy (Smith).
Treatment and management of severe brain injuries in horses is expensive, labor
intensive and frequently results in a guarded to grave prognosis. For immediate intervention,
diazepam and midazolam have been employed in both foals and adult equine patients. Single
seizure episode control with diazepam is effective, relatively inexpensive, and simple; however,
recurrent seizures become more difficult to manage (Boothe D.M.).
For long-term seizure control, phenobarbital and potassium bromide have been the drugs
of choice to manage seizures in horses or foals. However, the high doses of phenobarbital
needed to control seizures results in hypothermia and decrease in respiratory drive which
ultimately leads to hypercapnia (elevation in CO2). Respiratory depression, which is more severe
in neonates because of their reduced hepatic clearance, makes longer term seizure control with
phenobarbital problematic in both practice and referral institution settings (Boothe D.M.).
Recently, levetiracetam has been used for seizure control in the equine patient. Serum
levetiracetam concentrations achieved are generally within the published therapeutic ranges for

131
dogs and cats; however, as in other species, the drug has a short half-life of six hours in horses
(Cesar). This short half-life would require frequent administration which is labor intensive as
well as cost prohibitive for long-term management.
Zonisamide, a synthetic sulfonamide, has been approved for treatment of epilepsy in
people. Zonisamide’s mechanism of action is diverse and includes: blockage of voltage-
dependent sodium and type T calcium channels, modulation of the dopaminergic system,
increasing GABA release from the hippocampus, and protecting neuronal membranes from
oxygen free radicals. Its therapeutic success in people has led to its use in companion small
animals and birds (Beaufrere H.; Boothe D.M.; Dewey C.W.). With a half-life of 30-48 hours in
canine patients, the drug can be administered at 12 to 24 hour intervals (Boothe D.M.). If this
long half-life were to occur in horses, there would be sustained seizure control at convenient
dosing intervals in comparison to levetiracetam.
In seizing or obtunded horses, rectal administration of a drug may be necessary due to
altered mentation and safety concerns (Feary D.J.). Drawbacks of rectal administration include
interruption of absorption due to defecation, patient acceptability, or binding of the drug
formulation to feces present within the rectum (A.G. De Bower). Ensuring that a product is
capable of oral absorption after rectal administration is key to determining its use in the clinical
setting. The objectives of this study were to describe the disposition and time course of drug
concentrations of a new antiepileptic, zonisamide, when administered either orally or per rectum
in the healthy horse.

132
Materials & Methods
Animals
This study was approved by the Institutional Animal Care and Use Committee for the
university. Using a randomized, crossover study design, healthy adult horses (n=8), weighing
between 409-591 kg were selected from the teaching herd at Auburn University. Complete blood
counts and serum biochemistry profiles were performed prior to study initiation and at study
completion. Using a randomization table, horses were assigned to one of two designated dosing
routes (oral or rectal administration) for the first treatment day, and then the route of
administration was switched for the second treatment day.
The day before drug administration (day 0), a physical examination was performed and
20 mL of blood withdrawn from the jugular vein for complete blood count and serum
biochemistry profile to ensure the animal had no underlying systemic disease. Horses were
fasted for eight hours prior to and two hours after study initiation.
Drug Administration
Once the dose of zonisamide was determined, the corresponding number of capsules
(Glenmark Pharmaceuticals, Mahwah, NJ) were opened and the powder inside the capsule was
completely dissolved with either 100 mL (rectal administration) or 1.5 L of water depending on
the route of administration.
For both routes of administration, manual restraint was employed using a twitch on the
horse’s nose. After nasogastric administration, the 1.5 L zonisamide suspension was
administered via a funnel followed by 800 mL of air to empty all liquid. The nasogastric tube
was removed immediately after drug administration. A Foley catheter gently guided by hand

133
and advanced six inches into the rectum, and100 mL zonisamide suspension was infused. Once
the drug was infused into the rectum, the Foley catheter and twitch were removed.
On the first day of dosing, a pilot dose determination study was performed. Horses were
administered either10 mg/kg zonisamide via a nasogastric tube (n=4) or 20 mg/kg rectally (n=2).
Serum concentrations (determined as described below) were considered subtherapeutic via both
routes. The zonisamide dose was subsequently doubled for each route (20 mg/kg PO and 40
mg/kg PR).
Sample Collection
Immediately prior to drug administration, an 8 cm diameter area in the jugular groove
was clipped and prepared in an aseptic manner for five minutes using a chlorhexidine solution
and isopropyl alcohol for sample collection purposes. A small local area of the skin was
anesthetized for catheter placement using 2.0 mL of 2% lidocaine solution. A 14 gauge 5.5 inch
intravenous catheter (MILA 14 G, MILA International, Florence, KY, USA) was placed in the
left jugular vein using sterile technique. Blood samples (5mL of whole blood that was discarded
and 5mL for the sample) were collected through the indwelling catheter through the catheter’s
injection cap at times 0 (prior to administration), 5, 15, 30 minutes, 1, 2, 4, 6, 8, 10, 12, 24, 36,
48, 60, and 72 hours after dosing. Blood was placed in red top tubes. Following collection of
each sample, the catheter was flushed with 5 mL of heparinized saline (Monoject PreFill IV
Flush, Cardinal Health, Dublin, OH). After the 24 hour sample had been collected, the
intravenous catheter was removed and all consecutive blood draws were done via venipuncture
with a 20G 1.5 inch needle and syringe (Monoject, Cardinal Health, Dublin, OH). Horses were

134
closely monitored for adverse events and a physical examination was performed every six hours
until completion of the study. Horses were returned to pasture after the 48 hour sample was
collected. Blood samples were separated into their components (packed red blood cells and
serum) by centrifugation at 1900 g (3000 rpm) for 15 minutes, and plasma was stored frozen at
-80°C until sample analysis.
Sample Analysis
Zonisamide concentrations were detected in equine plasma using a homogeneous particle
enhanced turbidimetric immunoassay (QMS® Zonisamide reagent, Siemens) with a Siemens
Dimension Xpand Plus® general chemistry analyzer (New York, NY). Unknown concentrations
of zonisamide in each sample were determined by comparing the signal to a five point
calibration curve. The standard curve was generated by fortifying equine plasma with known
amounts of zonisamide that ranged from 2-300 µg/mL. A calibration curve was accepted if the
coefficient of determination (r2) was at least 0.998 and the predicted control concentrations (5,
10, 25, 50 and 75 µg/mL) were within 10% of the actual concentrations. The lower and upper
limits of quantification (LOQ) for zonisamide were 2 µg/mL and 50 µg/mL, respectively, based
on the lowest and highest control that was studied and was accurately and precisely predicted
within 15%. Intra and inter assay variability was less than 10% for all controls.
Pharmacokinetic Analysis
For each horse, serum zonisamide concentration versus time was subjected to standard
non-compartmental pharmacokinetic analysis using computer assisted linear regression software
(WinNonLin®, v.7.0 Pharsight Corporation, Mountain View, CA). A programmatic correction

135
was used to record and adjust values depending on the dose each animal was administered..
Pharmacokinetic parameters reported in the study were: maximum serum drug concentration
(Cmax), time to maximum concentration (Tmax), mean residence time (MRT), disappearance rate
constant (kd), disappearance half-life (t1/2, determined from the relationship t1/2 = 0.693/kel), area
under the curve (AUC∞), and percent of the AUC that was extrapolated from the terminal
component of the curve (AUCextrapolated), the ratio of apparent volume of distribution (Vz/F) as
well as a ratio of apparent clearance (CLss/F) to bioavailability. Data included median ±
standard deviation and a 95% confidence interval.

136
Results
The clinically-relevant pharmacokinetic values for all oral administration are as follows:
maximum serum drug concentration (Cmax) was 7.4 ± 9.6 µg/mL), time to maximum drug
concentration (Tmax) was 4.0 ± 1.7 hours, and elimination half-life (t1/2) was 13.4 ± 5.7 hours.
Figure 4.2 depicts the zonisamide serum drug concentrations plotted against time course of study
after oral administration (representing both 10 mg/kg and 20 mg/kg dosing). All animals
apparently tolerated all drug administration with no evidence of adversity.
In the dose determination study, four horses were administered 10 mg/kg orally, and all
horses had detectable serum drug concentrations ranging from 5-9 µ/mL. These concentrations
were subtherapeutic to the concentration range (10-40 µ/mL) used for therapeutic drug
monitoring in human medicine. Four horses were administered zonisamide suspension at 20
mg/kg and achieved serum within the human therapeutic drug monitoring range (Figure 6.1,
Table 6.1).
For per rectum administration, all serum samples for each of the time points were below
the limit of quantification of the assay levels. Thus, no pharmacologic inferences could be
calculated from these values. All recommendations and conclusions are based on oral
administration.

137
Table 6.1. Combined pharmacokinetic parameters after oral administration of 10 and 20 mg/kg n
of zonisamide in apparently healthy horses (n=8).
Parameter Median STD Lower CI Upper CI
AUC
(µg/mL/hour) 162.4 278 -356 958
AUCextrapolated
(µg/mL/hour) 0.2 0.1 -0.1 25.1
MRT 21 8.5 -1.3 39.1
CL/F 1.5 1 -0.9 3.9
Cmax (µg/mL) 7.4 9.6 -9.6 35.6
Tmax (hour) 4 1.72 -0.2 50.6
Vd/F 965 785 -676 3036
t1/2 (hour) 13.4 5.7 -2.2 25
AUC = area under the curve; MRT = mean resonance time; CL/F = apparent oral clearance; Cmax
=maximum serum drug concentration; Tmax = time to maximum serum drug concentration; Vd/F
= apparent oral volume of distribution; t1/2 = elimination half-life; STD= standard deviation; CI =
Confidence Interval (95%)

138
Figure 6.1. Combined oral dosing (10 and 20 mg/kg) of serum zonisamide concentrations
plotted against time course of study (n=8). Data is reflected as the geometric mean and the 95%
Confidence Interval. Accompanying pharmacokinetic data is found in Table 6.1.
1
10
100
0 10 20 30 40 50 60
Zo
nis
amid
e S
eru
m C
on
cen
trat
ion
(µ
g/m
L)
Time (minutes)

139
Figure 6.2. Serum zonisamide concentrations plotted against time in apparently normal horses
receiving zonisamide at either 10 mg/kg (n= 4) or 20 mg/kg (n= 4). Data is reflected as the
geometric mean and the 95% Confidence Interval. Accompanying pharmacokinetic data is
found in Table 6.2.
1
10
100
-10 0 10 20 30 40 50 60 70 80Zonis
amid
e S
erum
Conce
ntr
atio
ns
(µg/m
L)
Time (minutes)
10 mg/kg 20 mg/kg

140
Discussion
Treatment and management of severe brain injuries in horses is expensive, labor
intensive and frequently results in a grave to guarded prognosis. For immediate intervention,
diazepam and midazolam have been employed in both foals and adult equine patients. Single
seizure episode control with diazepam is effective, relatively inexpensive, and simple; however,
recurrent seizures become more difficult to manage (Papich). For long-term seizure control,
phenobarbital and potassium bromide have been the drugs of choice to manage long term
seizures in horses or foals. However, the high doses of phenobarbital needed to control seizures
results in hypothermia and decrease in respiratory drive which ultimately leads to hypercapnia
(elevation in CO2). Equine patients treated with potassium or sodium bromide can present with a
multitude of dose-dependent adverse effects that are considered unacceptable including: central
nervous system effects (such as depression, drowsiness, sedation, stupor, recumbency, ataxia,
and paresis), gastrointestinal tract problems (such as inappetence, weight loss, and pancreatitis),
muscle pain and skin disorders (Raidal). In comparison, zonisamide has minimal side effects
that are limited to thyroid hormone suppression when levels are above the therapeutic range.
More recently, the use of levetiracetam has been evaluated in the equine patient (Cesar).
However, with such a short half-life, the drug must still be dosed every four to six hours to
maintain levels within therapeutic ranges. In comparison, zonisamide’s long half-life allows for
twice daily dosing which is more convenient for administration and owner compliance. Also,
with sustained drug levels throughout a day, the patient is less likely to experience the significant
peaks and troughs seen with levetiracetam that contribute to break through seizures.
In seizing horses, it is often difficult to administer oral medications due to altered
mentation and safety concerns. Medications such as diazepam and metronidazole have been

141
shown to be absorbed readily through the mucosa after administration per rectum in dogs and
horses (Papich; G. M. Steinman A.) In these patients, therapeutic drug levels necessary for
seizure control or therapeutic levels have been achieved through administering drugs per rectum
at two to three times the oral dose recommended in patients. One of the limiting factors with this
study is how the product was prepared for administration to the horses. Administration of
zonisamide in this study was designed to simulate clinical application. Based on the patient
dose, the corresponding number of capsules (100 mg) were opened and the powder was
dissolved with water depending on the route of administration. Similar to what has recently been
reported in canine patients zonisamide does not appear to be absorbed per rectum (Brewer).
In both routes of administration, the serum concentrations were lower than what was
expected in patients where the capsule was administered in an intact fashion as has been studied
in humans and small animals (Boothe D.M.). One of the limitations in this study as well as in
equine practice is the need to alter dosage forms in order to treat the patient. Further evaluation
may need to be done to look at methods to administer the whole capsules to horses in order to
achieve a more accurate indication of serum drug concentrations.
Despite having a low sample size (n=4), dosing at 20 mg/kg of zonisamide appears to
reach published human therapeutic levels and as such, might be considered as a possible
alternative for treating epilepsy in the equine patient. None of the horses experienced any
adverse events during the course of the pharmacokinetics studies as well as all maintained
complete blood counts and serum biochemistry profiles within clinically normal limits. Since
zonisamide was well received in healthy adult horses, it should be a consideration for use in
equine patients with seizure activity as well as serve for pilot data for use in foals.

142
Chapter 7. Cannabinoid Pharmacology
“Just take a look with me right here…”
-Dr. Robert Judd
Cannabinoid Receptor
The endocannabinoid system has been shown to be both complex and multimodal as it
plays an important role in the regulation and function of many physiological processes. Areas
that have been described include both the central and peripheral nervous systems, physiologic
functions (cognition, behavior, and memory), motor control, pain sensation, cardiovascular
function, immunoregulation, and gastrointestinal motility (Boisselier R.L.).
The mechanism by which cannabinoids behave within the human body was developed in
parallel with the discovery of the opioid receptors, and led to the discovery and identification of
endocannabinoid receptors and their endogenous cannabinoid ligands. The activities of the two
systems include similar inhibitory actions on nociception, gastrointestinal and cardiac function,
and stress (Di Marzo V.; J. N. Hill A.J.; Hosking R.D.; Rice).
Although endocannabinoids, phytocannabinoids, and synthetic molecules all have
different chemical arrangements, structure activity models have shown that these 3D protein
configurations have the ability to interact with the cannabinoid receptors in a similar way.
Cannabinoids can bind to at least two rhodopsin like-G-protein coupled receptors (GPCR) family
A receptors: the cannabinoid receptors (CB1R and CB2R) as well as the orphan G-protein

143
coupled receptor (GPR55). When a GPCR ligand (such as a cannabinoid) activates the G-
protein’s alpha subunit, GTP is exchanged for GDP which then dissociates and causes secondary
signaling. Cyclic adenosine monophosphate (cAMP) formulation is inhibited by Gi/o proteins
leading to a decreased protein kinase A dependent phosphorylation and conversion of AMP to
cyclic AMP. Binding to the cannabinoid receptor may also modulate ion channels in the
presynaptic nerve by inhibiting the N- and P/Q-type calcium channels and activation of inward
rectifying potassium and potassium A channels. (Boisselier R.L.; Di Marzo; Di Marzo V.;
Hosking R.D.).
CB1R is mainly expressed in the brain, spinal cord, and dorsal root ganglia (Rice, 2002).
In the brain, CB1R is present with a high density in the olfactory bulb, cerebral cortex,
hypothalamus, hippocampus, striatum, and cerebellum. Within the spinal cord, CB1R is present
in all areas associated with the processing of nociceptive information including within the
superficial dorsal horn, dorsolateral funiculus, and lamina X. CB1R it is the primary receptor
responsible for the psychoactivity of both the physiological effects of the endocannabinoids as
well as the psychotropic effects of the exogenously administered cannabinoids (Boisselier R.L.;
Grotenhermen; Hohmann A.G.; Hosking R.D.; Rice).
CB1R receptors mainly act presynaptically through a retrograde signaling system that
suppresses neurotransmitter release. Endocannabinoids released from the neuron activate
presynaptic CB1R which then inhibit the voltage gated calcium channels and reduces the release
of both excitatory (glutamate) and inhibitory (GABA) ligands. Depending on the dose and
affected brain regions, researchers have determined that interactions of the endocannabinoids and
GABAergics cells may be crucial in the regulating motor response, anxiety, as well as abuse and
dependence to drugs or alcohol by modulating the effects of the nicotinic cholinergic system.

144
Through activation of the CB1R, N-methyl-D-aspartate (NMDA) receptor activity is decreased,
resulting in a decrease in the excitotoxicity (Boisselier R.L.; Grotenhermen; Hohmann A.G.;
Hosking R.D.; Rice).
CB1R receptors are also found to a lesser extent in the peripheral tissues including
cardiovascular, gastrointestinal, reproductive, musculoskeletal, and skin. In the enteric nervous
system, CB1R activation has been shown to inhibit gastric acid secretion, cause relaxation of the
lower esophageal sphincter, decrease intestinal motility, and mediate the effects of visceral pain
as well as inflammation. In the cardiovascular system, CB1R helps to mediate the heart rate as
well as blood pressure. In the kidney, activation of the CB1R plays an important role in renal
physiology by regulating vascular hemodynamics and stimulating ion movement in different
areas of the nephron (Boisselier R.L.).
Anandamide (AEA) was the first endocannabinoid to be isolated and found to be widely
distributed in the porcine brain. AEA binds to the CB1R acting like as a partial agonist at low
concentrations and a full agonist at higher concentrations. Degradation of AEA occurs post-
synaptically and at intracellular membranes into arachidonic acid and ethanolamine by fatty
amide hydrolase (FAAH) (Di Marzo; Hosking R.D.). Interestingly, 2-arachydonylglyceraol (2-
AG) is present at a 170-fold higher concentration than AEA in brain, and despite a low binding
affinity, acts as a full agonist on the CB1R (Rice).
CB2R shares between 44-66% sequence homology with CB1R with the highest homology
present in the transmembrane region (Rice 2002). CB2R was initially identified in macrophages
in the marginal zone of the spleen and was later found to be highly expressed in the tonsil. Of
the circulating human immune cells, the highest concentration of CB2R mRNA was found in the
B-lymphocytes and natural killer cells, a moderate amount in monocytes, and minimal in

145
polymorphonuclear cells. Within the gastrointestinal tract, activation of the CB2R receptors are
likely to work in conjunction with the CB1R to inhibit visceral inflammation and pain. CB2R
receptors are also found in the CNS, primarily on neurons and microglia (Boisselier R.L.).
Publications have proposed that 2-AG may also be the optimal endogenous ligand for the
CB2R (Rice). Degradation of 2-AG occurs post synaptically in the cytosol and at intracellular
membranes by monacylglycerol lipases (MAGLs) to form arachidonic acid and glycerol (Di
Marzo; Hosking R.D.). AEA also binds to the CB2R, however, but it does not evoke an
appreciable effect of receptor mediated activity (Rice).

146
Cannabinoid Ligands
Three major groups of ligands for the cannabinoid receptor have been characterized:
endocannabinoids, phytocannabinoids, and synthetically manufactured cannabinoids. No matter
the orientation of the chemical compound, all of the cannabinoids have a wide range of effects
on various parts of the mammalian body depending on which receptor subtype binding affinity
(Boisselier R.L.).
Endocannabinoids are produced “endogenously” by mammals but were not characterized
until 1992. Several endocannabinoids have been isolated in the brain including: anandamide
(AEA), 2-arachydonylglyceraol (2-AG), noladin ether, virodhamine, and N-
arachydonoyldopamine (NADA). Anandamide and 2-AG are the two most clearly defined
endocannabinoids that have been characterized in scientific literature (Boisselier R.L.; Hohmann
A.G.).
Unlike hormones that are stored in secretory vesicles, endocannabinoids are produced
from calcium sensitive biosynthetic pathways that are can be stimulated. In neurons, there is an
elevation of intracellular calcium caused by post-synaptic neuronal depolarization or stimulation
of post-synaptic neurotransmitter release which stimulates the enzymes catalyzing the
biosynthesis of AEA and 2-AG in one of two pathways. In the first pathway, pre-synaptic
neurotransmitter release stimulates a post synaptic G-protein-coupled receptor (GPCR). Once
the GPCR is stimulated, phospholipase C (PLC) is activated, membrane phosphatidyl inositol 4,5
bisphosphate (PIP2) is cleaved and forms inositol triphosphate (IP3) and diacylglycerol (DAG).
IP3 and DAG mobilize intracellular calcium stores which activates diacylglycerol lipase to form
2-arachydonoylglycerol (2-AG). In the second pathway, post-synaptic calcium channels allow
an elevation of intracellular calcium stores. Elevation in the calcium activates N-acyl transferase

147
(NAT) which combines with phosphoatidyl-ethanolamine (PhosEA) and phosphatidyl-choline
(PhosC) to create N-arachidonoyl-phosphatidyl-ethanolamine (NAPE). Phospholipase D is
cleaves NAPE to make anandamide (AEA).
A total of 66 phytocannabinoid subtypes, named according to the dibenzopyran system,
have been identified. Phytocannabinoids are chemicals present in the resin secreted from
trichromes that are produced within the Cannabis sativa herb. Of the subtypes,
cannabichromene (CBC), cannabidiol (CBD), tetrahydrocannabinol (9 THC), cannabicyclol
(CBL), cannabielsoin (CBE), cannabinol (CBN), cannabinodiol (CBDL), and cannabitriol
(CBTL) have been evaluated in scientific literature. Within the plant, phytocannabinoids are
synthesized from fatty acid precursors via a series of transferase and synthase enzymes. Once
the fatty acid becomes activated, geranyl pyrophosphate acts on olivetolic acid (the phenolic
precursor) to make cannabigerol (CBG). From here, 9 THC, CBD, and CBC synthase enzymes
react with CBG to create their specific phytocannabinoids with pentyl side chain groups.
Interestingly, during periods of storage, 9 THC has been appreciated to be broken down to
CBN (Boisselier R.L.; Grotenhermen; Hosking R.D.).
To date, the most important cannabinoids present in the plant are 9 THC, CBD, CBC,
and CBG. The vast majority of scientific research has been done looking at the psychoactive
tetrahydrocannabinol (9 THC) and nonpsychoactive cannabidiol (CBD). The molecules of 9
THC as well as its metabolites are low molecular weight (~300 Da), highly lipophilic and water
insoluble, with an octanol:water partition coefficient ranging from 6,000 – 9,440,000.
(Boisselier R.L.; Grotenhermen; Hosking R.D.).
Cannabidiol (CBD) was the first phytocannabinoid to be isolated from the Cannabis plant
in 1930-1940s. In 1960s, CBD was employed as an anticonvulsant due to having similar

148
pharmacologic effects as phenobarbital and diphenydantion (DPH) (P. L. Mechoulam R.;
Reddy). Besides anti-convulsant effects, CBD has been used for its anxiolytic, anti-psychotic,
and anti-nausea effects.
The psychotropic effects of marijuana are produced by the phenols of 9 THC. Within
the Cannabis sativa plant, the 9 THC is present as a ratio acids and phenols. The ratio of 9
THC acids to phenolic 9 THC phenols present within the leaves and flowers varies depending
on the location as well as climate where the plant was grown (Grotenhermen; P. L. Mechoulam
R.; P. M.-R. Mechoulam R.).
In the 1970s, synthetic cannabinoids were developed as probes to help investigate the
endogenous cannabinoid system. However, since the 2000s, they have been found to have
elaborate popularity in recreational drug use with extensive abuse as an alternative to
phytocannabinoid use (Boisselier R.L.).
One way to differentiate cannabinoids is to evaluate their affinity and selectivity for each
of the receptors. Table 1 describes the receptor affinity for each group of cannabinoids. CBD
has very low affinity for the cannabinoid receptors; however, it serves as an antagonist for CB1R
and CB2R agonists.

149
Table 7.1. Cannabinoid and receptor relationships with corresponding response.
Cannabinoid Type of
Cannabinoid
CB1R
Affinity
CB2R
Affinity
Receptor
Response
2-Arachidonoyl
glycerol
(2-AG)
Endocannabinoid Low – High
(depending on
authors)
High Agonist
Anandamide
AEA
Endocannabinoid Good
(Agonist)
Poor Agonist
9 THC Phytocannabinoid Moderate Moderate Partial Agonist
(CB1R)
CBD* Phytocannabinoid Low Low Agonist
Various Synthetic
Cannabinoids
Stronger
Affinity than
Endo and Phyto
Stronger
Affinity than
Endo and Phyto
Agonist
*may interact with other targets

150
Pharmacokinetics of Cannabinoids
Pharmacokinetic evaluation of the cannabinoids is challenging for many different reasons
including low analyte concentrations, rapid and extensive metabolism, and differentiation of the
cannabinoids from normal matrix of the animal (Huestis).
Absorption
The absorption characteristics of both 9 THC and CBD have been described after
various routes of administration in people and dogs. Each of these are described below.
Intravenous
People - A double-blind, randomized, and placebo control study has been used to
investigate the pharmacokinetic and pharmacodynamic responses of intravenous administration
of 9 THC in humans. Patients in this study were administered 0, 2.5 and 5 mg of 9 THC.
After 10 minutes, the peak plasma THC concentrations were 8287.4 (2.5 mg) and 119.2 166.5
(5 mg) (Huestis). Radiolabeled CBD was administered at a dose of 20 mg and achieved levels of
37-61 ng/mL (n = 3, mean 48.4 ng/mL). Based on the calculated area under the curve after
intravenous administration, a plasma clearance of 960-1560 mL/min was determined (Ohlsson
1986).
Dogs - After intravenous dosing of 3.75-5.63 mg/kg, CBD distribution into tissues was
rapid but had a prolonged terminal elimination half-life of 9 hours (Samara E.).

151
Inhalation
People - The time course of plasma concentration of inhaled 9 THC resembles
intravenous administration. After only a single puff of a cannabis cigarette, 9 THC was
detectable in the blood stream at levels just below intravenous administration – indicating that
inhalation is an efficient method of drug delivery. Bioavailability varied according to depth of
inhalation, puff duration, breath hold, and frequency of resulting with a range of 2-56%
(Grotenhermen; Huestis). Accumulation of 9 THC in the lung after exposure has been
documented due to the extensive perfusion to the lung and high uptake of basic compounds into
lung tissue (Huestis). In Ohlsson’s study, plasma blood concentrations were compared between
intravenous and inhalation administration of deuterium labeled CBD. The average
bioavailability of CBD in patients after smoking was 31 13%, with a fourfold difference
between routes (Ohlsson A.).
Oral
People - Absorption of 9 THC is slower and the plasma drug concentrations are lower
than when administered either inhaled or intravenously. Vehicles of administration of the 9
THC may also affect absorption with evidence glycocholate and sesame oil based medium
resulting in increased absorption. Based on its high octanol:water partition coefficient (estimated
to be between 6,000 and 9 x 10^6 depending on the method of detection), dose, route of
administration, and physiological factors all have affect absorption of 9 THC. Oral
administration of 9 THC has been shown to be highly variable with peak maximal plasma drug
concentrations ranging from 60 minutes to six hours with high inter and intra subject variability.
Oral bioavailability of 9 THC has been reported to be highly variable at 4-20%. Recently,

152
formulation development has been evaluated to either employ the use of nanoparticles to deliver
the active ingredient or to use excipients to cross link and create barrier forming polymers to
protect the active ingredient and minimize first pass metabolism (Badowski; Conte R.;
Grotenhermen; Huestis; Punyamurthula N.S.) CBD concentrations have been evaluated in
people after oral intake at a variety of doses. Agurell detected 1.1-11 ng/mL of CBD one hour
after administration of chocolate cookies containing 40 mg of CBD (Agurell S.). After
administration of 5.4 mg of CBD orally, Nadulski reported CBD concentrations ranging from
0.3-2.57 ng/mL one hour after oral administration (Nadulski T.).
Dogs - Multiple pharmacokinetic studies have evaluated the oral administration of a CBD
product. At a dose range of 7.5-11.25 mg/kg, it was originally noted that the CBD
bioavailability was low and highly variable (0-19% of the dose). From this, authors concluded
that it may be due to the gelatin capsule formulation as well as first pass metabolism occurring in
the liver (Samara E.).
Bartner evaluated oral administration of both microencapsulated oil beads as well as a
CBD infused oil at two different dosing (75 and 150 mg administered every twelve hours. In this
study, the maximum plasma CBD concentration was significantly higher (649.43 and 903.69
ng/mL for dogs receiving the oil formulation than the microencapsulated beads (364.93 and
546.06 ng/mL, respectively). When comparing the pharmacokinetic results from the two doses,
the overall CBD exposure appeared to be dose-proportional. The CBD oil formulation also had
the smallest amount of inter-subject variability. In this study, the half-life was noted to be
shorter two and three hours, in comparison to what was appreciated after intravenous
administration (Bartner L.R.; Samara E.).
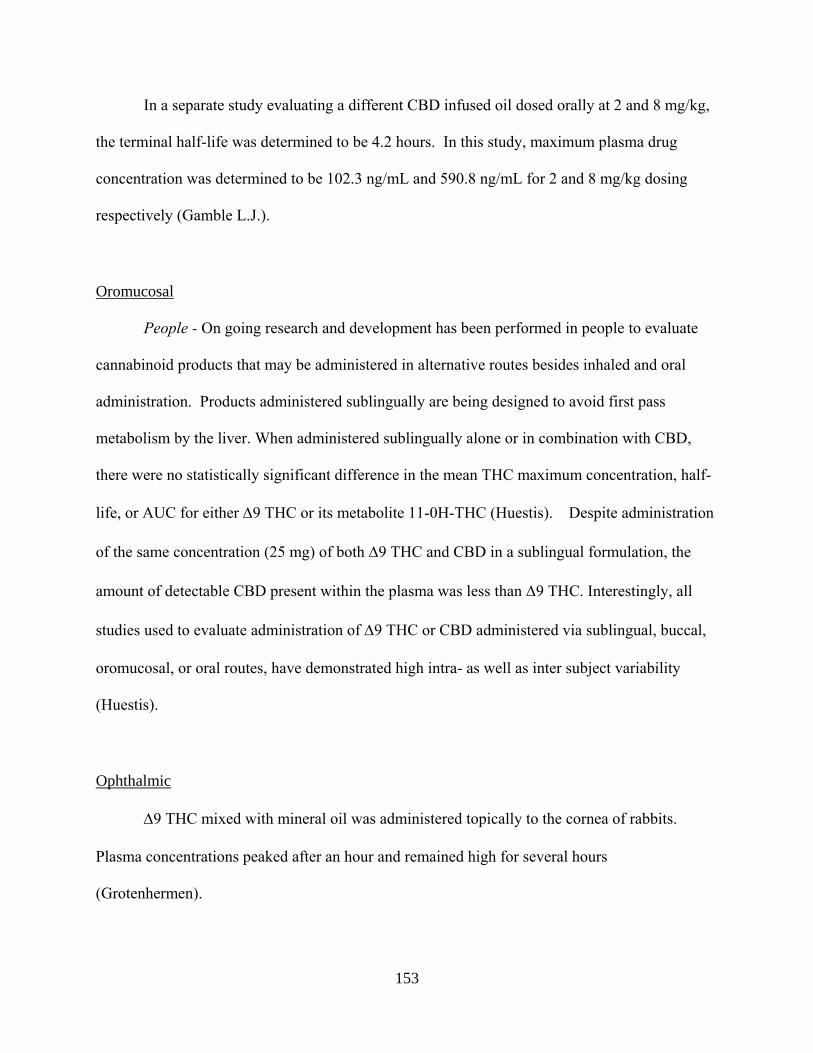
153
In a separate study evaluating a different CBD infused oil dosed orally at 2 and 8 mg/kg,
the terminal half-life was determined to be 4.2 hours. In this study, maximum plasma drug
concentration was determined to be 102.3 ng/mL and 590.8 ng/mL for 2 and 8 mg/kg dosing
respectively (Gamble L.J.).
Oromucosal
People - On going research and development has been performed in people to evaluate
cannabinoid products that may be administered in alternative routes besides inhaled and oral
administration. Products administered sublingually are being designed to avoid first pass
metabolism by the liver. When administered sublingually alone or in combination with CBD,
there were no statistically significant difference in the mean THC maximum concentration, half-
life, or AUC for either 9 THC or its metabolite 11-0H-THC (Huestis). Despite administration
of the same concentration (25 mg) of both 9 THC and CBD in a sublingual formulation, the
amount of detectable CBD present within the plasma was less than 9 THC. Interestingly, all
studies used to evaluate administration of 9 THC or CBD administered via sublingual, buccal,
oromucosal, or oral routes, have demonstrated high intra- as well as inter subject variability
(Huestis).
Ophthalmic
9 THC mixed with mineral oil was administered topically to the cornea of rabbits.
Plasma concentrations peaked after an hour and remained high for several hours
(Grotenhermen).

154
Rectal
Human – The rectal bioavailability of the cannabinoid products have been variable
depending on the suppository formulation; however, administration of the products rectally
reduced the first pass effect seen after oral administration. When compared to the oral route,
rectal administration was found to be two times more bioavailable due to increased absorption as
well as decreased effects of first pass metabolism (Grotenhermen; Huestis).
Transcutaneous
Human – Transdermal delivery of cannabinoids reduces the negative side effects seen
with inhalation dosing and avoids first pass metabolism. Cannabinoids are highly hydrophobic,
making transport across the aqueous layer of the skin the rate limiting step of the diffusion
process. In comparison, the permeabilities of CBD and CBN were 10-fold higher than that of
THC, indicating that the physicochemical properties of CBD may lend itself to application in this
manner (Huestis). However, in humans as with mice, it appears that CBD accumulates within
the stratum corneum of the epidermal layers and is not well absorbed (Barry; Lodzki M.).
Dog – Bartner evaluated a CBD-infused transdermal cream administered topically to the
pinna of dogs after a 75 and 150 mg dose. In their study, they demonstrated that the CBD
infused transdermal cream reached a significantly lower plasma drug concentration than the
other two oral formulations evaluated in the study. Authors surmised that this was due to
possible CBD accumulation within the stratum corneum as well as thickness of the pinna skin
(Bartner L.R.).

155
Distribution
Distribution of 9 THC and CBD into tissues have been evaluated in people. Plasma
drug concentrations reach peak highs after both intravenous and inhalation administration of 9
THC after 20-30 minutes and decreased to baseline after four hours. 9 THC has been shown to
be highly lipophilic and moves rapidly from plasma into highly vascularized tissue such as liver,
heart, lung, kidney, placenta, adrenal cortex, and thyroid and pituitary gland. 9 THC has also
been shown to bind to adipose tissue which is its long-term storage site (Grotenhermen; Huestis).
9 THC – 9 THC has an alkaline pKa (10.6) and is very lipophilic, both of which
facilitate distribution of the molecule to the brain, fatty tissues, and lungs. Distribution of 9
THC has been well characterized in humans with 90% being distributed into the plasma with an
initial volume of distribution of 2.5-3L indicating high protein binding. The metabolites THC-
COOH and THC-COOH glucuronide have shown to have a similar protein binding
characteristics as the THC parent compound (Brunet B.; Huestis).
In regularly using patients, the initial volume of distribution was found to be quite larger
with a volume of distribution to be 6.38 4.1 L. The increase in volume of distribution is due to
persistent drug concentrations being detected in the peripheral adipose tissue of the human
patient. In a repeat, consecutive dosing study evaluated in people, the ratio of fat to brain 9
THC concentration was 21:1 after seven days, and increased to 64:1 after 27 days of exposure.
At steady state concentrations, the volume of distribution becomes significantly larger at 10
L/kg. From these studies, researchers have suggested that fatty acid conjugates of THC and 11-
OH-THC may be formed which lead to the increased stability of the compounds in the fat tissue
(Grotenhermen; Huestis).

156
In animals and people, 9 THC rapidly crosses the placenta whereas the two metabolites
cross the placenta less efficiently. 9 THC has also been shown to concentrate in breast milk of
humans due to the highly lipophilic nature of the milk itself (Huestis).

157
Metabolism
Protein binding, enterohepatic circulation, extensive accumulation, and prolonged release
from adipose tissue contribute to the prolongation of metabolism of the cannabinoids in any
species. In fact, it has been found that the rate limiting step of 9 THC in becoming metabolized
has to do with redistribution of the cannabinoid from the adipose tissue into blood for processing
in the liver.
For Phase 1 of cannabinoid metabolism, oxidative metabolic patterns dominated by
hydroxylation, hydrolysis, N- and O- dealkylation, or deamination taking place on the aliphatic
chains or substituted aromatic rings. From these reactions, over 80 metabolites have been
identified for 9 THC. The major metabolites of 9 THC are 11-hydroxy THC (11-OH-THC)
and 11-nor-9-carboxy-THC (THC-COOH). Of these metabolites, 11-OH-THC is the only one
that may contribute to the pharmacological activity equal to or greater than 9 THC (Brunet B.;
Dinis-Oliveira; Stott C.).
Secondary pathways of metabolism involve carboxylation and glucuronidation. For
instance, THC-COOH is glucuronidated to 11-nor-9-carboxy-THC glucuronide. Once
metabolism has been completed, multiple derivatives are assembled that will have various
affinity for either the CB1 or CB2 receptors leading to either a perceived clinical effect, storage of
the molecule, or elimination from the body. Conjugates of 11-OH-THC with long chain fatty
acids are stored within tissues while other molecules will become polarized to facilitate renal
clearance (Boisselier R.L.; Dinis-Oliveira; Grotenhermen). Similar to 9 THC, CBD is subject
to extensive first pass metabolism with primary oxidation of the ninth carbon to the alcohol and
carboxylic acid. However, a larger portion of the dose is excreted unchanged in the feces
(Huestis).

158
Many studies have investigated the metabolism of cannabinoids in human hepatocytes,
liver microsomes, or the fungus Cunninghamella elegans. From these studies, it was determined
that the cannabinoids undergo extensive first pass metabolism where cytochrome P450 enzymes
(CYP2C9, 2C19, and 3A4) are the primary mediators of the metabolic reactions. Each
metabolic reaction is specific for the particular cannabinoids as well as the species to which the
product is administered. In Stott’s study where a 9 THC/CBD oromucosal spray was
administered in conjunction with known drugs that either had an inhibitory or induction of CYP
enzymes, it was found that both 9-THC and CBD inhibit CYP1A1, 1A2, and 1B1 during in
vitro analysis. Also, during the in vitro analysis, CBD was appreciated to be an inhibitor of
CYP3A4 as well as CYP2C19; however, this was only appreciated at high concentrations (IC50
= 6-9 M). Despite evidence of inhibition, authors concluded that it was not very likely that 9-
THC nor CBD would cause a relevant inhibition of CYP450 enzymes at current dosing with
available formulations (Stott C.).
For endocannabinoids, fatty acid binding proteins (FABPs) are responsible for
transferring AEA from the membrane proteins to fatty acid amide hydrolase (FAAH) for
metabolism into ethanolamine and arachidonic acid. Metabolism of 2-AG is hydrolyzed into
AEA and glycerol by FAAH or monoacyl glycerol lipase (MAGL) (Hohmann A.G.; Nagarkatti
P.).

159
Elimination
Elimination of the cannabinoid parent compound as well as metabolites have been
described in terms of elimination from the plasma as well as excretion from the body.
In people, after intravenous administration of 9 THC, an equilibrium is reached six
hours after administration between plasma and tissues. Similarly, after smoking either a low (15
mg) or high dose (34 mg) 9-THC cigarette, the concentration of the THC-COOH metabolite
was detectable for 3.5 days (2-7 days) for the low and 6.3 days (3-7 days) for the high dose. The
major reason for the slow elimination of 9 THC from the plasma is due to the delayed time
taken for redistribution of the 9 THC from the tissue back into the blood. Calculation of the
true elimination half-life is difficult to determine due to this delayed time of redistribution but
also the low plasma drug concentration (Grotenhermen).
In one human study, after oral and intravenous administration, elimination half-life was
similar for 9 THC (25-36 hours). Longer half-lives of THC have been appreciated in animals
after higher doses and longer periods of measurement with ranges of 12.6 days with a period of
observation of four weeks. However, care should be taken when interpreting whether THC
could be reliably distinguished from the metabolites which may overestimate the length of the
half-life.
Human studies have shown that 9 THC is excreted from the body as acid metabolites
with the majority being excreted in feces (65-80%), 20-35% in urine, and less than 5% excreted
unchanged in feces. Due to the extremely lipid soluble nature of the cannabinoids, there is a
significant amount of renal tubular reabsorption, leading to low levels of excretion and a single
dose of 9 THC may result in a detectable metabolites from three up to 12 days. This also

160
applies to the 9 THC metabolites with the primarily metabolite of THC-COOH acid
glucuronide having a half-life of 30-60 hours depending on the monitoring period (Dinis-
Oliveira; Grotenhermen).
Repeated dosing of 9 THC has been shown to decrease renal clearance from maximum
of 1.2L/h (20 mL/min) at 100 minutes to 0.06 L/h (1 mL/min) after four days of 9 THC
administration. Clearance of CBD has been shown to be similar to 9 THC ranging from 58 – 94
L/h (960-1500 mL/min). The excretion of metabolites in urine (16% over 72 hours) is similar to
that of 9 THC; however, there is a higher percentage of unchanged CBD excreted in feces
(Grotenhermen).

161
Pharmacodynamic Effects on People
Effects of cannabis in people has been well characterized as being a sedative, anxiolytic,
and induction of thought disruption. Phytocannabinoids differ in their psychoactivity with 9
THC having the greatest effect, cannabinol (CBN) is 90% less psychoactive, and cannabidiol
(CBD) lacks psychoactivity entirely (Boisselier R.L.; Hosking R.D.). Psychotropic effects seen
clinically are seen after the peak plasma drug concentrations have been achieved. Rodent studies
using radiolabeled 9 THC have illustrated that the maximal radioactivity was reached in the
brain after two to four hours, and the concentrations achieved were 0.06% of the administered
dose. When translated to the human population, researchers also found that the amount of
radiolabeled drug present was less than 1% of the administered dose (Huestis).
Phytocannabinoids have also been shown to protect neurons from toxic stimuli or prevent
degeneration through ligand reactions with the CB receptors or mediating innate antioxidant
properties on the central nervous system. Cannabidiol (CBD) has shown to have a positive effect
on attenuating psychotic, anxious, and depressive behaviors (Boisselier R.L.; W. C. Hill A.J.).
Cannabinoids play a minor role in vascular function in the normal patient; however,
profound effects may be appreciated in patients with altered cardiovascular disorders.
Cannabinoid use increases myocardial oxygen demand which could induce several cardiac
adverse events including myocardial ischemia, coronary thrombosis, and vasospasm (Boisselier
R.L.).
Tolerance to cannabinoid administration has been appreciated in people receiving 30 mg
of 9 THC every four hours for 10-12 days. In the tolerant state, few pharmacologic changes

162
were noted with the exception of increased clearance (605 to 977 mL/min) and initial volume of
distribution (2.6 to 6.4 L/kg).

163
Pharmacodynamic Effects on Dogs
Recently, Gamble conducted a randomized, placebo-controlled, veterinarian and owner
blinded cross over study in osteoarthritis (OA) affected dogs that were administered CBD oil (2
mg/kg) or placebo oil every twelve hours for 4 weeks. Veterinary assessments and owner
questionnaires were performed at baseline as well as at weeks two and four of treatment. In this
study, there were no observable side effects and the canine brief pain inventory and Hudson
activity scores showed a significant decrease in pain and increase in activity (Gamble L.J.). This
was the first documented study in scientific literature documenting a desirable pharmacodynamic
response to treatment with a cannabinoid.

164
Chapter 8. Pharmacokinetic and pharmacodynamics characterization of a CBD oil in the
horse after oral and transmucosal administration
“Come to the dark side, we have cookies”
-Dr. Jennifer Taintor
Abstract
The purpose of this study was to describe the disposition and time course of drug
concentrations of CBD and Δ9 THC when administered transmucosally to healthy horses. Under
fasted conditions, thirteen healthy adult horses were administered a cannabinoid oil (0.1 mg/kg)
transmucosally. Whole blood was collected intermittently for 72 hours post administration.
Pharmacodynamic variables were evaluated for indication of sedation over the course of 24
hours after administration. Cannabinoids were quantitated in equine serum using liquid
chromatography-tandem mass spectrometry triple-quadrupole (LC-MS) and time versus
concentration data was subjected to non-compartmental pharmacokinetic analysis. Descriptive
statistics were reported for measurable parameters. All animals appeared to tolerate the
cannabinoid well at the dose administered. After transmucosal administration, Cmax was 27.2 (13
- 53.9) ng/mL at Tmax: 2.9 (1.9 - 4.3) hours. MRT and disappearance half-life were 18 hours (11-
94 - 28) and 15 hours (9 - 25), respectively. AUC was 247.1 (166.1 – 367.8) ng/mL/hour.
Cannabinoid oil (0.1 mg/kg) was well tolerated for administration to horses; however, the dose
appears to be too low to evaluate pharmacodynamics effects. However, initial pilot data using
oral administration of a cannabinoid “cookie” was well tolerated at 14 mg/kg twice daily for
seven days.

165
Introduction
Changes in the regulation of products containing cannabinoids has led to an increase in their
medical use (Krietzer 2009; Burns 2006). Cannabidiol, a cannabinoid derived from the Cannabis
plant is not associated with the adverse psychotropic effects typical of tetrahydrcannabinoid (Δ9
THC) yet may maintain many of the therapeutic benefits of THC. Passage of the 2014 and 2018
Farm Bills should lead to path for the legal use of cannabidiol (CBD) derived from industrial
hemp, thus increasing medicinal cannabinoid use. Industrial hemp was defined by the 2014 Farm
Bill to be Cannabis sativa plants that contain not more than 0.3% Δ9 THC or other tetra
cannabinoids on a dry matter basis. The 2018 Farm Bill removes CBD derived from industrial
hemp from regulation by the Drug Enforcement Agency and legalizes it from the federal
standpoint throughout the United States. However, marijuana or any cannabinoid constituents
that are not approved by the Food and Drug Administration as a drug and are derived from
marijuana remain Schedule 1 drug with the DEA. For Industrial Hemp, the Secretary of the
United States Department of Agriculture has been charged with developing procedures and
protocols whereby a crop and subsequent products containing CBD have been verified to
originate from an industrial hemp cultivar of Cannabis sativa. Once this pathway is established,
veterinarians should expect clients to treat animals with industrial hemp oil products. Indeed,
currently supplements comprised of non-psychotropic cannabinoids are being marketed
specifically for equine patients to treat pain arising from: musculoskeletal pain (osteoarthritis,
lameness associated with soft tissue injury, or laminitis and/or visceral (diarrhea, colic, enteritis,
and pleuropneumonia).
The efficacy and potency of cannabinoids in producing anti-nociception comparable to
that of morphine and has been the driving force for evaluation of this product for pain control in

166
the equine patient (Hohmann A.G.). However, multiple challenges exist regarding the scientific
basis for use of cannabidiol in horses. In the absence of mandated premarket assessment, the
quality of products in terms of content of cannabinoids (both strength and specific chemicals),
other herbal-based pharmacologically active ingredients (e.g., terpenes, flavonoids) and
potentially detrimental compounds (i.e., herbicides, pesticides, drugs) cannot be verified.
Further, the disposition of the products is likely to vary both because of formulation differences
as well as species differences in those factors that influence compound absorption. Among these
latter concerns is the extent of first pass metabolism which is likely to vary among species.
Likewise, the design of dosing regimens is dependent on the elimination half-life of the
compound of interest. These and other factors can influence the amount and type of cannabinoid
that causes pharmacodynamic response and as such, should be understood prior to the
implementation of clinical trials that provide evidence of efficacy and safety.
The objectives of this study were to: 1.) describe in normal, healthy horses the disposition
of cannabidiol (presented in a cookie or oil) after single dose oral or transmucosal
administration; and 2.) Record pharmacodynamic measurements associated with specific
cannabidiol serum concentrations. The data collected herein should serve as a template for
future studies involving dietary supplements containing cannabidiol.

167
Materials & Methods
All procedures were approved by Auburn University’s Institutional Animal Care and Use
Committee (IACUC).
Pilot Study
Three adult horses (528-578 kg) diagnosed with navicular syndrome by gait analysis
using a Lameness Locator using diagnostic blocking (nerve and/or intraarticular anesthesia) and
confirmed through radiographs were used in this study. Horses had not been treated with any
intra articular medications for six months prior to study start or any other medications for two
weeks prior to study start. The day before drug administration (day 0) and at the close of the
study (day 7), a physical examination, complete blood count, and serum biochemistry profile
were performed. Each horse was administered cookie product containing 360 mg of CBD (14
mg/kg by mouth twice daily, 12 hours apart (morning and evening) for seven days (Canna-
Biscuits for Dogs, Maple Bacon MaxCBD, Canna-Pet, Seattle, WA).
The pharmacodynamic response to therapy in this pilot study was evaluated using the
Lameness Locator which is a body mounted, inertial sensor system that objective analyzes horse
gait at a trot on a flat surface. Evaluations were performed at baseline and daily during the
course of treatment. Whole blood samples were collected at two and 12 hours after each dose.
Harvesting of serum and serum cannabinoid analysis was performed as described below.
Neither Δ9 TCH nor CBD were detected at any time point in any horse during the 7 day period.
A small amount of CBC was detectable. No animal demonstrated improvement in lameness.
Based on this, authors were led to believe that horses may be similar to humans and the
cannabinoids undergo first pass metabolism, thus leading to decreased levels being present in the

168
bloodstream (Samara E.). Authors used this pilot study to develop as a foundation for selecting a
formulation as well as dose that would more likely yield quantifiable levels of CBD.
Animals
Adult apparently healthy adult geldings (n=13) weighing at least 450 kg were studied.
The sample size was determined to be sufficient to define, with 95% confidence, the true
population mean of either the area under the curve or Cmax with an interval that varies by 40%
around the mean. The day before drug administration (day 0), a physical examination and
complete blood count and serum biochemistry profile were performed to identify potential
underlying systemic disease. Horses were fasted for eight hours prior to and two hours after
dosing.
Sample Collection
Immediately prior to drug administration, an eight cm diameter area in the jugular groove
was clipped and prepared in an aseptic manner for five minutes using a chlorhexidine solution
and isopropyl alcohol for sample collection purposes. A small local area of the skin was
anesthetized for catheter placement using 2.0 mL of 2% lidocaine solution. A 14 gauge 5.5 inch
intravenous catheter (MILA 14 G, MILA International, Florence, KY) was placed in the left
jugular vein using sterile technique.
Each horse was administered a dose of 0.1 mg/kg CBD contained in hemp oil (12.6 mg
CBD/mL). An aliquot of the oil was held for analysis to confirm cannabinoid content. The dose
(ranging from 3 to 4 mL) was applied topically over the maxillary mucosa proximal to the
incisors and in the interdental space to avoid oral ingestion.

169
Whole blood (20 mL after five mL waste) was collected via the catheter into heparinized
tubes (BD Vacutainer, Sodium Heparin, BD, Franklin Lakes, NJ, USA) at 0 (prior to dosing),
and 5,15, 30, 45 minutes 1, 1.5, 2, 4, 6, 8, 10, 12, 16, 24, 36, 48, 60 hours after dosing. After
sampling, the catheter was flushed with five mL heparinized saline (Monoject PreFill IV Flush,
Cardinal Health, Dublin, OH). After the 24 hour sample was collected, the IV catheter was
removed and the whole blood collected from the jugular vein through venipuncture with a 20G
1.5 inch needle and syringe (Monoject, Cardinal Health, and Dublin, OH, USA). Blood samples
were separated into their components (packed red blood cells and serum) by centrifugation at
1900 g (3000 rpm) for 15 minutes and serum was stored at -80°C until samples were processed.
Pharmacodynamic Assessment
These pharmacodynamic evaluations took place at baseline, 1, 6, 12, and 24 hours after
administration. Pharmacodynamic responses evaluated included sedation, ataxia, response to
stimuli (auditory and touch), as well as avoidance reactions to mechanical stimuli. Responses
were evaluated in all horses the day prior to the study (baseline) and at three different time points
after administration of the CBD oil (1, 6, 12, and 24 hours after administration).
The degree of sedation was based on physical examination, and specifically heart and
respiratory rates as well as the height of the lowest point of the lower lip from the ground (T. P.
Love E.J.). The degree of ataxia was assessed on a four point numerical scale: no change from
normal non sedated state (0); stable but swaying (1); swaying and leaning against the wall (2);
swaying, leaning on the wall with carpi flexed and/or hind limbs crossed (3). Finally, the horses’
response to auditory stimulation (hand clap 60 cm from head) and touch (running hand from ears
to shoulder) was assessed in a similar numerical scale: no reaction (0), slight head movement

170
with no limb movement (1), vigorous head movement with no limb movement (2), vigorous head
movement with movement of one or more limb (3). Nociception was assessed by applying a
pressure algometer with a 1 cm2 rubber plunger tip perpendicularly to mid cannon bone as well
as along the axial spine at approximately 10 kg/cm2/s over two to three seconds until a local
avoidance reaction is elicited. Avoidance reactions included would be skin twitching (1), local
muscle fasciculation (2), lifting of the thoracic limb (3), or stepping away from the pressure (4)
(Haussler; M. J. Love E.J.; T. P. Love E.J.).
During the course of the study, the horses were closely monitored for the most common
signs of marijuana toxicity following ingestion include bradycardia, hypotension, depression,
ataxia, hypersalivation, weakness, hypothermia and seizures (Donaldson).
Sample Analysis
Horse serum was analyzed for CBD as well as 9-THC using a liquid chromatography-
tandem mass spectrometry triple-quadrupole (LC-MS) (Ammann J.; Raharjo T.J.). The
UHPLC=MS system consisted of an Agilent 1290 system coupled with an Agilent 6460 Triple
Quad Mass Spectrometer (Agilent Technologies, Santa Clara, CA, USA) equipped with an
electrospray ionization (ESI) interface. Separation was achieved with a Zorbax Eclipse Plus
C18 column (Agilent Technologies, Santa Clara, CA, USA). The mobile phase consisted
of 0.1% Formic Acid and acetonitrile (VWR®, Radnor, PA, USA) with the flow rate set to 0.5
mL/min.
Cannabinoid standards for product analysis and for serum analysis were made by adding
to either sesame oil or equine serum known amounts of following cannabinoids: CBG, CBD,
CBN, Δ9-THC, and CBC. The standard curve was generated for both CBD and 9 THC ranging

171
from 0.98 to 1,000 ng/mL by fortifying equine serum with known amounts of CBD and 9
THC as reference standards and THC-D3 as internal standard (Cerilliant a Sigma-Aldrich®
company, Round Rock, TX, USA), and accepted if the coefficient of determination (r2) was at
least 0.999 and the predicted concentrations were within 20% of the actual concentrations. The
cannabinoids were extracted from horse serum with solid phase extraction (SPE) cartridges (3
mL, 60 mg) (Waters Oasis® HLB, Waters Corporation™, Milford, MA, USA). Briefly,
previously frozen serum samples were thawed and vortexed. The SPE cartridges were
conditioned with 2 mL methanol and then 2 mL distilled water. Serum samples were prepared
for solid phase extraction by combining 1.5 mL of serum with 1.5 mL of acetonitrile and 60 L
of internal standard. The tube was vortexed for 20 seconds and then centrifuged at 3000 rpm for
12 min at 5C. Two mL of the supernatant were then loaded into the cartridge and allowed to
elute by vacuum. The cartridges were rinsed with 1.0 mL of water and a vacuum of ~10 in of Hg
was used to remove the residual solvent. Cannabinoids were eluted with 1.5 mL methanol
which was then evaporated to dryness under a stream of nitrogen during 30 min at 40 °C. The
residue was reconstituted with 60 µL of methanol, with vortex/mixing for 20 sec and then the
solution was centrifuged at 14,000 rpm for 10 minutes at room temperature. Forty five L of the
clear supernatant was transferred to a sampling vial for the LC-MS. The injection volume was 1
µL. The retention time for CBD and 9 THC was 1.35 min and 2.39 min respectively. The
LOD was established at 1.95 ng/mL and the LLOQ was 3.9 ng/mL. The lower limit of
quantitation (LOQ) in equine serum currently was 25 ng/mL with < 15 % precision and accuracy

172
Pharmacokinetic Analysis
Serum compound concentrations versus time curves were analyzed by non-
compartmental analysis using pharmacokinetic software (Phoenix WinNonLin®, Pharsight
Corporation, Mountain View, California, USA). Non-compartmental analysis was performed
using the linear-log trapezoidal option for determination of the area under the concentration
(AUC) versus time (Phoenix WinNonlin®). From this, the following were determined:
maximum serum drug concentration (Cmax), time to maximum concentration (Tmax), mean
residence time (MRT), disappearance rate constant (kd), disappearance half-life (t1/2, determined
from the relationship t1/2 = 0.693/kel), area under the curve (AUC∞), percent of the AUC that was
extrapolated from the terminal component of the curve, and the ratio of apparent volume of
distribution (Vz/F). Data included geometric mean ± standard deviation and a 95% confidence
interval.

173
Results
The CBD oil contained the following concentration of cannabinoids (mg/mL, followed
by % composition) in descending order of concentration: CBD (12.6 mg/mL; 1.4%), CBC (0.77;
0.09%). Δ9-THC (0.5 mg/mL; 0.06%), CBG (0.2 mg/mL; 0.03%), and CBN (0.2 mg/mL;
0.03%).
Transmucosal dosing of the horses (3-4 mL) occurred without issue (head shaking, nose
rubbing, or actively trying to lick product off gums). All horses were closely monitored up to
five minutes after administration and no visible volume was lost from their mouths; however, the
amount swallowed could not be quantitated.
The time course of measurable serum cannabinoids across time are demonstrated in
Figure 8.1. Key pharmacokinetic parameters for the transmucosal oil (Table 8.1) were:
maximum serum drug concentration (Cmax): 27.2 (13.8-53.8) ng/mL, time to maximum
concentration (Tmax): 2.9 (1.9-4.3) hour , mean residence time (MRT): 18.3 (11.9–27.96),
disappearance half-life (t1/2): 15 (19-25.13) hour, area under the curve (AUC): 247.1 (166.1-
367.84) ng/mL/minute, ratio of volume of distribution to bioavailability (Vd/F): 8851 (4730-
16550) mL/kg, and ratio of clearance to bioavailability (Cl/F): 405 (270-600) mL/min/kg.

174
Table 8.1. Mean pharmacokinetic parameters for CBD when administered in apparently healthy
horses (n=10).
Parameter Geometric Mean Lower CI Upper CI
AUC∞ (ng/mL/minutes)
247.1
166.1
367.8
AUC%extrapobs
(ng/mL/min) 6 2.4 14.9
Cmax (ng/mL) 27.2 13.8 53.8
Tmax (hours) 2.9 1.9 4.3
T1/2 (hours) 15.2 9.2 25.1
MRT (hours) 18.3 11.9 28
CL/F (mL/min/kg) 405 270 600
Vd/F (mL/kg) 8851 4730 16550
AUC = area under the curve; Cmax = maximum serum drug concentration; Tmax = time to
maximum serum drug concentration; t1/2 = elimination half-life; MRT = mean resonance time;
CL/F = ratio of apparent oral clearance; Vd/F = ratio of apparent oral volume of distribution; CI
= Confidence Interval (95%).

175
Figure 8.1. Serum equine cannabinoid concentrations (CBD and Δ9 THC) with corresponding
standard deviations over the time course of the study (n=13). Data is reflected as the geometric
mean and the 95% Confidence Interval. Accompanying pharmacokinetic data is found in Table
8.1.
0.10
1.00
10.00
100.00
1 6 11 16 21 26 31 36 41 46
Can
nab
ino
id C
on
cen
trat
ion
(n
g/m
L)
Time (hours)
CBD (ng/mL) THC (ng/mL)

176
During the course of the study, no horse demonstrated sedation, ataxia, or depressed
response to auditory or touch stimuli. There was not a significant change from baseline levels of
heart and respiration rates. No substantive lowering of the head to the ground occurred in any
animal throughout the course of the study. All values for sedation may be reviewed in Table 8.2;
Figure 8.2. There was no evidence of withdrawal response to pressure placed on the dorsal
aspect of the mid-cannon bone or along the epaxial muscles at any of the time points throughout
the course of the study.

177
Table 8.2. Evaluation of sedation for horses (n=13) over the first 24 hours after administration.
Examination Heart Rate
(bpm)
STD Respiration Rate
(bpm)
STD Lower Lip Height
(inches)
STD
Initial 49 16 20 5 125 8
1 hour 45 13 20 3 125 8
6 hour 42 5 19 4 124 7
12 hour 42 4 17 3 126 10
24 hour 43 4 17 3 128 7
Heart Rate bpm = beats per minute; Respiration Rate bpm = breaths per minute; STD = standard
deviation

178
Figure 8.2. Evaluation of sedation and serum CBD concentration for horses (n=13) over the first
24 hours after administration in graphical form.
49.2
45.4
41.5 41.8 42.5
19.8 20.1 18.917.2 17.1
125.4 124.6 123.8 126.2 127.7
0
12.516.8
4.71.8
0
20
40
60
80
100
120
140
0
10
20
30
40
50
60
Initial 1 hour 6 hour 12 hour 24 hour
Mea
sure
men
t
Examination
Heart Rate (bpm) Respiration Rate (bpm)
Lower Lip Height (inches) CBD Serum Concentration (ng/mL)

179
Discussion
Pain management in the equine patient is a major concern to owners and veterinarians as
it impacts the animals’ quality of life. The first line of defense for pain management in the
equine patient is the use of NSAIDs, such as phenylbutazone, or more recently COX-2 selective
products such as firocoxib. Despite their improved safety, use of newer NSAIDs, including the
coxibs, are potentially associated with life threatening adverse drug events. Because their use
inhibits prostaglandin production, a decrease in gastrointestinal mucosal blood flow, mucous
production, and increased hydrochloric acid secretion can result in gastric and intestinal
ulceration. Adequate blood flow to the gastric mucosa is critical for preventing ischemia and
subsequent hypoxia induced-cellular acidosis and release of enzymes which may damage the cell
membrane leading to necrosis (Videla R.). Diarrhea secondary to recommended, overdose, or
chronic use of NSAIDs has also been well documented experimentally and retrospectively. Other
side effects implicated in the use of NSAIDs include renal papillary necrosis (Chapman).
The mechanism by which Δ9 THC behaves within the human body was developed in
parallel with the discovery of the opioid receptor, and led to the discovery and identification of
endogenous cannabinoid ligands and their respective endocannabinoid receptors (Di Marzo; Di
Marzo V.; Hosking R.D.). Similar to opioids, endogenous endocannabinoid ligands are capable
of acting as agonists or antagonists on their corresponding receptors (Di Marzo). Activation of
CB1R receptors causes inhibition of voltage-activated calcium channels, reducing the release of
excitatory (acetylcholine) and inhibitory (GABA) neurotransmitters. Clinically, this produces a
variety of clinical effects, including inhibition of nociception (sensation and pain), decreased
gastrointestinal and cardiovascular function, and anxiety (Pinto L.).

180
Pharmacokinetic evaluation of the cannabinoids is challenging for many different reasons
including low analyte concentrations, rapid and extensive metabolism, and differentiation of the
cannabinoids from normal matrix of the animal (Huestis). In people, oral administration of the
9 THC and CBD has been shown to be highly variable with peak maximal serum drug
concentrations ranging from 60 minutes to six hours with high inter and intra subject variability.
Also, 9 THC oral bioavailability has been reported to be high variable at 4-20%. Vehicles of
administration of the Δ9 THC may also affect absorption with evidence glycocholate and sesame
oil based medium resulting in increased absorption. In this study, it appears that horses also
reach maximal serum drug concentrations between 1.9 and 4.3 hours, which is similar to what
has been reported in dogs (Badowski; Conte R.; Gamble L.J.; Grotenhermen; Huestis;
Punyamurthula N.S.).
Many studies have investigated the metabolism of cannabinoids in human hepatocytes,
liver microsomes, or the fungus Cunninghamella elegans. Using these studies, it was determined
that the cannabinoids undergo extensive first pass metabolism where cytochrome P450 enzymes
(CYP2C9, 2C19, and 3A4) are the primary mediators of the metabolic reaction. In horses, the
CYP3A subfamily, coded by six functional and one pseudo gene, contains significantly more
members than people. Each metabolic reaction is specific for the particular cannabinoids as well
as the species to which the product is administered. In a comparative study evaluating human-
horse sequence analysis, the four genes of the human CYP3A family correspond to seven
potential closely linked genes responsible for cannabinoid metabolism (D. S. Schmitz A.; Z. J.
Schmitz A.).
Based on the results of the current study, it appears that the dose of the CBD
administered transmucosally is absorbed by the equine patient with high variability with a

181
prolonged half-life (15 hours). These results are consistent with what has been described in both
rodent as well as human species. The low detectable levels of both CBD and 9 THC as well
large volume of distribution appreciated in this study is indicative most likely due to the low
dose administered as well as distribution of the cannabinoids to the adipose tissue of the equine
patients. In further work, care should be taken when increasing the dose administered to the
horse due to the long half-life. As with firocoxib administration, the canine dose is 5 mg/kg,
whereas the corresponding equine maintenance dose is 0.1 mg/kg. It is this 50-fold difference in
dose that allows once a day dosing in horses, facilitating owner compliance, as well as providing
longer pain relief.
In both Gamble and Bartner’s pharmacokinetic studies, dogs were administered CBD
infused oil dosed orally at 2, 8, 10, and 20 mg/kg with a corresponding maximum CBD
concentrations at: 102.3 ng/mL, 590.8 ng/mL, 649.43, and 903.69 ng/mL, respectively (Barton
M.H.; Gamble L.J.). In this study, horses received a dose of (0.1 mg/kg) with a Cmax of 27.2
(13.8-53.8) ng/mL. Using the data collected from dogs, and assuming linear and stationary
kinetics, the current data set has the potential to be extrapolated to higher doses in future studies
such as 2 mg/kg to parallel the canine studies.
The assay for this study was designed to look only for CBD and 9 THC. However, in
the absence of no evidence of marked pharmacodynamics responses, this study can conclude at
least at the concentrations of CBD achieved in this study, there is no evidence of abnormal
physiologic responses. For further work, developers may consider also screening for the major
active metabolites of 9 THC since there was evidence of this particular cannabinoid in the
serum collected.

182
Cannabinoids have a combination of stimulant and depressive effects on the central
nervous system with clinical effects of euphoria, talkativeness, increased perception of external
stimulation, dizziness, and sedation. Phytocannabinoids have also been shown to protect
neurons from toxic stimuli or prevent degeneration through ligand reactions with the CB
receptors or mediating innate antioxidant properties on the central nervous system (Hill 2012).
Cannabidiol (CBD) has shown to have a positive effect on attenuating psychotic, anxious, and
depressive behaviors (Boisselier, 2017).
Based on the wide dispersion of the endocannabinoid receptors, applications for pain
management may be expanded to both lameness and visceral studies. However, since the
endocannabinoid receptors are closely related and function similarly to the opioids, caution
should be used when treating patients at high dose. Clinical signs were associated with CBD
concentrations ranging from 10-10,000 ng/mL (Samara E.). Any further studies should include a
dose titration evaluation so as not to put patients at further risk.
Investigation into alternative products for effective management of orthopedic or soft
tissue pain with minimal side effects and ease of administration is needed. While a cannabinoid
product is more appealing than pure marijuana as an analgesic, data supporting scientific
evaluation of these products is essential to determine the efficacy, safety, and quality assurance
such that there is scientific justification for its use. Another consideration is the status of CBD in
terms of state and federal DEA regulations. The legalization of industrial hemp may ultimately
result in CBD products for medical use in animals, including horses. However, realistic
application of this product in clinical use may be limited in horses because of the very large dose
to be administered unless a different formulation is created with a higher CBD concentration.
That being said, owners are able to order CBD products readily on the internet and have them

183
directly shipped to their home. A final consideration regarding the use of these products is the
quality of formulations in the absence of regulations that mandate pre-market assessment of
labeled content. Not all products are accurately labeled, and thus may contain less CBD than
labeled, as well as inappropriate concentrations of 9 THC. This may be problematic both for
assessment of efficacy and safety, but also for horses entering competitive events. Most
recently, racing associations as well as USEF and FEI have banned the use of cannabinoid
products in competitive animals.

184
Potential Therapeutic Targets of Cannabinoids
The primary drive of evaluating cannabinoids in the equine patient has been to treat pain
and inflammation. However, the cannabinoids are being evaluated in many areas of pathology in
human medicine that warrant review and potential evaluation for the equine market.
Central Nervous System
Use of cannabis for hyperexcitability has been documented as far back as to the Arabic
scholar al-Mayusi in 1100 AD and again in the 15 century when the historian Ibn al-Bardri
recorded that the cannabis "cured the epileptic son of the caliph’s chamberlain completely” (W.
C. Hill A.J.).
In the 1970s, the phytocannabinoids were evaluated for their effects on seizure states
using the electroshock model (MES) in hum. At that time, the studies revealed that the potency
of the phytocannabinoids were as follows 9 THC>CBD>CBN. Although 9 THC was found to
be the most potent, its effects on hyperexcitability disorders can be unpredictable and has been
shown to have evidence of contradictory central excitement or pro-convulsant effects. CBD was
also evaluated in a subset of animals using the MES, audiogenic, cobalt, picrotoxin, 3-
mercaptopropionic acid, isonicotinic acid, bicuculine, hydrazine, strychnine, pentylenetetrazole
(PTZ), pilocarpine, and penicillin induced seizures in murine species model for seizure
generation (J. N. Hill A.J.). Authors concluded that CBD had the greatest protective index when
compared to the traditional antiepileptic drug phenobarbital. When administered at a dose of
>100 mg/kg CBD was effective as a nontherapeutic agent; however, when administered in
combination, there was evidence of differential effects. CBD enhanced the anticonvulsant
effects of phenytoin or phenobarbital but decreased the effects of chlodiazepoxide, clonazepam,
trimethadione, or ethosuximide (W. C. Hill A.J.).

185
The contribution of CBD to treating epilepsy has not been fully elucidated and much of
that is due to the poorly understood mechanism of action of CBD within the central nervous
system. However, the anticonvulsant effects of CBD has been primarily isolated to the neuronal
CB1R targets, resulting in alterations of glutamate release. Hill reported that CBD and CGB are
sodium channel blockers at micromolar concentrations in human and murine neurons and
recombinant cells; however, in their model, these effects did not relate to anticonvulsant activity
(2014). Authors have also hypothesized that the overall mechanism of action of CBD in seizure
control may involve a more complex system of second messengers that suppress
neuroinflammation and peripheral inflammatory factors (Jones N.A.; Reddy).
In humans, there is growing evidence to support that endocannabinoids as well as the
cannabinoid receptors may play a crucial role in pathology associated with patients affected by
epilepsy, multiple sclerosis (MS), Alzheimer’s, Parkinson’s, or amyotrophic lateral sclerosis. In
each of these neurologic pathologies, there is evidence of hyper active glial cells as well as
infiltration of peripheral blood leukocytes (W. C. Hill A.J.; P. M.-R. Mechoulam R.). .
Multiple sclerosis (MS), Alzheimer’s disease (AD), and Parkinson’s disease (PD) all
have distinct pathologies; however, they all exhibit two similar clinical signs of inflammation
and neurodegeneration. Neuroinflammation has been characterized by the activation of
microglia and release of inflammatory agents and has now been determined to be a significant
cause of neurodegeneration. In disease states such as AD and PD, neurodegeneration is
characterized by the progressive loss of viable neurons within one or more regions of the CNS
leading to specific deficits that increase in severity as the disorder progresses. In patients
suffering from the autoimmune disease MS, the neurodegeneration component of the disease
becomes more profound as the clinical signs become more apparent. Nabilone, a 9 THC

186
analog available in Switzerland, the United Kingdom, and Canada is labeled for use for treatment
of chemotherapy induced nausea and vomiting; however, case reports are present with its use for
treating spasticity in patients with MS.
There is currently very little human data available for phytocannabinoid use in
neurodegenerative disorders; however, increasing amount of preclinical evaluations have shown
promise that CBD may be able modulate immune cell activity in the CNS and limit oxidative
stress creating in a neuroprotective effect (W. C. Hill A.J.; P. M.-R. Mechoulam R.). Sativex,
the licensed formulation containing a combination of 9 THC and CBD, has been shown to
decrease the symptoms associated with MS. For instance, Mechoulam (2002) reported that both
natural and synthetic CBD suppress the production of TNF by LPS activated mouse
macrophages (P. L. Mechoulam R.).
Cancer
The application of cannabinoids in the field of cancer management is restricted palliative
treatment of nausea and vomiting caused by chemotherapeutic administration. The first placebo
controlled study demonstrating efficacy of 9 THC for the treatment of chemotherapy induced
nausea and vomiting was published in 1975. In humans, there are three cannabinoid agonists
currently available on the market: dronabinol, nabilone, and cannabis medicinal extract.
Dronabinol, a synthetically manufactured Schedule III 9 THC molecule is available in the
United States as an appetite stimulant in patients with HIV or for chemotherapy induced nausea
and vomiting. With positive response from this application, pre-clinical studies have been
initiated to evaluate various effects of both 9 THC and CBD on various cancers. However,
pharmacodynamic response to oral 9 THC administration is highly variable depending on the

187
route administered, the product used if administered orally (capsule vs. solution), as well as high
intra-subject variability (Badowski; Boisselier R.L.; P. M.-R. Mechoulam R.).
Ocular
As discussed previously, the endocannabinoid system is present in both the anterior and
posterior ocular tissue, including the retina. Cannabinoid products applied to topically to the
produces several clinical effects including hyperemia, reduced tear production as well as
intraocular pressure.
As with any translational medicine approach, careful consideration of implementation of
each of these pathologies is warranted prior to use.

188
Chapter 9. Conclusion Chapter and Potential Therapeutic Topics
“Courage is not the absence of fear,
But rather the assessment that something is more important than fear”
– Franklin D. Roosevelt
Within the pages of this dissertation, the anatomic configuration as well as function of
each of the organs within the equine gastrointestinal tract and their contributing factors to the
digestion and absorption of a drug have been discussed. The gastrointestinal tract is unique in
that it serves as a protective barrier from the external environment while also serving to facilitate
the absorption of nutrients from the ingested food particulate. No matter if the substance is
nutritional, supportive, or a drug, if administered orally, the molecule must be processed by the
gastrointestinal tract prior to absorption into the blood stream. In so doing, the molecule must be
able to withstand the intraluminal gastrointestinal environment (Florence).
.
Novel Development - Peritonitis Model
Thirteen adult healthy horses (geldings and mares), weighing approximately 900-1,300
lbs. (409-590 kg) were selected for use in this study. Horses were assigned to one of the
treatment groups: Abdominocentesis only (n=1), 500 mL of balanced crystalloid solution (n=1),
500 mL balanced crystalloid solution containing 50 mL heparin sodium citrate infusion (n=2),
autologous plasma infusion with 50 mL of heparin sodium citrate (n=1), autologous whole blood
with 50 mL heparin sodium citrate (n=2), or 500 mL autologous whole blood without anti-
coagulant (n=6). Horses were monitored with physical examinations, urine/fecal output, and

189
water/food consumption three times daily during the study. At days 1 through 5, post treatment,
abdominal ultrasounds were performed to evaluate peritoneal fluid accumulation, gastrointestinal
motility and intestinal wall thickness. Abdominal examination per rectum were performed daily
to detect changes within the abdominal cavity. Peritoneal fluid and whole blood were also
collected for a complete blood count and serum biochemistry profile in order to assess evidence
of systemic response to peritoneal inflammation.
In this study, horses developed evidence of a mild, transitory inflammatory response after
infusion of whole blood into the abdomen; however, levels of both nucleated cell count and total
protein did not reach acceptable levels to be classified as clinicopathological peritonitis. Despite
this, patients treated with whole blood showed evidence of peritoneal inflammation on
ultrasonographic evaluation with decreased motility, thickened loops of small intestine, and
increased/alterations of the peritoneal fluid character. Subjectively, examinations also confirmed
decreased motility as increased turgidity of the wall of the large colon was appreciated during
abdominal examinations per rectum.
Despite there not being a statistical difference between groups, the whole blood infusions
(with and without the anticoagulant present) did appear to be more likely to initiate a response
than the other treatments. Based on the horse’s tolerability to the various treatment modalities,
further studies should be considered using larger volumes of blood to further evaluate this aseptic
model of peritonitis. Increasing the infusion volume to one liter of blood should be evaluated.
Also, walking or lunging the horses intermittently after infusion to increase exposure of the
infused blood to the visceral structures of the gastrointestinal tract. Further studies should also
monitor peritoneal pH as well as peripheral and peritoneal D-Dimer, glucose, and lactose levels
as these have become valuable diagnostic aids in assessing systemic disease in the equine

190
patient. In septic peritonitis, a peritoneal glucose of >50 mg/dL or peritoneal pH 7.2 with a
peritoneal glucose <30 mg/dL can be highly suggestive of septic peritonitis (Auer J.A.; M. L.
Delgado M.A.; M. L. Delgado M.A.)\
Once the intraperitoneal fluid infusion volume has been determined to be injected to
produce a reliable and predictable response in the equine peritoneum, this method should be fully
validated prior to implementation and use for evaluation of drug movement, accumulation,
clearance, or efficacy.
Impact of Route and Volume on Drug Absorption in the Equine Patient
Currently, there is not a “standard of care” for evaluating drug movement in the equine
patient. Pharmacokinetic studies evaluating oral administration in horses most commonly
involve administration of either a paste or liquid formulation. However, when these are
unavailable, a solid dosing form of the drug (tablet or capsule) is crushed or opened and
administered as a powder one of several ways: spread over grain, dissolved in a small volume of
water and then administered in a syringe, or as a large volume solution via nasogastric tube.
Pharmacologically, multiple factors can affect a drug’s ability to be absorbed. In people, studies
have shown the volume in which a drug is administered markedly impacts the rate (time to
maximum drug concentration) and extent that it reaches systemic circulation (maximum plasma
drug concentration, area under the curve, and bioavailability) (Neirinck E.). Depending on the
characteristic of the drug, absorption may also be affected by the presence or absence of food in
the stomach and small intestine.
Determining effects of oral drug administration has been key in developing appropriate
models that predict drug concentrations in animals and people. The effects of food, drug coating,

191
and how the drug is administered are the cornerstones in evaluating and modeling drug
movement (Mizuta H.). In the horse, oral administration either in a clinical setting or as part of
research studies often varies depending on the drug, the investigator, or the circumstances under
which the drug is administered.
The goal of this chapter was to investigate the impact of: route, volume, and fasting
versus fed state on orally administered acetaminophen using six healthy adult horses,
randomized, cross over design. All six horses received a 20 mg/kg dose of acetaminophen using
two different oral routes of administration (nasogastric versus syringe), two different volumes
(100 vs 1500 mL), and in the fed versus fasted state.
Administering the acetaminophen directly through a nasogastric tube with 100 mL water
showed a significant increase in drug absorption over syringe administration with 100 mL. This
increase in absorption and is most likely due to bypassing the issues associated with oral product
administration such as product loss by delayed swallowing. Though clinically this would not be
possible, in the academic arena where drug movement is often studied, this would be the most
direct method of assessing drug movement without the compounding issues of administration.
Similar to people, the effect of volume of administration also affects the extent to which a
drug may be absorbed as was illustrated with the comparison of NGT 100 mL vs. 1.5L. In future
endeavors where drug movement is being evaluated, it would be prudent to take this into account
when planning the amount of volume to be used during administration.
Animals that were non-fasted had a statistically significant increased AUC and Cmax, both
indicating that the effects of food being present in the stomach or small intestine greatly affects
the absorption of drug into the blood stream. Depending on the drug structure, this may be due

192
to binding of the drug in food material, alteration of intraluminal pH, or decreased
gastrointestinal motility and exposure of the drug to the blood stream.
In conclusion, investigators were able to establish that for the most accurate
determination of oral drug absorption in the equine: animals should be fasted for eight hours
prior to study initiation and administered via a nasogastric tube with the formulation (tablet or
capsule) dissolved in 1.5L of water.
Formulation Effect on Drug Absorption
Depending on drug administration, there are often multiple steps required prior to
reaching the target tissue for treating pathologies. The first step along this path is absorption of
the formulation itself. Dosage forms are necessary because they: protect the drug substance
from environmental influences (humidity and oxygen) or gastric acid degradation, conceal the
bitter, salty or offensive taste or odor, or provide a rate controlled release from the products
(Ansel). Many factors effect an active ingredient’s ability to be absorbed in a patient’s body.
How an active ingredient is formulated, meaning how the drug is prepared for
commercialization, takes three important factors into account: disintegration, dissolution, and
diffusion. Each of these factors directly influence how the matrix is broken down and the active
ingredient becomes liberated in order to be available to absorb into the patient’s body.
Dissolution of a drug from its formulation is often the slowest process of drug absorption
and the rate is greatly affected by the pH of the environment within the lumen of the
gastrointestinal tract. The pH of the ingesta is important to consider as most drug formulations
are weak acids or bases and the aqueous solubility of these compounds are influenced by the rate
of dissolution from the dosage form. Drugs that are acidic in nature are more readily dissolved

193
in the basic environment of the small intestine in comparison to the acid environment of the
stomach. In contrast, drugs that have a basic pH will dissolve more readily in gastric fluid.
A variety of preparations using binding agents, disintegrants, various salts or esters influence
where the formulation is degraded and dissolved in the gastrointestinal tract. Use of polymers
may also be used to coat granules or tablets that are designed to dissolve at a specific desired pH,
which ultimately protects the drug from degradation in unwanted pH’s that will maximize
absorption profile for the drug (Ansel; Boothe; Florence; Riviere).
The purpose of this study was to compare the bioavailability (degree and rate of
absorption) of firocoxib formulated in a paste designed for horses to a chewable tablet
formulated for dogs as well as evaluate therapeutic levels with clinical response. Horses (n=8)
received a single loading dose of firocoxib (0.3 mg/kg) as an oral paste, chew, or intravenously in
a randomized, triple cross-over study.
In contrast to horses, the elimination half-life of firocoxib in dogs is only eight hours.
The longer half- life in horses impacts therapeutic use of firocoxib in several ways. First, it
allows once a day dosing in horses, facilitating owner compliance, as well as providing longer
pain relief. Second, the longer half-live firocoxib results in a 50- fold oral dose differential
between the two species: horses are dosed at 0.1 mg/kg/day compared to 5 mg/kg/day in dogs.
It is this 50-fold difference in dose that has led equine practitioners to administer the canine
preparation rather than the approved horse product to equine patients. Third, the longer t1/2 in
horses also results in different times to steady-state between the species. In dogs, firocoxib
does not reach a true steady-state when using the labeled dosing interval. However, in horses,
with a 40-hour half-life, drug concentrations in horses will minimally fluctuate during a 24-hour
dosing interval. Furthermore, because little drug is eliminated during each interval, drug will

194
accumulate with each subsequent dose until steady-state is reached. Thus, the full effect of the
drug in horses will not be realized until three to five drug half-lives – or approximately five to
seven days – have lapsed once a dosing regimen is implemented. This delay to steady-state
necessitates a loading dose (0.3 mg/kg) in horses if a rapid onset in effect is desired. By
administering an initial loading dose, the patient reaches therapeutic drug levels after the first
dose and a clinical response is appreciated within the first 24 hours of treatment
This study confirmed that despite the different formulations available for firocoxib,
once administered at the same mg/ kg dose, they are similarly bioavailable, and based on the
clinical samples collected, are capable of controlling both soft tissue and orthopedic pain.
This study also highlights the importance of fully evaluating each active ingredient with a full
pharmacokinetic profile in each intended species and not translating from one species to the
other without careful analysis.
Comparison of Oral to Rectal Administration
Treatment and management of severe brain injuries in horses is expensive, labor
intensive and frequently results in a grave to guarded prognosis. For immediate intervention,
diazepam and midazolam have been employed in both foals and adult equine patients. Single
seizure episode control with diazepam is effective, relatively inexpensive, and simple; however,
recurrent seizures become more difficult to manage. For long term seizure control, phenobarbital
and potassium bromide have been the drugs of choice to manage long term seizures in horses or
foals. Recently, levetiracetam has been used for seizure control in the equine patient. Serum
levetiracetam concentrations achieved are generally within the published therapeutic ranges for
dogs and cats, however, as in other species, the drug has a short half-life of six hours in horses.

195
This short half-life would require frequent administration which is labor intensive, as well as cost
prohibitive for long term management (Cesar).
In seizing or obtunded horses, rectal administration of a drug may be necessary due to
altered mentation and safety concerns (Feary D.J.). Drawbacks of rectal administration include
interruption of absorption due to defecation, patient acceptability, or binding of the drug
formulation to feces present within the rectum (A.G. De Bower). Ensuring that a product is
capable of oral absorption after rectal administration is key to determining use in the clinical
setting. The objectives of this study were to describe the disposition and time course of drug
concentrations of a new antiepileptic zonisamide when administered either orally or per rectum
in the healthy horse.
In this dissertation, a chapter described the disposition and time course of drug
concentrations of zonisamide when administered either orally or per rectum in the healthy horse.
Eight healthy adult horses were used in a randomized, crossover study under fasted conditions.
Horses received zonisamide orally via nasogastric tube (20 mg/kg, PO), and per rectum (PR, 40
mg/kg) via a Foley catheter. Whole blood was collected intermittently for 72 hours post
administration. Zonisamide (20 mg/kg PO) maintains serum concentrations in the human
therapeutic range for 13 hours in healthy horses and might be effective for treatment of seizures.
In contrast, zonisamide was not consistently detected after 40 mg/kg after rectal administration,
which does not support use of this current dosing form in this route.
In both routes of administration, the serum concentrations were lower than what was
expected in patients where the capsule was administered in an intact fashion, as has been studied
in people and small animals (Boothe D.M.). One of the limitations in this study as well as in
equine practice is the need to alter dosage forms in order to treat the patient. Further evaluation

196
may need to be done to look at methods to administer the whole capsules to horses in order to
achieve a more accurate indication of serum drug concentrations.
Absorption of a rectal drug formulation is dependent on many factors. First, the
molecular size of the drug as well as partitioning of the drug between the delivered formulation
and the rectal fluid is of key importance. Several dosage forms are available for rectal delivery
of drugs: suppositories (emulsion or suspension), gelatin capsules (solutions and suspensions)
and enemas which are quantified by macro (100 mL) and micro (1 to 20 mL). Formulations that
are aqueous or alcoholic solutions have a greater chance of being absorbed more quickly than
tablet or paste formulations. The use of surfactants may also alter drug absorption. (A.G. De
Bower; H. D.-E. Corveleyn S.). In equine practice, most of the formulations used are a
suspension or paste which is created by dissolving the oral product (veterinary or human) in a
variable amount of water (A.G. De Bower).
Inactivation of drug formulations by binding to fecal material has been suggested as a
potential cause for reduced bioavailability. In a study evaluating rectal administration of an
omeprazole paste, all horses defecated within the first two hours of treatment and there was
macroscopic binding of the paste evident on the fecal piles. These effects as well as a small
amount of drug dispensed into the rectum (5 mL) could have had a greater effect on drug
absorption (Rand C. Stanley).
Despite having a low sample size (n=4) dosed zonisamide at 20 mg/kg appears to reach
published human therapeutic levels and as such, might be considered as a possible alternative for
treating epilepsy in the equine patient. None of the horses experienced any adverse events
during the course of the pharmacokinetics studies as well as all maintained complete blood
counts and serum chemistry profiles within clinically normal limits. Since zonisamide was well

197
received in healthy adult horses, it should be a consideration for use in equine patients with
seizure activity as well as serve for pilot data for use in foals.
In further work, this zonisamide should be administered at 20 mg/kg in a paste
formulation (to simulate what is done in clinical practice) and compare it to nasogastric
administration. Due to zonisamide’s unique capabilities, there is potential for it to be evaluated
as a therapeutic agent in neuropathic pain conditions affecting the equine patient in further
clinical trials.
Further Advances in Equine Pain Management
In the 1970s, Sir William Paton began the study of the pharmacologic actions of cannabis
and the cannabinoids as possible analgesic and sedative agents. Originally, thoughts were that
the cannabinoids were similar in mechanism of action as to the general anesthetics and
movement within the cellular membranes were determined by the chemical size and shape of the
molecule. However, it was later determined that the clinical effects seen on affecting pain
management were due to interaction with the CB1R and CB2R (Di Marzo).
As discussed earlier, CB1R are most densely present in the brain – hippocampus,
cerebellum and striatum. However, there are several areas which could provide targets through
which cannabinoids could modulate pain including the periaqueductal grey (PAG), rostral
ventral medulla, superficial layers of the spinal dorsal horn as well as the dorsal root ganglion.
The endocannabinoid system has also been identified in the ventral, posterior later nucleus of the
thalamus which is the termination zone of the spinothalamic tract which is the major source of
ascending nociceptive information to the brain (de Vries M.; Hohmann A.G.).
The capacity for cannabinoids to control pain is among the most studied responses and have
been noted to be effective in both acute (phasic) and chronic (tonic) pain (Izzo A.A.) Activation

198
of centrally located CB1R receptors present in the dorsal horn, lateral funiculus, and Lamina X
have been specifically shown to suppress the nociceptive neurons after mechanical, thermal, as
well as chemical stimulation (Hohmann A.G.; Izzo A.A.; Rice). Peripherally, CB2R receptors,
and to a much lesser extent CB1R, have been effective in modulating the inflammatory response
as well as tissue and nerve injury (Hohmann A.G.; Rand C.). CB2R, present on both mast cells
and leukocytes, play multiple key roles in the modulation of the local inflammatory response
including preventing mast cell degranulation, diminishing neutrophil migration, and decreasing
the release of nitric oxide from macrophages (Rice).
Cannabinoid use has been best prescribed for controlling neuropathic pain. Among these, 9
THC is the most understood as it is the main property of psychogenic producing behavior and
pharmacological activity against pain (Grotenhermen; Di Marzo V.) Secondary to nerve injury,
cannabinoid induced antinociception is more effective in alleviating pain than opioid drugs by
suppressing wind up and noxious stimulus induced central sensitization (Hohmann A.G.;
MacPherson). The mechanism of action is hypothesized to be due to loss of opioid receptors
along the traumatized nerve tissue being either removed or compromised secondary to the injury,
whereas CB1R remain intact (Bridges D.; Rice). Recently, studies of the interactions between
the cannabinoid and the opioid systems indicates that co-administration of two agents may
produce favorable synergistic effects, and may offer a new treatment strategy for multi-modal
analgesia (de Vries M.; MacPherson; Ripamonti C.).
Preliminary studies of ajulemic acid (CT-3) in rats have shown that they have anti-
inflammatory activity similar to that of NSAIDs, without the gastrointestinal adverse effects,
even at supratherapeutic dosages (Burns T.L.). Accordingly, hemp-based products show
promise as either sole or combination analgesia. Studies have found that 9 THC: CBD extract

199
and 9-THC alone were effective in the management of pain resistant to strong opioid use in
humans (Boisselier R.L.). Sativex (approximately a 1:1 mixture of 9 THC:CBD) was the first
medicine derived from the whole cannabis plant licensed to treat pain and spasticity in multiple
sclerosis (MS) patients without the negative side effects associated with 9-THC monotherapy.
With this combination, it was found that CBD most likely inhibited the metabolism of 9 THC
to the more psychoactive metabolite 11-OH-9 THC (W. C. Hill A.J.).
Recent findings have also suggested that NSAIDs may also owe some of their therapeutic
success to their interaction with the endocannabinoid system either by inactivation of proteins or
by encouraging biosynthesis. Rofenicoxib, a cyclooxygenase 2 (COX-2) selective nonsteroidal
anti-inflammatory, synergizes with anandamide (the endogenous agonist of CB1R and CB2R) in
a positive feedback loop to further elevate levels of anandamide as well as other analgesic fatty
acid ethanolamide levels (Di Marzo V.). Interestingly, after oral administration of CBD in a
murine model for rheumatoid arthritis, researchers saw a diminished interferon gamma (IFN-γ),
decreased release of tumor necrosis factor alpha (TNF-α), and decreased nitrous oxide (NO) (P.
M.-R. Mechoulam R.; Malfait A.M.).
CBD also works as a potent anti-oxidative agent showing greater protective nature
against glutamate neurotoxicity than either ascorbate (Vitamin C) or α tocopherol (Vitamin E)
(P. M.-R. Mechoulam R.). These anti-oxidative effects may have explained why CBD was
successful in correcting hypermotility in mice with no effects on the control population (Capasso
R.). On a smaller scale, CBD has been shown to stimulate mesenchymal stem cells responsible
for bone formation and fracture healing while also controlling bone resorption (Izzo A.A.).
Recent legalization of marijuana or hemp for medicinal use has been accompanied by
increased interest in the implications for veterinary medicine. A supplement comprised of non-

200
psychotropic cannabinoids is being marketed specifically for canine and feline patients for
diverse medical indications. Dietary supplements, including hemp-based products, undergo no
premarket approval for quality, safety, or efficacy. Demonstrating the transmucosal disposition
of this product should be beneficial for a wide variety of equine patients experiencing visceral
(diarrhea, colic, enteritis, and pleuropneumonia) and/or musculoskeletal pain (osteoarthritis,
lameness associated with soft tissue injury, or laminitis).
To describe the disposition and time course of drug concentrations of CBD and Δ9 THC
when administered transmucosally to healthy horses. Thirteen healthy adult horses under fasted
conditions horses were administered a cannabinoid oil (0.1 mg/kg). Whole blood was collected
intermittently for 72 hours post administration. Pharmacodynamic variables were evaluated for
indication of sedation over the course of 24 hours after administration. All animals appeared to
tolerate the cannabinoid well at the dose administered. After transmucosal administration, Cmax
was 27.2 (13 - 53.9) ng/mL at Tmax: 2.9 (1.9 - 4.3) hours. MRT and disappearance half-life were
18 hours (11-94 - 28) and 15 hours (9 - 25), respectively. AUC was 247.1 (166.1 – 367.8)
ng/mL/hour. Cannabinoid oil (0.1 mg/kg) was well tolerated for administration to horses;
however, the dose appears to be too low to evaluate pharmacodynamics effects. However, initial
pilot data using oral administration of a cannabinoid “cookie” was well tolerated at 14 mg/kg
twice daily for 7 days.
In further work, transmucosal oil should be considered the formulation for use and
administration when evaluating effects in the equine patient. Preliminary work has been
provided within the pages of this dissertation that would allow further researchers to explore
many avenues of cannabinoid effects on the equine patient, including but not limited to
managing visceral and somatic pain signaling. However, in order to successfully treat the patient

201
as well as meet the needs of the pharmacologist, manufacturers of the cannabinoid oil would
need to be able to increase the concentration to levels that would not prevent dosing to be
cumbersome for the veterinarian or the client. Due to the longer half-life in the horses, the
concentration increase in the formulation should be titrated to effect in further studies such that
the horses are not put at risk. Also of note is careful advisement to clients of the products that
they are administering. Since there is not an oversight of the manufacturing of these products
currently, each product that is on the market is not the same quality or content as the other.
Veterinarians should seek to know the product being administered to their patients as well as
have further analysis done to ensure the composition of the product being administered.
.

202
References
A.G. De Bower, F. Moolenaar, L.G.J. De Leede, & D.D. Breimer. "Rectal drug administration."
Clinical Pharmacokinetics (1982): 285-311.
Adams I.B., Martin B.R. "Cannabis: pharmacology and toxicology in animals and humans."
Addiction (1996): 1585-1614.
Agency, European Medicines. "European Medicines Agency." 2010. 1-20.
Agurell S., Carlsson S., Lindgren J.E., et. al. "Interactions of delta 11-tetrahydrocannabinol with
cannabinol and cannabidiol following oral administration in man. ." Experientia (1981):
1090-1092.
Ammann J., McLaren J.M., Gerostamoulos D., et. al. "Detection and quantification of new
designer drugs in human blood: part 1-synthetic cannabinoids." Journal of analytical
toxicology (2012): 372-380.
Ansel, Loyd V. Allen & Howard C. Ansel's Pharmaceutical Dosage Forms and Drug Delivery
Systems 10th Edition. Philadelphia: Lippicott Williams & Wilkins, 2014.
Arguelles D., Casteljins G., Carmona J.U., Armengou L., Climent F., Prades M. "Peritoneal
concentraitons of transforming growth factor beta in horses with colic." Equine
Veterinary Journal (2010): 451-455.
Arnold C.E., Chaffin M.K. "Abdominal abscesses in adult horses: 61 cases (1993-2008)."
Journal of the American Veterinary Medical Association (2012): 1659-1665.
Atli A., Dogra S. "Zonisamide in the treatment of painful diabetic neuropathy: a randomized
double-blind placebo controlled pilot study." Pain Medicine (2005): 225-234.
Auer J.A., Stick J.A. Equine Surgery Edition 4. Philadelphia: Elsevier Heath Sciences, 2011.

203
Backonja, M.M. "Use of anticonvulsants for treatment of neuropathic pain." Neurology (2002):
S14-S17.
Badowski, M.E. "A review of oral cannabinoids and medical marijuana for the treatment of
chemotherapy-induced nausea and vomiting: a focus on pharmacokinetic variability and
pharmacodynamics." Cancer Chemotherapy and Pharmacology (2017): 441-449.
Barry, B.W. "Novel mechanisms and devices to enable successful transdermal drug delivery."
European Journal of Pharmaceutical Sciences (2001): 101-114.
Bartner L.R., McGrath S., Rao S., et. al. "Pharmacokinetics of cannabidiol administered by 3
delivery methods at 2 different dosages to healthy dog." The Canadian Journal of
Veterinary Research (2018): 178-183.
Barton M.H., Collatos C. "Tumor necrosis factor and interleukin-6 activity and endotoxin
concentration in peritoneal fluid and blood of horses with acute abdominal disease."
Journal of Veterinary Internal Medicine (1999): 457-464.
Beaufrere H., Nevarez J., Gaschen L., et. al. "Diagnosis of presumed acute ischemic stroke and
associated seizure managment in a Congo African grey parrot." Journal of American
Veterinary Medical Association (2011): 122-126.
Boisselier R.L., Alexandre, J., Lelong-Boulouard V.L., et. al. "Focus on cannabinoids and
synthetic cannabinoids." Clinical Pharmacology & Therapeutics (2017): 220-229.
Boothe D.M., Perkins J. "Disposition and safety of zonisamide after intravenous and oral single
dose and oral multiple dosing in normal hound dogs." Journal of Veterinary
Pharmacology and Therapeutics (2008): 544-553.
Boothe, D.M. Small Animal Clinical Pharmacology & Therapeutics. St. Louis: Elsevier, 2012.

204
Bridges D., Thompson S.W.N., Rice A.S.C. "Mechanisms of neuropathic pain." British Journal
of Anesthesia (2001): 12-26.
Brocco M.C., Paulo D. N. S., Baptista J.F.D.A., Ferrari T.A., Azevedo T.C.V.D, Silva A.L.D.
"Effects of periotoneal lavage with lidocaine on survival of rats with fecal peritonitis."
Acta Cirurgica Basileira (2008): 42-47.
Broome T.A., Brown M.P., Gronwall R.R., Casey M.F., Meritt K.A. "Pharmacokinetics and
plasama concentrations of acetylsalacyclic acid after intravenous, rectal, and intragastric
administration to horses." The Canadaian Journal of Veterinary Research (2003): 297-
302.
Brunet B., Doucet C., Venisse N., et. al. "Validation of a large white pig as an animal model for
the study of cannabinoids metabolism: applicaiton to the study of THC distribution in
tissues." Forensic Science International (2006): 169-174.
Burns T.L., Ineck J.R. "Cannabinoid analgesia as a potential new therapeutic option in the
treatment of chronic pain." Annals of Pharmacotherapy (2006): 251-260.
Canada, Health. "Policy of extra label drug use (ELDU) in food producing animals." n.d.
Website. 24 February 2015. <: http://www.hc-sc.gc.ca/ dhp-mps/vet/label-
etiquet/pol_eldu-umdde-eng. php>.
Capasso R., Borrelli F., Aviello G., et. al. "Cannabidiol, extracted from Cannabis sativa,
selectively inhibits inflammatory hypermotility in mice." British Journal of
Pharmacology (2008): 1001-1008.
Chapman, A.M. "Acute diarrhea in hospitalized horses." Veterinary Clinics of America Equine
(2009): 363-380.

205
Chase J.P., Beard W.L., Bertone A.L., Goltz K. "Open peritoneal drainage inhorses with
experimentally induced peritonitis." Veterinary Surgery (1996): 189-194.
Clements J.A., Heading R.C., Nimmo W.S., Prescott L.F. "Kinetics of acetaminophen absorption
and gastric emptying in man." Clinical Pharmacology and Therapeutics (1978): 420-431.
Conte R., Marturano V., Peluso., et. al. "Recent advances in nanoparticle-mediated delivery of
anti-inflammatory phytocompounds." International Journal of Molecular Sciences
(2017): 709.
Cook V.L., Meyer C.T., Campbell N.B. "Effect of firocoxib or flunixin meglumine on the
recovery of ischemic-injured equine jejunum." American Journal of Veterinary Research
(2009): 992-1000.
Corveleyn S., Deprez P, van der Weken G., Baeyens, Remon J.P. "Bioavailability of ketoprofen
in horses after rectal administration." Journal of Veterinary Pharmacology and
Therapeutics (1996): 359-363.
Corveleyn S., Henrist D., Remon J.P., van der Weken G., Baeyens W., Haustraete J., Aboul-
Enein H.Y., Sustronck B., Deprez P. "Bioavailaiblity of racemic ketoprofen in healthy
horses following rectal administration." Research in Veterinary Science (1999): 201-202.
Cox S., Yarbrough J. "Determination of firocoxib in equine plasma using high performance
liquid chromatography." Journal of Chromatography (2011): 205-208.
Currie, G.M. "Pharmacology, Part 2: Introduction to Pharmacokinetics." Journal of Nuclear
Medicine Technology (2018): 221-230.
Davis, J.L. "Treatment of peritonitis." The Veterinary Clinics of North America: Equine Practice
(2003): 765-778.

206
de Vries M., Van Rijckevorsel D.C., Vissers K.C., et. al. "Single dose of delta-9-
tetrahydrocannabinol in chornic pancreatitis patients: analgesic efficacy,
pharmacokinetics and tolerability." British Journal of Clinical Pharmacology (2016):
525-537.
Dechant J.E., Nieto J.E., Le Jeune S.S. "Hemoperitoneum in horses: 67 cases (1989-2004)."
Journal of the American Veterinary Medical Association (2006): 253-258.
Delgado M.A., Monreal L., Armengou L., Rios J., Segura D. "Peritoneal D-Dimer concentraiton
for assessing peritoneal fibrinoloytic activity in horses with colic." Journal of Veterinary
Internal Medicine (2009): 882-889.
Delgado M.A., Monreal L., Armengou L., Segura D., Rios J. "Effects of blood contamination on
peritoneal D-Dimer concentration in horses with colic." Journal of Veterinary Internal
Medicine (2009): 1232-1238.
DePuy T., Howard R., Keegan K. "Effects of intra-articular botulinum toxin type A in an equine
model of acute synovitis: a pilot study." American Journal of Physical Medicine &
Rehabilitation (2007): 777-783.
Dewey C.W., Guiliano R., Boothe D.M. "Zonisamide therapy for refractory idiopathic epilepsy
in dogs." Journal of the American Animal Hospital Association (2004): 285-291.
Di Marzo V., Bisogno T., De Patrocellis L. "Endocannabinoids and related compounds: walking
back and forth between plant natural products and animal physiology." Chemistry &
Biology (2007): 741-756.
Di Marzo, V. "A brief history of cannabinoid and endocannabinoid pharmacology as inspired by
the work of British scientists." Trends in Pharmacological Sciences (2006): 134-140.

207
Dinis-Oliveira, R.J. "Metabolomics of delta9-tetrahydrocannabinol: implications in toxicity."
Drug Metabolism Reviews (2016): 80-87.
Doherty T.J., Andrews F.M., Provenza M.K. "Acetaminophen as a marker of gastric emptying in
ponies." Equine Veterinary Journal (1998): 349-351.
Doherty, T.J., Andrews F.M., Provenza M.K., et. al. "Acetaminophen as a marker for gastric
emptying in ponies." Equine Veterinary Journal (1998): 349-351.
Doi K., Lellahavanichikul A., Yuen P.S.T., Star R.A. "Animal models of sepsis and sepsi indced
kidney injury." The Journal of Clinical Investigation (2009): 2868-2878.
Donaldson, C.W. "Marijuana exposure in animals." Veterinary Medicine (2002): 437-439.
Donnell J.R., Frisbie D.D., King M.R., et. al. "Comparison of subjective lameness evaluation,
force platforms and an intertial-sensor system to identify mild lameness in an equine
osteoarthritis model." The Veterinary Journal (2015): 146-142.
Dyson, S. "Review of 30 cases of peritonitis in the horse." Equine veterinary journal (1983): 25-
30.
Elce, Y.A. "Infections in the equine abdomen and pelvis: perirectal abscesses, umbillical
infections, and peritonitis." Veterinary Clinics: Equine Practice (2006): 419-436.
Feary D.J., Magdesian K.G., Aleman M.A. "Traumatic brain injury in horses: 34 cases (1994-
2004)." Journal of the American Veterinary Medical Association (2007): 259-266.
Florence, Alexander T. Modern Pharmaceutics. Boca Raton: Taylor& Francis Group, 2010.
Gabaldon, D. Writen in my own heart's blood. New York: Randm House Company, 2014.
Gamble L.J., Boesch J.M., Frye C.W. "Pharmacokinetics, safety and clinical efficacy of
cannabidiol treatment in osteoarthritic dogs." Fronteirs in Veterinary Science (2018): 1-9.

208
Gray S.N., Dechant J.E., LeJeune S.S., Nieto J.E. "Identification, management, and outcome of
postoperative hemoperitoneum in 23 horses after emergency exploratory celiotomy for
gastrointestinal disease." Veterinary Surgery (2015): 379-385.
Grotenhermen, F. "Pharmacokinetiics and pharmacodynamics of cannabinoids." Clinical
Pharmacokinetics (2003): 327-360.
Gutierrez-Nibeyro S.D., Santos M.P, Brown J.A. "Effects of intrabursal administration of
botulinum toxin type B on lameness in horses with degenerative injury to the
podotrochlear apparatus." American Journal of Veterinary Research (2014): 282-289.
Guyton A.C., Hall J.E. Textbook of Medical Physiology. Philadelphia: W.B. Saunders, 2000.
Hatanaka S., Kondoh M., Kawarabayashi K., et. al. "The measurement of gastric emptying in
conscious rats by monitoring serial changes in serum acetaminphen level." Journal of
Pharmaological and Toxicological Methods (1994): 161-165.
Haussler, K.K, Erb H.N. "Mechanical nociceptive thresholds in the axial skeleton of horses."
Equine Veteirnary Journal (2006): 70-75.
Hill A.J., Jones N.A., Smith I., et. al. "Voltage-gated sodium (NaV) channel blockade by plant
cannabinoids does not confer anticonvulsant effects per se." Neuroscience Letters (2014):
269-274.
Hill A.J., Williams C.M., Whalley B.J., et. al. "Phytocannabinoids as a novel therapeutic agents
in CNS disorders ." Pharmacology & Therapeutics (2012): 79-97.
Hoerdemann M., Smith R.L., Hosgood G. "Duration of action of mepivicaine and lidocaine in
equine palmar digital perineural blocks in an experimental lameness model." Veterinary
Surgery (2017): 986-993.

209
Hohmann A.G., Suplita R.L. "Endocannabinoid mechanisms of pain modulation." The AAPs
Journal (2006): E693-E708.
Hosking R.D., Zajiceck J.P. "Therapeutic potential of cannabis in pain medicine." British
Journal of Anaesthesia (2008): 59-68.
Huestis, M.A. "Human cannabinoid pharmacokinetics." Chemistry & Biodiversity (2007): 1770-
1804.
Hunt E., Tennat B.C., Whitlock R.H. "Interpretation of peritoneal fluid erythrocyte counts in
horses with abdominl disease." Equine colic research; proceedings of the second
symposim at the University of Georgia (1985): 168-174.
Internationale, Federation Equestre. Prohibited Substances Database. n.d. 24 February 2015.
<http://prohibitedsubstanc- esdatabase.feicleansport.org/list.php?q=firocoxib.>.
Izzo A.A., Borrelli F., Capasso R., et. al. "Non-psychotropic plant cannabinoids: new therpaeutic
opportunities from an ancient herb." Trends in Pharmacological Sciences (2009): 515-
527.
Jeffrey, S.C. "Managing hemoperitoneum in horses." Veterinay Medicine (1996): 850-856.
Jones N.A., Glyn S. E., Akiyama S., et. al. "Cannabidiol exterts anti-convulsant effects in animal
models of temporal lobe and partial seizures." Seizure (2012): 344-352.
Khumsap S., Rosenstein M.S., Clayton H.M. "Effect of induced unilateral synovitis of distal
intertarsal and tarsometatarsal joints on sagittal plane kinematics and kinetics of trotting
horses." American Journal of Veterinary Research (2003): 1491-1495.
Kvaternick V., Malinski T., Wortmann J., et. al. "Quantitative HPLC-UV method for the
determination of firocoxib from horse and dog plasma." Journal of Chromatography
(2007): 313-319.

210
Kvaternick V., Pollmeier M., Fischer J., et. al. "Pharmacokinetics and metabolism of orally
administered firocoxib, a novel second generation coxib in horses." Journal of Veterinary
Pharmacology and Therapeutics (2007): 208-217.
Lammers T., Roussel A., Boothe D. "Effect of an indwelling nasogastric tube on gastric
emptying rates of liquids in horses." American Journal of Veterinary Research (2005):
642-645.
Latimer K.S., Mahaffey E.A., Prasse K.W. Veterinary Laboratory Medicine Clinical P athology.
Ames: Blackwell Publishing Company, 2003.
Letendre L.T., , Tessman R.K., McClure S.R., et. al. "Pharmacokinetics of firocoxib after
administration of multiple consecutive daily doses to horses." American Journal of
Veterinary Research (2008): 1399-1405.
Lodzki M., Godin B., Rakou L., et. al. "Transdermal delivery and anti-inflammatory effect in a
murine model." Journal of Controlled Release (2003): 377-387.
Love E.J., Murrell J., Whay H.R. "Thermal and mechanical nociceptive threshold testing in
horses: a review." Veterinary Anesthesia and Analgesia (2011): 3-14.
Love E.J., Taylor P.M., Murrell J., et. al. "Effects of acepromaine, butorphanol, and
buprenorphine on thermal and mechanical noociceptive thresholds in horse." Equine
Veterinary Journal (2012): 221-225.
Love E.J., Taylor P.M., Murrell T.J., et. al. "Assessment of the sedative effects of buprenorphine
administered with 10 mcg/kg detomidine in horses." Veterinary Record (2011):
vetrecc7288.
MacPherson, R.D. "The pharmacological basis of contemporary pain management."
Pharmacology & Therapeutics (2000): 163-185.

211
Malark J.A., Peyton L.C., Galvin M.J. "Effects of blood contamination on equine perionteal fluid
analysis." Journal of the American Veterinary Medical Association (1992): 1545-1548.
Malfait A.M., Gallily R., Sumariwalla P.F., et. al. "The nonpsychoactive cannabis constituent
cannabidiol is an oral anti-arthritic therapeutic in murine collagen-induced arthritis."
Proceedings of the National Academy of Sciences. 2000. 9561-9566.
McCann ME, Andersen DR, Zhang D, et al. "In vitro effects and in vivo efficacy of a novel
cyclooxyagenase-2 inhibitor in dogs with experimentally induced synovitis." American
Journal of Veterinary Research (2004): 503-512.
McClure S.R., Evans R.B., Huerter M., et. al. "Validation of a reversible lameness model and the
assessment of a topically applied nonsteroidal anti-inflammatory drug." Journal of
Equine Veterinary Science (2017): 107-113.
Mechoulam R., Parker L.A., Gallily R. "Cannabidiol: an overview of some pharmacological
aspects." The Journal of Clinical Pharmacology (2002): 11S-19S.
Mechoulam R., Peters M., Murillo-Rodriguez E., et. al. "Cannabidiol-recent advances."
Chemistry & Biodiversity (2007): 1678-1692.
Medicine, Center for Veterinary. "Adverse Reporting Site." n.d. Food and Drug Administration.
Electronic. 13 February 2013. <http://www.fda.gov/downloads/AnimalVet-
erinary/SafetyHealth/ProductSafetyInformation/ UCM055407.pdf>.
Mendes L.C.N., Maques L.C., Bechara G.H., Peiro J.R. "Experimental peritonits in horses:
peritoneal fluid composition." Arquivo basileiro de medicina veterinaria e zootecnia
(1999): 217-222.
Mendes L.C.N., Marques L.C., Iturrino R.P.S., Avila F.A.D. "Clinical aspects of experimental
peritonitis in horses." Ciencia Rural (1999): 493-497.

212
Merial. "Equioxx." Limited package insert. Merial, 2006.
—. "Previcox." Limited package insert. Merial, 2007.
Merkens H.W., Schamhardt H.C. "Evaluation of equine locomotion during different degrees of
experimentally induced lameness I: lameness model and quantification of ground reaction
force patterns of the limbs." Equine Veterinary Journal Supplemental (1988): 99-106.
Mizuta H., Kawazoe Y., Ogawa K. "Effects of meals on gastric emptying and small itnesitne
transit time of a suspension in the Beage dog assessed using acetaminophen and
salocylazosulfapyridine as markers." Chemical and Pharmaceutical Bulletin (1991):
2224-2227.
Nadulski T., Sporkert F., Schnelle M., et. al. "Simultaneous and sensitive analysis of THC, 11-
OH-THC, THC-COOH, CBD, and CN by GC-MS in plasma after oral application of
small doses of THC and cannabis extract." Journal of Analytical Toxicology (2005): 782-
789.
Nagarkatti P., Pandey R., Reider S., et. al. "Cannabinoids as novel anti-inflammatory drugs."
Future Medicinal Chemsitry (2009): 1333-1349.
Neirinck E., Vervaet C., De Boever S., et. al. "Species compariosn of oral bioaialaility, first pass
metabolism, and pharmacokinetics of acetaminophen." Research in Veterinary Science
(2010): 113-119.
Nelson B.B., King M.R., Frisbie D.D. "Assessment of a novel equine tarsocrural experiemental
joint disease model using recombinant interleukin 1beta and arthroscopic articular
sampling of the medial malleolus of the tibia onthe standing sedated horse." The
Veterinary Journal (2017): 54-59.

213
Nixon A.J., Grol M.W., Lang H.M., et. al. "Disease-modifying osteoarthritis treatment with
interleukin-1 receptor antagonist gene therapy in small and large animal models."
Arthritis & Rheumatology (2018): 1757-1768.
Oberle R.L, Chen T.S., Lloyd C., Barnett J.L. Owyang C., Meyer J, Amidon G.L. "The influence
of the interdigestive migrating myoelectic compmlex on the gastric empyting of liquids."
Gastroenterology (1998): 1275-1282.
Ohlsson A., Lindgren J.E., Andersson S. "Single-dose kinetics of deuterium-labelled cannabidiol
in man after smoking and intravenous administration." Biological Mass Spectrometry
(1986): 77-83.
Olivier van Till J.W., van Veen S.Q, van Ruler O., Lamme B., Gouma D.J., Booermeester M.A.
"The innate immune response to secondary peritonitis." Shock (2007): 504-517.
Papich M.G., Alcorn J. "Absorption of diazeam after its rectal administration in dogs." American
Journal of Veterinary Research (1995): 1629-1636.
Peiro J.R., Barnabe P.A., Cadioli F.A., Cunha F.Q., Lima V.M.F., Mendonca V.H., Santana
A.E., Malheiros E.B., Perri S.H.V., Valadao C.A.A. "Effects of lidocaine infusion during
experimental endotoxemia in horses." Journal of Veterinary Internal Medicine (2010):
940-948.
Pinto L., Izzo A., Cascio M.G., et. al. "Endocannabinoids as psychological regulators of colonic
propulsion in mice." Gastroenterology (2002): 227-234.
Pollmeier M. Toulemonde C., Fleishman C., et. al. "Clinical evaluation of firocoxib and
carprofen for the treatment of dogs with osteoarthritis." Veterinary Record (2006): 547-
551.

214
Punyamurthula N.S., Hingorani T., Adelli G., et. al. "Controlled release tablet formulation
containig natural deta 9 tetrahydrocannabinol." Drug Development and Industrial
Pharmacy (2015): 1158-1164.
Raharjo T.J., Verpoorte R. "Methods for the analysis of cannabinoids in biological materials: a
review." Phytochemical Analysis (2004): 79-94.
Rand C., Stanley D., Pusterla N. "Effects of intrarectally administered omeprazole paste on
gastric fluid pH in healthy adult horses." Veteirnary Record (2011): 169, 126b.
Reddy, D.S. "The utility of cannabidiol in the treatment of refractory epilepsy." Clinical
Pharmacology & Therapeutics (2017): 182-184.
Reed, S.M. Equine Medicine. St. Louis: Saunders, 2004.
Rice, A.S.C. "Endocannabinoids and pain: spinal and peripheral analgesia in inflammation and
neuropathy." Prostaglandins, leukotrienes, and essential fatty acids (2002): 243-256.
Ripamonti C., Dickerson E.D. "Strategies for the treatment of cancer pain in the new
millennium." Drugs (2001): 955-977.
Riviere, Jim E. Veterinary Pharmacology and Therapeutics. New York City: John Wiley &
Sons, 2018.
Samara E., Bialer M. Mechoulam R. "Pharmacokinetics of cannabidiol in dogs." Drug
Metabolism and Disposition (1988): 469-472.
Sammour T., Kahokehr A., Soop M., Hill A.G. "Peritoneal Damage: The inflammatory response
and clinical implications of the neuro-immuno-humoral axis." World Journal of Surgery
(2010): 704-720.
Scarth J.P., Teale P., Kuuranne T. "Drug metabolism in the horse: a review." Drug Testing and
Analysis (2010): 19-53.

215
Schmitz A., Demmel, S., Peters L.M., et. al. "Comparative human-horse sequence analysis of the
CYP3A subfamily gene cluster." Animmal Genetics (2010): 72-79.
Schmitz A., Zielinski J., Dick B., Mevissen M. "In vitro metabolism of testosterone in the horse
liver and involvement of equine CYP 3A89 3A94 and 3A95." Journal of Veterinary
Pharmacology and Therapeutics (2014): 338-347.
Schumacher J., Schumacher J., de Graves F., et. al. "A comparison of the effects of two volumes
of local analgesic solution in the distal interphalangeal joint of horses with lameness
caused by solar toe or solar heel pain." Equine Veterinary Journal (2001): 265-268.
Schumacher J., Schumacher J., Spano J.S., McGuire J., Scrutchfield W.L., Feldman R.G.
"Effects of castration on peritoneal fluid in the horse." Journal of Veterinary Internal
Medicine (1988): 22-25.
Schumacher J., Spano J.S., Moll H.D. "Effects of enterocentesis on peritoneal fluid constituents
in the horse." Journal ofthe American Veterinary Medical Association (1985): 1301-
1303.
Shearman D.J., Finlayson N.D. Disease of the gastrointestinal tract and liver. London: Churchill
Lingstone, 1982.
Slatter, Douglas. Textook of Small Animal Surgery 3rd Edition. Philadelphia: Saunders, 2002.
Smith, B.P. Large Animal Internal Medicine 4th Edition. St Louis: Mosby Elsevier, 2009.
Southwood L.L., Russell G. "The use of clinical findings in the identification of equine
peritonitis cases that respond favorably to medical therapy." Journal of Veterinary
Emergency and Critical Care (2007): 382-390.
Dyson, S.S. "Review of 30 cases of eritonitis in the horse." Equine Veterinary journal (1983):
25-30.

216
Steel C.M., Bolton J.R., Preechagoon Y., Charles B.G. "Unreliable rectal absorption of cisapride
in horses." Equine Veterinary Journal (1999): 82-84.
Stein F., Gilliam L., Davis J., Taylor J. "Rectal administration of metronidazole with and without
rectal evacuation prior to use in horses." Journal of Veterinary Pharmacology and
Therapeutics (2018): 838-842.
Steinman A., Gips M., Lavy E., Sinay I., Soback S. "Pharmacokinetics of metronidazole in
horses after intravenous, rectal, and oral administration." Journal of Veterinary
Pharmacology and Therapeutics (2000): 353-357.
Stott C., White L., Wright S., et. al. "A Phase 1, open-label, randomized crossover study in three
parallel groups to evaluate the effect of rifampicin, ketoconazole, and omeprazole on the
pharmacokinetics of THC/CBD oromucosal spray in healthy volunteers." Springerplus
(2013): 236.
van Hoogdalem E.J., de Bower A.G., Breimer D. D. "Pharmacokinetics of rectal drug
administration part I." Clinical Pharmacokinetics (1991): 11-26.
Videla R., Andrews F.M. "New perspecties in equine gastric ulcer syndrome." Veterinary Clinics
of America Equine (2009): 283-301.
Wilgenbusch C., McClure S.R., Thomsen D., et. al. "Characterization of a reversible lamenss
model in the horse." Veterinary Comparative and Orthopaedics and Traumatology
(2014): 113-119.
Yaksh, T.L. "Calcium channels as therapeutic targets for neuropathic pain." The Journal of Pain
(2006): S13-S30.

217