Nova multiwavelength light curves: predicting UV...
14
MNRAS 437, 1962–1975 (2014) doi:10.1093/mnras/stt2027 Advance Access publication 2013 November 19 Nova multiwavelength light curves: predicting UV precursor flashes and pre-maximum halts Y. Hillman, 1‹ D. Prialnik, 1 A. Kovetz, 1,2 M. M. Shara 3 and J. D. Neill 4 1 Department of Geophysics and Planetary Sciences, Raymond and Beverly Sackler Faculty of Exact Sciences, Tel-Aviv University, Tel-Aviv 69978, Israel 2 School of Physics and Astronomy, Raymond and Beverly Sackler Faculty of Exact Sciences, Tel Aviv University, Tel-Aviv 69978, Israel 3 Department of Astrophysics, American Museum of Natural History, Central Park West and 79th street, New York, NY 10024-5192, USA 4 California Institute of Technology, 1200 E. California Blvd., Pasadena, CA 91125, USA Accepted 2013 October 18. Received 2013 October 17; in original form 2013 August 6 ABSTRACT The dramatic brightenings of classical novae have yielded rich data sets of detailed light curves. Modelling these light curves is a challenge for any theory of classical novae. We have used our extended grid of nova outburst calculations to predict the luminosities of erupting novae expected in three electromagnetic bands – the visual, the near UV and the X-ray. Our models predict and explain many features of novae before eruption, as well as detailed characterizations of nova outbursts and post-nova declines. The evolutionary time-scales of eruption features vary by orders of magnitude, and depend on the basic nova parameters: white dwarf mass, luminosity and accretion rate. However, all light curves are found to share common features. Some of these features are unique to only one electromagnetic passband, while others show up in two, or in all three of the analysed bands. One extraordinary feature, common to all of our low-mass white dwarfs (0.65 M ) novae, is that all exhibit a sharp rise followed by a more gradual decline in the near-UV luminosity, prior to the eruption in the visual luminosity. This is because the expansion of the outer layers lags behind the rise in bolometric luminosity. These predicted precursor-UV-flashes last between a few hours and a few days, and the predicted luminosity increase is between ∼0.5 and ∼3 mag. These flashes should be easily observable if a nova event is detected early and its time coverage is dense. Many observed novae exhibit a pre-maximum halt, and this feature is found in all three electromagnetic bands of many, but not all, of our nova models. We explain the presence or absence of pre-maximum halts as due to changes in the convective energy transfer regime. Finally we note cases where the maximum visual magnitude reaches as high as −8.5 mag for low-mass white dwarfs. This re-emphasizes the fact that white dwarf mass is not always the determining factor in setting a nova’s peak luminosity. Key words: methods: data analysis – methods: numerical – binaries: close – novae, cata- clysmic variables – white dwarfs. 1 INTRODUCTION Classical novae (CNe) are powerful explosions of previously faint stars. The study of CN eruptions was energized by the appearance of first-magnitude GK Persei – Nova 1901 AD. Since then, many such energetic, mass-ejecting events have been detected, first in our own Galaxy (e.g. Payne-Gaposchkin 1957) and, more recently, in galaxies all the way out to the Virgo cluster. The physical explana- tion of the CN phenomenon followed Kraft’s (1964) study, which demonstrated that novae must be composed of a white dwarf (WD) – the primary star – accreting hydrogen-rich matter via an accretion disc from a red dwarf (RD) companion – the secondary star. Two E-mail: [email protected] logical consequences of this model are that (1) CN are powered by thermonuclear runaways (TNR) in their WDs’ hydrogen-rich en- velopes (Starrfield et al. 1972) and (2) novae must self-extinguish when their erupting envelopes are ejected (Prialnik, Shara & Shaviv 1978). Early theoretical studies focused on nova simulations of the ac- creting WD up to the TNR, using a hydrostatic stellar evolution code. The first full-cycle nova simulation was carried out by Prial- nik (1986), on a main-frame computer, using a hydrodynamic code. The appearance of workstations, and of PCs with high speed and large memory, enabled carrying out simulations of several, consec- utive cycles (Shara, Prialnik & Kovetz 1993; Prialnik & Kovetz 1995). It became clear (Prialnik 1995) that a simulation of a nova on a WD of given composition (e.g. C and O in equal mass frac- tions) depended on three key parameters: the WD mass M WD , its C 2013 The Authors Published by Oxford University Press on behalf of the Royal Astronomical Society at California Institute of Technology on March 20, 2014 http://mnras.oxfordjournals.org/ Downloaded from
Transcript of Nova multiwavelength light curves: predicting UV...

MNRAS 437, 1962–1975 (2014) doi:10.1093/mnras/stt2027Advance Access publication 2013 November 19
Nova multiwavelength light curves: predicting UV precursorflashes and pre-maximum halts
Y. Hillman,1‹ D. Prialnik,1 A. Kovetz,1,2 M. M. Shara3 and J. D. Neill41Department of Geophysics and Planetary Sciences, Raymond and Beverly Sackler Faculty of Exact Sciences, Tel-Aviv University, Tel-Aviv 69978, Israel2School of Physics and Astronomy, Raymond and Beverly Sackler Faculty of Exact Sciences, Tel Aviv University, Tel-Aviv 69978, Israel3Department of Astrophysics, American Museum of Natural History, Central Park West and 79th street, New York, NY 10024-5192, USA4California Institute of Technology, 1200 E. California Blvd., Pasadena, CA 91125, USA
Accepted 2013 October 18. Received 2013 October 17; in original form 2013 August 6
ABSTRACTThe dramatic brightenings of classical novae have yielded rich data sets of detailed lightcurves. Modelling these light curves is a challenge for any theory of classical novae. We haveused our extended grid of nova outburst calculations to predict the luminosities of eruptingnovae expected in three electromagnetic bands – the visual, the near UV and the X-ray.Our models predict and explain many features of novae before eruption, as well as detailedcharacterizations of nova outbursts and post-nova declines. The evolutionary time-scales oferuption features vary by orders of magnitude, and depend on the basic nova parameters:white dwarf mass, luminosity and accretion rate. However, all light curves are found to sharecommon features. Some of these features are unique to only one electromagnetic passband,while others show up in two, or in all three of the analysed bands. One extraordinary feature,common to all of our low-mass white dwarfs (0.65 M�) novae, is that all exhibit a sharprise followed by a more gradual decline in the near-UV luminosity, prior to the eruptionin the visual luminosity. This is because the expansion of the outer layers lags behind therise in bolometric luminosity. These predicted precursor-UV-flashes last between a few hoursand a few days, and the predicted luminosity increase is between ∼0.5 and ∼3 mag. Theseflashes should be easily observable if a nova event is detected early and its time coverage isdense. Many observed novae exhibit a pre-maximum halt, and this feature is found in all threeelectromagnetic bands of many, but not all, of our nova models. We explain the presence orabsence of pre-maximum halts as due to changes in the convective energy transfer regime.Finally we note cases where the maximum visual magnitude reaches as high as −8.5 mag forlow-mass white dwarfs. This re-emphasizes the fact that white dwarf mass is not always thedetermining factor in setting a nova’s peak luminosity.
Key words: methods: data analysis – methods: numerical – binaries: close – novae, cata-clysmic variables – white dwarfs.
1 IN T RO D U C T I O N
Classical novae (CNe) are powerful explosions of previously faintstars. The study of CN eruptions was energized by the appearanceof first-magnitude GK Persei – Nova 1901 AD. Since then, manysuch energetic, mass-ejecting events have been detected, first in ourown Galaxy (e.g. Payne-Gaposchkin 1957) and, more recently, ingalaxies all the way out to the Virgo cluster. The physical explana-tion of the CN phenomenon followed Kraft’s (1964) study, whichdemonstrated that novae must be composed of a white dwarf (WD) –the primary star – accreting hydrogen-rich matter via an accretiondisc from a red dwarf (RD) companion – the secondary star. Two
� E-mail: [email protected]
logical consequences of this model are that (1) CN are powered bythermonuclear runaways (TNR) in their WDs’ hydrogen-rich en-velopes (Starrfield et al. 1972) and (2) novae must self-extinguishwhen their erupting envelopes are ejected (Prialnik, Shara & Shaviv1978).
Early theoretical studies focused on nova simulations of the ac-creting WD up to the TNR, using a hydrostatic stellar evolutioncode. The first full-cycle nova simulation was carried out by Prial-nik (1986), on a main-frame computer, using a hydrodynamic code.The appearance of workstations, and of PCs with high speed andlarge memory, enabled carrying out simulations of several, consec-utive cycles (Shara, Prialnik & Kovetz 1993; Prialnik & Kovetz1995). It became clear (Prialnik 1995) that a simulation of a novaon a WD of given composition (e.g. C and O in equal mass frac-tions) depended on three key parameters: the WD mass MWD, its
C© 2013 The AuthorsPublished by Oxford University Press on behalf of the Royal Astronomical Society
at California Institute of T
echnology on March 20, 2014
http://mnras.oxfordjournals.org/
Dow
nloaded from

Nova light curves 1963
(isothermal) core temperature Tc, and the accretion rate M . Gridsof nova simulations for wide ranges of these three parameters werecalculated (Prialnik & Kovetz 1995), culminating with a determi-nation of the limits of these ranges, outside of which novae couldnot occur (Yaron et al. 2005).
A typical nova cycle comprises an accretion phase, an eruptionfollowed by a mass-loss phase and a long decline that overlapsthe next accretion phase (Prialnik 1986). A nova eruption startswhen a TNR is initiated in an accreting WD’s envelope (Shara1989; Starrfield, Iliadis & Hix 2008). A rise in visual luminosityhas signalled the vast majority of novae outbursts to astronomers,but we note that, until the past two decades, most novae were notintensively observed in the ultraviolet or X-ray passbands. Duringthe late stages of nova eruptions, after mass loss has ceased, thevisual (VIS) luminosity declines to its pre-nova value, while thenear-UV (NUV) luminosity dominates (MacDonald, Fujimoto &Truran 1985). Eventually, it declines as well. The X-ray luminosityalso remains high after the decline in the VIS luminosity Itoh &Hachisu (1990); MacDonald & Vennes (1991). It has been observedin novae decades after the visual eruption has ended. Finally, itdeclines as well (Orio et al. 1994, 2009; Schaefer & Collazzi 2010).
Simulations of nova outburst evolution show that the rise in bolo-metric luminosity L following the onset of the TNR occurs at almost
Figure 1. A full, typical nova cycle shown in an HR diagram, for theparameter combination; MWD = 1.25 M�, Tc = 5 × 10⁷ K and MWD =10−10 M� yr−1.
constant radius. This is because the dynamical expansion time of theWD envelope – hours to days – is much longer than the time-scaleof the last explosive phase of the TNR – minutes. The net resultis that the effective temperature Teff of a nova rises very rapidly, atthe TNR time-scale. When L approaches the Eddington limit, theWD’s outer layers start expanding at almost constant (Eddington)luminosity, and the effective temperature decreases as the radiusincreases and the mass loss phase begins. We expect this generalbehaviour to be reflected in the evolution of the luminosities in theVIS, NUV and X-ray passbands; but we are aware of significantvariations in outburst behaviours amongst our many models. Thesevariations, in addition to recent detailed observations and classifi-cation schemes of nova light curves (Strope, Schaefer & Henden2010), have motivated us to data-mine the extensive data base gen-erated by the calculations of Prialnik & Kovetz (1995) and Yaronet al. (2005) (see Section 3) in order to confront nova model lightcurves with observations.
In the next section we describe the general physical principles thatgovern the behaviour of nova luminosities in different passbands. InSection 3 we describe the data base used for this study. In Section4 we analyse the results of our study. A brief discussion and mainconclusions follow in Section 5.
2 T H E E VO L U T I O N O F N OVA L U M I N O S I T Y,T E M P E R AT U R E A N D R A D I U S
Fig. 1 shows the path of the luminosity and the effective tempera-ture of a typical nova cycle in an HR diagram. A significant part ofthe nova cycle is spent during the accretion phase, in quiescence,i.e. both Teff and L remain constant. The onset of the nova eruptionis marked by the rapid rise of Teff and L along a slope of constantradius. This is followed by the expansion and the mass-loss stage,represented by the turn to the right, and a subsequent horizontalpath. As mass-loss declines, contraction of the envelope ensues,illustrated by the turn back towards higher effective temperaturesalong the same horizontal line. Finally, when mass ejection stops,L and Teff revert slowly back to their pre-nova values, descend-ing along the same slope, at constant radius, as the rapid rise tomaximum light.
The typical evolution in time of a nova flash (effective temper-ature, radius and luminosity) emerging from Fig. 1 is displayed inFig. 2 for a 1.25 M� WD, a core temperature of 5 × 10⁷ K and anaccretion rate of 10−10 M�yr−1. The left panel shows a complete
Figure 2. Evolution of log(Teff [K]) (blue solid), log(R[R�]) (green dash–dotted) and log(L[L�]) (red dash) for MWD = 1.25 M�, Tc = 5 × 10⁷ K andMWD = 10−10 M� yr−1. Left: a complete light curve on a time-scale of days. Right: a close-up of the pre-nova temperature spike (time-scale of hours).
at California Institute of T
echnology on March 20, 2014
http://mnras.oxfordjournals.org/
Dow
nloaded from

1964 Y. Hillman et al.
Figure 3. Evolution of log(Teff [K]) throughout a nova cycle for a WD cen-tral temperature of Tc = 107 K, an accretion rate of MWD = 10−8 M� yr−1
and the masses: MWD = 0.65 M� (black); MWD = 1.0 M� (red); MWD =1.25 M� (green); and MWD = 1.4 M� (orange).
nova outburst. Note the initial sharp spike in the effective tempera-ture during the first day, which then declines as the radius expands.The right panel of Fig. 2 shows a close-up of this temperature spike.
The effective temperatures displayed by all novae undergo dras-tic changes throughout a nova outburst, regardless of the three keynova parameters. Fig. 3 shows the behaviour of Teff throughout acomplete nova cycle on a logarithmic scale, as well as the commonfeatures and differences in the Teff profile for different WD masses.The cycle duration and the minimum and maximum Teff vary de-pending on the chosen key parameter values (e.g. the WD mass).However, in all cases, Teff changes by ∼1–2 orders of magnitudethroughout the cycle, causing the wavelength of peak emission topass through the various electromagnetic bands. This results in theapparent magnitude evolving in very different manners for the dif-ferent electromagnetic bands. This behaviour is described in moredetail in Section 4.
The accretion rate indirectly affects the light curves as well: afaster accretion rate results in a shorter time-scale for mass ejection.But the most important information gleaned from these light curvesis that the duration of the effective temperature peak ranges froma few hours to a few months, a testable prediction for each of theVIS, NUV and XRT passbands.
3 DATA BA SE
The data base for this study is the grid of nova light curves de-rived from modelling by Prialnik & Kovetz (1995) and then ex-panded by Yaron et al. (2005). The grid spans a range of valuesfor the three parameters; the WD mass (MWD: 0.65, 1.0, 1.25 and1.4 M�), the core temperature (Tc: 107, 3 × 10⁷ and 5 × 10⁷ K)and the accretion rate (MWD: 10−7, 10−8, 10−9, 10−10, 10−11 and10−12 M� yr−1). The nova evolution code used to derive the lightcurves is a hydrodynamic Lagrangian code and was described insome detail by Prialnik & Kovetz (1995). It includes OPAL opaci-ties, a nuclear reaction network including 40 heavy element isotopesup to 31P, convection according to the mixing-length theory, diffu-sion for all elements, accretional heating and a mass-loss algorithmthat applies a steady, optically thick supersonic wind solution. Thedynamical phases are calculated by solving the equation of motionalong with the energy balance equation, rather than imposing hy-
drostatic equilibrium. Mass loss is calculated continually, accordingto the mass-loss rate Mm−l derived from the optically thick windsolution.
For each parameter combination, the code was programmed torun for ∼5–10 consecutive cycles, until a regular cyclic patternwas obtained, showing very little variations between the cycles(of the order of a few per cent). Then one cycle was selected forextensive analysis. The nova parameters in the following figuresare specified in the figure title in the form: ‘MWD.Tc.MWD’, e.g.125.30.9 refers to the model; MWD = 1.25 M�, Tc = 3 × 10⁷ K andMWD = 10−9 M� yr−1. Data – in particular, the WD radius (RWD),Teff, L and visual magnitude (MV) – were produced for a largenumber of parameter combinations throughout the nova cycle. Wethen extracted the NUV and X-ray magnitudes (MNUV and MXRT).The synthetic magnitudes are based on the response functions ofthe Galaxy Evolution Explorer (GALEX) Martin et al. (2005) NUVband, the SWIFT Gehrels et al. (2004) X-ray Telescope1 (XRT),and the Johnson V-band filter Bessel (1990). The GALEX projecthas recently been terminated; we used the GALEX passband simplybecause we had easy access to it. However, the NUV wavelengthspan observed by GALEX is 175–280 nm Martin et al. (2005),while that observed by SWIFT UVOT is the nearly identical 170–290 nm.2 Since the NUV passbands of the two telescopes coveralmost the same wavelengths, the NUV light curves we producedfor the GALEX passband are equally applicable to SWIFT UVOTobservations. The model effective temperature and radius at a givenpoint were used to specify the spectral energy distribution and lumi-nosity of a blackbody. The response curves were used to integratethe blackbody flux within each of the passbands. The integratedfluxes were then converted to standard AB magnitudes Oke (1974).To simulate observations of the modelled novae in the nearby galaxyM31, we dim these magnitudes by a distance modulus of 24.4 magRibas et al. (2005).
4 A NA LY SIS O F R ESULTS
The 54 light curves analysed in this study are presented in the sevenpanels of Fig. 4. These show the evolution of nova luminosities inthe VIS, NUV and XRT passbands. The t = 0 point is determinedarbitrarily for the sake of plotting the light curves in a more orless similar fashion. The evolution time is measured continuouslyfrom the beginning of the first cycle for each evolution run. Wesystematically vary the three key WD parameters between succes-sive models. Dramatic changes often occur when we vary just oneparameter; changes in two parameters sometimes affect results inopposing directions, while changes in all three parameters lead tounpredictable results.
There are a few features that are common to all our light curves.X-ray emission is always minimal during the mass-loss phase, whenthe hot WD is obscured by its X-ray absorbing envelope. X-rayemission is highest during the post-nova decline, when mass losshas ceased and the hot WD is exposed. During the post-nova declinethe VIS is always the lowest of the three luminosities as the hot WDemits mostly NUV and X-rays.
The time-scale of nova eruptions varies from about one day totens of years, depending mostly on the WD mass. The accretion rateplays a secondary but non-negligible role. The ratio between thedurations of the three nova phases – pre-nova rise, mass-loss phase
1 http://swift.gsfc.nasa.gov/docs/heasarc/caldb/data/swift/xrt/index.html2 http://swift.gsfc.nasa.gov/analysis/uvot_ugrism.html
at California Institute of T
echnology on March 20, 2014
http://mnras.oxfordjournals.org/
Dow
nloaded from

Nova light curves 1965
and post-nova decline – is roughly the same for all the models.The pre-nova rise time is always much shorter than the mass-losstime-scale which, in turn, is always much shorter than the post-novadecline time. The first of these is controlled by the dynamical time-scale of the WD envelope. The second is the time-scale required togenerate sufficient nuclear energy to unbind the WD envelope. Thethird is the thermal time-scale of the outer WD and the remnantenvelope not ejected by the nova.
4.1 Pre-Nova NUV flashes
The most important finding (and prediction) of this paper (basedon the models published in 2005 by Yaron et al.) is that a subset
of our models displays a bright flash in the NUV prior to the onsetof the mass-loss phase. This NUV precursor (to the optical out-burst) flash is exhibited by the low-mass, 0.65 M�, WDs (all butthe cold, extremely slow accreting 065.10.11) and occurs concur-rently with the Teff early peak. The amplitude of the NUV flashesvaries from 0.5 to 2 mag and the duration is ∼5–10 d. There is onemodel, the 065.10.10 (Fig. 4, panel 1), that produces an exception-ally large flash – a magnitude change of ∼3 mag, which lasts as longas 60 d.
At least two observational detections of this phenomenon have re-cently been reported, based on GALEX observations of M31 novae.In particular, Cao et al. (2012) report that ‘Novae M31N 2009-10b and M31N 2010-11a show prominent UV emission peaking a
Figure 4. Panel 1. Light curves of a typical nova cycle for each parameter combination, given in MV (solid blue), MNUV (green dash) and MXRT (blackdash–dotted). Each light curve is given in its entirety in the right panel, while the left panel is a close up of its pre-nova rise. While the ordinate, representingthe magnitude, is uniformly set for all the light curves, the abscissa, representing the time in days, changes depending on the time-scale of the specific novamodel. The zero-point is arbitrary to some extent.
at California Institute of T
echnology on March 20, 2014
http://mnras.oxfordjournals.org/
Dow
nloaded from

1966 Y. Hillman et al.
Figure 4. Panel 2.
few days prior to their optical maxima, possibly implying aspher-ical outbursts’. In Fig. 5 we reproduce the R-band and NUV lightcurves [from fig. 12 of Cao et al. (2012)], and superpose the VISand NUV curves from our nova model 065.30.11 (Fig. 4, panel 2).The match is remarkably good.
Pietsch et al. (2007a) reported two cases where the UV emissionwas detected previous to the optical maximum: M31N 2007-07cand M31N 2007-07d. For M31N 2007-7c the Swift UV detectionpreceded the optical by 2.8 h Pietsch et al. (2007b), resembling ourmodel 065.30.11 as well (Fig. 4, panel 2 and Fig. 5).
at California Institute of T
echnology on March 20, 2014
http://mnras.oxfordjournals.org/
Dow
nloaded from

Nova light curves 1967
Figure 4. Panel 3.
Cao et al. (2012) also noted that ‘the UV observations and thecolour information suggest that UV and optical emission originatefrom different radiative regions because they cannot be simply inter-preted as the thermal radiation of a receding spherical photosphere
which has a large optical depth in local thermal equilibrium. Be-cause UV emission is only generated deep inside the envelope, theresult may suggest that the envelope has holes from which we cansee deep inside.’ Our 065.30.11 model [see in particular table 2 of
at California Institute of T
echnology on March 20, 2014
http://mnras.oxfordjournals.org/
Dow
nloaded from
1968 Y. Hillman et al.
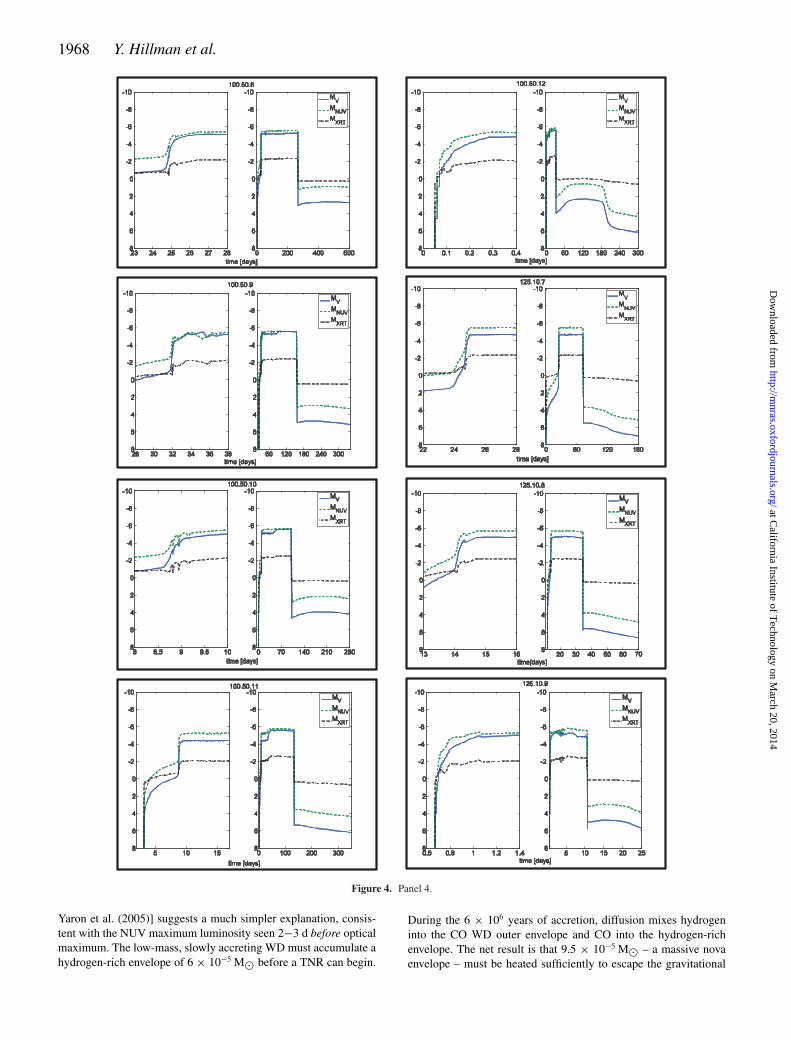
Figure 4. Panel 4.
Yaron et al. (2005)] suggests a much simpler explanation, consis-tent with the NUV maximum luminosity seen 2−3 d before opticalmaximum. The low-mass, slowly accreting WD must accumulate ahydrogen-rich envelope of 6 × 10⁻⁵ M� before a TNR can begin.
During the 6 × 10⁶ years of accretion, diffusion mixes hydrogeninto the CO WD outer envelope and CO into the hydrogen-richenvelope. The net result is that 9.5 × 10⁻⁵ M� – a massive novaenvelope – must be heated sufficiently to escape the gravitational
at California Institute of T
echnology on March 20, 2014
http://mnras.oxfordjournals.org/
Dow
nloaded from

Nova light curves 1969
Figure 4. Panel 5.
grip of its WD. The low mass and large radius of the WD result ina relatively low pressure and weak TNR which reaches a maximumtemperature of only 1.2 × 10⁸ K. Thus, several days (rather thanjust a few hours, as for most novae) are required to release enough
nuclear energy to significantly expand the massive envelope awayfrom the WD.
During the several days that the envelope is hot but WD-sized it radiates mostly in the NUV. Thus we propose that nova
at California Institute of T
echnology on March 20, 2014
http://mnras.oxfordjournals.org/
Dow
nloaded from

1970 Y. Hillman et al.
Figure 4. Panel 6.
NUV precursors, or flashes, like those seen in M31N 2009−10band M31N 2010−11a are the result of a very slow WD enve-lope expansion, and not because of any inhomogeneity in theejecta.
4.2 Symbiotic novae emission line flashes – a prediction
Exactly the same behaviour should occur for TNRs on WDs accret-ing from red giant (RG) companions – the symbiotic novae. The
at California Institute of T
echnology on March 20, 2014
http://mnras.oxfordjournals.org/
Dow
nloaded from

Nova light curves 1971
Figure 4. Panel 7.
WD NUV flashes on low-mass WDs that precede the optical flashesshould irradiate their RG companions with high ionization potentialphotons. This should lead to a very rapid (minutes to a few hours)change in the emission-line spectra of the irradiated RGs. High
excitation lines of helium, oxygen, iron and other elements should‘turn on’ very quickly in the atmosphere of the RG, in responseto the hard radiation suddenly being emitted by the erupting WD.This effect may have already been seen in the narrow UV emission
at California Institute of T
echnology on March 20, 2014
http://mnras.oxfordjournals.org/
Dow
nloaded from

1972 Y. Hillman et al.
Figure 5. MWD = 0.65 M�, Tc = 3 × 10⁷ K and MWD = 10−11 M� yr−1
superposed over the R-band and NUV of nova M31N 2009−10b fromfig.12 in Cao et al. (2012). The magnitude scale of the model curves hasbeen shifted to allow for comparison.
line component of RS Oph, shortly after its 1985 eruption Shore,Kenyon & Sonneborn (1996) and in the X-ray emission of RS Ophduring its 2006 outburst. The problem may, however, be that even atthose relatively early times, ejecta were already interacting with thepre-outburst wind Bode et al. (2006), thus complicating any suchsearches.
4.3 Pre-Nova X-ray flashes
A few intermediate-mass, cold, slow-accreting WD models, namely100.10.10 (Fig. 4, panel 2), 100.10.11 (Fig. 4, panel 3) and125.10.10 (Fig. 4, panel 5) exhibit a precursor X-ray flash in addi-tion to the NUV flash. Because these WDs have smaller radii thanthose of the 0.65 M� models, they produce significantly highervalues of Teff for the same luminosity, leading to an X-ray flash.The amplitude of the X-ray flashes is smaller than that of the NUVflashes: ∼0.5–1 mag. The duration of both the NUV and X-rayflashes on these more massive WDs is much shorter than for the0.65 M� models, a matter of 6–12 h.
Most of the 1.0 M� models also brighten greatly in the NUV.Even during the expansion phase the effective temperature remainstoo high to allow the NUV luminosity to drop, and so the NUVand VIS luminosities remain comparable during the nova eruption.These WDs also undergo pre-maximum NUV halts, as we nowexplain.
4.4 Pre-maximum halts
For many of our models we find pre-maximum halts in the differentelectromagnetic bands; some show the halt in all three bands andothers in only one or two. The halts come in different shapes andsizes, ranging from a fraction of a magnitude up to ∼5–6 mag,and a few even display a double halt. A common behaviour of theluminosities emitted in all three passbands is to increase as Teff
rises, and then to halt as Teff declines. When mass loss begins, theluminosity rises to its maximum value.
An interesting feature accompanying the pre-maximum halt inmany cases is a dip in the total luminosity (see Fig. 6). This dipoccurs in conjunction with the decline of Teff from its peak, justbefore mass loss begins. The cause of this dip is a temporary drop
Figure 6. A luminosity dip accompanying a typical pre-maximum halt,shortly after reaching plateau and prior to mass loss for: MWD = 1.25 M�,Tc = 5 × 10⁷ K and MWD = 10−8 M� yr−1 (see model 125.50.8 in Fig. 4,panel 5). The vertical dotted line marks the beginning of the mass-lossepisode.
in the energy flux as convection in the expanding, thinning envelopeceases to be efficient near the envelope surface. The accompany-ing decrease in opacity soon allows radiation to take over fromconvection, halting and reversing the dip.
Some models produce a double halt, while the second halt isusually shorter, with a smaller amplitude and does not always showup in all three bands. Model 100.10.8 (Fig. 4, panel 2) exhibits asecond halt with an amplitude of about a tenth of a magnitude inthe visual luminosity and lasts a few hours, while in the NUV andX-ray luminosities the amplitude is five times larger (∼0.5 mag)and lasts twice as long. This particular second small halt (a closeup is presented in Fig. 7) bears a remarkable resemblance to visual
Figure 7. Close up of a pre-maximum halt resembling observations;MWD = 1.0 M�, Tc = 107 K and MWD = 10−8 M� yr−1 superposed overthe visual observations of RS Oph and KT Eri from Hounsell et al. (2010).The magnitude scale of the curves has been shifted to allow for comparison.
at California Institute of T
echnology on March 20, 2014
http://mnras.oxfordjournals.org/
Dow
nloaded from

Nova light curves 1973
observational data of RS Ophiuchi and KT Eridani from Hounsellet al. (2010). The massive 125.10.8 model (Fig. 4, panel 4) shows asomewhat similar halt as well.
4.5 Oscillations
Prior to, or during the mass-loss phase, some of our models dis-played luminosity oscillations of ∼0.5–1 mag in all three pass-bands. Time-scales ranged from ∼2 h to ∼50 d. These oscillationsare caused by the restructuring and rebalancing that the envelope un-dergoes as it begins to expand. A typical example is model 125.30.9(Fig. 4, panel 5), performing ∼ five small-amplitude oscillations(∼0.5 mag) over a period of ∼days. An exceptional case is model065.10.11 (Fig. 4, panel 1) with ∼10 oscillations and an amplitudeof ∼1 mag continuing for ∼500 d. Strope et al. (2010) have clas-sified a data base of 93 well-observed nova light curves into sevenmorphological types, oscillations being one of them, based on thefirst 500 d after nova eruption. The light curve of model 065.30.9(Fig. 4, panel 1) begins oscillating after reaching peak luminosity
Figure 8. Close up of oscillations resembling Strope et al.’s (2010)O-class nova light curves; MWD = 0.65 M�, Tc = 3 × 10⁷ K and MWD =10−9 M� yr−1. MV (solid blue) MNUV (green dash) and MXRT (black dash–dot).
(Fig. 8) resembling the O-class (oscillations) nova light curves fromStrope et al. (2010; see their fig. 13).
4.6 Multiple outbursts
Some of the models exhibit multiple outbursts during the mass-loss phase. Prialnik & Livio (1995) first reported mass loss in twostages. Following the first mass-loss episode an envelope contrac-tion occurred. Enhanced pressure at the envelope base then causedan increase in the nuclear luminosity, leading to re-expansion anda second mass-loss episode. Two models displaying large, multipleoutbursts, are 065.10.10 and 065.30.10 (Fig. 4, panel 1). (Someof the more massive WDs exhibited multiple flashes as well.) Theformer continues rising in bursts throughout the entire nova untilthe mass loss ceases. The latter peaks and then declines back. Itdisplays two major additional bursts of ∼2 mag in all three bands.This model (a close up of which is shown in the left panel of Fig. 9)resembles Strope et al.’s (2010) J-class (jitters) nova light curve(see their fig. 19 of nova V723 Cas). An example of a very differ-ent presentation of multiple outbursts of ∼1 mag is demonstratedby model 125.10.10 (Fig. 4, panel 5). A close-up is shown in theright panel of Fig. 9. In this model the first ∼5 days after outburstresemble Hounsell et al.’s (2010) SMEI light curve of V1280 Sco(see their fig. 2).
4.7 Decline – secondary rise
When the mass-loss phase is completed all models undergo a sharpluminosity drop in all three passbands. The X-ray luminosity, whichwas the lowest during the mass-loss phase, becomes the highest andthe VIS becomes the lowest. The X-ray becomes hard at this pointespecially for the massive WDs as demonstrated by the effectivetemperature in Fig. 3 and via observations by Schwarz et al. (2011,Fig. 4). For most low-mass models, the NUV luminosity is justslightly lower than the X-ray luminosity, with the VIS falling farbelow. For the more massive WDs, the NUV and the VIS luminosi-ties are both much weaker than the X-ray luminosity. Differencesbetween the X-ray and the VIS luminosities of 2–8 mag are pre-dicted by the models. Later, the X-ray luminosity declines as well,approaching the VIS luminosity before the beginning of the next
Figure 9. Left: MWD = 0.65 M�, Tc = 3 × 10⁷ K and MWD = 10−1 M� yr−1 exhibiting large multiple flashes on a time-scale and amplitude similar toStrope et al.’s (2010) J-class nova light curves. Right: MWD = 1.25 M�, Tc = 107 K and MWD = 10−10 M� yr−1 exhibiting moderate-amplitude multipleflashes on a short time-scale.
at California Institute of T
echnology on March 20, 2014
http://mnras.oxfordjournals.org/
Dow
nloaded from
1974 Y. Hillman et al.
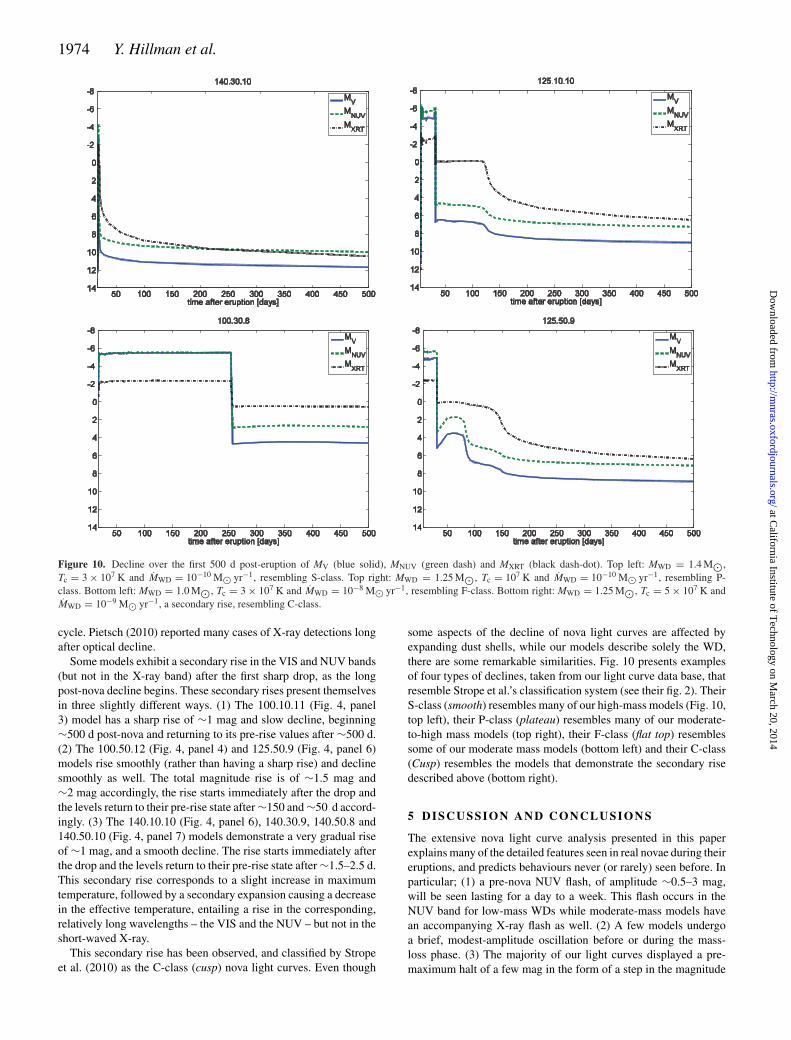
Figure 10. Decline over the first 500 d post-eruption of MV (blue solid), MNUV (green dash) and MXRT (black dash-dot). Top left: MWD = 1.4 M�,Tc = 3 × 10⁷ K and MWD = 10−10 M� yr−1, resembling S-class. Top right: MWD = 1.25 M�, Tc = 107 K and MWD = 10−10 M� yr−1, resembling P-class. Bottom left: MWD = 1.0 M�, Tc = 3 × 10⁷ K and MWD = 10−8 M� yr−1, resembling F-class. Bottom right: MWD = 1.25 M�, Tc = 5 × 10⁷ K andMWD = 10−9 M� yr−1, a secondary rise, resembling C-class.
cycle. Pietsch (2010) reported many cases of X-ray detections longafter optical decline.
Some models exhibit a secondary rise in the VIS and NUV bands(but not in the X-ray band) after the first sharp drop, as the longpost-nova decline begins. These secondary rises present themselvesin three slightly different ways. (1) The 100.10.11 (Fig. 4, panel3) model has a sharp rise of ∼1 mag and slow decline, beginning∼500 d post-nova and returning to its pre-rise values after ∼500 d.(2) The 100.50.12 (Fig. 4, panel 4) and 125.50.9 (Fig. 4, panel 6)models rise smoothly (rather than having a sharp rise) and declinesmoothly as well. The total magnitude rise is of ∼1.5 mag and∼2 mag accordingly, the rise starts immediately after the drop andthe levels return to their pre-rise state after ∼150 and ∼50 d accord-ingly. (3) The 140.10.10 (Fig. 4, panel 6), 140.30.9, 140.50.8 and140.50.10 (Fig. 4, panel 7) models demonstrate a very gradual riseof ∼1 mag, and a smooth decline. The rise starts immediately afterthe drop and the levels return to their pre-rise state after ∼1.5–2.5 d.This secondary rise corresponds to a slight increase in maximumtemperature, followed by a secondary expansion causing a decreasein the effective temperature, entailing a rise in the corresponding,relatively long wavelengths – the VIS and the NUV – but not in theshort-waved X-ray.
This secondary rise has been observed, and classified by Stropeet al. (2010) as the C-class (cusp) nova light curves. Even though
some aspects of the decline of nova light curves are affected byexpanding dust shells, while our models describe solely the WD,there are some remarkable similarities. Fig. 10 presents examplesof four types of declines, taken from our light curve data base, thatresemble Strope et al.’s classification system (see their fig. 2). TheirS-class (smooth) resembles many of our high-mass models (Fig. 10,top left), their P-class (plateau) resembles many of our moderate-to-high mass models (top right), their F-class (flat top) resemblessome of our moderate mass models (bottom left) and their C-class(Cusp) resembles the models that demonstrate the secondary risedescribed above (bottom right).
5 D I S C U S S I O N A N D C O N C L U S I O N S
The extensive nova light curve analysis presented in this paperexplains many of the detailed features seen in real novae during theireruptions, and predicts behaviours never (or rarely) seen before. Inparticular; (1) a pre-nova NUV flash, of amplitude ∼0.5–3 mag,will be seen lasting for a day to a week. This flash occurs in theNUV band for low-mass WDs while moderate-mass models havean accompanying X-ray flash as well. (2) A few models undergoa brief, modest-amplitude oscillation before or during the mass-loss phase. (3) The majority of our light curves displayed a pre-maximum halt of a few mag in the form of a step in the magnitude
at California Institute of T
echnology on March 20, 2014
http://mnras.oxfordjournals.org/
Dow
nloaded from

Nova light curves 1975
profile, in all three passbands. The pre-maximum halt is largest inthe visual and smallest in the X-ray. In many cases a dip in the totalluminosity accompanied these halts immediately before the massloss began, caused by the convection zone boundary receding fromthe photosphere. Most models showed these halts in all three bands.The low-mass models showed these halts in two bands (VIS and X-ray) while the massive, slowly accreting models exhibited a halt onlyin the X-ray band. We explored the possibility that the abundancesof the heavy elements in the ejecta may be correlated somehow withthe features we presented here, but found no substantial correlation.Variations in the abundance are mostly related to the WD mass andaccretion rate as detailed in Yaron et al. (2005, table 2).
Some of the predicted features do resemble observations; theNUV precursor flash which resembles observations reported by Caoet al. (2012); the pre-maximum small halt, which matches visualobservations of RS-Ophiuchi and KT-Eridani Hounsell et al. (2010);the oscillations and the post-nova decline behaviour, including thesecondary rise, that fit well with the morphological classes O, S,P, F and C defined by Strope et al. (2010) and their J-class thatresembles some of our multiple-outbursting models which mightbe observable (decades after outburst) as multiple shells resultingfrom a single nova eruption Duerbeck (1987).
Finally we note two important caveats. The light curves analysedin this work result from the luminosity of the WD only; once masshas left the photosphere of the WD, it is considered lost, and theinteraction of the WD luminosity with the nebula is not calculated.Some novae form dusty nebulae, which obscure the WD and rera-diate in the infrared (IR). For this reason, we have not modelledthe IR passband, since most of the radiation may originate fromthe expanding dusty nebula. Our results refer to an unobscured WDthroughout the entire cycle.
The second caveat is driven by the parameter study nature ofthis paper. The frequency of a phenomenon in our results (whetherit be NUV flashes, oscillations, pre-maximum halts, etc.) has noimplication for the likelihood of it being observed. A rare resultmay be from a model parameter combination that is very commonin nature and vice versa.
AC K N OW L E D G E M E N T S
This work was supported by Grant No.2010220 of the UnitedStates – Israel Binational Science Foundation. MS gratefully ac-knowledges ongoing support from Hilary and Ethel Lipsitz, andvery helpful conversations with J. Mikolajewska concerning sym-biotic novae. A very helpful referee report by Mike Bode is alsogratefully acknowledged.
R E F E R E N C E S
Bessel M. S., 1990, A&AS, 83, 357Bode M. F. et al., 2006, ApJ, 652, 629Cao Y. et al., 2012, ApJ, 752, 133Duerbeck H. W., 1987, ESO Messenger, 50, 8Gehrels N. et al., 2004, ApJ, 611, 1005Hounsell R. et al., 2010, ApJ, 724, 480Itoh H., Hachisu I., 1990, ApJ, 358, 551Kraft R. P., 1964, ApJ, 139, 457MacDonald J., Vennes S., 1991, ApJ, 373, L51MacDonald J., Fujimoto M. Y., Truran J. W., 1985, ApJ, 294, 263Martin C. et al., 2005, in Colless M., Staveley-Smith L., Stathakis R. A.,
eds, ASP Conf. Ser. Vol. 216. IAU Symp., Maps of the Cosmos. Astron.Soc. Pac., San Francisco, p. 221
Oke J. B., 1974, ApJS, 236, 21Orio M., Della Valle M., Massone G., Ogelman H., 1994, A&A, 289, L11Orio M., Mukai K., Bianchini A., De Martino D., Howell S., 2009, ApJ,
690, 1753Payne-Gaposchkin C., 1957, The Galactic Novae. Interscience, New YorkPietsch W., 2010, Astron. Nachr. 331, 187–192Pietsch W., Sala G., Haberl F., Greiner J., 2007a, Astron. Telegram, 1149Pietsch W., Sala G., Haberl F., Greiner J., 2007b, Astron. Telegram, 1157Prialnik D., 1986, ApJ, 310, 222Prialnik D., 1995, in Bianchini A., Della Valle M., Orio M., eds, Cataclysmic
Variables. Kluwer, The Netherlands, p. 217Prialnik D., Kovetz A., 1995, ApJ, 445, 789Prialnik D., Livio M., 1995, PASP, 107, 1201Prialnik D., Shara M. M., Shaviv G., 1978, A&A, 62, 339Ribas I., Jordi C., Vilardell F., Fitzpatrick E. L., Hilditch R. W., Guinan E.
F., 2005, ApJ, 635, L37Schaefer B. B., Collazzi A. C., 2010, AJ, 139, 1831Schwarz G. J. et al., 2011, ApJS, 197, 31Shara M. M., 1989, PASP, 101, 5Shara M. M., Prialnik D., Kovetz A., 1993, ApJ, 406, 220Shore S. N., Kenyon S. J., Sonneborn G., 1996, ApJ, 456, 717Starrfield S., Truran J. W., Sparks W. M., Kutter G. S., 1972, ApJ, 176, 169Starrfield S., Iliadis C., Hix W. R., 2008, in Bode M. F., Evans A., eds,
Classical Novae. p. 77Strope R. J., Schaefer B. E., Henden A. A., 2010, ApJ, 140, 34Yaron O., Prialnik D., Shara M. M., Kovetz A., 2005, ApJ, 623, 398
This paper has been typeset from a TEX/LATEX file prepared by the author.
at California Institute of T
echnology on March 20, 2014
http://mnras.oxfordjournals.org/
Dow
nloaded from