Nov. 11, 2014 - Jefferies€¦ · Jefferies 2014 Energy Conference Jeff Sheets, EVP, Finance and...
24
Jefferies 2014 Energy Conference Jeff Sheets, EVP, Finance and CFO Nov. 11, 2014
Transcript of Nov. 11, 2014 - Jefferies€¦ · Jefferies 2014 Energy Conference Jeff Sheets, EVP, Finance and...
Jef fer ies 2014 Energy Conference
Jeff Sheets, EVP, Finance and CFO Nov. 11, 2014

The following presentation includes forward-looking statements. These statements relate to future events, such as anticipated revenues, earnings, business strategies, competitive position or other aspects of our operations or operating results or the industries or markets in which we operate or participate in general. Actual outcomes and results may differ materially from what is expressed or forecast in such forward-looking statements. These statements are not guarantees of future performance and involve certain risks, uncertainties and assumptions that may prove to be incorrect and are difficult to predict such as oil and gas prices; operational hazards and drilling risks; potential failure to achieve, and potential delays in achieving expected reserves or production levels from existing and future oil and gas development projects; unsuccessful exploratory activities; unexpected cost increases or technical difficulties in constructing, maintaining or modifying company facilities; international monetary conditions and exchange controls; potential liability for remedial actions under existing or future environmental regulations or from pending or future litigation; limited access to capital or significantly higher cost of capital related to illiquidity or uncertainty in the domestic or international financial markets; general domestic and international economic and political conditions, as well as changes in tax, environmental and other laws applicable to ConocoPhillips’ business and other economic, business, competitive and/or regulatory factors affecting ConocoPhillips’ business generally as set forth in ConocoPhillips’ filings with the Securities and Exchange Commission (SEC). We caution you not to place undue reliance on our forward-looking statements, which are only as of the date of this presentation or as otherwise indicated, and we expressly disclaim any responsibility for updating such information.
Use of non-GAAP financial information – This presentation includes non-GAAP financial measures, which are included to help facilitate comparison of company operating performance across periods and with peer companies. A reconciliation of these non-GAAP measures to the nearest corresponding GAAP measure is available at www.conocophillips.com/nongaap.
Cautionary Note to U.S. Investors – The SEC permits oil and gas companies, in their filings with the SEC, to disclose only proved, probable and possible reserves. We use the term "resource" in this presentation that the SEC’s guidelines prohibit us from including in filings with the SEC. U.S. investors are urged to consider closely the oil and gas disclosures in our Form 10-K and other reports and filings with the SEC. Copies are available from the SEC and from the ConocoPhillips website.
Cautionary Statement
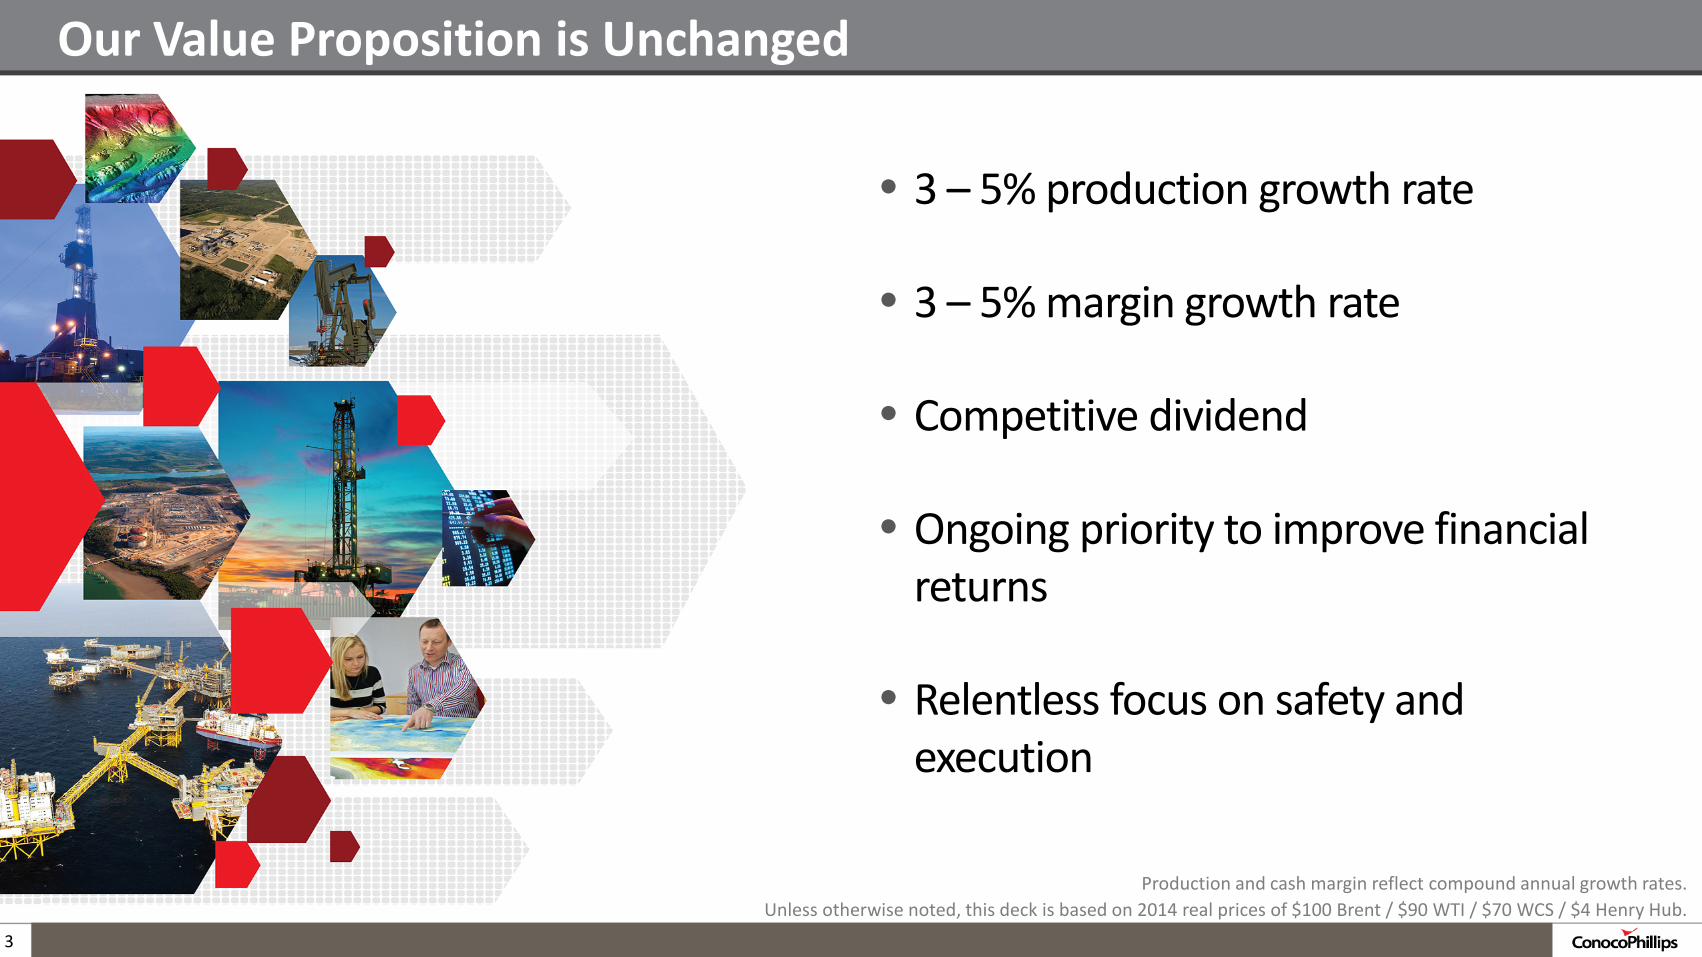
Our Value Proposition is Unchanged
• 3 – 5% production growth rate
• 3 – 5% margin growth rate
• Competitive dividend
• Ongoing priority to improve financial returns
• Relentless focus on safety and execution
3
Production and cash margin reflect compound annual growth rates. Unless otherwise noted, this deck is based on 2014 real prices of $100 Brent / $90 WTI / $70 WCS / $4 Henry Hub.
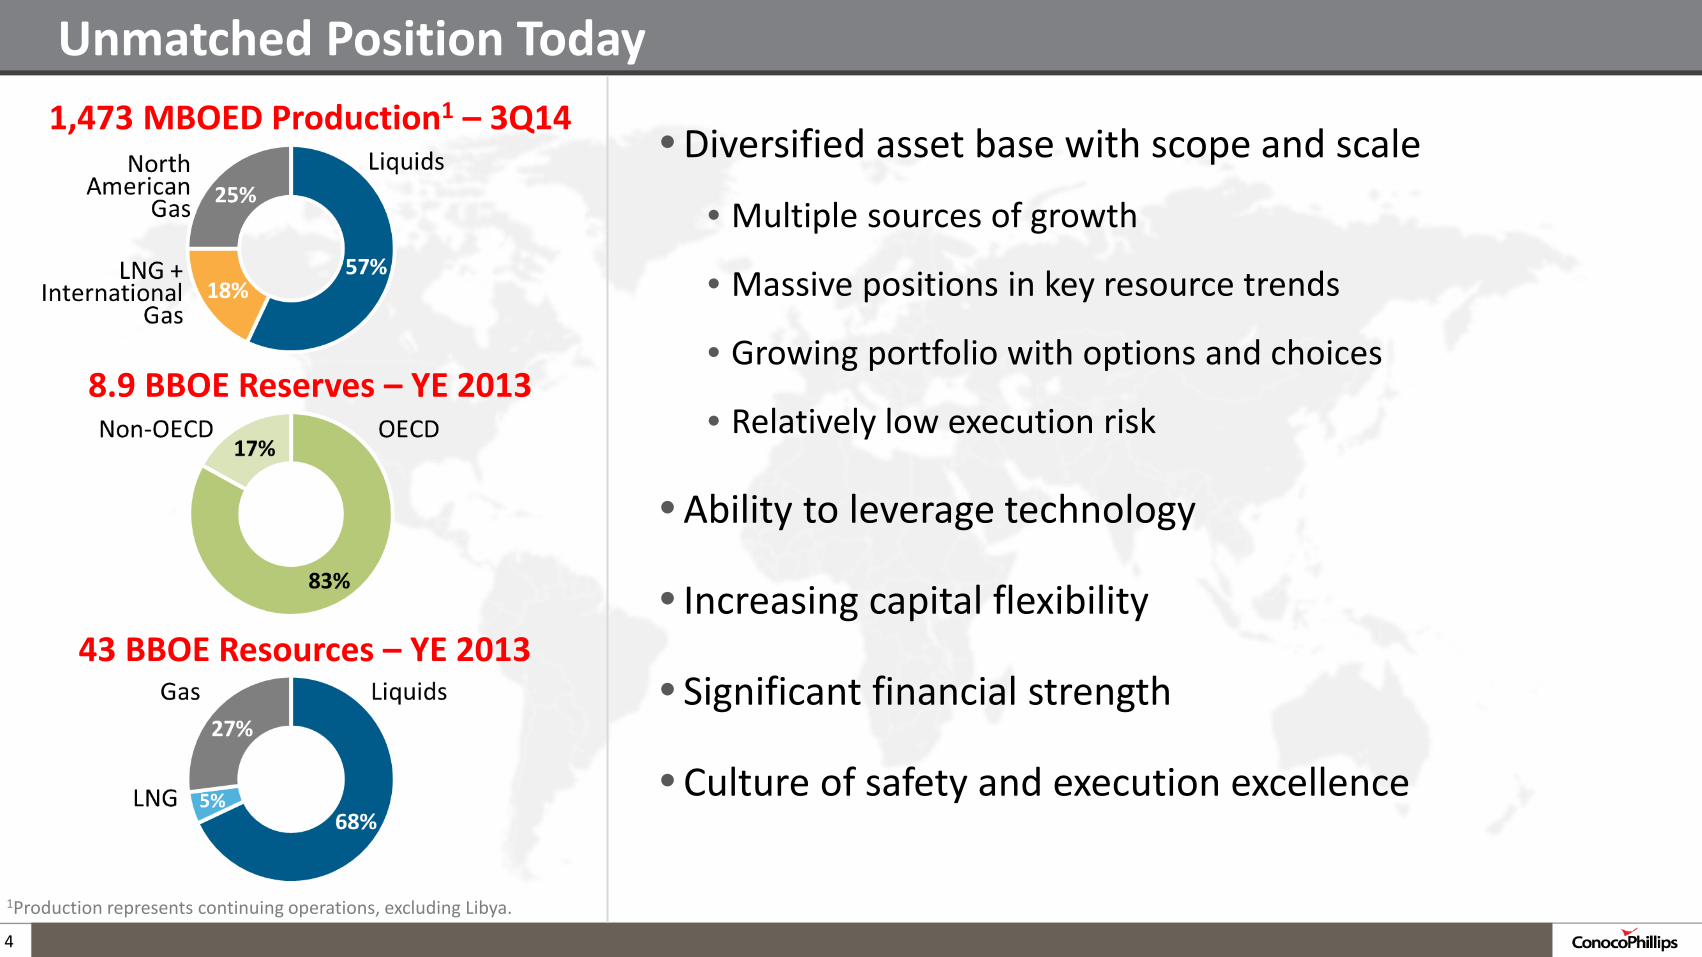
Unmatched Position Today
4
• Diversified asset base with scope and scale
• Multiple sources of growth
• Massive positions in key resource trends
• Growing portfolio with options and choices
• Relatively low execution risk
• Ability to leverage technology
• Increasing capital flexibility
• Significant financial strength
• Culture of safety and execution excellence
8.9 BBOE Reserves – YE 2013
43 BBOE Resources – YE 2013
1,473 MBOED Production1 – 3Q14
1Production represents continuing operations, excluding Libya.

Flexible and Resilient to Lower Prices
5
• Performance on track for 3 to 5 percent volume and margin growth
• Production momentum from recent investments
• Continued focus on margins and returns
• Well positioned for current environment
• Major project completions increase capital flexibility
• Attractive dividend is appropriate
• On track for cash flow neutrality by 2017
• Significant balance sheet strength
Volume represents production from continuing operations, excluding Libya. Margin represents price normalized cash margins.
6
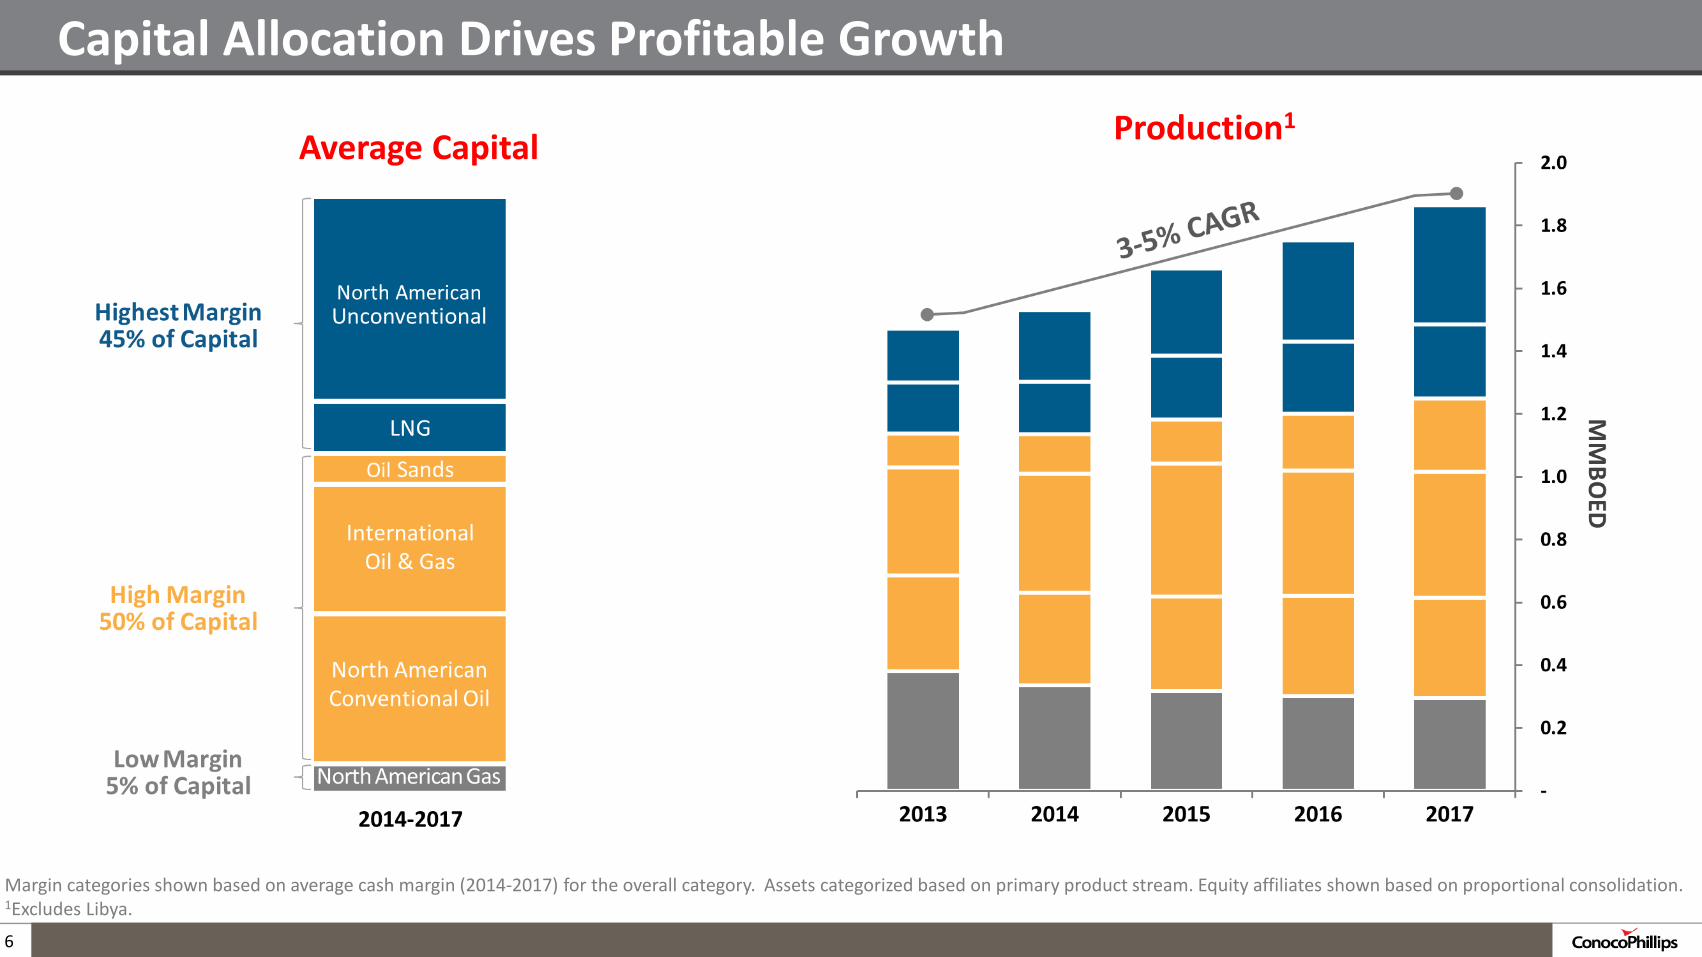
Capital Allocation Drives Profitable Growth
Margin categories shown based on average cash margin (2014-2017) for the overall category. Assets categorized based on primary product stream. Equity affiliates shown based on proportional consolidation. 1Excludes Libya.
Production1 Average Capital
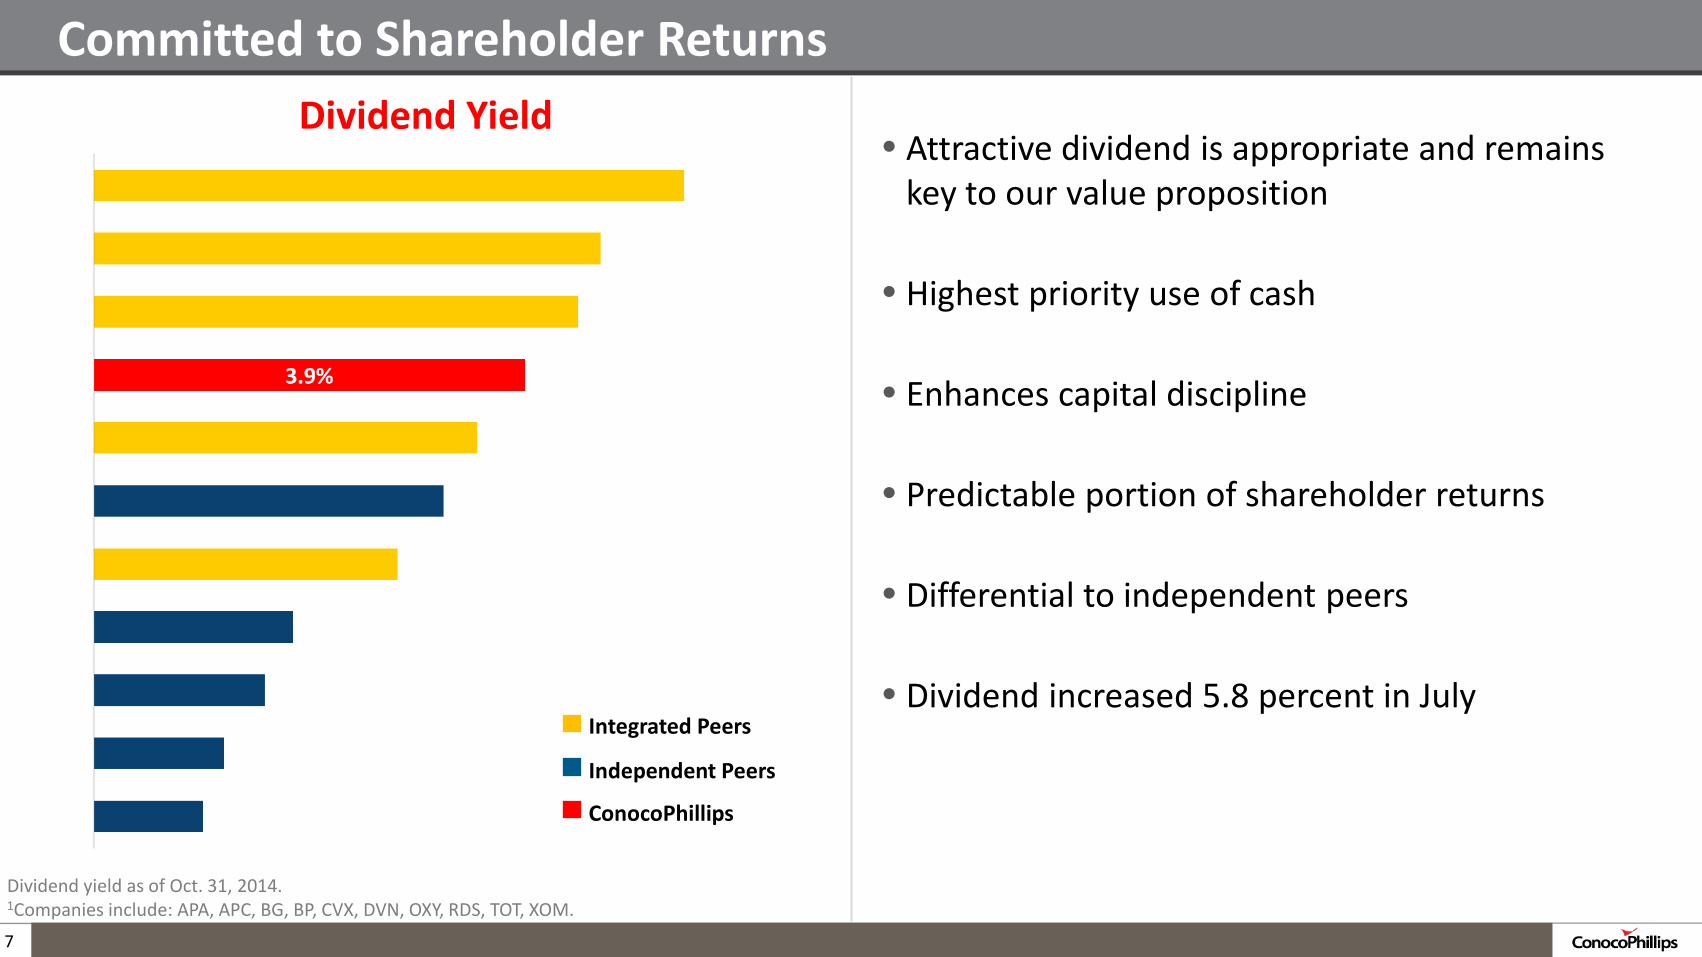
Committed to Shareholder Returns Dividend Yield
7
Dividend yield as of Oct. 31, 2014.
1Companies include: APA, APC, BG, BP, CVX, DVN, OXY, RDS, TOT, XOM.
• Attractive dividend is appropriate and remains key to our value proposition
• Highest priority use of cash
• Enhances capital discipline
• Predictable portion of shareholder returns
• Differential to independent peers
• Dividend increased 5.8 percent in July
Integrated Peers
Independent Peers
ConocoPhillips
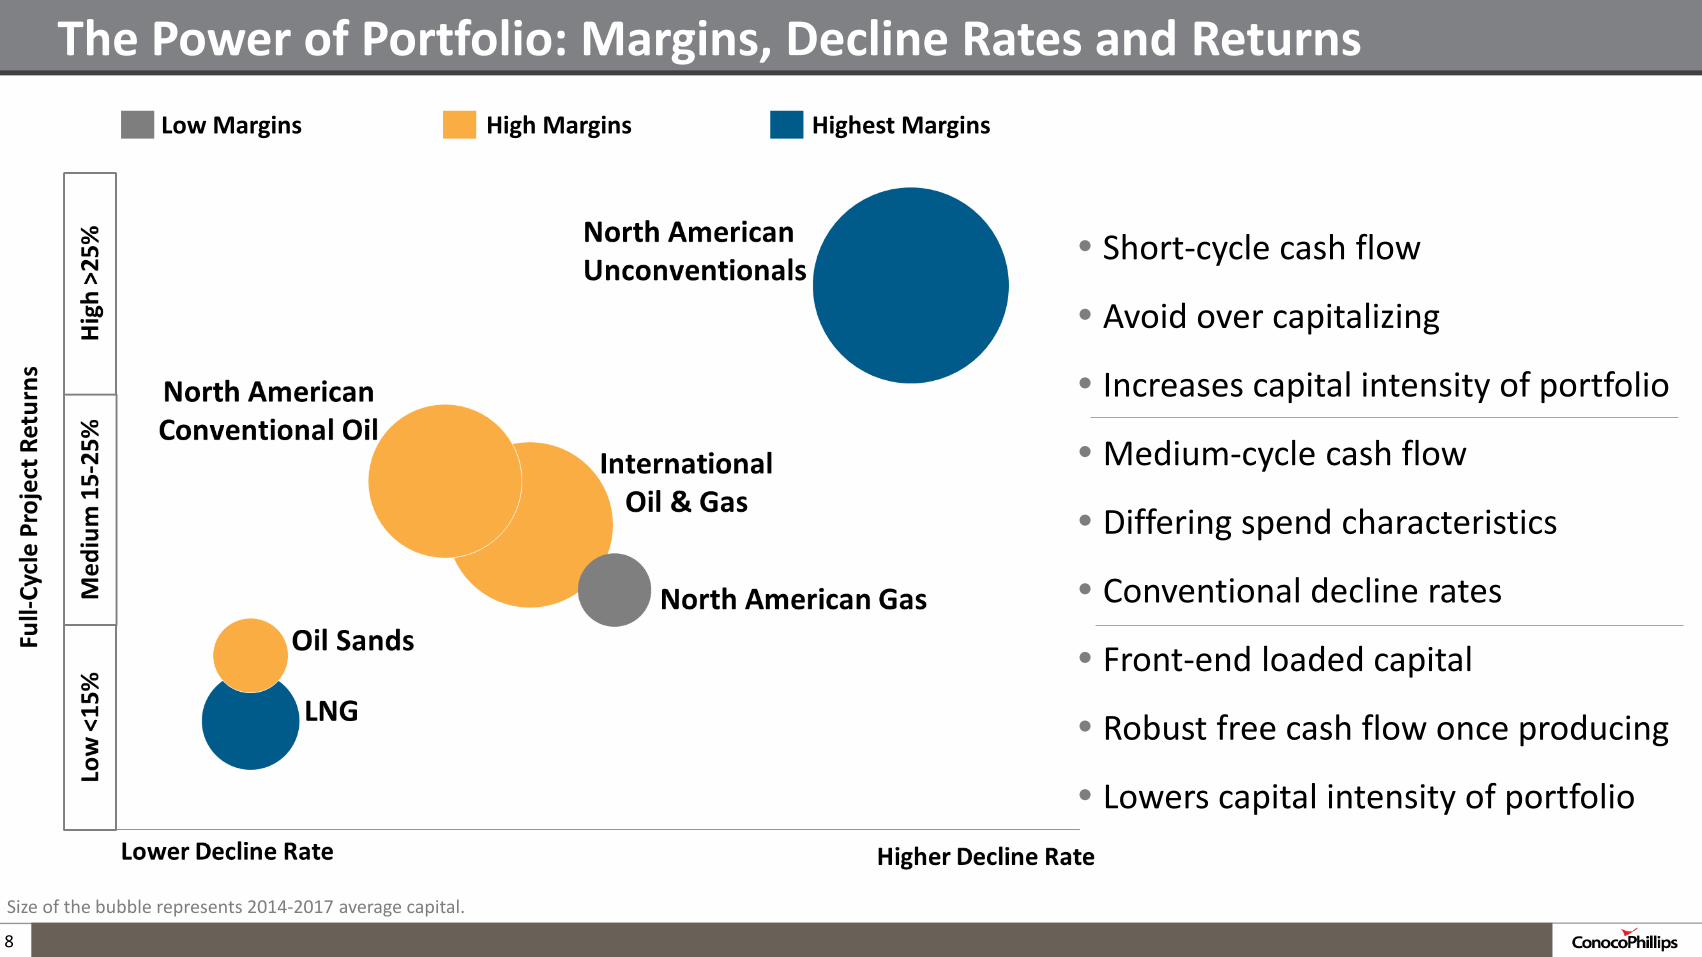
Size of the bubble represents 2014-2017 average capital.
Low Margins High Margins Highest Margins
The Power of Portfolio: Margins, Decline Rates and Returns
8
• Short-cycle cash flow
• Avoid over capitalizing
• Increases capital intensity of portfolio
• Medium-cycle cash flow
• Differing spend characteristics
• Conventional decline rates
• Front-end loaded capital
• Robust free cash flow once producing
• Lowers capital intensity of portfolio
Montney
Bakken
Permian Barnett
Niobrara
Duvernay
Eagle Ford
Anadarko
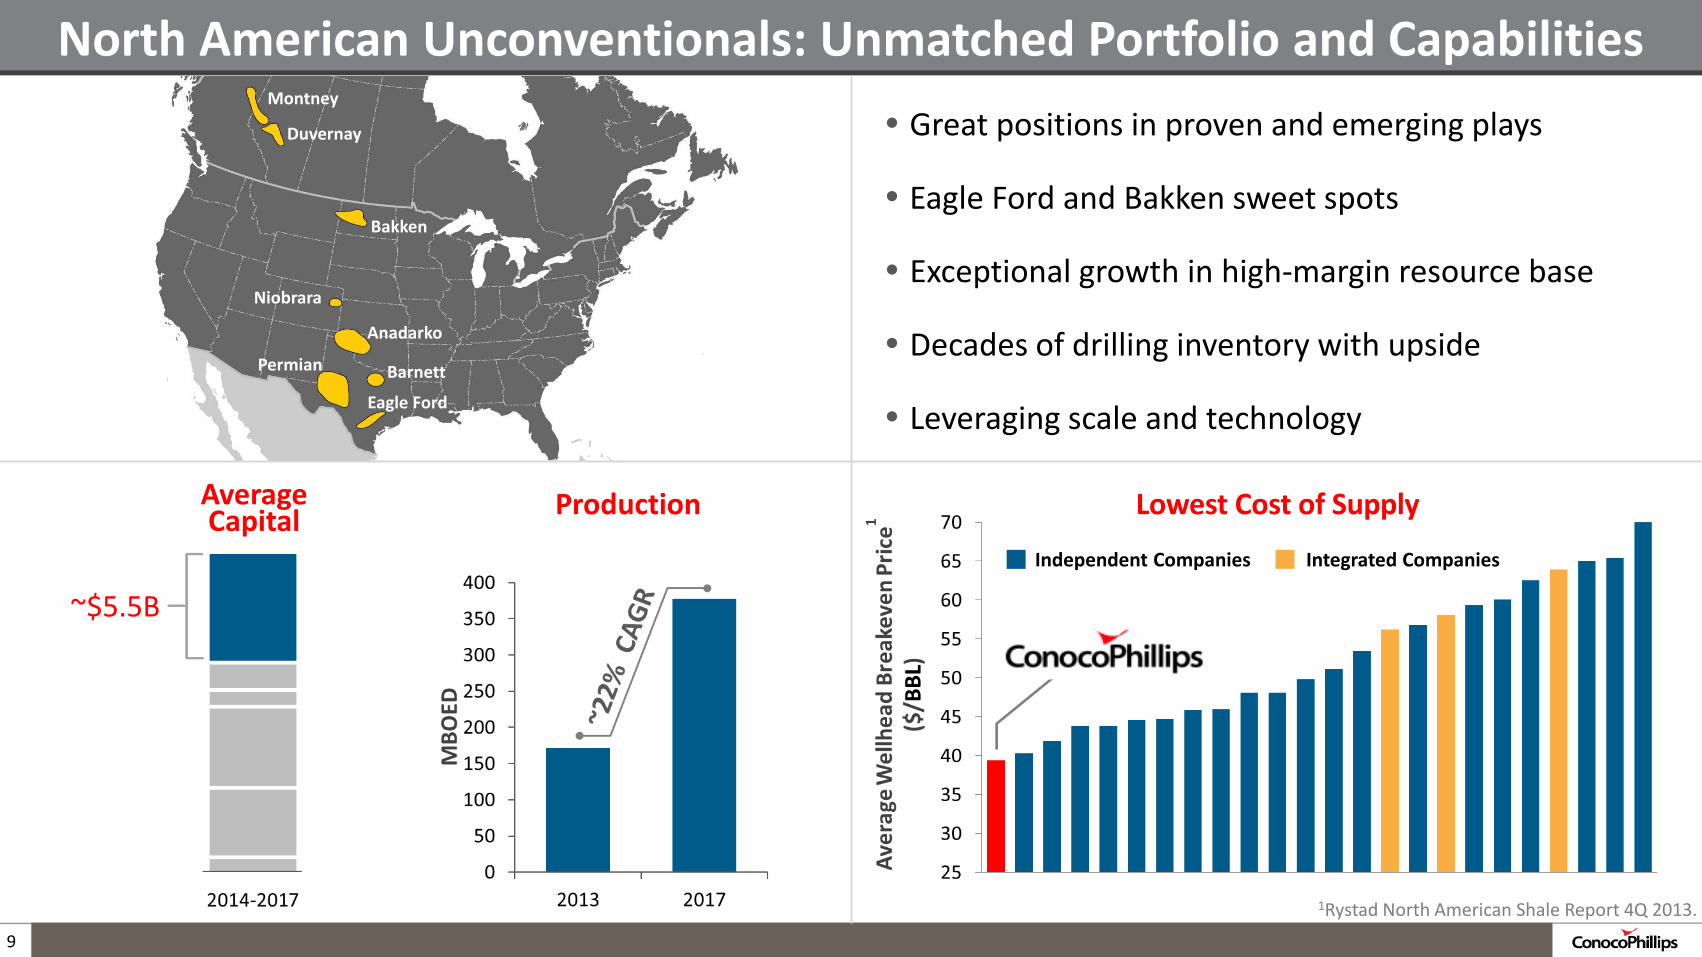
North American Unconventionals: Unmatched Portfolio and Capabilities • Great positions in proven and emerging plays
• Eagle Ford and Bakken sweet spots
• Exceptional growth in high-margin resource base
• Decades of drilling inventory with upside
• Leveraging scale and technology
~$5.5B
Production Lowest Cost of Supply Average
Capital
9
Independent Companies Integrated Companies
1Rystad North American Shale Report 4Q 2013.

Eagle Ford: Significant Resource Increase • ~220 M net acres; acreage capture complete
• 96% average operated working interest
• 1.8 BBOE to 2.5 BBOE net EUR increase
• >3,000 identified drilling locations
• Outlook based on 12-rig program
• $20-25/BOE full-cycle F&D cost
Production
~$3B
Average Capital
10
12014-2017 average.
Product Mix1
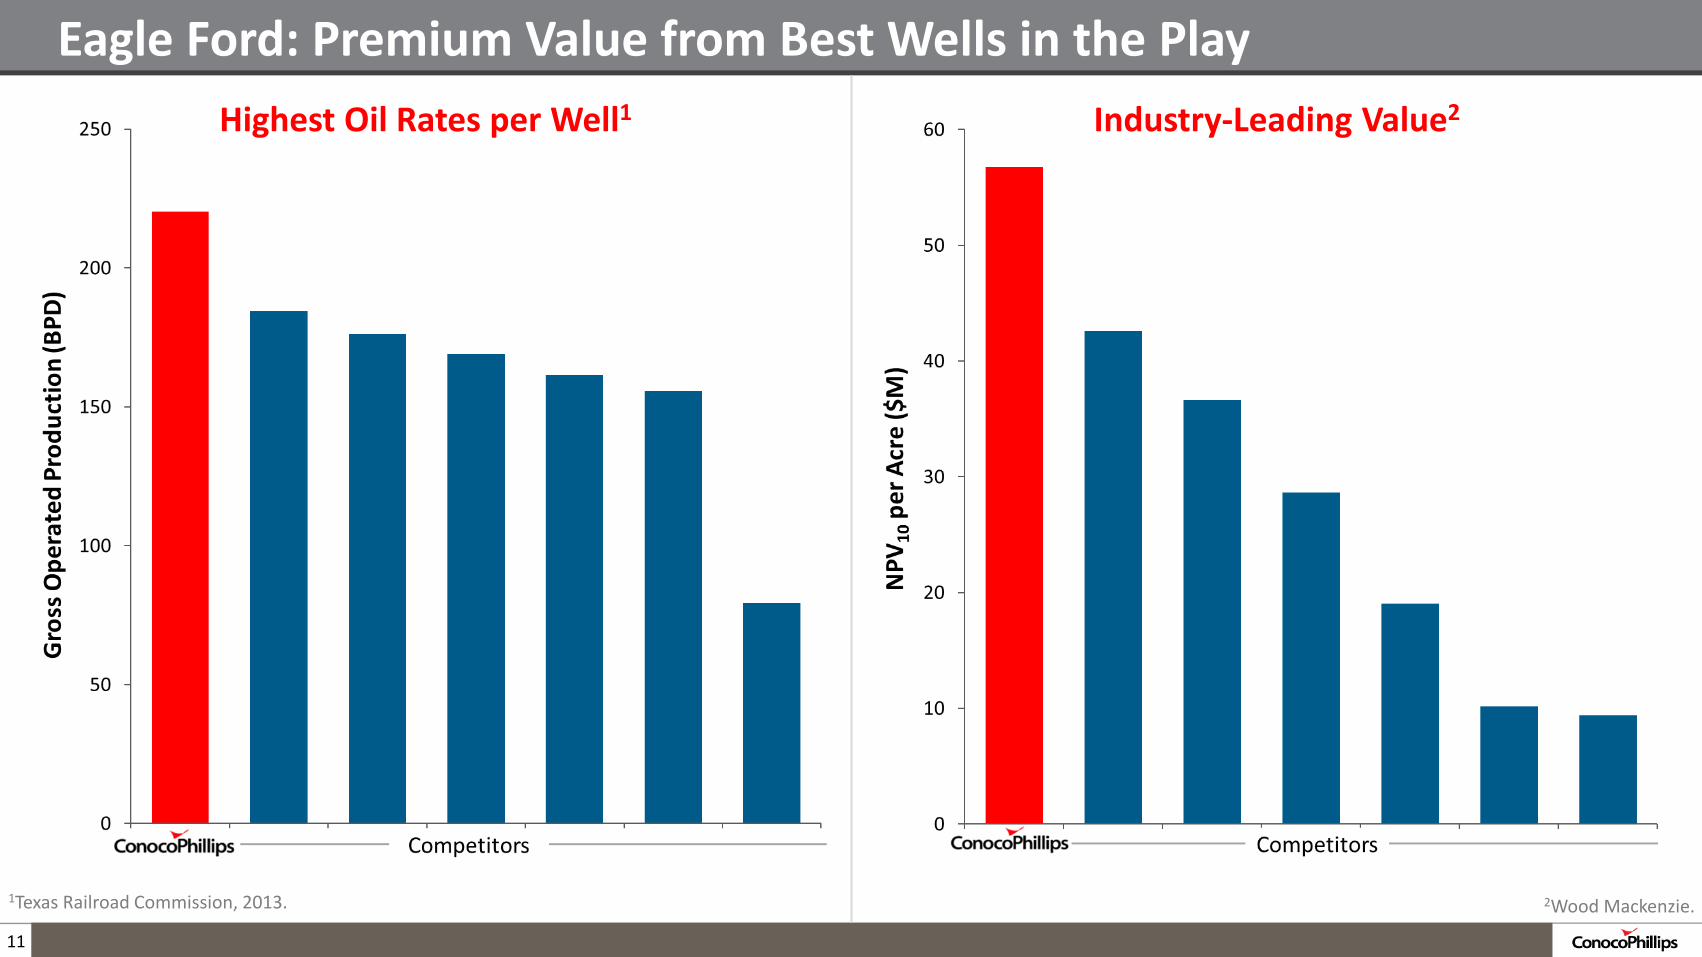
Eagle Ford: Premium Value from Best Wells in the Play Highest Oil Rates per Well1
11
Industry-Leading Value2
1Texas Railroad Commission, 2013. 2Wood Mackenzie.
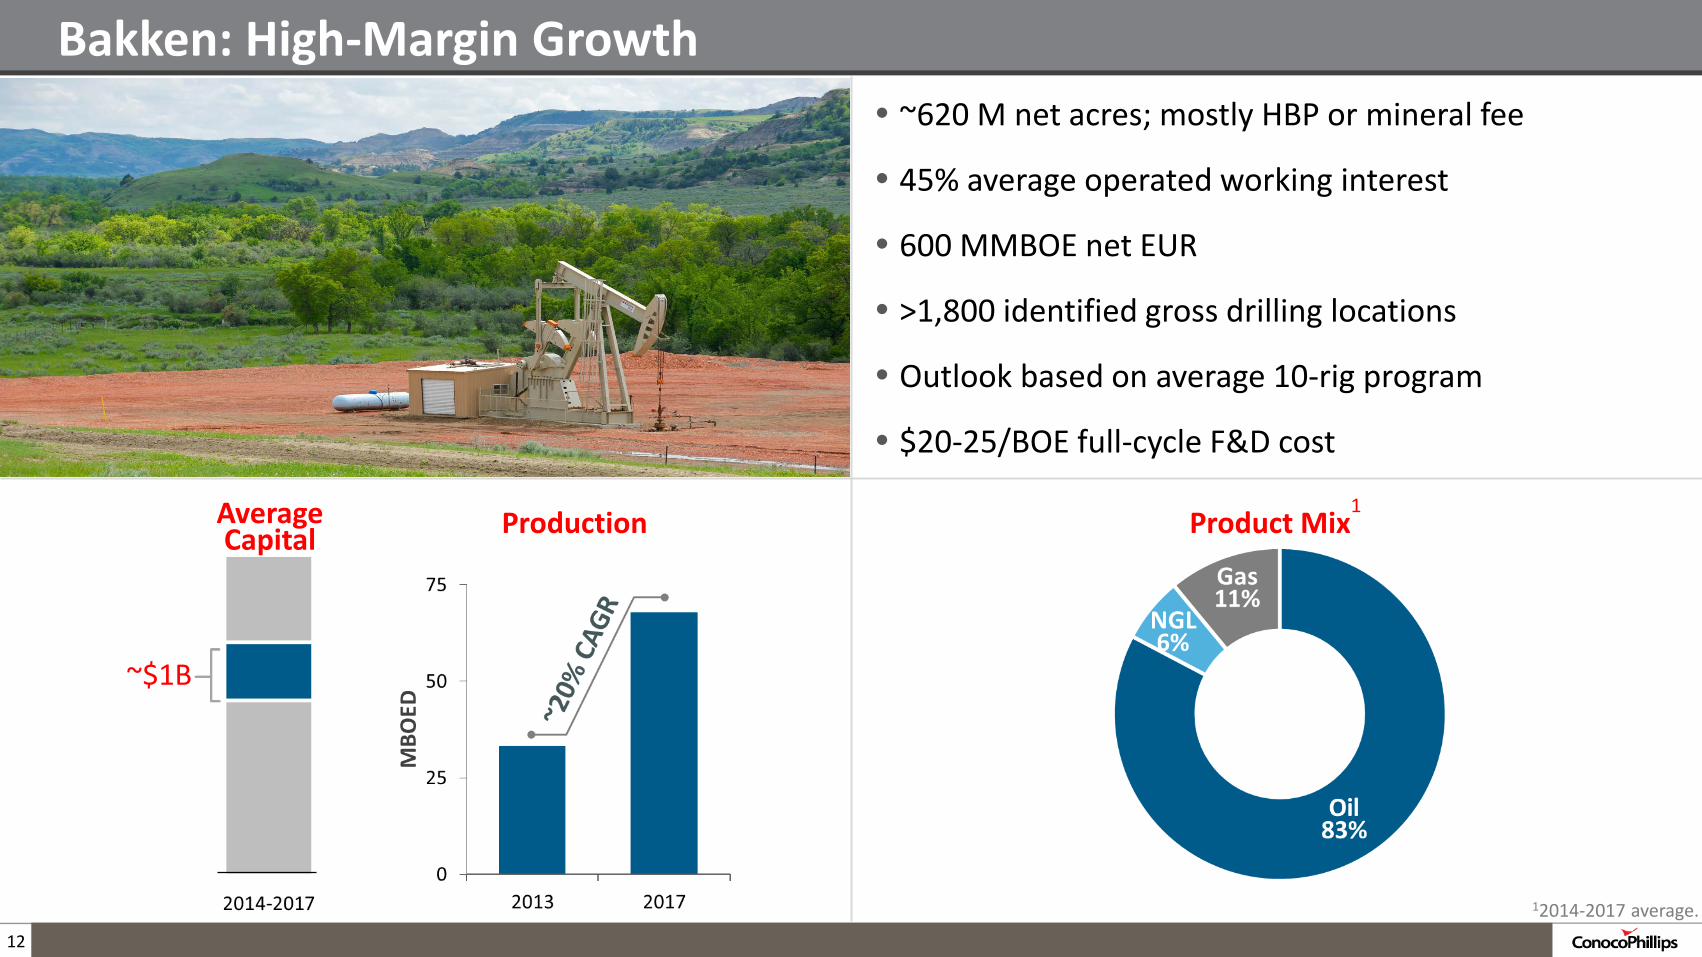
Bakken: High-Margin Growth • ~620 M net acres; mostly HBP or mineral fee
• 45% average operated working interest
• 600 MMBOE net EUR
• >1,800 identified gross drilling locations
• Outlook based on average 10-rig program
• $20-25/BOE full-cycle F&D cost
~$1B
12
Production Average Capital Product Mix
1
12014-2017 average.
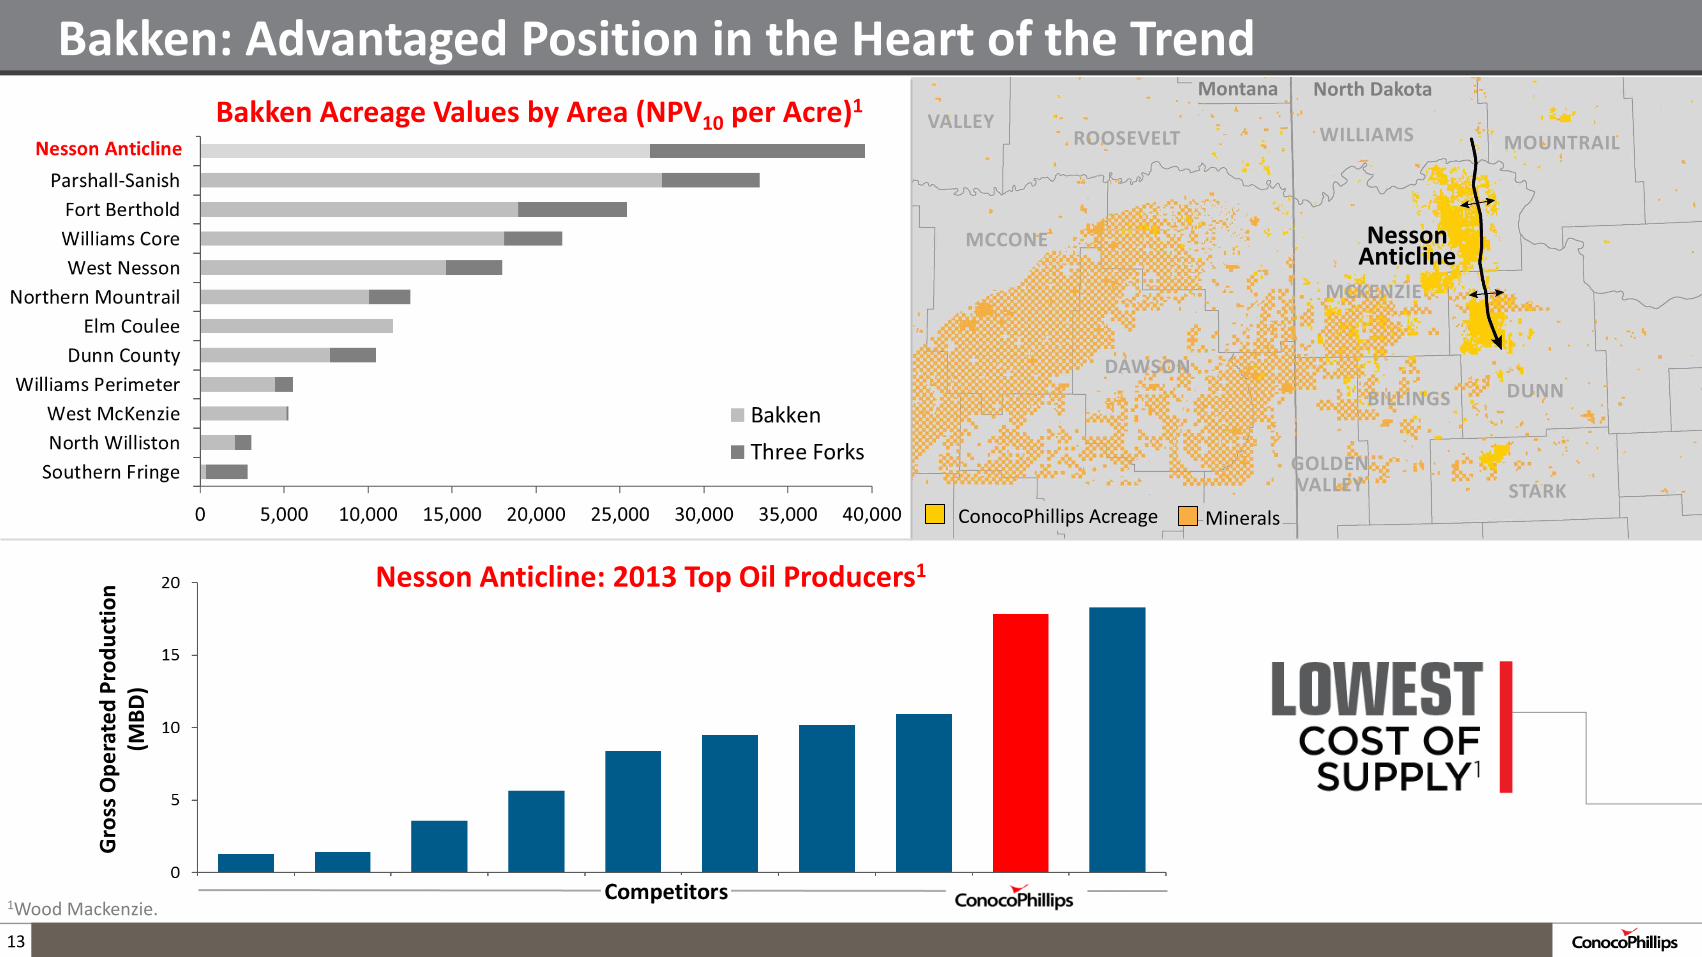
ConocoPhillips Acreage Minerals
Montana North Dakota
Nesson Anticline
VALLEY
DAWSON
WILLIAMS MOUNTRAIL
MCKENZIE
BILLINGS DUNN
STARK GOLDEN VALLEY
ROOSEVELT
MCCONE
Bakken: Advantaged Position in the Heart of the Trend Bakken Acreage Values by Area (NPV10 per Acre)1
Gro
ss O
pera
ted
Prod
uctio
n (M
BD)
Nesson Anticline: 2013 Top Oil Producers1
1Wood Mackenzie.
13

Central Platform
Basin
New Mexico
Delaware Basin
ConocoPhillips Acreage
Texas
Midland Basin
Avalon
Bone Spring
Wolfcamp Layers
Permian Unconventional: Early Appraisal Results Encouraging
• Positions in Delaware and Midland basins
• Thick column of both shale and tight rock intervals
• Four rigs running in Delaware Basin
• ~30 horizontal wells planned for 2014
• Average early rates >1,000 BOED
Permian Appraisal Strategy
Central Platform
Basin Delaware Basin Midland Basin
East
Permian Basin Stratigraphy1
1West Texas Geological Society.
West
14
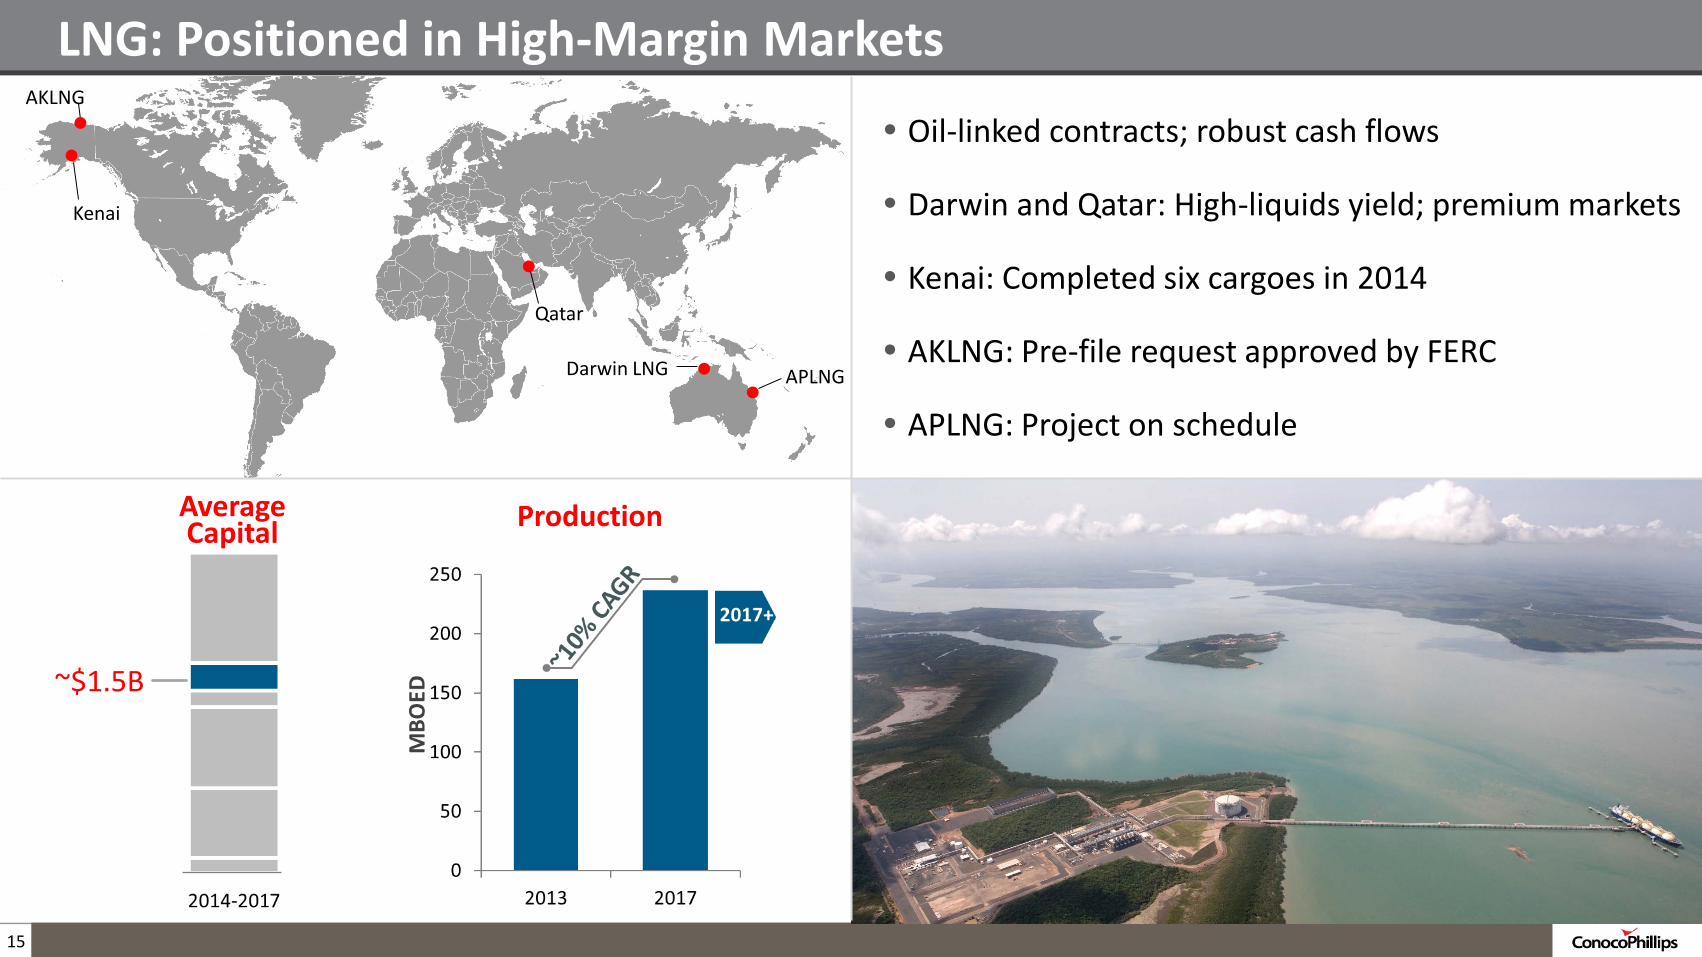
APLNG
Qatar
AKLNG
Darwin LNG
Kenai
LNG: Positioned in High-Margin Markets
• Oil-linked contracts; robust cash flows
• Darwin and Qatar: High-liquids yield; premium markets
• Kenai: Completed six cargoes in 2014
• AKLNG: Pre-file request approved by FERC
• APLNG: Project on schedule
15
Production Average Capital
~$1.5B
Planned First Production Dates
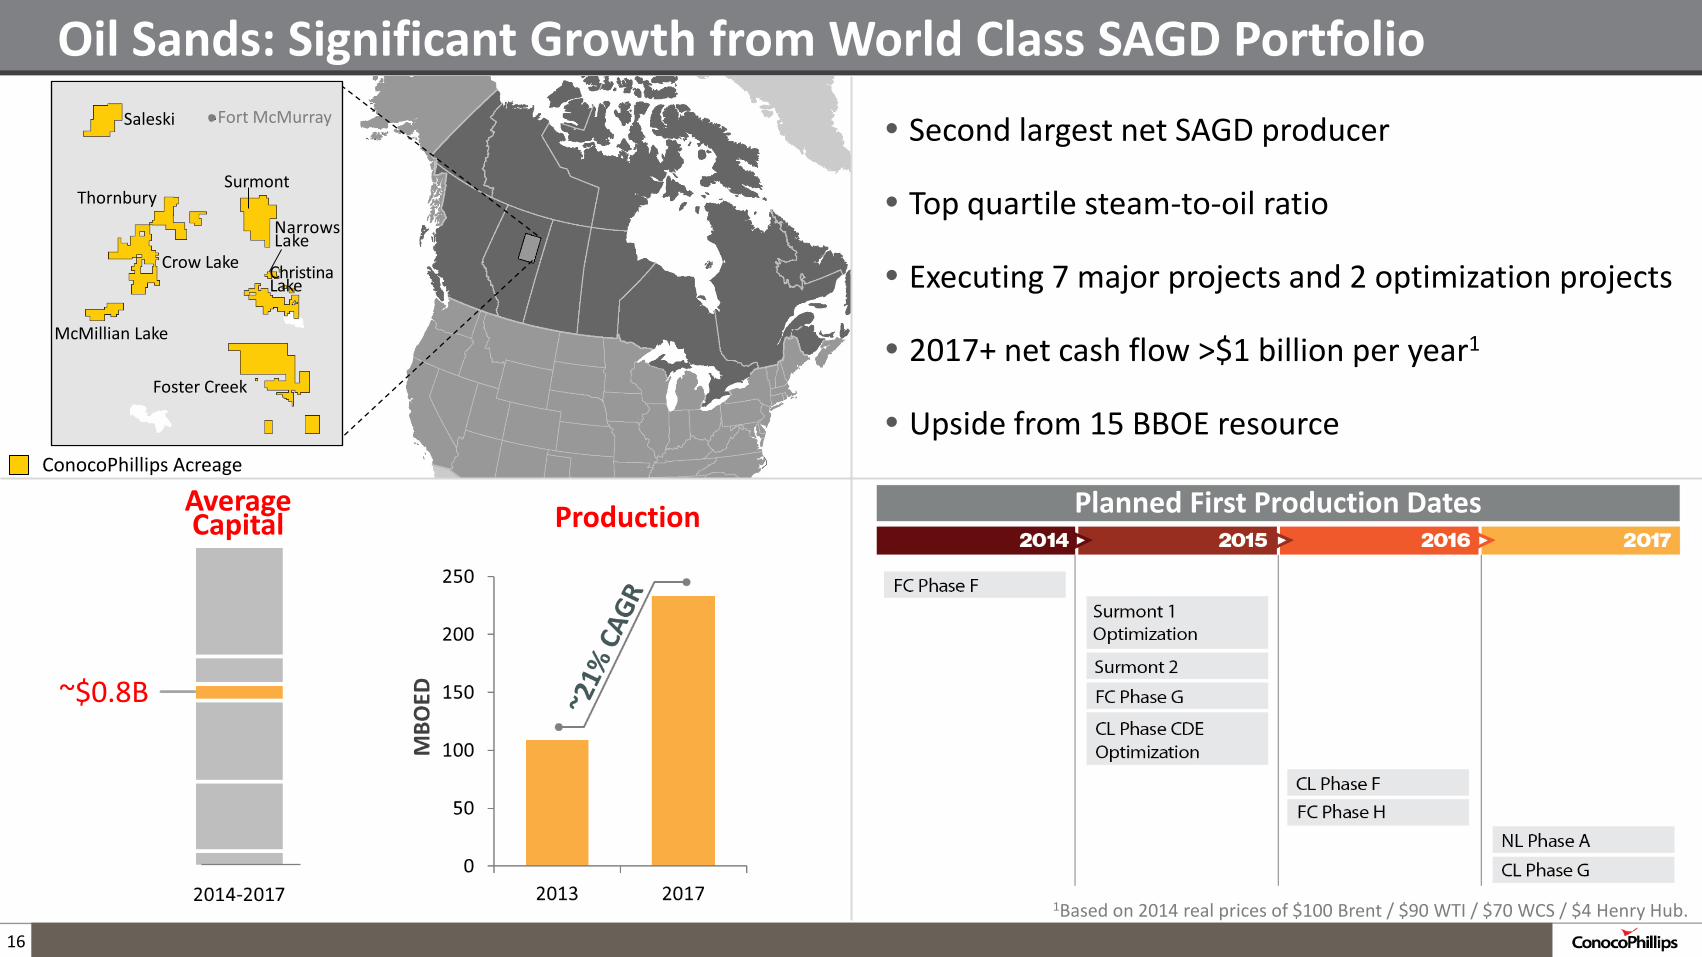
~$0.8B
Saleski
Surmont
Fort McMurray
Thornbury
Crow Lake
Narrows Lake
McMillian Lake
Foster Creek
Christina Lake
Oil Sands: Significant Growth from World Class SAGD Portfolio
• Second largest net SAGD producer
• Top quartile steam-to-oil ratio
• Executing 7 major projects and 2 optimization projects
• 2017+ net cash flow >$1 billion per year1
• Upside from 15 BBOE resource
Production Average Capital
16
ConocoPhillips Acreage
1Based on 2014 real prices of $100 Brent / $90 WTI / $70 WCS / $4 Henry Hub.

~$4B
Product Mix1
International Oil & Gas: Major Projects Driving Growth • Strong legacy positions
• 130 MBOED major projects growth expected by 2017
• 2013: Ekofisk South and Jasmine started on schedule
• 2014: Major project startups in Europe and Malaysia
• 2015-2017: 7 projects expected to come online
• $20-25/BOE full-cycle F&D cost
Libya
China
Malaysia
Indonesia
U.K. Norway
12014-2017 average.
17 Libya volumes excluded; ~50 MBOED upon resumption.
Production Average Capital
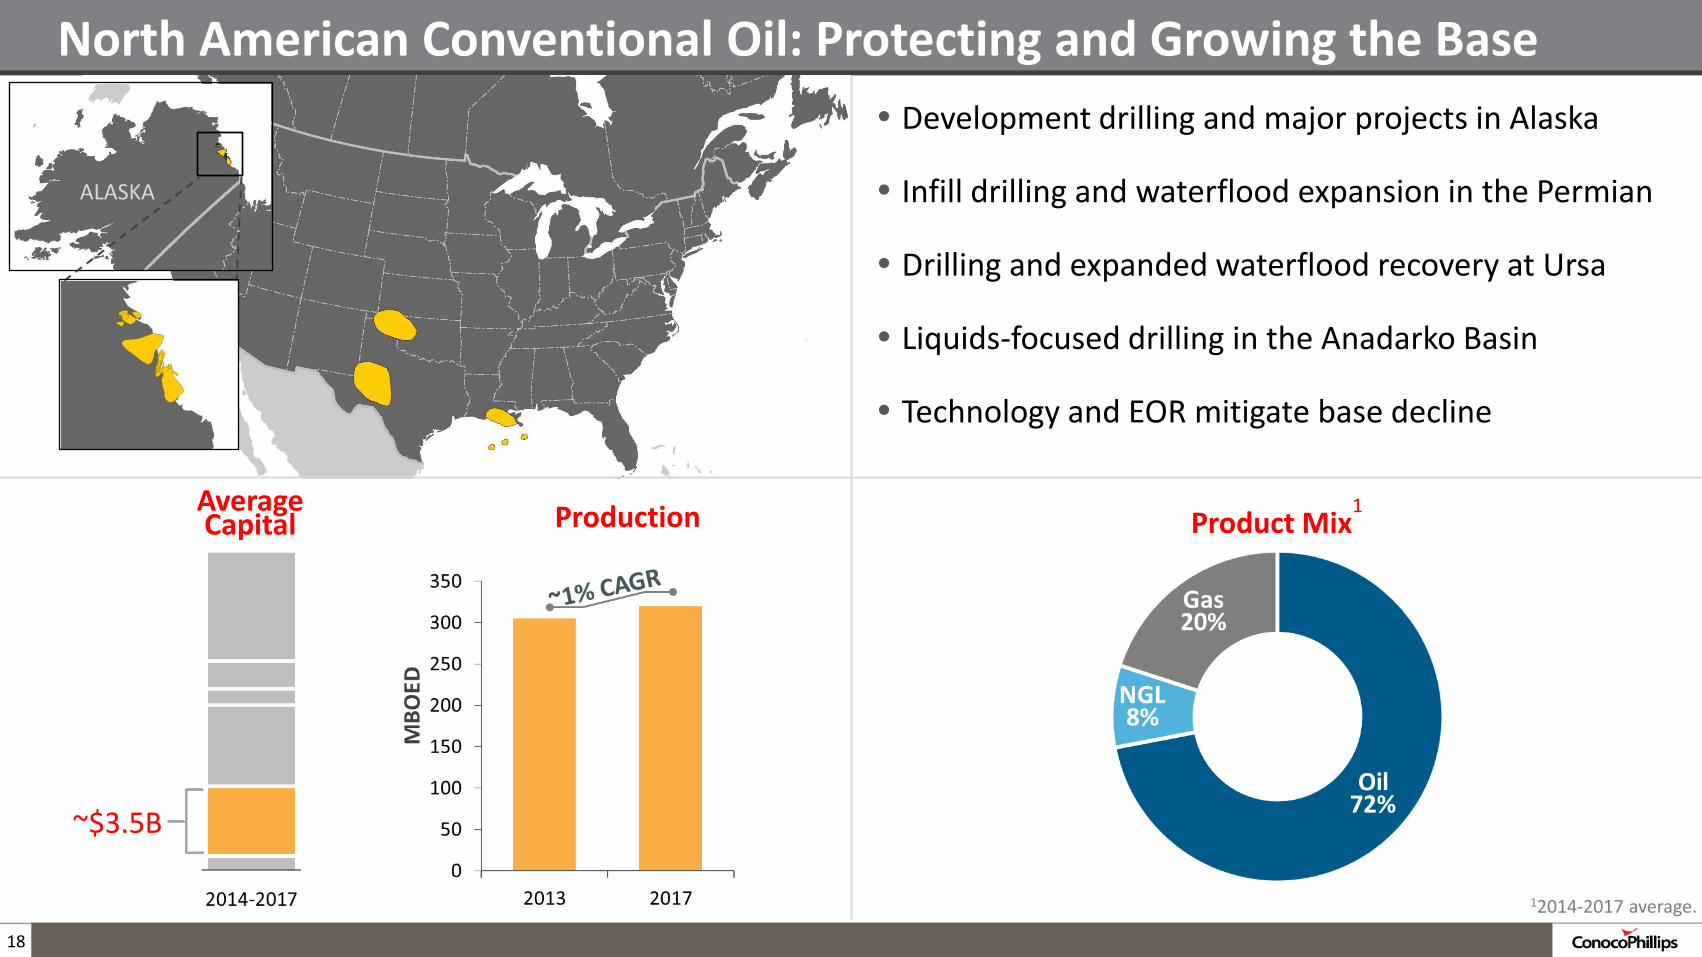
North American Conventional Oil: Protecting and Growing the Base • Development drilling and major projects in Alaska
• Infill drilling and waterflood expansion in the Permian
• Drilling and expanded waterflood recovery at Ursa
• Liquids-focused drilling in the Anadarko Basin
• Technology and EOR mitigate base decline
~$3.5B
18
Product Mix1
ALASKA
12014-2017 average.
Production Average Capital
~$0.8B
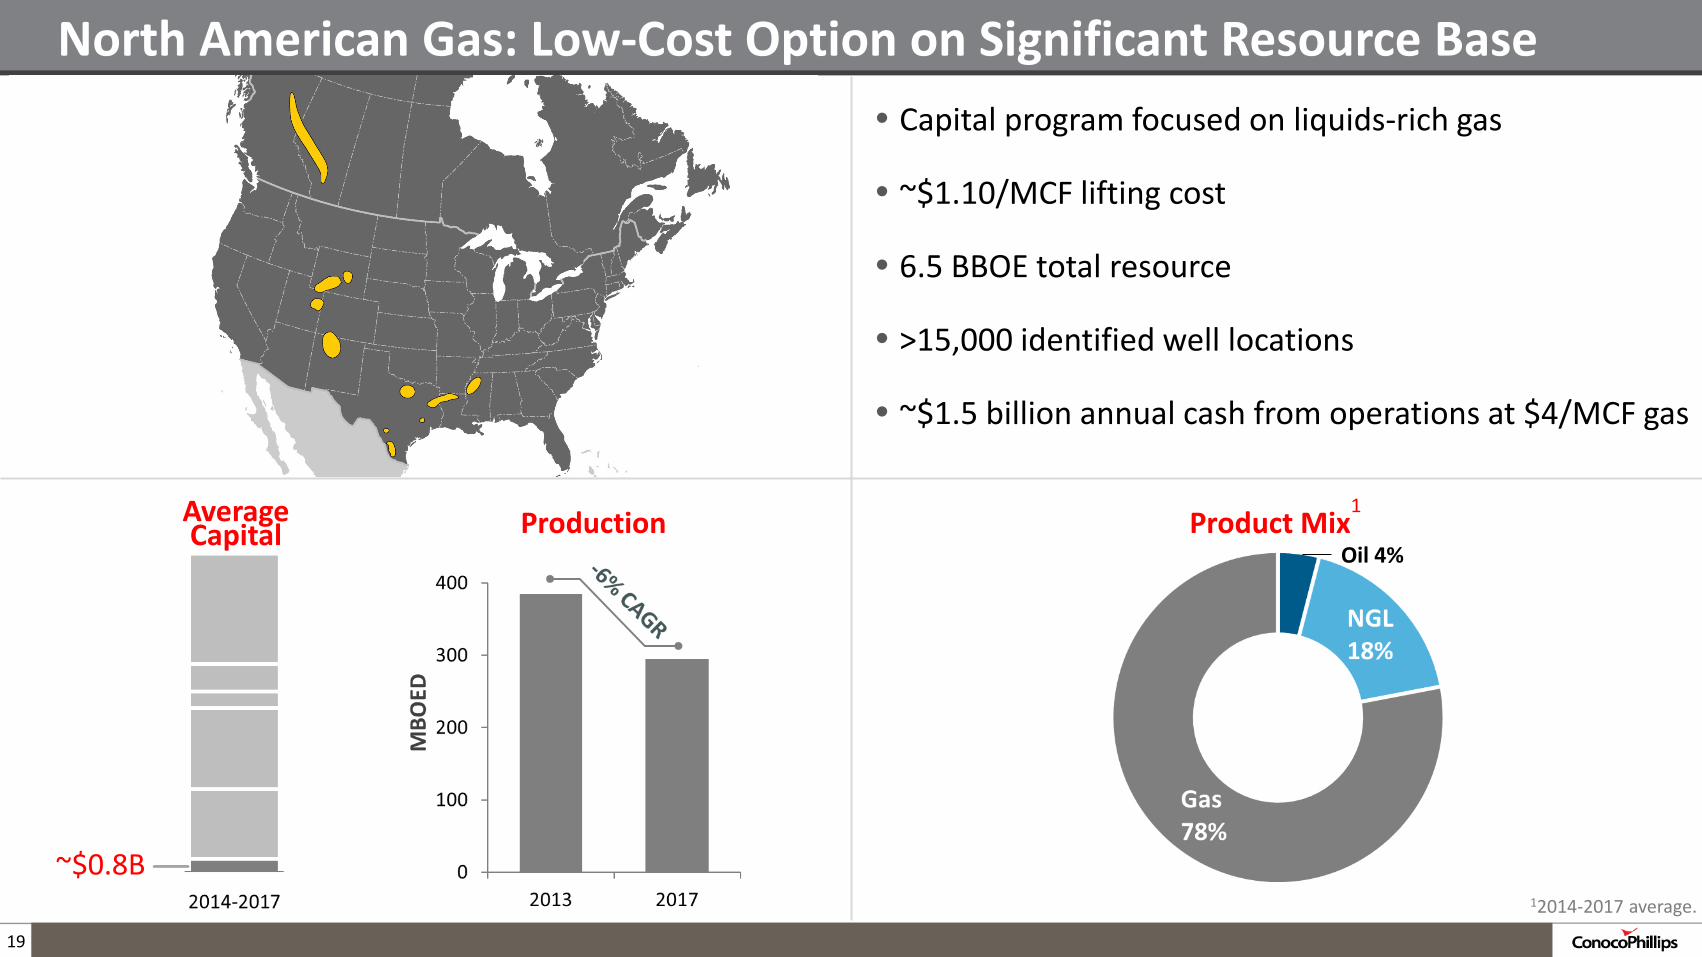
North American Gas: Low-Cost Option on Significant Resource Base • Capital program focused on liquids-rich gas
• ~$1.10/MCF lifting cost
• 6.5 BBOE total resource
• >15,000 identified well locations
• ~$1.5 billion annual cash from operations at $4/MCF gas
19
Oil 4% Production Average
Capital Product Mix1
12014-2017 average.

2014: Testing Global Portfolio
Angola Kwanza
Senegal
Australia
Gulf of Mexico
Greenland
Bangladesh
Malaysia
Azerbaijan
China Sichuan
Indonesia
Poland Baltic Basin
Colombia Middle
Magdalena
Norway Barents
Niobrara
Canol
UK & Norway
China Bohai
Delaware & Midland
Browse Bonaparte
Montney, Duvernay
Myanmar1
Chukchi
NPR-A
20
Unconventional Deepwater
Other Conventional
2014 Drilling Activity
1Based on high bid award on Block AD-10.
Nova Scotia
ConocoPhillips Acreage
Gila Tiber
TEXAS LOUISIANA
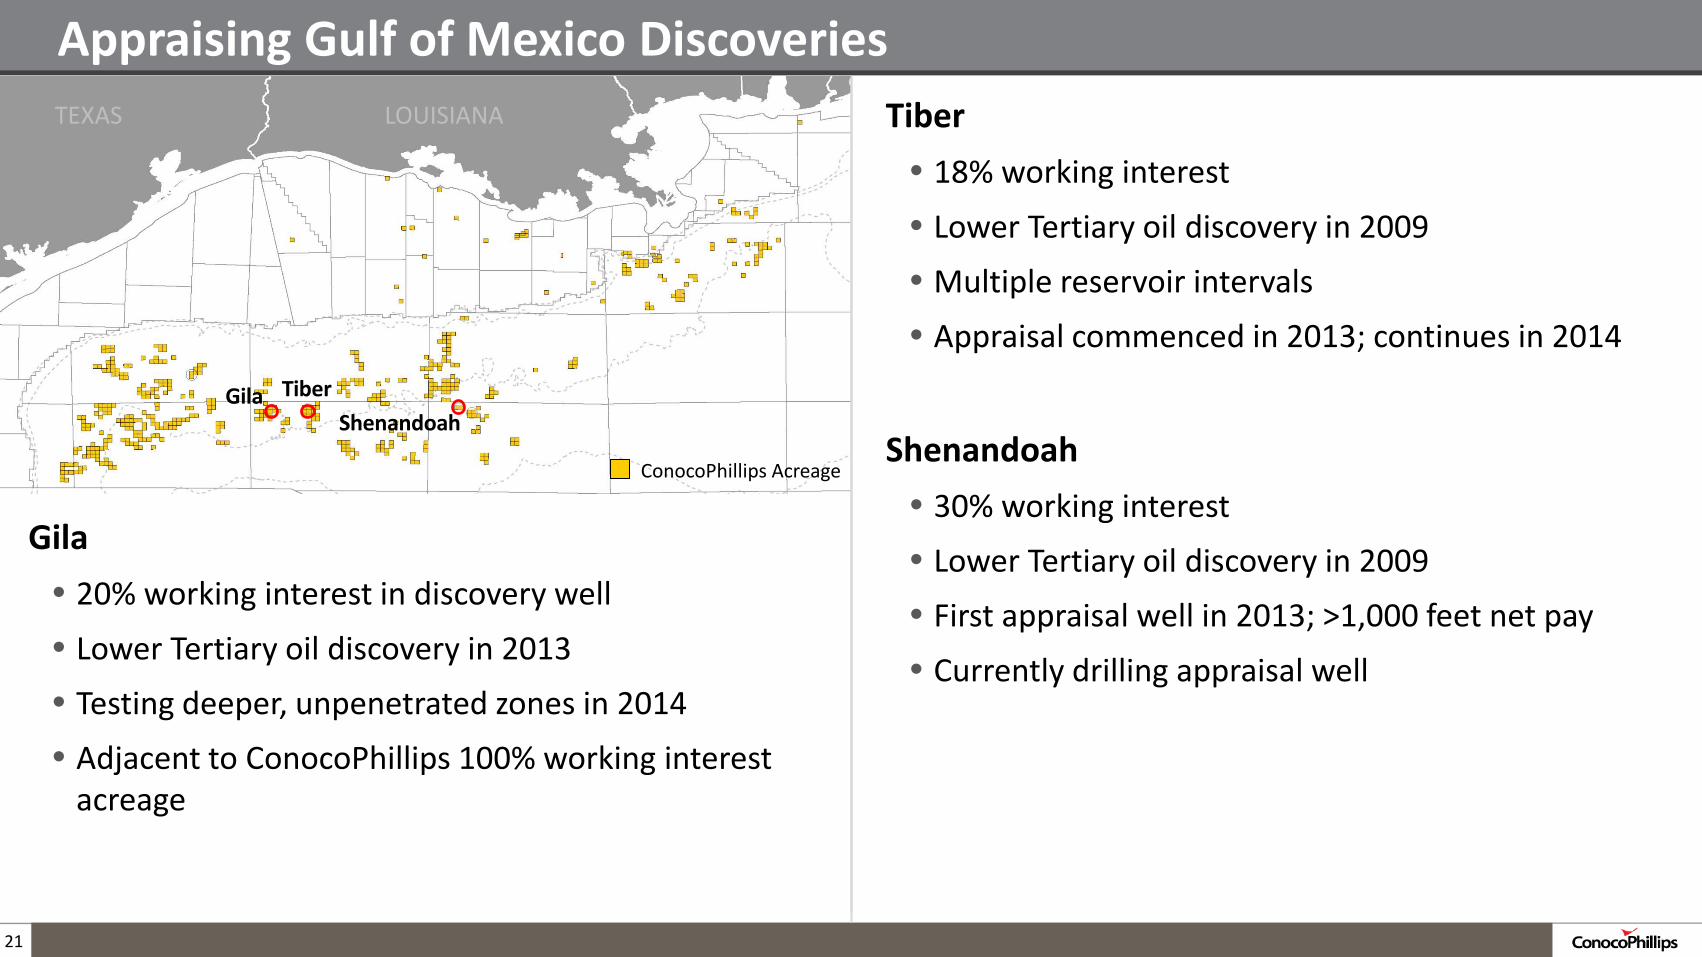
Appraising Gulf of Mexico Discoveries
Gila • 20% working interest in discovery well
• Lower Tertiary oil discovery in 2013
• Testing deeper, unpenetrated zones in 2014
• Adjacent to ConocoPhillips 100% working interest acreage
21
Shenandoah
Tiber • 18% working interest
• Lower Tertiary oil discovery in 2009
• Multiple reservoir intervals
• Appraisal commenced in 2013; continues in 2014
Shenandoah • 30% working interest
• Lower Tertiary oil discovery in 2009
• First appraisal well in 2013; >1,000 feet net pay
• Currently drilling appraisal well
West East
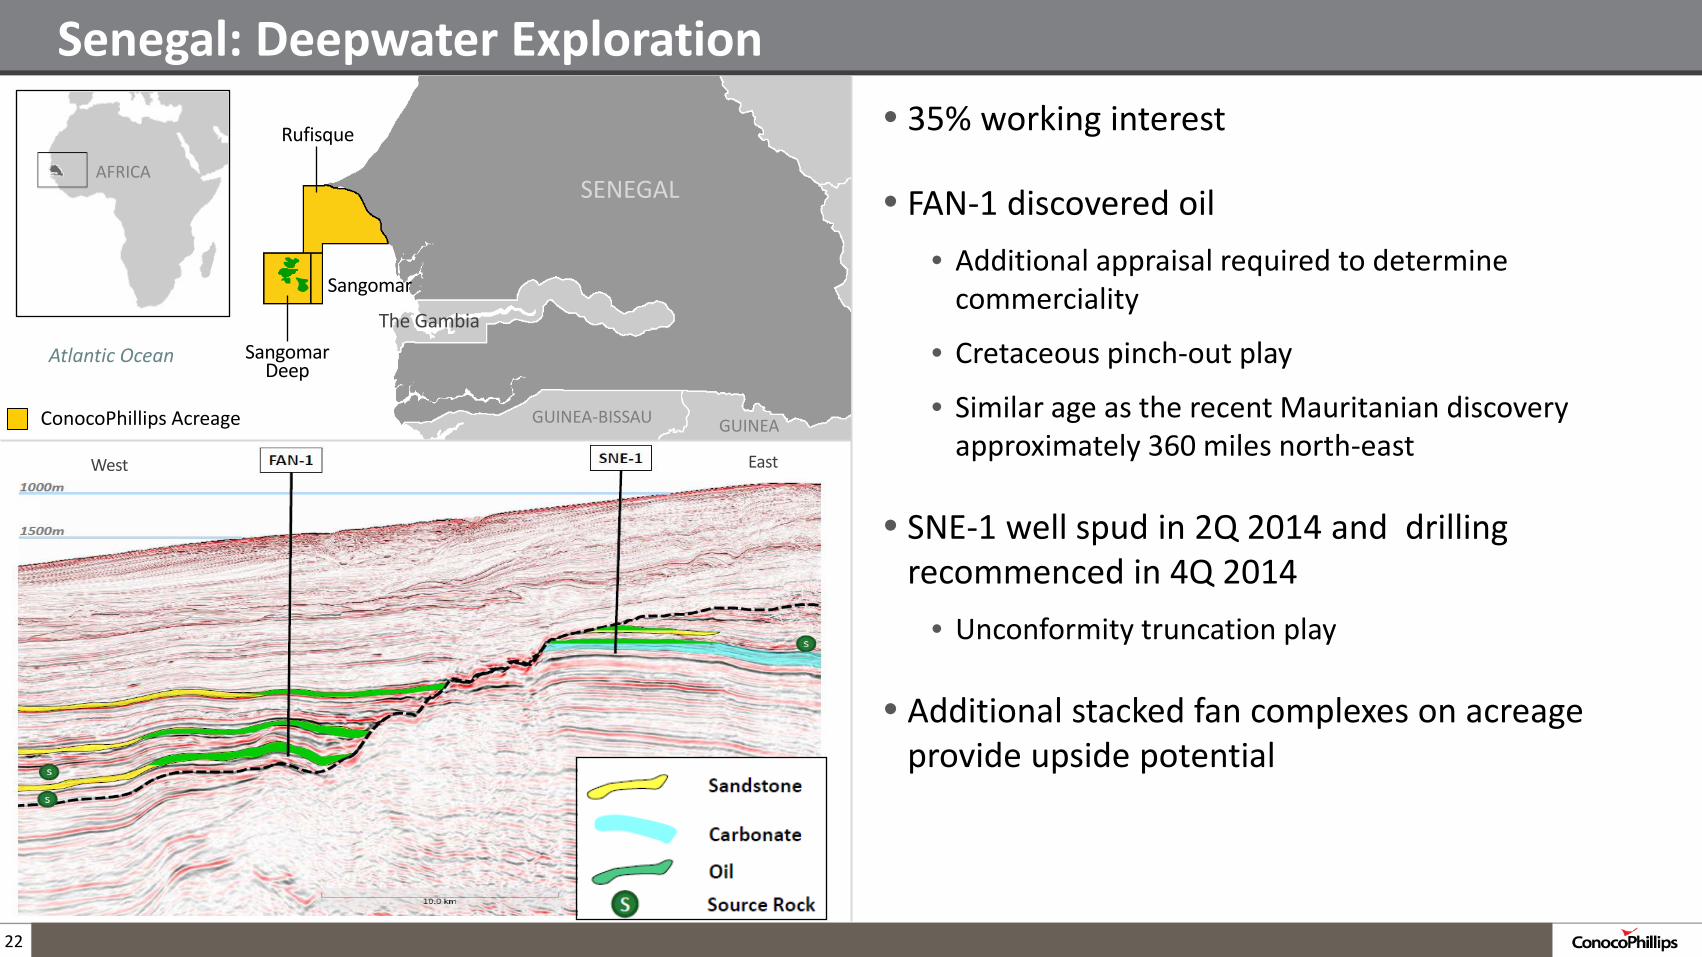
Senegal: Deepwater Exploration • 35% working interest
• FAN-1 discovered oil • Additional appraisal required to determine
commerciality
• Cretaceous pinch-out play
• Similar age as the recent Mauritanian discovery approximately 360 miles north-east
• SNE-1 well spud in 2Q 2014 and drilling recommenced in 4Q 2014
• Unconformity truncation play
• Additional stacked fan complexes on acreage provide upside potential
22
The Gambia
Atlantic Ocean
SENEGAL
GUINEA-BISSAU GUINEA
Sangomar Deep
Sangomar
Rufisque
AFRICA
ConocoPhillips Acreage

Key Messages
23
• Value proposition unchanged
• Performance on track to deliver 3 to 5 percent volume and margin growth
• Well positioned for current environment; significant capital flexibility
• Strong momentum going into 2015
• Dividend is appropriate
• Cash flow neutrality is a priority
• Significant balance sheet strength
Volume represents production from continuing operations, excluding Libya. Margin represents price normalized cash margins.

24
Q&A