NOTICEThis document is disseminated under the ...pstrust.org/docs/usdot_doc3.pdfReport No. #DTRS...
32
Report No. #DTRS 56-94-C-0006 PIPELINE INDUSTRY PIPELINE ACCIDENT CONSEQUENCES FOR NATURAL GAS AND HAZARDOUS LIQUIDS PIPELINES* PIPELINE ACCIDENT CONSEQUENCES FOR NATURAL GAS AND HAZARDOUS Joshua Greenfeld, Ph.D., L.S. Eugene Golub, Ph.D., P.E. Robert Dresnack, Ph.D., P.E. F.H. Bud Griffis, Ph.D., P.E. Louis J. Pignataro, Ph.D., RE.ANALYSIS USING GISLIQUIDS PIPELINES NEW JERSEY INSTITUtE OF TECHNOLOGY Institute for Transportation 323 Martin Luther King Boulevard Newark, NJ 07102 AUGUST 1996 FINAL REPORT This document is available through the National Technical Information Service, Springfield, Virginia 22161 Prepared for U.S. DEPARTMENT OF TRANSPORTATION Research and Special Programs Administration Office of Pipeline Safety Washington, DC 205901~~4 ~
Transcript of NOTICEThis document is disseminated under the ...pstrust.org/docs/usdot_doc3.pdfReport No. #DTRS...

Report No. #DTRS 56-94-C-0006 PIPELINE INDUSTRY PIPELINE ACCIDENT CONSEQUENCES FOR NATURAL GAS AND HAZARDOUS LIQUIDS PIPELINES* PIPELINE ACCIDENT CONSEQUENCES FOR NATURAL GAS AND HAZARDOUS Joshua Greenfeld, Ph.D., L.S. Eugene Golub, Ph.D., P.E. Robert Dresnack, Ph.D., P.E. F.H. Bud Griffis, Ph.D., P.E. Louis J. Pignataro, Ph.D., RE.ANALYSIS USING GISLIQUIDS PIPELINES NEW JERSEY INSTITUtE OF TECHNOLOGY Institute for Transportation 323 Martin Luther King Boulevard Newark, NJ 07102 AUGUST 1996 FINAL REPORT This document is available through the National Technical Information Service, Springfield, Virginia 22161 Prepared for U.S. DEPARTMENT OF TRANSPORTATION Research and Special Programs Administration Office of Pipeline Safety Washington, DC 205901~~4 ~

NOTICEThis document is disseminated under the sponsorshipof the Department of Transportation in the interest ofinformation exchange. The United States Governmentassumes no liability for the contents or use thereof.

Technical Report Documentation Page1. Report No. 2. Government Accession No.DTRS56-94-C-0006-3.3. RecipIent's Catalog No.4. Title and SubtitlePIPELINE INDUSTRYo Pipeline Accident Consequences for Natural Gas and Hazardous Liquids Pipelineso Pipeline Accident Consequences Analysis Using GIS for Natural Gas and Hazardous Liquids Pipelines5. Report DateAugust 19966. PerformIng Organization CodeDOT/RSPNOPS7. AuthorsJoshua Greenfeld; Eugene Golub; Robert Dresnack; F.H. Bud Griffis;Louis J. Pignataro8. Performing Organization Report No.9. Performing Organization Name and AddressNEW JERSEY INSTITUTE OF TECHNOLOGYInstitute for Transportation323 Martin Luther King Blvd.Newark, NJ 0710210. Work Unit No. TRAIS11. Contract or Grant No.DTRS 5694C000612. sponsoring Agency Name and AddressU.S. DEPARTMENT OF TRANSPORTATIONResearch and Special Programs Administration/Office of Pipeline Safety400 7th St. S.W., Rm. 2335Washington, D.C. 2059013. Type of Report and Period CoveredFinal Report14. SponsorIng Agency Code~15. Supplementary Notes 16. Abstract The development of a consequences database requires a description of the damages that occur in the incidents-accidents that result in fires and/or explosions. In order to determine the consequences of an incident-accident, the records of the National Transportation Safety Board NTSB were examined for relevant information such as description of the damage since that type of data does not exist in the OPS database. The consequences database was then used in conjunction with a sample Geographic Information System GIS developed by the project team. The damage area found in the consequences database was analyzed using a GIS to determine the damages that would result if an incident were to occur at various locations along the simulated pipeline in the GIS.17. Key WordsU.S. and Foreign Pipeline Regulations, Rehabilitation,Retrofitting, Repair, Gas, Hazardous Liquids, Pipeline,Safety, Maintenance, Transmission Lines, Operator,Corrosion, Welding, Urban Areas, Siting, Land Use,Environmental Impact.18. Distribution Statement . ~19. Security Classification of this report 20. Security Classification of this page 21. No. of Pages 22. PriceUnclassified Unclassified 31Form DOT F 1700.7 8-72 R~nrndu~tinn nf fnrm nnd enmnlAtPd fl~flA I~ ~uthnrI2~d

TABLE OF CONTENTSPART I ACCIDENT CONSEQUENCES FOR NATURAL GAS AND HAZARDOUS LIQUIDS PIPELINES1.0 INTRODUCTION............................................................................12.0 ANALYSIS OF PIPELINE INCIDENTS-ACCIDENTS RESULTING IN FIRES.............................5 2.1 NATURAL GAS TRANSMISSION PIPELINES..................................................5 2.2 NATURAL GAS AND PROPANE.............................................................6 2.3 NATURAL GAS, PROPANE AND VOLATILE LIQUIDS...........................................7 2.4 NATURAL GAS, PROPANE, VOLATILE LIQUIDS AND CRUDE OIL................................8 2.5 HAzARDOUS LIQUIDS WITH SIGNIFICANT FLOWS PRIOR TO IGNITION OF PRODUCT RELEASED......83.0 ANALYSIS OF PIPELINE INCIDENTS-ACCIDENTS RESULTING IN ENVIRONMENTAL DAMAGES...................................................................9PART 2 A GIS BASED PIPELINE RISK MANAGEMENT MODEL4.0 INTRODUCTION...........................................................................115.0 THE GIS SOLUTION.......................................................................11 5.1 PIPELINE AND ITS ENVIRONMENT DATA DEFINITION.......................................12 5.2 PIPELINE ATTRIBUTE DATA REPRESENTATION.............................................13 5.3 PIPELINE SURROUNDINGS DATABASE.....................................................14 5.4 DATA ANALYSIS......................................................................146.0 CASE STUDY.............................................................................157.0 RISK ANALYSIS WITH GIS.................................................................158.0 ANALYSIS OF RESULTS....................................................................169.0 CONCLUSIONS............................................................................16APPENDIX A FIGURE 1 STUDY AREA AND ITS SURROUNDINGS FIGURE 2 PIPELINE ROUTE SYSTEM FIGURE 3 WETLANDS FIGURE 4 LAKE COVERAGE FIGURE 5 STREAMS COVERAGE FIGURE 6 IMPACT OF POINT INCIDENTS FIGURE 7 250 FT. BUFFER FIGURE 8 500 FT. BUFFER FIGURE 9 750 FT. BUFFER FIGURE 10 1000 FT. BUFFER FIGURE 11 POPULATION WITHIN THE LINE BUFFER AREA FIGURE 12 POPULATION WITHIN THE POINT BUFFER AREA

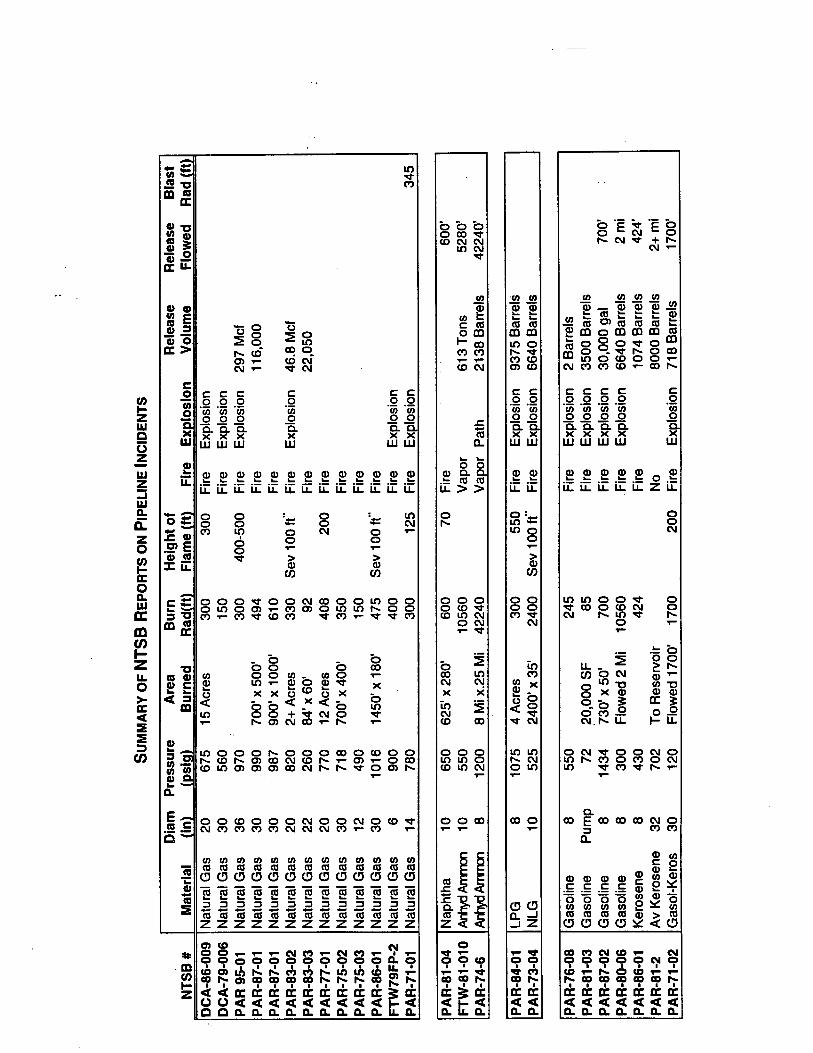
PART I ACCIDENT CONSEQUENCES FOR NATURAL GAS AND HAZARDOUS LIQUIDS PIPELINES 1.0 INTRODUCTION This report discusses a methodology to define both safety and environmental consequences, including damage, that result from gas transmission and hazardous liquid pipeline failures. To determine the consequences of an incident-accident, the records of the National Transportation Safety Board NTSB were examined for relevant information since this type of data does not exist in the OPS database. The development of a consequences database requires a description of the damages that occur in the incidents-accidents that caused fires and/or explosions. The consequences database will then be used in conjunction with a sample Geographic Information System GIS developed by the project team. The damage area found in the consequences database will be moved through the GIS database to determine the damages that would result if an incident were to occur at various locations along the simulated pipeline in the GIS. The type of damages that are of interest in forming a consequences database includes: * The area damaged by fire during the release of transported combustible material. * The area damaged by an explosion that results from the release of material. * Receptors damaged by the release of hazardous material. A summary table of major incidents-accidents studied by the NTSB is presented below. The table includes those factors deemed important in modeling the impacts of a release of pipeline transported material and the resulting fires or explosions. These factors include: * Pipeline diameter * Operating pressure * Material transported * Size of the area burned during a resulting fire * Size of the area damaged by a resulting explosion * Volume of material released during the incident-accident * Material flow prior to fire and/or explosion

Not all of the information sought for this study was available from the NTSB reports. Theavailable information is listed in the table that follows.All of the incidents listed resulted in a fire and/or explosion. In some cases the material flowedprior to the resulting fire or explosion. In these flow situations the resulting area that burnedwas greater than that which would have occurred had the released material not flowed. Thedata represents many geometries, wind velocities, and other factors at the incident-accidentsite. Within these variations, an upper bound on the area effected by the incident-accident willbe sought. 2
LU C,N- C~SJ ~ + N-~-000 ~0 LUr-cd ~01- DC'JC'J,- *~*C'JCCC000.~ 0 00000.0.0.XXXwww U, a, I--Ca, 0C~ 0000 a, cÿ ca~ N- 00 CD 0 0C0Cl00.XwCC0010000.0XXwwwCa01~N-C0U,0XwC,C,-C 0 0 0 `U a, L. U-,- ~-0= w00I_ -~50,a, -U.-&_ .-0.C,I-zUi0C.zUIz-JUI0.0.z0UI-00.uJUI-zU.0>-4Cl~LL. Li. U.. LL. Li. U.. U.0 0 : 0 :0 0 - 0 ~ C~J~ 1 0 ~`J 0 6 0 0 0 1~ > > C 0 U CI000~00C~J000L0000to0-C,00IfltoN-00C,i-C~CDC' ~-~~C,CCCC0000100000000.0.0.0.XXXXwwww ~ ! .~ .~ 0 U.U.LL.ZLL. 0 0 c..J1Cto00~t 0*~-CD0C0C'J 0C'J N-LO~ N 0 1~CD C'J C', 10C~l U, 0'.- CC 0~ C'C' 1~ 1~ DC', -C 0~ I.. ~- 00 0.0 a CLI.>>0N0000cD,~.CD 10 C', OC',0 ItC', C~X XC 00001000CO LU C', 1~0001~000 I I I I I I<`-40.U-0. .0 00U 00a LU'-O XX11 001~ F-C0~00~coC~J0 - 0 0 0U0 1~ XOX -~ 0 0 ItC'J0 ~`-N- `-0 Cl00tooa,coCc00Cl Cl000.0XXwwU.LL. 0 1-~ > a, U0000 C', U, C,I.. -OLULlN-CaOtt00 1-~C!".,,0--i00 I S~C,0t-. I S4<0.0-Li...~o X°.boc,,C~. N-C..,V0 00.9 o2U I-IL.L0000N-000000000 0 0 0 0 0 N-N-~0 0 N-00 0 0 0 0 C'J 00 C~ 0 0 51-C' 1-000 00 000 U 1 00 1000 CCC CCC 0 CC CC 0000000000000000zzzzzzzzzzzzz0 C~ 0 0 C', 0toN- C' 0 C' 0 C',It ~C'~N-i 1-0.0.000C'J0 C' C'UI-z.~ .~ .~ .~ C C00000200CO`no-~U>CC<C-,, c~ ,- C'1 C' C'l C'000000000000-0 I I 5 5 S I S I I I II I i- F- I I I I I I I I I I I~OC.<<<<<<<<<~-<000-0-0.0-0.0.0-0-0-LL.Q.0C'C~1cDi- C40 0000 C~& 0I I I I I IC0s-N. 01-1-I I I I I I I<<<<<4<0-0-0-0-0-0-0-

0 CO U b b ~ 0 0 0 0 CO - C' 1~ C' U' bcn Wa, J~~-w ~ ~_ .u - * I_ W __ ~*COwC~ ~ CO~!go, c~,COo~t C'r--~.CO i-00CO L0C1~C' OOwCO ~i-~-C%J C'JL C o cc~cc ~cCl 00000 00~ flCiUUU CflCI 00000 00ILl C ~ ~o *xxx* xx LU WWWWW WWz- a,LU .~wwaa,a~a Wa az u~ .~ .~ .~ .~ .~ .~ ~- I- i- 0 LLLLLLLL.UU. LLU..ZLLZuJ 0 00 00 ~ C~JIO 0z CW 0 a'E >I- a Cl00c' 00 0C~J00 OCO Oi-~ ~C~0,-0C~ CO COC/ -I- ~~0 - a 0 0 .~z *~ 0 0IL SW ~,-~ WCIW x~- ~~.# I_ ~ a _~ co~ b<a x c~.j o,~.2 b C' U U LL i- 0 C'J 0 U 0 0 U 00 U ~0C'~J0 C'C'r~-0U ~ ~ U COOi- ~ `- U C'.J CO ~ WC I_ `- - a 0. ~ CO CO CJ CO CO CO E c~J CD CO ~ ~C'~C%J w - a, Wa C CC - ~ UC~ - - a~aD~*a ~3W~ c~ Coc22c ~ 5 9~-0.c.c0 ~ ~ U' b.. h~ b- 0 - `- ~O~JO~L~iD.. OOZOO 0 C~l U ~ OJ N 0 000000 0000.0 ~`o S I I U U U U I N N CD 0 C' CD IL ~ >> ~ flu O<~<4< <<1-4 ` 00.0.0.0.0. 0.0.0.U0. .4

2.0 ANALYSIS OF PIPELINE INCIDENTS-ACCIDENTS RESULTING IN FIRES2.1 NATURAL GAS TRANSMISSION PIPELINESThe incident pressure and burn radius for natural gas pipeline failures resulting in fires areplotted below. A review of this plot shows a trend relating the incident operating pressure andthe radius of the area burned The general trend is for the burn radius to increase withincreased operating pressure.It is understood that there are many other factors that contribute to the area burned. Theseinclude, but are not limited to, the geometry of the surrounding terrain, the wind magnitude anddirection, the depth of the pipeline that ruptured, the geometry of the rupture, the time overwhich material is released, the quantity of material released, the type of facilities nearby. Withinthese limitations, it is still possible to discern trends or upper bounds on the extent of theresulting damage area. 700 600~. 500~400~.300~200 100 0BURN RADIUS ftNATURAL GASPRESSURE PSIG~iURNRftI1200A line can be drawn that represents an upper bound on the burn radius for the natural gaspipeline failures considered that resulted in fires as a function of the incident operatingpressure. This upper bound line passes through the two points:* 260 psig* 987 psig 92 ft radius 610 ft radiusThe upper bound to the data is reasonably modeled by the line shown.On the other hand, a more accurate upper bound may be drawn as the compound line shownon the plot. This line passes through four points representing incidents plus a minimum radius0 200 400 600 600 10005

of 92 feet at lower pressures. These upper bounds represent conservative estimates of thearea of influence of an incident resulting in a natural gas fire.It is also of interest that all of the data, with the exception of two data points, fall on the two linesshown in the plot. The pertinent data is presented in the table below divided between data thatfalls on the lower line, the upper line, and outside the two lines.CHART LINEDIAMETERINCIDENT PRESSUREBURN RADIUSEXPLOSIONLower20675300EXPLOSIONLower30560150EXPLOSIONLower30990494NOLower20820. 330EXPLOSIONLower301016475NOLower14780300EXPLOSIONLower6900400EXPLOSIONOutside36970300Outside2226092NOUpper30987610NOUpper20770408NOUpper30718350NOUpper12490150NOAn examination of the table shows that the pipe diameter does not correlate with the upper andlower line. There is, however, a close correlation with the occurrence of an explosion. Itappears that the occurrence of an explosion may do damage associated with an explosion, butfire damage is a function of the radiant energy of the fire. When an explosion occurs, there isless natural. gas available to burn and produce radiant energy.In the following sections, the data for natural gas transmission will be supplemented by data forother fuels transmitted by pipeline. This will be done in a stepwise fashion, i.e., adding oneproduct at a time. In all cases an upper bound will be sought.2.2 NATURAL GAS AND PROPANEThe data for natural gas has been supplemented by the data for propane to see if an upperbound model still exists for the combined data. Both are gaseous fuels. 6
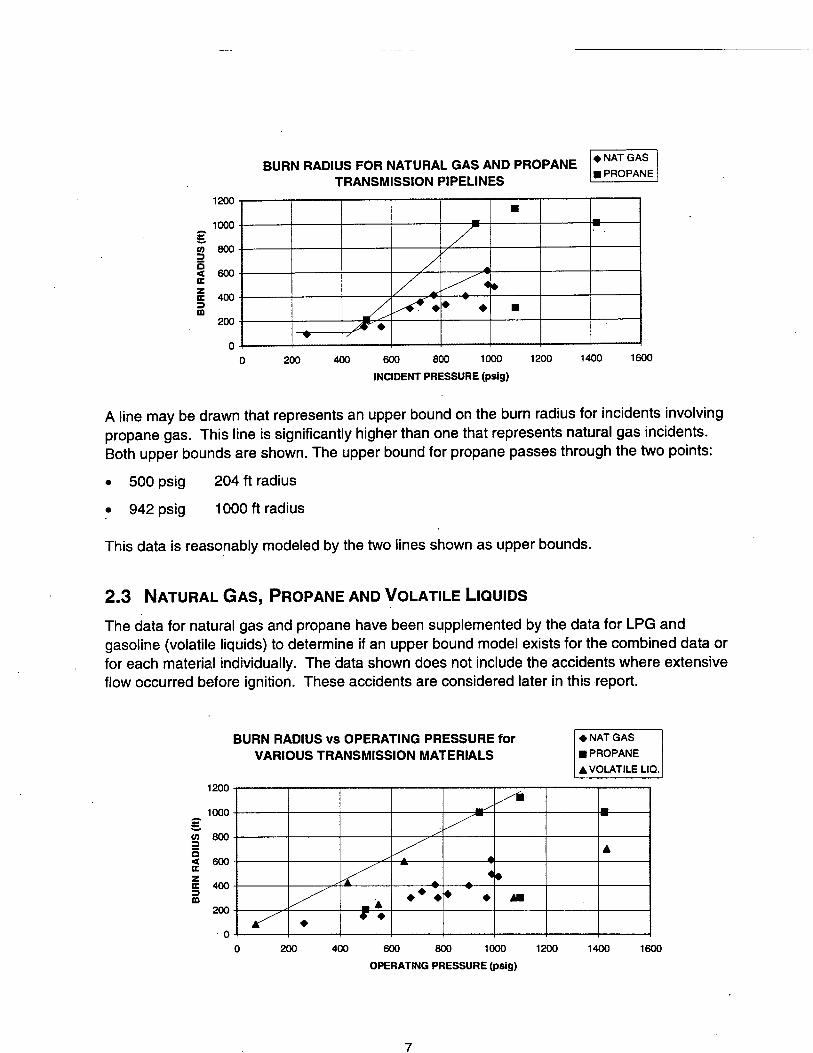
A line may be drawn that represents an upper bound on the burn radius for incidents involvingpropane gas. This line is significantly higher than one that represents natural gas incidents.Both upper bounds are shown. The upper bound for propane passes through the two points:* 500 psig 204 ft radius* 942 psig 1000 ft radiusThis data is reasonably modeled by the two lines shown as upper bounds.2.3 NATURAL GAS, PROPANE AND VOLATILE LIQUIDSThe data for natural gas and propane have been supplemented by the data for LPG andgasoline volatile liquids to determine if an upper bound model exists for the combined data orfor each material individually. The data shown does not include the accidents where extensiveflow occurred before ignition. These accidents are considered later in this report.12001000800600400200 0 600 800 1000OPERATING PRESSURE psig*NAT GAS*PROPANEA VOLATILE LIQ.BURN RADIUS FOR NATURAL GAS AND PROPANE NAT GAS TRANSMISSION PIPELINES *PROPANE=C'0212001000800600400200 00 200 400 600 800 1000 INCIDENT PRESSURE psig1200 1400 1600BURN RADIUS vs OPERATING PRESSURE for VARIOUS TRANSMISSION MATERIALS=Cl02-~IIA -~~A~A*.:. * . a..0 200 4001200 1400 16007

An upper bound may be drawn that contains all of the accidents. Propane and volatile liquidsappear to have a similar upper bound where there has not been a major flow situation prior toignition. The natural gas upper bound, as developed earlier, is still valid.2.4 NATURAL GAS, PROPANE, VOLATILE LIQUIDS AND CRUDE OILThe data for the previous case has been supplemented by the data for crude oil to determine ifthe two upper bound models are still valid for the combined data. The major flow accidents willbe treated later in the report.The crude oil data also introduced an anomalous data point due to major flow prior to ignition.This will be deleted from the data.The upper bound model, however, is still valid for incidents-accidents that result in a fire at thesource of the leak. An upper bound is again drawn. 1200~1000~800< 600~400 200BURN RADIUS vs OPERATING PRESSUREfor VARIOUS TRANSMISSION MATERIALS*NAT GAS~PROPANE& VOLATILE LIQ.x CRUDE OIL1200 1400 16002.5 HAZARDOUS LIQUIDS WITH SIGNIFICANT FLOWS PRIOR TO IGNITION OF PRODUCT RELEASEDThe accident data for which there was a significant flow of released material prior to ignition areplotted in the following chart. There is no discernible pattern. Depending upon the individualsituation, the length of flow will vary. It does not correlate with the incident operating pressure.Transported liquid, when accidentally released, may flow a significant distance before it ignitesand either burns or explodes. The NGL and other accidents included in this chart represent adifferent phenomenon than the gaseous releases considered earlier.0 200 400 600 800 1000 OPERATING PRESSURE psig8

BURN RADIUS AFTER SIGNIFICANT FLOW OF HAZARDOUS LIQUIDSA VOLATILE LIQ.OCRUDE OIL PRESSURE psig3.0 ANALYSIS OF PIPELINE INCIDENTS-ACCIDENTS RESULTING IN ENVIRONMENTAL DAMAGESIt is not feasible to develop a radius of influence for environmental damages resulting from atransmission pipeline leak. This is because the environmental damage that results from a leakis very site specific.The released material will impact a sensitive environmental receptor if a receptor exists at thesite of the leak. The environmental damage of a pipeline leak is a function of:* the quantity of material released.* the proximity of a sensitive receptor.* local topography if the released material is liquid.* prevailing winds if the released material is gaseous.The possible radius of influence of a hazardous materials release is potentially quite large. Inthe accident represented by PAR 80-06 in the table at the beginning of this report, leakinggasoline flowed approximately two miles in a small stream before it was ignited. Releasedmaterial, if topography allowed, could, in theory, flow until it reached a lake or the sea. NTSBreport PAR 74-6 represented a release of anhydrous ammonia vapors that traveled eight milesafter release in an accident.The operator must be cognizant of all sensitive environmental receptors along a pipeline routeand all possible routes from their pipeline to the receptor. Particular attention should be givento sourcesof potable water supply, both ground and surface supplies, and other importantenvironmental receptors. 12000 10000 8000 6000 4000D~ 2000 0AAA1bAA0 200 4006008001000 1200 14001600Q

Study is needed to classify types of environmental receptors with regard to the importance ofprotecting these receptors. RSPA/OPS might then consider developing a class locationsystem, similar to that for natural gas transmission pipelines, for hazardous liquid pipelines.This process is very complex and would require the cooperation and assistance of many publicagencies in identifying and classifying the importance of environmental receptors with regard toallowable risk. 10

PART 2A GIS BASED PIPELINE RISK MANAGEMENT MODEL4.0 INTRODUCTIONEncroachment of new land development on existing natural gas and hazardous liquid pipelinesrights-of-way has posed a real concern related to added risk and the consequences of potentialaccidents. Several major accidents have occurred in the past few years resulting in loss of life,extensive property damage and water resources contamination. To reduce the probability ofaccident occurrence and the impact of accidents, the characteristics of the pipeline and itsspatial proximity to populated and/or environmentally sensitive areas must be carefullyanalyzed. An illustrative GIS based strategy for analyzing the risks and consequencesassociated with natural gas and hazardous liquid pipelines was developed and is presented inthis report.This report presents a sample GIS that includes data requirements, data structure analyticaltools, a risk management model, and an impact analysis. The GIS presented here is by nomeans a comprehensive and complete system. It is a modest illustration of a GIS approach thatcould be useful in assessing and managing risks. The information used for this study includes:1. Spatial information on the location of the pipelines and the facilities, man-made and natural, within the potential impact area of the pipeline.2. Attribute information on the type of facilities, their usage and the population surrounding these facilities.Based on the above information, the risk management model and historical information, the GIScan provide a statistical assessment of the probability of a failure occurring and its impact on agiven area. In the GIS that was developed here different impact buffers are presented. Thesebuffers represent a "what if" scenario. For example, if an accident occurs at a given point andthe impact radius is 750 feet from that point, the GIS will show what will be affected by theaccident.5.0 THE GIS SOLUTIONA GIS allows one to study pipeline risk processes by developing and implementing a riskmanagement model RMM. According to Muhlbauer Pipeline Risk Management Manual, GulfPublishing Co., 1992, building a risk management tool takes four steps:1. SECTIONING. Breaking the pipeline system into sections of similar characteristics and condition. 11

2. CusToMIzING. Deciding on a list of risk contributors and their relative weight.3. DATA GATHERING. Building the database by computing the risks associated with each section4. MAINTENANCE. Updating the database to reflect changes in pipe data and potential risks.Building a risk management system based on GIS and these four steps is a natural match. GIShas many tools to handle both the spatial aspects and the database aspects of the Muhlbaueroutline. Sectioning of the pipe and the computations of the relative risk associated with eachsection are classical vertical selection and analysis operations that are at the core of GIStechnology.To carry out the risk analysis it is necessary to collect pipeline surroundings environmental data.5.1 DATA DEFINITION PIPELINE AND ITS ENVIRONMENTAn essential step in implementing a risk management model with GIS is the establishment of adata model. The data model is a conceptual plan for the type of data and the context in which itwill be used. The following figure illustrates the sources of risks to the pipeline risk factors andsome of the corresponding GIS data models GIS coverages that are needed for evaluatingthe associated risks.For a pipeline risk management model based on a GIS there is a need to define two types ofdata. The first is the pipeline's characteristics and the second is the resources surrounding thepipeline. In addition, the characteristics of the specific product being transported i.e. type ofgas or liquid have to be specified because different products present different risks. Thepipeline's surroundings proximity data includes distribution of population, man made facilities,and environmentally sensitive areas. In terms of GIS coverages or data layers, the mainsurrounding factors that need to be considered are:RISK _____ ~rounding IFACrORS _________ I Environment J .1 / /1***~COVERAGES ~ ~ ~ Buildingj IStreet Soil J Water Resources12

* POPULATION DENSITY AND PROXIMITY. Denser population in the vicinity of the pipeline presents higher risk in the event of pipeline failure. It also implies more activity, fence building, street construction, etc. Many of these activities present a higher risk to the integrity of the pipeline. Population related data are stored in the building and Street coverage.* ENVIRONMENTALLY SENSITIVE AREAS. The size, extent, and proximity of both groundwater and surface water to the pipeline and its usage determines the potential impact of an accident~ If the water is used for swimming, fishing, livestock watering, irrigation, or drinking, even a relatively small spill could cause considerable damage. Stream, lake and wetland coverages are constructed to enable analysis of the risks associated with environmentally sensitive areas.* SOIL TYPE. Soil is often an effective electrolyte, and the elements of the soil may directly or indirectly promote or enhance pipeline corrosion. The stability of the soil and its ability to resist erosion and stress are also important properties of the soil. A soil coverage is used to store the information on soil corrosivity, soil movement, soil pH, and soil permeability, among other factors.* Other factors such as ecological, recreational and cultural resources.Since the GIS presented here is an illustration of its potential as a risk management tool, onlylimited data was actually used by NJIT's Team.5.2 PIPELINE ATTRIBUTE DATA REPRESENTATIONIn pipeline risk management, the risk evaluator must decide on criteria to section or divide thepipeline into sections of similar characteristics. Each section is then labeled with a pdtential riskbased on its characteristics. Dividing the pipeline into many short sections increases theaccuracy of the assessment for each section, but may result in higher costs of data collection,.handling, and maintenance. The appropriate approach to sectioning is to insert a break pointwherever significant changes occur. Dynamic segmentation in GIS is an efficient method forperforming this task. Dynamic segmentation is the ability to associate multiple sets of attributesto any segment of a linear feature without changing the description of the feature; the ability tolink attributes to linear features using route-measure formats; and to store, display, query andanalyze these pipeline product attributes without segmenting the pipeline itself.The following pipeline risk related attribute data was available and was stored in a linear eventtable a table that is needed for implementing the dynamic segmentation concept:* The year in which the pipeline was installed, and the integrity testing data.* The pipe wall thickness.* Thegradeofthe pipe.* The diameter of the pipe. 13
* MAOP for gas pipelines or MOP for hazardous liquid pipelines. * The pipeline station number. A homogeneous section based on the above parameters was used in this study. Additional data could be added depending on the particular analysis and the availability of data. 5,3 PIPELINE SURROUNDINGS DATABASE As noted above, the population and resources surrounding the pipeline are very important factors to be considered in pipeline risk management. In this study, a detailed database was built to account for some these attributes. In the database, attribute tables have been constructed for the types of facilities and the number of people occupying each one of them. The types of facilities in these tables are, for example: schools, hospitals, shopping centers, or residential buildings. Due to lack of actual data the occupancy of these facilities was assumed. 5.4 DATA ANALYSIS The main power of a GIS is in performing spatial analysis. In this particular application of pipeline risk assessment, GIS can be used to perform the following spatial analysis: * IDENTIFY PIPELINE SECTIONS BY AGE, DIAMETER, GRADE, PRESSURE, ETC. A color coding scheme can be developed for highlighting specific information. If a particular characteristic of a pipe is to be examined or evaluated, the appropriate sections can be extracted for analysis. For example, pipe of a certain grade and vintage that has a problem can be easily identified and located by a GIS. * IDENTIFY THE PIPELINE'S SURROUNDINGS. As mentioned earlier, an area with higher population and active land development poses increased danger to the pipeline. A GIS could easily perform class location classification to determine the need for increasing safety measures. * IDENTIFY THE SOIL CONDITION AROUND THE PIPELINE AREA. The type of soil could, for example, be a factor in ~Jetermining the extent of the damage to the environment in the event of a spill. * IDENTIFY THE WATER FLOW PATTERNS AND PROXIMITY TO SURFACE WATERS. Overlaying the water map and pipeline map and using query tools, one can assess the possible dispersion and the extent of the contamination. * ANALYZE THE IMPACT ON EXPLOSION AND RELATED SAFE DISTANCE SEPARATION IN CONJUNCTION WITH POPULATION AND PROPERTY THAT EXISTS IN THE VICINITY OF THE PIPELINE. This would be useful in analyzing risk. 14

6.0 CASE STUDYAs a case study to demonstrate the concept, a GIS was built around a short approximately 2* mile pipeline section in Edison, South Plainfield, and Metuchen, New Jersey. The researcharea is depicted in Figure 1. This section is located in the vicinity of the gas explosion thatoccurred in 1994 in Edison, New Jersey. The pipeline characteristics information along thispipeline section was obtained from an operator of a hazardous liquid pipeline. The pipelineroute and its relationship to the local streets is presented in Figure 2. The building and streetcoverage were digitized from a topographic map of the area and orthophotographs TIGER datafor this area was erroneous and outdated. The factors of pipeline surroundings includedenvironmental factors and population density. Environmental data such as streams, lakes, andwetlands was obtained from the New Jersey Department of Environmental Protection andEnergy NJDEPE. Figures 3 through 6 show the data that was obtained from NJDEPE. Someof the data is presented for the entire county with an indication of the research area. This is toshow that information was collected, but that very limited data falls inside the case study area.Some of the data elements do not even exist for the research area. For example, in Figure 4Lakes, there are no lakes that fell within the pipeline corridor. A Soil map was also digitized.7.0 RISK ANALYSIS WITH GISThe risk analyses performed in this study involve hypothetical "what if" scenarios. Differentincidents could have different areas of impact. Thus, it is prudent to analyze what would happenif a certain incident occurred at a certain point. The buffer spatial analysis tool was used toperform this analysis.For pipeline risk management analysis, two types of buffers are useful. The first is a line bufferand the second is a point buffer. A line buffer analysis takes into consideration an impact areaalong a line i.e. pipeline, while a point buffer computes the impact on a certain radius around aselected point incident point. In this study we computed four line buffers with different widthsand four point buffers with a fixed radius at different locations along the pi~ieline. The widths ofthe line buffers were 250 feet, 500 feet, 750 feet, and 1000 feet. The radius of the four pointbuffers was 1000 feet.The determination of the actual width or radius for a particular incident is a function of manyfactors. Some of these factors are operating pressure, commodity transported, depth of burial,and weather conditions. A study on this matter was produced by NJIT and covered in Part I ofthis report.8.0 ANALYSIS OF RESULTSThe results. of the above analysis are presented in Figures 6 through 12. The following is thelist of these figures and what they depict. 15

Figure 6 The location of the four point buffers which were analyzed.Figure 7 Impact area on facilities within 250 feet of the pipeline.Figure 8 Impact area on facilities within 500 feet of the pipeline.Figure 9 Impact area on facilities within 750 feet of the pipeline.Figure 10 Impact area on facilities within 1000 feet of the pipeline.Figure 11 The affected population within the above line buffers.Figure 12 The affected population within the above.point buffers.The findings from Figure 11 indicate that the wider the impact area, the more population is atrisk. This is an expected result. What one can learh from these findings is that in certain areas,if a highly volatile commodity is being transported, a very large population could be put at risk.Safe separation distances or an equivalent increase in safety measures must be consideredfollowing a risk assessment.The results shown in Figure 12 are interesting as well. They show that if an incident occurredat point 4 i.e., points shown in Figure 6 it would have no impact on the population. However,should one occur at point 3, 1100 people would be at risk. The distance between points 3 and 4is about one mile. These results show that an appropriate risk management program must bedetailed enough to accommodate and account for very large variations in very short distances.Implementing only a general risk management program is not sufficient for determining the realrisk involved.9.0 CONCLUSIONSA brief demonstration GIS based risk management model was developed and a case study waspresented. It attempted to show that GIS is an appropriate tool for implementing a riskmanagement model and for maintaining a risk management program. It was also shown that abroad brush risk management program that does not consider detailed spatial data isinsufficient in assessing the real risks associated with transmission pipelines. 16
APPENDIX AFIGURE 1 STUDY AREA AND ITS SURROUNDINGSFIGURE 2 PIPELINE ROUTE SYSTEMFIGURE 3 WETLANDSFIGURE 4 LAKE COVERAGEFIGURE 5 STREAMS COVERAGEFIGURE 6 IMPACT OF POINT INCIDENTSFIGURE 7 250 FT. BUFFERFIGURE 8 500 FT. BUFFERFIGURE 9 750 FT. BUFFERFIGURE 10 1000 FT. BUFFERFIGURE 11 POPULATION WITHIN THE LINE BUFFER AREAFIGURE 12 POPULATION WITHIN THE POINT BUFFER AREA

Cl 0 L.C, Cl* - Cu 0C,z~ 4,I',0U,1~ / 0z D LL C a, O~ cDCI z a, - C C ~ a,=*_ >~. - - COQQDU

z~ c.,1 E C, U I 100+00 IL`C, ~. ClQ 0C1U

Cl£2 C U .- C C 0 *1 0 E ~ 0 0 W<0 C C WD~ a.~wz~InN0`4cv0

Cu L.. w 00 0-J z~:ij *:. -`4S ~r4~~IaS SF..I.-a,.u- 0 . .. .. -V.. *`*1U.. ~:. k ` ~- *v.~. ~..:.~-; *::.: ~0a. ~ G E cD< Co.-- iQCIEli:

0 C 0C Cl E CClz~AI',LL_6~~a,0U,0U, 4-, a E 0 0-c, ~4-'COQC/

Cl0C.050~0C.0. E ~O ~~~Cl cmc -~cw .~ .~ Q__o mo-ocsCoI',0ItCo0I-VCl

C a icl ~ a CC *~ =.-~ CD V = a .~ c~.iCflCIz~0 -l - / `.1 ~ 0~~1 I0ItC~~1I.-LI~0U,

C a E 0 w a CC I- 0 .~cU CU>.. a.0 - - UCI 0 0C.,I'00I00Inc

0 E 0 LLz~00U,0ICC~ ~5oaaCC ._ *0 =0 ~ 1.0 - -a~mN-ucf

0 LL0U,04000CUDU ~CUUC Cii~4..~ cU>~. I- _, 0 -

Line:Buffer~IBufferDistance2505007501000Population660181021902990z.~PÛi~tBuffer~::~::1.LocationPoint 1Point 2Point 3Point 4Population660181021902990Figure 111200Population Within the Point Buffer Area1000800050600400200 - -:0F~int Io ~int I*R1nt2D~int3DRint4~int 2~int 3Location~bint 4Figure 12