NOTICE - Kaweah Delta Medical Center...The Board of Directors of the Kaweah Delta Health Care...
55
400 West Mineral King Avenue · Visalia, CA · (559) 624 2000 · www.kaweahdelta.org September 6, 2019 NOTICE The Board of Directors of the Kaweah Delta Health Care District will meet in an open Quality Council Committee meeting at 7:00AM on Thursday September 12, 2019, in the Kaweah Delta Medical Center – Acequia Wing – Executive Office Conference Room {400 W. Mineral King, Visalia}. The Board of Directors of the Kaweah Delta Health Care District will meet in a Closed Quality Council Committee meeting immediately following the 7:00AM Open Quality Council Committee meeting on Thursday September 12, 2019, in the Kaweah Delta Medical Center – Acequia Wing – Executive Office Conference Room {400 W. Mineral King, Visalia} pursuant to Health and Safety Code 32155 & 1461. All Kaweah Delta Health Care District regular board meeting and committee meeting notices and agendas are posted 72 hours prior to meetings in the Kaweah Delta Medical Center, Mineral King Wing entry corridor between the Mineral King lobby and the Emergency Department waiting room. The disclosable public records related to agendas are available for public inspection at the Kaweah Delta Medical Center – Acequia Wing, Executive Offices (Administration Department) {1st floor}, 400 West Mineral King Avenue, Visalia, CA and on the Kaweah Delta Health Care District web page http://www.kaweahdelta.org. KAWEAH DELTA HEALTH CARE DISTRICT Nevin House, Secretary/Treasurer Cindy Moccio Board Clerk, Executive Assistant to CEO DISTRIBUTION: Governing Board Legal Counsel Executive Team Chief of Staff http://www.kaweahdelta.org/ 1/161
Transcript of NOTICE - Kaweah Delta Medical Center...The Board of Directors of the Kaweah Delta Health Care...

400 West Mineral King Avenue · Visalia, CA · (559) 624 2000 · www.kaweahdelta.org
September 6, 2019
NOTICE The Board of Directors of the Kaweah Delta Health Care District will meet in an open
Quality Council Committee meeting at 7:00AM on Thursday September 12, 2019, in the Kaweah Delta Medical Center – Acequia Wing – Executive Office Conference Room {400 W. Mineral King, Visalia}.
The Board of Directors of the Kaweah Delta Health Care District will meet in a Closed Quality Council Committee meeting immediately following the 7:00AM Open Quality
Council Committee meeting on Thursday September 12, 2019, in the Kaweah Delta Medical Center – Acequia Wing – Executive Office Conference Room {400 W. Mineral King, Visalia} pursuant to Health and Safety Code 32155 & 1461.
All Kaweah Delta Health Care District regular board meeting and committee meeting notices and agendas are posted 72 hours prior to meetings in the Kaweah Delta Medical Center, Mineral King Wing entry corridor between the Mineral King lobby and the Emergency Department waiting room.
The disclosable public records related to agendas are available for public inspection at the Kaweah Delta Medical Center – Acequia Wing, Executive Offices (Administration Department) {1st floor}, 400 West Mineral King Avenue, Visalia, CA and on the Kaweah Delta Health Care District web page http://www.kaweahdelta.org. KAWEAH DELTA HEALTH CARE DISTRICT Nevin House, Secretary/Treasurer
Cindy Moccio Board Clerk, Executive Assistant to CEO DISTRIBUTION: Governing Board Legal Counsel Executive Team Chief of Staff http://www.kaweahdelta.org/
1/161

Thursday September 12, 2019 – Quality Council Page 1 of 2 Herb Hawkins – Zone I ⃰⃰ Lynn Havard Mirviss – Zone II ⃰⃰ John Hipskind, MD – Zone III ⃰⃰ David Francis– Zone IV ⃰⃰ Nevin House– Zone V Board Member President Vice President Board Member Secretary/Treasurer
KAWEAH DELTA HEALTH CARE DISTRICT BOARD OF DIRECTORS
QUALITY COUNCIL
Thursday, September 12, 2019
Kaweah Delta Medical Center – Acequia Wing 400 W. Mineral King Avenue, Visalia, CA Executive Conference Room
ATTENDING: Nevin House, Board Member; David Francis, Board Member; Gary Herbst, CEO; Regina Sawyer, RN, VP & CNO; Byron Mendenhall, MD, Chief of Staff; Monica Manga, MD, Professional Staff Quality Committee Chair; Daniel Hightower, MD, Secretary/Treasurer; Harry Lively, MD, Past Chief of Staff; Lori Winston, MD, DIO; Tom Gray, MD, Quality and Patient Safety Medical Director; Sandy Volchko, Director of Quality and Patient Safety; Evelyn McEntire, Director of Risk Management; Ben Cripps, Compliance and Privacy Officer, and Heather Goyer, Recording.
OPEN MEETING – 7:00AM
Call to order – Herb Hawkins, Committee Chair & Board Member
Public / Medical Staff participation – Members of the public wishing to address the Committee concerning items not on the agenda and within the subject matter jurisdiction of the Committee may step forward and are requested to identify themselves at this time. Members of the public or the medical staff may comment on agenda items after the item has been discussed by the Committee but before a Committee recommendation is decided. In either case, each speaker will be allowed five minutes.
1. Written Quality Reports – A review of key quality metrics and actions associated with the following populations:
1.1. Value-Based Purchasing Report 1.2. Patient Experience 1.3. Maternal Child Health Careline Quality Report 1.4. Fall Prevention
2. Emergency Department Quality Update – A review of key measures and actions for the Emergency Department. Kona Seng, OD, Medical Director of Emergency Services, and Tom Siminski, RN Director of Emergency Services.
3. Update: Fiscal Year 2019 Clinical Quality Goals - A review of current performance and actions focused on the FY 2019 clinical quality goals. Sandy Volchko, RN, Director of Quality and Patient Safety.
4. Cardiology Services Quality Report – A review of key quality indicators and actions through the American College of Cardiology quality program. A. Verma, MD, Director of Cardiac Cath Lab
5. Infection Prevention Quarterly Report – A review of infection prevention measures, and actions for improvement and enhancement of the infection prevention program. Shawn Elkin, MPA, BSN, RN, PHN, CIC, Infection Prevention Manager.
2/161

Thursday September 12, 2019 – Quality Council Page 2 of 2 Herb Hawkins – Zone I ⃰⃰ Lynn Havard Mirviss – Zone II ⃰⃰ John Hipskind, MD – Zone III ⃰⃰ David Francis– Zone IV ⃰⃰ Nevin House– Zone V Board Member President Vice President Board Member Secretary/Treasurer
6. Approval of Quality Council Closed Meeting Agenda – Kaweah Delta Medical Center Executive Conference Room – immediately following the open Quality Council meeting
o Quality Assurance pursuant to Health and Safety Code 32155 and 1461, report of Professional Staff Quality Committee (Pro-Staff) – Monica Manga, MD, and Professional Staff Quality Committee Chair;
o Quality Assurance pursuant to Health and Safety Code 32155 and 1461, report of Professional Staff Quality Committee (Pro-Staff) – Evelyn McEntire, Director of Risk Management.
Adjourn Open Meeting – Herb Hawkins, Committee Chair & Board Member
CLOSED MEETING – Immediately following the 7:00AM open meeting
Call to order – Herb Hawkins, Committee Chair & Board Member
1. Quality Assurance pursuant to Health and Safety Code 32155 and 1461, report of Professional Staff Quality Committee (Pro-Staff) – Monica Manga, MD, and Professional Staff Quality Committee Chair
2. Quality Assurance pursuant to Health and Safety Code 32155 and 1461, report of Professional Staff Quality Committee (Pro-Staff) – Evelyn McEntire, Director of Risk Management.
Adjourn Open Meeting – Herb Hawkins, Committee Chair & Board Member
In compliance with the Americans with Disabilities Act, if you need special assistance to participate at this meeting, please contact the Board Clerk (559) 624-2330. Notification 48 hours prior to the meeting will enable the District to make reasonable arrangements to ensure accessibility to the Kaweah Delta Health Care District Board of Directors committee meeting.
3/161

Value Base Purchasing FY 2020
4/161
Abbreviations
• CMS: Centers for Medicare and Medicaid Services
• DRG: Diagnosis Related Groups
• FY: Fiscal Year
• CY: Calendar Year
• TPS: Total Performance Score
• VPB: Value Based Purchasing
• AHRQ: Agency For Health Care Research and Quality
• PSI-90: Patient Safety Indicators-90
• SNF: Skilled Nursing Facility
• RRT: Rapid Response Team
5/161

VBP Payment Method• “The Hospital VBP Program is funded by a 2% reduction from
participating hospitals’ base operating diagnosis-related group (DRG) payments for FY 2018. Resulting funds are redistributed to hospitals based on their Total Performance Scores (TPS). The actual amount earned by each hospital depends on the range and distribution of all eligible/participating hospitals’ TPS scores for a FY. It is possible for a hospital to earn back a value-based incentive payment percentage that is less than, equal to, or more than the applicable reduction for that program year.”
CMS Quality Patient Assessment Instruments
6/161
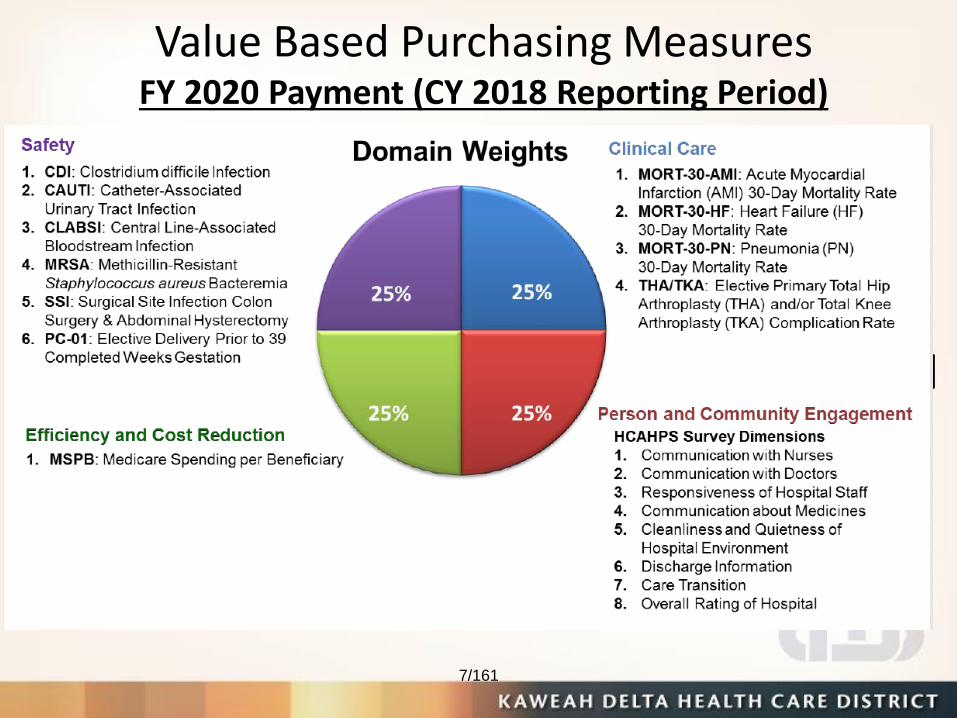
Value Based Purchasing MeasuresFY 2020 Payment (CY 2018 Reporting Period)
New FY 2019
7/161

Kaweah Delta Performance FY 2020 Payment Performance
Base Operating DRG Amount Reduction Value-Base Incentive Payment %
FY 2016 1.75% 2.09%
FY 2017 2% 1.84%
FY 2018 2% 1.47%
FY 2019 2% 1.53%
FY 2020 2% 1.48%
8/161

Actual Points & Costs
FY 2020 VBP Cost AnalysisContribution Payment Percentage
2% = $1,669,200 1.48%=$1,236,376
($432,823)
FY 2020 (Points Received)
52.50%
8
1
2
10
20.00%
0
0
0
0
7
0
5
13%*
0
0
0
0
0
0
0
0
0
20.00%
2
*Consistency Score
Efficiency and Cost Reduction-Domain
Score
Complication elective THA/TKA
Cleanliness of Hospital EnvironmentQuietness of Hospital EnvironmentDischarge InformationCare TransitionOverall Rating of Hospital
Communication about Medicines
CAUTI - Per 1000 catheter days
CLABSI - Per 1000 line days
Communication with DoctorsResponsiveness of Hospital Staff
MRSA - Per 10,000 patient days
C. difficile - Per 10,000 patient days
SSI Abdominal Hysterectomy - Rate Per 100
SSI Colon - Rate Per 100 procedures
Medicare Spending per Beneficiary
Pneumonia
Acute Myocardio Infarction
Heart Failure
PC-01 Early Elective Deliveries
Clinical Outcomes - Domain Score
Safety - Healthcare Associated infections -
Domain Score
Person and Community Engagement -
Domain Score
Communication with Nurses
9/161

Action Plan & TeamsMortality
• Mortality committee meets once month and has identified the largest improvement opportunity is earlier palliative care. Disease specific resource effectiveness teams are also working on best practices.
Hip & Knee Complications
• Orthopedic service line reviews all complications to assess if complications are true (re-code) and identify opportunities for improvement.
Infection Prevention
• Infection prevention has teams in each area meet every month. In 2019, Kaweah implemented and IV safety team to round on all lines and monitor expired IVs. Since this team, Kaweah MRSA and CLABSI rates are trending down.
Ear lily Elective Deliveries
• Implemented hard stop of scheduling early elective deliveries.
Patient Experience
• Implementation of “Operation Always” with department specific action plans, increased leader patient rounding, and use of new survey vendor in July 2019.
Medicare Spending
• Resource Effectiveness Committee teams are all working on efficiency and lowering costs.
10/161
Questions?
11/161

Patient Experience – Excellent Service - HCAHPS The data is for patients discharged: First Quarter 2018 through Fourth Quarter 2018. 1469 surveys completed with a 21% response rate.
HCAHPS Measure CMS 50th percentile 1Q18-4Q18
Kaweah Delta 1Q18-4Q18
Adjustments to Kaweah Delta 1Q18- 4Q18
Kaweah Delta RAW 3Q18- 2Q19
Comments/Improvement Efforts
# of surveys - 1469 - 1661 -
Communication with Nurses
81%
77% Below
84.9% (RAW) MODE ADJ: -4.2% ~PT MIX ADJ: -3.7% ~ TOTAL ADJ: -7.9%
83% Opening and closing encounters Narrate the care Communication white boards
Communication with Doctors
81%
74% Below
84.0% (RAW) MODE ADJ: -2.8% ~PT MIX ADJ: -5.2% ~ TOTAL ADJ: -8.0%
83% Greet patients & companions with a smile Sit at the bedside Conclude with “Is there anything else I can do for you?”
Responsiveness of Staff
70%
63% Below
70.2% (RAW) MODE ADJ: -0.8% ~PT MIX ADJ: -6.4% ~ TOTAL ADJ: -7.2%
70% Hourly Rounding Proactive toileting
Communication about Meds
66%
61% Below
69.5% (RAW) MODE ADJ: -1.7% ~PT MIX ADJ: -6.8% ~ TOTAL ADJ: -8.5%
67% Medicine Guide
Cleanliness of Environment
75% 67% Below
70.5% (RAW) MODE ADJ: -2.8% ~PT MIX ADJ: -0.7% ~ TOTAL ADJ: -3.5%
70% Linen delivery revamp EVS competency re-validation
Quietness of Environment
62% 48% Below
64.8% (RAW) MODE ADJ: -8.6% ~PT MIX ADJ: -8.2% ~ TOTAL ADJ: -16.8%
63% No new interventions
Discharge Information (Yes)
87%
85% Within
89.2% (RAW) MODE ADJ: -1.7% ~PT MIX ADJ: -2.5% ~ TOTAL ADJ: -4.2%
88% Medicine Guide Use discharge advocates to onboard new admits of preferences and expectations Implement solution for Discharge Phone Calls Rebuild Discharge Instructions (Fall 2019)
Care Transition (Strongly Agree)
53%
46% Below
50.5% (RAW) MODE ADJ: -0.6% ~PT MIX ADJ: -3.9% ~ TOTAL ADJ: -4.5%
49% Same as above
Overall Rating of Hospital (0 = worst; 10 = best)
73% 69% (9 or 10) Below
76.2% (RAW) MODE ADJ: -2.0% ~PT MIX ADJ: -5.2% ~ TOTAL ADJ: -7.2%
77% OPERATION ALWAYS Purpose: Consistently provide world-class service
Department-specific action plans reviewed by Executive Team
Increase leader rounding on patients
Regular monthly data and comments
New Survey Vendor: JL Morgan
Launch Gold Star Discharge Program (early discharges home)
New patient menu
Willingness to Recommend (Definitely Recommend)
72% 68% Within
76.2% (RAW) MODE ADJ: -3.5% ~PT MIX ADJ: -4.7% ~ TOTAL ADJ: -8.2%
77% Same as above
Legend: Above or at benchmark Within 3% of benchmark Below benchmark by more than 3%
12/161
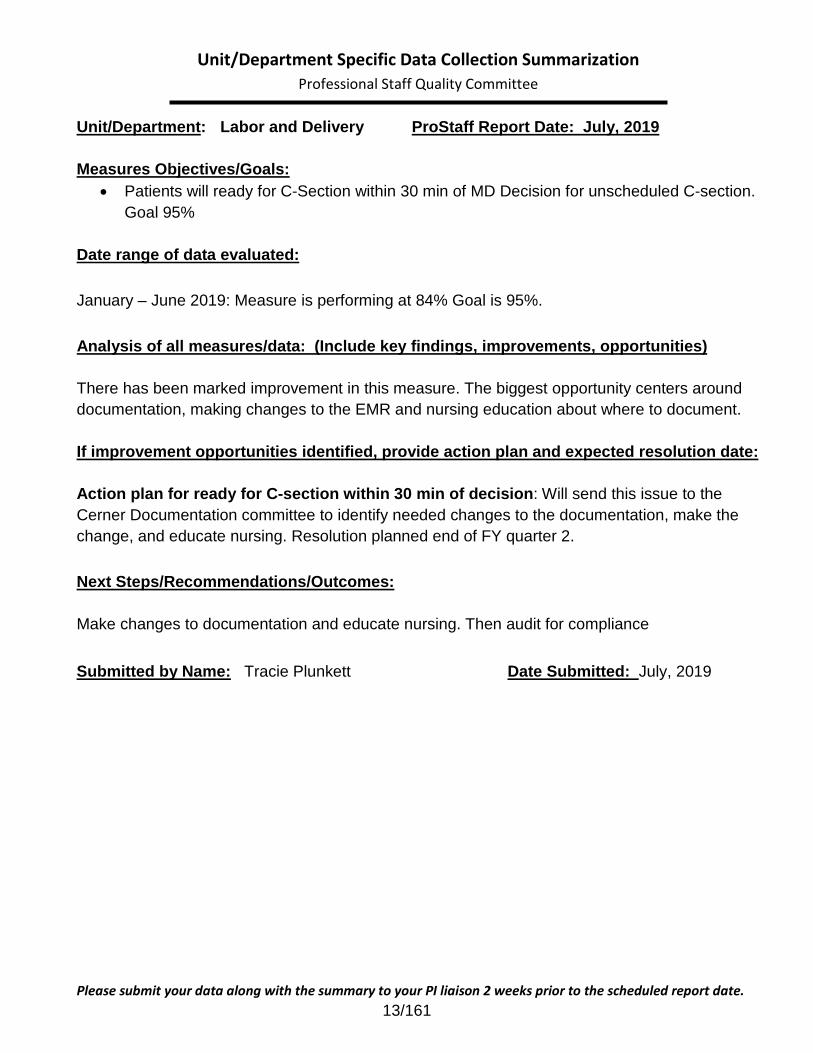
Unit/Department Specific Data Collection Summarization Professional Staff Quality Committee
Unit/Department: Labor and Delivery ProStaff Report Date: July, 2019
Measures Objectives/Goals:
• Patients will ready for C-Section within 30 min of MD Decision for unscheduled C-section.
Goal 95%
Date range of data evaluated:
January – June 2019: Measure is performing at 84% Goal is 95%.
Analysis of all measures/data: (Include key findings, improvements, opportunities)
There has been marked improvement in this measure. The biggest opportunity centers around
documentation, making changes to the EMR and nursing education about where to document.
If improvement opportunities identified, provide action plan and expected resolution date:
Action plan for ready for C-section within 30 min of decision: Will send this issue to the
Cerner Documentation committee to identify needed changes to the documentation, make the
change, and educate nursing. Resolution planned end of FY quarter 2.
Next Steps/Recommendations/Outcomes:
Make changes to documentation and educate nursing. Then audit for compliance Submitted by Name: Tracie Plunkett Date Submitted: July, 2019
Please submit your data along with the summary to your PI liaison 2 weeks prior to the scheduled report date.
13/161

Unit/Department Specific Data Collection Summarization Professional Staff Quality Committee
Unit/Department: Labor & Delivery ProStaff Report Date: July, 2019
Measure Objective/Goal:
Early Elective Deliveries: Goal is 2.42%
Date range of data evaluated:
Quarter January – June 2019
Analysis of all measures/data: (Include key findings, improvements, opportunities)
Quarter January – June 2019: Goal Met, Zero Early Elective Deliveries
Continue to monitor and work with OB Department Leadership on any potential issues
If improvement opportunities identified, provide action plan and expected resolution date:
Continue current plan, monitor for any issues.
Next Steps/Recommendations/Outcomes:
Continue current plan Submitted by Name: Date Submitted:
Tracie Plunkett MSN, RNC-OB, NE-BC July, 2019
Please submit your data along with the summary to your PI liaison 2 weeks prior to the scheduled report date.
14/161

Breastfeeding Stats
15/161
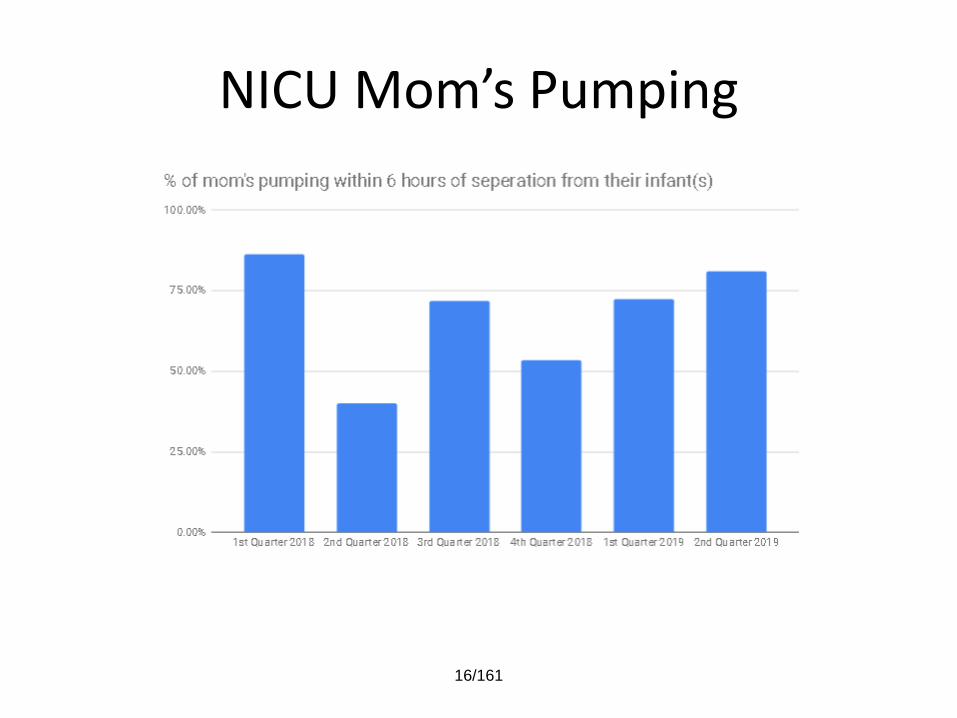
NICU Mom’s Pumping
16/161

C-Section Respiratory Rate Audit
17/161

Unit/Department Specific Data Collection Summarization Quality Improvement Committee
Unit/Department: Mother Baby QIC Report Date: July 2019
Measure Objective/Goal:
Babies receiving any breast milk while in the hospital 91.24% (CDPH 2017 benchmark of 93.9%)
Date range of data evaluated:
January – June 2019
Analysis of all measures/data: (Include key findings, improvements, opportunities)
We currently are performing below the benchmark of 93.9%.
If improvement opportunities identified, provide action plan and expected resolution date:
We are currently fully staffed with 7 day a week coverage spanning an average of 20 hours a
day. We implemented coverage on Labor/Delivery to see our new mom’s prior to delivery
providing them with education so they can make an informed decision on how they want to feed
their baby while in the hospital. We are beginning to roll out our breastfeeding bundle which
included the following: change in lactation scheduling, mandatory breastfeeding education for
RN’s, breastfeeding education provided to our pediatricians, selection preference form to be
collected on admission to Labor and Delivery and an investigative form for nursing to complete
when formula is given.
Next Steps/Recommendations/Outcomes:
We continue to support our mother’s choice of breastfeeding Submitted by Name: Date Submitted:
Melissa Filiponi, RNC-MNN, BSN 07/11/19
Please submit your data along with the summary to your PI liaison 2 weeks prior to the scheduled report date.
18/161

Unit/Department Specific Data Collection Summarization Quality Improvement Committee
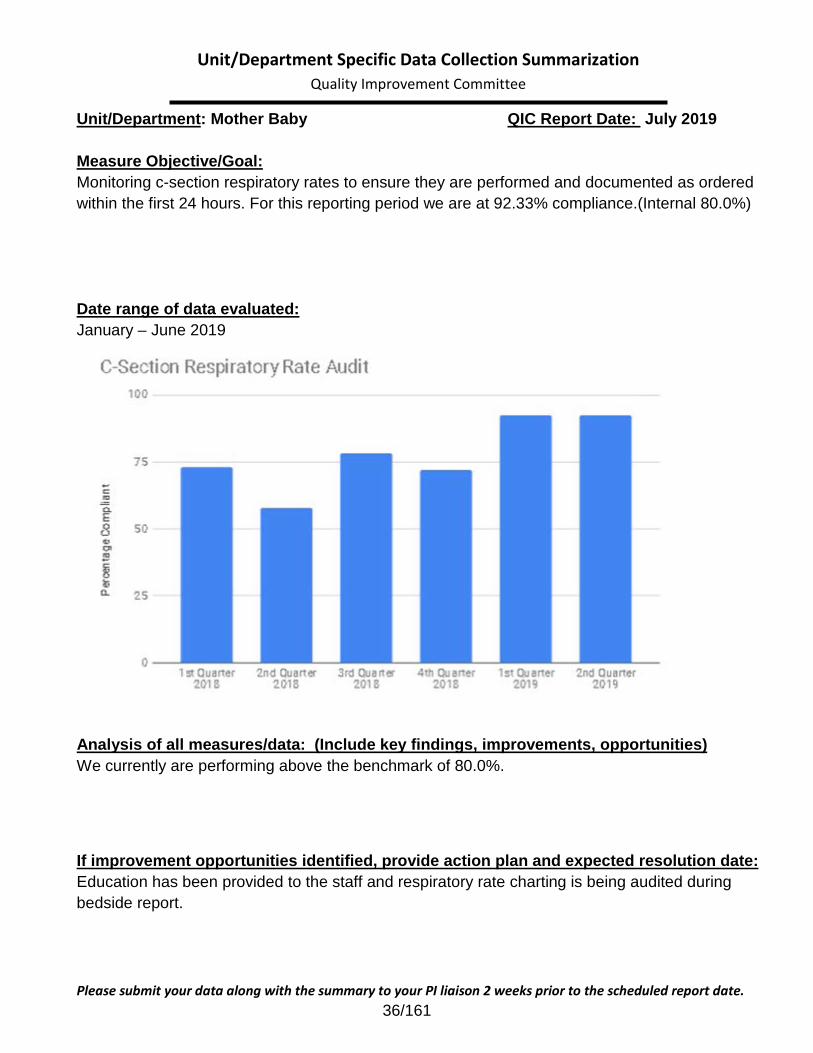
Unit/Department: Mother Baby QIC Report Date: July 2019
Measure Objective/Goal:
Monitoring c-section respiratory rates to ensure they are performed and documented as ordered
within the first 24 hours. For this reporting period we are at 92.33% compliance.(Internal 80.0%)
Date range of data evaluated:
January – June 2019
Analysis of all measures/data: (Include key findings, improvements, opportunities)
We currently are performing above the benchmark of 80.0%.
If improvement opportunities identified, provide action plan and expected resolution date:
Education has been provided to the staff and respiratory rate charting is being audited during
bedside report.
Next Steps/Recommendations/Outcomes:
We will continue to monitor this measure until we achieve and sustain a 80% compliance rate. Submitted by Name: Date Submitted:
Melissa Filiponi, RNC-MNN, BSN 07/11/19
Please submit your data along with the summary to your PI liaison 2 weeks prior to the scheduled report date.
19/161

Unit/Department Specific Data Collection Summarization Quality Improvement Committee
Unit/Department: Mother Baby QIC Report Date: July 2019
Measure Objective/Goal:
Babies receiving exclusive breast milk while in the hospital 52.57% (Benchmark 52.2%)
Date range of data evaluated:
January – June 2019
Analysis of all measures/data: (Include key findings, improvements, opportunities)
We currently are performing above the benchmark of 52.2%.
If improvement opportunities identified, provide action plan and expected resolution date:
We are currently fully staffed with 7 day a week coverage spanning an average of 20 hours a
day. We implemented coverage on Labor/Delivery to see our new mom’s prior to delivery
providing them with education so they can make an informed decision on how they want to feed
their baby while in the hospital. We are beginning to roll out our breastfeeding bundle which
included the following: change in lactation scheduling, mandatory breastfeeding education for
RN’s, breastfeeding education provided to our pediatricians, selection preference form to be
collected on admission to Labor and Delivery and an investigative form for nursing to complete
when formula is given.
Next Steps/Recommendations/Outcomes:
We continue to support our mother’s choice of exclusive breastfeeding. Submitted by Name: Date Submitted:
Melissa Filiponi, RNC-MNN, BSN 07/11/2019
Please submit your data along with the summary to your PI liaison 2 weeks prior to the scheduled report date.
20/161

Unit/Department Specific Data Collection Summarization Quality Improvement Committee
Unit/Department: Mother Baby QIC Report Date: July 2019
Measure Objective/Goal:
To initiate NICU mom’s pumping within 6 hours of separation from their baby 76.67% (Internal
benchmark of 75%).
Date range of data evaluated:
January – June 2019
Analysis of all measures/data: (Include key findings, improvements, opportunities)
We currently are performing above the benchmark of 75%.
If improvement opportunities identified, provide action plan and expected resolution date:
Education provided to staff on the importance of pumping for both mother and babies well-being.
We will begin auditing the charts of NICU moms and providing one on one education to staff so
that they are charting in the correct location within the EHR.
Next Steps/Recommendations/Outcomes:
We continue to audit, monitor and support the mother’s choice of pumping. Submitted by Name: Date Submitted:
Melissa Filiponi, RNC-MNN, BSN 07/11/19
Please submit your data along with the summary to your PI liaison 2 weeks prior to the scheduled report date.
21/161
Unit/Department Specific Data Collection Summarization Professional Staff Quality Committee
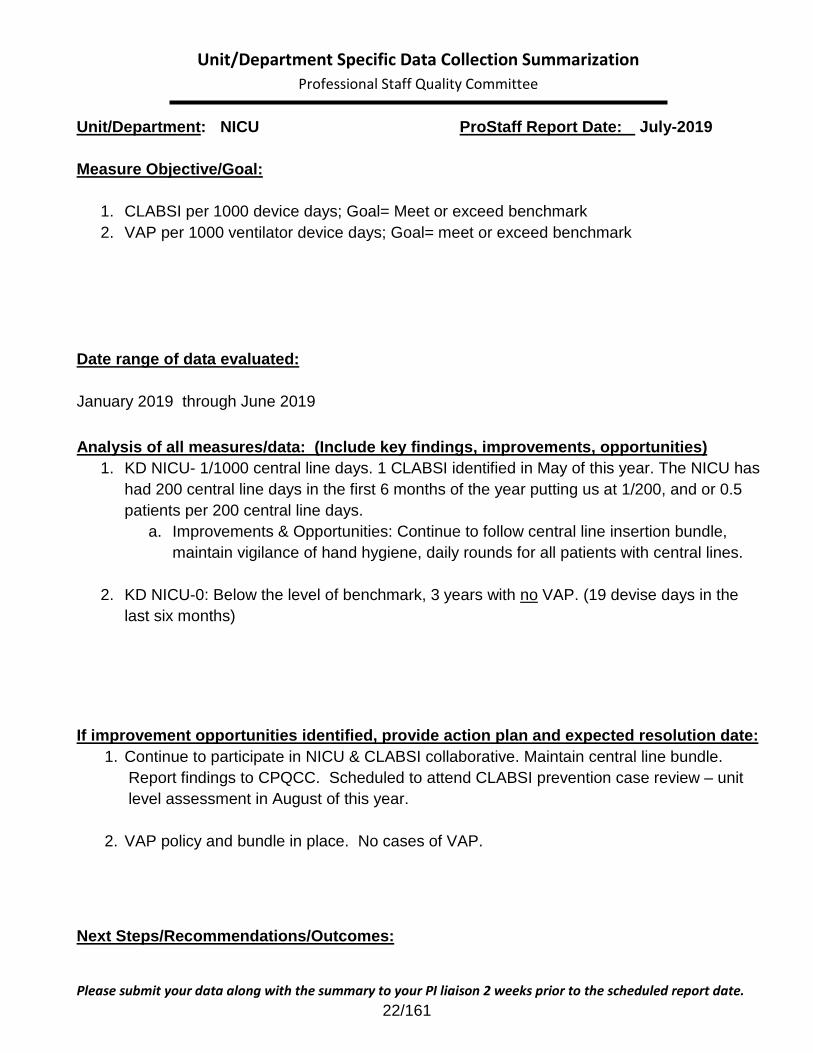
Unit/Department: NICU ProStaff Report Date: July-2019
Measure Objective/Goal:
1. CLABSI per 1000 device days; Goal= Meet or exceed benchmark
2. VAP per 1000 ventilator device days; Goal= meet or exceed benchmark
Date range of data evaluated:
January 2019 through June 2019
Analysis of all measures/data: (Include key findings, improvements, opportunities)
1. KD NICU- 1/1000 central line days. 1 CLABSI identified in May of this year. The NICU has
had 200 central line days in the first 6 months of the year putting us at 1/200, and or 0.5
patients per 200 central line days.
a. Improvements & Opportunities: Continue to follow central line insertion bundle,
maintain vigilance of hand hygiene, daily rounds for all patients with central lines.
2. KD NICU-0: Below the level of benchmark, 3 years with no VAP. (19 devise days in the
last six months)
If improvement opportunities identified, provide action plan and expected resolution date:
1. Continue to participate in NICU & CLABSI collaborative. Maintain central line bundle.
Report findings to CPQCC. Scheduled to attend CLABSI prevention case review – unit
level assessment in August of this year.
2. VAP policy and bundle in place. No cases of VAP.
Next Steps/Recommendations/Outcomes:
Please submit your data along with the summary to your PI liaison 2 weeks prior to the scheduled report date.
22/161

Unit/Department Specific Data Collection Summarization Professional Staff Quality Committee
1. Continue with current standardized insertion practice and care of all central lines.
2. No VAP. Benchmark met; continue to support current P&P.
Submitted by Name: Date Submitted:
Felicia Vaughn July 2019
Please submit your data along with the summary to your PI liaison 2 weeks prior to the scheduled report date.
23/161

Unit/Department Specific Data Collection Summarization Professional Staff Quality Committee
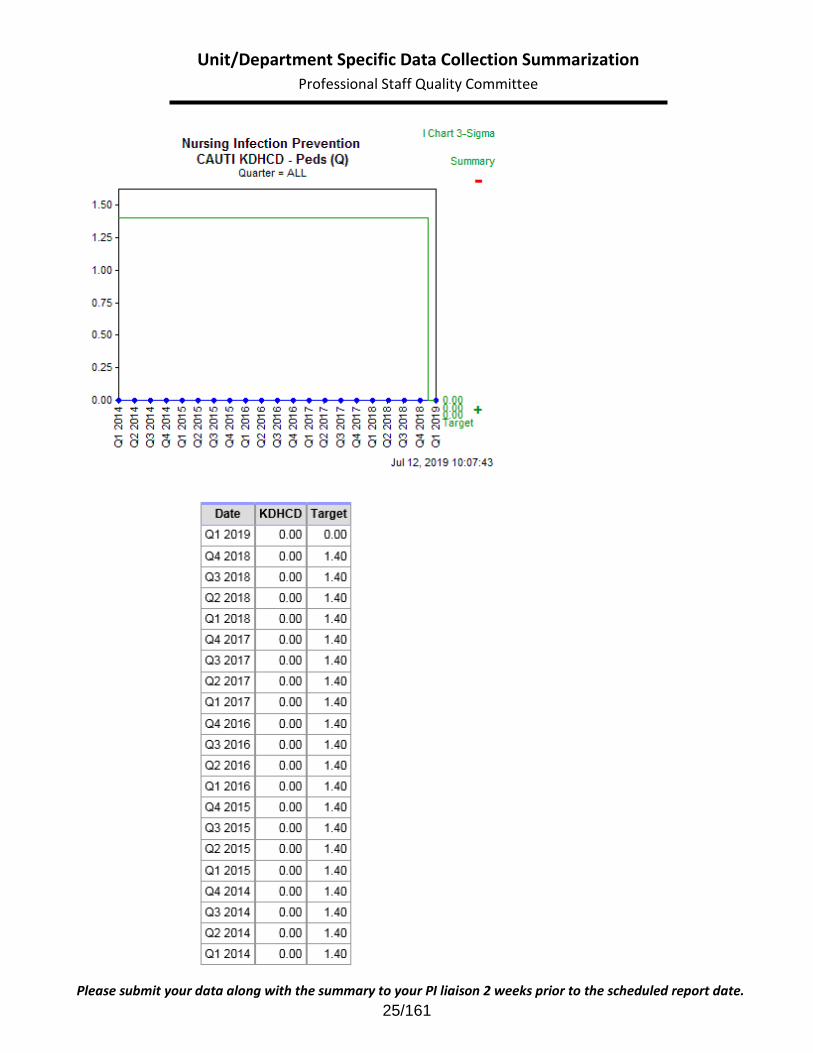
Unit/Department: Pediatrics ProStaff Report Date: July 2019
Measure Objective/Goal:
Catheter Associated Urinary Tract Infection
Goal: 0.00
Date range of data evaluated:
January-March 2019
Analysis of all measures/data: (Include key findings, improvements, opportunities)
We had 0 CAUTIs for this quarter. We are performing equal to the benchmark.
If improvement opportunities identified, provide action plan and expected resolution date:
Next Steps/Recommendations/Outcomes:
We will continue to use aseptic technique to insert urinary catheters, and we will continue to provide perineal care every shift. We will also continue to evaluate need for urinary catheter on a daily basis. Submitted by Name: Date Submitted:
Danielle Grimaldi, RN, BSN, CPN 07/12/19
Please submit your data along with the summary to your PI liaison 2 weeks prior to the scheduled report date.
24/161
Unit/Department Specific Data Collection Summarization Professional Staff Quality Committee
Please submit your data along with the summary to your PI liaison 2 weeks prior to the scheduled report date.
25/161

Unit/Department Specific Data Collection Summarization Professional Staff Quality Committee
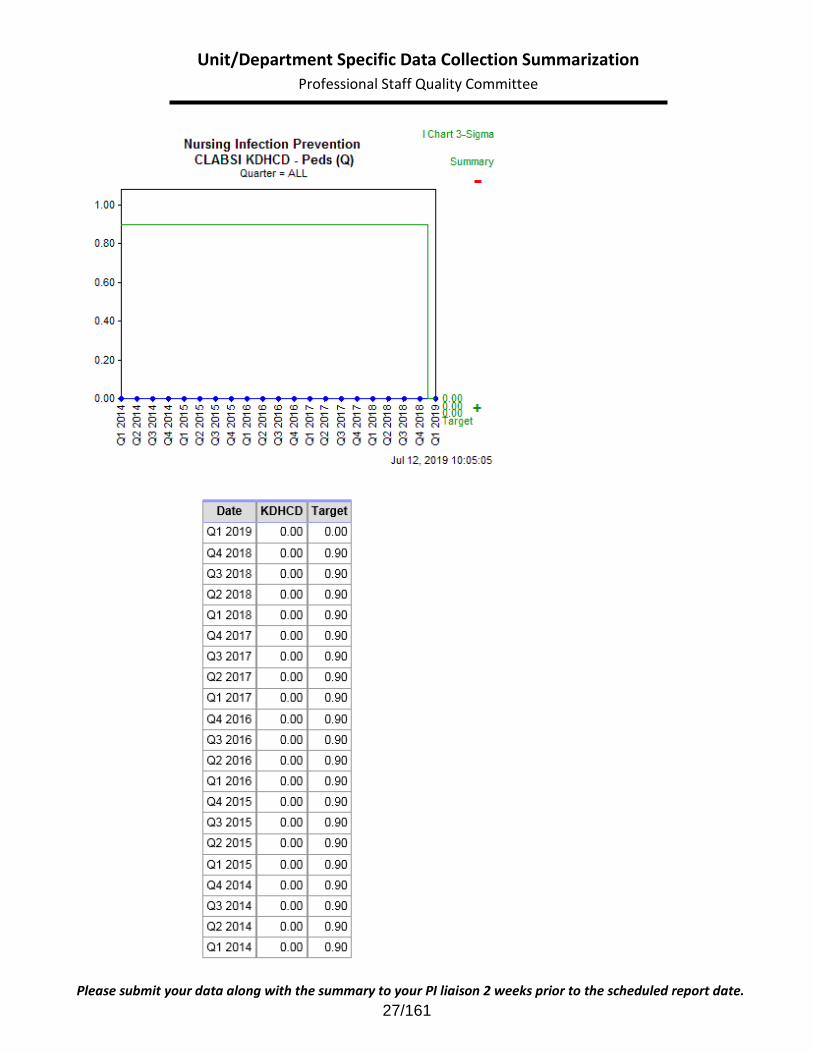
Unit/Department: Pediatrics ProStaff Report Date: July 2019
Measure Objective/Goal:
Central Line Associated Blood Infections
Goal: 0.00
Date range of data evaluated:
January-March 2019
Analysis of all measures/data: (Include key findings, improvements, opportunities)
We had 0 CLABSIs for this quarter. We are performing equal with the benchmark.
If improvement opportunities identified, provide action plan and expected resolution date:
Next Steps/Recommendations/Outcomes:
We will continue to use aseptic technique to perform scheduled dressing and cap changes. We will also continue to evaluate need for central line on a daily basis. Submitted by Name: Date Submitted:
Danielle Grimaldi, RN, BSN, CPN 712/19
Please submit your data along with the summary to your PI liaison 2 weeks prior to the scheduled report date.
26/161
Unit/Department Specific Data Collection Summarization Professional Staff Quality Committee
Please submit your data along with the summary to your PI liaison 2 weeks prior to the scheduled report date.
27/161

Unit/Department Specific Data Collection Summarization Professional Staff Quality Committee
Unit/Department: Pediatrics ProStaff Report Date: July 2019
Measure Objective/Goal:
Falls per 1000 patient days
Goal: 1.35
Date range of data evaluated:
January-March 2019
Analysis of all measures/data: (Include key findings, improvements, opportunities)
We had 0.00 per 1000 patient days for this quarter.
If improvement opportunities identified, provide action plan and expected resolution date:
.
Next Steps/Recommendations/Outcomes:
We will continue to implement fall risk precautions and educate families on safe sleep. We will continue to have parents sign waivers when they decline Safe Sleep. Submitted by Name: Date Submitted:
Danielle Grimaldi, RN, BSN, CPN 07/12/19
Please submit your data along with the summary to your PI liaison 2 weeks prior to the scheduled report date.
28/161

Unit/Department Specific Data Collection Summarization Professional Staff Quality Committee
Please submit your data along with the summary to your PI liaison 2 weeks prior to the scheduled report date.
29/161

Unit/Department Specific Data Collection Summarization Professional Staff Quality Committee
Unit/Department: Pediatrics ProStaff Report Date: July 2019
Measure Objective/Goal:
Percent of PIV infiltrations
Goal: 0.68
Date range of data evaluated:
January- March 2019
Analysis of all measures/data: (Include key findings, improvements, opportunities)
We had 0 PIV infiltrations for this quarter. This is better than the benchmark.
If improvement opportunities identified, provide action plan and expected resolution date:
Next Steps/Recommendations/Outcomes:
We will continue to perform hourly assessments for patients that have continuous infusions running. Submitted by Name: Date Submitted:
Danielle Grimaldi, RN, BSN, CPN 7/12/19
Please submit your data along with the summary to your PI liaison 2 weeks prior to the scheduled report date.
30/161

Unit/Department Specific Data Collection Summarization Professional Staff Quality Committee
Please submit your data along with the summary to your PI liaison 2 weeks prior to the scheduled report date.
31/161

Unit/Department Specific Data Collection Summarization Professional Staff Quality Committee
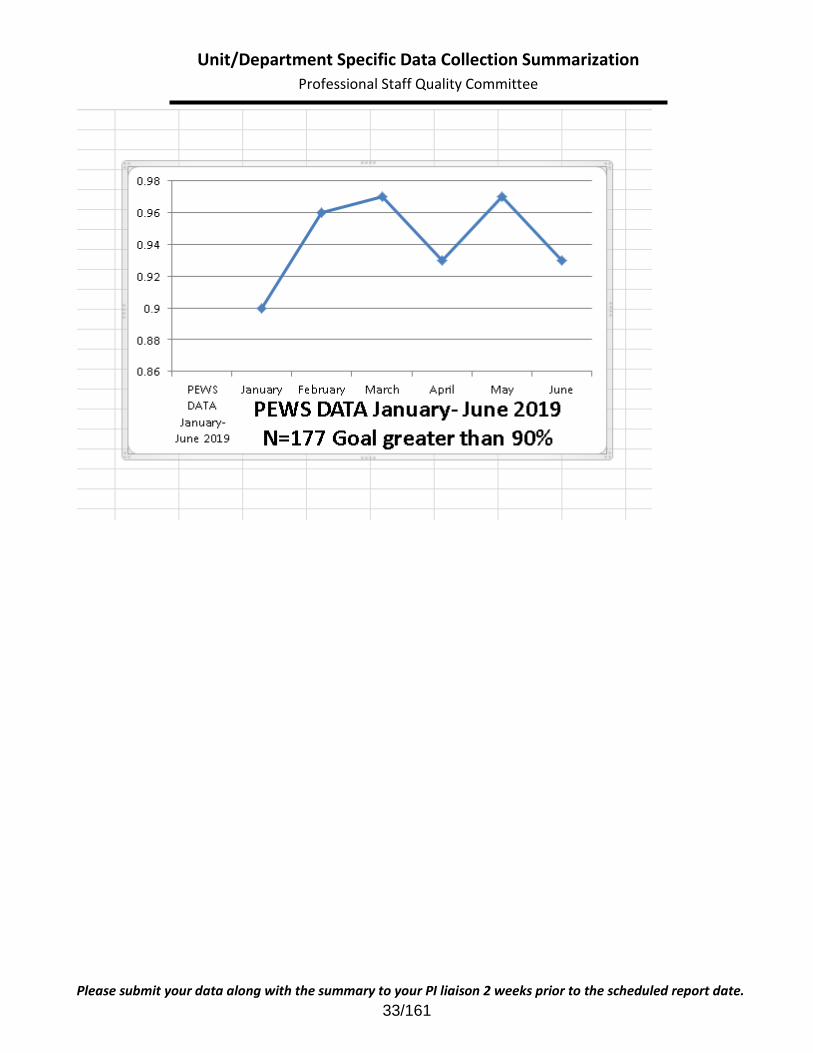
Unit/Department: Pediatrics ProStaff Report Date: July 2019
Measure Objective/Goal:
Percent of PEWS fallouts-PEWS score charted every 4 hours on every patient.
Goal: 90% or greater no fallouts.
Date range of data evaluated:
January-June 2019
Analysis of all measures/data: (Include key findings, improvements, opportunities)
Using data received within the last 180 days, we have had a 94% success rate in PEWS score
being charted every 4 hours. Results are better than benchmark for PEWS score.
If improvement opportunities identified, provide action plan and expected resolution date
Next Steps/Recommendations/Outcomes:
Continue to maintain PEWS scoring greater than 90% expected with next report date.
Submitted by Name: Date Submitted:
Danielle Grimaldi, RN, BSN, CPN 07/12/19
Please submit your data along with the summary to your PI liaison 2 weeks prior to the scheduled report date.
32/161
Unit/Department Specific Data Collection Summarization Professional Staff Quality Committee
Please submit your data along with the summary to your PI liaison 2 weeks prior to the scheduled report date.
33/161

Unit/Department Specific Data Collection Summarization Professional Staff Quality Committee
Unit/Department: Pediatrics ProStaff Report Date: July 2019
Measure Objective/Goal:
Percent of patients with stage 2 or greater HAPI: 0.00
Goal: 0.16
Date range of data evaluated:
January-March 2019
Analysis of all measures/data: (Include key findings, improvements, opportunities)
We had 0 HAPIs stage 2 or greater for this quarter. This is better than the benchmark.
If improvement opportunities identified, provide action plan and expected resolution date:
Next Steps/Recommendations/Outcomes:
We will continue identifying patients at risk for skin breakdown and implement appropriate preventative measures. Submitted by Name: Date Submitted:
Danielle Grimaldi, RN, BSN, CPN 07/12/19
Please submit your data along with the summary to your PI liaison 2 weeks prior to the scheduled report date.
34/161

Unit/Department Specific Data Collection Summarization Professional Staff Quality Committee
Please submit your data along with the summary to your PI liaison 2 weeks prior to the scheduled report date.
35/161
Unit/Department Specific Data Collection Summarization Quality Improvement Committee
Unit/Department: Mother Baby QIC Report Date: July 2019
Measure Objective/Goal:
Monitoring c-section respiratory rates to ensure they are performed and documented as ordered
within the first 24 hours. For this reporting period we are at 92.33% compliance.(Internal 80.0%)
Date range of data evaluated:
January – June 2019
Analysis of all measures/data: (Include key findings, improvements, opportunities)
We currently are performing above the benchmark of 80.0%.
If improvement opportunities identified, provide action plan and expected resolution date:
Education has been provided to the staff and respiratory rate charting is being audited during
bedside report.
Please submit your data along with the summary to your PI liaison 2 weeks prior to the scheduled report date.
36/161

Unit/Department Specific Data Collection Summarization Quality Improvement Committee
Next Steps/Recommendations/Outcomes:
We will continue to monitor this measure until we achieve and sustain a 80% compliance rate. Submitted by Name: Date Submitted:
Melissa Filiponi, RNC-MNN, BSN 07/11/19
Please submit your data along with the summary to your PI liaison 2 weeks prior to the scheduled report date.
37/161

Validated by Cindy Vander Schuur at 06/25/19 14:22
Q2
2015 Q3
2015 Q4
2015 Q1
2016 Q2
2016 Q3
2016 Q4
2016 Q1
2017 Q2
2017 Q3
2017 Q4
2017 Q1
2018 Q2
2018 Q3
2018 Q4
2018 Q1
2019
Falls 0.73 0.41 0.67 0.58 0.45 0.52 0.44 0.46 0.15 0.53 0.54 0.42 0.40 0.43 0.29 0.29
Target 0.49 0.52 0.49 0.48 0.48 0.48 0.47 0.45 0.49 0.45 0.44 0.43 0.43 0.43 0.42 0.52
Description
Owners
Expert Erick Nad
Notes 1
Notes 2
Cautions
Disclaimer
38/161

Unit/Department Specific Data Collection Summarization QIC/Professional Staff Committee Report
Unit/Department: Falls Committee QIC/ProStaff Report Date: September 4, 2019
Measure Objective/Goal:
1. KDHCD Nursing Unit Falls Data:
• Total Falls per 1000 patient days
• Total Injury Falls per 1000 patient days
• Percent of Falls with Moderate to Severe Injury
Date range of data evaluated:
1. KDHCD Q 1, 2019
1
39/161

Unit/Department Specific Data Collection Summarization QIC/Professional Staff Committee Report
Injury Falls Summary 1Q 2019: n/33
Injury Level # Unit
None 23 Multiple
Minor 9 Multiple Moderate 1 Mental Health
Severe 0 n/a
Analysis of all measures/data for Q4, 2018- Q1, 2019: (Include key findings,
improvements, opportunities)
1. KDHCD hospital data:
• Overall, fall metrics remain at or below target for all indicators.
• Total falls per 1000 patient days 1.07, below target (2.23).
• Total injury falls per 1000 patient days 0.29, below target (0.52).
• Percent of falls with moderate or greater injury 3.45 (1 fall), below target (4.17). This injury was a
laceration on the back of the head which required 4 staples to close the wound. It is important to
note 70% of falls were without injury and 27% were minor.
• Seasonal variations in census and patient acuity are typically seen late Q3 through Q1.
• As previously reported, more obvious risk factors are mitigated and plans of care initiated but
some patient populations are emerging as more challenging. Patients and families with behavioral
issues, history of substance abuse and unusual psychosocial issues are proving most difficult to
develop effective plans of care to mitigate the risk for falls.
2
40/161

Unit/Department Specific Data Collection Summarization QIC/Professional Staff Committee Report
If improvement opportunities identified, provide action plan and expected resolution date:
Next Steps/Recommendations/Outcomes:
• Improve onboarding of clinical staff. Various unit-level projects are under way to improve hourly rounding and communication. Explore creation of an enduring class which educates new staff on the pathophysiology of falls and the KDHCD falls prevention program.
• Continue weekly review of falls at Falls University with publication of Falls U Take Aways each week. This continues to be an excellent opportunity to provide real time education and discussion of prevention strategies.
• Reinforcement of unit level accountability: 1) Falls University, 2) inclusion of NDNQI Falls metrics in unit-level QIC reports, 3) review of outliers as appropriate at NPIC and Falls Committee.
• K. Gilmore, NM Urgent Care provided a report to the Falls Committee on fall prevention strategies and identification of at-risk patients within this outpatient setting. At-risk patients are assisted by staff and placed in an observation room. If family is not available, staff remains with the patient. Currently all patients are screened for risk at first contact. Providers are responsible for all discharge instructions. One identified opportunity is to conduct an environmental assessment at the Urgent Care Centers to determine if any other opportunities exist. This will be facilitated by K. Glimore.
• L. McClain, Hospice Director provided a report to the Falls Committee on efforts to decrease falls in this patient population. It is important to note, this population is not included in the NDNQI data submissions. This patient population is a higher risk for falls. A review of their data indicates opportunities for patients at skilled facilities and in the home. A detailed plan of action was provided to the Committee to address these opportunities.
• S. Lee NM 3S, provided a report to the Falls Committee on the work 3S has undertaken after the team identified an uptick of falls for patients on comfort care. The team has developed and implemented a diagnosis-specific action plan for this population. A random audit is currently under way to determine effectiveness of this plan. The results of this audit and effectiveness of this plan will be reported to the Falls Committee in November, 2019.
• A. Baker, NM 4N, provided a report to the Falls Committee re an uptick in falls Jan-June 2019. An analysis of this trend notes several common opportunities: 1) traveler onboarding, 2) bed alarm refusals by patients and 3) patients sitting on the edge of the bed. Action planning under way with update to the Committee in July 2019.
• Evaluate yellow sock options, completed May 2019. After a trial of various sock options, none were found to be superior to the current sock. A recommendation was made to the nursing units by the Falls Committee to replace socks, daily if needed, if the socks were found to be ill-fitting.
• Environmental assessment of adult patient rooms at the Medical Center was completed in May, 2019 in collaboration with Stryker, report pending
Submitted by Name: Date Submitted: Rose Newsom, MSN NE-BC July 17, 2019
Director of Nursing Practice
Falls Committee Chair
3
41/161

Validated by Cindy Vander Schuur at 06/25/19 14:21
Q2
2015 Q3
2015 Q4
2015 Q1
2016 Q2
2016 Q3
2016 Q4
2016 Q1
2017 Q2
2017 Q3
2017 Q4
2017 Q1
2018 Q2
2018 Q3
2018 Q4
2018 Q1
2019
Patient Falls
3.36 2.22 2.47 2.48 2.13 2.64 2.61 2.18 1.72 2.17 2.10 1.91 1.93 1.29 1.43 1.07
Target 2.70 2.72 2.70 2.61 2.54 2.45 2.60 2.56 2.51 2.47 2.46 2.44 2.32 2.22 2.37 2.23
Description
Owners
Expert Erick Nad
Notes 1
Notes 2
Cautions
Disclaimer
42/161
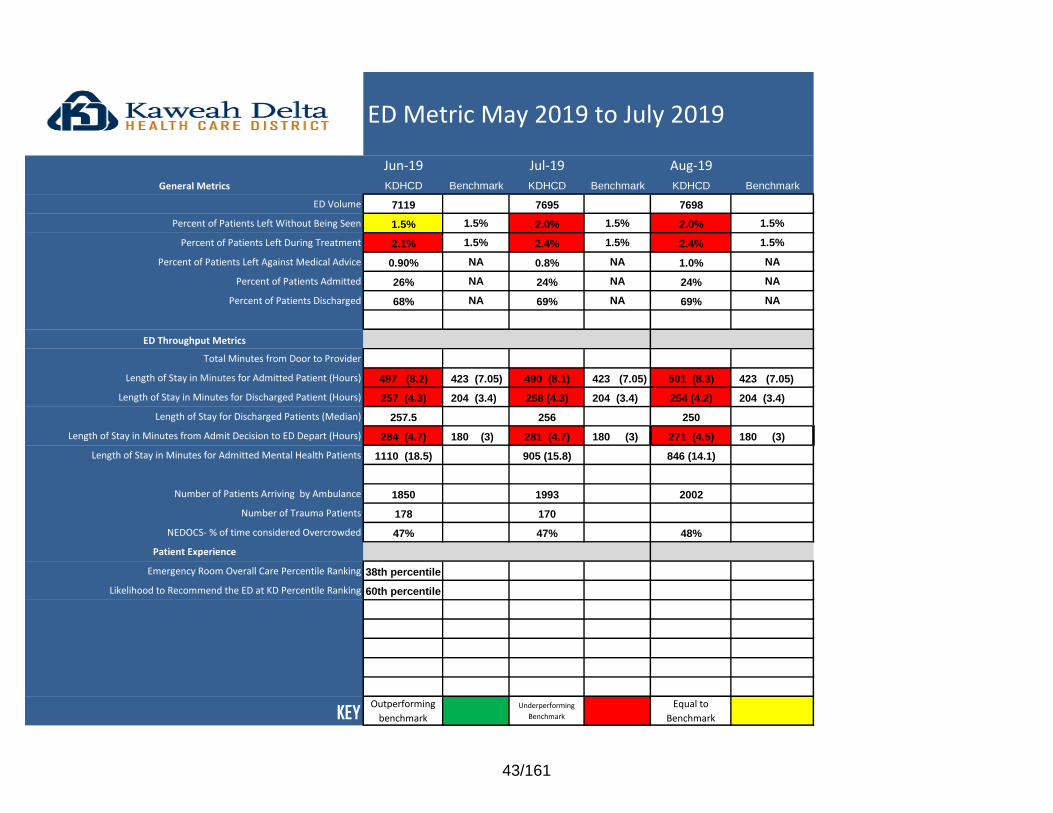
ED Metric May 2019 to July 2019
Jun-19 Jul-19 Aug-19
General Metrics KDHCD Benchmark KDHCD Benchmark KDHCD Benchmark
ED Volume 7119 7695 7698
Percent of Patients Left Without Being Seen 1.5% 1.5% 2.0% 1.5% 2.0% 1.5%
Percent of Patients Left During Treatment 2.1% 1.5% 2.4% 1.5% 2.4% 1.5%
Percent of Patients Left Against Medical Advice 0.90% NA 0.8% NA 1.0% NA
Percent of Patients Admitted 26% NA 24% NA 24% NA
Percent of Patients Discharged 68% NA 69% NA 69% NA
ED Throughput Metrics
Total Minutes from Door to Provider
Length of Stay in Minutes for Admitted Patient (Hours) 497 (8.2) 423 (7.05) 490 (8.1) 423 (7.05) 501 (8.3) 423 (7.05)
Length of Stay in Minutes for Discharged Patient (Hours) 257 (4.3) 204 (3.4) 258 (4.3) 204 (3.4) 254 (4.2) 204 (3.4)
Length of Stay for Discharged Patients (Median) 257.5 256 250
Length of Stay in Minutes from Admit Decision to ED Depart (Hours) 284 (4.7) 180 (3) 281 (4.7) 180 (3) 271 (4.5) 180 (3)
Length of Stay in Minutes for Admitted Mental Health Patients 1110 (18.5) 905 (15.8) 846 (14.1)
Number of Patients Arriving by Ambulance 1850 1993 2002
Number of Trauma Patients 178 170
NEDOCS- % of time considered Overcrowded 47% 47% 48%
Patient Experience
Emergency Room Overall Care Percentile Ranking 38th percentile
Likelihood to Recommend the ED at KD Percentile Ranking 60th percentile
KEYOutperforming
benchmark
Underperforming
Benchmark
Equal to
Benchmark
43/161
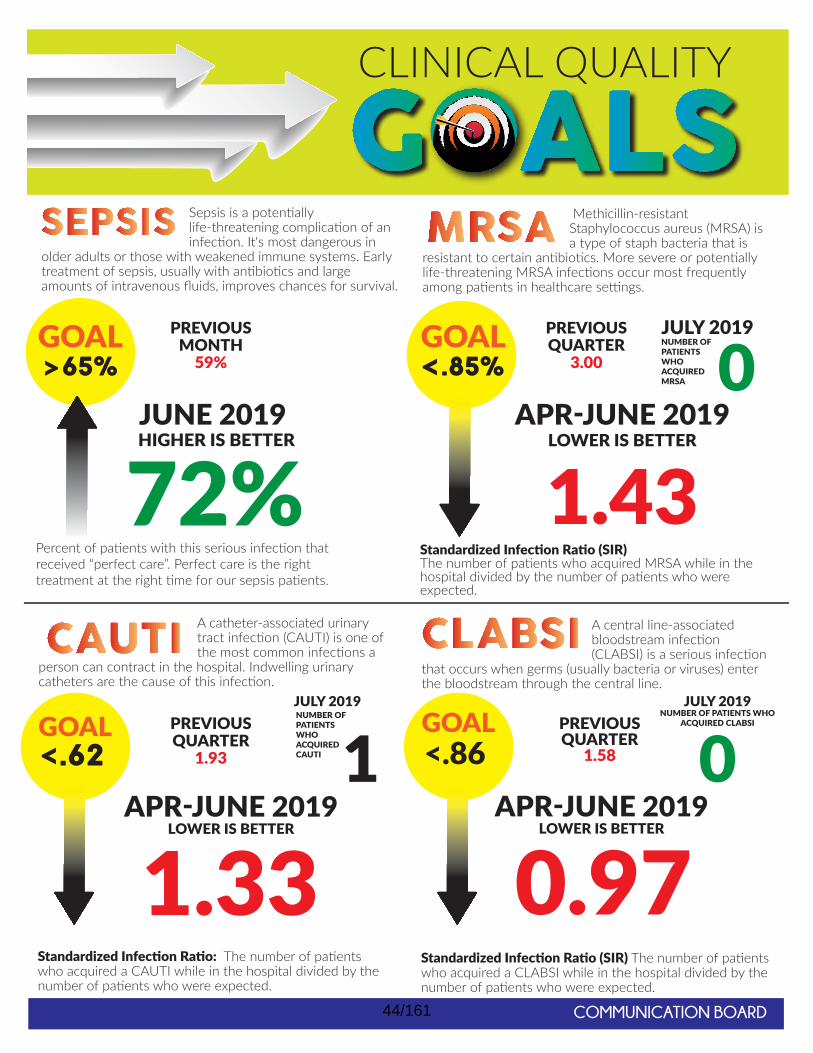
Sepsis is a potentially life-threatening complication of an infection. It's most dangerous in
older adults or those with weakened immune systems. Early treatment of sepsis, usually with antibiotics and large amounts of intravenous fluids, improves chances for survival.
JUNE 2019HIGHER IS BETTER
Percent of patients with this serious infection that received “perfect care”. Perfect care is the right treatment at the right time for our sepsis patients.
Methicillin-resistant Staphylococcus aureus (MRSA) is a type of staph bacteria that is
resistant to certain antibiotics. More severe or potentially life-threatening MRSA infections occur most frequently among patients in healthcare settings.
APR-JUNE 2019LOWER IS BETTER
JULY 2019NUMBER OF PATIENTS WHO ACQUIRED MRSA
Standardized Infection Ratio (SIR)The number of patients who acquired MRSA while in the hospital divided by the number of patients who were expected.
A catheter-associated urinary tract infection (CAUTI) is one of the most common infections a
person can contract in the hospital. Indwelling urinary catheters are the cause of this infection.
Standardized Infection Ratio: The number of patients who acquired a CAUTI while in the hospital divided by the number of patients who were expected.
APR-JUNE 2019LOWER IS BETTER
JULY 2019NUMBER OF PATIENTS WHO ACQUIRED CAUTI
A central line-associated bloodstream infection (CLABSI) is a serious infection
that occurs when germs (usually bacteria or viruses) enter the bloodstream through the central line.
APR-JUNE 2019LOWER IS BETTER
Standardized Infection Ratio (SIR) The number of patients who acquired a CLABSI while in the hospital divided by the number of patients who were expected.
JULY 2019NUMBER OF PATIENTS WHO
ACQUIRED CLABSI
<.86
PREVIOUSMONTH
59%
PREVIOUSQUARTER
3.00
PREVIOUSQUARTER
1.93
PREVIOUSQUARTER
1.58
CLINICAL QUALITY
72% 1.430
1
1.330
0.9744/161

eReports DashboardEnding Timeframe : 2018Q4 Category : ALLParticipant : 906004 - Kaweah Delta Hospital District
Data Submission Status BaseLatest SubmissionJul 11, 2019 6:09:34 PM
2019Q3 2019Q2 2019Q1 2018Q4 2018Q3 2018Q2
Metrics Aggregated on : Apr 16, 2019 11:59:00 PM
PCI Performance Measures1 - PCI in-hospital risk adjusted mortality (all patients)
1.91My Hospital
R4Q Performance1 1.5 2 2.5 3 3.5
10th 25th 50th 75th 90th3.15 2.45 1.87 1.42 1.04
US Hospital R4Q Performance Distribution for 2018Q4
0.51.52.53.54.55.5
2017Q1 2017Q2 2017Q3 2017Q4 2018Q1 2018Q2 2018Q3 2018Q4
4.9
2.08 2.022.97 2.62
1.460.41
2.81
Performance Trend
40 - PCI in-hospital risk standardized rate of bleeding (all patients)
2.49My Hospital
R4Q Performance1.5 2 2.5 3 3.5 4
10th 25th 50th 75th 90th3.79 3.11 2.47 1.99 1.62
US Hospital R4Q Performance Distribution for 2018Q4
2.4
3.2
4.0
4.8
2017Q1 2017Q2 2017Q3 2017Q4 2018Q1 2018Q2 2018Q3 2018Q4
3.053.6
2.47
4.55
2.652.15 2.21
2.9
Performance Trend
©2019 American College of Cardiology FoundationNCDR® CathPCI Registry®
1 of 4 Jul 15, 2019 3:39:45 PM
PCI = Percutaneous Coronary Intervention (Stent or Balloon)
45/161

eReports DashboardEnding Timeframe : 2018Q4 Category : ALLParticipant : 906004 - Kaweah Delta Hospital District
Data Submission Status BaseLatest SubmissionJul 11, 2019 6:09:34 PM
2019Q3 2019Q2 2019Q1 2018Q4 2018Q3 2018Q2
Metrics Aggregated on : Apr 16, 2019 11:59:00 PM
Quality Metrics3 - Median time to immediate PCI (patients with STEMI)
58 min
My HospitalR4Q Performance
45 50 55 60 65 70 75
10th 25th 50th 75th 90th72 66 60 55 49
US Hospital R4Q Performance Distribution for 2018Q4
52.0
56.0
60.0
64.0
68.0
2017Q1 2017Q2 2017Q3 2017Q4 2018Q1 2018Q2 2018Q3 2018Q4
6765
67
54
58
62 62
51
Performance Trend
4 - PCI within 90 minutes (patients with STEMI)
95.37%
My HospitalR4Q Performance
80 85 90 95 100
10th 25th 50th 75th 90th81.29 89.04 94.62 98.17 100
US Hospital R4Q Performance Distribution for 2018Q4
86.0
90.0
94.0
98.0
102.0
2017Q1 2017Q2 2017Q3 2017Q4 2018Q1 2018Q2 2018Q3 2018Q4
88.46
96.3
85.19
95.83
90.91 91.67
100 100
Performance Trend
5 - Median transfer time from door to door (patients with STEMI)
90 min
My HospitalR4Q Performance
40 60 80 100 120
10th 25th 50th 75th 90th118 92 74 61 50
US Hospital R4Q Performance Distribution for 2018Q4
50.0
70.0
90.0
110.0
130.0
2017Q1 2017Q2 2017Q3 2017Q4 2018Q1 2018Q2 2018Q3 2018Q4
87
58
81
120 103
8067
94
Performance Trend
6 - Median time to immediate PCI (transfer patients with STEMI)
149 min
My HospitalR4Q Performance
80 100 120 140 160
10th 25th 50th 75th 90th155 125 106 92 82
US Hospital R4Q Performance Distribution for 2018Q4
100.0
120.0
140.0
160.0
180.0
2017Q1 2017Q2 2017Q3 2017Q4 2018Q1 2018Q2 2018Q3 2018Q4
146
124
169178 159
152
108
149
Performance Trend
8 - Aspirin prescribed at discharge
98.3%
My HospitalR4Q Performance
94 95 96 97 98 99 100
10th 25th 50th 75th 90th94.5 97.2 98.9 99.8 100
US Hospital R4Q Performance Distribution for 2018Q4
96.8
97.6
98.4
99.2
100.0
2017Q1 2017Q2 2017Q3 2017Q4 2018Q1 2018Q2 2018Q3 2018Q4
99.2 99.3
97.2
98.599.6
97.798.3
97.5
Performance Trend
©2019 American College of Cardiology FoundationNCDR® CathPCI Registry®
2 of 4 Jul 15, 2019 3:39:45 PM
STEMI = ST Elevated Myocardial Infarction (Cardiac Alert-Emergency)
Time from transferring ED arrival to arrival at KDHCD
46/161

eReports DashboardEnding Timeframe : 2018Q4 Category : ALLParticipant : 906004 - Kaweah Delta Hospital District
Data Submission Status BaseLatest SubmissionJul 11, 2019 6:09:34 PM
2019Q3 2019Q2 2019Q1 2018Q4 2018Q3 2018Q2
Metrics Aggregated on : Apr 16, 2019 11:59:00 PM
9 - P2Y12 inhibitor prescribed at discharge
99.7%
My HospitalR4Q Performance
96 97 98 99 100
10th 25th 50th 75th 90th96.8 98.4 99.5 100 100
US Hospital R4Q Performance Distribution for 2018Q4
98.298.699.099.499.8
100.2
2017Q1 2017Q2 2017Q3 2017Q4 2018Q1 2018Q2 2018Q3 2018Q4
98.8
100 99.6
98.4
100 99.6
99.1
100
Performance Trend
10 - Statin prescribed at discharge
97.3%
My HospitalR4Q Performance
90 92 94 96 98 100
10th 25th 50th 75th 90th91.6 95.6 98 99.3 100
US Hospital R4Q Performance Distribution for 2018Q4
96.0
97.0
98.0
99.0
100.0
2017Q1 2017Q2 2017Q3 2017Q4 2018Q1 2018Q2 2018Q3 2018Q4
97.798.3
96.597.4
99.6
96.2 96.1
97.1
Performance Trend
16 - Intra/post-procedure stroke
0.1%
My HospitalR4Q Performance
0 0.2 0.4 0.6 0.8 1
10th 25th 50th 75th 90th0.8 0.4 0.1 0 0
US Hospital R4Q Performance Distribution for 2018Q4
0.0
0.2
0.2
0.4
0.4
2017Q1 2017Q2 2017Q3 2017Q4 2018Q1 2018Q2 2018Q3 2018Q4
0.3
0
0.3 0.4
0
0.4
0 0
Performance Trend
17 - Composite: Major adverse events (all patients)
2.72%
My HospitalR4Q Performance
0 1 2 3 4 5
10th 25th 50th 75th 90th4.63 3.6 2.61 1.74 0.84
US Hospital R4Q Performance Distribution for 2018Q4
0.51.52.53.54.55.5
2017Q1 2017Q2 2017Q3 2017Q4 2018Q1 2018Q2 2018Q3 2018Q4
4.612.28
3.37 4.983.09 2.92
0.41
4.26
Performance Trend
18 - PCI in-hospital risk adjusted mortality (patients with STEMI)
6.43My Hospital
R4Q Performance2 4 6 8 10 12
10th 25th 50th 75th 90th11 8.14 6.2 4.49 3.24
US Hospital R4Q Performance Distribution for 2018Q4
2.0
6.0
10.0
14.0
2017Q1 2017Q2 2017Q3 2017Q4 2018Q1 2018Q2 2018Q3 2018Q4
11.916.71
8.16 12.01
5.88 5.24
2.1
11.3
Performance Trend
19 - PCI in-hospital risk adjusted mortality (STEMI patients excluded)
0.97My Hospital
R4Q Performance0.5 1 1.5 2 2.5
10th 25th 50th 75th 90th2.25 1.57 1.07 0.74 0.51
US Hospital R4Q Performance Distribution for 2018Q4
0.8
1.6
2.4
3.2
4.0
2017Q1 2017Q2 2017Q3 2017Q4 2018Q1 2018Q2 2018Q3 2018Q4
3.68
1.110.79 0.79
2.08
0.73 0.91
Performance Trend
©2019 American College of Cardiology FoundationNCDR® CathPCI Registry®
3 of 4 Jul 15, 2019 3:39:45 PM
47/161

eReports DashboardEnding Timeframe : 2018Q4 Category : ALLParticipant : 906004 - Kaweah Delta Hospital District
Data Submission Status BaseLatest SubmissionJul 11, 2019 6:09:34 PM
2019Q3 2019Q2 2019Q1 2018Q4 2018Q3 2018Q2
Metrics Aggregated on : Apr 16, 2019 11:59:00 PM
22 - Median post-procedure length of stay (patients with STEMI)
3 Day
My HospitalR4Q Performance
1.6 1.8 2 2.2 2.4 2.6 2.8 3
10th 25th 50th 75th 90th2.9 2.7 1.9 1.7 1.6
US Hospital R4Q Performance Distribution for 2018Q4
2.0
2.4
2.8
3.2
2017Q1 2017Q2 2017Q3 2017Q4 2018Q1 2018Q2 2018Q3 2018Q4
3 3 3 3
2
3 3
2
Performance Trend
25 - Transfusion post PCI
1.85%
My HospitalR4Q Performance
0 0.5 1 1.5 2 2.5
10th 25th 50th 75th 90th2.05 1.39 0.82 0.27 0
US Hospital R4Q Performance Distribution for 2018Q4
1.21.62.02.42.83.2
2017Q1 2017Q2 2017Q3 2017Q4 2018Q1 2018Q2 2018Q3 2018Q4
2.092.96
1.69
2.5 2.371.95
1.321.63
Performance Trend
39 - PCI in-hospital risk adjusted acute kidney injury (all patients)
6.88My Hospital
R4Q Performance2 4 6 8 10
10th 25th 50th 75th 90th9.99 8.22 6.47 4.82 3.03
US Hospital R4Q Performance Distribution for 2018Q4
4.0
6.0
8.0
10.0
12.0
2017Q1 2017Q2 2017Q3 2017Q4 2018Q1 2018Q2 2018Q3 2018Q4
7.33
9.61
6.11
7.8611.11
5.47 5.954.42
Performance Trend
45 - Cardiac rehabilitation referral
45.3%
My HospitalR4Q Performance
0 20 40 60 80 100
10th 25th 50th 75th 90th3.5 39.4 81.1 95.7 99.3
US Hospital R4Q Performance Distribution for 2018Q4
32.036.040.044.048.052.0
2017Q1 2017Q2 2017Q3 2017Q4 2018Q1 2018Q2 2018Q3 2018Q4
49.8
33.9
51.4
Performance Trend
©2019 American College of Cardiology FoundationNCDR® CathPCI Registry®
4 of 4 Jul 15, 2019 3:39:45 PM
48/161

Kaweah Delta Health Care District 1
Q1 Q2 Q3 Q4AVG. or
TOTAL YTDSUMMARY / ACTION
I. Overall Surgical Site Infections (SSI) IR/SIR SSIs calculated internally though standard incidence
rate and externally through Standardized Infection
Ratio (SIR) from National Health and Safety Network
(NHSN).
A. #Total Procedure Count 1458 1034 Annual running total: 2492
B. Total Infection Count
[note: SSI events can be identified up to 90 days from
the last day of the month in each quarter]
5 9 1st QTR: 5 Predicted: 17.45
2nd QTR: Predicted:
C. Incidence Rate (IR)
[# of total SSI infections/# total procedures x 100]
Internal
0.70 Goal
0.34 0 1st QTR: Well exceeded the District's goal of 0.70 SSI
incidence rate - 36% better.
2nd QTR:
D. SIR Confidence Interval
(CI-KDHCD predicted range, based on risks)
0.105 -
0.635
1st QTR: Better than California 2017 SSI Benchmark
of 0.89. [Benchmark provided by CDPH 2017 Annual
Report for overall top performance]
2nd QTR:
E. Standardized Infection Ratio (SIR) NHSN 0.29 0 1st QTR: SB, FUSN x 2, KPRO, FX, CHOL, PACE,
COLO, VHYS, CSEC, CBGB (6 of these events were
superficial and are not counted by CMS or by CDPH
for public reporting)
2nd QTR: COLO x 2, HPRO, CHOL, FUSN, HER,
BRST, CSEC, HYSTF. Action Plan for Improvement 1st QTR: Scripting for 3 different Time-Out sessions
almost complete (1st pre-op antibiotic administration
check; 2nd universal timeout; 3rd debrief timeout
verfiy whether a change in wound status occurred).
Pursuuing questions about clean closure for
colorectal surgeries - some surgeons have
resevations about the process, whether or not it is an
effective process for reducing SSI (it is supported by
data meta-analysis and described prevention
guidelines).
2nd QTR: Clean closure for gastrointestinal
procedures now supported by all surgeons. Timely
pre-op antibiotic administration improved slightly.
Hematomas were involved in SSI development for 2
events. Anastomosis leaks identified as potential
source of 2 SSI events. Endogenous skin flora and
care of the incision at home post-operatively is also
suspected as source of infections for remaining SSI
events. II. Specific Surgical Review SIR
A. Colon Surgery (COLO) CMS/VBP
1. #Total Procedure Count 53 34 Annual running total: 140
Infection Prevention and Control Committee - IP Quality Improvement Dashboard CY 2019
49/161
Kaweah Delta Health Care District 2
Q1 Q2 Q3 Q4AVG. or
TOTAL YTDSUMMARY / ACTION
Infection Prevention and Control Committee - IP Quality Improvement Dashboard CY 2019
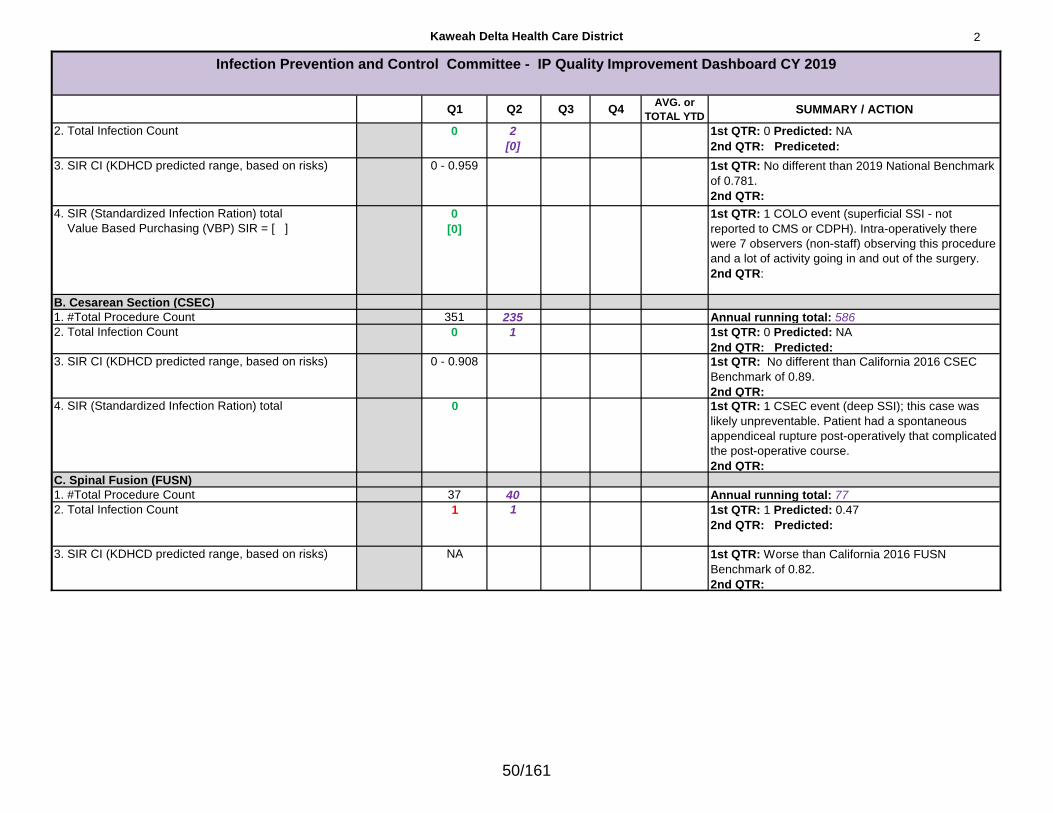
2. Total Infection Count 0 2
[0]
1st QTR: 0 Predicted: NA
2nd QTR: Prediceted:
3. SIR CI (KDHCD predicted range, based on risks) 0 - 0.959 1st QTR: No different than 2019 National Benchmark
of 0.781.
2nd QTR:
4. SIR (Standardized Infection Ration) total
Value Based Purchasing (VBP) SIR = [ ]
0
[0]
1st QTR: 1 COLO event (superficial SSI - not
reported to CMS or CDPH). Intra-operatively there
were 7 observers (non-staff) observing this procedure
and a lot of activity going in and out of the surgery.
2nd QTR:
B. Cesarean Section (CSEC)
1. #Total Procedure Count 351 235 Annual running total: 586
2. Total Infection Count 0 1 1st QTR: 0 Predicted: NA
2nd QTR: Predicted: 3. SIR CI (KDHCD predicted range, based on risks) 0 - 0.908 1st QTR: No different than California 2016 CSEC
Benchmark of 0.89.
2nd QTR: 4. SIR (Standardized Infection Ration) total 0 1st QTR: 1 CSEC event (deep SSI); this case was
likely unpreventable. Patient had a spontaneous
appendiceal rupture post-operatively that complicated
the post-operative course.
2nd QTR:
C. Spinal Fusion (FUSN)
1. #Total Procedure Count 37 40 Annual running total: 77
2. Total Infection Count 1 1 1st QTR: 1 Predicted: 0.47
2nd QTR: Predicted:
3. SIR CI (KDHCD predicted range, based on risks) NA 1st QTR: Worse than California 2016 FUSN
Benchmark of 0.82.
2nd QTR:
50/161

Kaweah Delta Health Care District 3
Q1 Q2 Q3 Q4AVG. or
TOTAL YTDSUMMARY / ACTION
Infection Prevention and Control Committee - IP Quality Improvement Dashboard CY 2019
4. SIR (Standardized Infection Ration) total 2.12
[2.12]
1st QTR: 2 FUSN events (2 deep SSI); A trend was
identified with this particular type of SSI event. Spinal
Fusion patients are transferred from the acute care
setting to the District's long-term rehab facility.
Identified a gap in continuity-of-care through
communication of discharge orders, specialists do not
follow their patients to long-term care rehab and will
not be consulted regarding surgical wound healing
and evaluation. Long-term care rehab nurses are
unfamiliar with some interventions related to the SSI
prevention bundle. Neurosurgery and Orthopedic
service line representatives will now be attending SSI
Prevention Committee. A midlevel practioner from the
orthopedic service line will now follow patients to lont-
term rehab to assess incision sites and consult. Long-
term rehab nurses will be reintroduced to SSI
Prevention Bundle interventions as a part of annual
compentency training.
2nd QTR:
D. Hysterectomy (HYST) CMS/VBP
1. #Total Procedure Count 23 17 Annual running total: 40
2. Total Infection Count 0 1
[0]
1st QTR: 0 Predicted: NA
2nd QTR: Predicted:
3. SIR CI (KDHCD predicted range, based on risks) NA 1st QTR: Better than 2018 Benchmark of 0.722.
2nd QTR: 4. SIR (Standardized Infection Ration) total
Value Based Purchasing (VBP) SIR = [ ]
0
[0]
1st QTR: No events.
2nd QTR:
II. Ventilator Associated Events (VAE) SIR
A. Ventilator Device Use
SUR (standardized utilization ratio)
1.23 1.519 1st QTR: 758vd Predicted: 615.75vd
2nd QTR:781vd Predicted: 514.09vd
B. Total VAEs ICU (NHSN Reportable) Includes
IVAC Plus
4 5 1st QTR: 4 Predicted: 3.97
2nd QTR: 5 Predicted: 4.08
1. SIR Total VAE CI
(KDHCD predicted range, based on risks)
0.320 -
2.432
0.448-
2.711
This is an internal quality driven metric. A State or
National benchmark has not been made available.
2. Total VAEs SIR 1.35 2.62 1st QTR: ICU had 2 VAC, 1 IVAC, 1 PVAP events.
2nd QTR: ICU had 3 VAC, 3 IVAC, 1 PVAP events
C. Total IVAC Plus -ICU 2 4 1st QTR: 2 Predicted: 1.48
2nd QTR: 4 Predicted: 2.62
51/161

Kaweah Delta Health Care District 4
Q1 Q2 Q3 Q4AVG. or
TOTAL YTDSUMMARY / ACTION
Infection Prevention and Control Committee - IP Quality Improvement Dashboard CY 2019
1. Total IVAC Plus CI
(KDHCD predicted range, based on risks)
0.226 -
4.455
0.832-
6.314
This is an internal quality driven metric. A State or
National benchmark has not been made available.
2. Total IVAC Plus ICU SIR 1.01 2.617 1st QTR: 2 PVAP events
2nd QTR: 1 PVAP event
D. CVICU/KDHCD Total VAEs (not NHSN/Internal) 2 5 1st QTR: 1 PVAP event
2nd QTR: 2 VAC & 1 IVAC event
E. Total VAEs-Both Units 6 10 1st QTR: 3 VAC,1 IVAC, 2 PVAP; pursuuing
implementation of subglottic suctioning, and
scheduled oral care.
2nd QTR: 5 VAC, 4 IVAC, 1 PVAP; pursuuing
methods to reduce VAC events thereby reducing
IVAC plus events.III. Central Line Associated Blood Stream Infections
(CLABSI) CMS/VBP
NHSN SIR
A. Total number of Central Line Days (CLD) 3648 3496 Annual running total: 7144
B. Central Line Device Use SUR
(standardized utilization ratio)
0.76 0.72 1st QTR: 3648 Predicted: 4,787.70
2nd QTR: 3496 Predicted: 4,814.87
C. Total Infection Count
Valule Based Purchasing (VBP) # events = [ ]
5
[4]
3
[2]
1st QTR: 5 Predicted: 3.17
2nd QTR: 3 Predicted: 3.21
D. SIR Confidence Interval 0.577 -
3.492
0.238 -
2.543
1st QTR: No different than 2019 National Benchmark
of 0.784.
2nd QTR: No different than 2019 National
Benchmark of 0.784.
52/161
Kaweah Delta Health Care District 5
Q1 Q2 Q3 Q4AVG. or
TOTAL YTDSUMMARY / ACTION
Infection Prevention and Control Committee - IP Quality Improvement Dashboard CY 2019
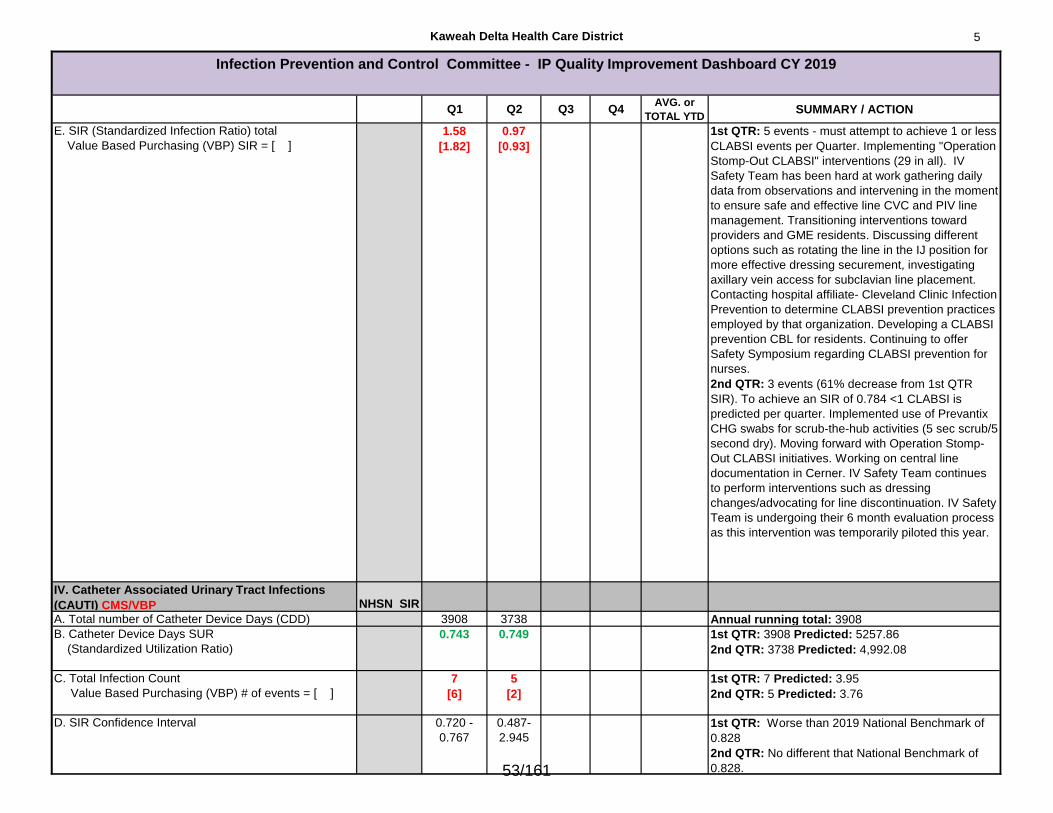
E. SIR (Standardized Infection Ratio) total
Value Based Purchasing (VBP) SIR = [ ]
1.58
[1.82]
0.97
[0.93]
1st QTR: 5 events - must attempt to achieve 1 or less
CLABSI events per Quarter. Implementing "Operation
Stomp-Out CLABSI" interventions (29 in all). IV
Safety Team has been hard at work gathering daily
data from observations and intervening in the moment
to ensure safe and effective line CVC and PIV line
management. Transitioning interventions toward
providers and GME residents. Discussing different
options such as rotating the line in the IJ position for
more effective dressing securement, investigating
axillary vein access for subclavian line placement.
Contacting hospital affiliate- Cleveland Clinic Infection
Prevention to determine CLABSI prevention practices
employed by that organization. Developing a CLABSI
prevention CBL for residents. Continuing to offer
Safety Symposium regarding CLABSI prevention for
nurses.
2nd QTR: 3 events (61% decrease from 1st QTR
SIR). To achieve an SIR of 0.784 <1 CLABSI is
predicted per quarter. Implemented use of Prevantix
CHG swabs for scrub-the-hub activities (5 sec scrub/5
second dry). Moving forward with Operation Stomp-
Out CLABSI initiatives. Working on central line
documentation in Cerner. IV Safety Team continues
to perform interventions such as dressing
changes/advocating for line discontinuation. IV Safety
Team is undergoing their 6 month evaluation process
as this intervention was temporarily piloted this year.
IV. Catheter Associated Urinary Tract Infections
(CAUTI) CMS/VBP NHSN SIR
A. Total number of Catheter Device Days (CDD) 3908 3738 Annual running total: 3908
B. Catheter Device Days SUR
(Standardized Utilization Ratio)
0.743 0.749 1st QTR: 3908 Predicted: 5257.86
2nd QTR: 3738 Predicted: 4,992.08
C. Total Infection Count
Value Based Purchasing (VBP) # of events = [ ]
7
[6]
5
[2]
1st QTR: 7 Predicted: 3.95
2nd QTR: 5 Predicted: 3.76
D. SIR Confidence Interval 0.720 -
0.767
0.487-
2.945
1st QTR: Worse than 2019 National Benchmark of
0.828
2nd QTR: No different that National Benchmark of
0.828.
53/161

Kaweah Delta Health Care District 6
Q1 Q2 Q3 Q4AVG. or
TOTAL YTDSUMMARY / ACTION
Infection Prevention and Control Committee - IP Quality Improvement Dashboard CY 2019
E. SIR (Standardized Infection Ratio) total
Value Based Purchasing (VBP) SIR = [ ]
1.77
[2.89]
1.33
[0.87]
1st QTR: Many of these events are due to keeping
the indwelling urinary catheter longer than indicated;
collecting urine cultures when not indicated.
Approvals are occuring for implementation of a new
order set for Urine Cultures (to help ensure when
cultures are ordered they are really indicated), also
implementation of a CAUTI algorithim will be starting
soon. Considering dual nurse insertion of indwelling
urinary catheters to reduce risk of contamination
during insertion.
2nd QTR: Urinalysis orderset implemented, however,
provider have not used it frequently as it hasn't been
added to their favorites in Cerner, ISS is working to
address this. CAUTI prevention algorithm has been
added to the Nursing Standard of Practice which is
still under revision. CAUTI prevention algorithm will
be added to physician ordersets so that nursing has
greaterly flexibility to inact appropriate measures
without waiting for physician approval to do so.
V. Clostridium difficile Infection (CDI) CMS/VBP SIR
A. Total Infection Count All units 5
[5]
3
[3]
1st QTR: 5 Predicted: 16.93
2nd QTR: 3 Predicted: 15.62
B. SIR CI (KDHCD predicted range, based on risks) 0.108 -
0.655
0.049-
0.523
1st QTR: Better than 2019 National Benchmark of
0.852
2nd QTR: Better than 2019 National Benchmark of
0.852.C. SIR (Standardized Infection Ratio) total
Value Based Purchasing (VBP) SIR = [ ]
0.3
[0.30]
0.19
[0.19]
1st QTR: Continued implementation of the C. diff.
algorithm, interventions provided by Antimicrobial
Stewardship Pharmacist and Infection Prevention.
2nd QTR: Incredible work done to consistently
maintain a low C. difficile rate to interventions
described during 1st QTR. VI. Hand Hygiene 95%
A. All units
Percentage of correct Hand Hygiene
observations/opportunities (30 observations/month/unit)
88% 90% 1st QTR: 3,397 of 3,877 hand hygiene observations
were compliant.
2nd QTR: 3,547 of 3,938 hand hygiene observations
were compliant.
VII. VRE (HAI) Blood-Hospital Onset (HO) BM
A. Total Infection Count 0 0 1st QTR: 0 Predicted: 0
2nd QTR: 0 Predicted: 0
B. Prevalence Rate (x100) 0 0 1st QTR: 0
2nd QTR: 0C. Number Admissions 7236 4984
54/161
Kaweah Delta Health Care District 7
Q1 Q2 Q3 Q4AVG. or
TOTAL YTDSUMMARY / ACTION
Infection Prevention and Control Committee - IP Quality Improvement Dashboard CY 2019
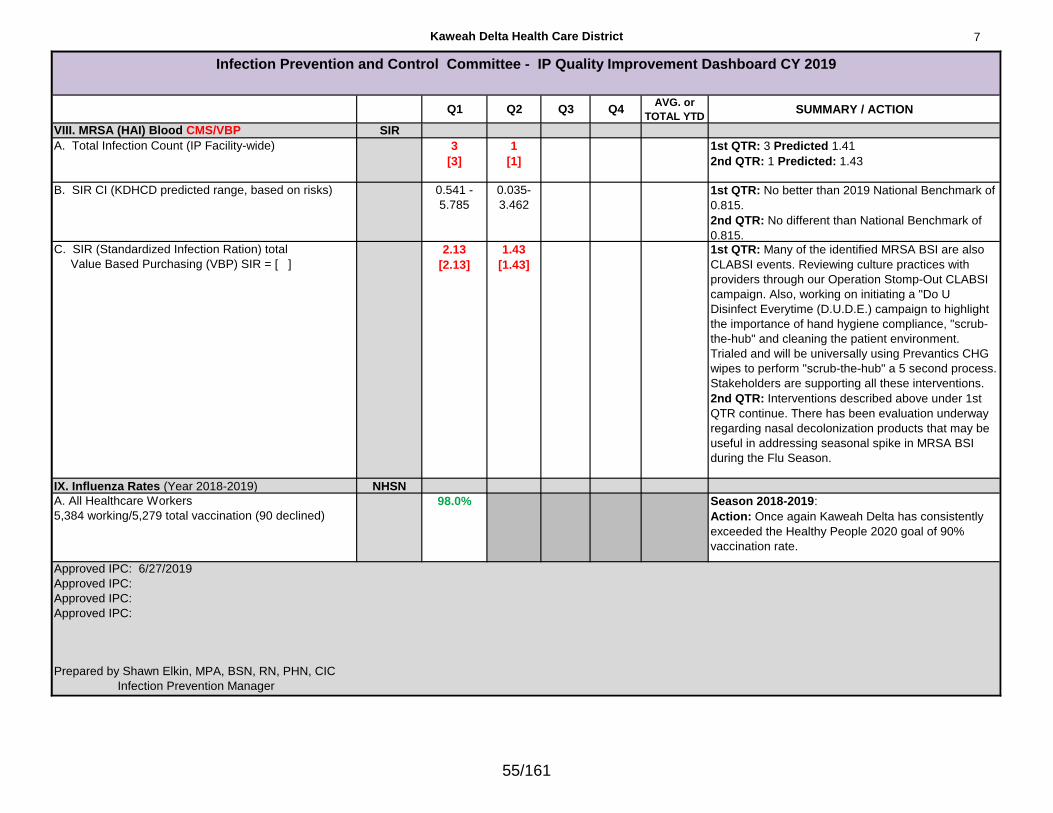
VIII. MRSA (HAI) Blood CMS/VBP SIR
A. Total Infection Count (IP Facility-wide) 3
[3]
1
[1]
1st QTR: 3 Predicted 1.41
2nd QTR: 1 Predicted: 1.43
B. SIR CI (KDHCD predicted range, based on risks) 0.541 -
5.785
0.035-
3.462
1st QTR: No better than 2019 National Benchmark of
0.815.
2nd QTR: No different than National Benchmark of
0.815.C. SIR (Standardized Infection Ration) total
Value Based Purchasing (VBP) SIR = [ ]
2.13
[2.13]
1.43
[1.43]
1st QTR: Many of the identified MRSA BSI are also
CLABSI events. Reviewing culture practices with
providers through our Operation Stomp-Out CLABSI
campaign. Also, working on initiating a "Do U
Disinfect Everytime (D.U.D.E.) campaign to highlight
the importance of hand hygiene compliance, "scrub-
the-hub" and cleaning the patient environment.
Trialed and will be universally using Prevantics CHG
wipes to perform "scrub-the-hub" a 5 second process.
Stakeholders are supporting all these interventions.
2nd QTR: Interventions described above under 1st
QTR continue. There has been evaluation underway
regarding nasal decolonization products that may be
useful in addressing seasonal spike in MRSA BSI
during the Flu Season.
IX. Influenza Rates (Year 2018-2019) NHSN
A. All Healthcare Workers
5,384 working/5,279 total vaccination (90 declined)
98.0% Season 2018-2019:
Action: Once again Kaweah Delta has consistently
exceeded the Healthy People 2020 goal of 90%
vaccination rate.
Approved IPC: 6/27/2019
Approved IPC:
Approved IPC:
Approved IPC:
Prepared by Shawn Elkin, MPA, BSN, RN, PHN, CIC
Infection Prevention Manager
55/161