NOTES TO THE ANNUAL FINANCIAL STATEMENTS€¦ · NOTES TO THE ANNUAL FINANCIALfiSTATEMENTS...
35
NOTES TO THE ANNUAL FINANCIAL STATEMENTS FOR THE YEAR ENDED 31 AUGUST Group 2018 R’000 2017 R’000 1 Revenue Turnover 29 239 688 26 809 101 Financial income 25 757 10 501 Other income 1 717 147 1 523 005 Distribution and logistics fees 792 482 683 022 Rental income 419 437 Advertising income, cost recoveries and other 924 246 839 546 30 982 592 28 342 607 2 Depreciation and amortisation Depreciation of property, plant and equipment (see note 9) 289 239 259 657 Amortisation of intangible assets (see note 10) 49 903 37 409 Total depreciation and amortisation 339 142 297 066 Depreciation included in cost of merchandise sold and inventories (19 166) (13 839) Depreciation and amortisation included in expenses 319 976 283 227 3 Occupancy costs Operating leases 851 144 746 130 Turnover rental expense 69 144 46 255 Movement in operating lease liability (see note 24) 9 113 2 617 Movement in provision for onerous contracts (see note 26) (1 740) (206) 927 661 794 796 4 Employment costs Directors’ emoluments (excluding incentives, see note 4.1) 23 933 21 630 Non-executive fees 3 773 3 210 Executive 20 160 18 420 Salary 18 685 17 182 Other benefits 1 475 1 238 Equity-settled share option costs (see note 20) 50 752 58 909 Long-term incentive scheme – TSR (see note 23) 191 857 149 020 Release of gain on cash flow hedge to profit or loss (see note 21) (160 386) (123 779) Long-term incentive scheme – HEPS (see note 23) 56 144 49 113 Staff salaries and wages 2 731 521 2 477 494 Contributions to defined contribution plans 155 178 143 419 Leave pay costs (see note 23) 12 787 16 480 Bonuses (see note 23) 146 727 151 931 Increase in liability for defined benefit plans (see note 23) 1 304 1 074 Total employment costs 3 209 817 2 945 291 Employment costs included in cost of merchandise sold and inventories (114 972) (99 453) Employment costs included in expenses 3 094 845 2 845 838 For further detail of directors’ emoluments refer to rewarding value creation on pages 75 to 77 of the integrated annual report or note 4.1. Included in total employment costs are the following aggregate amounts (including directors’ emoluments) relating to transactions with key management personnel: 184 357 168 049 Short-term employee benefits 31 895 28 944 Post-employment benefits 2 578 2 217 Short-term incentive scheme 15 940 14 055 Long-term incentive scheme 133 944 122 743 Share-based payments – 90 Non-executive directors’ fees 3 773 3 210 188 130 171 259 – 29 – Clicks Group Audited Annual Financial Statements 2018
Transcript of NOTES TO THE ANNUAL FINANCIAL STATEMENTS€¦ · NOTES TO THE ANNUAL FINANCIALfiSTATEMENTS...

NOTES TO THE ANNUAL FINANCIAL STATEMENTSFOR THE YEAR ENDED 31 AUGUST
Group2018
R’0002017
R’0001 Revenue
Turnover 29 239 688 26 809 101 Financial income 25 757 10 501 Other income 1 717 147 1 523 005
Distribution and logistics fees 792 482 683 022 Rental income 419 437 Advertising income, cost recoveries and other 924 246 839 546
30 982 592 28 342 607
2 Depreciation and amortisationDepreciation of property, plant and equipment (see note 9) 289 239 259 657 Amortisation of intangible assets (see note 10) 49 903 37 409 Total depreciation and amortisation 339 142 297 066 Depreciation included in cost of merchandise sold and inventories (19 166) (13 839)Depreciation and amortisation included in expenses 319 976 283 227
3 Occupancy costsOperating leases 851 144 746 130 Turnover rental expense 69 144 46 255 Movement in operating lease liability (see note 24) 9 113 2 617 Movement in provision for onerous contracts (see note 26) (1 740) (206)
927 661 794 796
4 Employment costsDirectors’ emoluments (excluding incentives, see note 4.1) 23 933 21 630
Non-executive fees 3 773 3 210 Executive 20 160 18 420
Salary 18 685 17 182 Other benefits 1 475 1 238
Equity-settled share option costs (see note 20) 50 752 58 909 Long-term incentive scheme – TSR (see note 23) 191 857 149 020 Release of gain on cash flow hedge to profit or loss (see note 21) (160 386) (123 779)Long-term incentive scheme – HEPS (see note 23) 56 144 49 113 Staff salaries and wages 2 731 521 2 477 494 Contributions to defined contribution plans 155 178 143 419 Leave pay costs (see note 23) 12 787 16 480 Bonuses (see note 23) 146 727 151 931 Increase in liability for defined benefit plans (see note 23) 1 304 1 074 Total employment costs 3 209 817 2 945 291 Employment costs included in cost of merchandise sold and inventories (114 972) (99 453)Employment costs included in expenses 3 094 845 2 845 838
For further detail of directors’ emoluments refer to rewarding value creation on pages 75 to 77 of the integrated annual report or note 4.1.
Included in total employment costs are the following aggregate amounts (including directors’ emoluments) relating to transactions with key management personnel:
184 357 168 049 Short-term employee benefits 31 895 28 944 Post-employment benefits 2 578 2 217 Short-term incentive scheme 15 940 14 055 Long-term incentive scheme 133 944 122 743 Share-based payments – 90
Non-executive directors’ fees 3 773 3 210 188 130 171 259
– 29 –Clicks Group Audited Annual Financial Statements 2018

NOTES TO THE ANNUAL F INANCIAL STATEMENTS (CONTINUED)
FOR THE YEAR ENDED 31 AUGUST
4 Employment costs (continued)4.1 Directors’ remuneration
Executive directors’ remuneration
Director(R’000) Salary
Pension fund
Other benefits
Total annual
guaran-teed pay
RONA short-
term incentive
Per-fomance-
based long-term incentive*
Total variable
pay Total
2018
Bertina Engelbrecht 3 489 411 – 3 900 1 560 17 453 19 013 22 913
Michael Fleming 5 287 356 57 5 700 2 280 25 268 27 548 33 248
David Kneale** 9 909 649 2 10 560 6 336 52 800 59 136 69 696
Total 18 685 1 416 59 20 160 10 176 95 521 105 697 125 857
2017
Bertina Engelbrecht 3 220 380 – 3 600 1 508 17 081 18 589 22 189
Michael Fleming 4 879 284 57 5 220 2 186 25 883 28 069 33 289
David Kneale** 9 083 515 2 9 600 6 031 48 000 54 031 63 631
Total 17 182 1 179 59 18 420 9 725 90 964 100 689 119 109
* Payments relating to the performance for the year ended 31 August are paid in November. The expense is provided over the three-year vesting period in the relevant financial year
** The LTI payment to Mr Kneale has been capped at five times annual guaranteed pay, in accordance with the rules of the scheme
The total number of ordinary shares in issue is 253 948 352 (2017: 245 968 968). The percentage of issued share capital held by directors is 0.20% (2017: 0.22%).
Details of all dealings in Clicks Group Limited shares by directors during the financial year are contained in the directors’ report on page 2 and directors’ shareholdings are set out on page 69, which has been audited.
Non-executive directors’ remuneration
Director
2018Directors’
fees(R’000)
2017Directors’
fees(R’000)
David Nurek 1 169 1 059
Fatima Abrahams* 630 459
John Bester 647 581
Nonkululeko Gobodo 450 213
Fatima Daniels** 523 408
Nkaki Matlala*** – 161
Martin Rosen 354 329
Total 3 773 3 210
Total directors’ remuneration
Executive directors 125 857 119 109
Non-executive directors 3 773 3 210
Total directors’ remuneration 129 630 122 319
* The fees paid to Professor Abrahams include an amount of R78 150 (2017: R24 610) for performing the role of chairperson of The Clicks Group Employee Share Ownership Trust and R72 917 (2017: nil) for her appointment as director of Clicks Retailers Proprietary Limited
** The fees paid to Fatima Daniels include an amount of R72 917 (2017: nil) for her appointment as director of Clicks Retailers Proprietary Limited
*** Retired with effect from 26 January 2017
– 30 –Clicks Group Audited Annual Financial Statements 2018

NOTES TO THE ANNUAL F INANCIAL STATEMENTS (CONTINUED)
FOR THE YEAR ENDED 31 AUGUST
Group
2018R’000
2017R’000
5 Other costsOther operating costs include:
Fees paid for outside services
Technical services 18 282 22 024
Decrease in financial assets at fair value through profit or loss – 1 161
Foreign exchange losses – realised – 1 996
Impairment allowances raised – trade receivables (see note 18) 5 115 6 518
Water and electricity 177 403 165 304
Retail 164 270 152 562
Distribution 13 133 12 742
6 Net financing income/(costs)Recognised in profit or loss:
Interest income on bank deposits and investments 24 429 9 977
Other interest income 1 328 524
Financial income 25 757 10 501
Interest expense on financial liabilities measured at amortised cost 23 692 47 838
Cash interest expense 9 456 41 591
Other interest expense 14 236 6 247
Financial expense 23 692 47 838
Net financing income/(costs) 2 065 (37 337)
– 31 –Clicks Group Audited Annual Financial Statements 2018

NOTES TO THE ANNUAL F INANCIAL STATEMENTS (CONTINUED)
FOR THE YEAR ENDED 31 AUGUST
Group Company
2018R’000
2017R’000
2018R’000
2017R’000
7 Income tax expenseSouth African normal tax
Current tax
Current year 206 279 513 303 54 31
Prior-year overprovision (14 679) (10 959) – –
Deferred tax
Current year 344 270 (28 288) – –
Prior-year underprovision 17 707 18 431 – –
Foreign tax
Current tax
Current year 9 180 4 706 – –
Withholding tax 6 223 5 488 – –
Deferred tax
Current year 1 224 (5 611) – –
Prior-year overprovision (414) (440) – –
Taxation per income statement 569 790 496 630 54 31
Deferred tax – current year (267 916) (208 915) – –
Cash flow hedge recognised in other comprehensive income 22 616 (4 658) – –
Equity-settled transaction recognised in equity (see note 20) (290 532) (205 516) – –
Remeasurement of post-employment benefit obligations – 1 259 – –
Total income tax charge 301 874 287 715 54 31
Reconciliation of rate of tax % % % %
Standard rate – South Africa 28.00 28.00 28.00 28.00
Adjusted for:
Disallowable expenditure 0.31 0.25 0.02 0.02
Exempt income and allowances (0.68) (0.97) (28.02) (28.02)
Foreign tax rate variations (0.24) – – –
Foreign withholding tax 0.30 0.31 – –
Prior-year net underprovision 0.17 0.40 – –
Effective tax rate 27.86 27.99 – –
One of the subsidiaries of the group has an estimated tax loss of R51.9 million (2017: R42.2 million) available for set-off against future taxable income of that subsidiary. A deferred tax asset of R16.6 million (2017: R11.6 million) has been recognised in respect of the total estimated tax loss (see note 12).
– 32 –Clicks Group Audited Annual Financial Statements 2018

NOTES TO THE ANNUAL F INANCIAL STATEMENTS (CONTINUED)
FOR THE YEAR ENDED 31 AUGUST
Group
2018R’000
2017R’000
8 Earnings per shareThe calculation of basic and headline earnings per share at 31 August 2018 was based on profit for the year attributable to ordinary shareholders of Clicks Group Limited of R1 475.2 million (2017: R1 277.6 million) and headline earnings of R1 476.1 million (2017: R1 268.6 million) divided by the weighted average number of ordinary shares as follows:
Reconciliation of headline earnings
Profit attributable to equity holders of the parent 1 475 210 1 277 642
Adjusted for:
927 (9 090)
Loss on disposal of property, plant and equipment 1 287 4 868
Tax on disposal of property, plant and equipment (360) (1 362)
Gain on consolidation of the New Clicks Foundation Trust – (12 596)
Headline earnings 1 476 137 1 268 552
2018cents
2017cents
Earnings per share 611.9 540.2
Headline earnings per share 612.3 536.3
Diluted earnings per share 577.6 505.7
Diluted headline earnings per share 578.0 502.1
2018’000
2017’000
Reconciliation of shares in issue to weighted average number of shares in issue
Total number of shares in issue at the beginning of the year 245 969 246 138
Treasury shares held for the full year and/or cancelled (9 443) (9 612)
Ordinary shares issued during the year weighted for the period held 4 547 –
Weighted average number of shares in issue for the year 241 073 236 526
Reconciliation of weighted average number of shares to weighted average diluted number of shares in issue
Weighted average number of shares in issue for the year (net of treasury shares) 241 073 236 526
Dilutive effect of share options (net of treasury shares) 14 312 16 115
Weighted average diluted number of shares in issue for the year 255 385 252 641
– 33 –Clicks Group Audited Annual Financial Statements 2018

NOTES TO THE ANNUAL F INANCIAL STATEMENTS (CONTINUED)
FOR THE YEAR ENDED 31 AUGUST
Group
2018 2017 2016
CostR’000
Accumulateddepreciation
andimpairment
lossesR’000
CostR’000
Accumulateddepreciation
andimpairment
lossesR’000
CostR’000
Accumulateddepreciation
andimpairment
lossesR’000
9 Property, plant and equipmentLand 25 809 – 25 809 – 25 809 –
Buildings 518 511 58 041 409 525 54 038 398 102 48 402
Computer equipment 496 298 329 100 463 033 290 547 439 496 295 039
Equipment 335 736 196 273 282 149 174 130 269 975 166 331
Furniture and fittings 2 122 936 1 100 554 1 812 027 963 570 1 564 466 859 538
Motor vehicles 52 309 24 229 46 061 22 384 50 213 33 727
3 551 599 1 708 197 3 038 604 1 504 669 2 748 061 1 403 037
All group property is owner-occupied.
The carrying amount of the group’s property, plant and equipment is reconciled as follows:
LandR’000
BuildingsR’000
Computerequipment
R’000Equipment
R’000
Furnitureand fittings
R’000
Motorvehicles
R’000Total
R’000
Carrying amount at 1 September 2016 25 809 349 700 144 457 103 644 704 928 16 486 1 345 024
Additions – 11 423 83 587 29 429 318 743 12 785 455 967
Disposals – – (205) (1 552) (4 691) (951) (7 399)
Depreciation – (5 636) (55 353) (23 502) (170 523) (4 643) (259 657)
Carrying amount at 31 August 2017 25 809 355 487 172 486 108 019 848 457 23 677 1 533 935
Additions – 109 567 53 968 59 524 367 472 11 149 601 680
Disposals – (259) (502) (338) (1 209) (666) (2 974)
Depreciation – (4 325) (58 754) (27 742) (192 338) (6 080) (289 239)
Carrying amount at 31 August 2018 25 809 460 470 167 198 139 463 1 022 382 28 080 1 843 402
– 34 –Clicks Group Audited Annual Financial Statements 2018

NOTES TO THE ANNUAL F INANCIAL STATEMENTS (CONTINUED)
FOR THE YEAR ENDED 31 AUGUST
Group2018 2017 2016
CostR’000
Accumulatedamortisation
andimpairment
lossesR’000
CostR’000
Accumulatedamortisation
andimpairment
lossesR’000
CostR’000
Accumulatedamortisation
andimpairment
lossesR’000
10 Intangible assetsClicks trademark (see note 10.1) 272 000 – 272 000 – 272 000 –Link trademark 6 000 6 000 6 000 6 000 6 000 6 000 Other trademarks 1 116 693 1 116 581 1 116 469 Capitalised and purchased computer software development 385 973 187 255 334 974 153 826 332 749 171 313 Contractual rights (see note 10.2) 25 633 20 013 22 015 18 095 17 020 17 020
690 722 213 961 636 105 178 502 628 885 194 802
The carrying amount of the group’s intangible assets is reconciled as follows:
Clickstrademark
R’000
Othertrademarks
and contractual
rightsR’000
Capitalisedsoftware
developmentR’000
TotalR’000
Carrying amount at 1 September 2016 272 000 647 161 436 434 083 Additions – 4 995 56 888 61 883 Amortisation – (1 187) (36 222) (37 409)Disposals – – (954) (954)Carrying amount at 31 August 2017 272 000 4 455 181 148 457 603 Additions – 3 619 65 934 69 553 Amortisation – (2 031) (47 872) (49 903)Disposals – – (492) (492)Carrying amount at 31 August 2018 272 000 6 043 198 718 476 761
Assessment of impairment of intangible assets 10.1 The Clicks trademark is part of the Clicks cash-generating unit and is considered to have an indefinite useful life. There is
no apparent legal or other restriction to the use of the trademark or risk of technical or other obsolescence. Given the strategic importance of the trademark to the future sustainability of the group, the group’s intention is to continue to use the trademark indefinitely. The directors consider that there is no foreseeable limit to the period over which this asset is expected to generate cash inflows for the group and, on this basis, the directors have concluded that the indefinite useful life assumption is appropriate.
In accordance with the group’s accounting policy, an impairment test was performed on the carrying values of intangible assets with indefinite useful lives at year-end. The recoverable amount was determined based on the value in use.
Budgeted operating cash flows for the related business units were projected and discounted at the group’s weighted average pre-tax cost of capital. The impairment calculations performed indicated that the trademarks were not impaired.
The following key assumptions were made in determining the value in use: (i) A forecast horizon of three years was used. The forecast horizon comprises the three-year plan drafted in the last
quarter of the 2018 financial year, whereafter a perpetuity growth rate of 7.0% (2017: 7.0%) is used. (ii) The values assigned to the three-year plan revenue and cost growth assumptions reflect current trends, anticipated
market developments and management’s experience. (iii) The key assumptions for the recoverable amount are the long-term growth rate and the discount rate. The long-
term growth rate used is purely for the impairment testing of intangible assets under IAS 36 – Impairment of Assets and does not reflect long-term planning assumptions used by the group for investment proposals or for any other assessments.
(iv) A discount rate of 13.7% (2017: 14.0%) per annum, being the group’s pre-tax weighted average cost of capital, was used. The group’s pre-tax weighted average cost of capital is deemed appropriate as, together with the Distribution business, both businesses largely operate within South Africa and are subject to similar market risks.
Management believes that any reasonably possible change in any of these assumptions would not cause the carrying amounts to exceed their recoverable amounts.
10.2 The group acquired the pharmacy business of Amalgamated Pharmacy Group Proprietary Limited in 2010. As part of the acquisition the group acquired the contractual rights to certain medical aid contracts. These contractual
rights have been amortised over five years. During the year the group also acquired contractual rights relating to medicine formulas.
– 35 –Clicks Group Audited Annual Financial Statements 2018

NOTES TO THE ANNUAL F INANCIAL STATEMENTS (CONTINUED)
FOR THE YEAR ENDED 31 AUGUST
Group
2018R’000
2017R’000
11 GoodwillGoodwill 103 510 103 510
Goodwill comprises:
United Pharmaceutical Distributors Proprietary Limited (“UPD”) (see note 11.1) 96 277 96 277
Kalahari Medical Distributors Proprietary Limited (“Kalahari”) (see note 11.2) 704 704
Amalgamated Pharmacy Group Proprietary Limited (“Amalgamated Pharmacy Group”) (see note 11.3) 6 529 6 529
Assessment of impairment of goodwill 11.1 Budgeted operating cash flows for the UPD business unit were projected and discounted at the group’s weighted average
pre-tax cost of capital. The impairment calculations performed indicated that the goodwill was not impaired.
The following key assumptions were made in determining the value in use of the UPD cash-generating unit:
(i) A forecast horizon of three years was used. The forecast horizon comprises the three-year plan drafted in the last quarter of the 2018 financial year, whereafter a perpetuity growth rate of 6.5% (2017: 6.5%) is used.
(ii) The values assigned to the three-year plan revenue and cost growth assumptions reflect current trends, anticipated market developments and management’s experience.
(iii) The key assumptions for the recoverable amount are the long-term growth rate and the discount rate. The long-term growth rate used is purely for the impairment testing of goodwill under IAS 36 – Impairment of Assets and does not reflect long-term planning assumptions used by the group for investment proposals or for any other assessments.
(iv) A discount rate of 13.7% (2017: 14.0%) per annum, being the group’s pre-tax weighted average cost of capital, was used. The group’s pre-tax weighted average cost of capital is deemed appropriate as, together with the Clicks business, both businesses largely operate within South Africa and are subject to similar market risks.
Management believes that any reasonably possible change in any of these assumptions would not cause the carrying amounts to exceed their recoverable amounts.
11.2 The same assumptions were applied to Kalahari as this company is in the same business as UPD and accordingly none of the assumptions would change significantly. The fact that Kalahari operates out of Botswana was considered, but this is also not expected to change the assumptions. The goodwill relating to Kalahari has been attributed to the UPD business as a cash-generating unit.
11.3 Due to the synergies that arose on acquisition, the goodwill relating to the purchase of the pharmacy business from Amalgamated Pharmacy Group has been attributed to the Clicks business as a cash-generating unit, which represents the lowest level within the group at which the goodwill is monitored for internal management purposes.
Applying IAS 36, goodwill relating to the above acquisition has been tested for impairment at the same level as the Clicks business unit.
Budgeted operating cash flows for the related business units were projected and discounted at the group’s weighted average pre-tax cost of capital. The impairment calculations performed indicated that goodwill was not impaired.
The following key assumptions were made in determining the value in use:
(i) A forecast horizon of three years was used. The forecast horizon comprises the three-year plan drafted in the last quarter of the 2018 financial year, whereafter a perpetuity growth rate of 7.0% (2017: 7.0%) is used.
(ii) The values assigned to the three-year plan revenue and cost growth assumptions reflect current trends, anticipated market developments and management’s experience.
– 36 –Clicks Group Audited Annual Financial Statements 2018
NOTES TO THE ANNUAL F INANCIAL STATEMENTS (CONTINUED)
FOR THE YEAR ENDED 31 AUGUST
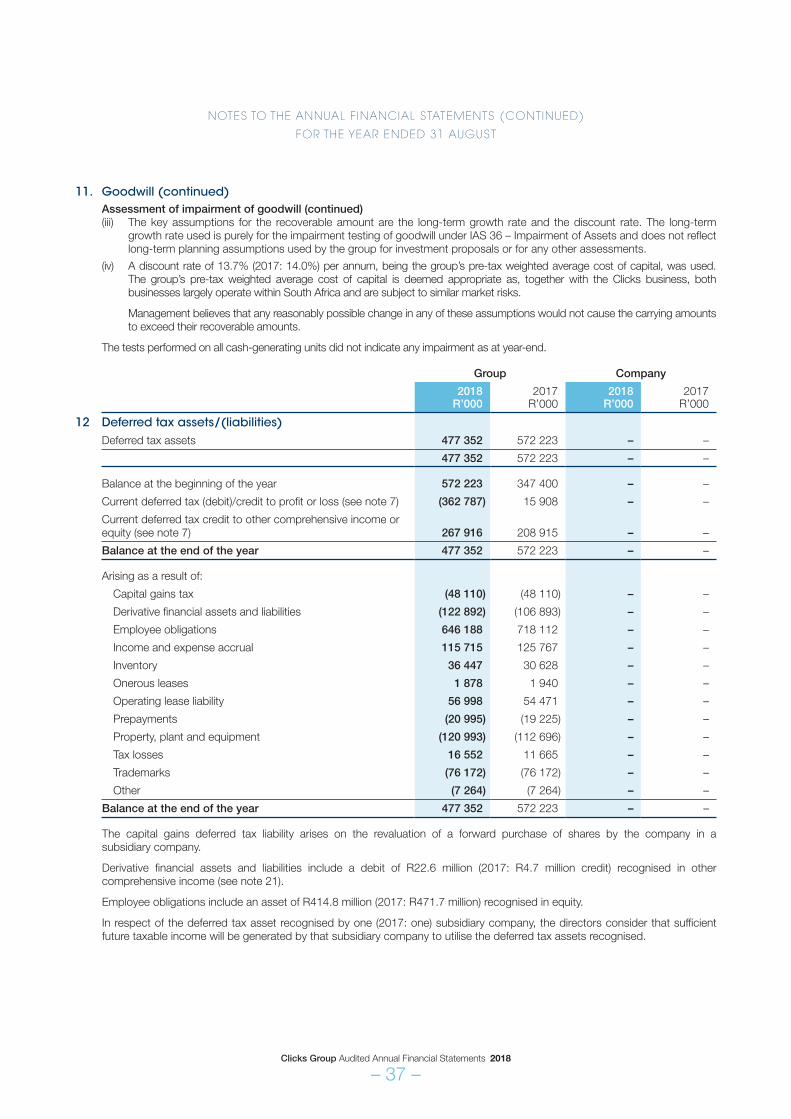
11. Goodwill (continued) Assessment of impairment of goodwill (continued) (iii) The key assumptions for the recoverable amount are the long-term growth rate and the discount rate. The long-term
growth rate used is purely for the impairment testing of goodwill under IAS 36 – Impairment of Assets and does not reflect long-term planning assumptions used by the group for investment proposals or for any other assessments.
(iv) A discount rate of 13.7% (2017: 14.0%) per annum, being the group’s pre-tax weighted average cost of capital, was used. The group’s pre-tax weighted average cost of capital is deemed appropriate as, together with the Clicks business, both businesses largely operate within South Africa and are subject to similar market risks.
Management believes that any reasonably possible change in any of these assumptions would not cause the carrying amounts to exceed their recoverable amounts.
The tests performed on all cash-generating units did not indicate any impairment as at year-end.
Group Company
2018R’000
2017R’000
2018R’000
2017R’000
12 Deferred tax assets/(liabilities)Deferred tax assets 477 352 572 223 – –
477 352 572 223 – –
Balance at the beginning of the year 572 223 347 400 – –
Current deferred tax (debit)/credit to profit or loss (see note 7) (362 787) 15 908 – –
Current deferred tax credit to other comprehensive income or equity (see note 7) 267 916 208 915 – –
Balance at the end of the year 477 352 572 223 – –
Arising as a result of:
Capital gains tax (48 110) (48 110) – –
Derivative financial assets and liabilities (122 892) (106 893) – –
Employee obligations 646 188 718 112 – –
Income and expense accrual 115 715 125 767 – –
Inventory 36 447 30 628 – –
Onerous leases 1 878 1 940 – –
Operating lease liability 56 998 54 471 – –
Prepayments (20 995) (19 225) – –
Property, plant and equipment (120 993) (112 696) – –
Tax losses 16 552 11 665 – –
Trademarks (76 172) (76 172) – –
Other (7 264) (7 264) – –
Balance at the end of the year 477 352 572 223 – –
The capital gains deferred tax liability arises on the revaluation of a forward purchase of shares by the company in a subsidiary company.
Derivative financial assets and liabilities include a debit of R22.6 million (2017: R4.7 million credit) recognised in other comprehensive income (see note 21).
Employee obligations include an asset of R414.8 million (2017: R471.7 million) recognised in equity.
In respect of the deferred tax asset recognised by one (2017: one) subsidiary company, the directors consider that sufficient future taxable income will be generated by that subsidiary company to utilise the deferred tax assets recognised.
– 37 –Clicks Group Audited Annual Financial Statements 2018

NOTES TO THE ANNUAL F INANCIAL STATEMENTS (CONTINUED)
FOR THE YEAR ENDED 31 AUGUST
13 Investment in an associateThe group acquired a strategic 25% interest in Sorbet Brands Proprietary Limited (“Sorbet Brands”) on 1 September 2015. R15 million was paid on signing of the contract with two contingent payments of R2.5 million each, paid during 2016 and 2017 respectively on achievement of turnover targets.
Sorbet Brands holds all of the trademark rights of the Sorbet brand in South Africa.
The group’s interest in Sorbet Brands is accounted for using the equity method in the consolidated financial statements.
The following amounts represent the assets and liabilities, income and expenses of the associate:
Group
2018R’000
2017R’000
Assets
Non-current assets 80 000 80 000
Current assets 6 253 2 744
Liabilities
Current liabilities 6 077 2 146
Equity 80 176 80 598
Group’s carrying amount of the investment 20 044 20 039
Summarised statement of comprehensive income
Income 19 428 16 490
Expenses (5 691) (380)
Profit before taxation 13 737 16 110
Income tax expense (3 572) (4 511)
Profit for the year 10 165 11 599
Total comprehensive income for the year 10 165 11 599
Group’s proportionate share of profit for the year 2 541 2 900
Dividends received from associate 2 233 3 143
Group
2018R’000
2017R’000
14 Loans receivableSign and Seal Trading 205 Proprietary Limited (“Style Studio”) (see note 14.1) 4 500 4 500
AfroBotanics Proprietary Limited (see note 14.1) 1 500 –
Brian Philippe Thomas Proprietary Limited shareholders (see note 14.2) 1 971 –
UPD Owner-driver Initiative (see note 14.3) 6 728 –
JGB Couriers Proprietary Limited (see note 14.4) 304 –
Non-current loans receivable 15 003 4 500
Brian Philippe Thomas Proprietary Limited shareholders (see note 14.2) 588 –
JGB Couriers Proprietary Limited (see note 14.4) 87 –
Triton Pharmacare Capital Investments Proprietary Limited (“Triton”) (see note 14.5) 9 000 9 000
Current loans receivable 9 675 9 000
Total loans receivable 24 678 13 500
– 38 –Clicks Group Audited Annual Financial Statements 2018

NOTES TO THE ANNUAL F INANCIAL STATEMENTS (CONTINUED)
FOR THE YEAR ENDED 31 AUGUST
14 Loans receivable (continued)
14.1 These loans are unsecured, interest free and repayable within 10 business days of demand.
14.2 The shareholders of Brian Philippe Thomas Proprietary Limited are indebted to Clicks Retailers Proprietary Limited for the amount of R3 000 000. The loan is interest free and is repayable in five instalments. The loan is secured via a second mortgage bond.
14.3 The amount relates to loans to various couriers who participate in the UPD owner-driver initiative. The loans are interest free, were advanced on 1 August 2018 and are expected to be repaid after five years.
14.4 The loan is unsecured, interest free and repayable by 30 April 2023 in monthly instalments.
14.5 The loan to Triton is interest free and carried at amortised cost. A second mortgage bond over property purchased by Triton and a special notarial bond over movable assets serve as security for the loan. The loan was repaid on 9 October 2018.
Group
2018R’000
2017R’000
15 Financial assets at fair value through profit or lossInvestment in Guardrisk Insurance Company Limited (Cell number 171) (see note 15.1) 16 850 11 279
Listed equity instruments (see note 15.2) – 10 941
Collective investment schemes (see note 15.2) 65 632 3 896
Listed preference shares (see note 15.2) – 1 464
Total financial assets at fair value through profit or loss 82 482 27 580
15.1 The investment in Guardrisk Insurance Company Limited is the net investment in the group’s insurance cell captive which is not deemed to be in the group’s control in accordance with IFRS 10 – Consolidated Financial Statements.
15.2 In the prior year New Clicks Foundation Trust was consolidated in the group for the first time in accordance with IFRS 10. The trust primarily invests in collective investment schemes.
Group
2018 2017
AssetsR’000
LiabilitiesR’000
AssetsR’000
LiabilitiesR’000
16 Derivative financial instrumentsNon-current
Equity derivative hedge 214 110 – 134 891 –
Current
Equity derivative hedge 199 814 – 190 848 –
Forward exchange contracts 39 242 – – (9 142)
239 056 – 190 848 (9 142)
All derivatives noted above are classified as held for trading and measured at fair value through profit or loss.
Equity derivative hedge European call options have been purchased to hedge the cash-settled share-based payment obligation relating to tranches 10,
11 and 12 of the total shareholder return long-term incentive scheme (refer to note 23.1). The expiration date of these hedging instruments and the vesting dates of the hedged items coincide on 31 August 2018, 2019 and 2020 respectively.
Refer to note 21 detailing the equity derivative hedges’ impact on profit and loss and other comprehensive income.
The fair value of these equity derivative hedges are calculated using a Monte Carlo option pricing model with reference to the closing share price, 250-day historical volatility, the 12-month trailing dividend yield and the risk-free rate.
Forward exchange contracts For currency derivatives, fair values are calculated using standard market calculation conventions with reference to the relevant
closing market spot rates, forward foreign exchange and interest rates. The notional principal amounts of the outstanding forward foreign exchange contracts at 31 August 2018 was R372.0 million (2017: R623.5 million). Refer to note 21 detailing the foreign exchange hedging impact on profit or loss and other comprehensive income.
– 39 –Clicks Group Audited Annual Financial Statements 2018

NOTES TO THE ANNUAL F INANCIAL STATEMENTS (CONTINUED)
FOR THE YEAR ENDED 31 AUGUST
Group
2018R’000
2017R’000
17 InventoriesInventories comprise:
Goods for resale 4 088 593 3 636 496
Goods in transit 138 743 117 298
4 227 336 3 753 794
Inventories stated at net realisable value 49 033 40 685
The value of inventories stated at net realisable value is determined based on management’s best estimate of the likely selling price at which the inventories in question could be sold in the ordinary course of business less the directly attributable selling costs.
Group
2018R’000
2017R’000
18 Trade and other receivablesTrade and other receivables comprise:
Trade receivables 1 770 139 1 732 032
Less: impairment of trade receivables (27 610) (30 599)
Trade receivables – net 1 742 529 1 701 433
Prepayments 152 285 101 281
Income accruals 272 446 177 972
Logistics fees receivable 138 080 223 251
Other (refer to note 18.1) 26 191 8 782
2 331 531 2 212 719
The carrying amount of trade and other receivables approximates their fair value. Trade and other receivables are predominantly non-interest bearing. Refer to note 29.4 for the credit risk management of trade and other receivables.
The movement in the doubtful debt provision in respect of trade receivables during the year was as follows:
Group
2018R’000
2017R’000
Balance at 1 September 30 599 24 081
Impairment provision raised 5 115 6 518
Impairment loss utilised (8 104) –
Balance at 31 August 27 610 30 599
18.1 Other receivables consist primarily of sundry customer receivables.
– 40 –Clicks Group Audited Annual Financial Statements 2018

NOTES TO THE ANNUAL F INANCIAL STATEMENTS (CONTINUED)
FOR THE YEAR ENDED 31 AUGUST
Group and Company
2018R’000
2017R’000
19 Share capital and share premiumAuthorised – group and company
600 million (2017: 600 million) ordinary shares of one cent each 6 000 6 000
50 million (2017: 50 million) “A” ordinary shares of one cent each 500 500
Issued ordinary shares – group and company
253.948 million (2017: 245.969 million) ordinary shares of one cent each and 14.577 million (2017: 29.153 million) “A” ordinary shares of one cent each 2 686 2 752
Share premium – group 513 848 3 497
Share premium – company 1 581 634 14 089
The company and the group have different values for share premium due to issue of ordinary shares at the 30-day VWAP on 2 February 2018 which was settled by The Clicks Group Employee Share Ownership Trust, a subsidiary of the group and eliminated on consolidation. Other differences arose in previous years, being preliminary expenses written off against share premium related to the acquisition of certain businesses in 1996 and the cancellation of shares at a holding company level at market value, while on consolidation the cancellation was carried out at cost.
Group and Company
Ordinary shares
’000
“A” ordinary shares
’000
Total2018’000
Total2017’000
Reconciliation of total number of shares in issue to net number of shares in issue
Total number of shares in issue at the end of the year 253 948 14 577 268 525 275 122
Treasury shares held at the end of the year (9 443) (14 577) (24 020) (38 596)
Net number of shares in issue at the end of the year 244 505 – 244 505 236 526
R’000 R’000
Of the shares in issue, the group holds the following treasury shares:
Shares held by a subsidiary – 9.443 million (2017: 9.443 million) ordinary shares of one cent each – cost 702 556 702 556
Shares held by the Clicks Group Employee Share Ownership Trust – 14.577 million (2017: 29.153 million) “A” ordinary shares of one cent each – cost 147 292
702 703 702 848
No ordinary shares were cancelled during the current financial year (2017: 168 795).
In terms of the unwind of 50% of the Clicks Group Employee Share Ownership Scheme, 7 979 384 ordinary shares were issued to beneficiaries of the scheme and 14 576 647 ordinary “A” shares were repurchased by Clicks Group Limited from the Employee Share Ownership Trust. The New Clicks Foundation Trust sold 284 155 Clicks Group Limited ordinary shares subsequent to acquiring them through the unwind of the scheme. No other equity share transactions occurred during the year.
The holders of ordinary shares are entitled to receive dividends as declared from time to time and are entitled to one vote per share at meetings of the company.
In respect of the company’s shares held by entities within the group, all voting rights are suspended until those shares are reissued.
The unlisted “A” ordinary shares have the same rights and rank pari passu with the ordinary shares in all respects except for distribution rights.
The holders of “A” ordinary shares are entitiled to an annual distribution equal to 10% of the cumulative distribution declared in relation to an ordinary share in a financial year.
– 41 –Clicks Group Audited Annual Financial Statements 2018

NOTES TO THE ANNUAL F INANCIAL STATEMENTS (CONTINUED)
FOR THE YEAR ENDED 31 AUGUST
20 Share option reserveEquity-settled share-based paymentOptions issued in terms of the Employee Share Ownership Programme (“ESOP”)In October 2010 Clicks Group Limited announced an employee share ownership programme.
In terms of The Clicks Group Employee Share Ownership Trust deed the group issued unlisted “A” ordinary shares (“A” shares), equating to 10% of the issued share capital of the group, net of treasury shares.
Upon vesting, options are converted into Clicks Group Limited ordinary shares; 50% converted in February 2018 and 50% willl be converted in February 2019, after the repayment of the notional debt.
Group
Number of shares
2018
Number of shares
2017
“A” shares issued in terms of the ESOP 14 576 648 29 153 295
Details of share option allocations
Grant date Option
price
Balance at the
beginningof the year
Grantedduring
the year
Deliveredduring
the year
Forfeitedduring
the year
Balance atthe end of
the year
2018
February 2011 R41.54 12 857 307 – (6 385 759) (85 789) 6 385 759
February 2012 R41.11 1 917 329 – (912 282) (92 765) 912 282
February 2013 R60.00 3 084 161 – (1 508 220) (67 721) 1 508 220
February 2014 R56.78 2 121 432 – (1 024 937) (71 558) 1 024 937
February 2015 R90.32 2 091 394 – (999 342) (92 710) 999 342
February 2016 R86.75 336 098 – (168 049) – 168 049
February 2017 R120.29 209 163 – (92 272) (24 619) 92 272
Unallocated share options 3 485 787
14 576 648
2017
February 2011 R41.54 13 031 548 – – (174 241) 12 857 307
February 2012 R41.11 2 186 475 – – (269 146) 1 917 329
February 2013 R60.00 3 736 083 – – (651 922) 3 084 161
February 2014 R56.78 2 526 052 – – (404 620) 2 121 432
February 2015 R90.32 2 337 431 – – (246 037) 2 091 394
February 2016 R86.75 385 383 – – (49 285) 336 098
February 2017 R120.29 – 209 163 – – 209 163
Unallocated share options 6 536 411
29 153 295
– 42 –Clicks Group Audited Annual Financial Statements 2018

NOTES TO THE ANNUAL F INANCIAL STATEMENTS (CONTINUED)
FOR THE YEAR ENDED 31 AUGUST
20 Share option reserve (continued)Fair value of share-based payments in respect of optionsOptions granted have been valued using the Monte Carlo option pricing model by an independent, external valuator. The fair value of the options determined at the grant date is amortised over the vesting period to the extent that the options are ultimately exercised or are expected to be exercised.
The assumptions used in estimating the fair values at grant date are listed below:
Share price at
grant date
Risk-free rate (%)
Expecteddividend
yield (%)
Expectedvolatility
(%)
Expectedforfeiture
rate (%)
February 2011 – seven-year vesting period R41.54 8.45 3.89 24.56 15.33 February 2011 – eight-year vesting period R41.54 8.60 4.11 24.56 15.33 February 2012 – six-year vesting period R41.11 7.38 2.80 27.00 14.20 February 2012 – seven-year vesting period R41.11 7.38 2.80 27.00 14.20 February 2013 – five-year vesting period R60.00 7.17 2.70 24.00 14.20 February 2013 – six-year vesting period R60.00 7.17 2.70 24.00 14.20 February 2014 – four-year vesting period R56.78 8.55 2.50 23.00 11.00 February 2014 – five-year vesting period R56.78 8.55 2.50 23.00 11.00 February 2015 – three-year vesting period R90.32 6.46 2.40 23.00 11.00 February 2015 – four-year vesting period R90.32 6.46 2.40 23.00 11.00 February 2016 – two-year vesting period R86.75 7.85 2.00 25.00 10.00 February 2016 – three-year vesting period R86.75 7.85 2.00 25.00 10.00 February 2017 – one-year vesting period R120.29 7.36 2.00 24.00 9.00 February 2017 – two-year vesting period R120.29 7.36 2.00 24.00 9.00
The risk-free rate is derived from the Swap BD curve published by the Bond Exchange of South Africa.
The dividend yield is the historical five-year average dividend yield as of the grant date, which has been converted to a continuously compounded dividend yield.
The expected volatility is the historic annualised standard deviation of the continuously compounded rates of return on the share, based on the most recent period as of the grant date that is commensurate with the expected term of the share option.
The expected exercise rate is based on the historic trend of option forfeitures and excludes options already exercised. The options already exercised are reflected in the share option reserve in addition to the value of options that are expected to be exercised based on the expected exercise rate.
The share option reserve recognises the cost at the fair value of the options on the date issued to employees, accrued over the vesting period.
Group
2018R’000
2017R’000
Share option reserveBalance at the beginning of the year 747 613 483 188
(169 429) 264 425 Equity-settled share-based payment expense 50 752 58 909 Transferred to share premium (510 713) –Deferred tax recorded directly in equity arising on consolidation 290 532 205 516
Balance at the end of the year 578 184 747 613
163 356 275 959 Equity-settled share-based payment expense in opening retained earnings 275 959 217 050 Equity-settled share-based payment expense 50 752 58 909 Transferred to share premium (163 355) –Deferred tax recorded directly in equity arising on consolidation 414 828 471 654 Estimate of options not yet vested but expected to vest 578 184 747 613
– 43 –Clicks Group Audited Annual Financial Statements 2018
NOTES TO THE ANNUAL F INANCIAL STATEMENTS (CONTINUED)
FOR THE YEAR ENDED 31 AUGUST
Group
2018R’000
2017R’000
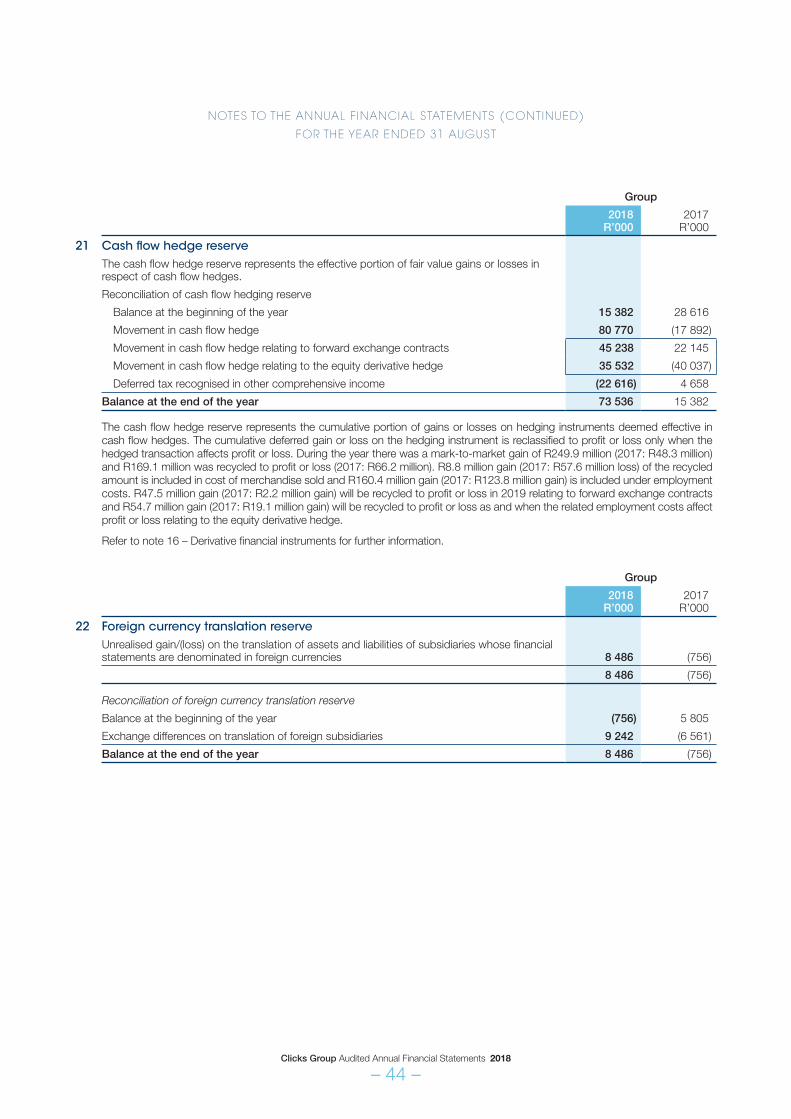
21 Cash flow hedge reserveThe cash flow hedge reserve represents the effective portion of fair value gains or losses in respect of cash flow hedges.
Reconciliation of cash flow hedging reserve
Balance at the beginning of the year 15 382 28 616
Movement in cash flow hedge 80 770 (17 892)
Movement in cash flow hedge relating to forward exchange contracts 45 238 22 145
Movement in cash flow hedge relating to the equity derivative hedge 35 532 (40 037)
Deferred tax recognised in other comprehensive income (22 616) 4 658
Balance at the end of the year 73 536 15 382
The cash flow hedge reserve represents the cumulative portion of gains or losses on hedging instruments deemed effective in cash flow hedges. The cumulative deferred gain or loss on the hedging instrument is reclassified to profit or loss only when the hedged transaction affects profit or loss. During the year there was a mark-to-market gain of R249.9 million (2017: R48.3 million) and R169.1 million was recycled to profit or loss (2017: R66.2 million). R8.8 million gain (2017: R57.6 million loss) of the recycled amount is included in cost of merchandise sold and R160.4 million gain (2017: R123.8 million gain) is included under employment costs. R47.5 million gain (2017: R2.2 million gain) will be recycled to profit or loss in 2019 relating to forward exchange contracts and R54.7 million gain (2017: R19.1 million gain) will be recycled to profit or loss as and when the related employment costs affect profit or loss relating to the equity derivative hedge.
Refer to note 16 – Derivative financial instruments for further information.
Group
2018R’000
2017R’000
22 Foreign currency translation reserveUnrealised gain/(loss) on the translation of assets and liabilities of subsidiaries whose financial statements are denominated in foreign currencies 8 486 (756)
8 486 (756)
Reconciliation of foreign currency translation reserve
Balance at the beginning of the year (756) 5 805
Exchange differences on translation of foreign subsidiaries 9 242 (6 561)
Balance at the end of the year 8 486 (756)
– 44 –Clicks Group Audited Annual Financial Statements 2018

NOTES TO THE ANNUAL F INANCIAL STATEMENTS (CONTINUED)
FOR THE YEAR ENDED 31 AUGUST
Group
2018R’000
2017R’000
23 Employee benefitsLong-term incentive schemes 182 170 150 628
Post-retirement medical obligations 63 237 58 603
Total long-term employee benefits 245 407 209 231
Accounted for as follows:
Long-term employee benefits recognised in terms of IFRS 2 – Share-based Payments (see note 23.1) 108 167 98 567
Long-term employee benefits recognised in terms of IAS 19 – Employee Benefits (see note 23.2) 137 240 110 664
Total long-term employee benefits 245 407 209 231
Long-term employee benefits recognised in terms of IFRS 2 – Share-based Payments
Long-term cash-settled share-based payment liability
Long-termincentive
scheme – TSR(note 23.1)
R’000
Balance at 1 September 2016 116 947
Expense from cash-settled share-based payment 149 020
Early settlement (1 751)
Reclassification to short-term benefits (165 649)
Balance at 31 August 2017 98 567
Expense from cash-settled share-based payment 191 857
Reclassification to short-term benefits (182 257)
Balance at 31 August 2018 108 167
– 45 –Clicks Group Audited Annual Financial Statements 2018

NOTES TO THE ANNUAL F INANCIAL STATEMENTS (CONTINUED)
FOR THE YEAR ENDED 31 AUGUST
23 Employee benefits (continued)23.1 Long-term incentive scheme – total shareholder return (TSR)
During 2018 the group issued 0.9 million (2017: 0.9 million) cash-settled appreciation rights to management. The value of these appreciation rights are linked to the TSR (capital gain plus dividends) over a three-year vesting period. These appreciation rights are classified as cash-settled share-based payment benefits and the liability has been valued using the Monte Carlo option pricing model by an independent, external valuator.
The September 2014 options were settled during the year.
The September 2015 options outstanding at year-end are due for settlement.
The contractual life of the September 2016 options outstanding at year-end was one year.
The contractual life of the September 2017 options outstanding at year-end was two years.
Details of share option allocations – 2018
Option price
Balance at the
beginningof the year
Grantedduring
the year
Deliveredduring
the year
Forfeitedduring
the year
Balance atthe end of
the year
September 2014 options – 1 175 857 – (1 175 857) – –
September 2015 options R200.28 964 020 – – (53 999) 910 021
September 2016 options R144.76 821 270 – – (39 016) 782 254
September 2017 options R144.97 – 866 513 – (57 982) 808 531
The assumptions used in estimating the fair value at year-end is listed below:
Share price at
grant date
Risk-free rate
(%)
Expecteddividend
yield (%)
Expectedvolatility
(%)
Expectedforfeiture
rate (%)
September 2015 options – three-year vesting period R93.82 7.60 1.68 30.66 4.00
September 2016 options – three-year vesting period R126.03 7.60 1.68 30.66 4.00
September 2017 options – three-year vesting period R146.10 7.60 1.68 30.66 4.00
Details of share option allocations – 2017
Option price
Balance at the
beginningof the year
Grantedduring
the year
Deliveredduring
the year
Forfeitedduring
the year
Balance atthe end of
the year
September 2014 options R159.52 1 225 514 – – (49 657) 1 175 857
September 2015 options R114.72 1 012 390 – – (48 370) 964 020
September 2016 options R53.51 – 861 807 – (40 537) 821 270
The assumptions used in estimating the fair value at year-end is listed below:
Share price at
grant date
Risk-free rate
(%)
Expecteddividend
yield (%)
Expectedvolatility
(%)
Expectedforfeiture
rate (%)
September 2014 options – three-year vesting period R66.34 6.75 1.92 20.10 4.00
September 2015 options – three-year vesting period R93.82 6.75 1.92 20.10 4.00
September 2016 options – three-year vesting period R126.03 6.75 1.92 20.10 4.00
The risk-free rate is derived from the zero coupon curve published by the Bond Exchange of South Africa.
The dividend yield is the 12-month trailing yield (nominal annual and compounded annuity).
The implied volatility is the 250-day historic volatility of the share price.
The expected exercise rate is based on the historic trend of option forfeitures and excludes options already exercised or forfeited.
– 46 –Clicks Group Audited Annual Financial Statements 2018

NOTES TO THE ANNUAL F INANCIAL STATEMENTS (CONTINUED)
FOR THE YEAR ENDED 31 AUGUST
23 Employee benefits (continued)23.2 Long-term employee benefits recognised in terms of IAS 19 – Employee Benefits
Long-term employee benefits
Long-termincentive
scheme – HEPS
(note 23.3)R’000
Post-retirement
medicalobligations(note 23.4)
R’000Total
R’000
Balance at 1 September 2016 39 541 58 644 98 185
Current service cost 49 733 1 074 50 807
Benefit payments (516) (1 170) (1 686)
Interest cost 6 710 4 550 11 260
Actuarial gain recognised in profit or loss (620) – (620)
Actuarial gain recognised in other comprehensive income – (4 495) (4 495)
Reclassification to short-term employee benefits (42 787) – (42 787)
Balance at 31 August 2017 52 061 58 603 110 664
Current service cost 62 038 1 304 63 342
Benefit payments – (1 800) (1 800)
Interest cost 9 106 5 130 14 236
Actuarial gain recognised in profit or loss (5 894) – (5 894)
Reclassification to short-term employee benefits (43 308) – (43 308)
Balance at 31 August 2018 74 003 63 237 137 240
23.3 Long-term incentive scheme – headline earnings per share (HEPS) During 2018 the group issued 2.1 million (2017: 2.1 million) cash-settled appreciation rights to management. The value
of these appreciation rights are linked to the performance of diluted HEPS over a three-year period. The amount to be provided in the current year is based on a three-year projection of diluted HEPS.
Any difference between projected performance and actual performance is recognised through an actuarial (gain)/loss based on the projected unit credit method which is taken to profit or loss.
The exercise price of each appreciation right was determined as R60.25 (2017: R52.62) per right (“base value”). In order to determine the amount to be provided a fixed factor of 12 is applied to the HEPS at the end of the three-year period. The differential between the factor multiplied by HEPS and the base value is the amount that will be paid out per right.
Should employees leave during the vesting period the rights will be forfeited.
– 47 –Clicks Group Audited Annual Financial Statements 2018

NOTES TO THE ANNUAL F INANCIAL STATEMENTS (CONTINUED)
FOR THE YEAR ENDED 31 AUGUST
23 Employee benefits (continued) 23.4 Post-retirement medical obligations The group subsidises a portion of the medical aid contributions of certain retired employees.
An actuarial valuation of the Clicks post-retirement medical aid scheme has determined that the unfunded liability in respect of pensioner post-retirement medical benefits amounts to R63.2 million (2017: R58.6 million). Provision has been made for the full unfunded liability.
The principal actuarial assumptions at the last valuation date (31 August 2017) are:
(i) a discount rate of 8.7% per annum;
(ii) general increases to medical aid contributions of 7.2%;
(iii) a retirement age of 65;
(iv) husbands are on average four years older than their spouses;
(v) mortality of pensioners determined in accordance with PA90 ultimate tables; and
(vi) mortality of in-service members determined in accordance with SA 85-90 ultimate table.
The post-retirement medical aid provision is sensitive to assumptions around medical aid inflation, discount rate, retirement age and life expectancy. A change in any of these factors would have an impact on the amount to be provided (expense/(credit) to other comprehensive income):
2018R’000
2017R’000
– Medical aid inflation increases by 1% per annum over assumptions made 7 641 10 163
– Medical aid inflation decreases by 1% per annum over assumptions made (5 460) (8 258)
– Discount rate increases by 1% per annum over assumptions made (5 998) (7 990)
– Discount rate decreases by 1% per annum over assumptions made 6 927 9 975
– Retirement age decreases by two years 7 156 6 920
– Life expectancy of male pensioners increases by one year 964 1 171
– Life expectancy of male pensioners decreases by one year (943) (1 176)
– Life expectancy of female pensioners increases by one year 1 299 1 349
– Life expectancy of female pensioners decreases by one year (1 286) (1 332)
The following undiscounted payments are expected contributions in future years from post-retirement medical obligations.
Within 12 months 2 094 1 800
Between 2 and 5 years 10 619 9 330
Between 5 and 10 years 21 051 18 397
Between 10 and 20 years 99 421 89 631
Between 20 and 30 years 164 344 159 301
Between 30 and 40 years 144 943 148 732
Beyond 40 years 86 783 98 278
Total expected payments 529 255 525 469
The average duration of the post-retirement medical obligations at year-end is 18.5 years (2017: 19.2 years).
– 48 –Clicks Group Audited Annual Financial Statements 2018

NOTES TO THE ANNUAL F INANCIAL STATEMENTS (CONTINUED)
FOR THE YEAR ENDED 31 AUGUST
23 Employee benefits (continued)23.4 Post-retirement medical obligations (continued)
Amounts for the current and previous four periods are as follows:
Post-retirement medical obligations
2018R’000
2017R’000
2016R’000
2015R’000
2014R’000
Defined benefit obligation 63 237 58 603 58 644 53 903 49 380
Experience adjustments on plan liabilities – – – (1 063) –
Short-term employee benefits
Long-termincentive
scheme – TSR
(note 23.1)R’000
Long-termincentive
scheme – HEPS
(note 23.3)R’000
Leave payaccrual
(note 23.5)R’000
Bonusaccrual
(note 23.6)R’000
Overtimeaccrual
(note 23.7)R’000
TotalR’000
Balance at 1 September 2016 – 68 936 61 328 108 733 2 989 241 986
Reclassification from long-term employee benefits 165 649 42 787 – – – 208 436
Benefit payments – (71 022) (8 316) (143 954) (8 067) (231 359)
Charge included in profit or loss – – 16 480 151 931 6 986 175 397
Balance at 31 August 2017 165 649 40 701 69 492 116 710 1 908 394 460
Reclassification from long-term employee benefits 182 257 43 308 – – – 225 565
Benefit payments (165 649) (38 277) (10 435) (148 738) (7 000) (370 099)
Charge included in profit or loss – – 12 787 146 727 8 776 168 290
Balance at 31 August 2018 182 257 45 732 71 844 114 699 3 684 418 216
23.5 The leave pay accrual is based on actual leave days by an employee multiplied by the employee’s current total daily cost to company.
23.6 The bonus accrual includes a guaranteed thirteenth cheque and an incentive bonus based on the business’s or group’s performance. The bonus is provided for all employees who qualify in respect of the expected cash payment.
– 49 –Clicks Group Audited Annual Financial Statements 2018

NOTES TO THE ANNUAL F INANCIAL STATEMENTS (CONTINUED)
FOR THE YEAR ENDED 31 AUGUST
23 Employee benefits (continued) 23.7 The overtime accrual is in respect of overtime worked in August 2018 which is paid in September 2018.
Pension and provident funds Three funds, which are registered and governed in terms of the Pension Funds Act, 24 of 1956, are operated by the group.
These funds are:
• the Clicks Group Retirement Fund;
• the Clicks Group Negotiated Pension Fund; and
• the Clicks Group Negotiated Provident Fund.
All permanent full-time staff members in South Africa, Lesotho and Swaziland are obliged to join one of the funds.
Employees in Namibia are members of the Namflex Umbrella Pension Fund and those in Botswana are members of the Sentlhaga Pension Fund.
The funds are all defined contribution schemes and the group carries no liability in relation to these funds. All funds provide death and disability cover, while the negotiated funds also include a funeral benefit. Combined membership across the funds was 14 816 (2017: 14 307) at year-end.
Medical aid funds Membership of one of the Horizon Medical Aid Scheme benefit options is actively encouraged and all existing members of
Discovery Health may continue their membership.
At year-end 2 416 (2017: 2 464) South African employees were principal members of a medical aid scheme, of whom 1 832 (2017: 1 817) were principal members with Horizon, 528 (2017: 535) were principal members of a Discovery Health medical aid scheme, and 56 (2017: 112) were principal members of various other medical aid schemes.
At year-end six (2017: six) Botswana employees were principal members with BOMaid and one with PULA, 13 (2017: 15) Namibian employees were principal members of Namibia Health Plan and 17 (2017: 17) Swaziland employees were principal members of Swazimed.
At year-end 30.0% (2017: 29.4%) of the permanent full-time employees were members of a medical aid scheme. Increasing the health benefits available to employees will be a focus area for the group in the years ahead.
Employee and company contributions to the above funds are included in employment costs detailed in note 4.
– 50 –Clicks Group Audited Annual Financial Statements 2018

NOTES TO THE ANNUAL F INANCIAL STATEMENTS (CONTINUED)
FOR THE YEAR ENDED 31 AUGUST
Group
2018R’000
2017R’000
24 Lease commitmentsOperating lease liability 202 139 193 026
Operating leases with fixed escalations are charged to profit or loss on a straight-line basis.
The associated provision will reverse during the latter part of each lease term when the actual cash flow exceeds the profit or loss charge.
Operating lease commitmentsThe group leases all its retail premises and certain of its pharmaceutical distribution centre sites under operating leases. The lease agreements provide for minimum payments together, in certain instances, with contingent rental payments determined on the basis of achieving a specified threshold turnover.
Future minimum lease payments under non-cancellable operating leases due*:
– Not later than one year 733 697 652 212
– Later than one year, not later than five years 1 629 639 1 613 413
– Later than five years 57 531 120 842
2 420 867 2 386 467
Future minimum lease payments receivable under non-cancellable operating leases due, which relate to Intercare Management Healthcare Proprietary Limited:
– Not later than one year 3 405 3 183
– Later than one year, not later than five years 2 374 5 779
5 779 8 962
The net future minimum lease payments under non-cancellable operating leases due*:
– Not later than one year 730 292 649 029
– Later than one year, not later than five years 1 627 265 1 607 634
– Later than five years 57 531 120 842
2 415 088 2 377 505
* Comparative operating lease commitments have been restated to exclude optional lease terms when it is not reasonably certain, at the inception of the lease, that the option will be exercised.
Generally, leases are taken out on five-year lease terms with an option to extend for a further five years in the instance of Clicks while shorter periods are committed to for Musica, The Body Shop and Claire’s.
– 51 –Clicks Group Audited Annual Financial Statements 2018

NOTES TO THE ANNUAL F INANCIAL STATEMENTS (CONTINUED)
FOR THE YEAR ENDED 31 AUGUST
Group
2018R’000
2017R’000
25 Trade and other payablesThe following are included in trade and other payables:Trade payables 5 019 885 4 500 821 Loyalty programme deferred income (see note 25.1) 66 084 97 190 Non-trade payables and accruals (see note 25.2) 1 112 466 877 171
6 198 435 5 475 182
25.1 Loyalty programme deferred incomeThe deferred income relating to points is determined based on the value of unredeemed vouchers in issue, as well as the value of points on qualifying sales that have not been converted into vouchers.
Based on the historic redemption rate, it is assumed that 68% of all points in issue are ultimately redeemed.
Estimates are made based on historic trends regarding the value of points on qualifying sales that will ultimately convert into vouchers issued.
25.2 Non-trade payables and accruals consist of expense and payroll accruals, value-added tax, unredeemed gift cards and income received in advance.
26 ProvisionsProvision for onerous contractsBalance at the beginning of the year 6 733 6 939 Movement in provision during the year recognised in occupancy costs (1 740) (206)Balance at the end of the year 4 993 6 733
Current 4 993 6 733 Non-current – –
4 993 6 733
Onerous contracts are identified where the present value of future obligations in terms of the contracts in question exceeds the estimated benefits accruing to the group from the contracts. The provision relates to certain leases where the site is either vacant or the commercial activity on the site is incurring losses.
Future cash flows are determined in accordance with the contractual lease obligations and are adjusted by market-related sub-let rentals and discounted at a risk-adjusted pre-tax rate.
The provision is further reduced to the extent that a straight-line operating lease accrual has already been recognised (see note 24).
– 52 –Clicks Group Audited Annual Financial Statements 2018

NOTES TO THE ANNUAL F INANCIAL STATEMENTS (CONTINUED)
FOR THE YEAR ENDED 31 AUGUST
Group
2018R’000
2017R’000
27 Dividends to shareholdersPrevious year final cash dividend out of distributable reserves – 234 cents per share paid 29 January 2018 (2017: 196 cents per share paid 30 January 2017 out of distributable reserves) 575 568 482 430
Current year interim cash dividend out of distributable reserves – 102.5 cents per share paid 2 July 2018 (2017: 88 cents per share paid 3 July 2017 out of distributable reserves) 260 297 216 452
“A” shares – previous year final cash dividend out of distributable reserves – 32.2 cents per share paid 29 January 2018 (2017: 27.2 cents per share paid 30 January 2017) 9 387 7 930
Total dividends to shareholders 845 252 706 812
Dividends on treasury shares (31 777) (28 507)
Dividends on “A” shares held in trust (1 897) (906)
Dividends paid outside the group 811 578 677 399
On 23 October 2018 the directors approved the final proposed dividend of 277.5 cents per share and 38.0 cents per “A” share.
The source of such a dividend will be from distributable reserves and paid in cash and will be recognised in the statement of changes in equity in 2019.
Dividend payout ratio The dividend payout ratio is 62%.
For further details refer to the directors’ report on page 2.
28 Financial risk management The group’s activities expose it to a variety of financial risks: market risk (including currency risk, price risk, interest rate risk),
credit risk and liquidity risk.
This note presents information about the group’s exposure to each of the above risks, the group’s objectives, policies and processes for measuring and managing risk, and the management of capital. Further quantitative disclosures are included throughout these consolidated financial statements.
The group’s overall risk management programme focuses on the unpredictability of financial markets and seeks to minimise potential adverse effects on the group’s financial performance. The group uses derivative financial instruments to hedge certain risk exposures.
The group treasury functions within the parameters of the treasury policy and reports to a sub-committee of management.
Market risk Market risk is the risk that changes in market prices, such as foreign exchange rates, interest rates and equity prices will affect
the group’s income or the value of its holdings of financial instruments.
The objective of market risk management is to manage and control market risk exposures within acceptable parameters, while optimising the return on risk.
The group buys derivatives to hedge economic exposures in the ordinary course of business to manage certain market risks.
– 53 –Clicks Group Audited Annual Financial Statements 2018

NOTES TO THE ANNUAL F INANCIAL STATEMENTS (CONTINUED)
FOR THE YEAR ENDED 31 AUGUST
28 Financial risk management (continued) Currency risk The group is exposed to foreign exchange risk through its imports of merchandise. The currencies in which these transactions
are primarily denominated are USD, EUR, GBP and CNY. The group’s treasury risk management policy is to take out forward exchange contracts, to cover both committed and anticipated exposures.
The impact of a 10% strengthening or weakening of the currency against the USD, EUR, GBP and CNY with all other variables held constant is disclosed in note 29.2. The effect of this movement is based on the outstanding forward foreign exchange contracts held by the group at year-end.
Interest rate risk The group has interest-bearing assets and liabilities in the form of call deposits, money market investments and short-
term borrowings.
Interest-bearing assets and liabilities have variable rates which are impacted by market factors and expose the group to cash flow interest rate risk.
There were no material interest rate sensitivities at year-end.
Price risk The group’s exposure to other price risk relates to fluctuations in the share price of the company as a result of the options that
have been granted to employees in terms of the long-term incentive scheme (refer to note 23.1). The group uses derivative financial instruments in the form of options to hedge exposure in respect of fluctuations in the share scheme obligation arising from movements in the company’s share price. Sufficient options were purchased in order to settle the total expected future obligation. As a result of the hedging relationship, movements in the company share price will not have a material impact on either profit or loss or equity of the group.
Credit risk Credit risk is the risk of financial loss to the group if a customer or counterparty to a financial instrument fails to meet its
contractual obligations, and arises primarily from the group’s receivables. Credit risk is managed on a group basis. Credit risk arises from cash and cash equivalents, money market investments, derivative financial instruments and deposits with banks and financial institutions, as well as credit exposures to Distribution and Retail customers, including outstanding receivables and committed transactions.
Trade and other receivables The group’s exposure to credit risk is influenced mainly by the individual characteristics of each customer. In relation to the Retail
business, trade receivables primarily relate to recoverables from vendors with which the group has a trading relationship and medical aids with respect to pharmacy recoverables, while in Distribution, customers (excluding intercompany) are primarily hospitals and independent pharmacists.
In relation to the Distribution business, the risk management has been delegated to the management of the subsidiary business.
Management has a credit policy in place and the exposure to credit risk is monitored on an ongoing basis. Credit evaluations are performed on all customers.
Credit Guarantee Insurance Corporation of Africa Limited is utilised to cover the majority of wholesale customers with a credit balance over a predetermined amount.
Goods are sold subject to retention of title clauses in Distribution so that in the event of non-payment the group may have a secured claim.
The group establishes an allowance for impairment that represents its estimate of incurred losses in respect of trade and other receivables.
The main components of this allowance are specific loss components that relate to individually significant exposures, and a collective loss component established for groups of similar assets in respect of losses that have been incurred but not yet identified.
The collective loss allowance is determined based on historical data of payment statistics of similar financial assets.
– 54 –Clicks Group Audited Annual Financial Statements 2018

NOTES TO THE ANNUAL F INANCIAL STATEMENTS (CONTINUED)
FOR THE YEAR ENDED 31 AUGUST
28 Financial risk management (continued) Liquidity risk Liquidity risk is the risk that the group will not be able to meet its financial obligations as they fall due.
The group’s approach is to ensure, as far as possible, that it will always have sufficient liquidity to meet its liabilities when due, under both normal and stressed conditions, without incurring unacceptable losses or risk damage to the group’s reputation. Due to the dynamic nature of the underlying businesses, group treasury maintains flexibility in funding by holding availability through credit lines. At year-end the group’s total uncommitted facilities available was R2 092 million and USD44 million (2017: R2 173 million and USD46 million) of which the full balance remained undrawn (2017: nil drawn down).
See note 29.5 for details for maturity analysis of the group’s financial liabilities.
Capital risk management The group’s objectives when managing capital are to safeguard the group’s ability to continue as a going concern in order to
provide returns for shareholders and benefits for other stakeholders, and to maintain an optimal capital structure to reduce the cost of capital.
In order to maintain or adjust the capital structure, the group may adjust the amount of dividends paid to shareholders, return capital to shareholders and issue new shares. The group’s target of maintaining a ratio of shareholders’ interest to total assets is in the range of 25% to 30%. This is obtained through achieving the group’s earnings targets, management of working capital, share buy-backs and dividends.
In 2018 the shareholders’ interest to total assets was 38.3% (2017: 34.0%).
29 Financial instruments Market risk 29.1 Treasury risk management The treasury committee meets on a regular basis to analyse currency and interest rate exposures and re-evaluate treasury
management strategies.
29.2 Foreign exchange risk management The group is exposed to foreign currency risk as it imports merchandise. This risk is mitigated by entering into forward
exchange contracts. These contracts are matched with anticipated future cash flows in foreign currencies.
The group does not use forward exchange contracts for speculative purposes.
The group has measured these instruments at fair value (see note 16).
31 August 2018 31 August 2017
Exposure to currency risk – foreign exchange contracts
USD’000
GBP’000
EUR’000
CNY’000
USD’000
GBP’000
EUR’000
CNY’000
Forecast purchases and payables due at the end of the year 15 550 1 278 3 322 73 611 27 634 4 653 4 913 90 941
Forward exchange contracts subject to cash flow hedging 12 288 1 968 2 525 69 526 26 574 2 382 2 785 87 153
Net exposure 3 262 (690) 797 4 085 1 060 2 271 2 128 3 788
The following exchange rates applied during the year:
Average rateReporting date mid-
spot rate
2018 2017 2018 2017
USD 12.97 13.46 14.71 13.02
GBP 17.61 17.24 18.89 16.98
EUR 15.62 14.99 17.01 15.79
CNY 1.99 1.97 2.15 1.97
– 55 –Clicks Group Audited Annual Financial Statements 2018

NOTES TO THE ANNUAL F INANCIAL STATEMENTS (CONTINUED)
FOR THE YEAR ENDED 31 AUGUST
29 Financial instruments (continued)29.2 Foreign exchange risk management (continued)
Foreign exchange rate sensitivity analysisThe following table details the group’s sensitivity to a 10% strengthening in the South African Rand against the relevant foreign currencies. 10% is the sensitivity rate used when reporting foreign currency risk internally to management personnel and represents management’s assessment of a reasonable possible change in foreign exchange rates. The sensitivity analysis includes only outstanding foreign currency denominated monetary items and their adjusted translation for a 10% change in foreign currency rates.
USD impact GBP impact EUR impact CNY impact
2018R’000
2017R’000
2018R’000
2017R’000
2018R’000
2017R’000
2018R’000
2017R’000
Decrease in pre-tax other comprehensive income (15 974) (36 640) (3 474) (4 130) (3 964) (4 236) (13 791) (17 344)
Increase/(decrease) in profit before tax 4 798 1 392 (1 304) 3 857 1 355 3 359 878 830
For a 10% weakening of the South African Rand against the relevant currency, there would be an increase in pre-tax other comprehensive income and decrease in profit before tax.
29.3 Fair values of financial instruments
The fair values of financial assets and liabilities, together with the carrying amounts shown in the statement of financial position, are as follows:
31 August 2018 31 August 2017
Carrying valueR’000
Fair valueR’000
Carrying valueR’000
Fair value
R’000
Financial assets
Trade receivables (see note 18) Loans and receivables 1 742 529 1 742 529 1 701 433 1 701 433
Logistics fees receivable (see note 18) Loans and receivables 138 080 138 080 223 251 223 251
Other receivable (see note 18) Loans and receivables 26 191 26 191 8 782 8 782
Loans receivable (see note 14) Loans and receivables 24 678 24 678 13 500 13 500
Financial assets at fair value through profit or loss (see note 15) Assets at fair value 82 482 82 482 27 580 27 580
Cash and cash equivalents Loans and receivables 1 523 815 1 523 815 700 473 700 473
Equity derivative contracts used for cash flow hedging (see note 16) Assets at fair value 413 924 413 924 325 739 325 739
Forward exchange contracts used for cash flow hedging (see note 16) Assets at fair value 39 242 39 242 – –
Financial liabilities
Forward exchange contracts used for cash flow hedging (see note 16) Financial liabilities measured at fair value – – 9 142 9 142
Trade and other payables (see note 25)
Financial liabilities measured at amortised cost 5 961 490 5 961 490 5 260 353 5 260 353
– 56 –Clicks Group Audited Annual Financial Statements 2018

NOTES TO THE ANNUAL F INANCIAL STATEMENTS (CONTINUED)
FOR THE YEAR ENDED 31 AUGUST
29 Financial instruments (continued) 29.3 Fair values of financial instruments (continued) Basis for determining fair values The following summarises the significant methods and assumptions used in estimating the fair values of financial instruments
reflected in the table above.
Derivatives Fair values of currency, interest rate and equity derivatives are calculated using standard market calculation conventions
with reference to the relevant closing market spot rates, forward foreign exchange, interest rates and share price.
Non-derivative financial assets and liabilities Fair value is calculated based on the present value of future principal and interest cash flows, discounted at the market rate
of interest at the reporting date except for the insurance cell captive where fair value is determined based on the net asset value at the reporting date.
The fair value of investments held by the New Clicks Foundation Trust is determined by reference to the quoted price in an active market.
The table below provides the valuation method of financial instruments carried at fair value. The different levels have been defined as follows:
Level 1 – Quoted prices (unadjusted) in active markets for identical assets and liabilities.
Level 2 – Inputs other than quoted prices included within level 1 that are observable for the asset or liability, either directly (i.e. prices) or indirectly (i.e. derived from prices).
Level 3 – Inputs for the asset or liability that are not based on observable market data (unobservable inputs).
The fair value of financial instruments that are not traded in an active market is determined by using valuation techniques. These valuation techniques maximise the use of observable market data where it is available and rely as little as possible on entity-specific estimates. If all significant inputs required to fair value an instrument are observable, the instrument is included in level 2.
If one or more of the significant inputs is not based on observable market data, the instrument is included in level 3.
– 57 –Clicks Group Audited Annual Financial Statements 2018

NOTES TO THE ANNUAL F INANCIAL STATEMENTS (CONTINUED)
FOR THE YEAR ENDED 31 AUGUST
29 Financial instruments (continued)29.3 Fair values of financial instruments (continued)
Financial assets and financial liabilities measured at fair value
GroupLevel 1
R’000Level 2
R’000Level 3
R’000Total
R’0002018Financial assetsFinancial assets at fair value through profit or loss (see note 15) – 16 850 – 16 850 Financial assets at fair value through profit or loss (see note 15) 65 632 – – 65 632 Equity derivative contracts used for cash flow hedging (see note 16) – 413 924 – 413 924 Forward exchange contracts used for cash flow hedging (see note 16) – 39 242 – 39 242 Total 65 632 470 016 – 535 648
2017Financial assetsFinancial assets at fair value through profit or loss (see note 15) 16 301 11 279 – 27 580 Equity derivative contracts used for cash flow hedging (see note 16) – 325 739 – 325 739 Total 16 301 337 018 – 353 319
Financial liabilitiesForward exchange contracts used for cash flow hedging (see note 16) – 9 142 – 9 142Total – 9 142 – 9 142
There have been no transfers between levels 1, 2 and 3 during the period.
29.4 Credit risk management Credit risk refers to the risk that a counterparty may default on its contractual obligation, resulting in financial loss to
the group. The group is exposed to credit risk arising from cash equivalents, a money market investment, derivative financial instruments and deposits with banks and financial institutions, as well as credit exposures to Distribution and Retail customers, including outstanding receivables and committed transactions. Management has a formal credit policy in place as a means of mitigating the risk of financial loss to the group.
The carrying amount of financial assets represents the maximum credit exposure. The maximum exposure to credit risk at the reporting date was:
Carrying amount
2018R’000
2017R’000
Derivative financial assets (see note 16) 453 166 325 739
Trade receivables (see note 18) 1 742 529 1 701 433
Logistics fees receivable (see note 18) 138 080 223 251
Other receivable (see note 18) 26 191 8 782
Cash and cash equivalents 1 523 815 700 473
Loans receivable (see note 14) 24 678 13 500
3 908 459 2 973 178
– 58 –Clicks Group Audited Annual Financial Statements 2018

NOTES TO THE ANNUAL F INANCIAL STATEMENTS (CONTINUED)
FOR THE YEAR ENDED 31 AUGUST
29 Financial instruments (continued) 29.4 Credit risk management (continued) Trade receivables The group’s exposure to credit risk is influenced mainly by the individual characteristics of each customer. Management has
a credit policy in place and exposure to credit risk is monitored on an ongoing basis. Credit evaluations are performed on all customers who purchase from the group.
Trade receivables can be categorised into Distribution customers and Retail customers.
The maximum exposure to credit risk, after impairment, for trade receivables at the reporting date by type of customer was:
Carrying amount
2018R’000
2017R’000
Retail customers 101 725 103 035
Distribution customers 1 640 804 1 598 398
1 742 529 1 701 433
Retail customers The ageing of trade receivables at the reporting date was:
2018 2017
Gross R’000
ImpairmentR’000
NetR’000
Gross R’000
ImpairmentR’000
NetR’000
Not past due 110 738 (9 013) 101 725 101 605 (4 700) 96 905
Past due 0 – 30 days – – – 2 347 (100) 2 247
Past due more than 31 days – – – 7 083 (3 200) 3 883
Total 110 738 (9 013) 101 725 111 035 (8 000) 103 035
Retail trade receivables mainly relate to receivables from medical aids with respect to pharmacy debtors.
Trade debtors are classified as past due when they have passed their payment date by one day.
Distribution customers The ageing of trade receivables at the reporting date was:
2018 2017
Gross R’000
ImpairmentR’000
NetR’000
Gross R’000
ImpairmentR’000
NetR’000
Not past due 1 530 085 – 1 530 085 1 431 141 – 1 431 141
Past due 0 – 30 days 111 477 (758) 110 719 145 774 – 145 774
Past due more than 31 days 17 839 (17 839) – 44 082 (22 599) 21 483
Total 1 659 401 (18 597) 1 640 804 1 620 997 (22 599) 1 598 398
Trade debtors are classified as past due when they have passed their payment date by one day.
Distribution customers are primarily hospitals and independent pharmacists.
The Distribution business minimises its exposure to credit risk by insuring debtors with balances greater than a predetermined amount.
There is an excess (which varies between hospitals and independent pharmacists) that is carried by the Distribution business with the balance being covered by Credit Guarantee Insurance Corporation of Africa Limited.
– 59 –Clicks Group Audited Annual Financial Statements 2018

NOTES TO THE ANNUAL F INANCIAL STATEMENTS (CONTINUED)
FOR THE YEAR ENDED 31 AUGUST
29 Financial instruments (continued)29.4 Credit risk management (continued)
The split between insured and uninsured gross distribution debtors is as follows:
Gross amount
2018R’000
2017R’000
Insured 1 654 919 1 563 908
Uninsured 4 482 57 089
1 659 401 1 620 997
Uninsured debtors consist mainly of a concentration of debtors with a monthly turnover of less than R40 000 and low-risk debtors such as government debtors.
The exposure to credit risk in respect of these debtors is managed through credit evaluations.
Impairment loss The impairment is determined based on information regarding the financial position of each trade receivable at year-end.
The group’s trade receivables are stated net of impairment losses. An analysis of impairment losses are as follows:
Retail Distribution
2018R’000
2017R’000
2018R’000
2017R’000
Balance at the beginning of the year (8 000) (4 300) (22 599) (19 781)
Additional allowances made (1 013) (3 700) (4 102) (2 818)
Trade receivables written off during the year as uncollectible – – 8 104 –
Balance at the end of the year (9 013) (8 000) (18 597) (22 599)
The creation of impairment losses have been included in “other costs” in profit or loss (see note 5).
Amounts charged to the allowance account are generally written off to profit or loss when there is no expectation of recovery.
Cash and cash equivalents The group’s current accounts, short-term deposits and money market fund are with reputable institutions, all of which have
a strong credit rating.
Other loans Other loans are reviewed at least on an annual basis to assess their recoverability. None of the loans are considered to be
impaired at the end of the financial year.
29.5 Liquidity risk management Liquidity risk is the risk that the group will not be able to meet its financial obligations as they fall due. The group’s approach
to managing liquidity is to ensure, as far as possible, that it will always have sufficient liquidity to meet its liabilities when due, under both normal and stressed conditions, without incurring unacceptable losses or risk damage to the group’s reputation.
– 60 –Clicks Group Audited Annual Financial Statements 2018

NOTES TO THE ANNUAL F INANCIAL STATEMENTS (CONTINUED)
FOR THE YEAR ENDED 31 AUGUST
29 Financial instruments (continued) 29.5 Liquidity risk management (continued) Liquidity and interest risk tables The following tables detail the group’s remaining contractual maturity for its financial liabilities, including interest payments
and excluding the impact of netting agreements:
Carrying amount
R’000
Contractual cash flows
R’000
One year or lessR’000
2018
Liabilities
Trade and other payables (see note 25) 5 961 490 5 961 490 5 961 490
5 961 490 5 961 490 5 961 490
2017
Liabilities
Derivative financial liabilities (see note 16) 9 142 9 142 9 142
Trade and other payables (see note 25) 5 260 353 5 260 353 5 260 353
5 269 495 5 269 495 5 269 495
30 Capital commitments Group
2018R’000
2017R’000
Capital expenditure approved by the directors
Contracted 133 337 184 028
Not contracted 565 612 496 485
698 949 680 513
The capital expenditure will be financed from borrowings and internally generated funds.
31 Financial guarantees Group companies provide surety for other group companies to the value of R2 092 million and USD44 million (2017: R2 173 million
and USD46 million) with respect to facilities held with various banks. At year-end these facilities had no drawings by group companies (2017: nil). The fair values of the financial guarantees are considered negligible.
– 61 –Clicks Group Audited Annual Financial Statements 2018

NOTES TO THE ANNUAL F INANCIAL STATEMENTS (CONTINUED)
FOR THE YEAR ENDED 31 AUGUST
32 Related party transactions 32.1 Group Clicks Group Limited is the ultimate holding company of the group.
Transactions between group subsidiaries During the year, in the ordinary course of business, certain companies within the group entered into transactions with one
another. These intragroup transactions have been eliminated on consolidation. For a list of the group’s main subsidiaries, see page 67.
Related party transactions include: (i) dividends paid and received from subsidiary companies and associates; (ii) interest received from or paid to subsidiary companies; (iii) loans to or from subsidiary companies; (iv) sale of goods between subsidiary companies; and (v) repurchase of “A” ordinary shares from the Employee Share Ownership Trust.
Directors and key management Certain non-executive directors are also non-executive directors of other public companies which transact with the group.
The relevant directors do not believe that they have control, joint control or significant influence over the financial or operating policies of those companies.
Executive directors’ employment contracts do not provide for a defined period of employment, but specify a notice period for the chief executive officer of 12 months and six months for the other executive directors. During this notice period, all standard benefits accrue to the directors in question. Contracts do not provide for predetermined compensation on termination other than that accorded to employees in terms of the group’s remuneration policies.
Employee benefits paid to directors and key management personnel are detailed in note 4.
Shares held by directors and their related entities The audited percentage of shares held by directors of the company at year-end is disclosed on page 69.
Group
2018R’000
2017R’000
Transactions with Sorbet Brands Proprietary Limited
Dividends received 2 233 3 143
Management fee received 1 688 –
Royalties paid 4 105 2 984
Other related partiesThe group has identified The Clicks Helping Hand Trust as a related party because of the group’s involvement in the charitable and developmental activities of the trust. The group has not consolidated the trust as it is not exposed to variable returns and any non-financial benefit is considered to be insignificant. The total net assets for the trust is R33 457 (2017: R2.5 million) and a net loss of R2.4 million (2017: R5.4 million) was incurred. Donations to the trust during the year from subsidiary companies were:
The Clicks Helping Hand Trust 9 562 4 087
No financial benefits were derived by the group from this relationship.
Contributions to pension and provident fundContributions paid to pension and provident funds are included in note 4 and additional information in note 23.
– 62 –Clicks Group Audited Annual Financial Statements 2018
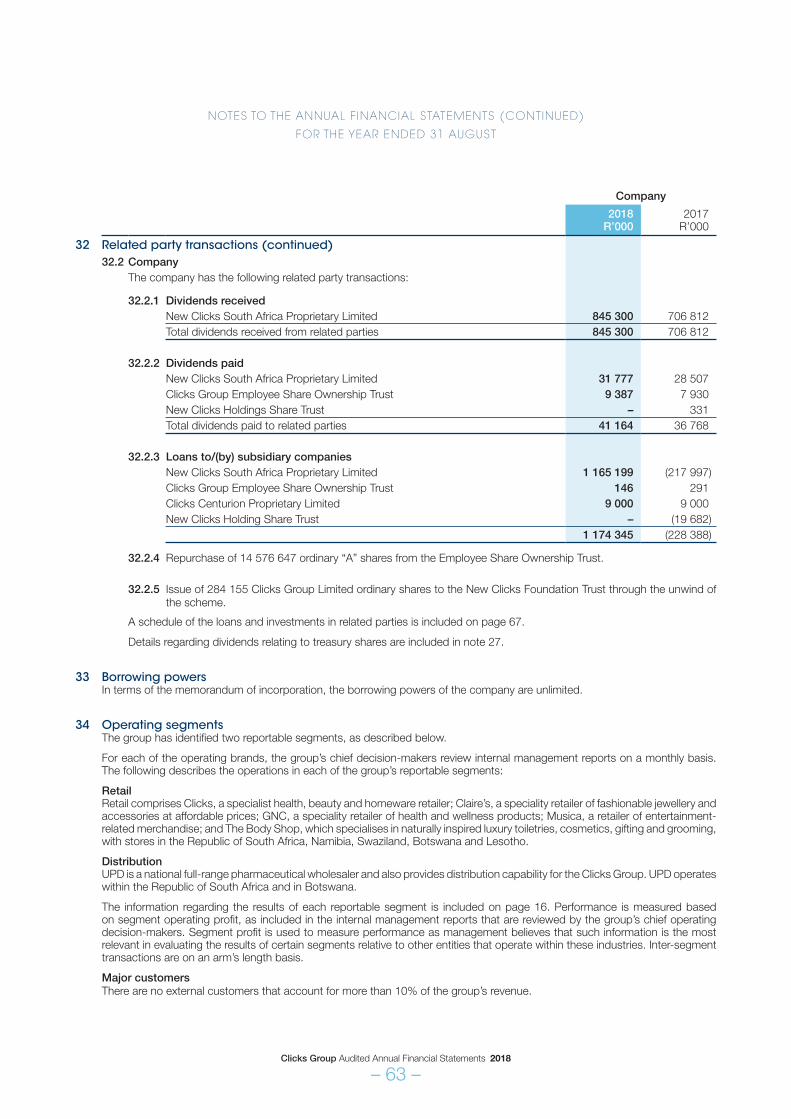
NOTES TO THE ANNUAL F INANCIAL STATEMENTS (CONTINUED)
FOR THE YEAR ENDED 31 AUGUST
Company
2018R’000
2017R’000
32 Related party transactions (continued)32.2 Company
The company has the following related party transactions:
32.2.1 Dividends receivedNew Clicks South Africa Proprietary Limited 845 300 706 812 Total dividends received from related parties 845 300 706 812
32.2.2 Dividends paid New Clicks South Africa Proprietary Limited 31 777 28 507 Clicks Group Employee Share Ownership Trust 9 387 7 930 New Clicks Holdings Share Trust – 331 Total dividends paid to related parties 41 164 36 768
32.2.3 Loans to/(by) subsidiary companiesNew Clicks South Africa Proprietary Limited 1 165 199 (217 997)Clicks Group Employee Share Ownership Trust 146 291 Clicks Centurion Proprietary Limited 9 000 9 000 New Clicks Holding Share Trust – (19 682)
1 174 345 (228 388)
32.2.4 Repurchase of 14 576 647 ordinary “A” shares from the Employee Share Ownership Trust.
32.2.5 Issue of 284 155 Clicks Group Limited ordinary shares to the New Clicks Foundation Trust through the unwind of the scheme.
A schedule of the loans and investments in related parties is included on page 67.
Details regarding dividends relating to treasury shares are included in note 27.
33 Borrowing powers In terms of the memorandum of incorporation, the borrowing powers of the company are unlimited.
34 Operating segments The group has identified two reportable segments, as described below.
For each of the operating brands, the group’s chief decision-makers review internal management reports on a monthly basis. The following describes the operations in each of the group’s reportable segments:
Retail Retail comprises Clicks, a specialist health, beauty and homeware retailer; Claire’s, a speciality retailer of fashionable jewellery and
accessories at affordable prices; GNC, a speciality retailer of health and wellness products; Musica, a retailer of entertainment-related merchandise; and The Body Shop, which specialises in naturally inspired luxury toiletries, cosmetics, gifting and grooming, with stores in the Republic of South Africa, Namibia, Swaziland, Botswana and Lesotho.
Distribution UPD is a national full-range pharmaceutical wholesaler and also provides distribution capability for the Clicks Group. UPD operates
within the Republic of South Africa and in Botswana.
The information regarding the results of each reportable segment is included on page 16. Performance is measured based on segment operating profit, as included in the internal management reports that are reviewed by the group’s chief operating decision-makers. Segment profit is used to measure performance as management believes that such information is the most relevant in evaluating the results of certain segments relative to other entities that operate within these industries. Inter-segment transactions are on an arm’s length basis.
Major customers There are no external customers that account for more than 10% of the group’s revenue.
– 63 –Clicks Group Audited Annual Financial Statements 2018