Notes to Consolidated Financial Statements 6 Reports... · Managing Director Director ......
25
Transcript of Notes to Consolidated Financial Statements 6 Reports... · Managing Director Director ......


Report of Independent Auditors 1
Consolidated Balance Sheets 2
Consolidated Statements of Income 3
Consolidate Statements of Changes in Shareholder’s Equity 4
Consolidated Statements of Comprehensive Income 4
Consolidated Statements of Cash Flows 5
Notes to Consolidated Financial Statements 6
FINANCIALS


Page 2
The accompanying notes on pages 6 to 23 form an integral part of these consolidated financial statements.
Report of Independent Auditors page 1
2009 2008
AssetsCash and demand deposits with banks 322,750,508 387,654,991Term deposits with banks 1,060,944,050 1,528,642,770 Total cash and deposits with banks (note 3 and note 8) 1,383,694,558 1,916,297,761
InvestmentsAvailable for sale 504,963,735 117,123,219Held to maturity 76,795,658 706,454,906
Total investments (note 4 and 12) 581,759,393 823,578,125
Loans, net of allowance for credit losses (note 5, 6 and 8) 564,757,494 507,619,348Premises, equipment and computer software (note 7) 57,526,071 55,803,648Accrued interest (note 8) 2,397,189 10,002,507Intangible assets (note 9) 780,973 861,757Other assets (note 8 and 15) 14,079,613 11,932,291Total assets 2,604,995,291 3,326,095,437
LiabilitiesDeposits
Non-interest bearing 277,364,165 255,584,564 Interest bearing
Customers 2,058,090,492 2,738,629,131Banks 76,292,697 122,589,691
Total deposits (note 8 and 10) 2,411,747,354 3,116,803,386
Accrued interest (note 8) 497,461 2,137,643 Other liabilities (note 8 and 15) 34,138,469 27,216,667Total other liabilities 34,635,930 29,354,310Total liabilities 2,446,383,284 3,146,157,696
Shareholder’s equityShare capital ($1.00 par: Authorised shares 16,450,000 (2008:16,450,000)) 16,450,000 16,450,000Retained earnings 153,116,393 163,487,741 Accumlated other comprehensive loss (10,954,386) - Total shareholder's equity 158,612,007 179,937,741 Total liabilities and shareholder's equity 2,604,995,291 3,326,095,437
Signed on behalf of the Board by:
Conor J. O’Dea James E. O’NeillManaging Director Director
Butterfield Bank (Cayman) LimitedConsolidated Balance Sheets
As at 31 December (Expressed in United States Dollars)

Page 3
The accompanying notes on pages 6 to 23 form an integral part of these consolidated financial statements.
Report of Independent Auditors page 1
Butterfield Bank (Cayman) LimitedConsolidated Statements of Income
For the year ended 31 December (Expressed in United States Dollars)
2009 2008
Non-interest incomeAsset management (note 8) 4,721,507 5,228,720Banking services 11,726,228 10,987,432Foreign exchange revenue 11,385,384 13,437,560Trust and corporate services 5,174,775 5,605,902Other non-interest income 644,876 86,230Total non-interest income 33,652,770 35,345,844
Interest incomeLoans (note 8 and 13) 23,870,926 23,256,371Investments 7,445,780 25,811,515Deposits with banks (note 8) 9,528,750 40,807,082Total interest income 40,845,456 89,874,968
Interest expense (note 8) (6,209,265) (39,910,784)
Net interest income before allowance for credit losses 34,636,191 49,964,184Allowance for credit losses (note 5) (7,786,858) (639,361)Net interest income after allowance for credit losses 26,849,333 49,324,823
Total revenue 60,502,103 84,670,667
Non-interest expenseSalaries and other employee benefits 26,254,777 27,517,353 Technology and communications 9,777,606 6,034,205Professional and outside services 704,471 4,571,017Property 5,681,357 6,589,791Non-income taxes 904,803 1,156,925Amortisation of intangible assets (note 9) 80,784 80,784Marketing 1,009,922 918,092Other expenses (note 8 and 14) 7,721,031 10,418,271Total non-interest expense 52,134,751 57,286,438
Net income from continuing operations before investment gains and losses 8,367,352 27,384,229
Net realised gains on held to maturity investments (note 4) 261,300 -Other-than-temporary impairment losses on held to maturity investments (note 4) - (29,745,212)
Net income/(loss) from continuing operations 8,628,652 (2,360,983)
Net income from discontinued operations (note 2) - 80,646,894
Net income 8,628,652 78,285,911
Page 4
The accompanying notes on pages 6 to 23 form an integral part of these consolidated financial statements.
Report of Independent Auditors page 1
2009 2008
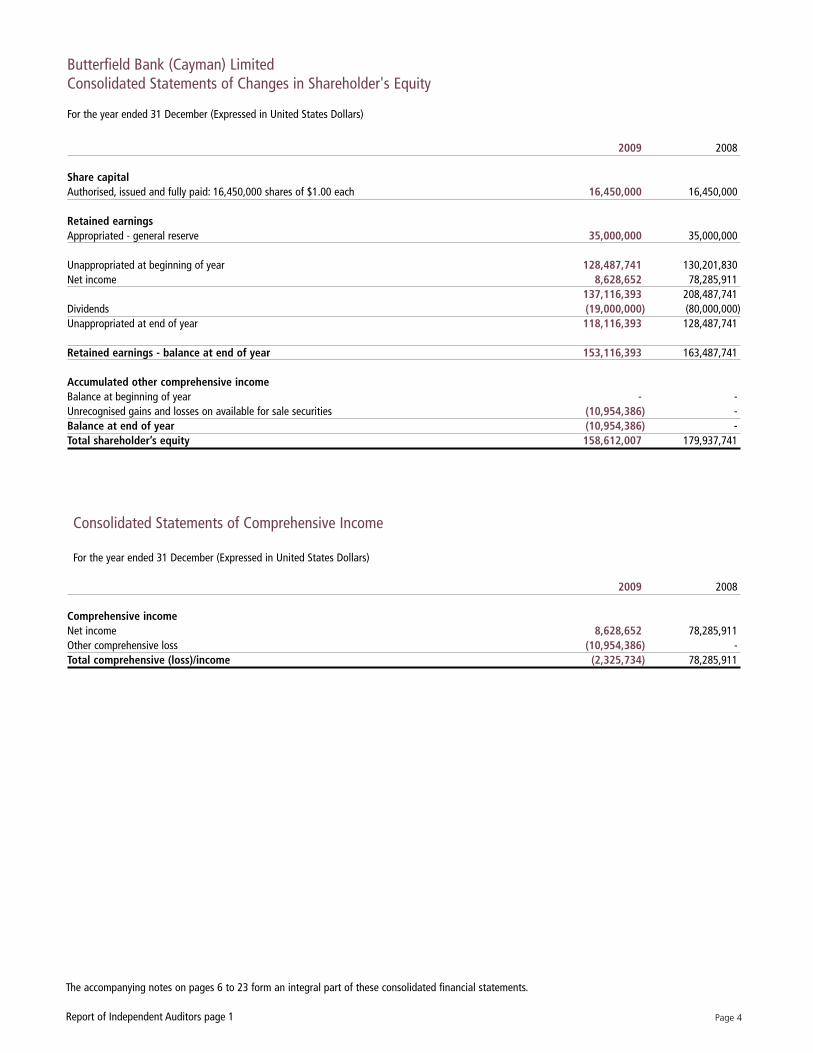
Share capitalAuthorised, issued and fully paid: 16,450,000 shares of $1.00 each 16,450,000 16,450,000
Retained earningsAppropriated - general reserve 35,000,000 35,000,000
Unappropriated at beginning of year 128,487,741 130,201,830Net income 8,628,652 78,285,911
137,116,393 208,487,741Dividends (19,000,000) (80,000,000)Unappropriated at end of year 118,116,393 128,487,741
Retained earnings - balance at end of year 153,116,393 163,487,741
Accumulated other comprehensive incomeBalance at beginning of year - -Unrecognised gains and losses on available for sale securities (10,954,386) -Balance at end of year (10,954,386) -Total shareholder’s equity 158,612,007 179,937,741
2009 2008
Comprehensive incomeNet income 8,628,652 78,285,911Other comprehensive loss (10,954,386) -Total comprehensive (loss)/income (2,325,734) 78,285,911
Butterfield Bank (Cayman) LimitedConsolidated Statements of Changes in Shareholder's Equity
For the year ended 31 December (Expressed in United States Dollars)
Consolidated Statements of Comprehensive Income
For the year ended 31 December (Expressed in United States Dollars)

Page 5
The accompanying notes on pages 6 to 23 form an integral part of these consolidated financial statements.
Report of Independent Auditors page 1
2009 2008
Cash flows from operating activitiesNet income 8,628,652 78,285,911 Adjustments to reconcile net income to cash provided by operating activities
Depreciation and amortisation 4,154,207 4,522,143Allowance for credit losses 7,786,858 639,361Impairment losses on held to maturity investments - 29,745,212Gain on sale of subsidiary - (77,330,116)
20,569,717 35,862,511Net change in other assets and liabilities 10,739,616 (8,195,878)Cash provided by operating activities 31,309,333 27,666,633
Cash flows from investing activitiesNet decrease/(increase) in term deposits with banks 467,698,720 (141,601,810)Net additions to premises, equipment and computer software (5,795,846) (10,051,282)Net increase in loans (64,925,004) (130,888,972)Available for sale securities: proceeds from maturities 456,123,219 50,000,000Available for sale securities: purchases and transfers (441,500,000) (167,123,219)Held to maturity securities: proceeds from maturities and transfers 231,233,627 72,957,452Held to maturity securities: purchases (14,992,500) -Proceeds from gain on sale of subsidiary - 77,330,116Cash provided/(used in) by investing activities 627,842,216 (249,377,715)
Cash flows from financing activitiesNet (decrease)/increase in customer deposits (705,056,032) 606,110,608Cash dividends paid (19,000,000) (80,000,000) Cash (used in)/provided by financing activities (724,056,032) 526,110,608)
Net (decrease)/increase in cash and demand deposits (64,904,483) 304,399,526
Cash and demand deposits at beginning of year 387,654,991 83,255,465Cash and demand deposits at end of year 322,750,508 387,654,991
Supplemental disclosure of cash flow information
Cash interest paid in the year 7,849,447 42,156,913
Butterfield Bank (Cayman) LimitedConsolidated Statements of Cash Flows
For the year ended 31 December (Expressed in United States Dollars)

Page 6Report of Independent Auditors page 1
Notes to Consolidated Financial StatementsFor the year ended 31 December 2009 and 2008 (Expressed in United States Dollars)
Note 1: Significant Accounting Policies
(a) Basis of Presentation and Use of Estimates and AssumptionsThe accounting and financial reporting policies of Butterfield Bank (Cayman) Limited (the “Bank") and its subsidiaries conform to Generally Accepted AccountingPrinciples in the United States of America (“GAAP”). The preparation of financial statements in accordance with GAAP requires management to make estimatesand assumptions that affect the reported amounts of assets and liabilities and disclosure of contingent assets and liabilities at the date of the financial statementsand the reported amounts of revenues and expenses for the period. Such estimates, including the provision for credit losses, the fair value of financial instruments,the fair value of investments, the carrying value of intangible assets require management to make subjective or complex judgments and are subject to change inthe future as additional information becomes available or previously existing circumstances are modified.
(b) Basis of ConsolidationThe Bank consolidates subsidiaries where it holds, directly or indirectly, more than 50% of the voting rights or where it exercises control. Entities where the Bankholds 20% to 50% of the voting rights and/or has the ability to exercise significant influence, other than investments in designated variable interest entities (VIEs),are accounted for under the equity method, and the pro rata share of their income (loss) is included in other income. The Bank consolidates entities deemed to beVIEs when the Bank is determined to be the primary beneficiary under the Financial Accounting Standards Board (FASB) Accounting Standard Codification (ASC)810 "Consolidation" (ASC 810). The Bank has no interest in any VIEs which are required to be consolidated under ASC 810.
(c) Foreign Currency TranslationAssets and liabilities arising from other foreign currency transactions are translated into United States dollars at the rates of exchange prevailing at the balancesheet date while associated revenues and expenses are translated to United States dollars at the average rates of exchange prevailing at the transaction date. Theresulting gains or losses are included in foreign exchange revenue in the Consolidated Statements of Income.
(d) Assets Held in Trust or CustodySecurities and properties (other than cash and deposits held with the Bank) held in a trust, agency or fiduciary capacity for customers are not included in theConsolidated Balance Sheets since the Bank is not the beneficiary of these assets.
(e) InvestmentsInvestments in debt securities include bonds, notes, certificates of deposits as well as certain loan or asset backed and structured securities subject to prepaymentrisk. Debt securities classified as “held to maturity” represent securities that the Bank has both the ability and the intent to hold until maturity and are carried atamortised cost adjusted to recognise other than temporary impairment ("OTTI"). Debt securities classified as "available for sale" are carried at fair value, withunrealised gains and losses reported in other comprehensive income, with the exception of other than temporary impairments which are included in net income.
Fair value of investments is determined in accordance with note 1 (p).
In respect of “held to maturity” securities, declines in fair value that are determined to be other than temporary are charged to earnings. Accrual of income issuspended in respect of debt securities that are in default, or from which it is unlikely that future interest payments will be received as scheduled. Realised gainsand losses on sales of investments are included in earnings on a specific identified cost basis.
(f) LoansLoans are reported at the principal amount outstanding, net of allowance for credit losses, unearned income and net deferred loan fees. Interest income is recognisedover the term of the loan using the interest method, or on a basis approximating a level rate of return over the term of the loan, except for loans classified as non-accrual. Non-accrual loans are those on which the accrual of interest is discontinued. Loans are placed on non-accrual status immediately if, in the opinion ofmanagement, full payment of principal or interest is in doubt or when principal or interest is 90 days past due, unless the loan is fully secured and any collection effortsare reasonably expected to result in repayment of all amounts due under the contractual terms of the loan. The entire balance of an account is contractually delinquentif the minimum payment of principal or interest is not received by the specified due date. Delinquency is reported on loans that are 30 days or more past due.
Interest accrued but not collected at the date a loan is placed on non-accrual status is reversed against interest income. In addition, the amortisation of net deferredloan fees is suspended. Interest income on non-accrual loans is recognised only to the extent it is received in cash. However, where there is doubt regarding theultimate collectability of the loan principal, all cash thereafter received is applied to reduce the carrying value of the loan. Loans are restored to accrual status onlywhen interest and principal payments are brought current and future payments are reasonably assured.
Credit card loans that are contractually 180 days past due and consumer loans with an outstanding balance under $100,000 that are contractually 180 days pastdue are automatically written off.
The Bank accounts for and discloses non-accrual commercial loans as impaired loans, and recognises their interest income as previously discussed for non-accrual loans. Accordingly, interest income on these loans is recognised after the entire recorded investment is recovered, and interest is actually received. Inaddition, the amortisation of net deferred loan fees is suspended.
(g) Allowance for Credit LossesThe Bank maintains an allowance for credit losses, which in management’s opinion is adequate to absorb all incurred credit related losses in its portfolio relating toon and off balance sheet lending portfolio. The allowance for credit losses consists of specific allowances and a general allowance, each of which is reviewed on aregular basis. The allowance for credit losses is included as a reduction of the related asset category.
(h) Specific AllowancesSpecific allowances are determined on an item by item basis and reflect the associated estimated credit loss. The specific allowance for loan loss is computed asthe difference between the recorded investment in the loan and present value of expected future cash flows from the loan. The effective rate of return on the loan isused for discounting the cash flows. However, when foreclosure of a collateral-dependent loan is probable, the Bank measures impairment based on the fair valueof the collateral. The Bank considers estimated costs to sell, on a discounted basis, in the measurement of impairment if those costs are expected to reduce thecash flows available to repay or otherwise satisfy the loan. If the measurement of an impaired loan is less than the recorded investment in the loan, then the Bankrecognises impairment by creating a valuation allowance with a corresponding charge to provision for credit losses.

Page 7Report of Independent Auditors page 1
(i) General AllowancesThe allowance for credit losses attributed to the remaining portfolio is established via a process that estimates the probable loss inherent in the portfolio basedupon various analyses. These analyses consider historical default rates and loss severities, internal risk ratings, and geographic, industry, and other environmentalfactors. Management also considers overall portfolio indicators including trends in internally risk rated exposures, cash-basis loans, historical and forecasted write-offs, and a review of industry, geographic and portfolio concentrations, including current developments within those segments. In addition, management considersthe current business strategy and credit process, including limit setting and compliance, credit approvals, loan underwriting criteria and loan workout procedures.
Each portfolio of smaller balance, homogeneous loans, including consumer mortgage, installment, revolving credit, and most other consumer loans, is collectivelyevaluated for impairment. The allowance for credit losses attributed to these loans is established via a process that estimates the probable losses inherent in theportfolio, based upon various analyses. Management considers overall portfolio indicators including historical credit losses; delinquent (defined as loans withpayments contractually over 30 days past due), non-performing, and classified loans; trends in volumes and terms of loans; an evaluation of overall credit quality;the credit process, including lending policies and procedures; and economic, geographical, product, and other environmental factors.
(j) Intangible AssetsIntangible assets (customer relationships) are accounted for using the purchase method. Acquired intangible assets with finite lives are amortised on a straight linebasis over their estimated useful lives, not exceeding 15 years. Intangible assets’ estimated useful lives are reevaluated annually and an annual impairment test iscarried out to determine if certain indicators of impairment exist.
(k) Premises, Equipment and Computer SoftwareLand, buildings, equipment and computer software, including leasehold improvements, are carried at cost less accumulated depreciation. The Bank generallycomputes depreciation using the straight-line method over the estimated useful life of an asset, which are 50 years for buildings, and 3 to 10 years for otherequipment. For leasehold improvements the Bank uses the straight-line method over the lesser of the remaining term of the leased facility or the estimatedeconomic life of the improvement. The Bank capitalises certain costs associated with the acquisition or development of internal use software. Once the software isready for its intended use, these costs are amortised on a straight-line basis over the software's expected useful life, which is between 5 and 10 years. If deemedsignificant the Bank will capitalise interest cost in accordance with ASC 835-20 "Capitalisation of Interest" (ASC 835-20).
(l) DerivativesThe Bank's derivatives and hedging transactions are accounted for in accordance with ASC 815 "Derivatives and Hedging" (ASC 815) which establishesaccounting and reporting standards for financial derivatives, including certain financial derivatives embedded in other contracts and hedging activities. Inaccordance with ASC 815, all derivatives are recognised on the Consolidated Balance Sheet at their fair value.
On the date that the Bank enters into a derivative contract, it designates the derivative as either; a hedge of the fair value of a recognised asset or liability (a "fairvalue" hedge); a hedge of a forecasted transaction or the variability of cash flows that are to be received or paid in connection with a recognised asset or liability (a"cash flow" hedge), or an instrument that is held for trading or non-hedging purposes (a "trading" or "non-hedging" instrument).
Changes in the fair value of a derivative that is highly effective, and that is designated and qualifies as a fair-value hedge, along with changes in the fair value ofthe hedged asset or liability that are attributable to the hedged risk, are recorded in current-year earnings. Changes in the fair value of a derivative that is highlyeffective and that is designated and qualifies as a cash flow hedge, to the extent that the hedge is effective, are recorded in other comprehensive income, untilearnings are affected by the variability of cash flows of the hedged transaction. Any hedge ineffectiveness is recorded in current-year earnings.
Changes in the fair value of a derivative that is highly effective as and that is designated and qualifies as a foreign-currency hedge is recorded in either current-yearearnings or Other Comprehensive Income, depending on whether the hedging relationship satisfies the criteria for a fair-value or cash-flow hedge. Changes in thefair value of derivative trading and non-hedging instruments are reported in current-year earnings.
The Bank formally documents all relationships between hedging instruments and hedged items, as well as its risk-management objective and strategy forundertaking various hedge transactions. This process includes linking all derivatives that are designated as fair-value, cash flow, or foreign-currency hedges tospecific assets and liabilities on the Consolidated Balance Sheets or specific firm commitments or forecasted transactions. The Bank also formally assesseswhether the derivatives that are used in hedging transactions have been highly effective in offsetting changes in the fair value or cash flows of hedged items andwhether those derivatives may be expected to remain highly effective in future periods. When it is determined that a derivative has ceased to be highly effective asa hedge, the Bank discontinues hedge accounting prospectively.
For those hedge relationships that are terminated, hedge designations that are removed, or forecasted transactions that are no longer expected to occur, the hedgeaccounting treatment described in the paragraphs above is no longer applied and the end-user derivative is terminated or transferred to the trading account. For fairvalue hedges, any changes to the hedged item remain as part of the basis of the asset or liability and are ultimately reflected as an element of the yield. For cashflow hedges, any changes in fair value of the end-user derivative remain in other comprehensive income and are included in retained earnings of future periodswhen earnings are also affected by the variability of the hedged cash flows. If the forecasted transaction is no longer likely to occur, any changes in fair value of theend-user derivatives are immediately reflected in other income.
(m) Employee Future BenefitsThe Bank maintains a trusteed defined contribution pension plan for substantially all employees.
The Bank provides a monthly contribution to the trust based on each participating employee's pensionable earnings.
The Bank also contributes to The Bank of N. T. Butterfield & Son Limited's (the Bank's parent company, herein after the "Parent Bank") non-contributory definedbenefits pension plan for three (2008: three) eligible long serving employees. No unfunded liabilities are recorded in these financial statements as all relevantamounts are recorded and borne by the Parent Bank.
Amounts paid are expensed in the year.

Page 8Report of Independent Auditors page 1
(n) Share Based CompensationEligible Employees participate in the Parent Bank's share based compensation plans, which is accounted for and operated by the Parent Bank, in accordance withASC 718 "Compensation—Stock Compensation" (ASC 718). The Parent Bank follows the fair value method of accounting for share-based compensation plans.The fair value of share-based awards that eventually vest are amortised over the vesting period of the award are recharged and included in Salaries and otheremployee benefits in the Consolidated Statements of Income.
(o) Revenue RecognitionBanking services fees primarily include fees for certain loan origination, letters of credit, other financial guarantees, compensating balances and other financialservices related products. Certain loan origination fees are primarily overdraft and other revolving lines of credit fees. These fees are recognised as revenue overthe period of the underlying facilities. Letters of credit fees are recognised as revenue over the period in which the related service is provided. All other fees arerecognised as revenue in the period in which the service is provided.
Asset management fees include fees for investment management, investment advice, custody and brokerage services. Investment management and custody feesare recognised over the period in which the related service is provided, on a net asset value basis. Investment advice and brokerage services fees are recognisedin the period in which the related service is provided.
Trust and corporate services fees include fees for private and institutional trust, executorship, corporate and managed bank accounts. These fees are recognisedas revenue when the Bank has rendered all services to the clients and is entitled to collect the fee from the client, as long as there are no other contingenciesassociated with the fee.
Loan interest income includes the amortisation of non-refundable loan origination and commitment fees. These fees are deferred (except for certain retrospectivelydetermined fees meeting specified criteria) and recognised as an adjustment of yield over the life of the related loan. In accordance with ASC 310-20 "Receivables-Nonrefundable Fees and Other Costs" (ASC 320-20), these loan origination and commitment fees are offset by their related direct cost and only the net amountsare deferred and amortised into interest income.
Interest income on all securities, including amortisation of premiums and discounts on debt securities held for investment, are included in investment income in theConsolidated Statements of Income.
(p) Fair Value of Financial InstrumentsASC 820 "Fair Value Measurements and Disclosures" defines fair value as the exchange price that would be received for an asset or paid to transfer a liability (anexit price) in the principal or most advantageous market for the asset or liability in an orderly transaction between market participants on the measurement date.The Bank determines the fair values of its financial instruments based on the fair value hierarchy established in ASC 820 which requires an entity to maximise theuse of observable inputs and minimise the use of unobservable inputs when measuring fair value. The standard describes three levels of inputs that may be usedto measure fair value. The Bank carries at fair value investments classified as available for sale and derivative assets and liabilities.
Level 1, 2 and 3 valuation inputsManagement classifies items that are recognised at fair value on a recurring basis used on the Level of inputs used in their respective fair value determination asdescribed below. Fair value inputs are considered Level 1 when based on unadjusted quoted prices in active markets for identical assets. Fair vale inputs areconsidered Level 2 when based on internally developed models or based on prices published by independent pricing services using proprietary models. To qualifyfor Level 2, all significant inputs used in these models must be observable in the market place or can be corroborated by observable market data for substantiallythe full term of the investment and includes, among others: interest yield curves, credit spreads, prices for similar assets and foreign exchange rates. Level 2 alsoincludes financial instruments that are valued using quoted price for identical assets but for which the market is not considered active due to low trading volumes.Fair value inputs are considered Level 3 when based on internally developed models using significant unobservable assumptions involving management’sestimations or non-binding bid quotes from brokers.
The following methods and assumptions were used in the determination of the fair value of financial instruments:
i) Cash and deposits with banks: The fair value of cash and deposits with banks, being short term in nature, is deemed to equate to the carrying value.
ii) Investments: The fair values of investments are determined based on the quoted market price or independent pricing services when available. If unavailable,observable inputs from similar items in active markets or identical / similar items with inactive markets are used. In the absence of observable quoted pricesunobservable inputs are used.
iii) Loans: The majority of loans are variable rate and re-price in response to changes in market rates and hence the fair value has been estimated as thecarrying value. For fixed rate loans, the fair value is based on management’s best estimates.
iv) Accrued interest: The carrying values of accrued interest receivable and payable are assumed to approximate their fair values given their short-term nature.
v) Deposits: The fair value of fixed rate deposits, being short term in nature, is deemed to equate to the carrying value. The fair value of deposits with no statedmaturity date is deemed to equate to the carrying value.
vi) Derivatives: Fair value of exchange traded derivatives is based on quoted market prices. Fair value of over-the-counter derivatives is calculated as the netpresent value of contractual cash flows using prevailing market rates.
(q) Credit Related ArrangementsIn the normal course of business, the Bank enters into various commitments to meet the credit requirements of its customers. Such commitments, which are notincluded in the Consolidated Balance Sheets include:
i) Commitments to extend credit which represent undertakings to make credit available in the form of loans or other financing for specific amounts andmaturities, subject to certain conditions.
Page 9Report of Independent Auditors page 1
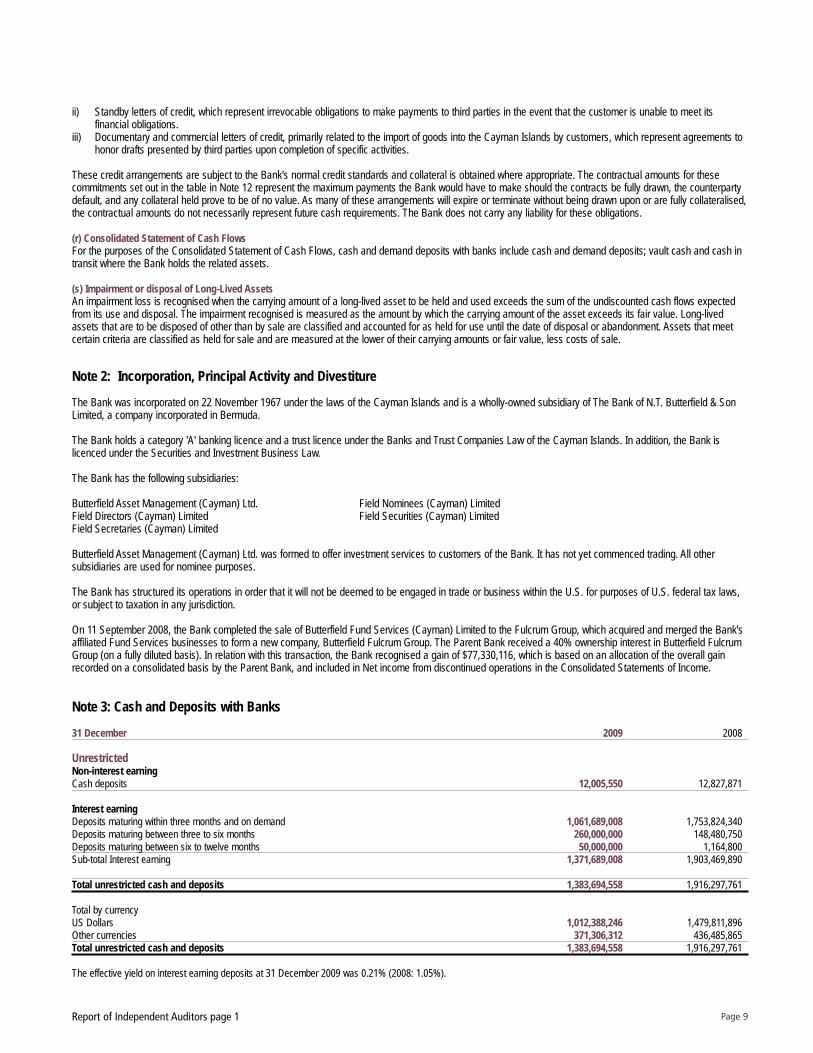
ii) Standby letters of credit, which represent irrevocable obligations to make payments to third parties in the event that the customer is unable to meet itsfinancial obligations.
iii) Documentary and commercial letters of credit, primarily related to the import of goods into the Cayman Islands by customers, which represent agreements tohonor drafts presented by third parties upon completion of specific activities.
These credit arrangements are subject to the Bank's normal credit standards and collateral is obtained where appropriate. The contractual amounts for thesecommitments set out in the table in Note 12 represent the maximum payments the Bank would have to make should the contracts be fully drawn, the counterpartydefault, and any collateral held prove to be of no value. As many of these arrangements will expire or terminate without being drawn upon or are fully collateralised,the contractual amounts do not necessarily represent future cash requirements. The Bank does not carry any liability for these obligations.
(r) Consolidated Statement of Cash FlowsFor the purposes of the Consolidated Statement of Cash Flows, cash and demand deposits with banks include cash and demand deposits; vault cash and cash intransit where the Bank holds the related assets.
(s) Impairment or disposal of Long-Lived AssetsAn impairment loss is recognised when the carrying amount of a long-lived asset to be held and used exceeds the sum of the undiscounted cash flows expectedfrom its use and disposal. The impairment recognised is measured as the amount by which the carrying amount of the asset exceeds its fair value. Long-livedassets that are to be disposed of other than by sale are classified and accounted for as held for use until the date of disposal or abandonment. Assets that meetcertain criteria are classified as held for sale and are measured at the lower of their carrying amounts or fair value, less costs of sale.
Note 2: Incorporation, Principal Activity and Divestiture
The Bank was incorporated on 22 November 1967 under the laws of the Cayman Islands and is a wholly-owned subsidiary of The Bank of N.T. Butterfield & SonLimited, a company incorporated in Bermuda.
The Bank holds a category 'A' banking licence and a trust licence under the Banks and Trust Companies Law of the Cayman Islands. In addition, the Bank islicenced under the Securities and Investment Business Law.
The Bank has the following subsidiaries:
Butterfield Asset Management (Cayman) Ltd. Field Nominees (Cayman) LimitedField Directors (Cayman) Limited Field Securities (Cayman) LimitedField Secretaries (Cayman) Limited
Butterfield Asset Management (Cayman) Ltd. was formed to offer investment services to customers of the Bank. It has not yet commenced trading. All othersubsidiaries are used for nominee purposes.
The Bank has structured its operations in order that it will not be deemed to be engaged in trade or business within the U.S. for purposes of U.S. federal tax laws,or subject to taxation in any jurisdiction.
On 11 September 2008, the Bank completed the sale of Butterfield Fund Services (Cayman) Limited to the Fulcrum Group, which acquired and merged the Bank'saffiliated Fund Services businesses to form a new company, Butterfield Fulcrum Group. The Parent Bank received a 40% ownership interest in Butterfield FulcrumGroup (on a fully diluted basis). In relation with this transaction, the Bank recognised a gain of $77,330,116, which is based on an allocation of the overall gainrecorded on a consolidated basis by the Parent Bank, and included in Net income from discontinued operations in the Consolidated Statements of Income.
Note 3: Cash and Deposits with Banks
31 December 2009 2008
UnrestrictedNon-interest earningCash deposits 12,005,550 12,827,871
Interest earningDeposits maturing within three months and on demand 1,061,689,008 1,753,824,340Deposits maturing between three to six months 260,000,000 148,480,750Deposits maturing between six to twelve months 50,000,000 1,164,800Sub-total Interest earning 1,371,689,008 1,903,469,890
Total unrestricted cash and deposits 1,383,694,558 1,916,297,761
Total by currencyUS Dollars 1,012,388,246 1,479,811,896Other currencies 371,306,312 436,485,865Total unrestricted cash and deposits 1,383,694,558 1,916,297,761
The effective yield on interest earning deposits at 31 December 2009 was 0.21% (2008: 1.05%).
Page 10Report of Independent Auditors page 1
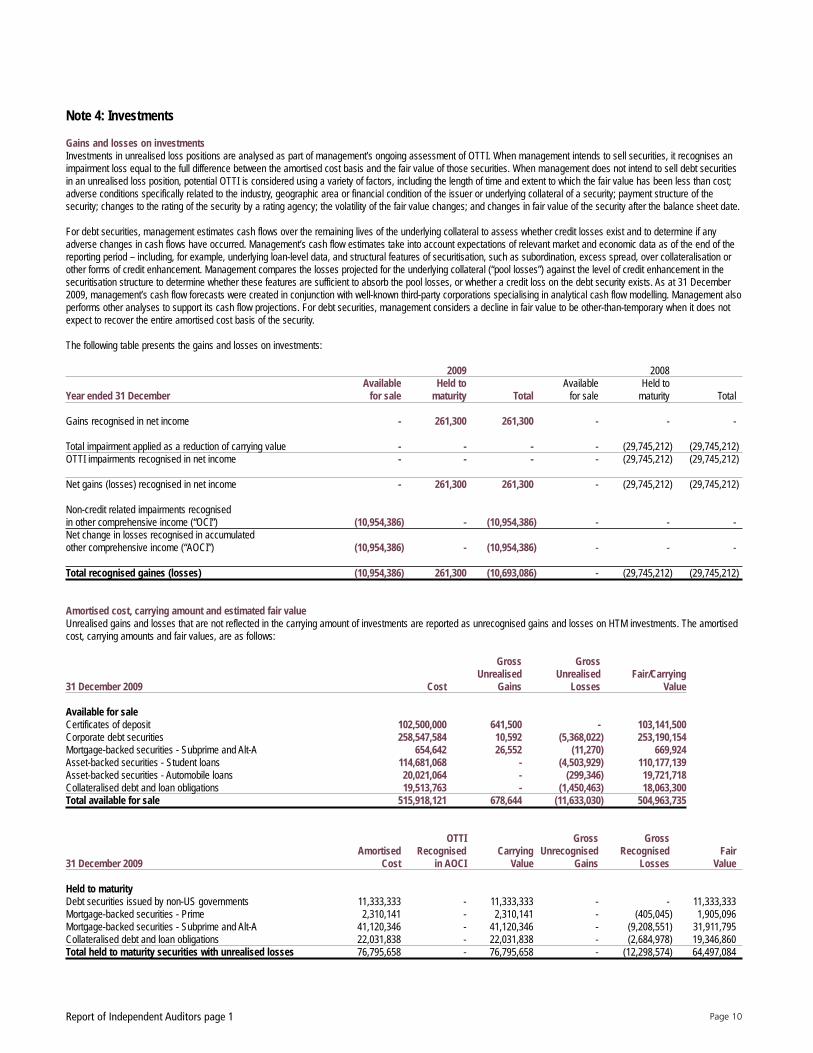
Note 4: Investments
Gains and losses on investmentsInvestments in unrealised loss positions are analysed as part of management’s ongoing assessment of OTTI. When management intends to sell securities, it recognises animpairment loss equal to the full difference between the amortised cost basis and the fair value of those securities. When management does not intend to sell debt securitiesin an unrealised loss position, potential OTTI is considered using a variety of factors, including the length of time and extent to which the fair value has been less than cost;adverse conditions specifically related to the industry, geographic area or financial condition of the issuer or underlying collateral of a security; payment structure of thesecurity; changes to the rating of the security by a rating agency; the volatility of the fair value changes; and changes in fair value of the security after the balance sheet date.
For debt securities, management estimates cash flows over the remaining lives of the underlying collateral to assess whether credit losses exist and to determine if anyadverse changes in cash flows have occurred. Management’s cash flow estimates take into account expectations of relevant market and economic data as of the end of thereporting period – including, for example, underlying loan-level data, and structural features of securitisation, such as subordination, excess spread, over collateralisation orother forms of credit enhancement. Management compares the losses projected for the underlying collateral (“pool losses”) against the level of credit enhancement in thesecuritisation structure to determine whether these features are sufficient to absorb the pool losses, or whether a credit loss on the debt security exists. As at 31 December2009, management’s cash flow forecasts were created in conjunction with well-known third-party corporations specialising in analytical cash flow modelling. Management alsoperforms other analyses to support its cash flow projections. For debt securities, management considers a decline in fair value to be other-than-temporary when it does notexpect to recover the entire amortised cost basis of the security.
The following table presents the gains and losses on investments:
2009 2008Available Held to Available Held to
Year ended 31 December for sale maturity Total for sale maturity Total
Gains recognised in net income - 261,300 261,300 - - -
Total impairment applied as a reduction of carrying value - - - - (29,745,212) (29,745,212)OTTI impairments recognised in net income - - - - (29,745,212) (29,745,212)
Net gains (losses) recognised in net income - 261,300 261,300 - (29,745,212) (29,745,212)
Non-credit related impairments recognisedin other comprehensive income (“OCI”) (10,954,386) - (10,954,386) - - -Net change in losses recognised in accumulatedother comprehensive income (“AOCI”) (10,954,386) - (10,954,386) - - -
Total recognised gaines (losses) (10,954,386) 261,300 (10,693,086) - (29,745,212) (29,745,212)
Amortised cost, carrying amount and estimated fair valueUnrealised gains and losses that are not reflected in the carrying amount of investments are reported as unrecognised gains and losses on HTM investments. The amortisedcost, carrying amounts and fair values, are as follows:
Gross GrossUnrealised Unrealised Fair/Carrying
31 December 2009 Cost Gains Losses Value
Available for saleCertificates of deposit 102,500,000 641,500 - 103,141,500Corporate debt securities 258,547,584 10,592 (5,368,022) 253,190,154Mortgage-backed securities - Subprime and Alt-A 654,642 26,552 (11,270) 669,924Asset-backed securities - Student loans 114,681,068 - (4,503,929) 110,177,139Asset-backed securities - Automobile loans 20,021,064 - (299,346) 19,721,718Collateralised debt and loan obligations 19,513,763 - (1,450,463) 18,063,300Total available for sale 515,918,121 678,644 (11,633,030) 504,963,735
OTTI Gross GrossAmortised Recognised Carrying Unrecognised Recognised Fair
31 December 2009 Cost in AOCI Value Gains Losses Value
Held to maturityDebt securities issued by non-US governments 11,333,333 - 11,333,333 - - 11,333,333Mortgage-backed securities - Prime 2,310,141 - 2,310,141 - (405,045) 1,905,096Mortgage-backed securities - Subprime and Alt-A 41,120,346 - 41,120,346 - (9,208,551) 31,911,795Collateralised debt and loan obligations 22,031,838 - 22,031,838 - (2,684,978) 19,346,860Total held to maturity securities with unrealised losses 76,795,658 - 76,795,658 - (12,298,574) 64,497,084

Page 11Report of Independent Auditors page 1
Gross GrossUnrealised Unrealised Fair/Carrying
31 December 2008 Cost Gains Losses Value
Available for saleCertificates of deposit 117,123,219 - - 117,123,219
Total available for sale 117,123,219 - - 117,123,219
OTTI Gross GrossAmortised Recognised Carrying Unrecognised Recognised Fair
31 December 2008 Cost in AOCI Value Gains Losses Value
Held to maturityUS government and federal agencies / corporations 14,703,312 - 14,703,312 - (227,077) 14,476,235Debt securities issued by non-US governments 12,979,166 - 12,979,166 - - 12,979,166Corporate debt securities 371,782,083 - 371,782,083 63,164 (26,910,597) 344,934,650Mortgage-backed securities - Prime 3,077,137 - 3,077,137 - (719,648) 2,357,489Mortgage-backed securities - Subprime and Alt-A 93,035,476 - 93,035,476 - (38,764,605) 54,270,871Asset-backed securities - Student loans 119,918,018 - 119,918,018 - (19,543,690) 100,374,328Asset-backed securities - Automobile loans 20,044,969 - 20,044,969 - (4,344,991) 15,699,978Collateralised debt and loan obligations 41,560,945 - 41,560,945 - (8,159,975) 33,400,970Structured investment vehicles 29,353,800 - 29,353,800 - - 29,353,800Total held to maturity securities with unrealised losses 706,454,906 - 706,454,906 63,164 (98,670,583) 607,847,487
Investments in the above table with gross unrecognised losses as at 31 December 2009 were considered temporarily impaired on that date. The impairments recognised inAOCI, when added to gross unrecognised losses on HTM investments, represent the total loss that would have been recognised in net income if the investment securitieshad been sold at their estimated fair value on 31 December 2009. The impairments recognised in AOCI are the result of various factors other than deterioration in thecreditworthiness of the issuer. Management does not intend to sell these securities and believes it is not likely that the Bank will be required to sell these securities prior torecovery of their amortised cost.
Overall, unrecognised losses on investments held at 31 December 2009 that were also held at 31 December 2008 have decreased since 31 December 2008 due primarily tothe effect of increased fair values across asset classes resulting from improved market spread and market liquidity. As of 31 December 2009, management does not intend tosell the securities with a loss position recognised in AOCI, and believes it is not likely that the Bank will be required to sell these securities before recovery of their amortisedcost basis.
Unrealised loss positionsThe following tables show the fair value and gross unrealised losses of the Bank's investments with unrealised losses that are not deemed to be other-than-temporarilyimpaired, aggregated by investment category and length of time that individual securities have been in a continuous unrealised loss position. Debt securities are categorisedas being in a continuous loss position for "less than 12 months" or "12 months or more" based on the point in time that the fair value declined below the cost basis.
Less than 12 months 12 months or moreGross Gross Total Total Gross
Number of Fair Unrealised Fair Unrealised Fair Unrealised31 December 2009 Securities Value Losses Value Losses Value Losses
Available for saleCorporate debt securities 17 - - 229,678,072 (5,368,022) 229,678,072 (5,368,022)Mortgage-backed securities - Subprime and Alt-A 1 - - 643,372 (11,270) 643,372 (11,270)Asset-backed securities - Student loans 5 - - 110,177,139 (4,503,929) 110,177,139 (4,503,929)Asset-backed securities - Automobile loans 1 - - 19,721,718 (299,346) 19,721,718 (299,346)Collateralised debt and loan obligations 2 - - 18,063,300 (1,450,463) 18,063,300 (1,450,463)Total available for sale securities with unrealised losses 26 - - 378,283,601 (11,633,030) 378,283,601 (11,633,030)
Held to maturityMortgage-backed securities - Prime 1 - - 1,905,096 (405,045) 1,905,096 (405,045)Mortgage-backed securities - Subprime and Alt-A 5 - - 31,911,795 (9,208,551) 31,911,795 (9,208,551)Collateralised debt and loan obligations 2 - - 19,346,860 (2,684,978) 19,346,860 (2,684,978)Total held to maturity securities with unrealised losses 8 - - 53,163,751 (12,298,574) 53,163,751 (12,298,574)
Total securities with unrealised losses 34 - - 431,447,352 (23,931,604) 431,447,352 (23,931,604)
Page 12Report of Independent Auditors page 1
Less than 12 months 12 months or moreGross Gross Total Total Gross
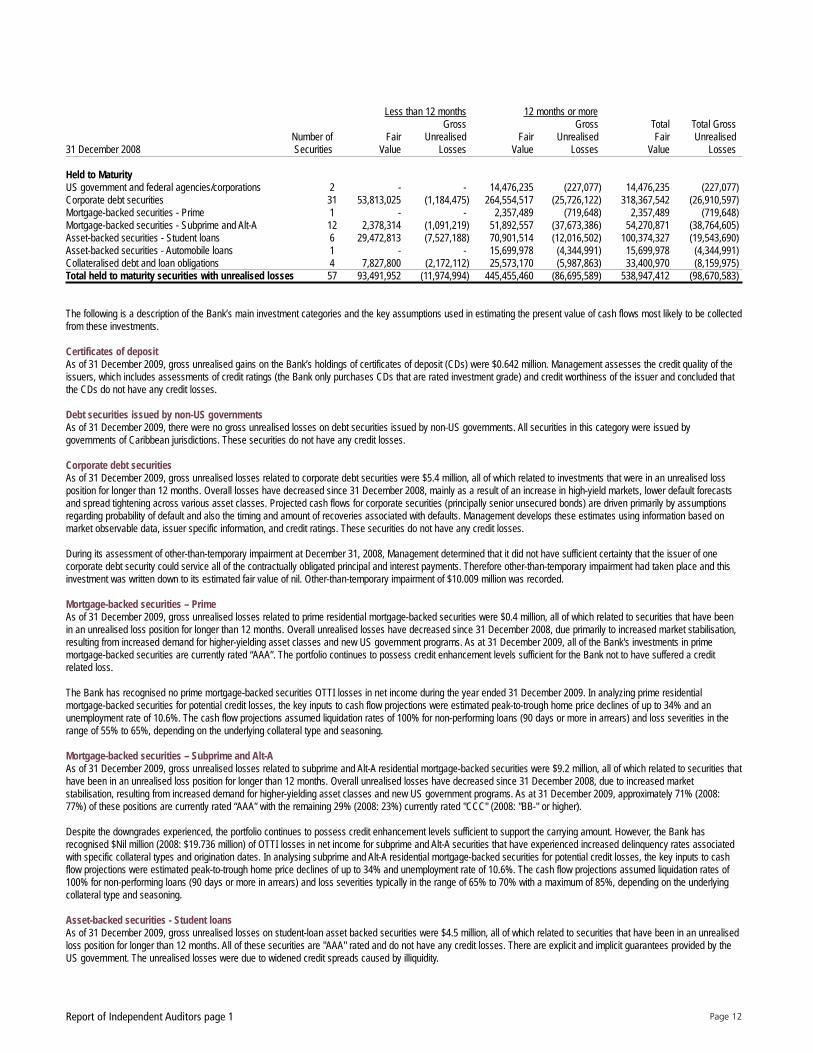
Number of Fair Unrealised Fair Unrealised Fair Unrealised31 December 2008 Securities Value Losses Value Losses Value Losses
Held to MaturityUS government and federal agencies/corporations 2 - - 14,476,235 (227,077) 14,476,235 (227,077)Corporate debt securities 31 53,813,025 (1,184,475) 264,554,517 (25,726,122) 318,367,542 (26,910,597)Mortgage-backed securities - Prime 1 - - 2,357,489 (719,648) 2,357,489 (719,648)Mortgage-backed securities - Subprime and Alt-A 12 2,378,314 (1,091,219) 51,892,557 (37,673,386) 54,270,871 (38,764,605)Asset-backed securities - Student loans 6 29,472,813 (7,527,188) 70,901,514 (12,016,502) 100,374,327 (19,543,690)Asset-backed securities - Automobile loans 1 - - 15,699,978 (4,344,991) 15,699,978 (4,344,991)Collateralised debt and loan obligations 4 7,827,800 (2,172,112) 25,573,170 (5,987,863) 33,400,970 (8,159,975)Total held to maturity securities with unrealised losses 57 93,491,952 (11,974,994) 445,455,460 (86,695,589) 538,947,412 (98,670,583)
The following is a description of the Bank’s main investment categories and the key assumptions used in estimating the present value of cash flows most likely to be collectedfrom these investments.
Certificates of depositAs of 31 December 2009, gross unrealised gains on the Bank’s holdings of certificates of deposit (CDs) were $0.642 million. Management assesses the credit quality of theissuers, which includes assessments of credit ratings (the Bank only purchases CDs that are rated investment grade) and credit worthiness of the issuer and concluded thatthe CDs do not have any credit losses.
Debt securities issued by non-US governmentsAs of 31 December 2009, there were no gross unrealised losses on debt securities issued by non-US governments. All securities in this category were issued bygovernments of Caribbean jurisdictions. These securities do not have any credit losses.
Corporate debt securitiesAs of 31 December 2009, gross unrealised losses related to corporate debt securities were $5.4 million, all of which related to investments that were in an unrealised lossposition for longer than 12 months. Overall losses have decreased since 31 December 2008, mainly as a result of an increase in high-yield markets, lower default forecastsand spread tightening across various asset classes. Projected cash flows for corporate securities (principally senior unsecured bonds) are driven primarily by assumptionsregarding probability of default and also the timing and amount of recoveries associated with defaults. Management develops these estimates using information based onmarket observable data, issuer specific information, and credit ratings. These securities do not have any credit losses.
During its assessment of other-than-temporary impairment at December 31, 2008, Management determined that it did not have sufficient certainty that the issuer of onecorporate debt security could service all of the contractually obligated principal and interest payments. Therefore other-than-temporary impairment had taken place and thisinvestment was written down to its estimated fair value of nil. Other-than-temporary impairment of $10.009 million was recorded.
Mortgage-backed securities – PrimeAs of 31 December 2009, gross unrealised losses related to prime residential mortgage-backed securities were $0.4 million, all of which related to securities that have beenin an unrealised loss position for longer than 12 months. Overall unrealised losses have decreased since 31 December 2008, due primarily to increased market stabilisation,resulting from increased demand for higher-yielding asset classes and new US government programs. As at 31 December 2009, all of the Bank's investments in primemortgage-backed securities are currently rated “AAA”. The portfolio continues to possess credit enhancement levels sufficient for the Bank not to have suffered a creditrelated loss.
The Bank has recognised no prime mortgage-backed securities OTTI losses in net income during the year ended 31 December 2009. In analyzing prime residentialmortgage-backed securities for potential credit losses, the key inputs to cash flow projections were estimated peak-to-trough home price declines of up to 34% and anunemployment rate of 10.6%. The cash flow projections assumed liquidation rates of 100% for non-performing loans (90 days or more in arrears) and loss severities in therange of 55% to 65%, depending on the underlying collateral type and seasoning.
Mortgage-backed securities – Subprime and Alt-AAs of 31 December 2009, gross unrealised losses related to subprime and Alt-A residential mortgage-backed securities were $9.2 million, all of which related to securities thathave been in an unrealised loss position for longer than 12 months. Overall unrealised losses have decreased since 31 December 2008, due to increased marketstabilisation, resulting from increased demand for higher-yielding asset classes and new US government programs. As at 31 December 2009, approximately 71% (2008:77%) of these positions are currently rated “AAA” with the remaining 29% (2008: 23%) currently rated "CCC" (2008: "BB-" or higher).
Despite the downgrades experienced, the portfolio continues to possess credit enhancement levels sufficient to support the carrying amount. However, the Bank hasrecognised $Nil million (2008: $19.736 million) of OTTI losses in net income for subprime and Alt-A securities that have experienced increased delinquency rates associatedwith specific collateral types and origination dates. In analysing subprime and Alt-A residential mortgage-backed securities for potential credit losses, the key inputs to cashflow projections were estimated peak-to-trough home price declines of up to 34% and unemployment rate of 10.6%. The cash flow projections assumed liquidation rates of100% for non-performing loans (90 days or more in arrears) and loss severities typically in the range of 65% to 70% with a maximum of 85%, depending on the underlyingcollateral type and seasoning.
Asset-backed securities - Student loansAs of 31 December 2009, gross unrealised losses on student-loan asset backed securities were $4.5 million, all of which related to securities that have been in an unrealisedloss position for longer than 12 months. All of these securities are "AAA" rated and do not have any credit losses. There are explicit and implicit guarantees provided by theUS government. The unrealised losses were due to widened credit spreads caused by illiquidity.
Page 13Report of Independent Auditors page 1
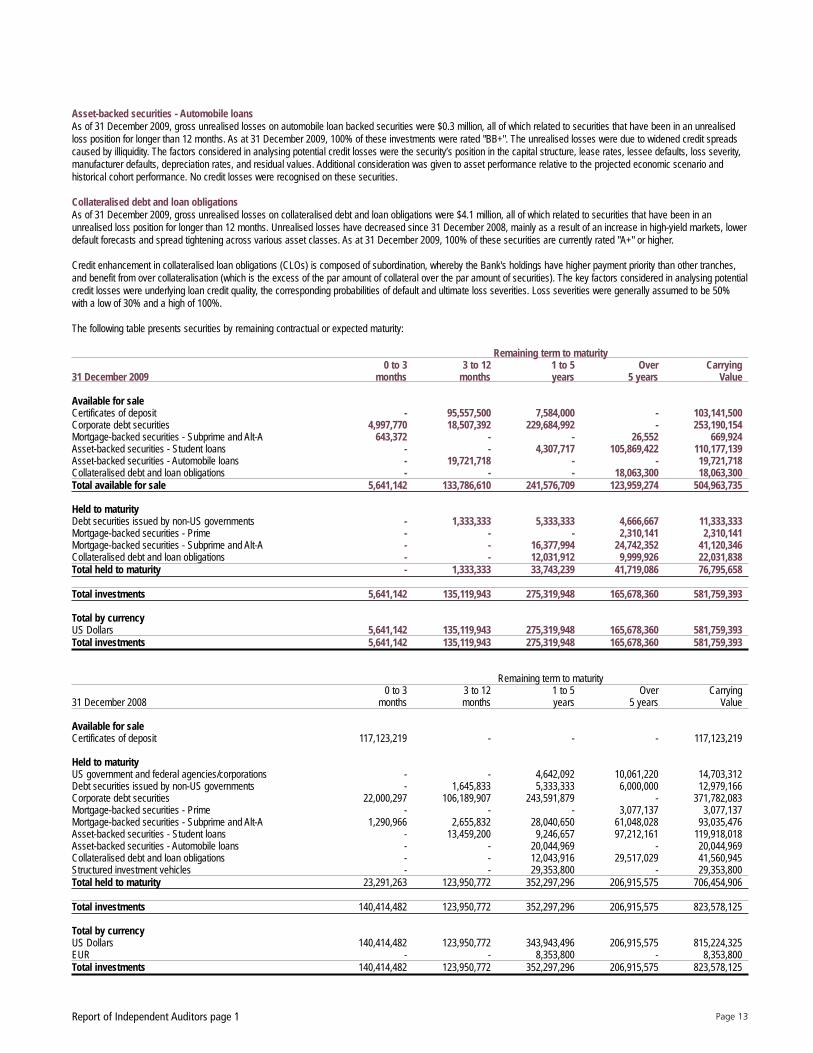
Asset-backed securities - Automobile loansAs of 31 December 2009, gross unrealised losses on automobile loan backed securities were $0.3 million, all of which related to securities that have been in an unrealisedloss position for longer than 12 months. As at 31 December 2009, 100% of these investments were rated "BB+". The unrealised losses were due to widened credit spreadscaused by illiquidity. The factors considered in analysing potential credit losses were the security’s position in the capital structure, lease rates, lessee defaults, loss severity,manufacturer defaults, depreciation rates, and residual values. Additional consideration was given to asset performance relative to the projected economic scenario andhistorical cohort performance. No credit losses were recognised on these securities.
Collateralised debt and loan obligationsAs of 31 December 2009, gross unrealised losses on collateralised debt and loan obligations were $4.1 million, all of which related to securities that have been in anunrealised loss position for longer than 12 months. Unrealised losses have decreased since 31 December 2008, mainly as a result of an increase in high-yield markets, lowerdefault forecasts and spread tightening across various asset classes. As at 31 December 2009, 100% of these securities are currently rated "A+" or higher.
Credit enhancement in collateralised loan obligations (CLOs) is composed of subordination, whereby the Bank's holdings have higher payment priority than other tranches,and benefit from over collateralisation (which is the excess of the par amount of collateral over the par amount of securities). The key factors considered in analysing potentialcredit losses were underlying loan credit quality, the corresponding probabilities of default and ultimate loss severities. Loss severities were generally assumed to be 50%with a low of 30% and a high of 100%.
The following table presents securities by remaining contractual or expected maturity:
Remaining term to maturity0 to 3 3 to 12 1 to 5 Over Carrying
31 December 2009 months months years 5 years Value
Available for saleCertificates of deposit - 95,557,500 7,584,000 - 103,141,500Corporate debt securities 4,997,770 18,507,392 229,684,992 - 253,190,154Mortgage-backed securities - Subprime and Alt-A 643,372 - - 26,552 669,924Asset-backed securities - Student loans - - 4,307,717 105,869,422 110,177,139Asset-backed securities - Automobile loans - 19,721,718 - - 19,721,718Collateralised debt and loan obligations - - - 18,063,300 18,063,300Total available for sale 5,641,142 133,786,610 241,576,709 123,959,274 504,963,735
Held to maturityDebt securities issued by non-US governments - 1,333,333 5,333,333 4,666,667 11,333,333Mortgage-backed securities - Prime - - - 2,310,141 2,310,141Mortgage-backed securities - Subprime and Alt-A - - 16,377,994 24,742,352 41,120,346Collateralised debt and loan obligations - - 12,031,912 9,999,926 22,031,838Total held to maturity - 1,333,333 33,743,239 41,719,086 76,795,658
Total investments 5,641,142 135,119,943 275,319,948 165,678,360 581,759,393
Total by currencyUS Dollars 5,641,142 135,119,943 275,319,948 165,678,360 581,759,393Total investments 5,641,142 135,119,943 275,319,948 165,678,360 581,759,393
Remaining term to maturity0 to 3 3 to 12 1 to 5 Over Carrying
31 December 2008 months months years 5 years Value
Available for saleCertificates of deposit 117,123,219 - - - 117,123,219
Held to maturityUS government and federal agencies/corporations - - 4,642,092 10,061,220 14,703,312Debt securities issued by non-US governments - 1,645,833 5,333,333 6,000,000 12,979,166Corporate debt securities 22,000,297 106,189,907 243,591,879 - 371,782,083Mortgage-backed securities - Prime - - - 3,077,137 3,077,137Mortgage-backed securities - Subprime and Alt-A 1,290,966 2,655,832 28,040,650 61,048,028 93,035,476Asset-backed securities - Student loans - 13,459,200 9,246,657 97,212,161 119,918,018Asset-backed securities - Automobile loans - - 20,044,969 - 20,044,969Collateralised debt and loan obligations - - 12,043,916 29,517,029 41,560,945Structured investment vehicles - - 29,353,800 - 29,353,800Total held to maturity 23,291,263 123,950,772 352,297,296 206,915,575 706,454,906
Total investments 140,414,482 123,950,772 352,297,296 206,915,575 823,578,125
Total by currencyUS Dollars 140,414,482 123,950,772 343,943,496 206,915,575 815,224,325EUR - - 8,353,800 - 8,353,800Total investments 140,414,482 123,950,772 352,297,296 206,915,575 823,578,125
Page 14Report of Independent Auditors page 1
Investments at carrying value includes $467.284 million (2008: $693.788 million) of floating-rate instruments and $114.475 million (2008: $129.790 million) of fixed-rateinstruments. The approximate yield on floating-rate securities at 31 December 2009 was 0.42% (2008: 2.34%), while the approximate yield on fixed-rate securities was1.94% (2008: 3.78%).
The average yield is based on amortised cost balances at year-end. Average yield is derived by dividing interest income (including the effect of amortisation of premiums andaccretion of discounts) by the amortised cost.
The estimated duration, which reflects anticipated future prepayments based on a consensus of dealers in the market, is approximately 2.47 years (2008: 2.30 years).
Transfer of investments from the Held to Maturity (“HTM”) to the Available for Sale (“AFS”) portfolioDuring 2009, the Parent Bank’s regulator, the Bermuda Monetary Authority, announced that as a precautionary measure it required all banks in Bermuda to maintain a capitalbuffer such that they would be able to withstand a severe economic downturn (a 1 in 100 year event) and still maintain Tier 1 capital of at least 6%.
In response to this significant and unforeseen increases in liquidity and capital requirements, the Bank along with the Parent Bank transfered investments from the HTM tothe AFS portfolio. Management believe that such transfer was necessary to meet the increased liquidity and capital requirements. On this basis, management believes thatthe transfer falls within the HTM investments tainting exemptions of ASC 320-10-25-6 e) and does not result in the tainting of the entire HTM portfolio.The net carryingamount of the transferred securities was $413.4 million at the time of the transfer. Subsequent to the transfer, a net unrealised loss of $11.6 million was recognised in OCI.
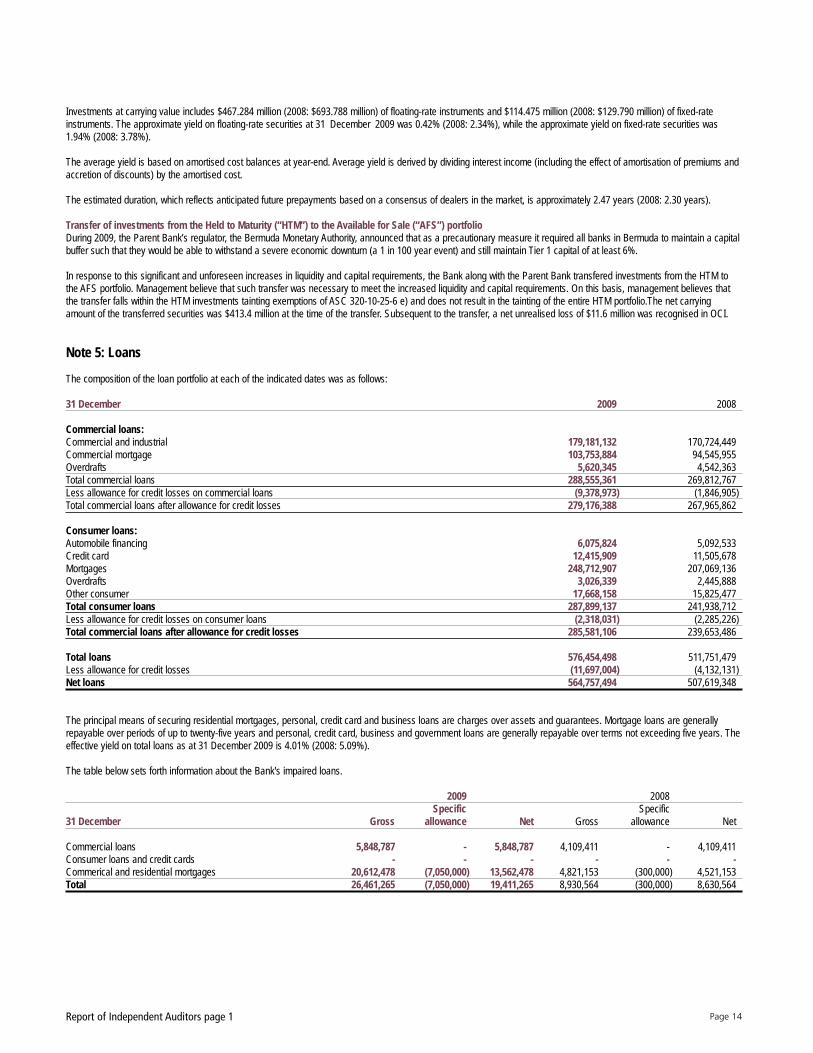
Note 5: Loans
The composition of the loan portfolio at each of the indicated dates was as follows:
31 December 2009 2008
Commercial loans:Commercial and industrial 179,181,132 170,724,449Commercial mortgage 103,753,884 94,545,955Overdrafts 5,620,345 4,542,363Total commercial loans 288,555,361 269,812,767Less allowance for credit losses on commercial loans (9,378,973) (1,846,905)Total commercial loans after allowance for credit losses 279,176,388 267,965,862
Consumer loans:Automobile financing 6,075,824 5,092,533Credit card 12,415,909 11,505,678Mortgages 248,712,907 207,069,136Overdrafts 3,026,339 2,445,888Other consumer 17,668,158 15,825,477Total consumer loans 287,899,137 241,938,712Less allowance for credit losses on consumer loans (2,318,031) (2,285,226)Total commercial loans after allowance for credit losses 285,581,106 239,653,486
Total loans 576,454,498 511,751,479Less allowance for credit losses (11,697,004) (4,132,131)Net loans 564,757,494 507,619,348
The principal means of securing residential mortgages, personal, credit card and business loans are charges over assets and guarantees. Mortgage loans are generallyrepayable over periods of up to twenty-five years and personal, credit card, business and government loans are generally repayable over terms not exceeding five years. Theeffective yield on total loans as at 31 December 2009 is 4.01% (2008: 5.09%).
The table below sets forth information about the Bank's impaired loans.
2009 2008Specific Specific
31 December Gross allowance Net Gross allowance Net
Commercial loans 5,848,787 - 5,848,787 4,109,411 - 4,109,411Consumer loans and credit cards - - - - - -Commerical and residential mortgages 20,612,478 (7,050,000) 13,562,478 4,821,153 (300,000) 4,521,153Total 26,461,265 (7,050,000) 19,411,265 8,930,564 (300,000) 8,630,564

Page 15Report of Independent Auditors page 1
For the year ended 31 December 2009, the amount of gross interest income that would have been recorded had impaired loans been current was $543,749 (31 December2008: $611,734). For the year ended 31 December 2009 the Bank recovered overdue interest of $94,866 (31 December 2008: $22,359) on impaired loans that were repaid inthe year. The average balance of impaired loans during the year ended 31 December 2009 was $10,135,208 (31 December 2008: $9,469,568).
The table below summarises the changes in the allowance for credit losses:
2009 2008Specific General Specific General
31 December allowances allowances Total allowances allowances Total
Allowance for credit losses at beginning of year 300,000 3,832,131 4,132,131 300,000 3,185,143 3,485,143Provision this year 6,750,000 1,036,858 7,786,858 - 639,361 639,361Recoveries - 307,457 307,457 - 454,584 454,584Charge-offs - (529,442) (529,442) - (446,957) (446,957)Allowance for credit losses at end of year 7,050,000 4,647,004 11,697,004 300,000 3,832,131 4,132,131
The table below presents information about the loan delinquencies, and charge-offs:
2009 2008Total Loans 90 Total Loans 90
delinquent days or more delinquent days or more31 December loans Interest Charge-offs loans past due Charge-offs
Credit card 94,683 - - 134,540 - -Automobile financing - - - - - -Other consumer and mortgages 5,532,117 1,949,918 (529,442) 7,195,180 4,821,153 (446,957)Consumer loans 5,626,800 1,949,918 (529,442) 7,329,720 4,821,153 (446,957)
Commercial loans 24,671,807 24,511,347 - 6,497,355 4,109,411 -Total loans reported 30,298,607 26,461,265 (529,442) 13,827,075 8,930,564 (446,957)
Note 6: Credit Risk Concentrations
Concentrations of credit risk arise when a number of customers are engaged in similar business activities or in the same geographic region, or when they have similareconomic features that would cause their ability to meet contractual obligations to be similarly affected by change in economic conditions. The Bank regularly monitorsvarious segments of its credit risk portfolio to assess potential concentrations of risks and to obtain collateral when deemed necessary. In the Bank's commercial portfolio, riskconcentrations are primarily evaluated by industry and also by geographic region. In the consumer portfolio, concentrations are primarily evaluated by products. Creditexposures include loans, guarantees and acceptances, letters of credit and commitments for undrawn lines of credit. Collateral and property charges in respect of loans aresituated primarily in the Cayman Islands, but also in Bermuda and the Bahamas.
The following table summarises the credit exposure by the Bank by business segment:
2009 2008On-balance Off-balance Total credit On-balance Off-balance Total credit
31 December (in $ thousands) sheet sheet exposure sheet sheet exposure
Banks and financial services 33,702 119,385 153,087 27,518 76,767 104,285Commercial and merchandising 101,194 - 101,194 51,220 - 51,220Individuals 351,143 17,438 368,581 389,093 21,024 410,117Primary industry and manufacturing 3,728 - 3,728 13,620 - 13,620Real estate 54,636 - 54,636 - - -Transport and communication 25,001 - 25,001 30,000 - 30,000Sub-total 569,404 136,823 706,227 511,451 97,791 609,242
General allowance (4,647) - (4,647) (3,832) - (3,832)Total 564,757 136,823 701,580 507,619 97,791 605,410

Page 16Report of Independent Auditors page 1
The following table summarises the credit exposure of the Bank by region:
2009 2008On-balance Off-balance Total credit On-balance Off-balance Total credit
31 December (in $ thousands) sheet sheet exposure sheet sheet exposure
Bermuda 35,000 - 35,000 35,000 - 35,000Cayman 479,644 136,823 616,467 411,152 97,791 508,943Guernsey 17,397 - 17,397 16,878 - 16,878St. Lucia 25,000 - 25,000 30,000 - 30,000The Bahamas 12,363 - 12,363 18,421 - 18,421Sub-total 569,404 136,823 706,227 511,451 97,791 609,242
General allowance (4,647) - (4,647) (3,832) - (3,832)Total 564,757 136,823 701,580 507,619 97,791 605,410
Note 7: Premises, Equipment and Computer Software
The following table summarises land, buildings, equipment and computer software:
2009 2008Accumulated Net Carrying Accumulated Net Carrying
31 December Cost depreciation value Cost depreciation value
Land 5,082,878 - 5,082,878 5,082,878 - 5,082,878Buildings 50,523,169 (8,000,298) 42,522,871 49,133,262 (6,562,384) 42,570,878Equipment 12,011,806 (6,943,853) 5,067,953 12,592,570 (5,311,597) 7,280,973Computer software 6,696,427 (1,844,058) 4,852,369 1,729,771 (860,852) 868,919Total 74,314,280 (16,788,209) 57,526,071 68,538,481 (12,734,833) 55,803,648
31 December 2009 2008
DepreciationBuildings and equipment (included in Property expenses) 2,365,328 2,112,430Computer hardware and software (incl. in Technology and communications expenses) 1,708,095 2,328,929Total depreciation charged to operating expenses 4,073,423 4,441,359

Page 17Report of Independent Auditors page 1
Note 8: Other Related Party Balances and Transactions
An analysis of other related party balances and transactions follows:
31 December 2008 2008
Consolidated Balance SheetsAssetsCash and deposits with banks 501,034,828 505,429,243Loans (including staff loans) 64,601,315 54,818,341Accrued interest 482,604 2,575,936Other assets 206,875 2,469,190
LiabilitiesCustomer deposits 11,413,105 12,011,369Accrued interest - 5,870Other liabilities 1,540,444 107,146
Consolidated Statements of IncomeNon-Interest IncomeInvestment services revenue 489,346 854,374
Interest IncomeInterest Income - Deposits with banks 6,164,373 17,847,607Interest Income - Loans (excluding staff loans) 610,523 1,056,511
Interest Expense 22,399 954,762
Non-Interest ExpenseOther expenses 2,157,057 6,062,852
Derivative Financial InstrumentsForeign exchange contracts 2,522,756 -
The Bank provides, as a benefit to employees, loan facilities at preferred lending rates.
Significant balances due and from affiliated entities other than the Parent Bank include, Loans and Customer deposits. In the ordinary course of business, the Bank receivesfrom and provides to its affiliated and other related corporations, normal banking services on terms similar to those offered to non-related parties. The non interest expensesare comprised of management fee allocations from the Parent Bank, which are determined at the sole discretion of the Parent Bank.
During the year ended December 31, 2009, as a result of specific credit issues on certain securities, the Bank transferred securities from its held to maturity investmentportfolio with an amortised cost of $87,815,350 to its Parent Bank at their carrying value and purchased a security from its Parent Bank at amortised cost of $14,992,500 intoits held to maturity portfolio.
During the year ended December 31, 2008, the Bank purchased or participated in loans of $90,000,000 and purchased certificates of deposits of $167,123,219 from theParent Bank at amortised cost plus accrued interest, as at the date of purchase.
Note 9: Intangible assets
The following table presents intangible assets by business segments:
31 December 2009 2008Gross Net Gross Net
Carrying Accumulated Carrying Carrying Accumulated Carrying Amount Amortisation value Amount Amortisation value
Customer Relationships 1,211,821 (430,848) 780,973 1,211,821 (350,064) 861,757
There have been no impairment losses for the years ended 31 December 2009 and 2008. The estimated aggregate amortisation expense for each of the succeeding yearsuntil 31 December 2014 is $403,920.
Page 18Report of Independent Auditors page 1
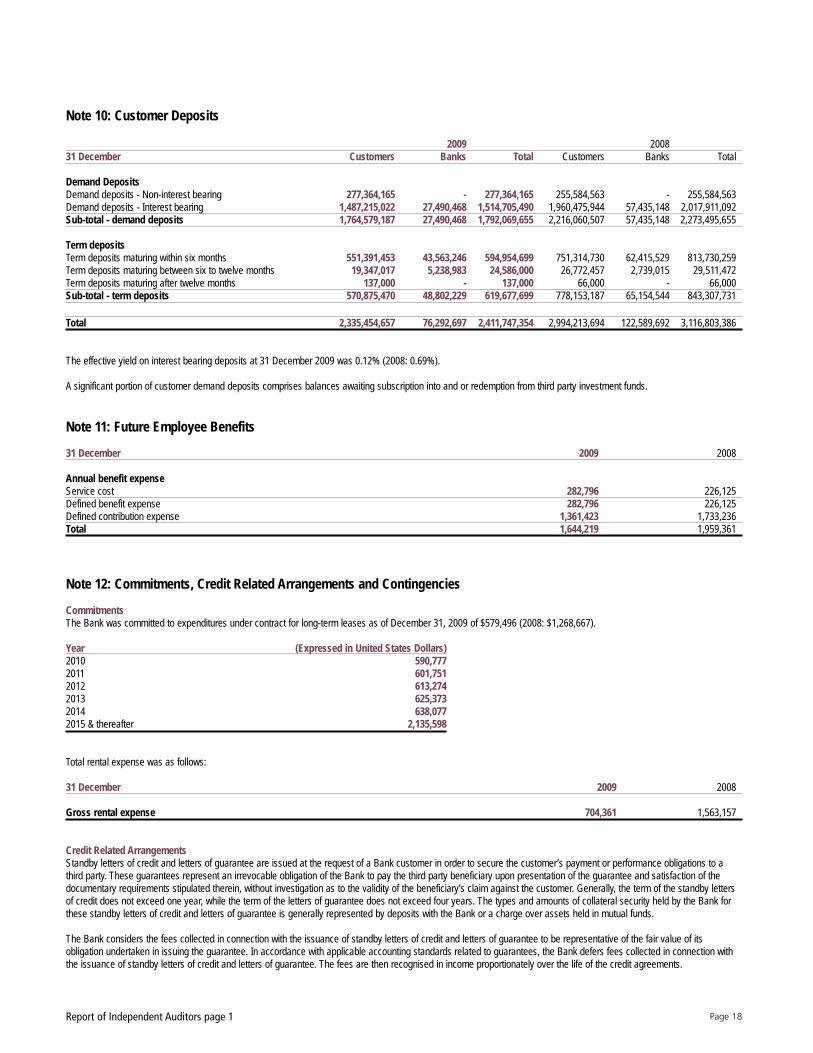
Note 10: Customer Deposits
2009 200831 December Customers Banks Total Customers Banks Total
Demand DepositsDemand deposits - Non-interest bearing 277,364,165 - 277,364,165 255,584,563 - 255,584,563Demand deposits - Interest bearing 1,487,215,022 27,490,468 1,514,705,490 1,960,475,944 57,435,148 2,017,911,092Sub-total - demand deposits 1,764,579,187 27,490,468 1,792,069,655 2,216,060,507 57,435,148 2,273,495,655
Term depositsTerm deposits maturing within six months 551,391,453 43,563,246 594,954,699 751,314,730 62,415,529 813,730,259Term deposits maturing between six to twelve months 19,347,017 5,238,983 24,586,000 26,772,457 2,739,015 29,511,472Term deposits maturing after twelve months 137,000 - 137,000 66,000 - 66,000Sub-total - term deposits 570,875,470 48,802,229 619,677,699 778,153,187 65,154,544 843,307,731
Total 2,335,454,657 76,292,697 2,411,747,354 2,994,213,694 122,589,692 3,116,803,386
The effective yield on interest bearing deposits at 31 December 2009 was 0.12% (2008: 0.69%).
A significant portion of customer demand deposits comprises balances awaiting subscription into and or redemption from third party investment funds.
Note 11: Future Employee Benefits
31 December 2009 2008
Annual benefit expenseService cost 282,796 226,125Defined benefit expense 282,796 226,125Defined contribution expense 1,361,423 1,733,236Total 1,644,219 1,959,361
Note 12: Commitments, Credit Related Arrangements and Contingencies
CommitmentsThe Bank was committed to expenditures under contract for long-term leases as of December 31, 2009 of $579,496 (2008: $1,268,667).
Year (Expressed in United States Dollars)2010 590,7772011 601,7512012 613,2742013 625,3732014 638,0772015 & thereafter 2,135,598
Total rental expense was as follows:
31 December 2009 2008
Gross rental expense 704,361 1,563,157
Credit Related ArrangementsStandby letters of credit and letters of guarantee are issued at the request of a Bank customer in order to secure the customer’s payment or performance obligations to athird party. These guarantees represent an irrevocable obligation of the Bank to pay the third party beneficiary upon presentation of the guarantee and satisfaction of thedocumentary requirements stipulated therein, without investigation as to the validity of the beneficiary’s claim against the customer. Generally, the term of the standby lettersof credit does not exceed one year, while the term of the letters of guarantee does not exceed four years. The types and amounts of collateral security held by the Bank forthese standby letters of credit and letters of guarantee is generally represented by deposits with the Bank or a charge over assets held in mutual funds.
The Bank considers the fees collected in connection with the issuance of standby letters of credit and letters of guarantee to be representative of the fair value of itsobligation undertaken in issuing the guarantee. In accordance with applicable accounting standards related to guarantees, the Bank defers fees collected in connection withthe issuance of standby letters of credit and letters of guarantee. The fees are then recognised in income proportionately over the life of the credit agreements.

Page 19Report of Independent Auditors page 1
The following table presents the credit related arrangements with contractual amounts representing credit risk as follows:
2009 200831 December (in $ thousands) Gross Collateral Net Gross Collateral Net
Standby letters of credit 145,104 145,104 - 126,534 126,534 -Letters of guarantee 6,499 6,499 - 2,821 2,821 -Total 151,602 151,602 - 129,355 129,355 -
Collateral is shown at estimated market value less selling cost. Where cash is the collateral given, collateral is shown at carrying value.
The Bank enters into contractual commitments to extend credit, normally with fixed expiration dates or termination clauses, at specified rates and for specific purposes.Substantially all of the Bank's commitments to extend credit are contingent upon customers maintaining specific credit standards at the time of loan funding. Managementassesses the credit risk associated with certain commitments to extend credit in determining the level of the allowance for possible loan losses.
The contractual terms of standby letters of credit vary but are generally under one year with multi-year agreements required to be renewed on an annual basis.
The following table presents the unfunded legally binding commitments to extent credit with contractual amounts representing credit risk as follows:
31 December (in $ thousands) 2009 2008
Commitments to extend credit 16,154 21,024Documentary and commerical letters of credit 1,284 -Total 17,438 21,024
A guarantee is a contract that contingently requires the guarantor to make payments to a third party based on (i) changes in an underlying interest rate, foreign exchangerate or other variable, including the occurrence or non-occurrence of an event, that is related to an asset, liability or equity security held by the guaranteed party, (ii) anindemnification provided to the third party with the characteristics listed above, (iii) another entity's failure to perform under an obligating agreement, or (iv) anotherentity’s failure to perform related to its indebtedness. As at 31 December 2009 the guarantees that the Bank provides to its customers and other third parties are standbyletters of credit and letters of guarantee with a maximum potential amount of future payments of $119,384,569 (2008: $76,766,596). The carrying value of these amountson the 31 December 2009 Consolidated Balance Sheet are $Nil (2008: $Nil).
The Bank was provided with a facility by one of its custodians, whereby the Bank may offer up to $200.0 million of standby letter of credits to its customers on a fully securedbasis. Under the standard terms of the facility, the custodian has the right of set-off against securities held of 110% of the utilised facility. At 31 December 2009,$133.3 million (31 December 2008: $102.1 million) of standby letters of credit were issued under this facility.
Legal ProceedingsThere are a number of actions and legal proceedings pending which involve the Bank, which arise from the normal course of its business. Management, after reviewing allactions involving the Bank, considers that the resolution of these matters would not be material to the financial position of the Bank.
Note 13: Interest Income
The following table presents the components of loan interest income:
31 December 2009 2008
Mortgages 10,369,723 12,904,634Other loans 13,018,127 10,034,739
22,387,850 22,939,373
Amortisation of loan origination fees (net of amortised costs) 483,076 316,998Total loan interest income 23,870,926 22,256,371
Balance of unamortised loan fees 993,645 892,400
Note 14: Non-interest expense
Other expensesDetails of other expenses were as follows:
31 December 2009 2008
Insurance 466,324 315,372Credit card expenses 2,720,670 2,359,445Bank charges 695,872 600,743All other (note 8) 3,838,165 7,142,711Total 7,721,031 10,418,271

Page 20Report of Independent Auditors page 1
Note 15: Accounting for derivative instruments
The Bank uses derivatives to meet the needs of its customers with their risk management objectives. The Bank’s derivative contracts principally involve over the counterforeign exchange contracts that are privately negotiated between the Bank and the counterparty.
Notional amountsThe notional amounts are not recorded as assets or liabilities on the Consolidated Balance Sheet as they represent the face amount of the contract to which a rate or price isapplied to determine the amount of cash flows to be exchanged. Notional amounts represent the volume of outstanding transactions and do not represent the potential gainor loss associated with market risk or credit risk of such instruments. Credit risk is limited to the positive fair value of the derivative instrument, which is significantly less thanthe notional amount.
Fair valueDerivative instruments, in the absence of any compensating up-front cash payments, generally have no market value at inception. They obtain value, positive or negative, asrelevant exchange rates change, such that previously contracted derivative transactions have become more or less favourable than what can be negotiated under currentmarket conditions for contracts with the same remaining period to maturity. The potential for derivatives to increase or decrease in value as a result of the foregoing factors isgenerally referred to as market risk. Market risk is managed within clearly defined parameters as prescribed by senior management of the Bank. The fair value is defined asthe profit or loss associated with replacing the derivative contracts at prevailing market prices.
Cash flow hedgesAs of 31 December 2009 and 2008 there were no cash flow hedges in place.
Client service derivativesThe Bank enters into foreign exchange contracts primarily to meet the foreign exchange needs of its customers for periods of less than one year. Foreign exchange contractsare agreements to exchange specific amounts of currencies at a future date at a specified rate of exchange. Changes in the fair value of client services derivative instrumentsare recognised in income.
The following table shows the aggregate notional amounts of derivative contracts outstanding and their respective gross positive or negative fair values:
Notional Positive Negative Net31 December 2009 Derivative Instrument amounts fair value fair value fair value
Client Services DerivativesSpot and forward foreign exchange 644,391,488 11,188,651 (11,082,785) 105,866
Notional Positive Negative Net31 December 2008 Derivative Instrument amounts fair value fair value fair value
Client Services DerivativesSpot and forward foreign exchange 625,717,678 6,108,111 (5,896,814) 211,297
Note 16: Fair value of financial instruments
The following table presents the financial assets and liabilities that are measured at fair value on a recurring basis and classifies such fair value based on the type of inputused in the related valuations:
a) Items that are recognised at fair value on a recurring basis:
31 December 2009Fair value determination
Quoted prices in Significant other Significant Total carryingactive markets for observable unobservable value /
identical assets (Level 1) inputs (Level 2) inputs (Level 3) fair value
Financial assetsInvestments available for sale - Certificates of deposits (note 4) - 103,141,500 - 103,141,500Investments available for sale - Corporate debt securities - 177,625,819 75,564,335 253,190,154Investments available for sale - Mortgage-backed sercurities - Subprime and Alt-A 669,924 - 669,924Investments available for sale - Asset-backed securities - Student loans - 58,209,072 51,968,067 110,177,139Investments available for sale - Asset-backed securities - Automobile loans - 19,721,718 - 19,721,718Investments available for sale - Collarteralised debt and loan obligations - 18,063,300 18,063,300Other Assets - Derivatives - 11,188,651 - 11,188,651
Financial liabilitiesOther liabilities - Derivatives - 11,082,785 - 11,082,785

Page 21Report of Independent Auditors page 1
31 December 2008Fair value determination
Quoted prices in Significant other Significant Total carryingactive markets for observable unobservable value /
identical assets (Level 1) inputs (Level 2) inputs (Level 3) fair value
Financial assetsInvestments available for sale - Certificates of deposits (note 4) - 117,123,219 - 117,123,219Other Assets - Derivatives - 6,108,111 - 6,108,111
Financial liabilitiesOther liabilities - Derivatives - 5,896,814 - 5,896,814
b) Items measured on a recurring basis using significiant unobservable inputs:
2009 2008Available Available
31 December for sale investments for sale investmentsCarrying amount at beginning of year - -Transfers in and out of Level 3 145,595,702 -Carrying amount at end of year 145,595,702 -
Level 3 investments are valued primarily using non-binding bid quotes from brokers.
c) Items other than those recognised at fair value on a recurring basis
2009 2008Appreciation/ Appreciation/
31 December Carrying value Fair value (depreciation) Carrying value Fair value (depreciation)
Financial assetsCash and deposits with banks 1,383,694,558 1,383,694,558 - 1,916,297,761 1,916,297,761 -Investments held to maturity 76,795,658 64,497,084 (12,298,574) 706,454,906 607,847,487 (98,607,419)Commercial loans, net of allowance for credit losses 279,176,388 279,176,388 - 267,965,862 267,965,862 -Consumer loans, net of allowance for credit losses 285,581,106 285,581,106 - 239,653,486 239,653,486 -Accrued interest 2,397,189 2,397,189 - 10,002,507 10,002,507 -Total financial assets 2,027,644,899 2,015,346,325 (12,298,574) 3,140,374,522 3,041,767,103 (98,607,419)
Financial liabilitiesCustomer deposits
Demand deposits 1,764,579,374 1,764,579,374 - 2,216,041,569 2,216,041,569 -Term deposits 570,874,940 570,874,940 - 778,153,187 778,153,187 -
Deposits from banks 76,293,394 76,293,394 - 122,608,630 122,608,630 -Accrued interest 497,461 497,461 - 2,137,643 2,137,643 -Total financial liabilities 2,412,245,169 2,412,245,169 - 3,118,941,029 3,118,941,029 -
Note 17: Assets Under Management and Assets Under Administration
31 December 2009 2008Assets under managementButterfield funds 63,553,462 61,200,488Other assets under management 793,684,999 687,058,005Total assets under management 857,238,461 748,258,493
Assets under administration (including mutual funds) 4,959,972,121 5,384,794,623
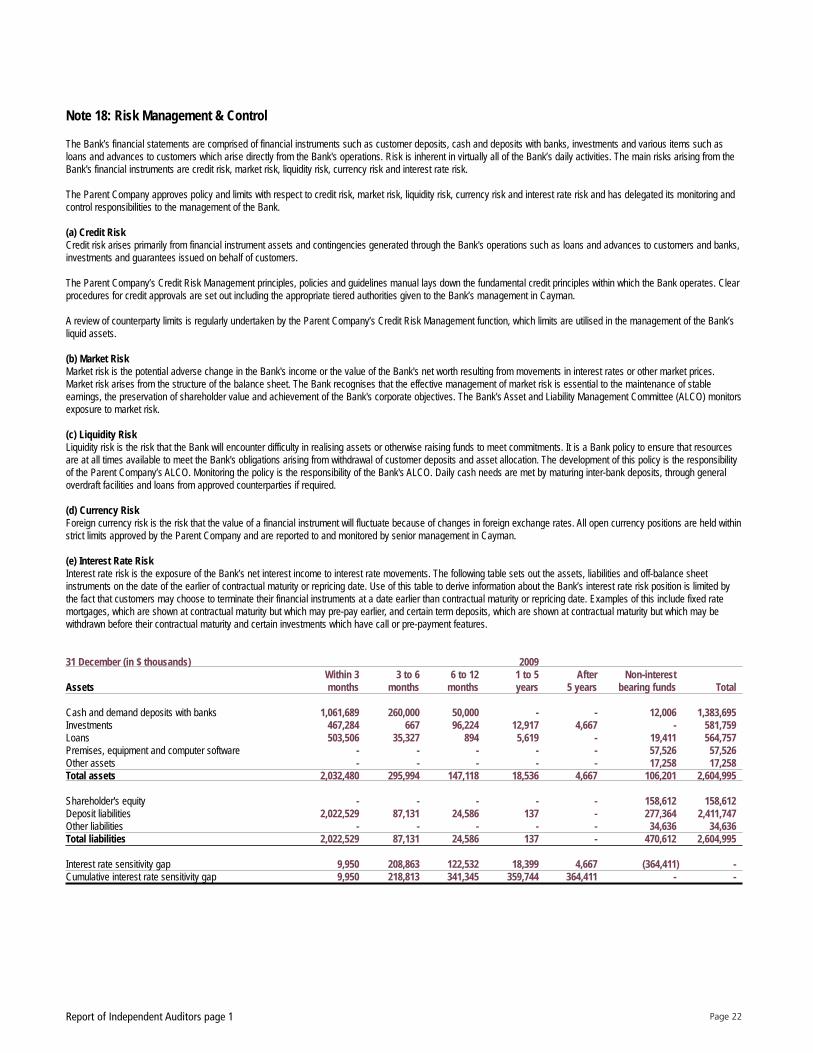
Page 22Report of Independent Auditors page 1
Note 18: Risk Management & Control
The Bank’s financial statements are comprised of financial instruments such as customer deposits, cash and deposits with banks, investments and various items such asloans and advances to customers which arise directly from the Bank's operations. Risk is inherent in virtually all of the Bank’s daily activities. The main risks arising from theBank's financial instruments are credit risk, market risk, liquidity risk, currency risk and interest rate risk.
The Parent Company approves policy and limits with respect to credit risk, market risk, liquidity risk, currency risk and interest rate risk and has delegated its monitoring andcontrol responsibilities to the management of the Bank.
(a) Credit RiskCredit risk arises primarily from financial instrument assets and contingencies generated through the Bank's operations such as loans and advances to customers and banks,investments and guarantees issued on behalf of customers.
The Parent Company’s Credit Risk Management principles, policies and guidelines manual lays down the fundamental credit principles within which the Bank operates. Clearprocedures for credit approvals are set out including the appropriate tiered authorities given to the Bank’s management in Cayman.
A review of counterparty limits is regularly undertaken by the Parent Company’s Credit Risk Management function, which limits are utilised in the management of the Bank’sliquid assets.
(b) Market RiskMarket risk is the potential adverse change in the Bank's income or the value of the Bank's net worth resulting from movements in interest rates or other market prices.Market risk arises from the structure of the balance sheet. The Bank recognises that the effective management of market risk is essential to the maintenance of stableearnings, the preservation of shareholder value and achievement of the Bank's corporate objectives. The Bank's Asset and Liability Management Committee (ALCO) monitorsexposure to market risk.
(c) Liquidity RiskLiquidity risk is the risk that the Bank will encounter difficulty in realising assets or otherwise raising funds to meet commitments. It is a Bank policy to ensure that resourcesare at all times available to meet the Bank's obligations arising from withdrawal of customer deposits and asset allocation. The development of this policy is the responsibilityof the Parent Company’s ALCO. Monitoring the policy is the responsibility of the Bank's ALCO. Daily cash needs are met by maturing inter-bank deposits, through generaloverdraft facilities and loans from approved counterparties if required.
(d) Currency RiskForeign currency risk is the risk that the value of a financial instrument will fluctuate because of changes in foreign exchange rates. All open currency positions are held withinstrict limits approved by the Parent Company and are reported to and monitored by senior management in Cayman.
(e) Interest Rate RiskInterest rate risk is the exposure of the Bank’s net interest income to interest rate movements. The following table sets out the assets, liabilities and off-balance sheetinstruments on the date of the earlier of contractual maturity or repricing date. Use of this table to derive information about the Bank’s interest rate risk position is limited bythe fact that customers may choose to terminate their financial instruments at a date earlier than contractual maturity or repricing date. Examples of this include fixed ratemortgages, which are shown at contractual maturity but which may pre-pay earlier, and certain term deposits, which are shown at contractual maturity but which may bewithdrawn before their contractual maturity and certain investments which have call or pre-payment features.
31 December (in $ thousands) 2009Within 3 3 to 6 6 to 12 1 to 5 After Non-interest
Assets months months months years 5 years bearing funds Total
Cash and demand deposits with banks 1,061,689 260,000 50,000 - - 12,006 1,383,695Investments 467,284 667 96,224 12,917 4,667 - 581,759Loans 503,506 35,327 894 5,619 - 19,411 564,757Premises, equipment and computer software - - - - - 57,526 57,526Other assets - - - - - 17,258 17,258Total assets 2,032,480 295,994 147,118 18,536 4,667 106,201 2,604,995
Shareholder's equity - - - - - 158,612 158,612Deposit liabilities 2,022,529 87,131 24,586 137 - 277,364 2,411,747Other liabilities - - - - - 34,636 34,636Total liabilities 2,022,529 87,131 24,586 137 - 470,612 2,604,995
Interest rate sensitivity gap 9,950 208,863 122,532 18,399 4,667 (364,411) -Cumulative interest rate sensitivity gap 9,950 218,813 341,345 359,744 364,411 - -
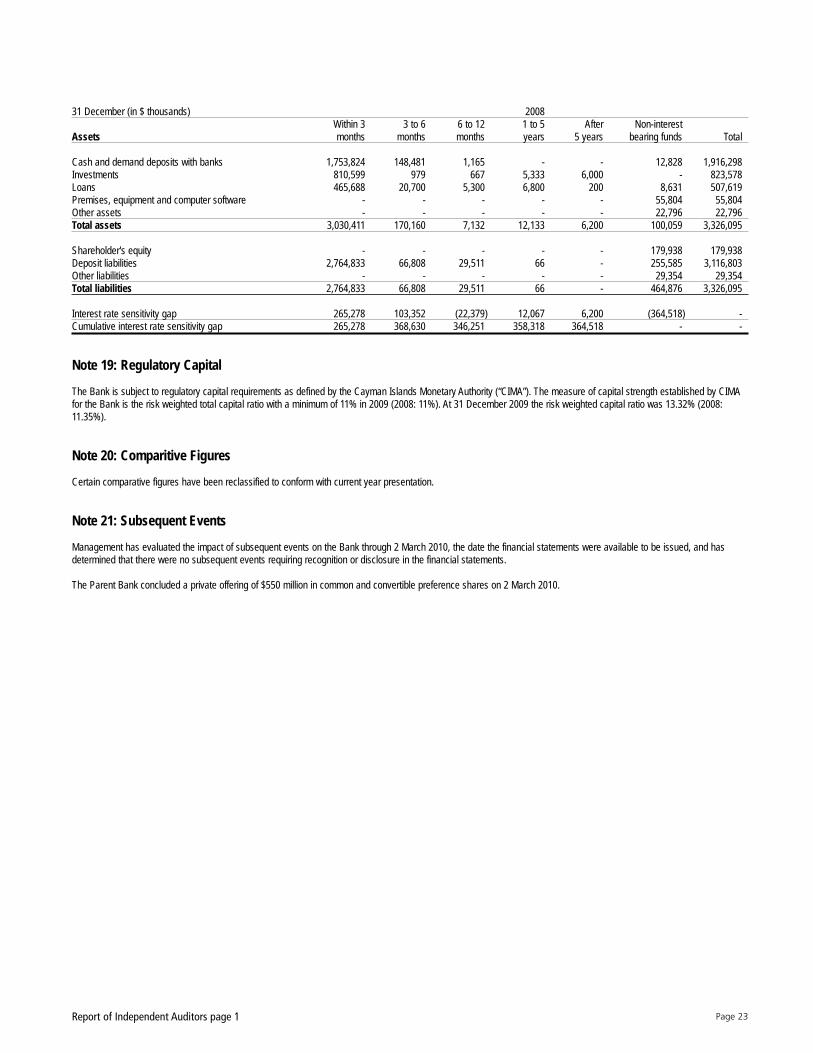
Page 23Report of Independent Auditors page 1
31 December (in $ thousands) 2008Within 3 3 to 6 6 to 12 1 to 5 After Non-interest
Assets months months months years 5 years bearing funds Total
Cash and demand deposits with banks 1,753,824 148,481 1,165 - - 12,828 1,916,298Investments 810,599 979 667 5,333 6,000 - 823,578Loans 465,688 20,700 5,300 6,800 200 8,631 507,619Premises, equipment and computer software - - - - - 55,804 55,804Other assets - - - - - 22,796 22,796Total assets 3,030,411 170,160 7,132 12,133 6,200 100,059 3,326,095
Shareholder's equity - - - - - 179,938 179,938Deposit liabilities 2,764,833 66,808 29,511 66 - 255,585 3,116,803Other liabilities - - - - - 29,354 29,354Total liabilities 2,764,833 66,808 29,511 66 - 464,876 3,326,095
Interest rate sensitivity gap 265,278 103,352 (22,379) 12,067 6,200 (364,518) -Cumulative interest rate sensitivity gap 265,278 368,630 346,251 358,318 364,518 - -
Note 19: Regulatory Capital
The Bank is subject to regulatory capital requirements as defined by the Cayman Islands Monetary Authority (“CIMA”). The measure of capital strength established by CIMAfor the Bank is the risk weighted total capital ratio with a minimum of 11% in 2009 (2008: 11%). At 31 December 2009 the risk weighted capital ratio was 13.32% (2008:11.35%).
Note 20: Comparitive Figures
Certain comparative figures have been reclassified to conform with current year presentation.
Note 21: Subsequent Events
Management has evaluated the impact of subsequent events on the Bank through 2 March 2010, the date the financial statements were available to be issued, and hasdetermined that there were no subsequent events requiring recognition or disclosure in the financial statements.
The Parent Bank concluded a private offering of $550 million in common and convertible preference shares on 2 March 2010.