Notes to Consolidated Financial Statements · 2020-05-27 · Notes to Consolidated Financial...
28
Operating Performance Message from the Management Special Feature Overview of Operations CSR Corporate Information Financial Section YAMAHA Motor Co., Ltd. | Annual Report 2010 87 Notes to Consolidated Financial Statements Yamaha Motor Co., Ltd. and Consolidated Subsidiaries Years ended December 31, 2009 and 2010 1. Basis of Presentation 2. Scope of Consolidation 3. Scope of Application of Equity Method of Accounting 4. Closing Date for Consolidated Subsidiaries Yamaha Motor Co., Ltd. (The “Company”) and its domestic sub- sidiaries maintain their accounting records and prepare their finan- cial statements in accordance with accounting principles generally accepted in Japan, and its foreign subsidiaries maintain their books of account in conformity with those of their countries of domicile. The accompanying consolidated financial statements have been prepared in accordance with accounting principles generally accepted in Japan, which are different in certain respects from the Number of consolidated subsidiaries: 104 Number of non-consolidated subsidiaries: 11 Names of principal consolidated subsidiaries: Yamaha Motorcycle Sales Japan Co., Ltd., Yamaha Motor Powered Products Co., Ltd., Yamaha Motor Corporation, U.S.A., Yamaha Motor Manufacturing Corporation of America, Yamaha Motor Europe N.V., MBK Industrie, PT. Yamaha Indonesia Motor Manufacturing, Thai Yamaha Motor Co., Ltd., Yamaha Motor Vietnam Co., Ltd., Yamaha Motor Taiwan Co., Ltd., and Yamaha Motor do Brasil Ltda. Number of non-consolidated subsidiaries accounted for by the equity method of accounting: 7 HL Yamaha Motor Research Centre Sdn. Bhd. and 6 other subsidiaries Number of affiliates accounted for by the equity method of accounting: 26 Chongqing Jianshe Yamaha Motor Co., Ltd. and 25 other affiliates The final date of the business year for all the Company’s consolidated subsidiaries is established in accordance with the Company’s annual closing date for its consolidated financial accounting. application and disclosure requirements of the International Financial Reporting Standards. The text in the sections which follow comprise the English ver- sion of the securities report. As permitted by the Financial Instruments and Exchange Act, amounts of less than one million yen have been omitted. Consequently, the totals shown in the accompanying consolidated financial statements (both in yen and U.S. dollars) do not necessarily equal the sum of the individual amounts. Domestic subsidiaries T.C. Co., Ltd., Yamaha Boating System Co., Ltd., and Yamaha Boating Create Co., Ltd., were liquidated and excluded from consolidation. Yamaha Motor Sanayi ve Ticaret Limited Sirketi, an overseas subsidiary, acquired greater signifi- cance and is now included in the scope of consolidation. Total assets, net sales, net income or loss, retained earnings and other financial indexes of non-consolidated subsidiaries, including HL Yamaha Motor Research Centre Sdn. Bhd., were individually insignificant to the Company’s consolidated financial statements, and were not significant in the aggregate. All shares, including those held by the Company, in overseas subsidiary TYM Marketing Co., Ltd., were sold and the company was removed from the scope of consolidation. Four non-consolidated subsidiaries—including PT. Melco Indonesia, and two affiliates—including Y 2 Marine Manufacturing Co., Ltd.—were individually insignificant to the Company’s consoli- dated net income or loss, consolidated retained earnings and other consolidated financial indexes, and were not significant in the aggregate. Therefore, the Company’s investments in these compa- nies were stated at cost, instead of being accounted for by the equity method of accounting. 5. Accounting Standards (1) Asset Valuation 1) Securities Other securities Marketable securities classified as “other” securities are carried at fair value, based on market prices as of the bal- ance sheet date. (Any changes in unrealized holding gain or loss, net of the applicable income taxes, are included directly in net assets. The cost of securities sold is determined by the moving average method.) Non-marketable securities classified as “other” securities are carried at cost, determined by the moving-average method. 2) Derivatives Derivatives are carried at fair value. 3) Inventories Inventories are stated at cost, determined primarily by the aver- age method. (Values stated in the balance sheet are computed using the write-down of book value due to lower profitability)
Transcript of Notes to Consolidated Financial Statements · 2020-05-27 · Notes to Consolidated Financial...

Operating Performance
Message from
the Managem
entSpecial Feature
Overview of Operations
CSRCorporate Inform
ationFinancial Section
YAMAHA Motor Co., Ltd. | Annual Report 2010 87
Notes to Consolidated Financial StatementsYamaha Motor Co., Ltd. and Consolidated Subsidiaries
Years ended December 31, 2009 and 2010
1. Basis of Presentation
2. Scope of Consolidation
3. Scope of Application of Equity Method of Accounting
4. Closing Date for Consolidated Subsidiaries
Yamaha Motor Co., Ltd. (The “Company”) and its domestic sub-sidiaries maintain their accounting records and prepare their fi nan-cial statements in accordance with accounting principles generally accepted in Japan, and its foreign subsidiaries maintain their books of account in conformity with those of their countries of domicile. The accompanying consolidated fi nancial statements have been prepared in accordance with accounting principles generally accepted in Japan, which are different in certain respects from the
Number of consolidated subsidiaries: 104Number of non-consolidated subsidiaries: 11Names of principal consolidated subsidiaries:
Yamaha Motorcycle Sales Japan Co., Ltd., Yamaha Motor Powered Products Co., Ltd., Yamaha Motor Corporation, U.S.A., Yamaha Motor Manufacturing Corporation of America, Yamaha Motor Europe N.V., MBK Industrie, PT. Yamaha Indonesia Motor Manufacturing, Thai Yamaha Motor Co., Ltd., Yamaha Motor Vietnam Co., Ltd., Yamaha Motor Taiwan Co., Ltd., and Yamaha Motor do Brasil Ltda.
Number of non-consolidated subsidiaries accounted for by the equity method of accounting: 7
HL Yamaha Motor Research Centre Sdn. Bhd. and 6 other subsidiaries
Number of affi liates accounted for by the equity method of accounting: 26
Chongqing Jianshe Yamaha Motor Co., Ltd. and 25 other affi liates
The fi nal date of the business year for all the Company’s consolidated subsidiaries is established in accordance with the Company’s annual closing date for its consolidated fi nancial accounting.
application and disclosure requirements of the International Financial Reporting Standards. The text in the sections which follow comprise the English ver-sion of the securities report. As permitted by the Financial Instruments and Exchange Act, amounts of less than one million yen have been omitted. Consequently, the totals shown in the accompanying consolidated fi nancial statements (both in yen and U.S. dollars) do not necessarily equal the sum of the individual amounts.
Domestic subsidiaries T.C. Co., Ltd., Yamaha Boating System Co., Ltd., and Yamaha Boating Create Co., Ltd., were liquidated and excluded from consolidation. Yamaha Motor Sanayi ve Ticaret Limited Sirketi, an overseas subsidiary, acquired greater signifi -cance and is now included in the scope of consolidation. Total assets, net sales, net income or loss, retained earnings and other fi nancial indexes of non-consolidated subsidiaries, including HL Yamaha Motor Research Centre Sdn. Bhd., were individually insignifi cant to the Company’s consolidated fi nancial statements, and were not signifi cant in the aggregate. All shares, including those held by the Company, in overseas subsidiary TYM Marketing Co., Ltd., were sold and the company was removed from the scope of consolidation.
Four non-consolidated subsidiaries—including PT. Melco Indonesia, and two affi liates—including Y2 Marine Manufacturing Co., Ltd.—were individually insignifi cant to the Company’s consoli-dated net income or loss, consolidated retained earnings and other consolidated fi nancial indexes, and were not signifi cant in the aggregate. Therefore, the Company’s investments in these compa-nies were stated at cost, instead of being accounted for by the equity method of accounting.
5. Accounting Standards
(1) Asset Valuation1) Securities Other securities
Marketable securities classifi ed as “other” securities are carried at fair value, based on market prices as of the bal-ance sheet date. (Any changes in unrealized holding gain or loss, net of the applicable income taxes, are included directly in net assets. The cost of securities sold is determined by the moving average method.) Non-marketable securities classifi ed as “other” securities are carried at cost, determined by the moving-average method.
2) Derivatives Derivatives are carried at fair value.3) Inventories Inventories are stated at cost, determined primarily by the aver-
age method. (Values stated in the balance sheet are computed using the write-down of book value due to lower profi tability)

Oper
atin
g Pe
rform
ance
Mes
sage
from
the
Man
agem
ent
Spec
ial F
eatu
reOv
ervie
w o
f Ope
ratio
nsCS
RCo
rpor
ate
Info
rmat
ion
Fina
ncia
l Sec
tion
YAMAHA Motor Co., Ltd. | Annual Report 201088
5) Accrued employees’ retirement benefi ts Accrued employees’ retirement benefi ts are provided mainly at
an amount, deemed generated on December 31, 2010, calcu-lated based on the retirement benefi t obligation and the fair value of the pension plan assets as of the balance sheet date, as adjusted for unrecognized actuarial gain or loss and unrec-ognized prior service cost.
Prior service cost is being amortized as incurred by the straight-line method over a period, 10 years, which is shorter than the average remaining years of service of the employees.
Actuarial gain and loss are amortized in the year following the year in which the gain or loss is recognized, by the straight-line method, over a period, 10 years, which is shorter than the average remaining years of service of the employees.
(Changes in accounting policies) Effective from the fi scal year ended December 31, 2010, the
Company has applied Partial Amendments to Accounting Standard for Retirement Benefi ts (Part 3) (ASBJ Statement No. 19, issued on July 31, 2008).
This change has no impact on the consolidated statements of income for the fi scal year ended December 31, 2010.
6) Accrued retirement benefi ts for Directors and Corporate Auditors
Accrued retirement benefi ts for Directors and Corporate Auditors are provided based on the amount payable as of the balance sheet date, in accordance with internal regulations of the Company.
7) Accrual for product liabilities An accrual for product liabilities is provided, at an estimated
amount of payments based on the actual results in past years, for liabilities that are not covered by product liability insurance.
8) Accrual for motorcycle recycling costs An accrual for motorcycle recycling costs is provided at an
estimated amount based on actual sales.
(4) Amortization of Goodwill and Negative GoodwillThe difference between the cost and the underlying net equity at fair value of investments in consolidated subsidiaries (“goodwill’) is amortized by the straight-line method over a period of years estimated, based on substantive judgment as incurred.
(5) Range of Funds in the Consolidated Statements of Cash Flows
In the consolidated statements of cash fl ows, funds (cash and cash equivalents) include cash on hand, deposits that can be with-drawn when needed, and short-term investments with a maturity of less than three months from the date of acquisition that are marketable and subject to minimum fl uctuation in value.
(6) Other Items of Signifi cance in Drawing up Consolidated Financial Statements
1) Consumption taxes Transactions subject to national and/or local consumption tax
are recorded at an amount exclusive of the consumption taxes.2) Application of consolidated tax return system The Company applies the Consolidated Tax Return System.
(2) Depreciation and Amortization of Assets1) Tangible fi xed assets (except for leased assets) Depreciation of tangible fi xed assets is computed primarily by
the declining-balance method.2) Intangible fi xed assets (except for leased assets) Amortization of intangible fi xed assets is computed by the
straight-line method. Amortization of capitalized software for internal use is com-
puted by the straight-line method over the software’s estimated useful life (fi ve years).
3) Leased assets Leased assets involved in fi nance lease transactions which
transfer ownershipComputed using the same depreciation method applicable to self-owned fi xed assets.
Leased assets involved in fi nance lease transactions which do not transfer ownership
Computed based on the assumption that the useful life equals the lease term, and the residual value equals zero. Those fi nance lease transactions which do not transfer ownership, where the lease transaction start date was prior to December 31, 2008, are computed based on an accounting method similar to the method for ordinary rental transactions.
(3) Signifi cant Accruals1) Allowance for doubtful receivables In order to evaluate accounts receivable, and loans and other
equivalents, an allowance for doubtful receivables is provided at an amount determined based on the historical experience of bad debt with respect to ordinary receivables, plus an estimate of uncollectible amounts determined by reference to specifi c doubtful receivables from customers who are experiencing fi nancial diffi culties.
2) Accrued bonuses Accrued bonuses are stated at an estimated amount of the
bonuses to be paid to employees, and to personnel working concurrently as Directors, based on their services for the cur-rent fi scal period.
3) Accrued bonuses for Directors Accrued bonuses are stated at an estimated amount of the
bonuses to be paid to Directors, based on their services for the current fi scal period.
4) Accrued warranty costs Accrued warranty costs are provided to cover after-sale service
expenses anticipated to be incurred during the warranty peri-ods of products sold, as well as expenses associated with the quality of products sold, at a specifi cally estimated amount, plus an amount estimated by multiplying sales during the war-ranty period by a factor (after-sales service expenses/sales of products) based on actual costs in the past years and sales during the warranty period.
Notes to Consolidated Financial StatementsYamaha Motor Co., Ltd. and Consolidated Subsidiaries
Years ended December 31, 2009 and 2010

Operating Performance
Message from
the Managem
entSpecial Feature
Overview of Operations
CSRCorporate Inform
ationFinancial Section
YAMAHA Motor Co., Ltd. | Annual Report 2010 89
6. U.S. Dollar Amounts
7. Changes in Accounting Principles and Procedures
The translation of yen amounts into U.S. dollar amounts is included solely for the convenience of readers outside Japan and has been made, as a matter of arithmetic computation only, at ¥81.49 = U.S.$1.00, the approximate rate of exchange in effect at December 31, 2010.
(Application of “Accounting Standards for Business Combinations and Related Matters,” etc.)The Company has applied the following accounting standards: Accounting Standard for Business Combinations (ASBJ State-ment No. 21; December 26, 2008), Accounting Standard for Consolidated Financial Statements (ASBJ Statement No. 22; December 26, 2008), Partial Amendments to Accounting Standard for Research and Development Costs (ASBJ Statement No. 23;
The translation should not be construed as a representation that yen have been, could have been, or could be converted into U.S. dollars at this or any other rate.
December 26, 2008), Revised Accounting Standard for Business Divestitures (ASBJ Statement No. 7; December 26, 2008), Revised Accounting Standard for Equity Method of Accounting for Investments (ASBJ Statement No. 16; December 26, 2008), and Revised Guidance on Accounting Standard for Business Combina-tions and Accounting Standard for Business Divestitures (ASBJ Statement No. 10; December 26, 2008).
8. Changes in Presentation Methods
(1) Consolidated Balance Sheets1) “Deferred tax assets” (¥3,669 million at the end of the fi scal
year ended December 31, 2010), which until the previous fi scal year were recorded as a separate item under “Current assets,” have been included in “Others” under “Current assets” since the amount is not more than 1% of total assets.
2) “Deferred tax assets” (¥3,797 million at the end of the fi scal year ended December 31, 2010), which until the previous fi scal year were recorded as a separate item under “Investments and other assets,” have been included in “Others” under “Investments and other assets” since the amount is not more than 1% of total assets.
3) “Accrued expenses” (¥34,334 million at the end of the fi scal year ended December 31, 2010), which until the previous fi scal year were recorded as a separate item under “Current liabili-ties,” have been included in “Others” under “Current liabilities” since the amount is not more than 5% of total liabilities and net assets.
4) “Accrued retirement benefi ts for Directors and Corporate Auditors” (¥76 million at the end of the fi scal year ended December 31, 2010), which until the previous fi scal year were recorded as a separate item under “Long-term liabilities,” have
been included in “Other provisions” under “Long-term liabilities” since the amount is not more than 1% of total liabilities and net assets.
5) “Accrual for motorcycle recycling costs” (¥1,228 million at the end of the fi scal year ended December 31, 2010), which until the previous fi scal year were recorded as a separate item under “Long-term liabilities,” have been included in “Other provisions” under “Long-term liabilities” since the amount is not more than 1% of total liabilities and net assets.
(2) Consolidated Statements of Income1) “Early retirement benefi t expenses” (¥11 million for the fi scal
year ended December 31, 2010), which until the previous fi scal year were recorded as a separate item under “Non-operating expenses,” have been included in “Others” under “Non-operating expenses” since the amount is not more than 10% of total non-operating expenses.
2) “Refund” of income taxes (¥(628) million for the fi scal year ended December 31, 2010), which until the previous fi scal year were recorded as a separate item, have been included in “Current” of income taxes since the amount has become insignifi cant.

Oper
atin
g Pe
rform
ance
Mes
sage
from
the
Man
agem
ent
Spec
ial F
eatu
reOv
ervie
w o
f Ope
ratio
nsCS
RCo
rpor
ate
Info
rmat
ion
Fina
ncia
l Sec
tion
YAMAHA Motor Co., Ltd. | Annual Report 201090
(3) Pursuant to the “Law Concerning the Revaluation of Land” (No. 24, enacted on March 31, 1999), land used for the Company’s business operations was revalued. The income tax effect of the difference between the book value and the revalued amount has been presented under liabilities as “Deferred tax liabilities on unrealized revaluation gain on land” and the remaining balance has been presented under net assets as “Unrealized revaluation gain on land” in the accompanying consolidated balance sheets.
a) Date of revaluation March 31, 2000
b) Method of revaluation Under Article 2-4 of the Ordinance Implementing the Law
Concerning Land Revaluation (No. 119 of the 1998 Cabinet
Order, promulgated on March 31, 1998), the land price for the revaluation was determined based on the offi cial notice prices assessed and published by the Chief Offi cer of the National Tax Administration, as provided by Article 16 of the Law Concerning Public Notifi cation of Land Prices. The appropriate adjustments were made to refl ect these offi cial notice prices.
c) Fair value of the land used for business after revaluation The fair value of the land used for business after revaluation at the end of fi scal 2009 and 2010 was below its book value by ¥5,272 million and ¥6,287 million ($77,151 thousand), respectively.
(2) Pledged assets and secured liabilities
Millions of yenThousands ofU.S. dollars
2009 2010 2010Pledged assets:
Trade notes and accounts receivable ¥ 66,815 ¥ 61,144 $ 750,325 Merchandise and fi nished goods 2,152 648 7,952 Work-in-process 464 783 9,609 Raw materials and supplies 2,124 3,473 42,619 Other current assets 9,772 9,842 120,776 Buildings and structures (net) 182 166 2,037 Machinery and transportation equipment (net) 8,758 9,229 113,253 Land 1,528 44 540 Construction in progress 1,130 295 3,620 Tangible fi xed assets—other (net) 327 309 3,792 Investment securities 27 38 466 Long-term loans receivable 23,994 21,276 261,087 Investments and other assets—other 1,050 2,486 30,507
Total ¥118,328 ¥109,739 $1,346,656
Secured liabilities:Short-term borrowing ¥ 41,837 ¥ 10,656 $ 130,765 Long-term debt 24,039 26,752 328,286 Long-term liabilities—other 1,476 1,233 15,131
Total ¥ 67,352 ¥ 38,643 $ 474,205
9. Consolidated Balance Sheets
Information regarding consolidated balance sheets at December 31, 2009 and 2010 is as follows.
(1) Accumulated depreciation of tangible fi xed assets
Millions of yenThousands ofU.S. dollars
2009 2010 2010¥516,478 ¥515,876 $6,330,544
Notes to Consolidated Financial StatementsYamaha Motor Co., Ltd. and Consolidated Subsidiaries
Years ended December 31, 2009 and 2010

Operating Performance
Message from
the Managem
entSpecial Feature
Overview of Operations
CSRCorporate Inform
ationFinancial Section
YAMAHA Motor Co., Ltd. | Annual Report 2010 91
(4) Guarantee obligations Guarantees are given for the following companies’ debt from fi nancial institutions.
Millions of yenThousands ofU.S. dollars
2009 2010 2010Subsidiaries or affi liates:
Amagasaki Woodland of Health Co., Ltd. ¥316 ¥293 $3,596 Other companies:
Enrum Marina Muroran Inc. 65 57 699 Marina Kawage Co., Ltd. 25 15 184
Total ¥408 ¥365 $4,479
Guarantee obligations described above include amounts arising from acts resembling guarantees: ¥342 million and ¥308 million ($3,780 thousand) at the end of fi scal 2009 and 2010, respectively.
(5) Discounts on trade notes receivable
Millions of yenThousands ofU.S. dollars
2009 2010 2010¥1,117 ¥1,765 $21,659
(6) Investment securities and investment in partnerships with non-consolidated subsidiaries and affi liates are as follows.
Millions of yenThousands ofU.S. dollars
2009 2010 2010Investment securities (stock) ¥18,644 ¥17,825 $218,738Investment in partnerships 426 756 9,277
10. Consolidated Statements of Income
Information regarding consolidated statements of income for the years ended December 31, 2009 and 2010 is as follows.
(1) Loss on devaluation of inventories after reversal of refund by the lower of cost or market method following write-down of book value due to lower profi tability included in cost of sales
Millions of yenThousands ofU.S. dollars
2009 2010 2010¥10,362 ¥(4,281) $(52,534)
(7) Notes maturing at the end of the consolidated fi scal year were settled on the date of clearing. As the end of the current con-solidated fi scal year fell on a holiday for fi nancial institutions,
the following notes maturing on the fi scal year-end date are included in the balance as of the fi scal year-end.
Millions of yenThousands ofU.S. dollars
2009 2010 2010Notes receivable-trade ¥326 ¥1,025 $12,578 Notes payable-trade 259 260 3,191

Oper
atin
g Pe
rform
ance
Mes
sage
from
the
Man
agem
ent
Spec
ial F
eatu
reOv
ervie
w o
f Ope
ratio
nsCS
RCo
rpor
ate
Info
rmat
ion
Fina
ncia
l Sec
tion
YAMAHA Motor Co., Ltd. | Annual Report 201092
(2) Breakdown of major selling, general and administrative expensesMillions of yen
2009Advertising expenses ¥21,910Sales promotion expenses 18,871Transportation expenses 29,887Provision for accrued warranty costs 6,768Provision for allowance for doubtful receivables 2,533Provision for accrual for product liabilities 13,041Provision for accrual for motorcycle recycling costs 62Salaries 73,560Provision for accrued bonuses 2,693Provision for accrued employees’ retirement benefi ts 3,251
Millions of yenThousands ofU.S. dollars
2010 2010Transportation expenses 30,504 374,328 Provision for accrued warranty costs 15,476 189,913 Provision for allowance for doubtful receivables 1,376 16,886 Salaries 71,392 876,083 Provision for accrued bonuses 2,160 26,506 Provision for accrued employees’ retirement benefi ts 4,446 54,559
(3) Research and development expenses included in selling, general and administrative expenses and manufacturing costs
Millions of yenThousands ofU.S. dollars
2009 2010 2010¥62,066 ¥55,183 $677,175
(4) Breakdown of gain on sale of fi xed assets
Millions of yenThousands ofU.S. dollars
2009 2010 2010Buildings and structures (net) ¥ 11 ¥ 76 $ 933 Machinery and transportation equipment (net) 319 434 5,326 Others (net) 36 33 405 Total ¥367 ¥544 $6,676
(5) Breakdown of loss on sale of fi xed assetsMillions of yen
2009Buildings and structures (net) ¥ 97Machinery and transportation equipment (net) 302Land 14Others (net) 116Total ¥531
Millions of yenThousands ofU.S. dollars
2010 2010Machinery and transportation equipment (net) 156 1,914 Others (net) 18 221 Total ¥175 $2,148
Notes to Consolidated Financial StatementsYamaha Motor Co., Ltd. and Consolidated Subsidiaries
Years ended December 31, 2009 and 2010

Operating Performance
Message from
the Managem
entSpecial Feature
Overview of Operations
CSRCorporate Inform
ationFinancial Section
YAMAHA Motor Co., Ltd. | Annual Report 2010 93
(6) Breakdown of loss on disposal of fi xed assets
Millions of yenThousands ofU.S. dollars
2009 2010 2010Buildings and structures (net) ¥ 283 ¥ 300 $ 3,681 Machinery and transportation equipment (net) 665 328 4,025 Others (net) 238 408 5,007 Total ¥1,186 ¥1,038 $12,738
(7) Details concerning impairment loss included in business structure improvement expenses
Fiscal year ended December 31, 2009
1) Summary of asset groups for which impairment loss has been identifi ed
Impairment lossMillions of yen
Use Location Item 2009
MotorcyclesIwata City (Shizuoka, Japan), U.S.A., Brazil, France, Italy, Hungary, other
Buildings and structures ¥ 8,701Machinery and transportation equipment 25,804 Land 12,242 Others 5,586 Intangible fi xed assets 61Total ¥52,398
Marine productsHamamatsu City (Shizuoka,
Japan), U.S.A., France, other
Buildings and structures ¥ 1,004Machinery and transportation equipment 9,788 Land 29 Construction in progress 624 Others 223 Intangible fi xed assets 149Total ¥11,819
Power productsKakegawa City (Shizuoka,
Japan), U.S.A., other
Buildings and structures ¥ 1,116Machinery and transportation equipment 5,914Land 4,795Construction in progress 1,315Others 944Intangible fi xed assets 3Total ¥14,091
Other productsIwata City (Shizuoka, Japan),
other
Buildings and structures ¥ 406Machinery and transportation equipment 3,310Land 54Others 274Intangible fi xed assets 6Total ¥ 4,052
Idle assetsHamamatsu City (Shizuoka,
Japan), other
Buildings and structures ¥ 100Machinery and transportation equipment 408Land 121Construction in progress 21Others 37Intangible fi xed assets 6Total ¥ 697
2) Method for grouping assets An asset group is defi ned as the minimum unit within a
business segment that generates cash fl ows, generally independent from other asset groups in that segment.
3) Background to the recognition of impairment losses Impairment losses recognized in the motorcycle, marine,
power product and other product business directly corre-late to the signifi cant deterioration of the market in these segments. Impairment losses were also identifi ed among certain idle assets not serving business uses. Specifi cally, losses were recognized for those idle assets whose market prices have signifi cantly declined from their book values.

Oper
atin
g Pe
rform
ance
Mes
sage
from
the
Man
agem
ent
Spec
ial F
eatu
reOv
ervie
w o
f Ope
ratio
nsCS
RCo
rpor
ate
Info
rmat
ion
Fina
ncia
l Sec
tion
YAMAHA Motor Co., Ltd. | Annual Report 201094
11. Consolidated Statements of Changes in Net Assets
Information regarding consolidated statements of changes in net assets for the years ended December 31, 2009 and 2010 is as follows.
Fiscal year ended December 31, 2009
(1) Type and number of outstanding sharesShares
Number of shares asof December 31, 2008
Increase in the number ofshares during the fi scal
year under review
Decrease in the numberof shares during the fi scal
year under reviewNumber of shares as of
December 31, 2009
Common stock 286,507,784 0 0 286,507,784
(2) Type and number of treasury stocksShares
Number of shares asof December 31, 2008
Increase in the number ofshares during the fi scal
year under review
Decrease in the numberof shares during the fi scal
year under reviewNumber of shares as of
December 31, 2009
Common stock 134,458 524,176 485 658,149
Note The reasons for the increase or decrease in the number of shares are as follows: • Increase due to the share purchase requested under the Article 797 (1) of the Company Law: 520,000 shares* • Increase due to the purchase of less-than-one-unit shares from shareholders: 2,713 shares • Increase due to the acquisition of subsidiaries and affi liates accounted for by the equity method: 1,463 shares • Decrease due to requests for additional purchase of less-than-one-unit shares by shareholders: 485 shares * This increase resulted from a share purchase request from shareholders dissenting against the absorption-type merger of Yamaha Marine Co., Ltd.
(YMEC) on January 1, 2009.
2) Method for grouping assets An asset group is defi ned as the minimum unit within a
business segment that generates cash fl ows, generally independent from other asset groups in that segment.
3) Background to the recognition of impairment losses Since a delay in profi tability recovery is forecasted as a
result of a review of future business plans conducted in the fi scal year ended December 31, 2010, principally at the consolidated subsidiary in India, impairment loss was
recognized in the motorcycle business. Impairment losses were also identifi ed among idle assets not serving business uses. Specifi cally, losses were recognized for those idle assets whose market prices have signifi cantly declined from their book values.
4) Computation of recoverable values The recoverable value was computed by the appraisal
value or the net sale value reasonably calculated and obtained using the disposal price.
Fiscal year ended December 31, 2010
1) Summary of asset groups for which impairment loss has been identifi ed
Impairment loss
Millions of yenThousands ofU.S. dollars
Use Location Item 2010 2010
Motorcycles India, other
Buildings and structures ¥1,369 $16,800 Machinery and transportation equipment 4,039 49,564 Others 134 1,644 Intangible fi xed assets 413 5,068 Total ¥5,957 $73,101
Idle assets
Kakegawa City
(Shizuoka, Japan),
other
Buildings and structures ¥ 309 $ 3,792 Machinery and transportation equipment 6 74 Land 298 3,657 Others 56 687 Total ¥ 670 $ 8,222
Notes to Consolidated Financial StatementsYamaha Motor Co., Ltd. and Consolidated Subsidiaries
Years ended December 31, 2009 and 2010
4) Computation of recoverable values The recoverable value represents the utility value, com-
puted using the discount rate of 4.0% (mainly based on the future cash fl ows by each asset group); the estimated value
based on real-estate appraisal criteria; or the net sale value, reasonably computed using the inheritance tax value determined by land assessment, whichever is greater.

Operating Performance
Message from
the Managem
entSpecial Feature
Overview of Operations
CSRCorporate Inform
ationFinancial Section
YAMAHA Motor Co., Ltd. | Annual Report 2010 95
(3) Share warrants and own share warrants
Classifi cationDescription of share
warrants
Type of shares to be issued by the exercise of share warrants
Number of shares issued by the exercise of share warrants (shares)Balance as of
December 31, 2009
December 31, 2008
Increase during the fi scal year under review
Decrease during the fi scal year under review
December 31, 2009 Millions of yen
Yamaha Motor Co., Ltd.
Share warrants as stock options Note — — — — — ¥72Total — — — — — ¥72
Note The exercise periods of the fourth and fi fth share warrants are June 13, 2010 through June 12, 2014 and June 16, 2011 through June 15, 2015, respectively. Thus, the fi rst day of the exercise periods has not come as of the end of the fi scal year ended December 31, 2009.
(4) Dividends • Amount of dividends paid
Resolution Type of share Total amount of dividends Dividend per share Record date Effective date
Millions of yen Yen
Ordinary General Meeting of Shareholders held on March 25, 2009 Common stock ¥1,432 ¥5.00
December 31, 2008
March 26, 2009
• Dividends whose record date falls in FY2009 and whose effective date falls in FY2010. No related items.
Fiscal year ended December 31, 2010
(1) Type and number of outstanding sharesShares
Number of shares asof December 31, 2009
Increase in the number ofshares during the fi scal
year under review
Decrease in the numberof shares during the fi scal
year under reviewNumber of shares as of
December 31, 2010
Common stock 286,507,784 63,250,000 0 349,757,784
Note The reasons for the increase or decrease in the number of shares are as follows: • Increase due to issuance of new shares through public offering: 55,000,000 shares • Increase due to issuance of new shares through third-party allocation: 8,250,000 shares
(2) Type and number of treasury stocksShares
Number of shares asof December 31, 2009
Increase in the number ofshares during the fi scal
year under review
Decrease in the numberof shares during the fi scal
year under reviewNumber of shares as of
December 31, 2010
Common stock 658,149 2,776 176 660,749
Note The reasons for the increase or decrease in the number of shares are as follows: • Increase due to the purchase of less-than-one-unit shares from shareholders: 1,652 shares • Increase due to the acquisition of subsidiaries and affi liates accounted for by the equity method: 1,124 shares • Decrease due to requests for additional purchase of less-than-one-unit shares by shareholders: 176 shares
(3) Share warrants and own share warrants
Classifi cationDescription of share
warrants
Type of shares to be issued by the exercise of share warrants
Number of shares issued by the exercise of share warrants (shares)Balance as of
December 31, 2010
December 31, 2009
Increase during the fi scal year under review
Decrease during the fi scal year under review
December 31, 2010
Millions of yen
Thousands of U.S. dollars
Yamaha Motor Co., Ltd.
Share warrants as stock options Note — — — — — ¥102 $1,252 Total — — — — — ¥102 $1,252
Note The exercise periods of the fi fth and sixth share warrants are June 16, 2011 through June 15, 2015 and June 15, 2012 through June 14, 2016, respectively. Thus, the fi rst day of the exercise periods has not come as of the end of the fi scal year ended December 31, 2010.
(4) Dividends • Amount of dividends paid No related items.
• Dividends whose record date falls in FY2010 and whose effective date falls in FY2011. No related items.

Oper
atin
g Pe
rform
ance
Mes
sage
from
the
Man
agem
ent
Spec
ial F
eatu
reOv
ervie
w o
f Ope
ratio
nsCS
RCo
rpor
ate
Info
rmat
ion
Fina
ncia
l Sec
tion
YAMAHA Motor Co., Ltd. | Annual Report 201096
12. Consolidated Statements of Cash Flows
Information regarding consolidated statements of cash fl ows for the years ended December 31, 2009 and 2010 is as follows.
(1) Reconciliation of “cash and cash equivalents” as of December 31, 2009 and 2010 to amounts in the various accounts appearing in the accompanying consolidated balance sheets
Millions of yenThousands ofU.S. dollars
2009 2010 2010Cash and deposits in banks ¥137,328 ¥205,362 $2,520,088 Time deposits with maturity in excess of three months (721) (2,016) (24,739)Other current assets 612 532 6,528 Cash and cash equivalents ¥137,219 ¥203,878 $2,501,878
(2) Business structure improvement expenses posted in the consolidated statement of cash fl ows for the fi scal year ended December 31, 2009 were impairment losses, which were included in the business structure improvement expenses posted in the consolidated statement of income for fi scal 2009.
(3) Income tax payments and refunds include a ¥13,835 million ($169,775 thousand) refund on transactions in prior fi scal years at consolidated subsidiary Yamaha Motor Corporation, U.S.A.
13. Lease Information
Information regarding leases for the years ended December 31, 2009 and 2010 is as follows.
Fiscal year ended December 31, 2009(1) Finance lease transactions (as a lessee) Finance lease transactions which do not transfer ownership 1) Subject leased assets Tangible fi xed assets Mainly vehicles
2) Depreciation method of leased assets As described in sub-section (2), “Depreciation and
Amortization of Assets,” of section (5) “Accounting Standards.”
Those fi nance lease transactions which do not transfer ownership, where the transaction start date was prior to December 31, 2008, are computed based on an account-ing method similar to the method for ordinary rental trans-actions, described below.
a) Amounts equivalent to acquisition cost, accumulated depreciation and the net book value of leased property at December 31, 2009
Millions of yen
Acquisition costAccumulated depreciation Net book value
Other (tools, furniture and fi xtures) ¥6,357 ¥5,536 ¥821
Acquisition costs of leased property were computed based on the inclusion of their interest portion, due to the lower ratio of the balance for future minimum lease payments to the balance for tangible fi xed assets at the end of the fi scal year.
b) Amounts equivalent to future minimum lease payments at December 31, 2009Millions of yen
Payable within one year ¥ 471Payable after one year 349Total ¥ 821
Future minimum lease payments of leased property were computed based on the inclusion of their interest portion, due to the lower ratio of the balance for future minimum lease payments to the balance for tangible fi xed assets at the end of the fi scal year.
Notes to Consolidated Financial StatementsYamaha Motor Co., Ltd. and Consolidated Subsidiaries
Years ended December 31, 2009 and 2010

Operating Performance
Message from
the Managem
entSpecial Feature
Overview of Operations
CSRCorporate Inform
ationFinancial Section
YAMAHA Motor Co., Ltd. | Annual Report 2010 97
c) Amounts equivalent to lease payments and depreciationMillions of yen
Lease payments ¥655Depreciation 655
d) Computation of amounts equivalent to depreciation The computation of amounts equivalent to depreciation is made by the straight-line method, assuming that useful life equals to
the lease term and the residual value equals to zero.
(2) Operating lease transactions Future minimum lease payments for noncancellable operating lease transactions
Millions of yen
Payable within one year ¥1,412Payable after one year 3,420Total ¥4,832
Fiscal year ended December 31, 2010(1) Finance lease transactions (as a lessee) Finance lease transactions which do not transfer ownership 1) Subject leased assets Tangible fi xed assets Mainly vehicles
2) Depreciation method of leased assets As described in sub-section (2), “Depreciation and
Amortization of Assets,” of section (5) “Accounting Standards.”
Those fi nance lease transactions which do not transfer ownership, where the transaction start date was prior to December 31, 2008, are computed based on an account-ing method similar to the method for ordinary rental trans-actions, described below.
a) Amounts equivalent to acquisition cost, accumulated depreciation and the net book value of leased property at December 31, 2010
Millions of yen Thousands of U.S. dollars
Acquisition costAccumulated depreciation Net book value Acquisition cost
Accumulated depreciation Net book value
Other (tools, furniture and fi xtures) ¥5,351 ¥5,019 ¥332 $65,664 $61,590 $4,074
Acquisition costs of leased property were computed based on the inclusion of their interest portion, due to the lower ratio of the balance for future minimum lease payments to the balance for tangible fi xed assets at the end of the fi scal year.
b) Amounts equivalent to future minimum lease payments at December 31, 2010
Millions of yenThousands ofU.S. dollars
Payable within one year ¥178 $2,184Payable after one year 153 1,878 Total ¥332 $4,074
Future minimum lease payments of leased property were computed based on the inclusion of their interest portion, due to the lower ratio of the balance for future minimum lease payments to the balance for tangible fi xed assets at the end of the fi scal year.
c) Amounts equivalent to lease payments and depreciation
Millions of yenThousands ofU.S. dollars
Lease payments ¥427 $5,240 Depreciation 427 5,240
d) Computation of amounts equivalent to depreciation The computation of amounts equivalent to depreciation is made by the straight-line method, assuming that useful life equals to
the lease term and the residual value equals to zero.

Oper
atin
g Pe
rform
ance
Mes
sage
from
the
Man
agem
ent
Spec
ial F
eatu
reOv
ervie
w o
f Ope
ratio
nsCS
RCo
rpor
ate
Info
rmat
ion
Fina
ncia
l Sec
tion
YAMAHA Motor Co., Ltd. | Annual Report 201098
1. Status of fi nancial instruments held by the group1) Policies on fi nancial instrumentsThe group restricts its asset management to short-term deposits, etc. in principle and raises funds mainly through bank borrowings. Derivative transactions are used to mitigate the risks described below and the group has no intention to engage in speculative trading.
2) Details of fi nancial instruments and related risksTrade notes and accounts receivable, which are operating receivables, are exposed to credit risk of customers. Foreign currency-denominated operating receivables resulting from the group conducting business globally are exposed to risk of foreign currency exchange fl uctuations, which is mitigated in principle by securing foreign exchange forward contracts on the net position of foreign currency-denominated operating receivables and payables. Investment securities, mainly stocks of companies with which the group has business relationships, are exposed to risk of market price fl uctuations. Notes and accounts payable, which are operating payables, are mostly due within one year. Some of them are denominated in foreign currency, refl ecting imports of raw materials, etc., and exposed to risk of foreign currency exchange fl uctuations. However, they are continuously below the balance of accounts receivable denominated in the same foreign currency. Short-term borrowing and long-term debt are intended for working capital, and some of them with variable interest rates are exposed to risk of interest rate fl uctuations. Derivative transactions used by the Company are mainly foreign exchange forward contracts to mitigate risk of foreign currency exchange fl uctuations in connection with foreign currency- denominated operating receivables and payables, and interest rate swap transactions to mitigate risk of fl uctuations in interest paid on the Company’s borrowings.
3) Risk management system for fi nancial instruments (a) Management of credit risk (risks associated with the defaults
of customers) The Company and its consolidated subsidiaries have their
administrative sections in individual business divisions periodically monitor main business partners with regard to operating receivables and keep track of the due date and the balance for each business partner, while trying to identify doubtful receivables due to worsened fi nancial conditions of the business partners at an early stage and seek to reduce their consequences.
In engaging in derivative transactions, the Company enters into transaction only with fi nancial institutions with a high credit rating in order to mitigate counterparty risk.
(b) Management of market risk (foreign currency exchange and interest rate fl uctuation risks)
The Company and some of its consolidated subsidiaries use foreign exchange forward contracts, etc. to mitigate foreign currency exchange fl uctuation risk of foreign currency-denominated operating receivables and payables, which is identifi ed for different currencies on a monthly basis. Foreign exchange forward contracts, etc. are also used for foreign currency-denominated operating receivables, which are certain to be generated as a result of scheduled export transactions. Additionally, the Company and some of its consolidated subsidiaries use interest rate swap transac-tions to reduce risk of fl uctuations in interest paid on their borrowings.
The Company periodically monitors the market prices of investment securities and the fi nancial conditions of the issu-ers (business partners) and reviews its holding of investment securities on an ongoing basis, taking relationships with the business partners into account.
The Company’s fi nance & accounting division carries out derivative transactions based on the internal rules prescribing transaction authority, the upper limit and others, keeps records and cross-checks the balance with fi nancial institutions. Transactions of foreign exchange forward con-tracts, etc. are reported to Executive Offi cers in the position of Senior Executive Offi cer or higher, Standing Corporate Auditors, and heads of the fi nance & accounting division and the division responsible for managing positions at least twice a month. The Company also monitors consolidated subsidiaries in accordance with the internal rules.
(c) Management of liquidity risk related to fi nancing (risks in which the Company being unable to repay within the due date)
The Company and each of its consolidated subsidiaries control liquidity risk by formulating and revising a cash position plan as needed, while maintaining liquidity on hand at an appropriate level.
4) Supplementary explanation concerning fair values, etc. of fi nancial instruments
Fair values of fi nancial instruments comprise values determined based on market prices and values determined reasonably when there is no market price. Since variable factors are incorporated in computing the relevant fair values, such fair values may vary depending on the different assumptions.
14. Financial Instruments and Related Disclosure
Consolidated fi scal year ended December 31, 2010
(2) Operating lease transactions Future minimum lease payments for noncancellable operating lease transactions
Millions of yenThousands ofU.S. dollars
Payable within one year ¥1,019 $12,505 Payable after one year 2,779 34,102 Total ¥3,799 $46,619
Notes to Consolidated Financial StatementsYamaha Motor Co., Ltd. and Consolidated Subsidiaries
Years ended December 31, 2009 and 2010

Operating Performance
Message from
the Managem
entSpecial Feature
Overview of Operations
CSRCorporate Inform
ationFinancial Section
YAMAHA Motor Co., Ltd. | Annual Report 2010 99
2. Fair value of fi nancial instrumentsCarrying amount, fair value and differences of the fi nancial instruments as of December 31, 2010 are as follows. Financial instruments whose fair values are not readily determinable are excluded from the following table: (See Note 2.)
Millions of yen Thousands of U.S. dollarsCarrying amount Fair value Differences Carrying amount Fair value Differences
(1) Cash and deposits in banks ¥205,362 ¥205,362 ¥ — $2,520,088 $2,520,088 $ —(2) Trade notes and accounts receivable 183,711 2,254,399 Allowance for doubtful receivables *1 (5,860) (71,911)
177,850 177,816 (34) 2,182,476 2,182,059 (417)(3) Investment securities 16,469 16,469 — 202,098 202,098 —(4) Long-term loans receivable 37,034 454,461 Allowance for doubtful receivables *1 (1,419) (17,413)
35,615 40,233 4,618 437,047 493,717 56,670Assets 435,297 439,881 4,583 5,341,723 5,397,975 56,240(5) Notes and accounts payable 125,809 125,809 — 1,543,858 1,543,858 —(6) Short-term borrowing 35,455 35,455 — 435,084 435,084 —(7) Current portion of long-term debt 57,576 57,576 — 706,541 706,541 —(8) Long-term debt 229,410 233,762 4,351 2,815,192 2,868,597 53,393Liabilities 448,252 452,604 4,351 5,500,699 5,554,105 53,393Derivative transactions *2 344 344 — 4,221 4,221 —
*1 Allowance for doubtful receivables are deducted from trade notes and accounts receivable and long-term loans receivable.*2 Receivables and payables, which were derived from derivative transactions, are presented in net amount.
Notes 1 Calculation method of fair values of fi nancial instruments and matters concerning marketable securities and derivative transactions Assets: (1) Cash and deposits in banks These assets are recorded using book values as the fair values are almost equal to the book values because of their short-term maturities.
(2) Trade notes and accounts receivable The fair values of these assets are measured at the present values of their future cash fl ows from which an allowance for doubtful receivables equivalent to credit
risk are deducted. In order to compute the present values of the future cash fl ows of these assets, the assets are categorized by specifi ed time period, and future cash fl ows in each category are discounted at a rate in accordance with appropriate indices such as government bond yields.
(3) Investment securities Investment securities are determined using the quoted price at the stock exchange. For information on securities classed by holding purpose, please refer to the
note “Marketable Securities.”
(4) Long-term loans receivable For long-term loans receivable with variable rates, fair value is calculated based on book values, as they refl ect market interest rates in the short run. For long-term loans receivable with fi xed rates, the fair values are measured at their present values from which an allowance for doubtful receivables
equivalent to credit risk are deducted. The present values of these assets are computed by discounting for each collection period at a rate in accordance with appropriate indices such as government bond yields.
Liabilities: (5) Notes and accounts payable, (6) Short-term borrowing, (7) Current portion of long-term debt These liabilities are recorded using book values as the fair values are almost equal to the book values because of their short-term maturities.
(8) Long-term debt For long-term debt with variable rates, fair value is calculated based on book values, as they refl ect market interest rates in the short run. For long-term debt with fi xed rates, the fair values are determined by computing the present values, discounted for each collection period at a projected inter-
est rate if a similar borrowing is taken out.
Derivative transactions For details on derivative transactions, refer to the note “Derivative Transactions.”

Oper
atin
g Pe
rform
ance
Mes
sage
from
the
Man
agem
ent
Spec
ial F
eatu
reOv
ervie
w o
f Ope
ratio
nsCS
RCo
rpor
ate
Info
rmat
ion
Fina
ncia
l Sec
tion
YAMAHA Motor Co., Ltd. | Annual Report 2010100
15. Marketable Securities
Information regarding marketable securities for the years ended December 31, 2009 and 2010 is as follows.
Fiscal year ended December 31, 2009
(1) Other securities with fair value (as of December 31, 2009)
Millions of yenType Acquisition cost Carrying value Unrealized gain
Securities whose carrying value exceeds their acquisition cost
(1) Equity securities ¥10,084 ¥15,330 ¥5,245(2) Bonds: 1) National and local government bonds — — — 2) Corporate bonds — — — 3) Other bonds — — —(3) Other — — —Sub-total 10,084 15,330 5,245
Securities whose acquisition cost exceeds their carrying value
(1) Equity securities ¥ 3,624 ¥ 3,078 ¥ (545)(2) Bonds: 1) National and local government bonds — — — 2) Corporate bonds — — — 3) Other bonds — — —(3) Other — — —Sub-total 3,624 3,078 (545)Total ¥13,709 ¥18,408 ¥4,699
Note The Company generally posts the entire amount of impairment loss on all securities whose fair value at the end of the fi scal year is less than 50% of the acquisition cost. For securities whose fair value at the end of the fi scal year decreases by 30 to 50% from their acquisition cost, the Company posts an impairment loss when it is judged necessary, by examining the importance and recoverability of the amount in question.
2 Financial instruments for which determining a market price is deemed extremely diffi cultMillions of yen Thousands of U.S. dollarsCarrying value Carrying value
Investment securities—Unlisted equity securities ¥18,847 $231,280
The item above has no market price and the effort to pinpoint fair value is deemed extremely diffi cult so the item is excluded from (3) Investment securities in the preceding table.
3 Redemption schedule for monetary claims and held-to-maturity securities with maturity dates subsequent to the consolidated fi scal year-end
Millions of yen Thousands of U.S. dollars1 year or less
1 to 5 years
5 to 10 years
More than 10 years
1 year or less
1 to 5 years
5 to 10 years
More than 10 years
Cash and deposits in banks ¥205,362 ¥ — ¥— ¥ — $2,520,088 $ — $ — $ —
Trade notes and accounts receivable 183,157 554 — — 2,247,601 6,798 — —
Long-term loans receivable — 36,844 70 119 — 452,129 859 1,460
Total ¥388,520 ¥37,399 ¥70 ¥119 $4,767,702 $458,940 $859 $1,460
4 Redemption schedule for long-term debt subsequent to the consolidated fi scal year-end See “Fund Procurement Conditions.”
(Additional Information)Effective from the fi scal year ended December 31, 2010, the Company has adopted “Accounting Standard for Financial Instruments” (ASBJ Statement No. 10, March 10, 2008) and “Guidance on Disclosures about Fair Value of Financial Instruments” (ASBJ Guidance No. 19 Guidance, March 10, 2008).
Notes to Consolidated Financial StatementsYamaha Motor Co., Ltd. and Consolidated Subsidiaries
Years ended December 31, 2009 and 2010

Operating Performance
Message from
the Managem
entSpecial Feature
Overview of Operations
CSRCorporate Inform
ationFinancial Section
YAMAHA Motor Co., Ltd. | Annual Report 2010 101
(2) Other marketable securities sold during the fi scal year (January 1, 2009 through December 31, 2009)
Millions of yenAmount sold Total gains Total losses
¥62 ¥4 ¥15
(3) Carrying value of securities whose fair value is not available (as of December 31, 2009)
Millions of yenCarrying value
Other securities:Unlisted equity securities ¥1,084
Fiscal year ended December 31, 2010
(1) Other securities with fair value (as of December 31, 2010)
Millions of yen Thousands of U.S. dollarsType Acquisition cost Carrying value Unrealized gain Acquisition cost Carrying value Unrealized gain
Securities whose carrying value exceeds their acquisition cost
(1) Equity securities ¥10,160 ¥14,253 ¥4,092 $124,678 $174,905 $ 50,215 (2) Bonds: 1) National and local government bonds — — — — — — 2) Corporate bonds — — — — — — 3) Other bonds — — — — — — (3) Other — — — — — —Sub-total 10,160 14,253 4,092 124,678 174,905 50,215
Securities whose acquisition cost exceeds their carrying value
(1) Equity securities ¥ 3,081 ¥ 2,215 ¥ (865) $ 37,808 $ 27,181 $(10,615)(2) Bonds: 1) National and local government bonds — — — — — — 2) Corporate bonds — — — — — — 3) Other bonds — — — — — — (3) Other — — — — — —Sub-total 3,081 2,215 (865) 37,808 27,181 (10,615)Total ¥13,241 ¥16,469 ¥3,227 $162,486 $202,098 $ 39,600
Note Unlisted stocks (¥1,022 million booked on the consolidated balance sheet) have no market price and the effort to pinpoint fair value is deemed extremely diffi cult so they are excluded from “Other marketable securities” in the preceding table.
(2) Other marketable securities sold during the fi scal year (January 1, 2010 through December 31, 2010)
Millions of yen Thousands of U.S. dollarsAmount sold Total gains Total losses Amount sold Total gains Total losses
¥51 ¥34 ¥3 $626 $417 $37
(3) Impaired marketable securities For the fi scal year ended December 31, 2010, the Company recorded impairment losses of ¥511 million ($6,271 thousand) on investment securities (¥477 million ($5,853 thousand) on listed stock under other marketable securities and ¥31 million ($380 thousand) on unlisted stocks and ¥1 million ($12 thousand) on equity in affi liates).
The Company generally posts the entire amount of impairment loss on all securities whose fair value at the end of the fi scal year is less than 50% of the acquisition cost. For securities whose fair value at the end of the fi scal year decreases by 30 to 50% from their acquisition cost, the Company posts an impairment loss when it is judged neces-sary, by examining the importance and recoverability of the amount in question.

Oper
atin
g Pe
rform
ance
Mes
sage
from
the
Man
agem
ent
Spec
ial F
eatu
reOv
ervie
w o
f Ope
ratio
nsCS
RCo
rpor
ate
Info
rmat
ion
Fina
ncia
l Sec
tion
YAMAHA Motor Co., Ltd. | Annual Report 2010102
16. Derivative Transactions
Matters concerning the market value of transactions
Fiscal year ended December 31, 2009
The Company changed the accounting method for derivative transactions from hedge accounting to the market value-based method since the fi scal year ended December 31, 2009. The change was made in conjunction with a groupwide review of hedging policy and other factors.
Derivative fi nancial instruments that do not apply for hedge accounting
(1) Currency relatedMillions of yen
Classifi cation Transaction Contractual valueContractual value
over 1 year Market value Unrealized gain or lossNon-market transactions
Forward exchange contractSell:
USD ¥27,776 ¥— ¥28,287 ¥(511)EUR 22,734 — 22,503 231CAD 6,054 — 6,137 (83)GBP 4,948 — 4,936 11PLN 1,631 — 1,663 (31)AUD 1,612 — 1,635 (23)HUF 428 — 434 (6)CZK 199 — 197 2JPY 20 — 19 0
Buy:USD 14,553 — 14,592 39JPY 863 — 875 12
Total ¥49,988 ¥— ¥50,346 ¥(358)
Note Market values are computed based on forward rates at the end of the fi scal year.
(2) Interest-rate relatedMillions of yen
Classifi cation Transaction Contractual valueContractual value
over 1 year Market value Unrealized gain or lossNon-market transactions
Interest-rate swap contractReceipts fi xed, payments fl oating ¥ 29,531 ¥ 29,531 ¥(203) ¥(203)Receipts fl oating, payments fi xed 86,238 81,557 (662) (662)
Total ¥115,770 ¥111,089 ¥(866) ¥(866)
Note Market values are computed based on quotes from fi nancial institutions, among other sources.
(3) OtherMillions of yen
Classifi cation Transaction Contractual valueContractual value
over 1 year Market value Unrealized gain or lossNon-market transactions Other ¥183,020 ¥41,572 ¥89 ¥89
Total ¥183,020 ¥41,572 ¥89 ¥89
Notes 1 Derivative transactions related to sales fi nance. 2 Market values are generally computed by estimating the future cash fl ow, and discounting it with an appropriate market interest rate.
Notes to Consolidated Financial StatementsYamaha Motor Co., Ltd. and Consolidated Subsidiaries
Years ended December 31, 2009 and 2010

Operating Performance
Message from
the Managem
entSpecial Feature
Overview of Operations
CSRCorporate Inform
ationFinancial Section
YAMAHA Motor Co., Ltd. | Annual Report 2010 103
Fiscal year ended December 31, 2010
1. Derivative fi nancial instruments that do not apply for hedge accounting
(1) Currency relatedMillions of yen
Classifi cation Transaction Contractual valueContractual value
over 1 year Market value Unrealized gain or lossNon-market transactions
Forward exchange contractSell:
USD ¥51,201 ¥— ¥ 942 ¥ 942EUR 12,579 — 219 219 CAD 2,531 — 4 4 PLN 1,597 — (6) (6) JPY 1,257 — (8) (8) HUF 463 — (2) (2) SGD 374 — (3) (3) GBP 360 — 1 1
Buy:USD 10,870 — 100 100 EUR 7,504 — (119) (119) JPY 1,111 — 36 36 SEK 240 — 0 0
Total ¥50,640 ¥— ¥1,164 ¥1,164
Thousands of U.S. dollars
Classifi cation Transaction Contractual valueContractual value
over 1 year Market value Unrealized gain or lossNon-market transactions
Forward exchange contractSell:
USD $628,310 $— $11,560 $11,560 EUR 154,362 — 2,687 2,687 CAD 31,059 — 49 49 PLN 19,597 — (74) (74)JPY 15,425 — (98) (98)HUF 5,682 — (25) (25)SGD 4,590 — (37) (37)GBP 4,418 — 12 12
Buy:USD 133,391 — 1,227 1,227 EUR 92,085 — (1,460) (1,460)JPY 13,634 — 442 442 SEK 2,945 — 0 0
Total $621,426 $— $14,284 $14,284
Note Market values are computed based on forward rates at the end of the fi scal year.
(2) Interest-rate relatedMillions of yen
Classifi cation Transaction Contractual valueContractual value
over 1 year Market value Unrealized gain or lossNon-market transactions
Interest-rate swap contractReceipts fi xed, payments fl oating ¥ 35,738 ¥32,876 ¥ (109) ¥ (109)Receipts fl oating, payments fi xed 92,881 31,186 (1,101) (1,101)
Total ¥128,620 ¥64,042 ¥(1,211) ¥(1,211)

Oper
atin
g Pe
rform
ance
Mes
sage
from
the
Man
agem
ent
Spec
ial F
eatu
reOv
ervie
w o
f Ope
ratio
nsCS
RCo
rpor
ate
Info
rmat
ion
Fina
ncia
l Sec
tion
YAMAHA Motor Co., Ltd. | Annual Report 2010104
Thousands of U.S. dollars
Classifi cation Transaction Contractual valueContractual value
over 1 year Market value Unrealized gain or lossNon-market transactions
Interest-rate swap contractReceipts fi xed, payments fl oating $ 438,557 $403,436 $ (1,338) $ (1,338)Receipts fl oating, payments fi xed 1,139,784 382,697 (13,511) (13,511)
Total $1,578,353 $785,888 $(14,861) $(14,861)
Note Market values are computed based on quotes from fi nancial institutions, among other sources.
(3) OtherMillions of yen
Classifi cation Transaction Contractual valueContractual value
over 1 year Market value Unrealized gain or lossNon-market transactions Other ¥134,760 ¥41,411 ¥391 ¥391
Total ¥134,760 ¥41,411 ¥391 ¥391
Thousands of U.S. dollars
Classifi cation Transaction Contractual valueContractual value
over 1 year Market value Unrealized gain or lossNon-market transactions Other $1,653,700 $508,173 $4,798 $4,798
Total $1,653,700 $508,173 $4,798 $4,798
Notes 1 Derivative transactions related to sales fi nance. 2 Market values are generally computed by estimating the future cash fl ow, and discounting it with an appropriate market interest rate.
2. Derivative fi nancial instruments that apply for hedge accountingNo related items.
17. Retirement Benefi t Plans
Information regarding retirement benefi t plans for the years ended December 31, 2009 and 2010 is as follows.
(1) Outline of retirement benefi t plans The Company and certain of its domestic consolidated
subsidiaries have cash balance pension plans and lump-sum payment plans. Certain of its other domestic consolidated sub-sidiaries have defi ned-benefi t plans, i.e., welfare pension funds, tax-qualifi ed pension plans and lump-sum payment plans.
Certain overseas consolidated subsidiaries have defi nedcontribution pension plans, in addition to defi ned- benefi t plans.
(2) Retirement benefi t obligation and related items
Millions of yenThousands ofU.S. dollars
2009 2010 2010Retirement benefi t obligation ¥(149,076) ¥(150,126) $(1,842,263)Plan assets at fair value 97,423 97,130 1,191,925 Unfunded retirement benefi t obligation (51,653) (52,996) (650,337)Unrecognized actuarial gain or loss 18,644 18,301 224,580 Unrecognized prior service cost (1,512) (510) (6,258)Net retirement benefi t obligation (34,521) (35,204) (432,004)Prepaid pension cost 226 218 2,675 Accrued retirement benefi ts ¥ (34,748) ¥ (35,423) $ (434,691)
Note Certain of the Company’s subsidiaries adopt the simplifi ed method to compute their retirement benefi t obligation.
Notes to Consolidated Financial StatementsYamaha Motor Co., Ltd. and Consolidated Subsidiaries
Years ended December 31, 2009 and 2010

Operating Performance
Message from
the Managem
entSpecial Feature
Overview of Operations
CSRCorporate Inform
ationFinancial Section
YAMAHA Motor Co., Ltd. | Annual Report 2010 105
18. Stock Options
Information regarding stock options for the years ended December 31, 2009 and 2010 is as follows.
Fiscal year ended December 31, 2009
1. Expenses associated with stock options during fi scal 2009 and the category in which they were classifi ed: Selling, general and administrative expenses: ¥42 million.
(3) Retirement benefi t expenses and related items
Millions of yenThousands ofU.S. dollars
2009 2010 2010Service cost ¥ 7,014 ¥ 6,552 $ 80,403 Interest cost 3,630 3,558 43,662 Expected return on plan assets (2,671) (2,964) (36,373)Amortization of actuarial gain or loss 3,423 4,084 50,117 Amortization of prior service cost (209) 278 3,411 Total ¥ 11,188 ¥11,508 $141,220
Notes 1 In addition to the retirement benefi t expenses above, employees’ early retirement expenses amounting to ¥20,160 million as business structure improve-ment expenses of extraordinary losses in fi scal 2009, as well as incentives amounting to ¥35 million as early retirement benefi t expenses of non-operating expenses were registered separately in fi scal 2009. In addition to the aforementioned retirement benefi t expenses, in fi scal 2010 the Company recorded ¥11 million ($135 thousand) for special incentives and other payments related to the voluntary early retirement program offer presented to employees in 2010 and ¥551 million ($6,762 thousand) in contributions to defi ned contribution pension plans.
2 In addition to the retirement benefi t expenses above, contributions into defi ned-contribution plans amounting to ¥689 million were registered separately in fi scal 2009.
3 Retirement benefi t expenses of the Company’s consolidated subsidiaries, which were accounted for by the simplifi ed method, were registered under the classifi cation “service cost” in the above table.
(4) Assumptions and policies adopted in the calculation of retirement benefi t obligation
2009 2010Attribution method for retirement benefi ts in the period Straight-line method Straight-line methodDiscount rate Mainly 2.0% Mainly 2.0%Expected rate of return on plan assets Mainly 2.5% Mainly 3.0%Amortization years of actuarial gain or loss Mainly 10 years
Amortized in the year following the year in which the gain or loss is recognized, primarily by the straight-line method, over a period which is shorter than the average remaining years of service of the employees.
Mainly 10 yearsAmortized in the year following the year in which the gain or loss is recognized, primarily by the straight-line method, over a period which is shorter than the average remaining years of service of the employees.
Amortization years of prior service cost Mainly 10 yearsAmortized as incurred, by the straight-line method over a period which is shorter than the average remaining years of service of the employees.
Mainly 10 yearsAmortized as incurred, by the straight-line method over a period which is shorter than the average remaining years of service of the employees.

Oper
atin
g Pe
rform
ance
Mes
sage
from
the
Man
agem
ent
Spec
ial F
eatu
reOv
ervie
w o
f Ope
ratio
nsCS
RCo
rpor
ate
Info
rmat
ion
Fina
ncia
l Sec
tion
YAMAHA Motor Co., Ltd. | Annual Report 2010106
2. Outline of stock options and changes
(1) Outline of stock options2008 Stock options 2009 Stock options
Title and number of grantees (Persons) Directors of Yamaha Motor Co., Ltd.: 9 Directors of Yamaha Motor Co., Ltd.: 7Executive Offi cers of Yamaha Motor Co., Ltd.: 15
Executive Offi cers of Yamaha Motor Co., Ltd.: 18
Number of stock options Note 1 (Shares) Common shares 75,500 Common shares 112,000Grant date June 13, 2008 June 16, 2009Condition for vesting Note 2 Persons who have received allocations of
common stock must serve a full term that includes the grant date (June 13, 2008).
Persons who have received allocations of common stock must serve a full term that includes the grant date (June 16, 2009).
Requisite service period Same period as listed under condition for vesting
Same period as listed under condition for vesting
Exercise period June 13, 2010 to June 12, 2014 June 16, 2011 to June 15, 2015
Notes 1 Stock options are converted into a number of shares. 2 Conditions for the exercise of stock options (1) Persons who have received allocations of share warrants may not exercise the rights when they lose their status as Director or Executive Offi cer of
Yamaha Motor Co., Ltd., for any reason stipulated in the “Agreement on Allocation of Share Warrants” concluded between the Company and the grantee.
(2) Share warrants may not be inherited. (3) Other conditions governing the exercise of stock option rights are based on the provisions of the “Agreement on Allocation of Share Warrants”
concluded between the Company and the grantee.
(2) Stock options granted and changes Stock options outstanding in fi scal 2009 are counted and converted into a number of shares.
a) Number of stock optionsShares
2008 Stock options 2009 Stock optionsBefore vesting:
Previous fi scal year-end 75,500 —Granted — 112,000Forfeited — —Vested 75,500 —Outstanding — 112,000
After vesting:Previous fi scal year-end — —Vested 75,500 —Exercised — —Forfeited — —Exercisable 75,500 —
b) Price informationYen
2008 Stock option 2009 Stock optionExercise price ¥2,205 ¥1,207Average exercise price — —Fair value at the grant date 535 380
Notes to Consolidated Financial StatementsYamaha Motor Co., Ltd. and Consolidated Subsidiaries
Years ended December 31, 2009 and 2010
Operating Performance
Message from
the Managem
entSpecial Feature
Overview of Operations
CSRCorporate Inform
ationFinancial Section
YAMAHA Motor Co., Ltd. | Annual Report 2010 107
3. Technique used for valuating the fair value of stock options Stock options granted in the fi scal year were valuated using the following technique. a) Valuation technique: Black-Scholes option-pricing model b) Principal parameters used in the option-pricing model
2009 Stock optionsExpected volatility Note 1 46.82%Average expected life Note 2 4 yearsExpected dividends Note 3 ¥25.50 per shareRisk-free interest rate Note 4 0.71%
Notes 1 Calculated based on the actual stock prices during the four years ending on the stock option grant date (June 16, 2009). 2 The average expected life could not be reasonably estimated due to insuffi cient data. Therefore, it was estimated assuming that the options were exercised
at the mid-point of the exercise period. 3 The actual dividends on common stock for the fi scal year ended December 31, 2008. 4 Japanese government bond yield corresponding to the average expected life.
4. Method of estimating number of stock options vested Only the actual number of forfeited stock options is refl ected because it is diffi cult to reasonably estimate the number of stock options
that will be forfeited in the future.
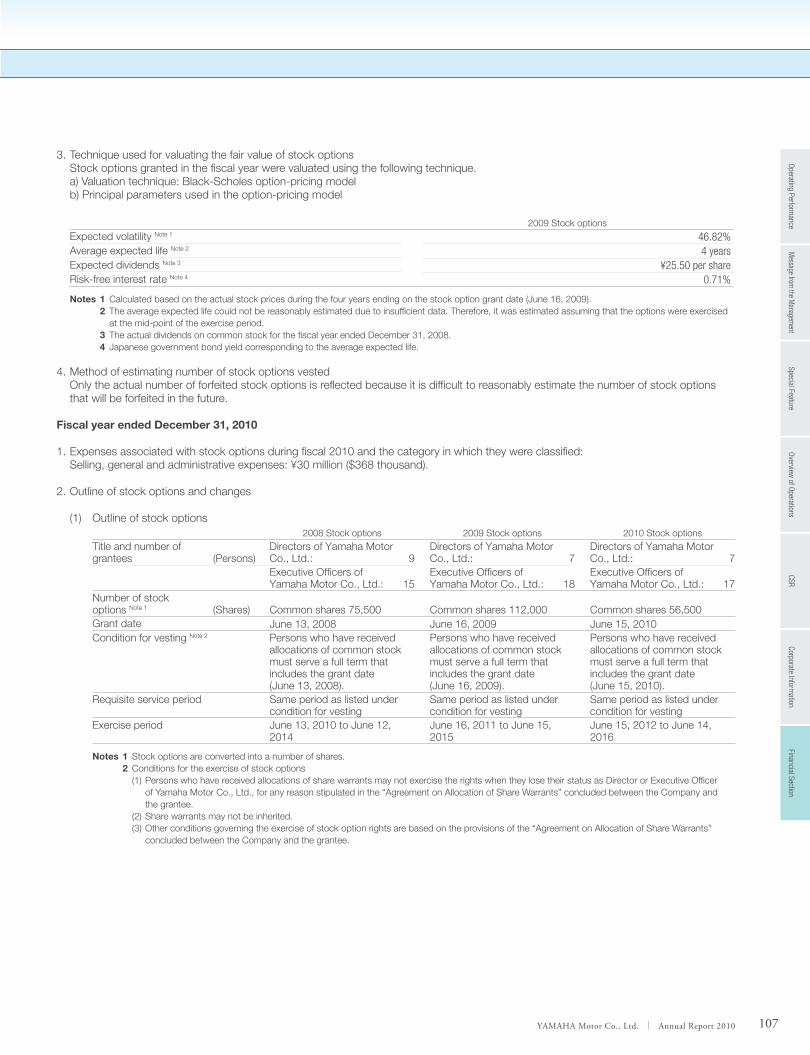
Fiscal year ended December 31, 2010
1. Expenses associated with stock options during fi scal 2010 and the category in which they were classifi ed: Selling, general and administrative expenses: ¥30 million ($368 thousand).
2. Outline of stock options and changes
(1) Outline of stock options2008 Stock options 2009 Stock options 2010 Stock options
Title and number of grantees (Persons)
Directors of Yamaha Motor Co., Ltd.: 9
Directors of Yamaha Motor Co., Ltd.: 7
Directors of Yamaha Motor Co., Ltd.: 7
Executive Offi cers of Yamaha Motor Co., Ltd.: 15
Executive Offi cers of Yamaha Motor Co., Ltd.: 18
Executive Offi cers of Yamaha Motor Co., Ltd.: 17
Number of stock options Note 1 (Shares) Common shares 75,500 Common shares 112,000 Common shares 56,500Grant date June 13, 2008 June 16, 2009 June 15, 2010Condition for vesting Note 2 Persons who have received
allocations of common stock must serve a full term that includes the grant date (June 13, 2008).
Persons who have received allocations of common stock must serve a full term that includes the grant date (June 16, 2009).
Persons who have received allocations of common stock must serve a full term that includes the grant date (June 15, 2010).
Requisite service period Same period as listed under condition for vesting
Same period as listed under condition for vesting
Same period as listed under condition for vesting
Exercise period June 13, 2010 to June 12, 2014
June 16, 2011 to June 15, 2015
June 15, 2012 to June 14, 2016
Notes 1 Stock options are converted into a number of shares. 2 Conditions for the exercise of stock options (1) Persons who have received allocations of share warrants may not exercise the rights when they lose their status as Director or Executive Offi cer
of Yamaha Motor Co., Ltd., for any reason stipulated in the “Agreement on Allocation of Share Warrants” concluded between the Company and the grantee.
(2) Share warrants may not be inherited. (3) Other conditions governing the exercise of stock option rights are based on the provisions of the “Agreement on Allocation of Share Warrants”
concluded between the Company and the grantee.

Oper
atin
g Pe
rform
ance
Mes
sage
from
the
Man
agem
ent
Spec
ial F
eatu
reOv
ervie
w o
f Ope
ratio
nsCS
RCo
rpor
ate
Info
rmat
ion
Fina
ncia
l Sec
tion
YAMAHA Motor Co., Ltd. | Annual Report 2010108
(2) Stock options granted and changes Stock options outstanding in fi scal 2010 are counted and converted into a number of shares.
a) Number of stock optionsShares
2008 Stock options 2009 Stock options 2010 Stock optionsBefore vesting:
Previous fi scal year-end — 112,000 — Granted — — 56,500 Forfeited — — — Vested — 112,000 — Outstanding — — 56,500
After vesting:Previous fi scal year-end 75,500 — — Vested — 112,000 — Exercised — — — Forfeited — — — Exercisable 75,500 112,000 —
b) Price informationYen U.S. dollars
2008 Stock options
2009 Stock options
2010 Stock options
2008 Stock options
2009 Stock options
2010 Stock options
Exercise price ¥2,205 ¥1,207 ¥1,396 $27.06 $14.81 $17.13 Average exercise price — — — — — —Fair value at the grant date 535 380 465 6.57 4.66 5.71
3. Technique used for valuating the fair value of stock options Stock options granted in the fi scal year were valuated using the following technique. a) Valuation technique: Black-Scholes option-pricing model b) Principal parameters used in the option-pricing model
2010 Stock optionsExpected volatility Note 1 48.41%Average expected life Note 2 4 yearsExpected dividends Note 3 ¥0 per shareRisk-free interest rate Note 4 0.31%
Notes 1 Calculated based on the actual stock prices during the four years ending on the stock option grant date (June 15, 2010). 2 The average expected life could not be reasonably estimated due to insuffi cient data. Therefore, it was estimated assuming that the options were exercised
at the mid-point of the exercise period. 3 The actual dividends on common stock for the fi scal year ended December 31, 2009. 4 Japanese government bond yield corresponding to the average expected life.
4. Method of estimating number of stock options vested Only the actual number of forfeited stock options is refl ected because it is diffi cult to reasonably estimate the number of stock options
that will be forfeited in the future.
Notes to Consolidated Financial StatementsYamaha Motor Co., Ltd. and Consolidated Subsidiaries
Years ended December 31, 2009 and 2010
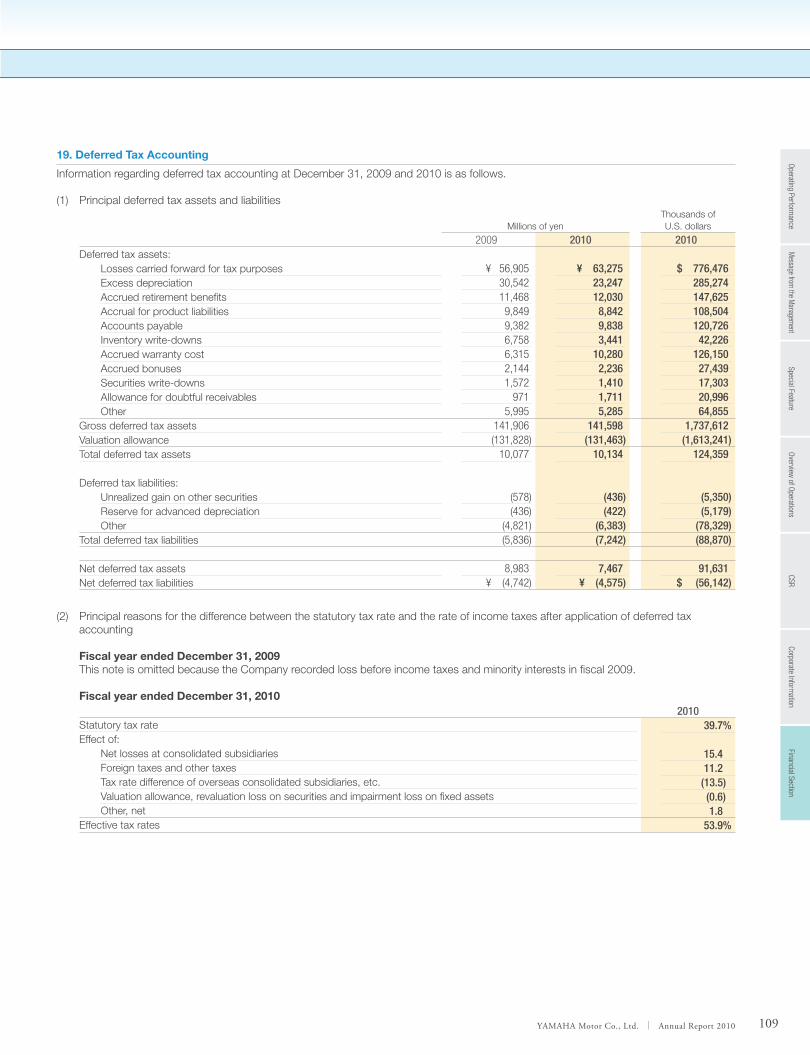
Operating Performance
Message from
the Managem
entSpecial Feature
Overview of Operations
CSRCorporate Inform
ationFinancial Section
YAMAHA Motor Co., Ltd. | Annual Report 2010 109
19. Deferred Tax Accounting
Information regarding deferred tax accounting at December 31, 2009 and 2010 is as follows.
(1) Principal deferred tax assets and liabilities
Millions of yenThousands ofU.S. dollars
2009 2010 2010Deferred tax assets:
Losses carried forward for tax purposes ¥ 56,905 ¥ 63,275 $ 776,476 Excess depreciation 30,542 23,247 285,274 Accrued retirement benefi ts 11,468 12,030 147,625 Accrual for product liabilities 9,849 8,842 108,504Accounts payable 9,382 9,838 120,726 Inventory write-downs 6,758 3,441 42,226 Accrued warranty cost 6,315 10,280 126,150 Accrued bonuses 2,144 2,236 27,439 Securities write-downs 1,572 1,410 17,303Allowance for doubtful receivables 971 1,711 20,996 Other 5,995 5,285 64,855
Gross deferred tax assets 141,906 141,598 1,737,612 Valuation allowance (131,828) (131,463) (1,613,241)Total deferred tax assets 10,077 10,134 124,359
Deferred tax liabilities:Unrealized gain on other securities (578) (436) (5,350)Reserve for advanced depreciation (436) (422) (5,179)Other (4,821) (6,383) (78,329)
Total deferred tax liabilities (5,836) (7,242) (88,870)
Net deferred tax assets 8,983 7,467 91,631 Net deferred tax liabilities ¥ (4,742) ¥ (4,575) $ (56,142)
(2) Principal reasons for the difference between the statutory tax rate and the rate of income taxes after application of deferred tax accounting
Fiscal year ended December 31, 2009This note is omitted because the Company recorded loss before income taxes and minority interests in fi scal 2009.
Fiscal year ended December 31, 20102010
Statutory tax rate 39.7%Effect of:
Net losses at consolidated subsidiaries 15.4 Foreign taxes and other taxes 11.2 Tax rate difference of overseas consolidated subsidiaries, etc. (13.5) Valuation allowance, revaluation loss on securities and impairment loss on fi xed assets (0.6) Other, net 1.8
Effective tax rates 53.9%

Oper
atin
g Pe
rform
ance
Mes
sage
from
the
Man
agem
ent
Spec
ial F
eatu
reOv
ervie
w o
f Ope
ratio
nsCS
RCo
rpor
ate
Info
rmat
ion
Fina
ncia
l Sec
tion
YAMAHA Motor Co., Ltd. | Annual Report 2010110
20. Segment Information
The Company and its consolidated subsidiaries are primarily engaged in the manufacture and sale of products in Japan and overseas. The operations of the Company and its consolidated subsidiaries have been classifi ed into four business segments: Motorcycles, Marine Products, Power Products, and Other Products. Major products in the Motorcycles segment include motorcycles and knockdown parts for overseas production; in the Marine Products segment: outboard motors, personal watercraft, pleasure-use boats, fi berglass-reinforced plastic pools, fi shing
boats, utility boats and diesel engines; in the Power Products seg-ment: all-terrain vehicles, side-by-side vehicles, snowmobiles, golf cars, generators, small-sized snow throwers and multipurpose engines; and in the Other Products segment: surface mounters, industrial robots, automobile engines, automobile components, electrically power assisted bicycles, unmanned industrial helicop-ters, electrically powered wheelchairs and the intermediate parts for products in all business segments.
(1) Business segment information
Business segment information for the Company and its subsidiaries for the years ended December 31, 2009 and 2010 is summarized as follows.
Fiscal year ended December 31, 2009Millions of yen
Motorcycles Marine products Power products Other products Total Eliminations ConsolidatedNet sales:
Outside customers ¥817,058 ¥150,113 ¥100,577 ¥ 85,893 ¥1,153,642 ¥ — ¥1,153,642Intersegment — — — 77,770 77,770 (77,770) —
Total 817,058 150,113 100,577 163,664 1,231,413 (77,770) 1,153,642Operating expenses 821,209 174,387 134,345 164,050 1,293,993 (77,770) 1,216,222Operating loss ¥ (4,151) ¥ (24,274) ¥ (33,768) ¥ (386) ¥ (62,580) ¥ 0 ¥ (62,580)Assets ¥607,311 ¥169,122 ¥115,082 ¥ 95,561 ¥ 987,077 ¥ — ¥ 987,077Depreciation 32,521 10,052 3,993 7,134 53,701 — 53,701Impairment loss 52,633 12,077 14,183 4,164 83,058 — 83,058Capital expenditures 29,932 6,660 3,660 5,780 46,035 — 46,035
Notes 1 Business segments correspond to categories classifi ed primarily by similarity of products and markets. 2 All operating expenses are assigned to individual segments, and there was no operating expense that could not be assigned. 3 Impairment losses on idle assets are included in the business to which the respective idle assets belong. 4 Depreciation and amortization of assets As described in “Depreciation and Amortization of Assets,” of “Accounting Standards,” the Company and its consolidated subsidiaries in Japan reviewed the
useful life of certain tangible fi xed assets, mainly machinery and equipment, taking advantage of the change in the Corporate Tax Law (Ministerial Ordinance to Partially Amend the Ministerial Ordinance with Regard to Useful Life of Depreciated Assets: April 30, 2008; Ordinance of the Ministry of Finance, No. 32).
Applying the new accounting method, operating expenses in fi scal 2009 increased ¥353 million in the motorcycle business, ¥560 million in the marine product business, ¥64 million in the power product business, and ¥221 million in the other products business, while operating loss in each business segment increased the same amount, compared with the fi gures derived using the previous method.
Fiscal year ended December 31, 2010Millions of yen
Motorcycles Marine products Power products Other products Total Eliminations ConsolidatedNet sales:
Outside customers ¥905,977 ¥167,141 ¥102,968 ¥118,043 ¥1,294,131 ¥ — ¥1,294,131Intersegment — — — 81,795 81,795 (81,795) —
Total 905,977 167,141 102,968 199,838 1,375,926 (81,795) 1,294,131Operating expenses 863,237 166,393 114,221 180,765 1,324,617 (81,795) 1,242,822Operating income (loss) ¥ 42,740 ¥ 748 ¥ (11,252) ¥ 19,073 ¥ 51,308 ¥ 0 ¥ 51,308Assets ¥609,948 ¥162,026 ¥103,934 ¥102,433 ¥ 978,343 ¥ — ¥ 978,343Depreciation 24,158 5,917 1,789 4,728 36,594 — 36,594Impairment loss 6,063 196 146 220 6,628 — 6,628Capital expenditures 23,784 3,635 2,460 4,058 33,939 — 33,939
Notes to Consolidated Financial StatementsYamaha Motor Co., Ltd. and Consolidated Subsidiaries
Years ended December 31, 2009 and 2010

Operating Performance
Message from
the Managem
entSpecial Feature
Overview of Operations
CSRCorporate Inform
ationFinancial Section
YAMAHA Motor Co., Ltd. | Annual Report 2010 111
Thousands of U.S. dollarsMotorcycles Marine products Power products Other products Total Eliminations Consolidated
Net sales:Outside customers $11,117,646 $2,051,061 $1,263,566 $1,448,558 $15,880,857 $ — $15,880,857 Intersegment — — — 1,003,743 1,003,743 (1,003,743) —
Total 11,117,646 2,051,061 1,263,566 2,452,301 16,884,599 (1,003,743) 15,880,857 Operating expenses 10,593,165 2,041,882 1,401,657 2,218,248 16,254,964 (1,003,743) 15,251,221 Operating income (loss) $ 524,482 $ 9,179 $ (138,078) $ 234,053 $ 629,623 $ 0 $ 629,623 Assets $ 7,484,943 $1,988,293 $1,275,420 $1,257,001 $12,005,682 $ — $12,005,682 Depreciation 296,454 72,610 21,954 58,019 449,061 — 449,061 Impairment loss 74,402 2,405 1,792 2,700 81,335 — 81,335 Capital expenditures 291,864 44,607 30,188 49,798 416,481 — 416,481
Notes 1 Business segments: Classifi ed in the same way as for the fi scal year ended December 31, 2009. 2 All operating expenses are assigned to individual segments, and there was no operating expense that could not be assigned. 3 Impairment losses on idle assets are included in the business to which the respective idle assets belong.
(2) Geographical segment information
The geographical segments of the Company and its subsidiaries for the years ended December 31, 2009 and 2010 are summarized as follows.
Fiscal year ended December 31, 2009Millions of yen
Japan North America Europe Asia Other areas Total Eliminations ConsolidatedNet sales:
Outside customers ¥188,276 ¥165,528 ¥197,641 ¥482,370 ¥119,825 ¥1,153,642 ¥ — ¥1,153,642Intersegment 261,973 17,654 3,503 37,098 937 321,167 (321,167) —
Total 450,250 183,183 201,144 519,469 120,762 1,474,810 (321,167) 1,153,642Operating expenses 505,833 225,451 210,293 485,912 122,802 1,550,292 (334,069) 1,216,222Operating income (loss) ¥ (55,582) ¥ (42,268) ¥ (9,148) ¥ 33,556 ¥ (2,039) ¥ (75,481) ¥ 12,901 ¥ (62,580)Assets ¥455,349 ¥192,638 ¥119,148 ¥273,632 ¥133,301 ¥1,174,069 ¥(186,991) ¥ 987,077
Notes 1 Geographic segments correspond to categories of geographical similarity, classifi ed primarily by nations and regions. 2 Nations and regions included in segments outside Japan: (1) North America: U.S.A. and Canada (2) Europe: The Netherlands, France, Italy, Spain and Russia (3) Asia: Indonesia, Taiwan, Thailand, Singapore, Vietnam, China and India (4) Other areas: Brazil, Australia, Colombia and Mexico 3 All operating expenses are assigned to individual segments, and there was no operating expense that could not be assigned. 4 Depreciation and amortization of assets As described in “Depreciation and Amortization of Assets,” of “Accounting Standards,” the Company and its consolidated subsidiaries in Japan reviewed the
useful life of certain tangible fi xed assets, mainly machinery and equipment, taking advantage of the change in the Corporate Tax Law (Ministerial Ordinance to Partially Amend the Ministerial Ordinance with Regard to Useful Life of Depreciated Assets: April 30, 2008; Ordinance of the Ministry of Finance, No. 32).
Applying the new accounting method, operating expenses in Japan in fi scal 2009 increased ¥1,199 million, while operating loss increased the same amount, compared with the fi gures derived using the previous method.
Fiscal year ended December 31, 2010Millions of yen
Japan North America Europe Asia Other areas Total Eliminations ConsolidatedNet sales:
Outside customers ¥216,353 ¥155,336 ¥165,602 ¥613,350 ¥143,488 ¥1,294,131 ¥ — ¥1,294,131Intersegment 310,881 16,043 3,088 44,843 1,108 375,966 (375,966) —
Total 527,235 171,379 168,691 658,194 144,597 1,670,098 (375,966) 1,294,131Operating expenses 529,754 186,102 166,722 602,945 134,337 1,619,862 (377,039) 1,242,822Operating income (loss) ¥ (2,519) ¥ (14,722) ¥ 1,968 ¥ 55,248 ¥ 10,259 ¥ 50,235 ¥ 1,073 ¥ 51,308Assets ¥560,568 ¥136,031 ¥105,725 ¥277,110 ¥131,918 ¥1,211,353 ¥(233,010) ¥ 978,343

Oper
atin
g Pe
rform
ance
Mes
sage
from
the
Man
agem
ent
Spec
ial F
eatu
reOv
ervie
w o
f Ope
ratio
nsCS
RCo
rpor
ate
Info
rmat
ion
Fina
ncia
l Sec
tion
YAMAHA Motor Co., Ltd. | Annual Report 2010112
Thousands of U.S. dollarsJapan North America Europe Asia Other areas Total Eliminations Consolidated
Net sales:Outside customers $2,654,964 $1,906,197 $2,032,176 $7,526,690 $1,760,805 $15,880,857 $ — $15,880,857 Intersegment 3,814,959 196,871 37,894 550,288 13,597 4,613,646 (4,613,646) —
Total 6,469,935 2,103,068 2,070,082 8,076,991 1,774,414 20,494,515 (4,613,646) 15,880,857 Operating expenses 6,500,847 2,283,740 2,045,920 7,399,006 1,648,509 19,878,046 (4,626,813) 15,251,221 Operating income (loss) $ (30,912) $ (180,660) $ 24,150 $ 677,973 $ 125,893 $ 616,456 $ 13,167 $ 629,623 Assets $6,878,979 $1,669,297 $1,297,398 $3,400,540 $1,618,824 $14,865,051 $(2,859,369) $12,005,682
Notes 1 Geographic segments correspond to categories of geographical similarity, classifi ed primarily by nations and regions. 2 Nations and regions included in segments outside Japan: (1) North America: U.S.A. and Canada (2) Europe: The Netherlands, France, Italy, Spain and Russia (3) Asia: Indonesia, Vietnam, Thailand, Taiwan, China, Singapore and India (4) Other areas: Brazil, Australia, Colombia and Mexico 3 All operating expenses are assigned to individual segments, and there was no operating expense that could not be assigned.
(3) Overseas sales
Overseas sales, which include export sales of the Company and its domestic consolidated subsidiaries, and sales (other than exports toJapan) of foreign consolidated subsidiaries, for the years ended December 31, 2009 and 2010 are summarized as follows.
Fiscal year ended December 31, 2009Millions of yen
North America Europe Asia Other areas TotalOverseas sales ¥166,330 ¥201,950 ¥500,442 ¥154,481 ¥1,023,205Consolidated sales 1,153,642Overseas sales to net sales 14.4% 17.5% 43.4% 13.4% 88.7%
Notes 1 Overseas segments correspond to categories of geographical similarity, classifi ed primarily by nations and regions. 2 Nations and regions included in segments outside Japan: (1) North America: U.S.A. and Canada (2) Europe: Italy, France, Spain, Russia and Germany (3) Asia: Indonesia, Vietnam, Thailand, China, Taiwan and India (4) Other areas: Brazil, Australia and South Africa 3 Overseas sales consist of export sales of Yamaha Motor and its domestic consolidated subsidiaries, and sales (other than exports to Japan) of its foreign
consolidated subsidiaries.
Fiscal year ended December 31, 2010Millions of yen
North America Europe Asia Other areas TotalOverseas sales ¥156,676 ¥170,371 ¥644,881 ¥179,824 ¥1,151,752Consolidated sales 1,294,131 Overseas sales to net sales 12.1% 13.2% 49.8% 13.9% 89.0%
Thousands of U.S. dollarsNorth America Europe Asia Other areas Total
Overseas sales $1,922,641 $2,090,698 $7,913,621 $2,206,700 $14,133,661Consolidated sales 15,880,857 Overseas sales to net sales 12.1% 13.2% 49.8% 13.9% 89.0%
Notes 1 Overseas segments correspond to categories of geographical similarity, classifi ed primarily by nations and regions. 2 Nations and regions included in segments outside Japan: (1) North America: U.S.A. and Canada (2) Europe: France, Italy, Germany, England and Russia (3) Asia: Indonesia, Vietnam, Thailand, China, Taiwan and India (4) Other areas: Brazil, Australia and South Africa 3 Overseas sales consist of export sales of Yamaha Motor and its domestic consolidated subsidiaries, and sales (other than exports to Japan) of its foreign
consolidated subsidiaries.
(4) Related party transactionsNo related items.
Notes to Consolidated Financial StatementsYamaha Motor Co., Ltd. and Consolidated Subsidiaries
Years ended December 31, 2009 and 2010

Operating Performance
Message from
the Managem
entSpecial Feature
Overview of Operations
CSRCorporate Inform
ationFinancial Section
YAMAHA Motor Co., Ltd. | Annual Report 2010 113
21. Per Share Information
Information regarding per share for the years ended December 31, 2009 and 2010 is as follows.
Yen U.S. dollars
2009 2010 2010Net assets per share Note 2 ¥ 743.04 ¥785.61 $9.64Net income (loss) per share—basic Note 3 (755.92) 55.50 0.68Net income per share—diluted Note 3 — Note 1 55.50 0.68
Note 1 The Company registered a basic net loss per share in the fi scal year ended December 31, 2009 (fi scal 2009). Therefore, diluted net income per share in fi scal 2009 is not described herein, although there were dilutive securities during the period.
Note 2 Net assets per share are calculated based on the following:
Millions of yenThousands ofU.S. dollars
2009 2010 2010Total net assets ¥249,266 ¥310,809 $3,814,075Amount excluded from total net assets 36,869 36,557 448,607
Share warrants 72 102 1,252Minority interests 36,796 36,454 447,343
Net assets attributable to common stock at the end of the period 212,397 274,252 3,365,468
Thousand shares
Number of common stocks outstanding at the end of the period, calculated under “Net assets per share” 285,849 349,097
Note 3 Basic net income (loss) per share and diluted net income per share are calculated based on the following:
Millions of yenThousands ofU.S. dollars
2009 2010 2010Net income (loss) per share—basic:
Net income (loss) ¥(216,148) ¥18,300 $224,567Amount not attributable to common stockholders — — —Net income (loss) attributable to common stock (216,148) 18,300 224,567
Thousand shares
Average number of shares outstanding during the period 285,942 329,735
Millions of yen
Net income per share—diluted:
Diluted net income per share in fi scal 2009 is not described herein, since the Company registered a net loss per share in fi scal 2009.
Adjustment for net income —
Shares
Increase in the number of common stocks 3,766 Share warrants 3,766
Dilutive securities not calculated under “Diluted net income per share” because they do not have dilutive effect:
Resolution of Board of Directors’ Meeting held on May 29, 2008: Stock options(Total number of shares: 75,500)
Resolution of Board of Directors’ Meeting held on May 28, 2010: Stock options(Total number of shares: 56,500)

Oper
atin
g Pe
rform
ance
Mes
sage
from
the
Man
agem
ent
Spec
ial F
eatu
reOv
ervie
w o
f Ope
ratio
nsCS
RCo
rpor
ate
Info
rmat
ion
Fina
ncia
l Sec
tion
YAMAHA Motor Co., Ltd. | Annual Report 2010114
22. Signifi cant Subsequent Events
Information regarding signifi cant subsequent events for the years ended December 31, 2009 and 2010 is as follows.
Fiscal year ended December 31, 2009No related items.
Fiscal year ended December 31, 2010
Reduction of the Amounts of Capital Reserve and Legal Reserve and Appropriation of SurplusA proposal to reduce the Company’s capital and legal reserves and appropriate surplus, as described below, was approved by shareholders at the 76th Ordinary General Meeting of Shareholders on March 24, 2011, and put into effect the same day.
1. Purpose Management’s goal was to promote fl exible implementation of capital policies and facilitate payment of future dividends to shareholders
by reducing capital and legal reserves and appropriating the surplus to cover the defi cit in retained earnings brought forward.
2. Method (1) The Company has reduced capital reserves and transferred these funds to other capital surplus, and decreased the total amount of
legal reserves and transferred these funds to retained earnings brought forward, in accordance with Paragraph 1 of Article 448 of the Corporation Law.
i) Items regarding decreasing reserves and their amounts Capital reserve ¥23,814,148,434 Legal reserve ¥ 3,775,736,564
ii) Items regarding increasing surplus and their amounts Other capital reserve ¥23,814,148,434 Retained earnings brought forward ¥ 3,775,736,564
iii) Items regarding decreased reserves and their amounts Capital reserve ¥73,941,967,288 Legal reserve ¥ 0
(2) Following the transfers of capital reserves outlined above, the Company appropriated other capital surplus to retained earnings brought forward to cover the defi cit, in accordance with the provisions of Article 452 of the Corporation Law.
i) Items regarding decreasing surplus and its amounts Other capital reserve ¥23,565,474,829
ii) Items regarding increasing surplus and its amounts Retained earnings brought forward ¥23,565,474,829
3. Effective date March 24, 2011
Notes to Consolidated Financial StatementsYamaha Motor Co., Ltd. and Consolidated Subsidiaries
Years ended December 31, 2009 and 2010