Notes - Le · PDF fileWell services Rigs Rotating equipment Subsea services ......
48
2015 Strategy & Outlook Focus on 4 key domains September 2015
Transcript of Notes - Le · PDF fileWell services Rigs Rotating equipment Subsea services ......

2015 Strategy & Outlook
Notes Focus on 4 key domains
September 2015

UPSTREAM Focus on cost discipline and
operational excellence
Arnaud BREUILLAC President, Exploration & Production

2015 Strategy & Outlook 3
Safety as a cornerstone of our strategy
Improving Upstream HSE performance
Reducing flaring** Mm3/d
Achieved target of 50% reduction on flaring Safety and operational efficiency go together
Reducing TRIR*
while increasing activity levels
* TRIR: Total Recordable Injury Rate ** Operated assets, excl. start-ups
0
1
2
0
100
200
300
2009 2014
200
1.3
1.9
Million
man-hours
TRIR
0
5
10
15
20
-50%
2005 2014
15
2015 Strategy & Outlook 4
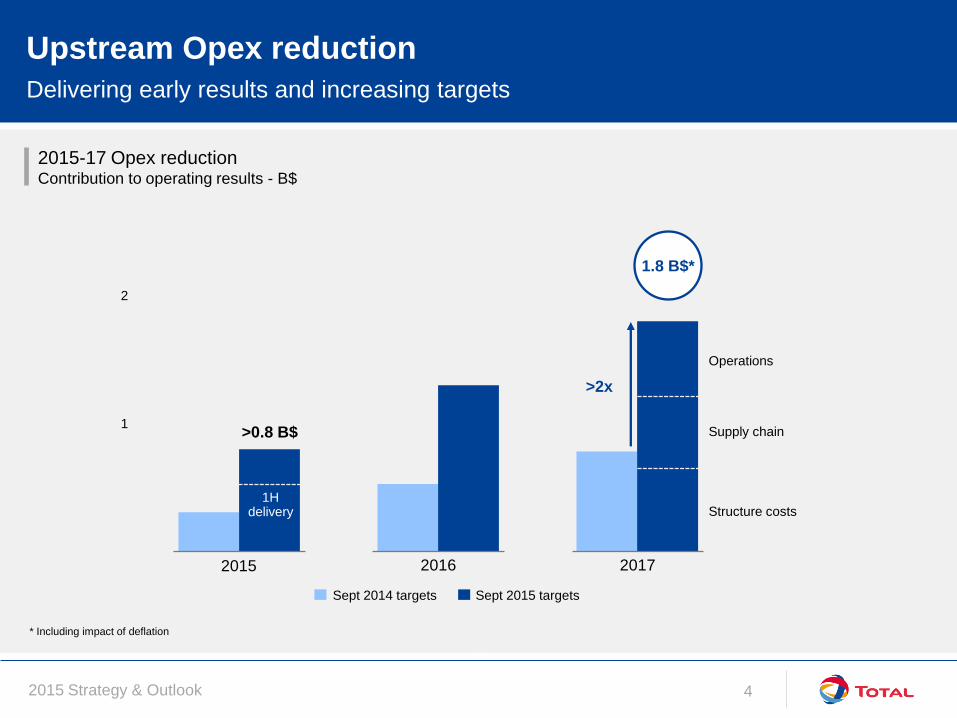
Upstream Opex reduction
Delivering early results and increasing targets
2015-17 Opex reduction Contribution to operating results - B$
Sept 2014 targets Sept 2015 targets
1.8 B$*
0
1
2
2015 2016 2017
1H delivery
Operations
Supply chain
Structure costs
>0.8 B$
>2x
* Including impact of deflation

2015 Strategy & Outlook 5
Systematic internal benchmarking
Measuring performance across all categories and assets
Identifying performance gaps
Encouraging best practice exchanges
between affiliates
Increasing cost awareness of all staff
Implementing performance-based
incentives
Maintenance benchmark Deep offshore - $/MCI*
Logistics benchmark
Helicopters - $/pax/h
Middle 50% Major assets
IT benchmark Workstations - $/unit
Top quartile Bottom quartile
* Maintenance complexity index based on number, type and complexity of equipment
Lower cost Higher cost
Lower cost Higher cost
Lower cost Higher cost

2015 Strategy & Outlook 6
Operations: revisiting operating models and logistics
Focusing on improving efficiency
Executing logistics action plan Nigeria - 100% operated savings - M$
Increasing passenger transport by sea
Reducing supply vessels
Improved utilization and fuel efficiency
Benefiting from synergies between FPSOs
Preparing onshore, implementing offshore
Developing multi-competence operators
New operating model Angola Block 17 - headcount
0
20
40
Fewer
vessels
Fuel
consumption
Synergies
2015 2017 0
500
-30%
2014 2017
Campaign teams
& smart rooms
Girassol
Dalia
Pazflor
CLOV

2015 Strategy & Outlook 7
Supply chain: reducing costs through contract renegotiations
Already achieving savings of up to 30%
Negotiated rate and fee reduction examples
Marine logistics
Seismic acquisition
Well services
Rigs
Rotating equipment
Subsea services
Tubulars
Operations & maintenance
Engineering
-40% -30% -20% -10% 0%
2015 Strategy & Outlook 8
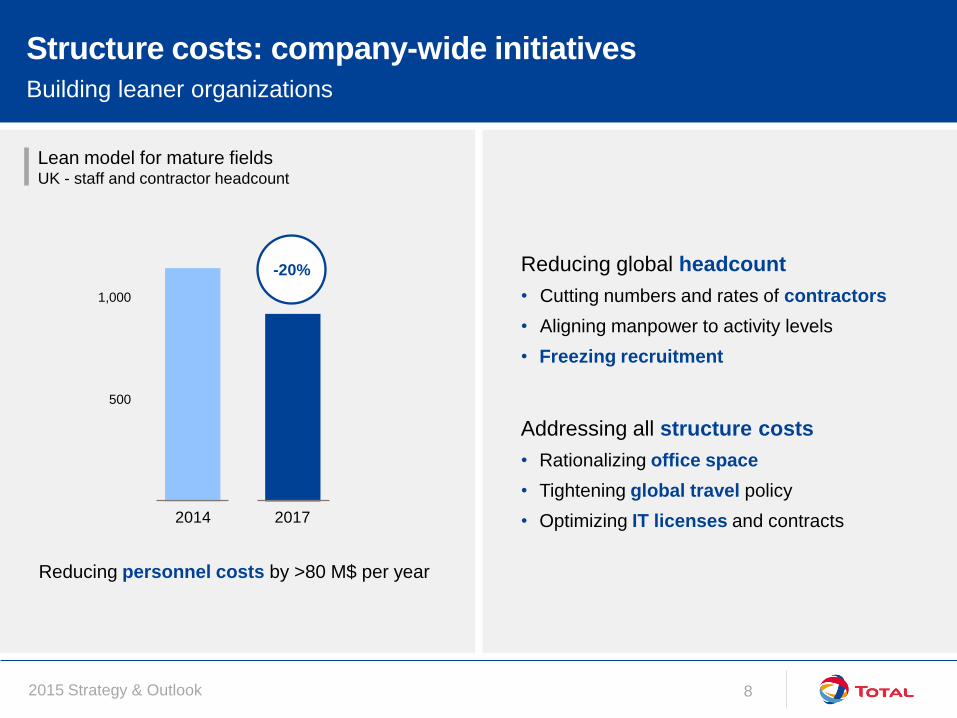
Reducing global headcount
• Cutting numbers and rates of contractors
• Aligning manpower to activity levels
• Freezing recruitment
Addressing all structure costs
• Rationalizing office space
• Tightening global travel policy
• Optimizing IT licenses and contracts
Lean model for mature fields UK - staff and contractor headcount
Reducing personnel costs by >80 M$ per year
-20%
0
500
1,000
2014 2017
Structure costs: company-wide initiatives
Building leaner organizations

2015 Strategy & Outlook 9
Tackling drilling costs
Optimizing rig fleet and drilling operations
Improving well execution Dalia, Angola - drilling time per well
Simplifying and standardizing well design Adapting rig count to activity levels
Terminating and renegotiating rig contracts
Managing rig count Operated rigs
0
10
20
30
40
50
60
Committed
Actions since
Jan 2015
0
20
40
60
80
100
120
100%
-35%
Lower NPT*
Rig sequence
Optimizing operations
2015 2017 2014 average
2015 2014
25
50
* NPT: non-productive time

2015 Strategy & Outlook 10
Production delivery: increasing operational efficiency
Launching dedicated program to improve performance
Remote monitoring of rotating equipment
Reducing unplanned production losses
Optimizing preventative maintenance
+75 kboe/d production in 2017
Production efficiency Operated assets - %
85%
90%
95%
2016 2014 2017
>3%
2015 Strategy & Outlook 11
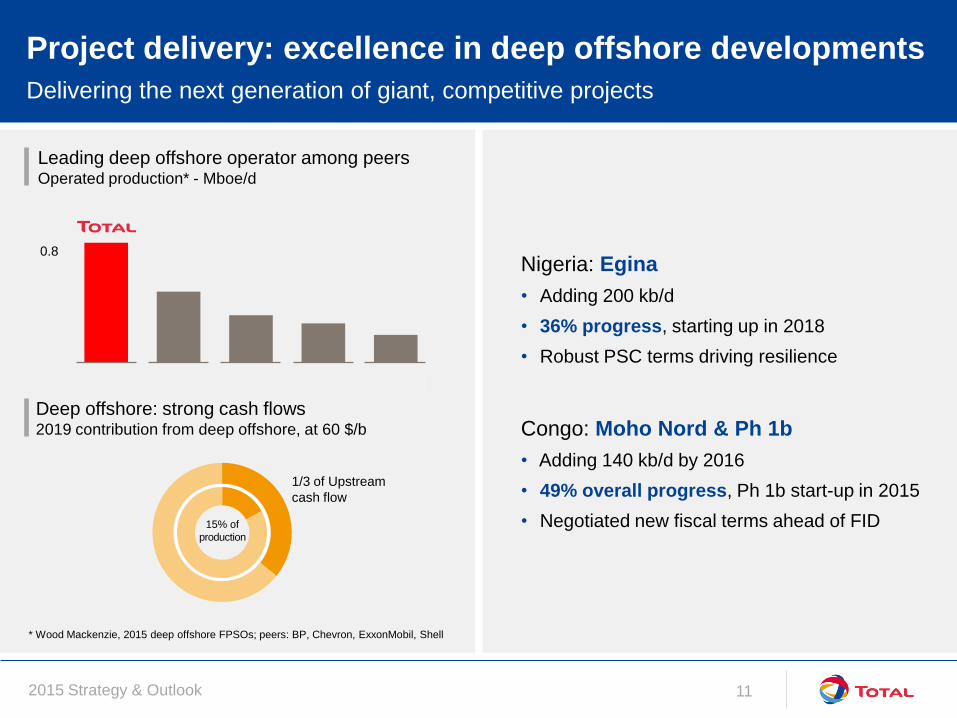
Project delivery: excellence in deep offshore developments
Delivering the next generation of giant, competitive projects
Nigeria: Egina
• Adding 200 kb/d
• 36% progress, starting up in 2018
• Robust PSC terms driving resilience
Congo: Moho Nord & Ph 1b
• Adding 140 kb/d by 2016
• 49% overall progress, Ph 1b start-up in 2015
• Negotiated new fiscal terms ahead of FID
Leading deep offshore operator among peers Operated production* - Mboe/d
Deep offshore: strong cash flows 2019 contribution from deep offshore, at 60 $/b
0.0
0.8
Total XoM BP CVX Shell
* Wood Mackenzie, 2015 deep offshore FPSOs; peers: BP, Chevron, ExxonMobil, Shell
1/3 of Upstream
cash flow
15% of
production

2015 Strategy & Outlook 12
Project delivery: lessons learned from Laggan experience
Focused on delivering start-up late-2015
Offshore executed on time
and on budget
• Wells ready for start-up
• Subsea systems and pipelines
ready since 2014
Lessons from specific onshore
challenges
• Better anticipation of site-specific issues
• Better control of contractors/supply chain
• Adapt standards for onshore environment
An innovative subsea to shore project Total 60%, operator
Shetland onshore gas plant Hot work complete, commissioning ongoing

2015 Strategy & Outlook 13
Building a more resilient and profitable Upstream
Global cost reduction program targeting sustainable change
Back to basics
• Investing with discipline
through “good enough” design
• Revising operating models
and increasing efficiency
Changing culture sustainably
• Imperative to reduce costs at all levels
• Systematic cost benchmarking
linked to compensation
• Focusing on value creation
Reducing Opex per barrel $/boe
7 $/b
0
10
2017 2015 2014
EXPLORATION Revised strategy and organization
Kevin MCLACHLAN SVP Exploration

2015 Strategy & Outlook 15
Strong acreage position with opportunities
Maximizing potential from a large and diversified portfolio
Acreage for Total and peers* Net thousands km2
* Peers: BP, Chevron, Conoco, ENI, ExxonMobil, Shell, Statoil. Source IHS, Feb 2015, excl. USA and Canada onshore
0
500
STATOIL XOM CVX COP ENI TOTAL BP RDS
Rifts and grabens
Carbonates
Deltas
Abrupt margins
Unconventional Foothills

2015 Strategy & Outlook 16
High-graded exploration potential
>3 Bboe from 150 top ranked prospects
Global ranking and selectivity based on
risk, resource and value creation
Priority on high-impact wells
Improved process for prospect
assessment
Maintaining ~3 Bboe* of high-graded
exploration potential
High-graded conventional exploration potential
by play thematics and regions*
* Risked mean net resources
Foothills
Deltas
Abrupt
margins
Pre-salt
carbonates
Rifts and
grabens
Africa
Americas
Asia Pacific
Europe
Middle East
North Africa
2015 Strategy & Outlook 17
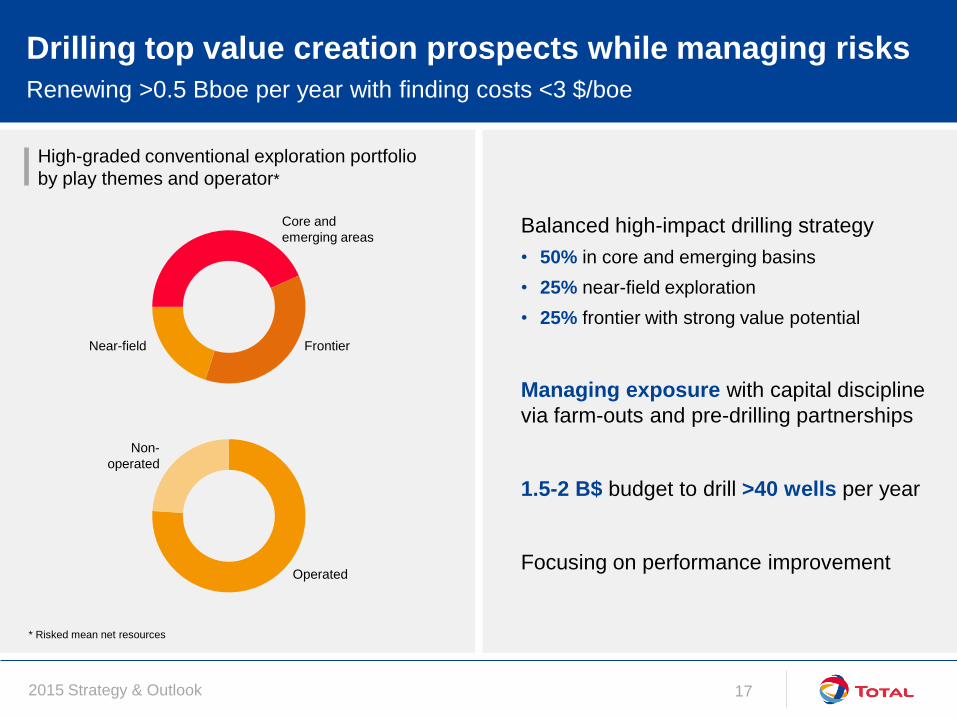
Drilling top value creation prospects while managing risks
Renewing >0.5 Bboe per year with finding costs <3 $/boe
Balanced high-impact drilling strategy
• 50% in core and emerging basins
• 25% near-field exploration
• 25% frontier with strong value potential
Managing exposure with capital discipline
via farm-outs and pre-drilling partnerships
1.5-2 B$ budget to drill >40 wells per year
Focusing on performance improvement
High-graded conventional exploration portfolio
by play themes and operator*
* Risked mean net resources
Core and
emerging areas
Near-field Frontier
Operated
Non-
operated
2015 Strategy & Outlook 18
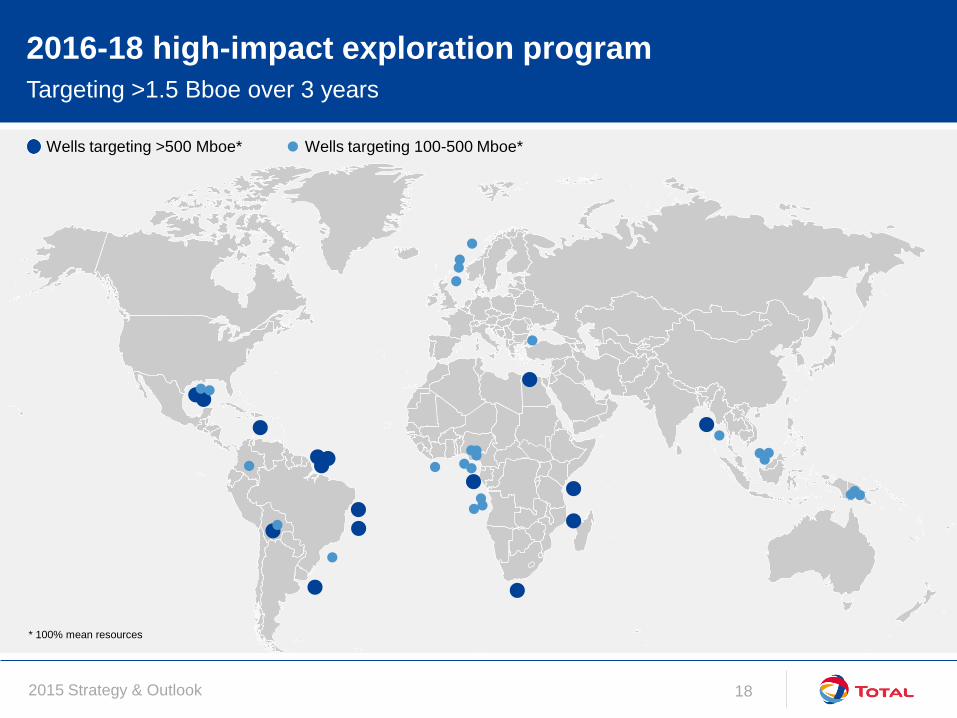
2016-18 high-impact exploration program
Targeting >1.5 Bboe over 3 years
* 100% mean resources
Wells targeting >500 Mboe* Wells targeting 100-500 Mboe*

2015 Strategy & Outlook 19
Focusing on core and emerging areas
US Gulf of Mexico, proving a new core area with North Platte discovery
North Platte lower tertiary discovery
• Total 40%
• >400 Mboe contingent and prospective
resources*
• North Platte 3 appraisal well ongoing
Goodfellow exploration
• Total 27.5%
• >400 Mboe prospective resources
• Exploration well in 2016
Other high value prospects to follow
236 blocks in Cobalt alliance Key prospects Discoveries
Fraser
Lewis Updip
Yeti
Rum
Ramsey
South
Platte
Williams Fork
North
Platte
Goodfellow
Baffin Bay
Houston
* Operator estimate

2015 Strategy & Outlook 20
Near-field exploration
Papua New Guinea, pursuing new prospects while appraising Elk-Antelope discovery
Total 40.1%, operator on PRL15
High potential play emerging in
onshore foothills environment
Proven play with significant potential
• Elk-Antelope discovery
• Antelope South well in 2016
• Further prospectivity under maturation for
future exploration drilling
2D PRL 15 composite seismic section
NNW SSE
Antelope Field Antelope South-1
Fields Prospects
PNG
Antelope
Elk
Antelope
South-1

2015 Strategy & Outlook 21
Frontier exploration with strong value creation potential
Uruguay Atlantic Margin, Block 14
Total 65%, operator
Successful farm-out completed
High-potential frontier prospects
de-risked with 3D and DHIs*
Raya, a giant ultra-deep offshore prospect
• Exploration well in 2016
• Success to de-risk several other targets
Raya-1
* DHI: direct hydrocarbon indication
Raya seismic section
Uruguay Raya-1
2km
SW NE
Flat Spot

2015 Strategy & Outlook 22
Transforming our exploration business with a new approach
New exploration teams organized around fully accountable regions
Focusing on value creation and
performance improvement
Emphasizing regions accountability
Strengthening regional knowledge
Revising processes for better quality
control and technical support
Rejuvenated exploration team
Opening regional hubs
Houston
Paris
Pau
Dubai Singapore
EXPLORATION
Americas Europe &
Central Asia Africa
Middle East &
North Africa Asia Pacific
Strategy, Planning
& Portfolio
Exploration
Excellence Geo-technology
Solutions

2015 Strategy & Outlook 23
Exploration key takeaways
New leadership team focused on
delivering top quartile performance
>3 Bboe high-graded exploration potential
Revised exploration drilling strategy
• 50% in core and emerging basins
• 25% near-field exploration
• 25% frontier with strong value potential
1.5-2 B$ budget, targeting
finding cost <$3/boe
Drilling >40 wells and >0.5 Bboe of
risked exploration potential per year

LNG Building on a profitable and integrated portfolio
Laurent VIVIER President, Gas
2015 Strategy & Outlook 25
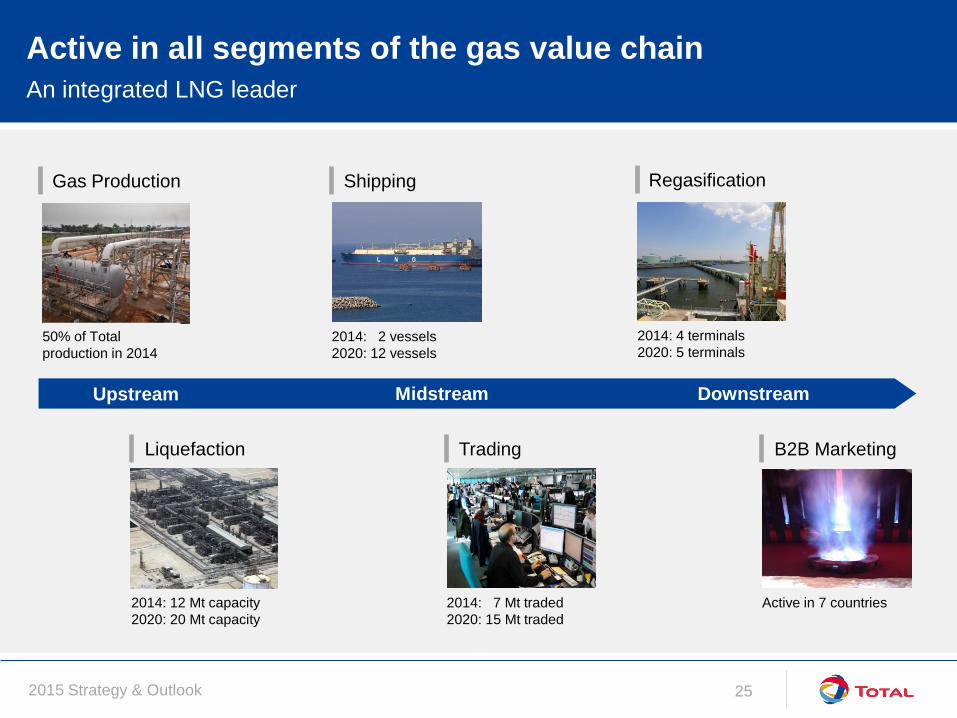
Active in all segments of the gas value chain
An integrated LNG leader
Liquefaction
2014: 12 Mt capacity
2020: 20 Mt capacity
Shipping
2014: 2 vessels
2020: 12 vessels
Trading
2014: 7 Mt traded
2020: 15 Mt traded
Regasification
2014: 4 terminals
2020: 5 terminals
B2B Marketing
Active in 7 countries
Midstream Upstream Downstream
Gas Production
50% of Total
production in 2014

2015 Strategy & Outlook 26
A global LNG player active in all markets
US exports
Altamira
South Hook
Fosmax
Dunkirk
Snøhvit Yamal
Angola
Nigeria
Yemen
Qatargas 1 & 2
Adgas
Qalhat
Oman
Ichthys GLNG
Bontang
Papua
project
Hazira
Liquefaction
Regasification
Long term purchase
Long term sale

2015 Strategy & Outlook 27
2014 2020
Profitable and growing business
Maximizing value from integration of upstream and trading
Total #3 in LNG* Mt/y
One of the Group’s growth drivers
Increasing LNG production capacity by 50%
More than doubling Trading portfolio
LNG contribution to Upstream in 2020
30% of net
operating income
20% of
production
Trading from Upstream
production
LNG plant direct sales
Trading from third party purchases
15
* Based on public data for BP, Chevron, Exxonmobil, Shell/BG (pro-forma)

2015 Strategy & Outlook 28
Starting up long plateau projects
Adding 8 Mt/y capacity
GLNG 7.2 Mt/y capacity
Total 27.5%
Train 1 gas-in Aug 2015
Upstream operational, LNG
plant being commissioned
Oil-indexed contracts to
Korea and Malaysia
Ichthys 8.9 Mt/y capacity + 100 kb/d liquids
Total 30%
Overall progress >75%
First LNG in 2017
Oil-indexed contracts to
Japan and Taiwan
Yamal 16.5 Mt/y capacity
Total 20%
Overall progress 30%
First LNG end-2017
Oil & gas-indexed contracts,
50% in Europe, 50% in Asia

2015 Strategy & Outlook 29
0
1
2
3
4
5
6
7
8
9
10
11
12
13
Maximizing value of Upstream production
Resilient contracts through the oil cycle
2014 Upstream LNG sales by area Mt/y
Low exposure to price reviews before 2020
S-curves and constants supporting prices
1/3 of Upstream contracts redirected in 2014
LNG contract price reviews
Contractual
destination
Realized
destination
Asia
Europe
North America
2015-19
After 2020
No price review
Rest of world 12

2015 Strategy & Outlook 30
Well positioned to seize new opportunities
Leveraging size and flexibility to capture margins
Trading arbitrage $/Mbtu
Enhancing supply optionalities
Well balanced long term and spot exposure
Global market with regional disparities
Arbitrage between three main areas
Trading portfolio evolution Mt/y
Flexible
destination
Long term
sales
Regas
capacity
Spot
2014
supply
2014
sales
2020
supply
2020
sales
15
Global arbitrage options
>2x
Fixed
destination
JKM 2014: 14
1H15: 8
NBP 2014: 8
1H15: 7 HH
2014: 4
1H15: 3

2015 Strategy & Outlook 31
Two competitive projects for production after 2020
Papua LNG Total 40.1%, operator
8.5 Mt/y capacity
Brownfield development taking advantage of
existing infrastructure
Positive resource appraisal ongoing
Greenfield development benefiting from
favorable location
Nigeria LNG Train 7 Total 15%

2015 Strategy & Outlook 32
Leveraging a core competency
Capturing the full value chain
Adding long plateau production
Global, well balanced and integrated
position
Growing trading portfolio with increasing
flexibility
Competitive new projects

Guy MAURICE SVP Africa,
Exploration & Production
Momar NGUER SVP Africa Middle-East,
Marketing & Services
AFRICA The leading integrated major

2015 Strategy & Outlook 34
Leading integrated major in Africa
Long history across the continent
Core region for Total
• 1/3 of Group cash flow from operations
• 1/3 of Group organic Capex
• 1/3 of Group production
Key resource base for Upstream
• Producing >650 kboe/d from six countries
• Exploration in a further 10 countries
Present in 44 countries
Downstream only
Upstream & Downstream
Upstream projects
Upstream only
2015 Strategy & Outlook 35
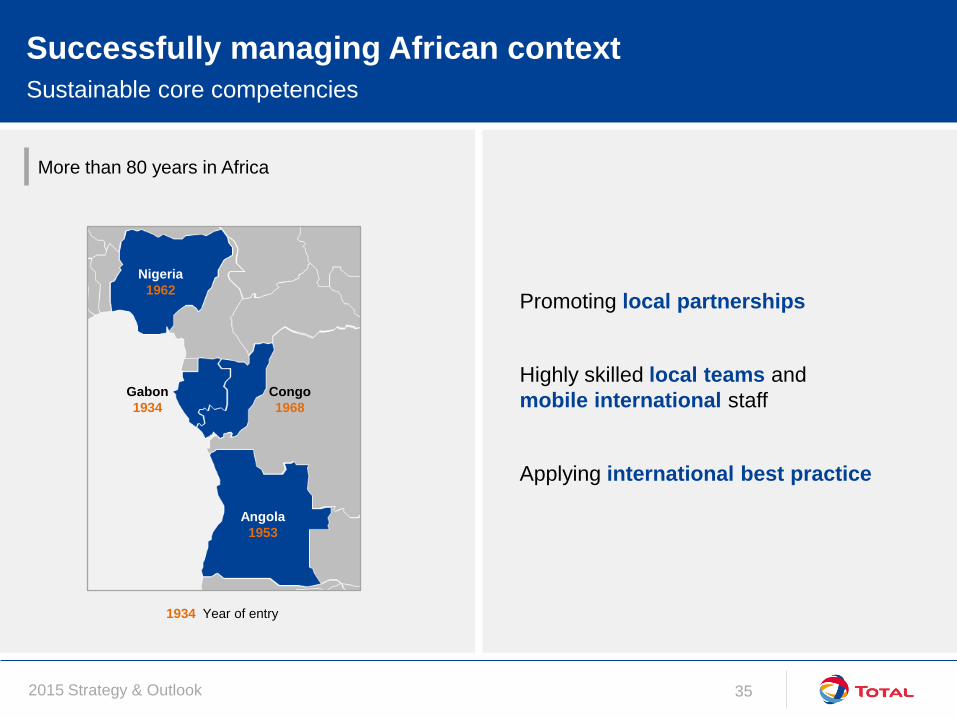
Successfully managing African context
Sustainable core competencies
Promoting local partnerships
Highly skilled local teams and
mobile international staff
Applying international best practice
More than 80 years in Africa
1934 Year of entry
Nigeria
1962
Angola
1953
Congo
1968
Gabon
1934

2015 Strategy & Outlook 36
Consistent operational delivery
Leveraging local expertise and operational excellence to create value
Implementing international
safety standards
Reducing flaring and monetizing gas
Reliably producing >1 Mboe/d since 2007
Improving HSE performance* in Africa
while growing operated production
* Operated assets, flaring excl. start-ups, TRIR: Total Recordable Injury Rate
0%
20%
40%
60%
80%
100%
120%
140%
160%
1H15 2010
100
2005
+38%
-56%
-53%
Base 100
in 2005
Production Flaring TRIR

2015 Strategy & Outlook 37
Deep offshore in Africa
Culture of continuous innovation
2001 2009 2006 2011 2007 2014 2008 2015 1997
ROSA Angola
CLOV Angola
AKPO Nigeria
PAZFLOR Angola
DALIA Angola
MOHO BILONDO Congo
MOHO Ph 1b Congo
BLOCK 17 Angola
GIRASSOL Angola
First giant deep offshore
FPSO, innovative
riser towers
20 km tie-back to
Girassol FPSO
Subsea multi-phase
pumps, variable speed
drive technology
First all-electric FPSO,
four-stage separation
First subsea
gas/liquid separation
and pumping modules
Flexible risers, integrated
production bundles and
pipe-in-pipe flow lines
Subsea seawater
treatment & injection
program
Deep offshore Girassol
discovery - a pioneer
explo well
Most powerful subsea
multi-phase pumps ever
installed

2015 Strategy & Outlook 38
Angola
Growing operated production to >700 kboe/d
Deep offshore Block 17 (Total 40%, operator) Cumulative production >2 Bb, 2 Bb reserves remaining
CLOV producing up to 180 kb/d and
generating 900 M$ cash in 2015 for Total
Kaombo (Total 30%, operator) progress
at 31%, adding 230 kb/d by 2018
Reducing costs prior to FID on Zinia 2
satellite and Acacia infill projects
3 high-impact exploration wells
Angola
ALNG
Kaombo
Girassol
Dalia
Pazflor
Zinia 2
Dalia 2A
CLOV Block 32
Block 17
Block 14
Block 0
Development Under study Producing
Acacia

2015 Strategy & Outlook 39
Nigeria
Adding to a strong and balanced portfolio
Diverse asset base Offshore, deep offshore, onshore and LNG
Ofon 2 flare-out and gas
monetization since 1Q15
Egina (Total 24%, operator) progress
at 36%, adding 200 kb/d by 2018
Evaluating developments on
Bonga SW, Ikike and NLNG T7
Continuing to explore
high-potential acreage
Bonga
Bonga SW
Usan
Ofon 2
Egina
Akpo
Ikike
NLNG
OML 58
NLNG T7
Nigeria
Amenam
Development Under study Producing

2015 Strategy & Outlook 40
Growth opportunities in Africa
New developments and exploration
Targeting new exploration provinces High-impact wells 2016-18
Frontier well in South Africa
High-potential deep offshore Kenya
Improved fiscal terms, progressing
development plan and pipeline route
Potential FID in 2017
Opening new frontier basin in Uganda >1 Bb resources
Uganda
EA-1A
EA-2
EA-2
Kingfisher
Total 33% Total 33%, operator
Lake
Albert
EA-1
Wells targeting >500 Mboe*
Wells targeting 100-500 Mboe*
* 100% mean resources

2015 Strategy & Outlook 41
0
100
200
300
400
500
600
700
800
E&P in Africa: continuing to deliver value
Securing the future through operational excellence and project delivery
Africa E&P cash flow from operations B$, at 60 $/b
Reducing costs in each affiliate
Growing production and cash flow
Producing safely and reliably
Delivering Moho Nord, Kaombo and Egina
Africa SEC production kboe/d
20%
2015 2017 2019 0
1
2
3
4
5
6
7
8
9 >40%
2015 2017 2019
800 8

2015 Strategy & Outlook 42
Unmatched M&S position in Africa
Leading Downstream operator leveraging critical mass
M&S presence in Africa Top 5 retailers in Africa 2014 number of service stations
M&S presence
Lubricant blendings
Equity refinery
Main fuels terminals
Leader with 17% market share in 43 countries
40% of M&S net operating income
and 35% of M&S investments in 2014
Competitive supply chain taking advantage of
extensive logistics network
4,000

2015 Strategy & Outlook 43
Recognized player bringing international standards
Building on a strong foundation by engaging local stakeholders
Leveraging local talent
• Targeting 60% nationals in management
• 29 university partnerships and
Young Graduates program in place
Increasing ties with local partners and
promoting local suppliers
Implementing highest standards
• Road safety
• Operational excellence in all facilities
African affiliates management
Enhancing local partnerships
280
managers Nationals
Other Africans
Non-Africans
Local minority shareholding
Presence through distributors
Main university partnerships
Fully owned affiliates

2015 Strategy & Outlook 44
Meeting increasing retail customer expectations in Africa
Delivering the brand promise
Offering premium quality retail
Modern stations with strong non-fuel services
High technology fuel and lubricants
Electronic payments and money transfers
African market growing at 2.5% per year
Increasing market share to 20%
M&S retail sales outpacing African market growth Base 100 in 2014
>4% per year
2014 2017 2019
market
2015 Strategy & Outlook 45
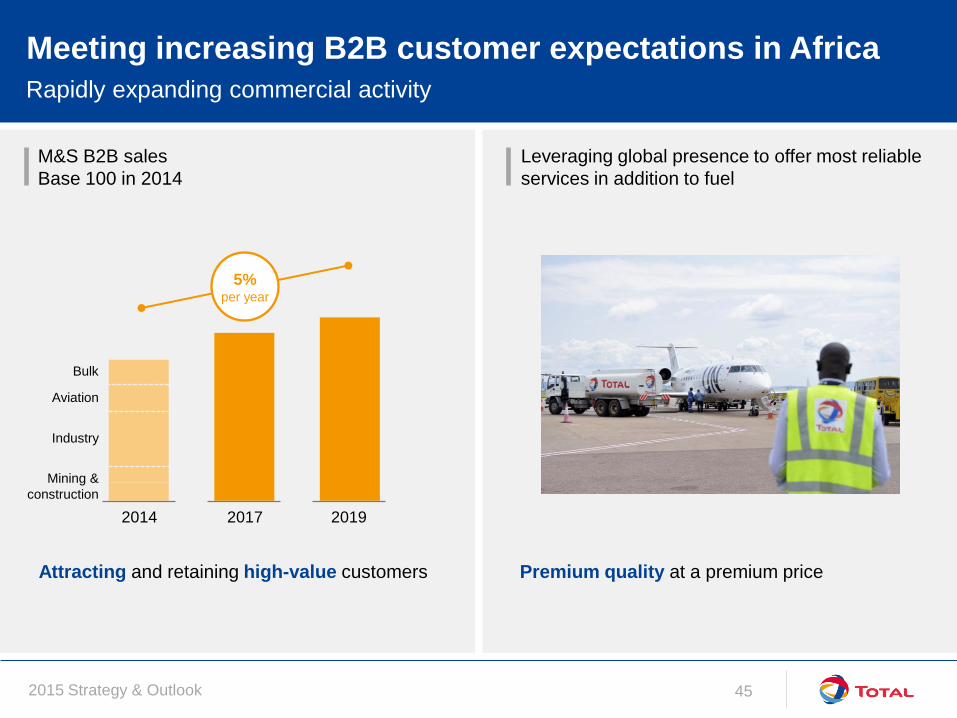
Meeting increasing B2B customer expectations in Africa
Rapidly expanding commercial activity
Leveraging global presence to offer most reliable
services in addition to fuel
Premium quality at a premium price Attracting and retaining high-value customers
M&S B2B sales
Base 100 in 2014
5% per year
2014 2017 2019
Mining &
construction
Aviation
Industry
Bulk

2015 Strategy & Outlook 46
Implementing an ambitious strategy
Generating higher returns from growing sales
Strong net operating income growth
Robust results, leveraging leadership
across all segments, in 43 countries
Maintaining 18% ROACE through
500 M$ per year investment phase
M&S net operating income in Africa B$
+30%
0.5
2014 2019 2017
2015 Strategy & Outlook 47
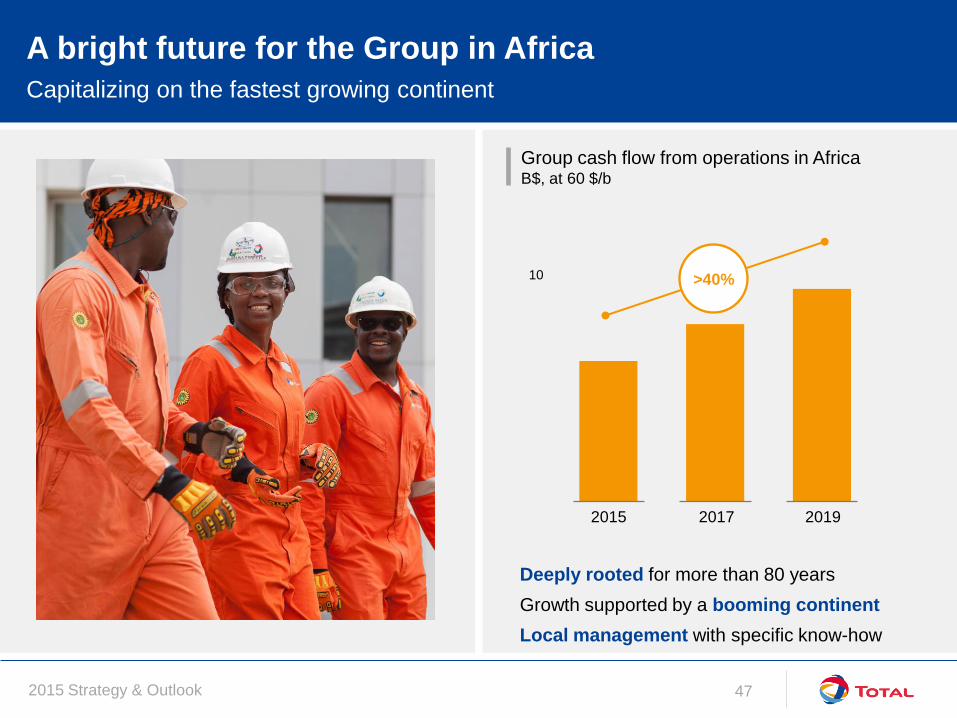
A bright future for the Group in Africa
Capitalizing on the fastest growing continent
Group cash flow from operations in Africa B$, at 60 $/b
Deeply rooted for more than 80 years
Growth supported by a booming continent
Local management with specific know-how
0
10
2017 2015 2019
>40%

2015 Strategy & Outlook 48
Disclaimer
This document may contain forward-looking information on the Group (including objectives
and trends), as well as forward-looking statements within the meaning of the Private
Securities Litigation Reform Act of 1995, notably with respect to the financial condition,
results of operations, business, strategy and plans of TOTAL. These data do not represent
forecasts within the meaning of European Regulation No. 809/2004.
Such forward-looking information and statements included in this document are based on a
number of economic data and assumptions made in a given economic, competitive and
regulatory environment. They may prove to be inaccurate in the future, and are subject to a
number of risk factors that could lead to a significant difference between actual results and
those anticipated, including currency fluctuations, the price of petroleum products, the ability
to realize cost reductions and operating efficiencies without unduly disrupting business
operations, environmental regulatory considerations and general economic and business
conditions. Certain financial information is based on estimates particularly in the assessment
of the recoverable value of assets and potential impairments of assets relating thereto.
Neither TOTAL nor any of its subsidiaries assumes any obligation to update publicly any
forward-looking information or statement, objectives or trends contained in this document
whether as a result of new information, future events or otherwise. Further information on
factors, risks and uncertainties that could affect the Company’s financial results or the
Group’s activities is provided in the most recent Registration Document filed by the
Company with the French Autorité des Marchés Financiers and annual report on Form 20-F
filed with the United States Securities and Exchange Commission (“SEC”).
Financial information by business segment is reported in accordance with the internal
reporting system and shows internal segment information that is used to manage and
measure the performance of TOTAL. Performance indicators excluding the adjustment
items, such as adjusted operating income, adjusted net operating income, and adjusted net
income are meant to facilitate the analysis of the financial performance and the comparison
of income between periods. These adjustment items include:
(i) Special items
Due to their unusual nature or particular significance, certain transactions qualified as
"special items" are excluded from the business segment figures. In general, special items
relate to transactions that are significant, infrequent or unusual. However, in certain
instances, transactions such as restructuring costs or asset disposals, which are not
considered to be representative of the normal course of business, may be qualified as
special items although they may have occurred within prior years or are likely to occur again
within the coming years.
(ii) Inventory valuation effect
The adjusted results of the Refining & Chemicals and Marketing & Services segments
are presented according to the replacement cost method. This method is used to assess
the segments’ performance and facilitate the comparability of the segments’ performance
with those of its competitors.
In the replacement cost method, which approximates the LIFO (Last-In, First-Out) method,
the variation of inventory values in the statement of income is, depending on the nature of
the inventory, determined using either the month-end price differentials between one period
and another or the average prices of the period rather than the historical value. The
inventory valuation effect is the difference between the results according to the FIFO (First-
In, First-Out) and the replacement cost.
(iii) Effect of changes in fair value
The effect of changes in fair value presented as an adjustment item reflects for some
transactions differences between internal measures of performance used by TOTAL’s
management and the accounting for these transactions under IFRS.
IFRS requires that trading inventories be recorded at their fair value using period-end spot
prices. In order to best reflect the management of economic exposure through derivative
transactions, internal indicators used to measure performance include valuations of trading
inventories based on forward prices.
Furthermore, TOTAL, in its trading activities, enters into storage contracts, which future
effects are recorded at fair value in Group’s internal economic performance. IFRS precludes
recognition of this fair value effect.
The adjusted results (adjusted operating income, adjusted net operating income, adjusted
net income) are defined as replacement cost results, adjusted for special items, excluding
the effect of changes in fair value.
Cautionary Note to U.S. Investors – The SEC permits oil and gas companies, in their filings
with the SEC, to separately disclose proved, probable and possible reserves that a company
has determined in accordance with SEC rules. We may use certain terms in this
presentation, such as resources, that the SEC’s guidelines strictly prohibit us from including
in filings with the SEC. U.S. investors are urged to consider closely the disclosure in our
Form 20-F, File N° 1-10888, available from us at 2, Place Jean Millier – Arche Nord
Coupole/Regnault - 92078 Paris-La Défense Cedex, France, or at our website: total.com.
You can also obtain this form from the SEC by calling 1-800-SEC-0330 or on the SEC’s
website: sec.gov.


![· @e] fid\ XelXc](https://static.fdocuments.in/doc/165x107/5c04b62e09d3f2183a8c24fe/-e-fid-xelxc-.jpg)