NOTCH4 HEY1 transition in head and neck squamous...
41
1 The NOTCH4-HEY1 pathway induces epithelial mesenchymal transition in head and neck squamous cell carcinoma Authors: Takahito Fukusumi 1 , Theresa W Guo 2 , Akihiro Sakai 1 , Mizuo Ando 1 , Shuling Ren 1 , Sunny Haft 1 , Chao Liu 1 , Panomwat Amornphimoltham 1 , J. Silvio Gutkind 1 , Joseph A Califano 1 1 Moores Cancer Center, University of California San Diego, 3855 Health Science Drive, MC 0803 La Jolla, California 92093, U.S.A. 2 Department of Otolaryngology-Head and Neck Surgery, Johns Hopkins Medical Institutions, 1550 Orleans Street, Baltimore, Maryland 21231, U.S.A. Running Title: NOTCH4-HEY1 induces EMT in HNSCC Key Words: Head and neck squamous cell carcinoma, TCGA, NOTCH4, HEY1, EMT Financial Support This study was supported by National Institute of Dental and Craniofacial Research (NIDCR, number: R01DE023347). J.A.Califano received this grant. Correspondence: Joseph A. Califano, MD, Department of Otolaryngology - Head and Neck Surgery, University of California San Diego, 3855 Health Science Drive, MC 0803 La Jolla, California 92093, U.S.A. Phone: 619-543-7895; E-mail; [email protected] Disclosure of Potential Conflict of Interest The authors declare no potential conflicts of interest. Research. on July 6, 2018. © 2017 American Association for Cancer clincancerres.aacrjournals.org Downloaded from Author manuscripts have been peer reviewed and accepted for publication but have not yet been edited. Author Manuscript Published OnlineFirst on November 16, 2017; DOI: 10.1158/1078-0432.CCR-17-1366
Transcript of NOTCH4 HEY1 transition in head and neck squamous...

1
The NOTCH4-HEY1 pathway induces epithelial mesenchymal transition in head
and neck squamous cell carcinoma
Authors: Takahito Fukusumi1, Theresa W Guo
2, Akihiro Sakai
1, Mizuo Ando
1, Shuling
Ren1, Sunny Haft
1, Chao Liu
1, Panomwat Amornphimoltham
1, J. Silvio Gutkind
1,
Joseph A Califano1
1 Moores Cancer Center, University of California San Diego, 3855 Health Science
Drive, MC 0803 La Jolla, California 92093, U.S.A.
2 Department of Otolaryngology-Head and Neck Surgery, Johns Hopkins Medical
Institutions, 1550 Orleans Street, Baltimore, Maryland 21231, U.S.A.
Running Title: NOTCH4-HEY1 induces EMT in HNSCC
Key Words: Head and neck squamous cell carcinoma, TCGA, NOTCH4, HEY1, EMT
Financial Support
This study was supported by National Institute of Dental and Craniofacial Research
(NIDCR, number: R01DE023347). J.A.Califano received this grant.
Correspondence: Joseph A. Califano, MD, Department of Otolaryngology - Head and
Neck Surgery, University of California San Diego, 3855 Health Science Drive, MC
0803 La Jolla, California 92093, U.S.A. Phone: 619-543-7895; E-mail;
Disclosure of Potential Conflict of Interest
The authors declare no potential conflicts of interest.
Research. on July 6, 2018. © 2017 American Association for Cancerclincancerres.aacrjournals.org Downloaded from
Author manuscripts have been peer reviewed and accepted for publication but have not yet been edited. Author Manuscript Published OnlineFirst on November 16, 2017; DOI: 10.1158/1078-0432.CCR-17-1366

2
ABSTRACT
Background: Recently, several comprehensive genomic analyses demonstrated
NOTCH1 and NOTCH3 mutations in head and neck squamous cell carcinoma
(HNSCC) in approximately 20% of cases. Similar to other types of cancers, these
studies also indicate that the NOTCH pathway is closely related to HNSCC progression.
However, the role of NOTCH4 in HNSCC is less well understood.
Methods: We analyzed NOTCH4 pathway and downstream gene expression in the
TCGA data set. To explore the functional role of NOTCH4, we performed in vitro
proliferation, cisplatin viability, apoptosis, and cell cycle assays. We also compared the
relationships among NOTCH4, HEY1 and epithelial mesenchymal transition (EMT)
related genes using the TCGA data set and in vitro assays.
Results: HEY1 is specifically up-regulated in HNSCC compared with normal tissues in
the TCGA data set. NOTCH4 is more significantly related to HEY1 activation in
HNSCC in comparison to other NOTCH receptors. NOTCH4 promotes cell proliferation,
cisplatin resistance, inhibition of apoptosis, and cell cycle dysregulation. Furthermore,
NOTCH4 and HEY1 up-regulation resulted in decreased E-cadherin expression and
increased Vimentin, Fibronectin, TWIST1, and SOX2 expression. NOTCH4 and HEY1
expression were associated with an EMT phenotypes as well as increased invasion and
cell migration.
Conclusion: In HNSCC the NOTCH4-HEY1 pathway is specifically up-regulated,
induces proliferation and cisplatin resistance, and promotes EMT.
Research. on July 6, 2018. © 2017 American Association for Cancerclincancerres.aacrjournals.org Downloaded from
Author manuscripts have been peer reviewed and accepted for publication but have not yet been edited. Author Manuscript Published OnlineFirst on November 16, 2017; DOI: 10.1158/1078-0432.CCR-17-1366

3
STATEMENT OF TRANSLATIONAL RELEVANCE
The identification of HNSCC specific genes and pathways may be essential for
targeted cancer therapy. Recently, several comprehensive genomic analyses reveal that
the NOTCH pathway is closely related to HNSCC progression. However, defining
which NOTCH pathway predominantly affects HNSCC development is not well
examined and understood. In this study, we examined the role of NOTCH4 using the
TCGA data set and in vitro experiments. Consequently, we demonstrate that the
NOTCH4-HEY1 pathway is specifically up-regulated in HNSCC compared with normal
tissue. We also demonstrate that NOTCH4 promotes HNSCC proliferation, cisplatin
resistance, a reduction in apoptosis and cell cycle alterations. Finally, we indicate that
the NOTCH4-HEY1 pathway promotes EMT by examining EMT-related genes such as
E-cadherin, Vimentin, Fibronectin, TWIST1 and SOX2. This finding has great potential
for expanding our knowledge regarding the NOTCH pathway in cancer biology and
may provide guidance in the development of novel specific HNSCC therapies.
Research. on July 6, 2018. © 2017 American Association for Cancerclincancerres.aacrjournals.org Downloaded from
Author manuscripts have been peer reviewed and accepted for publication but have not yet been edited. Author Manuscript Published OnlineFirst on November 16, 2017; DOI: 10.1158/1078-0432.CCR-17-1366

4
INTRODUCTION
Head and neck squamous cell carcinoma (HNSCC) is the sixth most common
malignancy in the world (1). Despite recent medical progress, HNSCC prognosis has
not dramatically improved (2). Thus, defining novel therapeutic target genes and
pathways provide an opportunity to elucidate the molecular alterations associated with
HNSCC mechanism and improve therapeutic design. Similar to other types of cancers,
HNSCC develops through several steps, including the accumulation of genetic and
epigenetic alterations, including TP53 (3), CDKN2A (4), EGFR (5), and others.
The Cancer Genome Atlas (TCGA) project aims to examine genetic alterations
for a better understanding of cancer pathology and, more importantly, identify signal
pathways that can be used as potential targets in cancer treatment (6). Recently, using
this data set, several types of cancers, such as lung (7), ovarian and colon cancer (8),
were examined by comprehensive pathway analysis. For HNSCC, the comprehensive
analysis of somatic genome alterations were also investigated using the TCGA data set
(9). In this study, a NOTCH mutation was identified in approximately 20% of patients.
In the other two articles, NOTCH1 is the second most frequently mutated gene after
TP53 based on whole exome sequencing data (10, 11).
However, the NOTCH pathway changes its functional role depending on
specific cancer site or histology. For example, an activated NOTCH pathway in cervical
cancer has a poor prognosis (12). In the skin, a tumor suppressor function of NOTCH
was reported in mouse keratinocyte tumor development (13). Interestingly, opposing
and exclusive roles for the NOTCH pathway are reported in HNSCC (14). NOTCH
pathway genes are up-regulated in HNSCC compared with normal or dysplasia tissues
(15, 16). Sun et al. showed NOTCH3 was overexpressed in HNSCC tumors compared
with normal mucosa and NOTCH1 wild type HNSCC had increased NOTCH
downstream genes HES1/HEY1 expression compared with normal mucosa, while
NOTCH1 mutated HNSCC do not show up-regulation (17). Inhibition of the NOTCH
pathway via a γ-secretase inhibitor decreases cell proliferation and invasion (18). On the
other hand, NOTCH mutations in HNSCC are considered as inactivating types,
indicating that NOTCH has a tumor suppressor function (17, 19). For example, Grandis
et al. showed that more NOTCH1 gene mutations were observed than mutations in the
other NOTCH receptor genes and many of NOTCH1 mutations were missense type (17,
19). To further explore the role of specific NOTCH receptors, we examined alterations
Research. on July 6, 2018. © 2017 American Association for Cancerclincancerres.aacrjournals.org Downloaded from
Author manuscripts have been peer reviewed and accepted for publication but have not yet been edited. Author Manuscript Published OnlineFirst on November 16, 2017; DOI: 10.1158/1078-0432.CCR-17-1366

5
in NOTCH pathway genes associated with HNSCC compared with normal tissue using
TCGA data sets, and found NOTCH4-HEY1 pathway is specifically up-regulated in
HNSCC. Furthermore, in this study we explore the functional role of the
NOTCH4-HEY1 pathway by using TCGA data set and in vitro experiments.
Research. on July 6, 2018. © 2017 American Association for Cancerclincancerres.aacrjournals.org Downloaded from
Author manuscripts have been peer reviewed and accepted for publication but have not yet been edited. Author Manuscript Published OnlineFirst on November 16, 2017; DOI: 10.1158/1078-0432.CCR-17-1366

6
MATERIALS AND METHODS
TCGA data set
The mRNA expression data of the HNSCC patients were obtained from the TCGA data
portal (http://tcga-data.nci.nih.gov/tcga/). We downloaded these data on 05/03/2016.
These TCGA data included 520 HNSCC and 46 normal tissues. We used 447 HNSCC
cases, excluding 73 tumors with NOTCH mutations (Supplementary Table S1). NOTCH
pathway genes included DTX1, JAG1, JAG2, DLL1, DLL3, DLL4, NOTCH1, NOTCH2,
NOTCH3, NOTCH4, POU5F1, SOX2, NANOG, CD44 and LMO2. The HES high group
was defined as tumors with expression 1 standard deviation greater than the mean of
normal tissue for HES1 or HES5. HEY and NOTCH4 high groups were also defined as
tumors with expression 1 standard deviation greater than the mean of normal tissue for
HEY1 and NOTCH4. Other samples were defined as a low expressing group. mRNA
expression was log2-transformed to calculate fold-change. The clinical background and
prognosis of these patients was obtained from the firebrowse web site
(http://firebrowse.org/).
Cell culture
We used SKN3, Cal27, SCC61 and SCC090 HNSCC cell lines. SKN3 was obtained
from the Japanese Collection of Research Bioresource (Ibaraki, Osaka, Japan). SCC61
was obtained from the Weichselbaum Laboratory at the University of Chicago. Cal27
and SCC090 cells were obtained from the Gutkind Laboratory at the University of
California San Diego, Moores Cancer Center. SCC090 was established from Human
Papilloma Virus (HPV)-positive HNSCC tissues. Other three cells are established from
HPV-negative HNSCC tissues. SKN3 was cultured in RPMI-1640 medium (Sigma
Aldrich, St. Louis, MO, U.S.A.). Cal27, SCC61 and SCC090 were cultured in
Dulbecco’s modified Eagle’s medium (DMEM; Sigma Aldrich). Both mediums were
supplemented with 10% fetal bovine serum (FBS) and a penicillin (50 U/ml) and
streptomycin (50 μg/ml) cocktail. All cells were cultured under an atmosphere of 5%
CO2 at 37°C.
Quantitative real-time PCR
Quantitative real-time polymerase chain reaction (qRT-PCR) was used to validate
siRNA-mediated knockdown of NOTCH4 and HEY1 and examine mRNA expression
Research. on July 6, 2018. © 2017 American Association for Cancerclincancerres.aacrjournals.org Downloaded from
Author manuscripts have been peer reviewed and accepted for publication but have not yet been edited. Author Manuscript Published OnlineFirst on November 16, 2017; DOI: 10.1158/1078-0432.CCR-17-1366

7
levels in each experiment. Briefly, total RNA was isolated from cells using the RNeasy
plus mini kit (Qiagen, Hilden, Germany), and complementary DNA was synthesized
using a high-capacity cDNA reverse transcription kit (Thermo Fisher Scientific,
Waltham, MA, U.S.A.). We obtained all primers from TaqMan Gene Expression Assays
(catalogue number: #4331182. Thermo Fisher Scientific). Each gene ID is described as
follows: β-actin (ACTB): Hs01060665_g1; NOTCH4: Hs00965895_g1; HES1:
Hs00172878_m1; HEY1: Hs01114113_m1; E-cadherin: Hs01023895_m1; Fibronectin:
Hs01549976_m1; Vimentin: Hs00958111_m1; TWIST1: Hs01675818_s1; ALDH1;
Hs00946916_m1 and SOX2: Hs01053049_s1. The housekeeping gene ACTB was used
as an internal control. qRT-PCR was performed using Quant Studio 6 Flex Real-Time
PCR System (Thermo Fisher Scientific).
Western blotting
The following primary antibodies were added to nitrocellulose membrane with 5%
non-fat dry milk in Tris-buffered saline and Tween 20: NOTCH4 (#2423, Cell Signaling
Technology, Danvers, MA, U.S.A.), HES1 (#sc-25392, Santa Cruz, Dallas, TX, U.S.A.),
HEY1 (#ab22614, Abcam, Cambridge, MA, U.S.A.), E-cadherin (#610181, BD
Bioscience, San Jose, CA, U.S.A.), Fibronectin (#ab2413, Abcam), Vimentin (#V6630,
Sigma Aldrich), TWIST1 (#sc-15393, Santa Cruz) and SOX2 (#2748, Cell Signaling
Technology). HRP conjugated goat anti-mouse (#1010-05, 1:20,000 dilution;
SouthernBiotech, Birmingham, AL, U.S.A.) or anti-rabbit antibodies (#4010-05,
1:20,000 dilution; SouthernBiotech) were used as secondary antibodies.
Si-RNA and sh-RNA
HNSCC cell lines were transfected with siRNA reagents using Lipofectamine RNAi
MAX (Thermo Fisher Scientific) according to the manufacturer's instructions. All
siRNA and si-control reagents used ON-TARGET plus siRNA reagents (GE Dharmacon,
Lafayette, CO, U.S.A.). Each catalogue number is described as follows: si-NOTCH4:
SMART pool ON-TARGET plus Human NOTCH4 siRNA (L-011883-00-0005);
si-HES1: SMART pool ON-TARGET plus Human HES1 siRNA (L-007770-02-0005);
si-HEY1: SMART pool ON-TARGET plus Human HEY1 siRNA (L-008709-00-0005);
and si-control: ON-TARGET plus Non-targeting Pool (D-001810-10-20). Medium was
changed 16 hours after siRNA transfection. mRNA inhibition was observed at a
Research. on July 6, 2018. © 2017 American Association for Cancerclincancerres.aacrjournals.org Downloaded from
Author manuscripts have been peer reviewed and accepted for publication but have not yet been edited. Author Manuscript Published OnlineFirst on November 16, 2017; DOI: 10.1158/1078-0432.CCR-17-1366

8
concentration of 30 nM siRNA at 48 hours after transfection. We also used sh-control
and sh-NOTCH4 (CSHCTR001-LVRU6MP and HSH011877-LVRU6MP, Genecopoeia,
Rockville, MD, U.S.A) to transfect Cal27 cells. The efficiency of down-regulation was
validated by calculating mRNA and protein levels (Supplementary Fig. S2A,B,
S3B,C,D,E,F). Thus, further analysis was performed under the same conditions.
Viability assay
Cells were seeded in 96-well plates at 1,500 to 9,000 cells/well. For proliferation assays,
cell numbers were measured every 24 hours. For cisplatin viability assay, cells were
cultured for 24 hours after seeding, and 0.1 to 81 μM cisplatin was added (EMD
Millipore, Billerica, MA, U.S.A.). The viability was measured 72 hours after cisplatin
exposure. All cell viabilities were measured using Vita Blue Cell Viability Reagent
(bimake.com, Houston, TX, U.S.A.). After a 1.5-hour preincubation in the assay
solution, the viable cell number in each well was calculated by the fluorescence (Ex =
530-570 nm, Em = 590-620 nm) as measured by a microplate reader (BioTek, Winooski,
VT, U.S.A.). The assays were performed three or more times.
Flow cytometry analysis
All flow cytometry analysis such as the NOTCH activity, apoptosis, cell cycle and
aldefluor assay were performed using BD FACSCalibur (BD Bioscience). NOTCH
activity was examined using a pGreenFire1-Notch plasmid (#TR020PA-1, System
Bioscience, Palo Alto, CA, U.S.A.). This lentiviral transfection was performed
according to the manufacturer’s protocol. The apoptotic cells were detected using
Annexin V-FITC apoptosis detection kit (#C986X37, Sigma Aldrich). Cell cycle phase
analysis was carried out using propidium iodide cell staining (#11348639001, Sigma
Aldrich) and FlowJo software (ver.10, FLOWJO, Ashland, OR, U.S.A.). To assess
ALDH1 activity, we used aldefluor kit (#01700, STEMCELL Technologies, Vancouver,
BC, Canada) at a concentration of 50 μlml-1
. Diethylaminobenzaldehyde (DEAB) was
used to inhibit ALDH1 activity.
Sphere formation assay
Cells were seeded in 6-well ultra-low attachment culture dishes (Corning, Tewksbury,
MA, U.S.A.) at 10,000 cells/well. Medium consisted of Repro Stem medium
Research. on July 6, 2018. © 2017 American Association for Cancerclincancerres.aacrjournals.org Downloaded from
Author manuscripts have been peer reviewed and accepted for publication but have not yet been edited. Author Manuscript Published OnlineFirst on November 16, 2017; DOI: 10.1158/1078-0432.CCR-17-1366

9
(ReproCELL, Yokohama, Japan) and basic fibroblast growth factor (bFGF: 5 ng/ml)
without FBS. After 7 days, photos were obtained (Supplementary Fig. S3A), and sphere
cells harvested to extract their mRNA. For qRT-PCR analysis, the adherent and sphere
cells mRNA amounts are equalized. NOTCH4 and HEY1 expression were normalized by
ACTB expression.
Migration and invasion assay
Migration assays were performed in cell culture insert (24-well 8μm pore size, #353097,
Corning). The concentrations of cells were set from 105 to 2×10
5 cells/ml. Invasion
assays were also performed in Corning BioCoat Matrigel invasion chambers (24-well
8μm pore size, #353097, Corning). The concentrations of cells were set from 2×10⁵ to
4×10⁵ cells/ml. Cells were seeded on uncoated or Matrigel-coated inserts in 500 ml of
serum-free medium for migration or invasion assays respectively. The lower chambers
were filled with 750 μl of 10% FBS-supplemented medium. After 48 h, the cells on
the lower surface of the insert were fixed and stained with crystal violet. The number of
stained cells was counted at more than three fields under a microscope.
Statistical analysis
All in vitro experiments were performed at least three times. The statistical comparisons
of two groups were performed using the Student’s t-test. The TCGA data set analysis of
NOTCH pathway genes in the HES and HEY high and low groups was adjusted by false
discovery rate using the Benjamini–Hochberg method. Clinical status was compared
between two groups using Pearson’s chi-square test. Overall survival was compared
using Log-Rank test. Differences were considered significant when P < 0.05. All
statistical analyses were performed using JMP 12 software (SAS, Cary, NC, U.S.A.).
Research. on July 6, 2018. © 2017 American Association for Cancerclincancerres.aacrjournals.org Downloaded from
Author manuscripts have been peer reviewed and accepted for publication but have not yet been edited. Author Manuscript Published OnlineFirst on November 16, 2017; DOI: 10.1158/1078-0432.CCR-17-1366

10
RESULTS
NOTCH4-HEY1 is upregulated in HNSCC
First, we examined which NOTCH pathway genes were significantly related NOTCH
pathway activation in HNSCC compared with normal tissue using TCGA data sets. We
excluded 73 NOTCH mutant samples (Supplementary Table S1). Thus, we examined
447 HNSCC and 46 normal tissues. The NOTCH downstream genes HES1/5 and HEY1
were selected as indicators of downstream NOTCH activity. Two groups were divided
according the mRNA expression of these genes compared with normal tissues. No
significant difference in NOTCH pathway genes was noted between the HES1/5 high
and low groups. On the other hand, HEY1 expression exhibited a significant correlation
with several NOTCH pathway genes (DLL4, NOTCH1, NOTCH2, NOTCH3, NOTCH4,
and SOX2). All NOTCH receptors were significantly related to HEY1 expression
(Supplementary Fig. S1A). Among these receptors, NOTCH4 exhibited the most
significant correlation to HEY1 overexpression. NOTCH4 expression in the HEY1 high
expressing group was increased approximately 1.58–fold compared with the HEY1 low
expressing group (Fig. 1A, Supplementary Fig. S1A). We also compared HES1, HES5
and HEY1 expression between HNSCC and normal tissues using the TCGA data set.
HES1 expression in HNSCC was significantly decreased compared with normal tissues
(P = 0.0002). HES5 expression was not significantly different between HNSCC and
normal tissues (P = 0.1251). On the other hand, HEY1 expression of HNSCC
significantly increased compared with normal tissues (P < 0.0001). HEY1 expression in
tumor samples was about two times more than that of normal samples (Fig. 1B). In
summary, HEY1 was up-regulated compared with normal tissues and was most related
to NOTCH4 among the NOTCH receptors in HNSCC. These results suggested that the
NOCH4-HEY1 pathway was specifically up-regulated in NOTCH wild type HNSCC
compared with normal tissue.
NOTCH4 inhibition inhibits HNSCC and sensitizes HNSCC to cisplatin
To elucidate the properties of the NOTCH4-HEY1 pathway in HNSCC cells, we
examined NOTCH4 function in HNSCC cells. First, we examined how NOTCH activity
was affected by si-NOTCH4 cells (Supplementary Fig. S2A, S2B) using
pGreenFire1-Notch plasmid. This reporter vector shows increased NOTCH activity
(GFP+) cells as a result of GFP expression under the binding of a NOTCH specific
Research. on July 6, 2018. © 2017 American Association for Cancerclincancerres.aacrjournals.org Downloaded from
Author manuscripts have been peer reviewed and accepted for publication but have not yet been edited. Author Manuscript Published OnlineFirst on November 16, 2017; DOI: 10.1158/1078-0432.CCR-17-1366
11
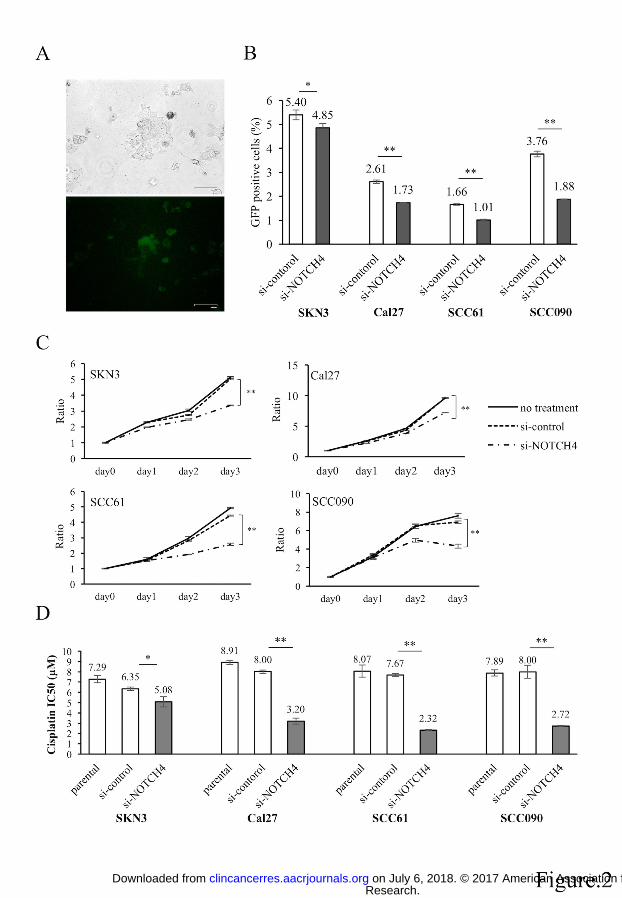
transcriptional response element (Fig. 2A). Using this vector, we showed si-NOTCH4
cells significantly decreased NOTCH activity in all cell lines (Fig. 2B, Supplementary
Fig. S2C). We also compared cell proliferation between si-control and si-NOTCH4 (Fig.
2C). Si-NOTCH4 cells significantly reduced their proliferation compared with si-control
cells in all cell lines. In SCC090 cells, si-NOTCH4 cell numbers decreased from day 2
to 3. Compared with si-control, si-NOTCH4 cell numbers were decreased by 20~40%
on day 3 (SKN3: 33.3%; Cal27: 24.9%; SCC61: 42.0%; SCC090: 37.5%). Next, we
assessed the chemo-resistance properties of si-NOTCH4 cells (Fig. 2D, Supplementary
Fig. S2D). We used cisplatin, commonly used for HNSCC chemotherapy. Similar to
proliferation assays, si-NOTCH4 cells significantly decreased their cisplatin resistance
compared with si-control cells in all cell lines. In comparing IC50, significant
differences were noted between the si-control and si-NOTCH4. In particular, Cal27,
SCC61 and SCC090 cells decreased IC50 by half to a third (Fig. 2D). These results
demonstrated that NOTCH4 inhibition affects NOTCH activity, cell proliferation, and
enhances chemo sensitivity in HNSCC cells.
NOTCH4 inhibits apoptosis and alters cell cycle
To elucidate what mechanism decreases si-NOTCH4 cell proliferation, we assumed it
related to apoptosis and cell cycle alteration. First, we performed apoptosis assays
(Supplementary Fig. S2E) and found that all the si-NOTCH4 cells statistically increased
the apoptotic cell fraction compared to si-control cells in a modest fashion (Fig. 2E).
Furthermore, we performed cell cycle analysis in si-NOTCH4 cells (Supplementary Fig.
S2F). The significant increase of G0/G1 phase and decrease of S phase was noted in
si-NOTCH4 cells. This result suggested that the si-NOTCH4 cells inhibited cell cycle
progression compared to si-control cells (Fig 2F). In these results, we can indicate that
NOTCH4 decreases cell proliferation by regulating both apoptosis and cell cycle.
NOTCH4 expression is correlated to EMT related gene expression
We explored other mechanisms related to NOTCH4 and HNSCC properties. NOTCH4
has been noted to induce epithelial mesenchymal transition (EMT) in melanoma (20).
EMT promotes cancer proliferation (21) and can be associated with chemo-resistance
(22). Thus, we hypothesized that NOTCH4 is also related to EMT in HNSCC and
examined the relationship between NOTCH4 and EMT-related genes. Using the TCGA
Research. on July 6, 2018. © 2017 American Association for Cancerclincancerres.aacrjournals.org Downloaded from
Author manuscripts have been peer reviewed and accepted for publication but have not yet been edited. Author Manuscript Published OnlineFirst on November 16, 2017; DOI: 10.1158/1078-0432.CCR-17-1366

12
data set, we compared EMT related genes expression between NOTCH4 high and low
groups. A significant decrease in the expression of E-cadherin, an epithelial marker, was
noted in the NOTCH4 high group compared with the low group (P = 0.001, ratio =
0.760). The expression of mesenchymal markers, such as N-cadherin, Vimentin, and
Fibronectin, was significantly increased in the high group compared with the low group
(P < 0.0001). The expression of mesenchymal markers of NOTCH4 high group was
several times higher than that of low group (N-cadherin: 2.854, Vimentin: 1.937,
Fibronectin: 3.266). TWIST1 is known as an EMT-inducing gene, and its expression
was significantly increased in the high group (P < 0.0001). The TWIST1 expression of
NOTCH4 high group was 1.749 times more than that of NOTCH4 low group (Fig. 3A).
SOX2 expression is also related to EMT genes (23). Its expression was also significantly
increased in the high group (P < 0.0046). The SOX2 expression of NOTCH4 high group
was 1.609 times more than that of NOTCH4 low group by using Student’s t-test (Fig.
3A). These results show an association between NOTCH4 and EMT in HNSCC and
raise the possibility that NOTCH4 activation may in part drive EMT in HNSCC.
NOTCH4 promotes HNSCC EMT
To confirm this TCGA data set analysis in vitro, we generated sphere colonies
(Supplementary Fig. S3A) that were employed to induce enrichment of EMT-related
gene expression (24). As noted, the NOTCH4 expression was significantly increased in
sphere cells derived from all HNSCC cell lines examined. NOTCH4 expression in
sphere cells was increased approximately 1.8- to 3.5–fold compared with parental cells
(Fig. 3B). Next, we also compared EMT-related genes between si-NOTCH4 and
si-control cells. si-NOTCH4 cells significantly increased E-cadherin expression in
SKN3, Cal27 and SCC61 cells. On the contrary, si-NOTCH4 significantly reduced
Vimentin (in Cal27, SCC61 and SCC090), Fibronectin (in the all cell lines) and TWIST1
(in Cal27, SCC61 and SCC090) expression. The SOX2 expressions of si-NOTCH4 cells
significantly decreased in Cal27, SCC61 and SCC090 cells. However, a portion of
si-NOTCH4 cells did not have significant changes in EMT-related genes. For example,
E-cadherin and TWIST1 expression did not exhibit significant differences between
si-NOTCH4 and si-control cells in SKN3 and SCC090, respectively. Fibronectin
expression in si-NOTCH4 cells was significantly increased compared with si-control
Cal27 cells. SOX2 expression in si-NOTCH4 cells was also significantly increased
Research. on July 6, 2018. © 2017 American Association for Cancerclincancerres.aacrjournals.org Downloaded from
Author manuscripts have been peer reviewed and accepted for publication but have not yet been edited. Author Manuscript Published OnlineFirst on November 16, 2017; DOI: 10.1158/1078-0432.CCR-17-1366
13
compared with si-control SKN3 cells (Fig. 4A). In western blot experiments, elevated
E-cadherin expression was also found in Cal27 si-NOTCH4 cells. But, there was no
obvious difference of E-cadherin expression between SKN3 si-control and si-NOTCH4
cells. Fibronectin, Vimentin, TWIST1 and SOX2 expression decreased in both SKN3 and
Cal27 si-NOTCH4 cells (Fig. 4B). Next, we examined the function of another HNSCC
specific NOTCH pathway gene, HEY1.
NOTCH4 specifically promotes HEY1 expression in HNSCC
Our TCGA data set analysis showed no significant difference in NOTCH pathway genes
between the HES high and low expressing tumors. On the other hand, HEY1 expression
exhibited a significant correlation with several NOTCH pathway genes (Fig. 1A, and
Supplementary Fig. S1A). To confirm these findings in vitro, HES1 and HEY1
expression were compared between si-control and si-NOTCH4 by using qRT-PCR. No
significant differences of HES1 expression were noted between si-control and
si-NOTCH4 in SKN3, SCC61, and SCC090. In Cal27, HES1 expression was
significantly increased in si-NOTCH4 (Fig. 5A). On the other hand, HEY1 expression
was significantly decreased in all cell lines with si-NOTCH4 (Fig. 5B). In western blot
experiments, we obtained similar results. There were no HES1 expression changes
between si-control and si-NOTCH4 cells, but si-NOTCH4 cells had less HEY1
expression than si-control cells (Fig. 5C). Thus, similar to the TCGA data set analysis,
our in vitro experiments also showed that NOTCH4 was significantly associated with
HEY1 expression.
HEY1 inhibition decreases NOTCH4 expression in HNSCC
HEY1 is generally activated by NOTCH receptors. However, si-HEY1 cells significantly
decreased NOTCH4 mRNA expression in all HNSCC cell lines (Fig. 5D and
Supplementary Fig. S3B, S3C). We also found less NOTCH4 expression in si-HEY1
cells of SKN3, Cal27 and SCC61 by western blot (Fig. 5E). These results may indicate
that HEY1 also reciprocally regulates NOTCH4 expression in HNSCC.
HEY1 is expression is associated with EMT genes in HNSCC
Next, we hypothesized that HEY1 was also related to EMT in HNSCC similar to
NOTCH4. Thus, using a TCGA data set similar to that used for NOTCH4 analysis,
Research. on July 6, 2018. © 2017 American Association for Cancerclincancerres.aacrjournals.org Downloaded from
Author manuscripts have been peer reviewed and accepted for publication but have not yet been edited. Author Manuscript Published OnlineFirst on November 16, 2017; DOI: 10.1158/1078-0432.CCR-17-1366
14
EMT-related genes were compared between HEY1 high and low groups (Fig. 6A). In
contrast to NOTCH4, E-cadherin expression was not significantly decreased in the
HEY1 high group (P = 0.10, ratio = 0.825). However, the expressions of N-cadherin (P
= 0.0038), Vimentin (P = 0.0068), Fibronectin (P = 0.0002), TWIST1 (P = 0.0025), and
SOX2 (P < 0.0001) were significantly increased in the HEY1 high group (Fig. 6A). The
expression of other EMT related genes of HEY1 high group were several times more
than that of low group (N-cadherin: 2.332, Vimentin: 1.249, Fibronectin: 1.720,
TWIST1: 1.228, SOX2: 3.724).
Similar to the previous NOTCH4 experiment, we compared HEY1 expression between
parental and sphere cells. HEY1 expression significantly increased in sphere cells of all
HNSCC cell lines. HEY1 expression in sphere cells was increased approximately 1.4- to
3.5–fold compared with parental cells (Fig. 6B). To summarize our sphere cells
experiments as shown Fig. 3B and 6B, sphere cells were enriched in both NOTCH4 and
HEY1 expression.
We also ascertained the relation of HEY1 and EMT genes in vitro. As shown in Fig. 7A,
si-HEY1 cells significantly increased E-cadherin expression in the all cell lines. On the
contrary, si-NOTCH4 significantly reduced Vimentin, Fibronectin and TWIST1
expression in the all cell lines. The SOX2 expressions of si-HEY1 cells significantly
decreased in SKN3, SCC61 and SCC090 cells. However, only si-HEY1 Cal27 cells did
not have significant changes of SOX2 expression (Fig. 7A). In western blot experiments,
we also noted that si-HEY1 cells had higher E-cadherin expression and less
mesenchymal marker gene (Vimentin, Fibronectin, TWIST1 and SOX2) expression than
si-control cells. Only Cal27 cells lacked an obvious difference of E-cadherin expression
(Fig. 7B). Furthermore, to assess whether these expression changes affect the cell
phenotype, we performed migration and invasion assays. We found significant decrease
of migrated and invaded cells in si-NOTCH4 and si-HEY1 cells compared to si-control
cells (Fig. 7C, 7D and 7E). In these results, we concluded that the NOTCH4-HEY1
pathway induces EMT in HNSCC.
Stable transfectants using sh-NOTCH4 were created in Cal27 cells, however, despite
RNA knockdown, protein levels of NOTCH4 were unchanged, indicating that NOTCH4
expression is obligate for survival in cell line systems (Supplementary Fig. S3D, S3E,
S3F).
Research. on July 6, 2018. © 2017 American Association for Cancerclincancerres.aacrjournals.org Downloaded from
Author manuscripts have been peer reviewed and accepted for publication but have not yet been edited. Author Manuscript Published OnlineFirst on November 16, 2017; DOI: 10.1158/1078-0432.CCR-17-1366

15
DISCUSSION
The NOTCH pathway is highly conserved through evolution and plays important
roles during embryonic development (25). The NOTCH pathway also affects normal
tissue cell proliferation and inhibits apoptosis (26). In mammals, the NOTCH pathway
has four receptors (NOTCH1, 2, 3 and 4) and five ligands (JAG1 and 2, DLL1, 3 and 4),
all of which are type 2 transmembrane proteins (27). This pathway is activated by a
ligand binding to a NOTCH receptor. Subsequently, the γ-secretase complex releases the
intracellular domain of the NOTCH receptor, which moves to the nucleus, resulting in
the transcriptional activation of NOTCH target genes, such as the HES/HEY family (27,
28).
The NOTCH pathway is also an attractive cancer therapeutic target. For instance,
inhibition of the NOTCH pathway by the γ-secretase inhibitor (GSI) decreases cell
proliferation and invasion (18). Thus, several clinical trials use GSI for cancer treatment
(29-32). However, GSI exhibits toxicity in normal stem cells and clinically results in
gastrointestinal toxicity, diarrhea, hepatotoxicity and nephrotoxicity (33-37). Wu et al.
considered that these adverse events resulted from GSI nonspecific effect for NOTCH
pathway. Thus, they showed that inhibition of NOTCH1 or NOTCH2 alone mildly
affected intestinal morphology and some goblet cell metaplasia, but that inhibition of
both NOTCH1 and 2 caused severe intestinal toxicity in their mouse model (36).
Furthermore, many studies assumed that GSIs used for clinical trails have biological
equivalent effect for each NOTCH receptors. But, Ran et al. examined the NOTCH
inhibition potential of several GSIs and showed these GSIs had different effect for each
NOTCH receptors. For instance, not all GSIs had sufficient pharmacological effect for
NOTCH4 (38). Harrison et al. also showed that two GSIs (DAPT and Dibenzazepine)
had no effect on NOTCH4 in breast cancer cells (39).
Our TCGA data set analysis showed that that only HEY1 is up-regulated among
the NOTCH downstream genes compared with normal tissues, in addition NOTCH4 is
the most significantly associated with HEY1 activation in HNSCC. Next, we used
pGreenFire1-Notch plasmid in order to examine to what extent NOTCH4 related to
NOTCH activity. Wicha et al. used this vector to assess the NOTCH activity and show
that NOTCH activity is related to tumorigenicity, cancer stem cells (CSCs), and poor
prognosis in lung adenocarcinoma and breast cancer (40, 41). NOTCH4 receptor was
expressed at 3-5 fold higher levels in the NOTCH high activity cells compared to
Research. on July 6, 2018. © 2017 American Association for Cancerclincancerres.aacrjournals.org Downloaded from
Author manuscripts have been peer reviewed and accepted for publication but have not yet been edited. Author Manuscript Published OnlineFirst on November 16, 2017; DOI: 10.1158/1078-0432.CCR-17-1366
16
NOTCH low activity breast cancer cell lines. (41). We also show that si-NOTCH4 cells
significantly decreased NOTCH activity in all cell lines. NOTCH4 is known to promote
mouse mammary epithelial transformation and tumorigenesis (42). This report is the
first study linking NOTCH4 and a cancer phenotype. Soriano et al. also demonstrated
that normal mammary cells exhibited altered shape and promoted an invasive and
tumorigenic phenotype by NOTCH4 (43). Thus, we next examined NOTCH4 function
in HNSCC and showed NOTCH4 affected HNSCC cell proliferation and cisplatin
resistance in vitro. There are several papers indicates that the NOTCH pathway affects
cell cycle and apoptosis. For instance, Demarest et al. indicates that the NOTCH
pathway promotes cell cycle progression and inhibits apoptosis by using T-ALL cells
(44). As a result of our apoptosis and cell cycle analysis, we can suggest that NOTCH4
decreases cell growth by regulating both apoptosis and the cell cycle.
Lombardo et al. showed that the EMT phenotype was induced by NOTCH4 in
breast cancer cells (45). NOTCH4 is also known as an EMT trigger and promotes the
metastasis of melanoma cells (20). EMT promotes cancer migration, invasion,
metastasis (46) and is also related to poor prognosis. Thus, EMT represents one of the
most important phenotypes in cancer therapy. In the melanoma study, NOTCH4 was
also related to SOX2 expression and cell invasion. Clinically, approximately 60% of
melanoma tissues express high levels of NOTCH4 protein. High NOTCH4 expression is
related to metastasis and poor prognosis (20). We also demonstrated that NOTCH4 was
related to EMT gene expression in HNSCC using the TCGA data set. By qRT-PCR and
western blot analysis, not all cell lines exhibited a significant change in EMT-related
genes upon NOTCH4 knockdown.
Using the TCGA data set, we demonstrated that HEY1 was significantly
up-regulated in tumors compared with normal tissue among the NOTCH downstream
genes. qRT-PCR and western blot analysis revealed the same result. In general, HEY1 is
related to the development of the heart, neurogenesis and osteogenesis (47-51). In
cardiovascular studies, HEY1 regulates endocardia EMT in septum and valve
development (52). In heart development, HEY1 cooperates with TWIST1 to promote
EMT (53). In cancer studies, HEY1 is an indicator of poor clinical prognosis in several
cancer types, such as pancreas (54), colon (55), esophagus (56), and thyroid (57). In a
thyroid cancer study, HEY1 expression was also related to recurrence and metastasis
(57). Lung metastasis of osteosarcoma cells was also promoted by HEY1 in a nude
Research. on July 6, 2018. © 2017 American Association for Cancerclincancerres.aacrjournals.org Downloaded from
Author manuscripts have been peer reviewed and accepted for publication but have not yet been edited. Author Manuscript Published OnlineFirst on November 16, 2017; DOI: 10.1158/1078-0432.CCR-17-1366

17
mouse model (58). However, few studies about EMT and HEY1 in cancers have been
performed. Our current study is the first HNSCC study that assesses the relationship
between HEY1 and EMT. In the TCGA data set analysis, TWIST1 and mesenchymal
genes such as N-cadherin, Vimentin and Fibronectin were significantly increased in the
HEY1 high group. But, E-cadherin expression was not significantly decreased in the
HEY1 high group (Fig. 6A). However, this finding may result from the method used to
divide the groups. For example, if the group was divided by the average of HNSCC
HEY1 expression, E-cadherin had significant differences similar to other EMT-related
genes (Supplementary Fig. S4A). Furthermore, our in vitro experiments showed that
E-cadherin, Vimentin, Fibronectin and TWIST1 expressions exhibit significant
differences between si-HEY1 and si-control cells in all cell lines. We also revealed that
the NOTCH4-HEY1 pathway was significantly correlated with SOX2 in the TCGA data
set and in vitro. SOX2 is a marker gene of tissue stem cells (59), CSCs (60) as well as
EMT (23) in the head and neck region. Furthermore, SOX2 is reported to co-expressed
with HEY1/HEY2 in the inner ear (61) and regulated by the NOTCH pathway in the
developing inner ear. During inner ear development, HEY1 expression is significantly
increased in the regulation of SOX2 (62). The NOTCH pathway is also necessary to
maintain SOX2-positive stem cells in the pituitary gland (63). In our TCGA results, the
HEY1 high group exhibited 3.72–fold increased SOX2 expression (Fig. 6A). In in vitro
experiments, inhibition of HEY1 resulted in significantly decreased SOX2 expression. In
these contexts, we suggest that HEY1 may regulate SOX2 as well as other EMT related
genes in HNSCC (Fig. 7A, 7B). EMT is known to enhance cell migration and invasion
(64). We also showed that both NOTCH4 and HEY1 promoted migration and invasion
properties (Fig. 7C, 7D and 7E). Thus, we concluded that the NOTCH4-HEY1 pathway
induces EMT in HNSCC.
NOTCH4 expression is also reported to increase in breast CSCs (65). EMT is
closely correlated with CSCSs (66). In HNSCC, CD10 (67), CD44 (68) and ALDH1
(69) are defined as CSCs markers. Thus, the expressions of these markers were
compared between NOTCH4 and HEY1 high/low groups using the TCGA data set.
Significant differences in ALDH1 and CD10 but not CD44 expression were noted
between NOTCH4 high and low groups (Supplementary Fig. S5A). The ALDH1
expression also significantly increased in the HEY1 high group compared with the
HEY1 low group. CD10 and CD44 expression did not exhibit a significant difference
Research. on July 6, 2018. © 2017 American Association for Cancerclincancerres.aacrjournals.org Downloaded from
Author manuscripts have been peer reviewed and accepted for publication but have not yet been edited. Author Manuscript Published OnlineFirst on November 16, 2017; DOI: 10.1158/1078-0432.CCR-17-1366

18
between HEY1 high and low groups (Supplementary Fig. S5B). Regarding ALDH1
expression, the NOTCH4 high group exhibited 1.63-fold increased expression and the
HEY1 high group exhibited 5.87-fold increased expression compared with each low
group. To elucidate the relationships between NOTCH4-HEY1 and ALDH1 in vitro,
ALDH1 expression was compared by using qRT-PCR, and significantly increased in
both si-NOTCH4 and si-HEY1 of all HNSCC cell lines except Cal27 si-NOTCH4 cells
(Supplementary Fig. S5C). We also performed aldefluor assays and found similar
results, with both si-NOTCH4 and si-HEY1 cells showing and increased ALDH1+
fraction (Supplementary Fig. S5D, S5E). Young et al. show ALDH1 regulates NOTCH1
expression in ovarian cancer cells (70). In our results, we also suggest that ALDH1 can
regulate NOTCH4-HEY1 pathway.
Wicha et al. showed high NOTCH4 and HEY1 expression in primary breast
cancer patient samples correlated with poor overall survival using a TCGA data set (41).
Simões et al. also showed NOTCH4 high breast cancer had high HEY1 expression and
worse clinical prognosis, such as overall survival and metastasis free survival (65). Thus,
we also compared the clinical background and prognosis between the NOTCH4/HEY1
high and low group using a TCGA data set (Supplementary Fig. S6A, S6B and
Supplementary Table S2). We noted is no significant difference between the
NOTCH4/HEY1 high and low group except the age of the HEY1 high/low group
(Supplementary Table S2), as well as no difference in overall survival between the
NOTCH4/HEY1 high and low group. (Supplementary Fig. S6A, S6B).
HEY1 is generally activated by NOTCH receptors. However, we demonstrate
that si-HEY1 cells significantly decreased NOTCH4 expression in all HNSCC cell lines
(Fig. 5D, 5E). Whether this effect is direct or indirect is not known; however, this result
may indicate that HEY1 also regulates NOTCH4 expression. In other words, the
NOTCH4-HEY1 pathway may create a positive feedback loop in HNSCC.
In this study, we used one HPV-positive HNSCC cell line, SCC090. The gene
expression and pathways of HPV-positive HNSCC differs from HPV-negative HNSCC
(71, 72). Regarding cancer therapy, HPV-positive HNSCC is more sensitive to radiation
and chemotherapy than HPV-negative cancer (73). However, in our experiments, there
were no differences in the results between SCC090 and the other HPV-negative HNSCC
cell lines. This finding indicates that the function of the NOTCH4-HEY1 pathway does
not change regardless of HPV status.
Research. on July 6, 2018. © 2017 American Association for Cancerclincancerres.aacrjournals.org Downloaded from
Author manuscripts have been peer reviewed and accepted for publication but have not yet been edited. Author Manuscript Published OnlineFirst on November 16, 2017; DOI: 10.1158/1078-0432.CCR-17-1366
19
In conclusion, we demonstrate that the NOTCH4-HEY1 pathway of HNSCC is
specifically up-regulated and promotes EMT. NOTCH4 is also related to proliferation,
chemoresistance, apoptosis inhibition, and cell cycle alteration in HNSCC. Thus, this
pathway may represent a novel target for HNSCC therapy or may serve as a target to
improve chemotherapeutic sensitivity.
Research. on July 6, 2018. © 2017 American Association for Cancerclincancerres.aacrjournals.org Downloaded from
Author manuscripts have been peer reviewed and accepted for publication but have not yet been edited. Author Manuscript Published OnlineFirst on November 16, 2017; DOI: 10.1158/1078-0432.CCR-17-1366

20
REFERENCES
1. Argiris A, Karamouzis MV, Raben D, Ferris RL. Head and neck cancer. The Lancet.
2008;371:1695-709.
2. Lo WL, Kao SY, Chi LY, Wong YK, Chang RC. Outcomes of oral squamous cell
carcinoma in Taiwan after surgical therapy: factors affecting survival. J Oral Maxillofac
Surg. 2003;61:751-8.
3. Poeta ML, Manola J, Goldenberg D, Forastiere A, Califano JA, Ridge JA, et al. The
Ligamp TP53 Assay for Detection of Minimal Residual Disease in Head and Neck
Squamous Cell Carcinoma Surgical Margins. Clin Cancer Res. 2009;15:7658-65.
4. Demokan S, Chuang A, Suoglu Y, Ulusan M, Yalniz Z, Califano JA, et al. Promoter
methylation and loss of p16(INK4a) gene expression in head and neck cancer. Head
Neck. 2012;34:1470-5.
5. Bonner JA, Harari PM, Giralt J, Cohen RB, Jones CU, Sur RK, et al. Radiotherapy
plus cetuximab for locoregionally advanced head and neck cancer: 5-year survival data
from a phase 3 randomised trial, and relation between cetuximab-induced rash and
survival. Lancet Oncol. 2010;11:21-8.
6. de Castro G, Jr., Negrao MV. The Cancer Genome Atlas findings in head and neck
cancer: a renewed hope. Curr Opin Oncol. 2014;26:245-6.
7. Comprehensive genomic characterization of squamous cell lung cancers. Nature.
2012;489:519-25.
8. Dellinger AE, Nixon AB, Pang H. Integrative Pathway Analysis Using Graph-Based
Learning with Applications to TCGA Colon and Ovarian Data. Cancer Inform.
2014;13:1-9.
9. Cancer Genome Atlas N. Comprehensive genomic characterization of head and neck
squamous cell carcinomas. Nature. 2015;517:576-82.
10. Agrawal N, Frederick MJ, Pickering CR, Bettegowda C, Chang K, Li RJ, et al.
Exome sequencing of head and neck squamous cell carcinoma reveals inactivating
mutations in NOTCH1. Science. 2011;333:1154-7.
11. Stransky N, Egloff AM, Tward AD, Kostic AD, Cibulskis K, Sivachenko A, et al.
The mutational landscape of head and neck squamous cell carcinoma. Science.
2011;333:1157-60.
12. Yousif NG, Sadiq AM, Yousif MG, Al-Mudhafar RH, Al-Baghdadi JJ, Hadi N.
Notch1 ligand signaling pathway activated in cervical cancer: poor prognosis with
Research. on July 6, 2018. © 2017 American Association for Cancerclincancerres.aacrjournals.org Downloaded from
Author manuscripts have been peer reviewed and accepted for publication but have not yet been edited. Author Manuscript Published OnlineFirst on November 16, 2017; DOI: 10.1158/1078-0432.CCR-17-1366

21
high-level JAG1/Notch1. Arch Gynecol Obstet. 2015;292:899-904.
13. Dotto GP. Notch tumor suppressor function. Oncogene. 2008;27:5115-23.
14. Yap LF, Lee D, Khairuddin A, Pairan MF, Puspita B, Siar CH, et al. The opposing
roles of NOTCH signalling in head and neck cancer: a mini review. Oral Dis.
2015;21:850-7.
15. Hijioka H, Setoguchi T, Miyawaki A, Gao H, Ishida T, Komiya S, et al.
Upregulation of Notch pathway molecules in oral squamous cell carcinoma. Int J Oncol.
2010;36:817-22.
16. Lee SH, Hong HS, Liu ZX, Kim RH, Kang MK, Park NH, et al. TNFalpha
enhances cancer stem cell-like phenotype via Notch-Hes1 activation in oral squamous
cell carcinoma cells. Biochem Biophys Res Commun. 2012;424:58-64.
17. Sun W, Gaykalova DA, Ochs MF, Mambo E, Arnaoutakis D, Liu Y, et al. Activation
of the NOTCH pathway in head and neck cancer. Cancer Res. 2014;74:1091-104.
18. Yao J, Duan L, Fan M, Wu X. Gamma-secretase inhibitors exerts antitumor activity
via down-regulation of Notch and Nuclear factor kappa B in human tongue carcinoma
cells. Oral Dis. 2007;13:555-63.
19. Egloff AM, Grandis JR. Molecular pathways: context-dependent approaches to
Notch targeting as cancer therapy. Clin Cancer Res. 2012;18:5188-95.
20. Lin X, Sun B, Zhu D, Zhao X, Sun R, Zhang Y, et al. Notch4+ cancer stem-like
cells promote the metastatic and invasive ability of melanoma. Cancer Sci.
2016;107:1079-91.
21. Thiery JP. Epithelial-mesenchymal transitions in tumour progression. Nat Rev
Cancer. 2002;2:442-54.
22. Saxena M, Stephens MA, Pathak H, Rangarajan A. Transcription factors that
mediate epithelial-mesenchymal transition lead to multidrug resistance by upregulating
ABC transporters. Cell Death Dis. 2011;2:e179.
23. Yang N, Hui L, Wang Y, Yang H, Jiang X. Overexpression of SOX2 promotes
migration, invasion, and epithelial-mesenchymal transition through the
Wnt/beta-catenin pathway in laryngeal cancer Hep-2 cells. Tumour Biol.
2014;35:7965-73.
24. Han XY, Wei B, Fang JF, Zhang S, Zhang FC, Zhang HB, et al.
Epithelial-mesenchymal transition associates with maintenance of stemness in
spheroid-derived stem-like colon cancer cells. PLoS One. 2013;8:e73341.
Research. on July 6, 2018. © 2017 American Association for Cancerclincancerres.aacrjournals.org Downloaded from
Author manuscripts have been peer reviewed and accepted for publication but have not yet been edited. Author Manuscript Published OnlineFirst on November 16, 2017; DOI: 10.1158/1078-0432.CCR-17-1366

22
25. Bray SJ. Notch signalling: a simple pathway becomes complex. Nat Rev Mol Cell
Biol. 2006;7:678-89.
26. Artavanis-Tsakonas S, Rand MD, Lake RJ. Notch signaling: cell fate control and
signal integration in development. Science. 1999;284:770-6.
27. Gordon WR, Arnett KL, Blacklow SC. The molecular logic of Notch signaling--a
structural and biochemical perspective. J Cell Sci. 2008;121:3109-19.
28. Aster JC, Pear WS, Blacklow SC. Notch signaling in leukemia. Annu Rev Pathol.
2008;3:587-613.
29. Strosberg JR, Yeatman T, Weber J, Coppola D, Schell MJ, Han G, et al. A phase II
study of RO4929097 in metastatic colorectal cancer. Eur J Cancer. 2012;48:997-1003.
30. De Jesus-Acosta A, Laheru D, Maitra A, Arcaroli J, Rudek MA, Dasari A, et al. A
phase II study of the gamma secretase inhibitor RO4929097 in patients with previously
treated metastatic pancreatic adenocarcinoma. Invest New Drugs. 2014;32:739-45.
31. Lee SM, Moon J, Redman BG, Chidiac T, Flaherty LE, Zha Y, et al. Phase 2 study
of RO4929097, a gamma-secretase inhibitor, in metastatic melanoma: SWOG 0933.
Cancer. 2015;121:432-40.
32. Chen X, Gong L, Ou R, Zheng Z, Chen J, Xie F, et al. Sequential combination
therapy of ovarian cancer with cisplatin and gamma-secretase inhibitor MK-0752.
Gynecol Oncol. 2016;140:537-44.
33. Searfoss GH, Jordan WH, Calligaro DO, Galbreath EJ, Schirtzinger LM, Berridge
BR, et al. Adipsin, a biomarker of gastrointestinal toxicity mediated by a functional
gamma-secretase inhibitor. J Biol Chem. 2003;278:46107-16.
34. van Es JH, van Gijn ME, Riccio O, van den Born M, Vooijs M, Begthel H, et al.
Notch/gamma-secretase inhibition turns proliferative cells in intestinal crypts and
adenomas into goblet cells. Nature. 2005;435:959-63.
35. Garber K. Notch emerges as new cancer drug target. J Natl Cancer Inst.
2007;99:1284-5.
36. Wu Y, Cain-Hom C, Choy L, Hagenbeek TJ, de Leon GP, Chen Y, et al. Therapeutic
antibody targeting of individual Notch receptors. Nature. 2010;464:1052-7.
37. Purow B. Notch inhibition as a promising new approach to cancer therapy. Adv Exp
Med Biol. 2012;727:305-19.
38. Ran Y, Hossain F, Pannuti A, Lessard CB, Ladd GZ, Jung JI, et al. gamma-Secretase
inhibitors in cancer clinical trials are pharmacologically and functionally distinct.
Research. on July 6, 2018. © 2017 American Association for Cancerclincancerres.aacrjournals.org Downloaded from
Author manuscripts have been peer reviewed and accepted for publication but have not yet been edited. Author Manuscript Published OnlineFirst on November 16, 2017; DOI: 10.1158/1078-0432.CCR-17-1366
23
EMBO Mol Med. 2017;9:950-66.
39. Harrison H, Farnie G, Howell SJ, Rock RE, Stylianou S, Brennan KR, et al.
Regulation of breast cancer stem cell activity by signaling through the Notch4 receptor.
Cancer Res. 2010;70:709-18.
40. Hassan KA, Wang L, Korkaya H, Chen G, Maillard I, Beer DG, et al. Notch
pathway activity identifies cells with cancer stem cell-like properties and correlates with
worse survival in lung adenocarcinoma. Clin Cancer Res. 2013;19:1972-80.
41. D'Angelo RC, Ouzounova M, Davis A, Choi D, Tchuenkam SM, Kim G, et al.
Notch reporter activity in breast cancer cell lines identifies a subset of cells with stem
cell activity. Mol Cancer Ther. 2015;14:779-87.
42. Gallahan D, Callahan R. The mouse mammary tumor associated gene INT3 is a
unique member of the NOTCH gene family (NOTCH4). Oncogene. 1997;14:1883-90.
43. Soriano JV, Uyttendaele H, Kitajewski J, Montesano R. Expression of an activated
Notch4(int-3) oncoprotein disrupts morphogenesis and induces an invasive phenotype
in mammary epithelial cells in vitro. Int J Cancer. 2000;86:652-9.
44. Demarest RM, Ratti F, Capobianco AJ. It's T-ALL about Notch. Oncogene.
2008;27:5082-91.
45. Lombardo Y, Faronato M, Filipovic A, Vircillo V, Magnani L, Coombes RC.
Nicastrin and Notch4 drive endocrine therapy resistance and epithelial to mesenchymal
transition in MCF7 breast cancer cells. Breast Cancer Res. 2014;16:R62.
46. Kang Y, Massague J. Epithelial-mesenchymal transitions: twist in development and
metastasis. Cell. 2004;118:277-9.
47. Sakamoto M, Hirata H, Ohtsuka T, Bessho Y, Kageyama R. The basic
helix-loop-helix genes Hesr1/Hey1 and Hesr2/Hey2 regulate maintenance of neural
precursor cells in the brain. J Biol Chem. 2003;278:44808-15.
48. Kokubo H, Miyagawa-Tomita S, Nakazawa M, Saga Y, Johnson RL. Mouse hesr1
and hesr2 genes are redundantly required to mediate Notch signaling in the developing
cardiovascular system. Dev Biol. 2005;278:301-9.
49. Kokubo H, Tomita-Miyagawa S, Hamada Y, Saga Y. Hesr1 and Hesr2 regulate
atrioventricular boundary formation in the developing heart through the repression of
Tbx2. Development. 2007;134:747-55.
50. Sharff KA, Song WX, Luo X, Tang N, Luo J, Chen J, et al. Hey1 basic
helix-loop-helix protein plays an important role in mediating BMP9-induced osteogenic
Research. on July 6, 2018. © 2017 American Association for Cancerclincancerres.aacrjournals.org Downloaded from
Author manuscripts have been peer reviewed and accepted for publication but have not yet been edited. Author Manuscript Published OnlineFirst on November 16, 2017; DOI: 10.1158/1078-0432.CCR-17-1366

24
differentiation of mesenchymal progenitor cells. J Biol Chem. 2009;284:649-59.
51. Salie R, Kneissel M, Vukevic M, Zamurovic N, Kramer I, Evans G, et al.
Ubiquitous overexpression of Hey1 transcription factor leads to osteopenia and
chondrocyte hypertrophy in bone. Bone. 2010;46:680-94.
52. Fischer A, Steidl C, Wagner TU, Lang E, Jakob PM, Friedl P, et al. Combined loss
of Hey1 and HeyL causes congenital heart defects because of impaired epithelial to
mesenchymal transition. Circ Res. 2007;100:856-63.
53. Luna-Zurita L, Prados B, Grego-Bessa J, Luxan G, del Monte G, Benguria A, et al.
Integration of a Notch-dependent mesenchymal gene program and Bmp2-driven cell
invasiveness regulates murine cardiac valve formation. J Clin Invest.
2010;120:3493-507.
54. Mann CD, Bastianpillai C, Neal CP, Masood MM, Jones DJ, Teichert F, et al.
Notch3 and HEY-1 as prognostic biomarkers in pancreatic adenocarcinoma. PLoS One.
2012;7:e51119.
55. Candy PA, Phillips MR, Redfern AD, Colley SM, Davidson JA, Stuart LM, et al.
Notch-induced transcription factors are predictive of survival and 5-fluorouracil
response in colorectal cancer patients. Br J Cancer. 2013;109:1023-30.
56. Forghanifard MM, Taleb S, Abbaszadegan MR. Notch Signaling Target Genes are
Directly Correlated to Esophageal Squamous Cell Carcinoma Tumorigenesis. Pathol
Oncol Res. 2015;21:463-7.
57. Jung CW, Kong JS, Seol H, Park S, Koh JS, Lee SS, et al. Expression of activated
Notch1 and HEY1 in papillary thyroid carcinoma. Histopathology. 2016.
58. Tsuru A, Setoguchi T, Matsunoshita Y, Nagao-Kitamoto H, Nagano S, Yokouchi M,
et al. Hairy/enhancer-of-split related with YRPW motif protein 1 promotes
osteosarcoma metastasis via matrix metallopeptidase 9 expression. Br J Cancer.
2015;112:1232-40.
59. Hume CR, Bratt DL, Oesterle EC. Expression of LHX3 and SOX2 during mouse
inner ear development. Gene Expr Patterns. 2007;7:798-807.
60. Lim YC, Oh SY, Cha YY, Kim SH, Jin X, Kim H. Cancer stem cell traits in
squamospheres derived from primary head and neck squamous cell carcinomas. Oral
Oncol. 2011;47:83-91.
61. Benito-Gonzalez A, Doetzlhofer A. Hey1 and Hey2 control the spatial and temporal
pattern of mammalian auditory hair cell differentiation downstream of Hedgehog
Research. on July 6, 2018. © 2017 American Association for Cancerclincancerres.aacrjournals.org Downloaded from
Author manuscripts have been peer reviewed and accepted for publication but have not yet been edited. Author Manuscript Published OnlineFirst on November 16, 2017; DOI: 10.1158/1078-0432.CCR-17-1366

25
signaling. J Neurosci. 2014;34:12865-76.
62. Neves J, Parada C, Chamizo M, Giraldez F. Jagged 1 regulates the restriction of
Sox2 expression in the developing chicken inner ear: a mechanism for sensory organ
specification. Development. 2011;138:735-44.
63. Zhu X, Tollkuhn J, Taylor H, Rosenfeld MG. Notch-Dependent Pituitary SOX2(+)
Stem Cells Exhibit a Timed Functional Extinction in Regulation of the Postnatal Gland.
Stem Cell Reports. 2015;5:1196-209.
64. Smith A, Teknos TN, Pan Q. Epithelial to mesenchymal transition in head and neck
squamous cell carcinoma. Oral Oncol. 2013;49:287-92.
65. Simões Bruno M, O’Brien Ciara S, Eyre R, Silva A, Yu L, Sarmiento-Castro A, et al.
Anti-estrogen Resistance in Human Breast Tumors Is Driven by
JAG1-NOTCH4-Dependent Cancer Stem Cell Activity. Cell Reports. 2015;12:1968-77.
66. Singh A, Settleman J. EMT, cancer stem cells and drug resistance: an emerging axis
of evil in the war on cancer. Oncogene. 2010;29:4741-51.
67. Fukusumi T, Ishii H, Konno M, Yasui T, Nakahara S, Takenaka Y, et al. CD10 as a
novel marker of therapeutic resistance and cancer stem cells in head and neck squamous
cell carcinoma. Br J Cancer. 2014;111:506-14.
68. Prince ME, Sivanandan R, Kaczorowski A, Wolf GT, Kaplan MJ, Dalerba P, et al.
Identification of a subpopulation of cells with cancer stem cell properties in head and
neck squamous cell carcinoma. Proc Natl Acad Sci U S A. 2007;104:973-8.
69. Chen YC, Chen YW, Hsu HS, Tseng LM, Huang PI, Lu KH, et al. Aldehyde
dehydrogenase 1 is a putative marker for cancer stem cells in head and neck squamous
cancer. Biochem Biophys Res Commun. 2009;385:307-13.
70. Young MJ, Wu YH, Chiu WT, Weng TY, Huang YF, Chou CY. All-trans retinoic
acid downregulates ALDH1-mediated stemness and inhibits tumour formation in
ovarian cancer cells. Carcinogenesis. 2015;36:498-507.
71. Mirghani H, Ugolin N, Ory C, Goislard M, Lefevre M, Baulande S, et al.
Comparative analysis of micro-RNAs in human papillomavirus-positive versus
-negative oropharyngeal cancers. Head Neck. 2016;38:1634-42.
72. Suarez E, Gonzalez L, Perez-Mitchell C, Ortiz AP, Ramirez-Sola M, Acosta J, et al.
Pathway Analysis using Gene-expression Profiles of HPV-positive and HPV-negative
Oropharyngeal Cancer Patients in a Hispanic Population: Methodological Procedures. P
R Health Sci J. 2016;35:3-8.
Research. on July 6, 2018. © 2017 American Association for Cancerclincancerres.aacrjournals.org Downloaded from
Author manuscripts have been peer reviewed and accepted for publication but have not yet been edited. Author Manuscript Published OnlineFirst on November 16, 2017; DOI: 10.1158/1078-0432.CCR-17-1366

26
73. Fakhry C, Westra WH, Li S, Cmelak A, Ridge JA, Pinto H, et al. Improved survival
of patients with human papillomavirus-positive head and neck squamous cell carcinoma
in a prospective clinical trial. J Natl Cancer Inst. 2008;100:261-9.
Research. on July 6, 2018. © 2017 American Association for Cancerclincancerres.aacrjournals.org Downloaded from
Author manuscripts have been peer reviewed and accepted for publication but have not yet been edited. Author Manuscript Published OnlineFirst on November 16, 2017; DOI: 10.1158/1078-0432.CCR-17-1366
27
FIGURE LEGENDS
Figure 1. TCGA data set analysis of HES/HEY and NOTCH4 relation
(A) NOTCH4 expression is compared between the HES (HES1+HES5) and HEY1
high/low group using the TCGA data set. Ratio is calculated by dividing the mRNA
expression of the HES or HEY1 high group by that of the low group. (B) HES1, HES5
and HEY1 expression are compared between HNSCC and normal tissue using the
TCGA data set. Ratio is calculated by dividing the mRNA expression of the tumor
samples by that of the normal samples. Whiskers indicate the minimum and maximum
values. P value is calculated by using Student’s t-test.
Figure 2. NOTCH activity, proliferation, cisplatin viability, apoptosis assay and cell
cycle analysis of si-NOTCH4 cells
(A) pGreenFire1-Notch plasmid vector was transfected to SKN3 cell. Scale bar
indicates 100 μm. (B) NOTCH activity assay of si-control and si-NOTCH4 cells. GFP
positive cells have high NOTCH activity. (C) Proliferation assays. si-NOTCH4 cells are
compared cell growths to si-control cells on day 3. (D) IC50 of cisplatin in parental,
si-control and si-NOTCH4 cells. The IC50 differences between si-control and
si-NOTCH4 cells are compared. (E) Apoptosis assays. Total apoptotic fraction is
defined as the sum of early and late apoptosis cells. (F) Cell cycle analysis. Each cell
cycle phase is compared between si-control and si-NOTCH4 cells. P value is calculated
by using Student’s t-test. *: P < 0.05, **: P < 0.01.
Figure 3. Comparison of EMT-related genes between the NOTCH4 high and low
groups using the TCGA data set. Comparison of NOTCH4 expression between
sphere and parental cells.
(A) The NOTCH4 high group is defined as tumors with expression 1 standard deviation
greater than the mean of normal tissue for NOTCH4. The other tumors are defined as
the low group. The boxes represent the interquartile range (25th
-75th
), and horizontal
lines inside the boxes indicate the median. Whiskers indicate the minimum and
maximum values. Ratio is calculated by dividing the mRNA expression of the high
group by the expression of the low group. (B) NOTCH4 expression is compared
between parental and sphere cells using qRT-PCR. P value is calculated by using
Student’s t-test. **: P < 0.01.
Research. on July 6, 2018. © 2017 American Association for Cancerclincancerres.aacrjournals.org Downloaded from
Author manuscripts have been peer reviewed and accepted for publication but have not yet been edited. Author Manuscript Published OnlineFirst on November 16, 2017; DOI: 10.1158/1078-0432.CCR-17-1366

28
Figure 4. The expression of EMT-related genes in si-NOTCH4 cells
(A) EMT-related gene (E-cadherin, Vimentin, Fibronectin, TWIST1, and SOX2)
expression in parental, si-control and si-NOTCH4 cells is measured by qRT-PCR. The
expression differences between si-control and si-NOTCH4 cells are compared. P value
is calculated by using Student’s t-test. *: P < 0.05, **: P < 0.01, N.S.: not significant.
(B) Western blots of EMT-related genes in si-control and si-NOTCH4 of SKN3 and
Cal27 cells. GAPDH antibody is used as a control.
Figure 5. HES1/HEY1 expression in si-NOTCH4 cells and NOTCH4 expression in
si-HEY1 cells.
HES1 (A) and HEY1 (B) expression in parental, si-control and si-NOTCH4 cells.
mRNA expression is measured by qRT-PCR. The expression differences between
si-control and si-NOTCH4 cells are compared. (C) Western blots of HES1 and HEY1 in
si-control and si-NOTCH4 cells. (D) NOTCH4 expression of parental, si-control and
si-HEY1 cells. mRNA expression is measured by qRT-PCR. The expression differences
between si-control and si-HEY1 cells are compared. (E) Western blots of NOTCH4 in
si-control and si-HEY1 cells. GAPDH antibody is used as a control. P value is
calculated by using Student’s t-test. *: P < 0.05, **: P < 0.01, N.S.: not significant.
Figure 6. Comparison of HEY1 and EMT-related genes using TCGA data set.
Comparison of HEY1 expression between sphere and parental cells.
(A) Comparison of EMT-related genes between HEY1 high and low groups using the
TCGA data set. The boxes represent the interquartile range (25th
-75th
), and horizontal
lines inside the boxes indicate median. Whiskers indicate the minimum and maximum
values. Ratio is calculated by dividing the mRNA expression of the high group by the
expression of the low group. (B) HEY1 expression is compared between parental and
sphere cells using qRT-PCR. P value is calculated by using Student’s t-test. **: P <
0.01.
Figure 7. HEY1 relates to EMT gene expression and EMT functions.
(A) The comparisons of EMT-related gene (E-cadherin, Vimentin, Fibronectin, TWIST1
and SOX2) expressions among parental, si-control and si-HEY1 cells. The expression
Research. on July 6, 2018. © 2017 American Association for Cancerclincancerres.aacrjournals.org Downloaded from
Author manuscripts have been peer reviewed and accepted for publication but have not yet been edited. Author Manuscript Published OnlineFirst on November 16, 2017; DOI: 10.1158/1078-0432.CCR-17-1366
29
differences between si-control and si-HEY1 cells are compared. (B) Western blots of
EMT-related genes in si-control and si-HEY1 cells. (C) Representative images of
migration and invasion assays. The cell line is SCC090. (D, E) Migration and invasion
assays in parental, si-control, si-NOTCH4 and si-HEY1 cells. The migration and
invasion indexes were calculated by deviding the number of parental cells thorough the
chamber. The differences between si-control and si-NOTCH4/si-HEY1 cells are
compared. P value is calculated by using Student’s t-test. *: P < 0.05, **: P < 0.01,
N.S.: not significant.
Research. on July 6, 2018. © 2017 American Association for Cancerclincancerres.aacrjournals.org Downloaded from
Author manuscripts have been peer reviewed and accepted for publication but have not yet been edited. Author Manuscript Published OnlineFirst on November 16, 2017; DOI: 10.1158/1078-0432.CCR-17-1366

Published OnlineFirst November 16, 2017.Clin Cancer Res Takahito Fukusumi, Theresa Guo, Akihiro Sakai, et al. transition in head and neck squamous cell carcinomaThe NOTCH4-HEY1 pathway induces epithelial mesenchymal
Updated version
10.1158/1078-0432.CCR-17-1366doi:
Access the most recent version of this article at:
Material
Supplementary
http://clincancerres.aacrjournals.org/content/suppl/2017/11/16/1078-0432.CCR-17-1366.DC1
Access the most recent supplemental material at:
Manuscript
Authorbeen edited. Author manuscripts have been peer reviewed and accepted for publication but have not yet
E-mail alerts related to this article or journal.Sign up to receive free email-alerts
Subscriptions
Reprints and
To order reprints of this article or to subscribe to the journal, contact the AACR Publications
Permissions
Rightslink site. Click on "Request Permissions" which will take you to the Copyright Clearance Center's (CCC)
.http://clincancerres.aacrjournals.org/content/early/2017/11/16/1078-0432.CCR-17-1366To request permission to re-use all or part of this article, use this link
Research. on July 6, 2018. © 2017 American Association for Cancerclincancerres.aacrjournals.org Downloaded from
Author manuscripts have been peer reviewed and accepted for publication but have not yet been edited. Author Manuscript Published OnlineFirst on November 16, 2017; DOI: 10.1158/1078-0432.CCR-17-1366