Cascade regulation of terminal adipocyte differentiation by three ...
Article
The Rockefeller University Press $30.00J. Exp. Med. 2016 Vol. 213 No. 10 2019–2037www.jem.org/cgi/doi/10.1084/jem.20160157
2019
INT ROD UCT IONHuman liposarcoma (LPS) is an aggressive soft tissue cancer, and the most common type found in adults, accounting for ∼20% of all sarcomas (Gimble et al., 2007; Dei Tos, 2014). The World Health Organization classified LPS into four major subtypes: 40–45% well-differentiated LPS (WDL PS), 15–25% dedifferentiated LPS (DDL PS), 30–35% myxoid LPS (MLPS), and ∼5% pleomorphic LPS (PLPS). Each LPS subtype can be diagnosed based on anatomical location, clinical behavior, his-tology appearance, and cytogenetic features (Dei Tos, 2014). WDL PS and DDL PS can be faithfully distinguished from the other two LPS subtypes based on genomic amplification of the 12q13-15 chromosomal region, which harbors the pro-tooncogenes MDM2 and CDK4, leading to overexpression of these two proteins. MDM2 and CDK4, together with p16, constitute a panel of highly specific and sensitive diagnostic markers to distinguish WDL PS and DDL PS from other li-pomatous tumors (Thway et al., 2012). LPS subtypes exhibit considerable variations of metastatic rates, from 0, 15–20, 20, and 30–50% for WDL PS, DDL PS, MLPS, and PLPS, respec-tively (Dei Tos, 2014). Currently, the most common therapy
for LPS is surgical resection, which often results in uncon-trolled local recurrence that causes an even higher mortality rate than that associated with metastasis (Dei Tos, 2014).
Despite the complex nature of LPS and its staggering consequence on human health, several crucial aspects of this cancer are largely unknown. Of special concern, the cellular or lineage origin of LPS is frequently overlooked. Intrigu-ingly, clinical studies indicate that 5–10% of DDL PS show heterologous cellular composition of myogenic, osteogenic, and angiogenic cells (Evans et al., 1994; Binh et al., 2007). This observation suggests a multipotent stem cell origin for at least a fraction of the DDL PSs. Alternatively, other mature cell types of the mesoderm lineage could have been transdif-ferentiated into LPS cells that partially resemble adipocyte morphology. Supporting this notion, activation of hedgehog signaling in adipocytes transformed them into muscle tumor (rhabdomyosarcoma; Hatley et al., 2012). Another equally important yet largely unknown aspect is the molecular reg-ulation of the initiation, development, and metastasis of LPS. Although several players, including Pten, p53, miR-155, and epigenetic modification, were shown to regulate LPS malig-nancy (Zhang et al., 2012; Keung et al., 2015; Ou et al., 2015; Puzio-Kuter et al., 2015), it’s unknown whether one single
Liposarcomas (LPSs) are the most common soft-tissue cancer. Because of the lack of animal models, the cellular origin and molecular regulation of LPS remain unclear. Here, we report that mice with adipocyte-specific activation of Notch signaling (Ad/N1ICD) develop LPS with complete penetrance. Lineage tracing confirms the adipocyte origin of Ad/N1ICD LPS. The Ad/N1ICD LPS resembles human dedifferentiated LPS in histological appearance, anatomical localization, and gene expression signature. Before transformation, Ad/N1ICD adipocytes undergo dedifferentiation that leads to lipodystrophy and metabolic dysfunction. Although concomitant Pten deletion normalizes the glucose metabolism of Ad/N1ICD mice, it dramatically accel-erates the LPS prognosis and malignancy. Transcriptomes and lipidomics analyses indicate that Notch activation suppresses lipid metabolism pathways that supply ligands to Pparγ, the master regulator of adipocyte homeostasis. Accordingly, synthetic Pparγ ligand supplementation induces redifferentiation of Ad/N1ICD adipocytes and tumor cells, and prevents LPS develop-ment in Ad/N1ICD mice. Importantly, the Notch target HES1 is abundantly expressed in human LPS, and Notch inhibition suppresses the growth of human dedifferentiated LPS xenografts. Collectively, ectopic Notch activation is sufficient to induce dedifferentiation and tumorigenic transformation of mature adipocytes in mouse.
Notch activation drives adipocyte dedifferentiation and tumorigenic transformation in mice
Pengpeng Bi,1 Feng Yue,1 Anju Karki,2 Beatriz Castro,1 Sara E. Wirbisky,3 Chao Wang,1 Abigail Durkes,4 Bennett D. Elzey,4,6 Ourania M. Andrisani,5,6 Christopher A. Bidwell,1 Jennifer L. Freeman,3,6 Stephen F. Konieczny,2,6 and Shihuan Kuang1,6
1Department of Animal Sciences, 2Department of Biological Sciences, 3School of Health Sciences, 4Department of Comparative Pathobiology, 5Department of Basic Medical Sciences, and 6Center for Cancer Research, Purdue University, West Lafayette, IN 47907
© 2016 Bi et al. This article is distributed under the terms of an Attribution–Noncommercial–Share Alike–No Mirror Sites license for the first six months after the publication date (see http ://www .rupress .org /terms). After six months it is available under a Creative Commons License (Attribution–Noncommercial–Share Alike 3.0 Unported license, as described at http ://creativecommons .org /licenses /by -nc -sa /3 .0 /).
Correspondence to Pengpeng Bi: [email protected]; or Shihuan Kuang: [email protected]
Abbreviations used: Ad, adipoq-Cre; BAT, brown adipose tissue; DDL PS, dedifferenti-ated LPS; H&E, hematoxylin and eosin; LPS, liposarcoma; mTmG, membrane GFP and membrane Td-tomato; N1ICD, Notch1 intracellular domain; NICD, Notch intracellular domain; WAT, white adipose tissue; WDL PS, well-differentiated LPS.
The
Journ
al o
f Exp
erim
enta
l M
edic
ine
on February 6, 2017
Dow
nloaded from
Published August 29, 2016
/content/suppl/2016/08/22/jem.20160157.DC1.html Supplemental Material can be found at:
Notch signaling in liposarcoma | Bi et al.2020
gene mutation event is sufficient to cause the development of malignant LPS in vivo. Certainly, gaining more insights on these aspects is essential to designing specific and effective therapeutic interventions to treat human LPS.
Notch signaling is an evolutionarily conserved pathway that plays essential roles in cell fate choice, organ develop-ment, metabolism, and tumorigenesis (Gridley, 2010; An-dersson et al., 2011; Guruharsha et al., 2012; Tao et al., 2014; Bi and Kuang, 2015). Notch signal transduction is initiated upon binding of a Notch receptor with a ligand located on neighbor cells, which drives sequential proteolytic cleavages of the Notch receptor and the final release of Notch intra-cellular domain (NICD). NICD then translocates to the nu-cleus, where it recruits a transcriptional complex to activate the transcription of downstream targets, including Hes and Hey family genes. The oncogenic function of Notch signaling was first described in human T cell acute lymphoblastic leu-kemia/lymphoma (T-ALL). Notably, more than half of T-ALL patients bear activating mutations of Notch (Weng et al., 2004; Aster et al., 2008). Subsequent studies found that Notch can also function as a tumor suppressor for certain types of solid tumors (Lobry et al., 2011). Recent studies revealed the oncogenic function of Notch signaling in osteosarcoma de-velopment (Engin et al., 2009; Tao et al., 2014). Despite the extensive research of Notch signaling in oncology, its func-tion in LPS development is totally unknown.
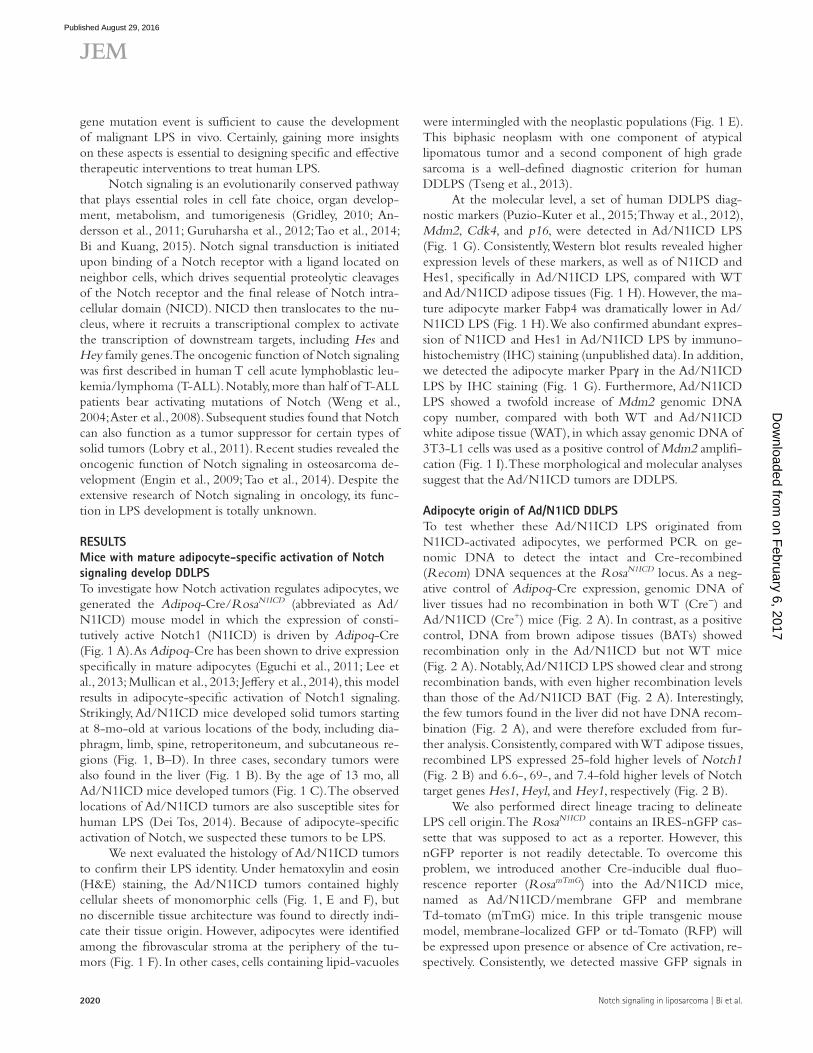
RES ULTSMice with mature adipocyte-specific activation of Notch signaling develop DDL PSTo investigate how Notch activation regulates adipocytes, we generated the Adipoq-Cre/RosaN1ICD (abbreviated as Ad/N1ICD) mouse model in which the expression of consti-tutively active Notch1 (N1ICD) is driven by Adipoq-Cre (Fig. 1 A). As Adipoq-Cre has been shown to drive expression specifically in mature adipocytes (Eguchi et al., 2011; Lee et al., 2013; Mullican et al., 2013; Jeffery et al., 2014), this model results in adipocyte-specific activation of Notch1 signaling. Strikingly, Ad/N1ICD mice developed solid tumors starting at 8-mo-old at various locations of the body, including dia-phragm, limb, spine, retroperitoneum, and subcutaneous re-gions (Fig. 1, B–D). In three cases, secondary tumors were also found in the liver (Fig. 1 B). By the age of 13 mo, all Ad/N1ICD mice developed tumors (Fig. 1 C). The observed locations of Ad/N1ICD tumors are also susceptible sites for human LPS (Dei Tos, 2014). Because of adipocyte-specific activation of Notch, we suspected these tumors to be LPS.
We next evaluated the histology of Ad/N1ICD tumors to confirm their LPS identity. Under hematoxylin and eosin (H&E) staining, the Ad/N1ICD tumors contained highly cellular sheets of monomorphic cells (Fig. 1, E and F), but no discernible tissue architecture was found to directly indi-cate their tissue origin. However, adipocytes were identified among the fibrovascular stroma at the periphery of the tu-mors (Fig. 1 F). In other cases, cells containing lipid-vacuoles
were intermingled with the neoplastic populations (Fig. 1 E). This biphasic neoplasm with one component of atypical lipomatous tumor and a second component of high grade sarcoma is a well-defined diagnostic criterion for human DDL PS (Tseng et al., 2013).
At the molecular level, a set of human DDL PS diag-nostic markers (Puzio-Kuter et al., 2015; Thway et al., 2012), Mdm2, Cdk4, and p16, were detected in Ad/N1ICD LPS (Fig. 1 G). Consistently, Western blot results revealed higher expression levels of these markers, as well as of N1ICD and Hes1, specifically in Ad/N1ICD LPS, compared with WT and Ad/N1ICD adipose tissues (Fig. 1 H). However, the ma-ture adipocyte marker Fabp4 was dramatically lower in Ad/N1ICD LPS (Fig. 1 H). We also confirmed abundant expres-sion of N1ICD and Hes1 in Ad/N1ICD LPS by immuno-histochemistry (IHC) staining (unpublished data). In addition, we detected the adipocyte marker Pparγ in the Ad/N1ICD LPS by IHC staining (Fig. 1 G). Furthermore, Ad/N1ICD LPS showed a twofold increase of Mdm2 genomic DNA copy number, compared with both WT and Ad/N1ICD white adipose tissue (WAT), in which assay genomic DNA of 3T3-L1 cells was used as a positive control of Mdm2 amplifi-cation (Fig. 1 I). These morphological and molecular analyses suggest that the Ad/N1ICD tumors are DDL PS.
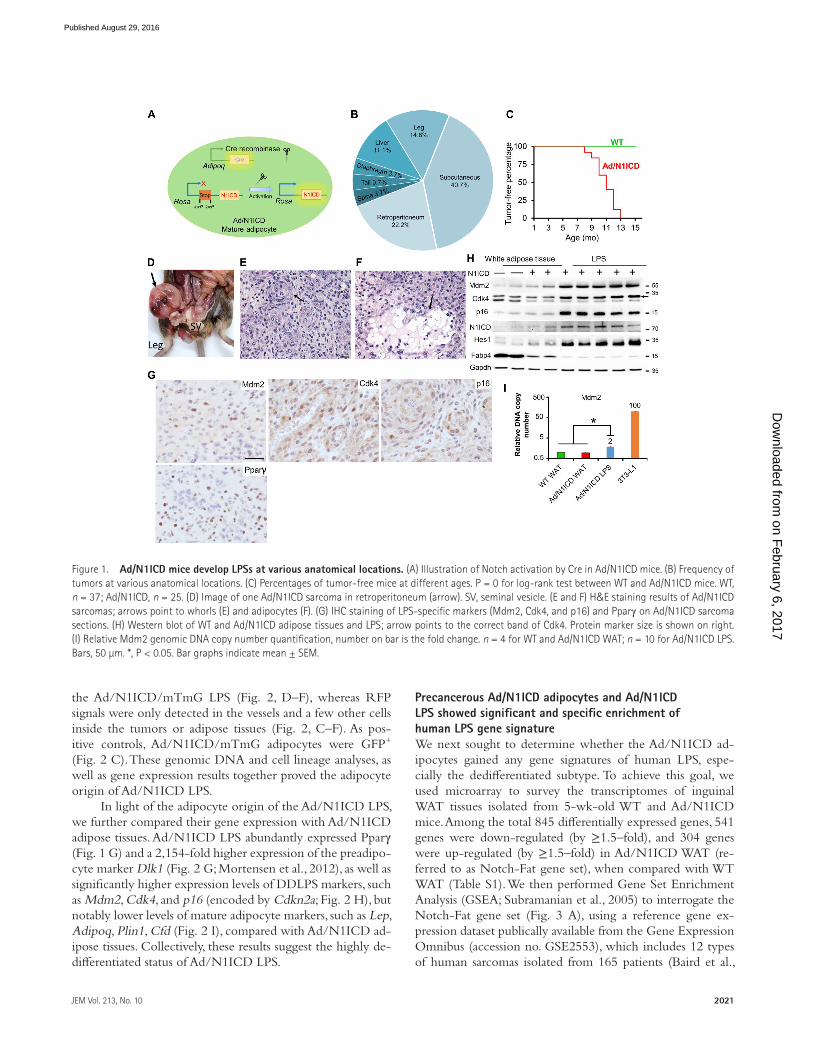
Adipocyte origin of Ad/N1ICD DDL PSTo test whether these Ad/N1ICD LPS originated from N1ICD-activated adipocytes, we performed PCR on ge-nomic DNA to detect the intact and Cre-recombined (Recom) DNA sequences at the RosaN1ICD locus. As a neg-ative control of Adipoq-Cre expression, genomic DNA of liver tissues had no recombination in both WT (Cre−) and Ad/N1ICD (Cre+) mice (Fig. 2 A). In contrast, as a positive control, DNA from brown adipose tissues (BATs) showed recombination only in the Ad/N1ICD but not WT mice (Fig. 2 A). Notably, Ad/N1ICD LPS showed clear and strong recombination bands, with even higher recombination levels than those of the Ad/N1ICD BAT (Fig. 2 A). Interestingly, the few tumors found in the liver did not have DNA recom-bination (Fig. 2 A), and were therefore excluded from fur-ther analysis. Consistently, compared with WT adipose tissues, recombined LPS expressed 25-fold higher levels of Notch1 (Fig. 2 B) and 6.6-, 69-, and 7.4-fold higher levels of Notch target genes Hes1, Heyl, and Hey1, respectively (Fig. 2 B).
We also performed direct lineage tracing to delineate LPS cell origin. The RosaN1ICD contains an IRES-nGFP cas-sette that was supposed to act as a reporter. However, this nGFP reporter is not readily detectable. To overcome this problem, we introduced another Cre-inducible dual fluo-rescence reporter (RosamTmG) into the Ad/N1ICD mice, named as Ad/N1ICD/membrane GFP and membrane Td-tomato (mTmG) mice. In this triple transgenic mouse model, membrane-localized GFP or td-Tomato (RFP) will be expressed upon presence or absence of Cre activation, re-spectively. Consistently, we detected massive GFP signals in
on February 6, 2017
Dow
nloaded from
Published August 29, 2016
2021JEM Vol. 213, No. 10
the Ad/N1ICD/mTmG LPS (Fig. 2, D–F), whereas RFP signals were only detected in the vessels and a few other cells inside the tumors or adipose tissues (Fig. 2, C–F). As pos-itive controls, Ad/N1ICD/mTmG adipocytes were GFP+ (Fig. 2 C). These genomic DNA and cell lineage analyses, as well as gene expression results together proved the adipocyte origin of Ad/N1ICD LPS.
In light of the adipocyte origin of the Ad/N1ICD LPS, we further compared their gene expression with Ad/N1ICD adipose tissues. Ad/N1ICD LPS abundantly expressed Pparγ (Fig. 1 G) and a 2,154-fold higher expression of the preadipo-cyte marker Dlk1 (Fig. 2 G; Mortensen et al., 2012), as well as significantly higher expression levels of DDL PS markers, such as Mdm2, Cdk4, and p16 (encoded by Cdkn2a; Fig. 2 H), but notably lower levels of mature adipocyte markers, such as Lep, Adipoq, Plin1, Cfd (Fig. 2 I), compared with Ad/N1ICD ad-ipose tissues. Collectively, these results suggest the highly de-differentiated status of Ad/N1ICD LPS.
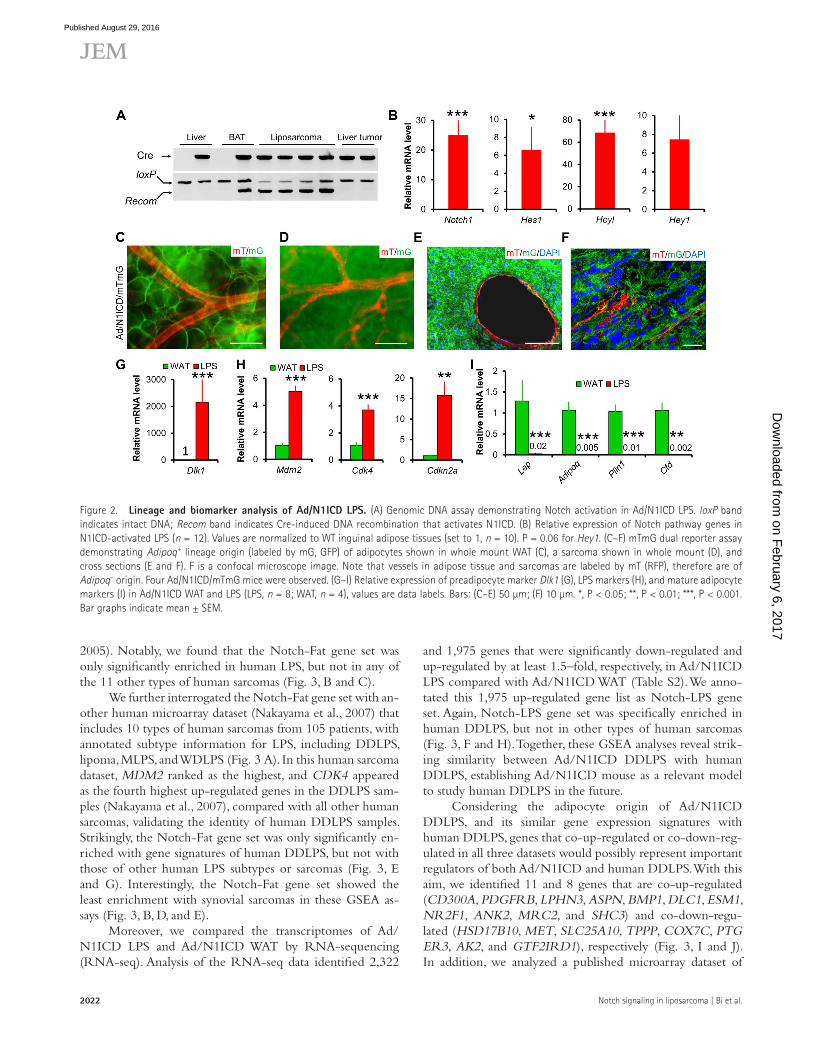
Precancerous Ad/N1ICD adipocytes and Ad/N1ICD LPS showed significant and specific enrichment of human LPS gene signatureWe next sought to determine whether the Ad/N1ICD ad-ipocytes gained any gene signatures of human LPS, espe-cially the dedifferentiated subtype. To achieve this goal, we used microarray to survey the transcriptomes of inguinal WAT tissues isolated from 5-wk-old WT and Ad/N1ICD mice. Among the total 845 differentially expressed genes, 541 genes were down-regulated (by ≥1.5–fold), and 304 genes were up-regulated (by ≥1.5–fold) in Ad/N1ICD WAT (re-ferred to as Notch-Fat gene set), when compared with WT WAT (Table S1). We then performed Gene Set Enrichment Analysis (GSEA; Subramanian et al., 2005) to interrogate the Notch-Fat gene set (Fig. 3 A), using a reference gene ex-pression dataset publically available from the Gene Expression Omnibus (accession no. GSE2553), which includes 12 types of human sarcomas isolated from 165 patients (Baird et al.,
Figure 1. Ad/N1ICD mice develop LPSs at various anatomical locations. (A) Illustration of Notch activation by Cre in Ad/N1ICD mice. (B) Frequency of tumors at various anatomical locations. (C) Percentages of tumor-free mice at different ages. P = 0 for log-rank test between WT and Ad/N1ICD mice. WT, n = 37; Ad/N1ICD, n = 25. (D) Image of one Ad/N1ICD sarcoma in retroperitoneum (arrow). SV, seminal vesicle. (E and F) H&E staining results of Ad/N1ICD sarcomas; arrows point to whorls (E) and adipocytes (F). (G) IHC staining of LPS-specific markers (Mdm2, Cdk4, and p16) and Pparγ on Ad/N1ICD sarcoma sections. (H) Western blot of WT and Ad/N1ICD adipose tissues and LPS; arrow points to the correct band of Cdk4. Protein marker size is shown on right. (I) Relative Mdm2 genomic DNA copy number quantification, number on bar is the fold change. n = 4 for WT and Ad/N1ICD WAT; n = 10 for Ad/N1ICD LPS. Bars, 50 µm. *, P < 0.05. Bar graphs indicate mean ± SEM.
on February 6, 2017
Dow
nloaded from
Published August 29, 2016
Notch signaling in liposarcoma | Bi et al.2022
2005). Notably, we found that the Notch-Fat gene set was only significantly enriched in human LPS, but not in any of the 11 other types of human sarcomas (Fig. 3, B and C).
We further interrogated the Notch-Fat gene set with an-other human microarray dataset (Nakayama et al., 2007) that includes 10 types of human sarcomas from 105 patients, with annotated subtype information for LPS, including DDL PS, lipoma, MLPS, and WDL PS (Fig. 3 A). In this human sarcoma dataset, MDM2 ranked as the highest, and CDK4 appeared as the fourth highest up-regulated genes in the DDL PS sam-ples (Nakayama et al., 2007), compared with all other human sarcomas, validating the identity of human DDL PS samples. Strikingly, the Notch-Fat gene set was only significantly en-riched with gene signatures of human DDL PS, but not with those of other human LPS subtypes or sarcomas (Fig. 3, E and G). Interestingly, the Notch-Fat gene set showed the least enrichment with synovial sarcomas in these GSEA as-says (Fig. 3, B, D, and E).
Moreover, we compared the transcriptomes of Ad/N1ICD LPS and Ad/N1ICD WAT by RNA-sequencing (RNA-seq). Analysis of the RNA-seq data identified 2,322
and 1,975 genes that were significantly down-regulated and up-regulated by at least 1.5–fold, respectively, in Ad/N1ICD LPS compared with Ad/N1ICD WAT (Table S2). We anno-tated this 1,975 up-regulated gene list as Notch-LPS gene set. Again, Notch-LPS gene set was specifically enriched in human DDL PS, but not in other types of human sarcomas (Fig. 3, F and H). Together, these GSEA analyses reveal strik-ing similarity between Ad/N1ICD DDL PS with human DDL PS, establishing Ad/N1ICD mouse as a relevant model to study human DDL PS in the future.
Considering the adipocyte origin of Ad/N1ICD DDL PS, and its similar gene expression signatures with human DDL PS, genes that co-up-regulated or co-down-reg-ulated in all three datasets would possibly represent important regulators of both Ad/N1ICD and human DDL PS. With this aim, we identified 11 and 8 genes that are co-up-regulated (CD300A, PDG FRB, LPHN3, ASPN, BMP1, DLC1, ESM1, NR2F1, ANK2, MRC2, and SHC3) and co-down-regu-lated (HSD17B10, MET, SLC25A10, TPPP, COX7C, PTG ER3, AK2, and GTF2IRD1), respectively (Fig. 3, I and J). In addition, we analyzed a published microarray dataset of
Figure 2. Lineage and biomarker analysis of Ad/N1ICD LPS. (A) Genomic DNA assay demonstrating Notch activation in Ad/N1ICD LPS. loxP band indicates intact DNA; Recom band indicates Cre-induced DNA recombination that activates N1ICD. (B) Relative expression of Notch pathway genes in N1ICD-activated LPS (n = 12). Values are normalized to WT inguinal adipose tissues (set to 1, n = 10). P = 0.06 for Hey1. (C–F) mTmG dual reporter assay demonstrating Adipoq+ lineage origin (labeled by mG, GFP) of adipocytes shown in whole mount WAT (C), a sarcoma shown in whole mount (D), and cross sections (E and F). F is a confocal microscope image. Note that vessels in adipose tissue and sarcomas are labeled by mT (RFP), therefore are of Adipoq– origin. Four Ad/N1ICD/mTmG mice were observed. (G–I) Relative expression of preadipocyte marker Dlk1 (G), LPS markers (H), and mature adipocyte markers (I) in Ad/N1ICD WAT and LPS (LPS, n = 8; WAT, n = 4), values are data labels. Bars: (C–E) 50 µm; (F) 10 µm. *, P < 0.05; **, P < 0.01; ***, P < 0.001. Bar graphs indicate mean ± SEM.
on February 6, 2017
Dow
nloaded from
Published August 29, 2016
2023JEM Vol. 213, No. 10
human LPS cell lines (Keung et al., 2015) and found that Notch ligands and target genes were expressed at significantly higher levels in human DDL PS (LPS224a and LPS224b) compared with WDL PS cell lines (LPS247b and LPS029b; Fig. 3 K). These results indicate the involvement of Notch activation in human DDL PS.
Notch signaling is activated in human LPS and inhibition of Notch suppresses DDL PS tumor cell growth in vitroWe examined the expression levels of N1ICD and HES1 in normal human adipose tissues and WDL PS and DDL
PS tumors by immunohistochemistry (IHC; n = 4/group). N1ICD signals were not detected in normal adipose tissues, but detectable in three of the four WDL PS and one of the four DDL PS samples (Fig. 4 A). Similarly, the Notch target HES1 signals were not detected in normal adipose tissues, but readily detectable in all WDL PS and DDL PS samples. How-ever, the signal intensity was much stronger in DDL PS than in WDL PS samples (Fig. 4 A). These results demonstrate acti-vation of Notch signaling in human DDL PS.
To directly examine the effect of Notch inhibition on human DDL PS cells, we treated immortalized cells derived
Figure 3. Ad/N1ICD adipocytes and LPS showed significant enrichment of human LPS gene signature. (A) Cartoon illustration of experiment design for B–H. (B) GSEA analysis of the human sarcoma gene expression database (GEO accession no. GSE2553), interrogated with Ad/N1ICD microarray gene set. NES, normalized enrichment score. FWER, familywise-error rate. #, number of patients. (C and D) Gene enrichment plots for analysis in B. (E and F) GSEA analysis of the human sarcoma gene expression database (GEO accession no. GSE6481) interrogated with Ad/N1ICD microarray gene set (E) and Ad/N1ICD LPS RNA-seq gene set (F). (G and H) Gene enrichment plots for analysis in E (G) and F (H). (I and J) Venn diagrams to show intersections among the three gene datasets. (K) Relative expression of Notch ligands (JAG2 and DLL4) and Notch target genes in human DDL PS cell lines, compared with WDL PS cell lines. Data were extracted and analyzed from GEO under accession no. GSE57754. (DDL PS, n = 6; WDL PS, n = 6). *, P < 0.05. Bar graphs indicate mean ± SEM.
on February 6, 2017
Dow
nloaded from
Published August 29, 2016

Notch signaling in liposarcoma | Bi et al.2024
from human DDL PS (LPS246; Peng et al., 2011) with the well-established γ-secretase inhibitor DAPT (10 µM). DAPT significantly inhibited the colony growth of LPS246 cells, visualized by crystal violet staining (Fig. 4, B and C). We detected significant reduction of Notch target gene HES1 mRNA after DAPT treatment (Fig. 4 D). Immunostaining of these cells with Ki67, a proliferation marker, and cleaved caspase-3, an apoptosis marker, revealed dramatic reduction of cell proliferation after DAPT treatment (Fig. 4, E and F), without affecting apoptosis of these cells (Fig. 4 E). These results demonstrate the antiproliferation effect of Notch in-hibitor on human DDL PS cells.
Adult onset of adipocyte dedifferentiation and metabolic syndromes in Ad/N1ICD miceTo better understand the development of LPS in Ad/N1ICD mice, we examined the adipose tissues in juvenile mice. The relative mass, and expression of mature and immature adipo-
cyte markers, were indistinguishable between WT and Ad/N1ICD adipose tissues at 3 wk of age (Fig. 5, A and B). We confirmed the Cre activation in these young adipocytes, in-dicated by td-Tomato expression in isolated Adipoq-Cre/RoasN1ICD/Rosatd-Tomato (Ad/N1ICD/td-Tomato) adipocytes (Fig. 5 C). However, adult Ad/N1ICD mice gradually de-veloped lipodystrophy, resulted in ∼90% reduction of adi-pose tissue weights (Fig. 5 E), compared with those of WT mice. Furthermore, epididymal WAT was not visible in Ad/N1ICD mice that were older than 5 mo. Because of the lack of adipose tissue, Ad/N1ICD mice were resistant to high-fat diet (HFD)–induced body weight gain (Fig. 5 D), and even normalized the obesity phenotype in the ob/ob (Leptinob) mice (Fig. 5 F). In contrast, weights of Ad/N1ICD livers were much heavier than those of control livers (Fig. 5 E), indicative of hepatic steatosis. Indeed, H&E staining reveals very high fat content in the livers of Ad/N1ICD mice (Fig. 5 G), ac-companied by significantly elevated expression levels of genes
Figure 4. Notch inhibitor DAPT inhibits cell proliferation of human DDL PS cells. (A) Representative IHC staining results of N1ICD and HES1 in human adipose tissue and LPS sections (n = 4/group). Arrows point to pos-itive cells. (B) Crystal violet staining result of DMSO or Notch inhibitor DAPT-treated human DDL PS cell line LPS246. (C) Quantification of densitometry in B. n = 3. (D) Relative expres-sion levels of Notch target genes in LPS246 cells. n = 8. (E) Immunofluorescent images of DMSO or DAPT-treated LPS246 cells. n = 3. (F) Quantification of Ki67+ percentages of cells as in E. n = 3. Bars, 50 µm. *, P < 0.05. Bar graphs indicate mean ± SEM.
on February 6, 2017
Dow
nloaded from
Published August 29, 2016
2025JEM Vol. 213, No. 10
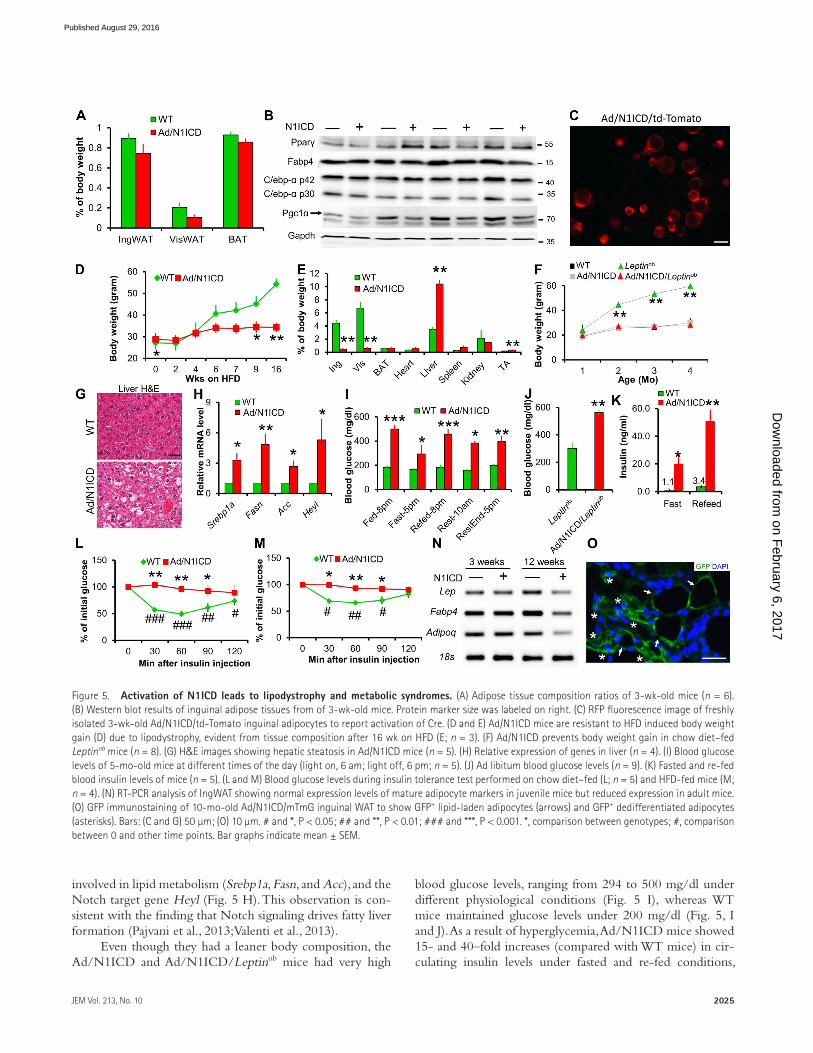
involved in lipid metabolism (Srebp1a, Fasn, and Acc), and the Notch target gene Heyl (Fig. 5 H). This observation is con-sistent with the finding that Notch signaling drives fatty liver formation (Pajvani et al., 2013; Valenti et al., 2013).
Even though they had a leaner body composition, the Ad/N1ICD and Ad/N1ICD/Leptinob mice had very high
blood glucose levels, ranging from 294 to 500 mg/dl under different physiological conditions (Fig. 5 I), whereas WT mice maintained glucose levels under 200 mg/dl (Fig. 5, I and J). As a result of hyperglycemia, Ad/N1ICD mice showed 15- and 40–fold increases (compared with WT mice) in cir-culating insulin levels under fasted and re-fed conditions,
Figure 5. Activation of N1ICD leads to lipodystrophy and metabolic syndromes. (A) Adipose tissue composition ratios of 3-wk-old mice (n = 6). (B) Western blot results of inguinal adipose tissues from of 3-wk-old mice. Protein marker size was labeled on right. (C) RFP fluorescence image of freshly isolated 3-wk-old Ad/N1ICD/td-Tomato inguinal adipocytes to report activation of Cre. (D and E) Ad/N1ICD mice are resistant to HFD induced body weight gain (D) due to lipodystrophy, evident from tissue composition after 16 wk on HFD (E; n = 3). (F) Ad/N1ICD prevents body weight gain in chow diet–fed Leptinob mice (n = 8). (G) H&E images showing hepatic steatosis in Ad/N1ICD mice (n = 5). (H) Relative expression of genes in liver (n = 4). (I) Blood glucose levels of 5-mo-old mice at different times of the day (light on, 6 am; light off, 6 pm; n = 5). (J) Ad libitum blood glucose levels (n = 9). (K) Fasted and re-fed blood insulin levels of mice (n = 5). (L and M) Blood glucose levels during insulin tolerance test performed on chow diet–fed (L; n = 5) and HFD-fed mice (M; n = 4). (N) RT-PCR analysis of IngWAT showing normal expression levels of mature adipocyte markers in juvenile mice but reduced expression in adult mice. (O) GFP immunostaining of 10-mo-old Ad/N1ICD/mTmG inguinal WAT to show GFP+ lipid-laden adipocytes (arrows) and GFP+ dedifferentiated adipocytes (asterisks). Bars: (C and G) 50 µm; (O) 10 µm. # and *, P < 0.05; ## and **, P < 0.01; ### and ***, P < 0.001. *, comparison between genotypes; #, comparison between 0 and other time points. Bar graphs indicate mean ± SEM.
on February 6, 2017
Dow
nloaded from
Published August 29, 2016
Notch signaling in liposarcoma | Bi et al.2026
respectively (Fig. 5 K), indicating severe insulin resistance. Indeed, Ad/N1ICD mice failed to respond to insulin in all time points examined during the 2-h insulin tolerance tests, in both chow diet (Fig. 5 L) and HFD regimes (Fig. 5 M). Together, the adult-onset lipodystrophy in Ad/N1ICD mice elicited a broad range of metabolic syndromes, including fatty liver disease, hyperglycemia, and severe insulin resistance.
Consistent with the lipodystrophy phenotype, adipose tissues of adult Ad/N1ICD mice expressed dramatically lower levels of mature adipocyte markers (Fig. 5 N). However, such changes were not observed in adipose tissues of 3-wk-old Ad/N1ICD mice (Fig. 5 N). The dedifferentiated white adi-pocytes, labeled as GFP+ in the cross section of Ad/N1ICD/mTmG inguinal WAT, totally lost the typical morphology of mature adipocytes (Fig. 5 O). These results confirm normal initial formation of WATs, and further suggest that the li-podystrophy of Ad/N1ICD mice is caused by the dediffer-entiation of mature adipocytes, but not a consequence of developmental defects of adipose tissues.
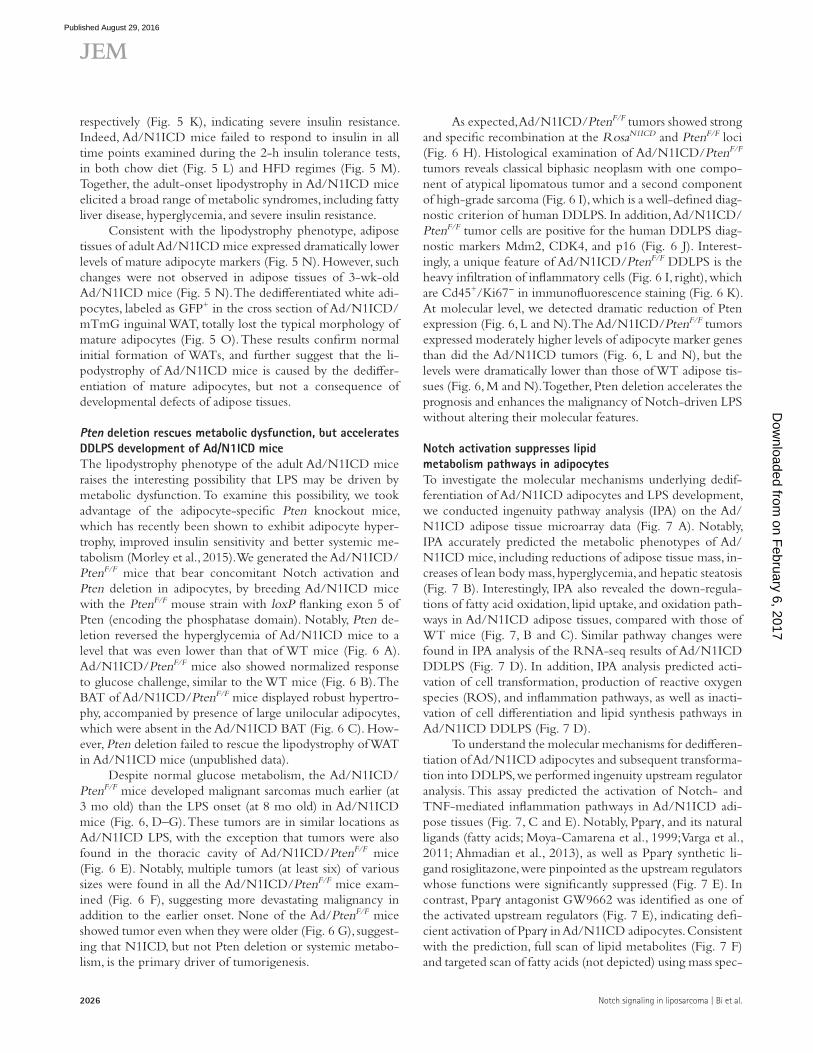
Pten deletion rescues metabolic dysfunction, but accelerates DDL PS development of Ad/N1ICD miceThe lipodystrophy phenotype of the adult Ad/N1ICD mice raises the interesting possibility that LPS may be driven by metabolic dysfunction. To examine this possibility, we took advantage of the adipocyte-specific Pten knockout mice, which has recently been shown to exhibit adipocyte hyper-trophy, improved insulin sensitivity and better systemic me-tabolism (Morley et al., 2015). We generated the Ad/N1ICD/PtenF/F mice that bear concomitant Notch activation and Pten deletion in adipocytes, by breeding Ad/N1ICD mice with the PtenF/F mouse strain with loxP flanking exon 5 of Pten (encoding the phosphatase domain). Notably, Pten de-letion reversed the hyperglycemia of Ad/N1ICD mice to a level that was even lower than that of WT mice (Fig. 6 A). Ad/N1ICD/PtenF/F mice also showed normalized response to glucose challenge, similar to the WT mice (Fig. 6 B). The BAT of Ad/N1ICD/PtenF/F mice displayed robust hypertro-phy, accompanied by presence of large unilocular adipocytes, which were absent in the Ad/N1ICD BAT (Fig. 6 C). How-ever, Pten deletion failed to rescue the lipodystrophy of WAT in Ad/N1ICD mice (unpublished data).
Despite normal glucose metabolism, the Ad/N1ICD/PtenF/F mice developed malignant sarcomas much earlier (at 3 mo old) than the LPS onset (at 8 mo old) in Ad/N1ICD mice (Fig. 6, D–G). These tumors are in similar locations as Ad/N1ICD LPS, with the exception that tumors were also found in the thoracic cavity of Ad/N1ICD/PtenF/F mice (Fig. 6 E). Notably, multiple tumors (at least six) of various sizes were found in all the Ad/N1ICD/PtenF/F mice exam-ined (Fig. 6 F), suggesting more devastating malignancy in addition to the earlier onset. None of the Ad/PtenF/F mice showed tumor even when they were older (Fig. 6 G), suggest-ing that N1ICD, but not Pten deletion or systemic metabo-lism, is the primary driver of tumorigenesis.
As expected, Ad/N1ICD/PtenF/F tumors showed strong and specific recombination at the RosaN1ICD and PtenF/F loci (Fig. 6 H). Histological examination of Ad/N1ICD/PtenF/F tumors reveals classical biphasic neoplasm with one compo-nent of atypical lipomatous tumor and a second component of high-grade sarcoma (Fig. 6 I), which is a well-defined diag-nostic criterion of human DDL PS. In addition, Ad/N1ICD/PtenF/F tumor cells are positive for the human DDL PS diag-nostic markers Mdm2, CDK4, and p16 (Fig. 6 J). Interest-ingly, a unique feature of Ad/N1ICD/PtenF/F DDL PS is the heavy infiltration of inflammatory cells (Fig. 6 I, right), which are Cd45+/Ki67− in immunofluorescence staining (Fig. 6 K). At molecular level, we detected dramatic reduction of Pten expression (Fig. 6, L and N). The Ad/N1ICD/PtenF/F tumors expressed moderately higher levels of adipocyte marker genes than did the Ad/N1ICD tumors (Fig. 6, L and N), but the levels were dramatically lower than those of WT adipose tis-sues (Fig. 6, M and N). Together, Pten deletion accelerates the prognosis and enhances the malignancy of Notch-driven LPS without altering their molecular features.
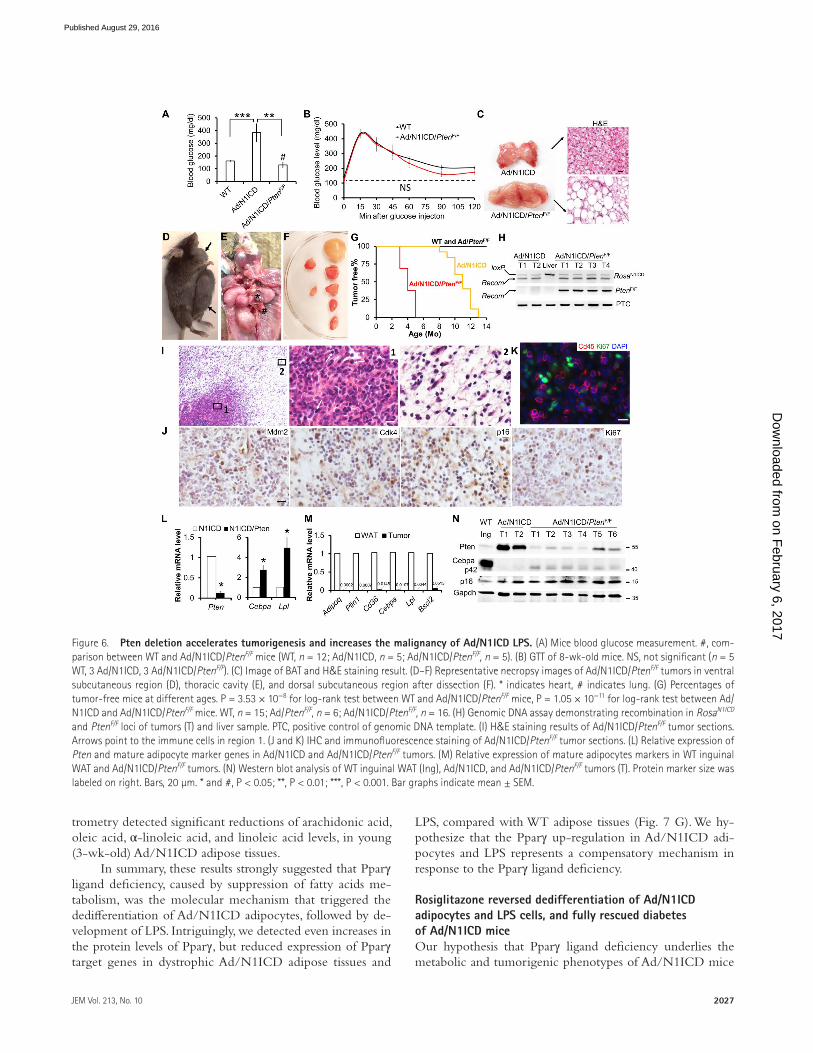
Notch activation suppresses lipid metabolism pathways in adipocytesTo investigate the molecular mechanisms underlying dedif-ferentiation of Ad/N1ICD adipocytes and LPS development, we conducted ingenuity pathway analysis (IPA) on the Ad/N1ICD adipose tissue microarray data (Fig. 7 A). Notably, IPA accurately predicted the metabolic phenotypes of Ad/N1ICD mice, including reductions of adipose tissue mass, in-creases of lean body mass, hyperglycemia, and hepatic steatosis (Fig. 7 B). Interestingly, IPA also revealed the down-regula-tions of fatty acid oxidation, lipid uptake, and oxidation path-ways in Ad/N1ICD adipose tissues, compared with those of WT mice (Fig. 7, B and C). Similar pathway changes were found in IPA analysis of the RNA-seq results of Ad/N1ICD DDL PS (Fig. 7 D). In addition, IPA analysis predicted acti-vation of cell transformation, production of reactive oxygen species (ROS), and inflammation pathways, as well as inacti-vation of cell differentiation and lipid synthesis pathways in Ad/N1ICD DDL PS (Fig. 7 D).
To understand the molecular mechanisms for dedifferen-tiation of Ad/N1ICD adipocytes and subsequent transforma-tion into DDL PS, we performed ingenuity upstream regulator analysis. This assay predicted the activation of Notch- and TNF-mediated inflammation pathways in Ad/N1ICD adi-pose tissues (Fig. 7, C and E). Notably, Pparγ, and its natural ligands (fatty acids; Moya-Camarena et al., 1999; Varga et al., 2011; Ahmadian et al., 2013), as well as Pparγ synthetic li-gand rosiglitazone, were pinpointed as the upstream regulators whose functions were significantly suppressed (Fig. 7 E). In contrast, Pparγ antagonist GW9662 was identified as one of the activated upstream regulators (Fig. 7 E), indicating defi-cient activation of Pparγ in Ad/N1ICD adipocytes. Consistent with the prediction, full scan of lipid metabolites (Fig. 7 F) and targeted scan of fatty acids (not depicted) using mass spec-
on February 6, 2017
Dow
nloaded from
Published August 29, 2016
2027JEM Vol. 213, No. 10
trometry detected significant reductions of arachidonic acid, oleic acid, α-linoleic acid, and linoleic acid levels, in young (3-wk-old) Ad/N1ICD adipose tissues.
In summary, these results strongly suggested that Pparγ ligand deficiency, caused by suppression of fatty acids me-tabolism, was the molecular mechanism that triggered the dedifferentiation of Ad/N1ICD adipocytes, followed by de-velopment of LPS. Intriguingly, we detected even increases in the protein levels of Pparγ, but reduced expression of Pparγ target genes in dystrophic Ad/N1ICD adipose tissues and
LPS, compared with WT adipose tissues (Fig. 7 G). We hy-pothesize that the Pparγ up-regulation in Ad/N1ICD adi-pocytes and LPS represents a compensatory mechanism in response to the Pparγ ligand deficiency.
Rosiglitazone reversed dedifferentiation of Ad/N1ICD adipocytes and LPS cells, and fully rescued diabetes of Ad/N1ICD miceOur hypothesis that Pparγ ligand deficiency underlies the metabolic and tumorigenic phenotypes of Ad/N1ICD mice
Figure 6. Pten deletion accelerates tumorigenesis and increases the malignancy of Ad/N1ICD LPS. (A) Mice blood glucose measurement. #, com-parison between WT and Ad/N1ICD/PtenF/F mice (WT, n = 12; Ad/N1ICD, n = 5; Ad/N1ICD/PtenF/F, n = 5). (B) GTT of 8-wk-old mice. NS, not significant (n = 5 WT, 3 Ad/N1ICD, 3 Ad/N1ICD/PtenF/F). (C) Image of BAT and H&E staining result. (D–F) Representative necropsy images of Ad/N1ICD/PtenF/F tumors in ventral subcutaneous region (D), thoracic cavity (E), and dorsal subcutaneous region after dissection (F). * indicates heart, # indicates lung. (G) Percentages of tumor-free mice at different ages. P = 3.53 × 10⁻⁸ for log-rank test between WT and Ad/N1ICD/PtenF/F mice, P = 1.05 × 10⁻¹¹ for log-rank test between Ad/N1ICD and Ad/N1ICD/PtenF/F mice. WT, n = 15; Ad/PtenF/F, n = 6; Ad/N1ICD/PtenF/F, n = 16. (H) Genomic DNA assay demonstrating recombination in RosaN1ICD and PtenF/F loci of tumors (T) and liver sample. PTC, positive control of genomic DNA template. (I) H&E staining results of Ad/N1ICD/PtenF/F tumor sections. Arrows point to the immune cells in region 1. (J and K) IHC and immunofluorescence staining of Ad/N1ICD/PtenF/F tumor sections. (L) Relative expression of Pten and mature adipocyte marker genes in Ad/N1ICD and Ad/N1ICD/PtenF/F tumors. (M) Relative expression of mature adipocytes markers in WT inguinal WAT and Ad/N1ICD/PtenF/F tumors. (N) Western blot analysis of WT inguinal WAT (Ing), Ad/N1ICD, and Ad/N1ICD/PtenF/F tumors (T). Protein marker size was labeled on right. Bars, 20 µm. * and #, P < 0.05; **, P < 0.01; ***, P < 0.001. Bar graphs indicate mean ± SEM.
on February 6, 2017
Dow
nloaded from
Published August 29, 2016
Notch signaling in liposarcoma | Bi et al.2028
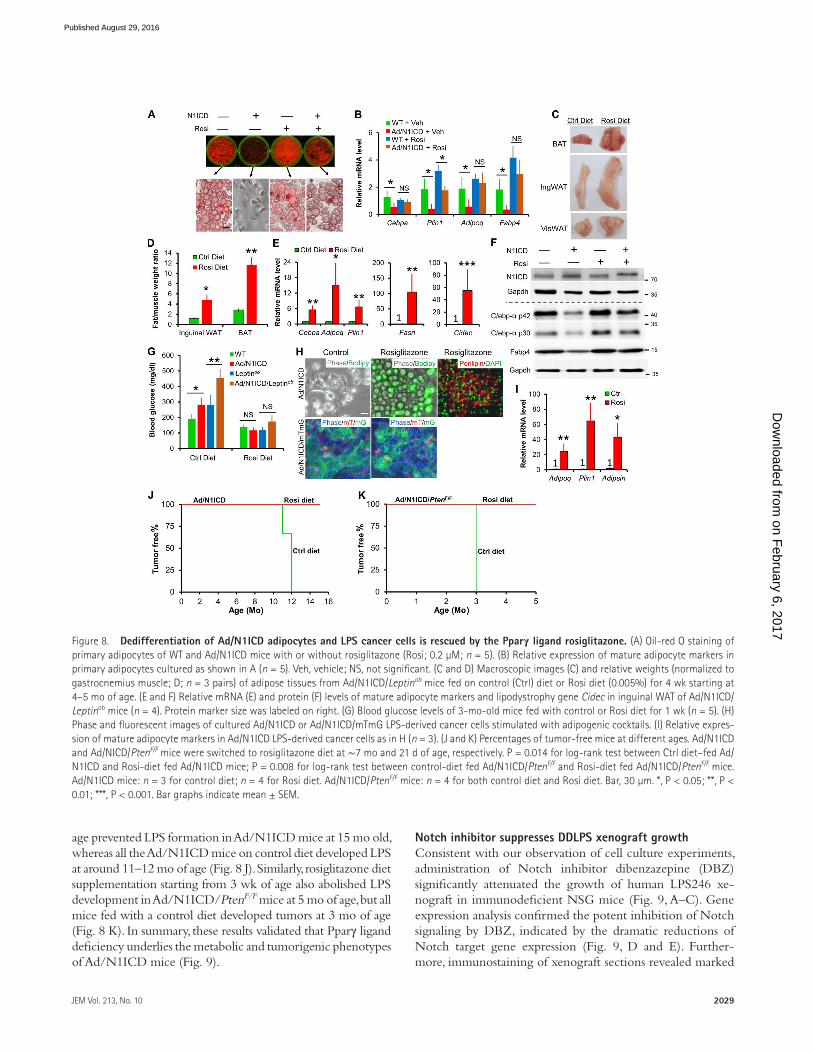
predicts that Pparγ ligand supplementation should rescue such phenotypes. To directly test this, we evaluated the effect of a synthetic Pparγ ligand, rosiglitazone (also a commonly prescribed antidiabetic drug), on Ad/N1ICD adipocytes and LPS. Consistent with in vivo observations, cultured Ad/N1ICD adipocytes were also lipodystrophic, manifested by the fibroblastic morphology and lack of lipid accumulation (Fig. 8 A). Strikingly, a very low concentration of rosiglitazone (0.2 µM) rescued the lipid content and adipocyte-specific gene expression in Ad/N1ICD adipocytes, to levels compara-ble to rosiglitazone-treated WT adipocytes (Fig. 8, A and B).
Similar rescues were also achieved in animal exper-iments in which supplementation of rosiglitazone in diet (0.005%) significantly increased the size and weight of Ad/N1ICD adipose tissues (Fig. 8, C and D), accompanied by reactivated expressions of mature adipocyte markers and fatty acid synthase (Fasn; Fig. 8, E and F). Rosiglitazone also dramatically activated expression of Cidec (Fig. 8 E), whose
mutation is associated with human lipodystrophy (Fiorenza et al., 2011; Garg, 2011). Remarkably, rosiglitazone treatment completely rescued the diabetes in both Ad/N1ICD and Ad/N1ICD/Leptinob mice within 1 wk (Fig. 8 G).
Next, we evaluated the response of LPS-derived cancer cells to rosiglitazone. In the absence of rosiglitazone, primary cells from Ad/N1ICD LPS never effectively differentiate into lipid-laden adipocytes (Fig. 8 H, first row) even after stimulation with the adipogenesis cocktails. Strikingly, in the presence of rosiglitazone (0.2 µM), Ad/N1ICD LPS cells redifferentiated into adipocytes, which were Perilipin+ by immunostaining, and showed morphological features that were nearly indistinguish-able from the WT adipocytes (Fig. 8 H, first row). With the mTmG dual reporter, we further confirmed the Ad/N1ICD cancer cell origin of these adipocytes, which are labeled as GFP+ (Fig. 8 H, second row). Consistently, rosiglitazone also greatly stimulated expression of adipocyte markers (Fig. 8 I). Further-more, rosiglitazone diet supplementation starting from 7 mo of
Figure 7. Inhibition of lipid metabolism pathways in Ad/N1ICD adipocytes and LPSs. (A) Microarray volcano plot of genes with significant fold-change in Ad/N1ICD (n = 4) versus WT inguinal WAT (n = 4). Colored dots are genes on the indicated pathways. (B and D) IPA pathway analysis for differen-tially expressed genes in Ad/N1ICD fat versus WT fat (B) and genes in Ad/N1ICD LPS versus Ad/N1ICD fat (D). (C) Heat map of the representative genes from pathways listed in B. (E) Ingenuity upstream regulator analysis of differentially expressed genes in Ad/N1ICD fat versus WT fat. (F) Heat map of metabolites in mass spectrometry full scan in the negative ion mode of lipids extracted from 3-wk-old WT and Ad/N1ICD inguinal adipose tissues (n = 4). (G) Western blot results of adipose tissues and Ad/N1ICD LPSs. Protein marker size is shown on the right. *, P < 0.05. Bar graphs indicate mean ± SEM.
on February 6, 2017
Dow
nloaded from
Published August 29, 2016
2029JEM Vol. 213, No. 10
age prevented LPS formation in Ad/N1ICD mice at 15 mo old, whereas all the Ad/N1ICD mice on control diet developed LPS at around 11–12 mo of age (Fig. 8 J). Similarly, rosiglitazone diet supplementation starting from 3 wk of age also abolished LPS development in Ad/N1ICD/PtenF/F mice at 5 mo of age, but all mice fed with a control diet developed tumors at 3 mo of age (Fig. 8 K). In summary, these results validated that Pparγ ligand deficiency underlies the metabolic and tumorigenic phenotypes of Ad/N1ICD mice (Fig. 9).
Notch inhibitor suppresses DDL PS xenograft growthConsistent with our observation of cell culture experiments, administration of Notch inhibitor dibenzazepine (DBZ) significantly attenuated the growth of human LPS246 xe-nograft in immunodeficient NSG mice (Fig. 9, A–C). Gene expression analysis confirmed the potent inhibition of Notch signaling by DBZ, indicated by the dramatic reductions of Notch target gene expression (Fig. 9, D and E). Further-more, immunostaining of xenograft sections revealed marked
Figure 8. Dedifferentiation of Ad/N1ICD adipocytes and LPS cancer cells is rescued by the Pparγ ligand rosiglitazone. (A) Oil-red O staining of primary adipocytes of WT and Ad/N1ICD mice with or without rosiglitazone (Rosi; 0.2 µM; n = 5). (B) Relative expression of mature adipocyte markers in primary adipocytes cultured as shown in A (n = 5). Veh, vehicle; NS, not significant. (C and D) Macroscopic images (C) and relative weights (normalized to gastrocnemius muscle; D; n = 3 pairs) of adipose tissues from Ad/N1ICD/Leptinob mice fed on control (Ctrl) diet or Rosi diet (0.005%) for 4 wk starting at 4–5 mo of age. (E and F) Relative mRNA (E) and protein (F) levels of mature adipocyte markers and lipodystrophy gene Cidec in inguinal WAT of Ad/N1ICD/Leptinob mice (n = 4). Protein marker size was labeled on right. (G) Blood glucose levels of 3-mo-old mice fed with control or Rosi diet for 1 wk (n = 5). (H) Phase and fluorescent images of cultured Ad/N1ICD or Ad/N1ICD/mTmG LPS-derived cancer cells stimulated with adipogenic cocktails. (I) Relative expres-sion of mature adipocyte markers in Ad/N1ICD LPS-derived cancer cells as in H (n = 3). (J and K) Percentages of tumor-free mice at different ages. Ad/N1ICD and Ad/NICD/PtenF/F mice were switched to rosiglitazone diet at ∼7 mo and 21 d of age, respectively. P = 0.014 for log-rank test between Ctrl diet–fed Ad/N1ICD and Rosi-diet fed Ad/N1ICD mice; P = 0.008 for log-rank test between control-diet fed Ad/N1ICD/PtenF/F and Rosi-diet fed Ad/N1ICD/PtenF/F mice. Ad/N1ICD mice: n = 3 for control diet; n = 4 for Rosi diet. Ad/N1ICD/PtenF/F mice: n = 4 for both control diet and Rosi diet. Bar, 30 µm. *, P < 0.05; **, P < 0.01; ***, P < 0.001. Bar graphs indicate mean ± SEM.
on February 6, 2017
Dow
nloaded from
Published August 29, 2016

Notch signaling in liposarcoma | Bi et al.2030
reductions of HES1+ and KI67+, but increases of cleaved Caspase3+ cells (Fig. 9, E–H). These results indicate that DBZ treatment inhibits the proliferation, while increasing the apoptosis of LPS246 cells in vivo, suggesting that inhibition of Notch signaling may represent an effective therapeutic ap-proach to treat human DDL PS.
DIS CUS SIONEmerging evidence has suggested critical roles of Notch signal-ing in regulating metabolism (Bi and Kuang, 2015). Our previ-ous work showed that inhibition of Notch signaling promotes beige adipocyte development in WATs and protects mice from developing obesity (Bi et al., 2014; Gridley and Kajimura, 2014; Stern and Scherer, 2015). Here, we found that activation of Notch signaling in mature adipocytes did not affect the initial development of white adipocytes, indicated by normal adi-pocyte-specific gene expression and adipose tissue size. This may be explained by the mature adipocyte–specific expression pattern of Adipoq (Berry and Rodeheffer, 2013), which results in the activation of Notch signaling in postmitotic adipocytes.
Despite normal WAT development, Ad/N1ICD adipo-cytes gradually dedifferentiated and finally caused lipodystro-
phy, which is a relatively rare human disease that can be either inherited due to genetic defects or acquired from HIV ther-apy or other autoimmune disease (Huang-Doran et al., 2010; Fiorenza et al., 2011). Interestingly, lipodystrophy patients dis-played metabolic complications that are also frequently asso-ciated with obesity, the other extremity of adiposity relative to lipodystrophy disease (Fiorenza et al., 2011). Although Ad/N1ICD mice were protected from developing HFD- and ge-netic-induced obesity, they showed severe diabetes and fatty liver disease (Chartoumpekis et al., 2015). Analysis of Ad/N1ICD adipose tissue transcriptomes predicted the meta-bolic phenotypes of Ad/N1ICD mice, even the abnormality in liver. It indicates that adipocyte dystrophy is the primary cause of the fatty liver disease, which was also observed in sev-eral other lipodystrophy mouse models (Pajvani et al., 2005; Huang-Doran et al., 2010; Safar Zadeh et al., 2013).
Notably, the oncogenic function of Notch activation in DDL PS development was greatly enhanced by deletion of Pten, indicated by the much earlier onset and higher malig-nancy (in terms of tumor numbers) of LPS in Ad/N1ICD/PtenF/F mice. This observation is consistent with the tumor suppressor function of Pten (Smith et al., 2013; Ou et al.,
Figure 9. Notch inhibitor DBZ inhibits human DDL PS xenograft growth. (A) Experiment design, 10 µmol DBZ/kg body weight was administrated by i.p. injection every 2 d. (B) Image of human LPS246 xenograft tumors isolated from DMSO- or DBZ-treated NSG mice. (C) Tumor weight mea-surements: n = 5 for DMSO; n = 6 for DBZ. (D) Relative expression levels of NOT CH1 and its target genes in LPS246 xenograft. n = 6. (E–H) Immuno-fluorescent staining results of LPS246 xenograft cross sections. Bar, 40 µm. *, P < 0.05; **, P < 0.01. Bar graphs indicate mean ± SEM.
on February 6, 2017
Dow
nloaded from
Published August 29, 2016
2031JEM Vol. 213, No. 10
2015; Puzio-Kuter et al., 2015) and further supports the two-hit hypothesis, which postulates that activation of an oncogene and inactivation of a tumor suppressor gene lead to cancer development. In contrast to the Ad/N1ICD mice, Ad/N1ICD/PtenF/F mice showed even better glucose me-tabolism than WT mice. This comparison strongly suggests that Notch activation itself, but not its consequence on metabolic dysregulation, determines the oncogenic trans-formation of Ad/N1ICD adipocytes. Accordingly, there was no report of tumorigenesis in other lipodystrophy mouse models or human patients.
Epidemiological studies found that obesity and its asso-ciated metabolic syndromes are risk factors for several types of cancer (Esposito et al., 2012; Bhandari et al., 2014). However, the cellular and molecular basis of whether and how dysreg-ulated peripheral tissues participate in tumor development is unknown. Our study exemplified that, in addition to causing metabolic syndromes, dysregulated adipocytes can also cell autonomously give rise to malignant DDL PS. Although our results didn’t rule out any other possible cell lineage origins of LPS, we provided solid cellular and genetic evidence that mature adipocyte can be a source of DDL PS.
Interestingly, GSEA analysis revealed specific enrich-ment of human DDL PS gene signatures, but not of all other sarcomas, in juvenile, precancerous Ad/N1ICD adipose tis-sues. This identified a gene set with 47 genes that are enriched in both Ad/N1ICD (versus WT) adipocytes and human DDL PS (versus other sarcomas). To probe the oncogenic mechanism of Ad/N1ICD adipocytes, we did IPA func-tion analysis of these genes. Interestingly, we find significant changes of the pathways related with cell gap and adhesion remodeling. Among them, Gucy1a3, the guanylyl cyclase, was reported as a direct target of Notch signaling, involved in endothelial-to-mesenchymal transition (EMT) of developing heart (Chang et al., 2011). Because EMT in cancer progres-sion and metastasis recaptures EMT in developmental pro-grams, Gucy1a3 may play important roles in the remodeling of Ad/N1ICD LPS as well.
Similar to human DDL PS, expression of Mdm2 and Cdk4, at both mRNA and protein levels, were easily detected in Ad/N1ICD DDL PS. Notably, Mdm2 is a positive regulator of Notch signaling through at least two distinct mechanisms on the posttranscriptional level. First, as an E3 ubiquitin ligase, Mdm2, degrades Numb, a major negative regulator of Notch signaling (Sczaniecka et al., 2012). Second, Mdm2 can di-rectly activate Notch signaling by nondegradative ubiquitina-tion of the Notch1 receptor (Pettersson et al., 2013). Analysis of one deposited human sarcoma cell line expression dataset revealed higher expression of several genes on Notch path-way, indicating the activation of Notch signaling in DDL PS, compared with WDL PS cell lines. We also confirmed higher HES1 protein level in human DDL PS than in WDL PS and normal adipose tissues. Intriguingly, it’s reported that both Mdm2 and Notch1 can antagonize p53 by promoting its degradation (Moll and Petrenko, 2003). Therefore, it’s import-
ant to know how the protooncogene MDM2 synergizes with Notch signaling to affect the clinical behaviors of the tumor, and whether p53 was involved in mediating such effects. The elevated levels of HES1 in human DDL PS compared with WDL PS and adipose tissues indicate higher Notch activity in DDL PS. However, we only detected activated NOT CH1 in 1 out of 4 human DDL PS samples, suggesting that other NOT CH receptors (NOT CH2-4) may also be involved in activating Notch signaling in human DDL PS.
Intriguingly, activation of Notch signaling was observed in obese adipose tissues and diabetic hepatocytes (Pajvani et al., 2013; Bi et al., 2014). Considering the oncogenic function of Notch signaling in liver cancer (Villanueva et al., 2012), Notch activation may facilitate the transformation of dia-betic hepatocytes into liver tumors, a scenario similar to the transformation of mature adipocyte into LPS in Ad/N1ICD mice. Indeed, Notch signaling was moderately activated in fatty liver of Ad/N1ICD mice too, followed by development of liver cancer, though at very low incidence. In the genomic DNA recombination assay, we didn’t detect any recombi-nation in the RosaN1ICD locus of Ad/N1ICD liver and liver tumor genomic DNA. Therefore, the activation of Notch in Ad/N1ICD liver is not a consequence of leaky expression of Adipoq-Cre, and liver tumor formation is likely a conse-quence of chronic liver damage caused by severe fatty liver disease (Starley et al., 2010).
To probe the mechanisms that led to lipodystrophy and LPS development in Ad/N1ICD mice, we applied IPA anal-ysis to predict upstream regulator of Ad/N1ICD phenotypes. Interestingly, these analyses pinpointed the Pparγ ligand de-ficiency in Ad/N1ICD adipocytes and LPS. Rosiglitazone, a synthetic Pparγ ligand, dramatically stimulated the expan-sion of Ad/N1ICD adipose tissues and reactivated adipocyte marker expression in Ad/N1ICD adipocytes, accompanied by a full rescue of diabetic phenotype of both Ad/N1ICD and Ad/N1ICD/Leptinob mice. In parallel, inhibition of PGC1α (Pparγ cofactor) expression by Notch activation in white adipocytes could also represent an important mecha-nism underlying the reduced Pparγ activity. Pparγ is currently the only known regulator that is both essential and sufficient for adipogenesis (Rosen and MacDougald, 2006). Specifically, no factor can induce adipogenesis in the absence of Pparγ (es-sential), and forced expression of Pparγ is sufficient to induce the adipogenic program of fibroblast (Tontonoz et al., 1994).
The redifferentiation of Ad/N1ICD LPS cancer cells is consistent with the reports that Pparγ ligand can induce terminal differentiation of human LPS cells (Tontonoz et al., 1997; Demetri et al., 1999). However, a phase II clinical trial aiming to evaluate the effect of rosiglitazone in treating pa-tients with LPS yielded unsatisfactory results (Debrock et al., 2003), which can be explained by the observation that tumors of distinct lineage origins may exhibit completely different clinical responses to the same pharmacological in-tervention (Abraham et al., 2014). Currently, another phase II clinical trial using rosiglitazone to treat LPS is under way
on February 6, 2017
Dow
nloaded from
Published August 29, 2016
Notch signaling in liposarcoma | Bi et al.2032
(ClinicalTrials.gov identifier: NCT00004180). Our study demonstrates that aberrant activation of Notch signaling drives the dystrophy of mature adipocytes and their sub-sequent transformation into LPS, and that Pparγ agonism can efficiently ameliorate the metabolic dysfunction of Ad/N1ICD mice and induce redifferentiation of DDL PS of cultured Ad/N1ICD cells.
MAT ERI ALS AND MET HODSAnimalsAll procedures involving mice were performed in accordance with Purdue University’s Animal Care and Use Committee. The following mice were purchased from The Jackson Lab-oratory: Adiponectin-Cre (Eguchi et al., 2011), RosaN1ICD (Murtaugh et al., 2003), PtenF/F (Groszer et al., 2001), Leptinob (Coleman and Hummel, 1973), RosamTmG (Muzumdar et al., 2007), and Rosatd-Tomato (Madisen et al., 2010). Mice were in C57BL/6J and 129S4 mixed background and housed in the animal facility with free access to water and standard rodent chow food or HFD (TD.06414; Harlan). Littermate control mice were used for comparisons with mutants. Ro-siglitazone diet (0.005%) and the control diet were pur-chased from Research Diets.
LPS246 xenograft and DBZ treatment2 × 106 human LPS246 cells were injected subcutaneously into the flank of 16–17-wk-old NSG mice. Before injec-tion, the cells were suspended in 0.1 ml HBSS and mixed with 0.1 ml Matrigel. DBZ was purchased from TOC RIS Bioscience and dissolved in DMSO at 100 mM concen-tration. Immediately before administration, the stock was suspended at 1:100 dilution in a solution containing 0.5% Methocel E4M (wt/vol; Dow Chemical) and 0.1% Tween-80 (wt/vol; Sigma-Aldrich) in H2O. The working solution was mixed by vortex for 1 min, and i.p. injected at a dosage of 10 µmol DBZ/kg mouse body weight every 2 d start-ing from day 14 after LPS246 cell injection. Control group mice were injected with equal volumes of DMSO diluted in E4M/Tween-80 solution. Control and DBZ treatment groups were randomly grouped.
Genomic DNA recombination and gene copy number quantification assaysGenomic DNA was extracted with phenol/chloroform, and analyzed by PCR using specific primers that detect the in-tact loxP sequence and deletion of loxP-flanked sequence at RosaN1ICD loci (Canalis et al., 2013). DNA copy numbers were quantified by real-time PCR (Roche Light Cycler 480 PCR System) with SYBR Green Master Mix (Roche) using Mdm2 primer (forward, 5′-TTA GGC GGT AGT CTA GGG TATG-3′; Reverse, 5′-GTG AGG GAG GTG AAC GAT TTAG-3′). Approximately 100 ng genomic DNA was used in each amplification. The 2−ΔΔCt method was used to ana-lyze the relative changes after normalization with glucagon genomic DNA (Fan et al., 2012).
Blood glucose and insulin measurement5 µl blood collected from tail vein was dropped onto a glu-cose test strip (Accu-Check Active; Roche) and measured by a glucometer (Accu-Check Active, Roche). For insulin toler-ance test (ITT), mice were fasted for 4 h before i.p. admin-istration of human insulin (Santa Cruz Biotechnology, Inc.; 0.75 U Kg−1 body weight), and tail blood glucose levels were monitored. For ITT, mouse was singly caged with blinded cage number and random orders. The 5 µl of blood was used for ELI SA analysis of insulin concentration, using a mouse insulin ELI SA kit (Crystal Chem).
Lipid extraction and mass spectrometryInguinal WAT samples were lysed in RIPA buffer, and centri-fuged 20 min at 13,000 at 4°C. The top lipid layer was diluted in 200 µl chloroform, mixed well, and centrifuged 10 min at 16,000 g. A volume of 15 µl polar phase was diluted with 200 µl CHCl3/MeOH/water with 300 mM ammonium ace-tate at the proportion of 300/665/35 (vol/vol/v), and 130 µl of chloroform. Samples were then loaded by a G1377A g microautosampler. An Agilent 6410 triple-quadrupole mass spectrometer was used to monitor the m/z of each free fatty acid or full mass scan in negative ion mode. Next, 8 µl of the lipid extract was delivered by flow injection to the ESI source of the instrument. Solvent used was CHCl3/MeOH/water (300/665/35 [vol/vol/vol]) with 300 mM ammonium acetate. Data were processed using MassHunter software and exported for further data analysis. Values of ion intensity of each free fatty acid/ion of the full mass spectra were normal-ized by the total ion intensity.
Cell culture and chemical treatmentHuman DDL PS cell line (LPS246) was provided by Y. Lu (MD Anderson Cancer Center, Houston, TX; Peng et al., 2011). LPS cells (passages #37–40) were cultured in DMEM containing 10% FBS with DMSO or DAPT (10 µM) for 2 d. At the end of the experiments, cells were collected for RNA extraction, or fixed and stained with crystal violet to visualize colony density, and quantified with densitometry using Image J software (National Institutes of Health). Mouse stromal-vascular fraction (SVF) cells were isolated from sub-cutaneous WAT unless otherwise stated. Adipose tissue was minced and digested with 1.5 mg ml−1 collagenase at 37°C for 1.5–2 h. The digestions were stopped with DMEM con-taining 10% FBS, filtered through 100-µm filters, and centri-fuged at 450 g for 5 min. SVF cells were seeded and cultured in growth medium containing DMEM, 20% FBS, and 1% penicillin/streptomycin at 37°C with 5% CO2 for 3 d. Upon confluence, preadipocytes were induced to differentiate with induction medium contains DMEM, 10% FBS, 1 µg ml−1 insulin, 5 µM dexamethasone (DEXA; Sigma-Aldrich) and 0.5 mM 3-isobutyl-methylxanthine (IBMX; Cayman Chem-ical), 1 nM T3 for 4 d, and then 4 d in differentiation medium contains DMEM, 1 µg ml−1 insulin and 1 nM T3 until adipo-cytes mature. During the induction and differentiation, cells
on February 6, 2017
Dow
nloaded from
Published August 29, 2016

2033JEM Vol. 213, No. 10
were treated with 0.2 µM rosiglitazone or vehicle control (DMSO). Oil red-O staining was performed as previously described (Liu et al., 2012), and the multi-well images were taken with an imaging system (FluorChem R FR0116). Cells were used for immunostaining with Perilipin antibody (sc-67164) obtained from Santa Cruz Biotechnology, Inc.
LPS246 xenograft and DBZ treatmentHuman LPS246 cells (2 × 10⁶) were injected subcutaneously into the flank of 16–17-wk-old NSG mouse. Before injection, the cells were suspended in 50 µl HBSS and mixed with 50 µl Matrigel. DBZ was purchased from TOC RIS Bioscience and dissolved in DMSO at a 100-mM concentration. Immediately before administration, the stock was suspended at 1:100 di-lution in a solution containing 0.5% Methocel E4M (wt/vol; Dow Chemical) and 0.1% Tween-80 (wt/vol; Sigma-Aldrich) in H2O. The working solution was mixed by vortex and soni-cation for 1 min, and i.p. injected at a dosage of 10 µmol DBZ/kg mouse body weight every 2 d starting from day 15 after LPS246 cell injection. Control group mice were injected with equal volumes of DMSO diluted in E4M/Tween-80 solution. Control and DBZ treatment groups were randomly grouped.
Total RNA extraction, cDNA synthesis, and real-time PCRTotal RNA was extracted from cells or tissues using TRIzol reagent according to the manufacturer’s instructions. RNA was treated with RNase-free DNase l to remove con-taminating genomic DNA. The purity and concentration of total RNA were determined by a spectrophotometer (Nanodrop 2000c; Thermo Fisher Scientific) at 260 and 280 nm. Ratios of absorption (260/280 nm) of all samples were between 1.8 and 2.0. Next, 5 µg of total RNA were reverse transcribed using random primers with M-MLV reverse transcription (Invitrogen). Real-time PCR was per-formed in a Light Cycler 480 PCR System with SYBR Green Master Mix (both from Roche) and the following gene-specific primers; 18s forward: 5′-AGT CCC TGC CCT TTG TAC ACA-3′, reverse: 5′-CGA TCC GAG GGC CTC ACTA-3′; Notch1 forward: 5′-TGG CCT GCC TGT CTG GAA CAA CAG TTCA-3′ reverse: 5′-ACC CTT GCC TCA GTT CAA ACA CAA GAT AC-3′; Hes1 forward: 5′-CCA GCC AGT GTC AAC ACGA-3′, reverse: 5′-AAT GCC GGG AGC TAT CTT TCT-3′; Hey1 forward: 5′-TGA ATC CAG ATG ACC AGC TAC TGT-3′, reverse: 5′-TAC TTT CAG ACT CCG ATC GCT TAC-3′; Heyl forward: 5′-TCC TAG CCA GAG ATT CAG TGT CAC-3′, reverse: 5′-GTT TGT CTG CAA CAC CCT AGA GTG-3′; Pten forward: 5′-GGA AAG GGA CGG ACT GGT GTAA-3′, reverse: 5′-GCA GTG CCA CGG GTC TGT AATC-3′; Lpl forward: 5′-GGG AGT TTG GCT CCA GAG TTT-3′, reverse: 5′-TGT GTC TTC AGG GGT CCT TAG-3′; Cd36 forward: 5′-ATG GGC TGT GAT CGG AAC TG-3′, reverse: 5′-TTT GCC ACG TCA TCT GGG TTT-3′; Cfd forward: 5′-CAT GCT CGG CCC TAC ATGG-3′, reverse: 5′-CAC AGA GTC GTC ATC CGT CAC-3′; Leptin forward: 5′-GAG ACC CCT GTG
TCG GTTC-3′, reverse: 5′-CTG CGT GTG TGA AAT GTC ATTG-3′; Cidec forward: 5′-ATG GAC TAC GCC ATG AAG TCT-3′, reverse: 5′-CGG TGC TAA CAC GAC AGGG-3′; Dlk1 forward: 5′-AGT GCG AAA CCT GGG TGTC-3′, reverse: 5′-GCC TCC TTG TTG AAA GTG GTCA-3′; Bscl2 forward: 5′-TGG GGC AAG AGA GAC ATGC-3′, reverse: 5′-TCT TCC ACA GGG ACG ATA CCC-3′; Srebp1a for-ward: 5′-GCG CCA TGG ACG AGC TG-3′, reverse: 5′-TTG GCA CCT GGG CTG CT-3′; Mdm2 forward: 5′-TGT CTG TGT CTA CCG AGG GTG-3′, reverse: 5′-TCC AAC GGA CTT TAA CAA CTT CA-3′; Cdk4 forward: 5′-AAG GTC ACC CTA GTG TTT GAGC-3′, reverse: 5′-CCG CTT AGA AAC TGA CGC ATT AG-3′; Cdkn2a forward: 5′-CGC AGG TTC TTG GTC ACT GT-3′, reverse: 5′-TGT TCA CGA AAG CCA GAG CG-3′; NOT CH1 forward: 5′-GAG GCG TGG CAG ACT ATGC-3′, reverse: 5′-CTT GTA CTC CGT CAG CGT GA-3′; HES1 forward: 5′-TCA ACA CGA CAC CGG ATA AAC-3′, reverse: 5′-GCC GCG AGC TAT CTT TCT TCA-3′; HEY1 forward: 5′-GTT CGG CTC TAG GTT CCA TGT-3′, reverse: 5′-CGT CGG CGC TTC TCA ATT ATTC-3′; HEYL forward: 5′-GGA AGA AAC GCA GAG GGA TCA-3′, reverse: 5′-CAA GCG TCG CAA TTC AGA AAG-3′. The 2−ΔΔCt method was used to analyze the relative changes in each gene’s expression normalized against 18S rRNA expression.
Microarray, RNA-seq, IPA, and GSEA analysisRNA was extracted from 5-wk-old WT and Ad/N1ICD mice, four mice for each genotype. Gene expression was analyzed by microarray with Agilent SurePrint G3 Mouse GE 8 X 60 K chip as previously described (Wirbisky et al., 2015). For RNA-sequencing, RNA was extracted from 8 Ad/N1ICD LPS samples and four 3-wk-old Ad/N1ICD inguinal WATs. The libraries were constructed from total RNA using the Illumina TruSeq Stranded mRNA Library Prep kit after the kit's instruction. Eight cycles of PCR were amplified. Individual libraries were pooled based on tittering using KAPA Library Quantification performed on an Ap-plied Biosystems Step-One qPCR machine. A single pool of all 12 libraries was clustered on two lanes of a HiSeq 2500 High Output chemistry run. The list of significantly changed genes with a fold change ≥ 1.5–fold was used to generate a volcano plot, as well as analyzed through the QIA GEN’s Ingenuity Pathway Analysis (IPA; QIA GEN). GSEA analysis was performed as instructed in the man-ual (Subramanian et al., 2005). The microarray and RNA-seq data reported in this paper have been deposited in the Gene Expression Omnibus (GEO) database under accession nos. GSE80215 and GSE80433.
Venn diagramThe up- or down-regulated gene lists were used to generate Venn diagrams with the online Bioinformatics and Evolutionary Genomics tool (http ://bioinformatics .psb .ugent .be /webtools /Venn /).
on February 6, 2017
Dow
nloaded from
Published August 29, 2016
Notch signaling in liposarcoma | Bi et al.2034
Protein extraction and Western blot analysisProtein was isolated from cells or tissue using RIPA buffer contains 50 mM Tris-HCl (pH 8.0), 150 mM NaCl, 1% NP-40, 0.5% sodium deoxycholate, and 0.1% SDS. Protein concen-trations were determined using BCA Protein Assay Reagent (Thermo Fisher Scientific), followed by measurement with NanoDrop. Proteins were separated by sodium dodecyl sulfate PAGE (SDS-PAGE), transferred to a polyvinylidene fluoride (PVDF) membrane (Millipore), blocked in 5% fat-free milk for 1 h at room temperature, and then incubated with primary antibodies diluted in 5% milk overnight at 4°C. Cdk4 (sc-260), p16 (sc-1207), Pparγ (sc-390740), C/ebp-a (sc-61), Fabp4 (sc-271529), Adiponectin (sc-26497), Hes1 (sc-25392), Pgc1α (sc-13067), and Gapdh (sc-32233) antibodies were purchased from Santa Cruz Biotechnology. Pten (#9188) antibody was purchased from Cell Signaling Technology. The Mdm2 (OP46) antibody was obtained from Millipore. N1ICD antibody was purchased from Abcam (ab8925). The HRP-conjugated sec-ondary antibody (anti–rabbit IgG or anti–mouse IgG; Santa Cruz Biotechnology, Inc.) was diluted at 1:5,000. Immuno-detection was performed using enhanced chemiluminescence (ECL) Western blotting substrate (Thermo Fisher Scientific) and detected with an imaging system (FluorChem R FR0116). Alternatively, the membrane was incubated with an infrared secondary antibody (Alexa Fluor 790 goat anti–mouse IgG; A11357; Alexa Fluor 680 goat anti–rabbit IgG, A21109; Life Technologies) diluted 1:10,000, and the signals were detected by using the Odyssey infrared image scanning system.
Immunofluorescent stainingTissue sections or cultured cells were fixed in 4% PFA, quenched with glycine (100 mM glycine, 0.2% Triton X-100, and 0.1% sodium azide in PBS), and blocked in PBS containing 2% BSA, 5% goat serum, and 0.2% Triton X-100 at room temperature for 45 min. Tissues or cells were then incubated with the primary antibodies diluted in the same blocking solution at 4°C overnight, and finally vi-sualized with fluorophore-conjugated secondary antibodies (Alexa Fluor 568 goat anti–mouse IgG, A21124 Life Tech-nologies, and Alexa Fluor 488 goat anti–rabbit IgG H&L, ab150077). The primary antibodies used were as follows: mouse monoclonal anti-Ki67 (BD), rabbit anti-cleaved caspase-3 (Asp175) antibody (Cell Signaling Technology), and rabbit anti-Perilipin (Santa Cruz Biotechnology, Inc.). Nuclei were counterstained with DAPI that was mixed with secondary antibodies.
H&E and IHC stainingTissues were fixed in 10% formalin for 24 h at room tem-perature. Then the tissues were embedded into paraffin and cut 4-µm thick, deparaffinized, and rehydrated through xy-lene, ethanol, and water by standard methods. Slides were used for H&E staining and the whole slide digital images were collected at 20× magnification with an Aperio Scan Scope slide scanner (Aperio). For IHC, 5-µm thick tissue sec-
tions of were deparaffinized and antigen-retrieved using the 2100-Retriever (Electron Microscopy Sciences) with antigen unmasking solution (Vector Laboratories). Human tissue ar-rays were purchased from Biomax (# SO242), which includes four normal human adipose tissue cases, four WDL PS cases, and four DDL PS cases, duplicate core per case. Then sections were blocked by incubating in 3% H2O2 for 5 min to block endogenous peroxidase activity, followed by 1 h in M.O.M. blocking buffer (Vector Laboratories) at 4°C for overnight. Slides were incubated in primary antibodies (1:100 dilutions except for N1ICD as 1:1,000) at 4°C for overnight. Hes1 antibody was obtained from Santa Cruz Biotechnology, Inc. (sc-25392) and N1ICD was purchased from Abcam (ab8925). Biotinylated secondary antibodies were used at 1:200 dilution for 30 min at room temperature. IHC development was per-formed using Vector reagents and DAB (diamonibenzidine) peroxidase substrate (Vector). Slides were counterstained with hematoxylin to visualize nucleus.
StatisticsTrial experiments or experiments done previously were used to determine sample size with adequate statistical power. Measurement values that are beyond fence as determined by interquartile range were considered as outlier and excluded from statistical analysis. All analyses were conducted with Stu-dent’s t test with two-tail distribution. Comparison with P < 0.05 was considered significant.
Online supplemental materialTables S1 and S2, available as Excel files, show lists of differentially expressed genes extracted from the microarray and RNA-seq. Online supplemental material is available at http ://www .jem .org /cgi /content /full /jem . 20160157 /DC1.
ACK NOW LED GME NTSWe thank Dr. Timothy Ratliff and Dr. Jingwu Xie for insightful discussion; Dr. Xiaoqi Liu and Dr. Susan M. Mendrysa for sharing antibodies; Dr. Bruce Cooper and Dr. Chris-tina Ferreira for helping with lipidomics analysis; Sandra Torregrosa-Allenfor assist-ing with tumor xenograft; Dr. Rong Fan for histological advices; Dr. Young-Woong Kim and Dr. Nadia Carlesso for assistance in tumor sampling; Phillip San Miguel for RNA-seq support; Jun Wu for maintaining mouse colonies; and members of the Kuang laboratory for comments.
B. Castro was supported by the Alfonso Martin Escudero Foundation. This work was partially supported by grants from the National Institutes of Health (R01AR060652 and P30CA023168) and Purdue University Center for Cancer Re-search (Shared Resource Award and Challenge Research award).
The authors declare no competing financial interests.Author contributions: P. Bi and S. Kuang conceived the project, designed the
experiments, and prepared the manuscript. P. Bi, F. Yue, B. Castro, S.E. Wirbirsky, A. Karki, and A. Durkes performed the experiments. O.M. Andrisani and, and and B.D. Elzey provided reagents. P. Bi, F. Yue, B. Castro, C. Wang, A. Durkes, C.A. Bidwell, J.L. Freeman, S.F. Konieczny, and S. Kuang analyzed the data.
Submitted: 1 February 2016
Accepted: 26 July 2016
on February 6, 2017
Dow
nloaded from
Published August 29, 2016

2035JEM Vol. 213, No. 10
REfERENCESAbraham, J., Y. Nuñez-Álvarez, S. Hettmer, E. Carrió, H.I. Chen, K. Nishijo,
E.T. Huang, S.I. Prajapati, R.L. Walker, S. Davis, et al. 2014. Lineage of origin in rhabdomyosarcoma informs pharmacological response. Genes Dev. 28:1578–1591. http ://dx .doi .org /10 .1101 /gad .238733 .114
Ahmadian, M., J.M. Suh, N. Hah, C. Liddle, A.R. Atkins, M. Downes, and R.M. Evans. 2013. PPARγ signaling and metabolism: the good, the bad and the future. Nat. Med. 19:557–566. http ://dx .doi .org /10 .1038 /nm .3159
Andersson, E.R., R. Sandberg, and U. Lendahl. 2011. Notch signaling: simplicity in design, versatility in function. Development. 138:3593–3612. http ://dx .doi .org /10 .1242 /dev .063610
Aster, J.C., W.S. Pear, and S.C. Blacklow. 2008. Notch signaling in leukemia. Annu. Rev. Pathol. 3:587–613. http ://dx .doi .org /10 .1146 /annurev .pathmechdis .3 .121806 .154300
Baird, K., S. Davis, C.R. Antonescu, U.L. Harper, R.L. Walker, Y. Chen, A.A. Glatfelter, P.H. Duray, and P.S. Meltzer. 2005. Gene expression profiling of human sarcomas: insights into sarcoma biology. Cancer Res. 65:9226–9235. http ://dx .doi .org /10 .1158 /0008 -5472 .CAN -05 -1699
Berry, R., and M.S. Rodeheffer. 2013. Characterization of the adipocyte cellular lineage in vivo. Nat. Cell Biol. 15:302–308. http ://dx .doi .org /10 .1038 /ncb2696
Bhandari, R., G.A. Kelley, T.A. Hartley, and I.R. Rockett. 2014. Metabolic syndrome is associated with increased breast cancer risk: a systematic review with meta-analysis. Int. J. Breast Cancer. 2014:189384. http ://dx .doi .org /10 .1155 /2014 /189384
Bi, P., and S. Kuang. 2015. Notch signaling as a novel regulator of metabolism. Trends Endocrinol. Metab. 26:248–255. http ://dx .doi .org /10 .1016 /j .tem .2015 .02 .006
Bi, P., T. Shan, W. Liu, F. Yue, X. Yang, X.R. Liang, J. Wang, J. Li, N. Carlesso, X. Liu, and S. Kuang. 2014. Inhibition of Notch signaling promotes browning of white adipose tissue and ameliorates obesity. Nat. Med. 20:911–918. http ://dx .doi .org /10 .1038 /nm .3615
Binh, M.B., L. Guillou, I. Hostein, M.C. Château, F. Collin, A. Aurias, B.N. Binh, E. Stoeckle, and J.M. Coindre. 2007. Dedifferentiated liposarcomas with divergent myosarcomatous differentiation developed in the internal trunk: a study of 27 cases and comparison to conventional dedifferentiated liposarcomas and leiomyosarcomas. Am. J. Surg. Pathol. 31:1557–1566. http ://dx .doi .org /10 .1097 /PAS .0b013e31804b4109
Canalis, E., D.J. Adams, A. Boskey, K. Parker, L. Kranz, and S. Zanotti. 2013. Notch signaling in osteocytes differentially regulates cancellous and cortical bone remodeling. J. Biol. Chem. 288:25614–25625. http ://dx .doi .org /10 .1074 /jbc .M113 .470492
Chang, A.C., Y. Fu, V.C. Garside, K. Niessen, L. Chang, M. Fuller, A. Setiadi, J. Smrz, A. Kyle, A. Minchinton, et al. 2011. Notch initiates the endothelial-to-mesenchymal transition in the atrioventricular canal through autocrine activation of soluble guanylyl cyclase. Dev. Cell. 21:288–300. http ://dx .doi .org /10 .1016 /j .devcel .2011 .06 .022
Chartoumpekis, D.V., D.L. Palliyaguru, N. Wakabayashi, N.K. Khoo, G. Schoiswohl, R.M. O’Doherty, and T.W. Kensler. 2015. Notch intracellular domain overexpression in adipocytes confers lipodystrophy in mice. Mol. Metab. 4:543–550. http ://dx .doi .org /10 .1016 /j .molmet .2015 .04 .004
Coleman, D.L., and K.P. Hummel. 1973. The influence of genetic background on the expression of the obese (Ob) gene in the mouse. Diabetologia. 9:287–293. http ://dx .doi .org /10 .1007 /BF01221856
Debrock, G., V. Vanhentenrijk, R. Sciot, M. Debiec-Rychter, R. Oyen, and A. Van Oosterom. 2003. A phase II trial with rosiglitazone in liposarcoma patients. Br. J. Cancer. 89:1409–1412. http ://dx .doi .org /10 .1038 /sj .bjc .6601306
Dei Tos, A.P. 2014. Liposarcomas: diagnostic pitfalls and new insights. Histopathology. 64:38–52. http ://dx .doi .org /10 .1111 /his .12311
Demetri, G.D., C.D. Fletcher, E. Mueller, P. Sarraf, R. Naujoks, N. Campbell, B.M. Spiegelman, and S. Singer. 1999. Induction of solid tumor differentiation by the peroxisome proliferator-activated receptor-gamma ligand troglitazone in patients with liposarcoma. Proc. Natl. Acad. Sci. USA. 96:3951–3956. http ://dx .doi .org /10 .1073 /pnas .96 .7 .3951
Eguchi, J., X. Wang, S. Yu, E.E. Kershaw, P.C. Chiu, J. Dushay, J.L. Estall, U. Klein, E. Maratos-Flier, and E.D. Rosen. 2011. Transcriptional control of adipose lipid handling by IRF4. Cell Metab. 13:249–259. http ://dx .doi .org /10 .1016 /j .cmet .2011 .02 .005
Engin, F., T. Bertin, O. Ma, M.M. Jiang, L. Wang, R.E. Sutton, L.A. Donehower, and B. Lee. 2009. Notch signaling contributes to the pathogenesis of human osteosarcomas. Hum. Mol. Genet. 18:1464–1470. http ://dx .doi .org /10 .1093 /hmg /ddp057
Esposito, K., P. Chiodini, A. Colao, A. Lenzi, and D. Giugliano. 2012. Metabolic syndrome and risk of cancer: a systematic review and meta-analysis. Diabetes Care. 35:2402–2411. http ://dx .doi .org /10 .2337 /dc12 -0336
Evans, H.L., K.K. Khurana, B.L. Kemp, and A.G. Ayala. 1994. Heterologous elements in the dedifferentiated component of dedifferentiated liposarcoma. Am. J. Surg. Pathol. 18:1150–1157. http ://dx .doi .org /10 .1097 /00000478 -199411000 -00009
Fan, W., C.S. Lin, P. Potluri, V. Procaccio, and D.C. Wallace. 2012. mtDNA lineage analysis of mouse L-cell lines reveals the accumulation of multiple mtDNA mutants and intermolecular recombination. Genes Dev. 26:384–394. http ://dx .doi .org /10 .1101 /gad .175802 .111
Fiorenza, C.G., S.H. Chou, and C.S. Mantzoros. 2011. Lipodystrophy: pathophysiology and advances in treatment. Nat. Rev. Endocrinol. 7:137–150. http ://dx .doi .org /10 .1038 /nrendo .2010 .199
Garg, A. 2011. Clinical review#: Lipodystrophies: genetic and acquired body fat disorders. J. Clin. Endocrinol. Metab. 96:3313–3325. http ://dx .doi .org /10 .1210 /jc .2011 -1159
Gimble, J.M., A.J. Katz, and B.A. Bunnell. 2007. Adipose-derived stem cells for regenerative medicine. Circ. Res. 100:1249–1260. http ://dx .doi .org /10 .1161 /01 .RES .0000265074 .83288 .09
Gridley, T. 2010. Notch signaling in the vasculature. Curr. Top. Dev. Biol. 92:277–309. http ://dx .doi .org /10 .1016 /S0070 -2153(10)92009 -7
Gridley, T., and S. Kajimura. 2014. Lightening up a notch: Notch regulation of energy metabolism. Nat. Med. 20:811–812. http ://dx .doi .org /10 .1038 /nm .3650
Groszer, M., R. Erickson, D.D. Scripture-Adams, R. Lesche, A. Trumpp, J.A. Zack, H.I. Kornblum, X. Liu, and H. Wu. 2001. Negative regulation of neural stem/progenitor cell proliferation by the Pten tumor suppressor gene in vivo. Science. 294:2186–2189. http ://dx .doi .org /10 .1126 /science .1065518
Guruharsha, K.G., M.W. Kankel, and S. Artavanis-Tsakonas. 2012. The Notch signalling system: recent insights into the complexity of a conserved pathway. Nat. Rev. Genet. 13:654–666. http ://dx .doi .org /10 .1038 /nrg3272
Hatley, M.E., W. Tang, M.R. Garcia, D. Finkelstein, D.P. Millay, N. Liu, J. Graff, R.L. Galindo, and E.N. Olson. 2012. A mouse model of rhabdomyosarcoma originating from the adipocyte lineage. Cancer Cell. 22:536–546. http ://dx .doi .org /10 .1016 /j .ccr .2012 .09 .004
Huang-Doran, I., A. Sleigh, J.J. Rochford, S. O’Rahilly, and D.B. Savage. 2010. Lipodystrophy: metabolic insights from a rare disorder. J. Endocrinol. 207:245–255. http ://dx .doi .org /10 .1677 /JOE -10 -0272
Jeffery, E., R. Berry, C.D. Church, S. Yu, B.A. Shook, V. Horsley, E.D. Rosen, and M.S. Rodeheffer. 2014. Characterization of Cre recombinase models for the study of adipose tissue. Adipocyte. 3:206–211. http ://dx .doi .org /10 .4161 /adip .29674
Keung, E.Z., K.C. Akdemir, G.A. Al Sannaa, J. Garnett, D. Lev, K.E. Torres, A.J. Lazar, K. Rai, and L. Chin. 2015. Increased H3K9me3 drives dedifferentiated phenotype via KLF6 repression in liposarcoma. J. Clin. Invest. 125:2965–2978. http ://dx .doi .org /10 .1172 /JCI77976
on February 6, 2017
Dow
nloaded from
Published August 29, 2016
Notch signaling in liposarcoma | Bi et al.2036
Lee, K.Y., S.J. Russell, S. Ussar, J. Boucher, C. Vernochet, M.A. Mori, G. Smyth, M. Rourk, C. Cederquist, E.D. Rosen, et al. 2013. Lessons on conditional gene targeting in mouse adipose tissue. Diabetes. 62:864–874. http ://dx .doi .org /10 .2337 /db12 -1089
Liu, W., Y. Liu, X. Lai, and S. Kuang. 2012. Intramuscular adipose is derived from a non-Pax3 lineage and required for efficient regeneration of skeletal muscles. Dev. Biol. 361:27–38. http ://dx .doi .org /10 .1016 /j .ydbio .2011 .10 .011
Lobry, C., P. Oh, and I. Aifantis. 2011. Oncogenic and tumor suppressor functions of Notch in cancer: it’s NOT CH what you think. J. Exp. Med. 208:1931–1935. http ://dx .doi .org /10 .1084 /jem .20111855
Madisen, L., T.A. Zwingman, S.M. Sunkin, S.W. Oh, H.A. Zariwala, H. Gu, L.L. Ng, R.D. Palmiter, M.J. Hawrylycz, A.R. Jones, et al. 2010. A robust and high-throughput Cre reporting and characterization system for the whole mouse brain. Nat. Neurosci. 13:133–140. http ://dx .doi .org /10 .1038 /nn .2467
Moll, U.M., and O. Petrenko. 2003. The MDM2-p53 interaction. Mol. Cancer Res. 1:1001–1008.
Morley, T.S., J.Y. Xia, and P.E. Scherer. 2015. Selective enhancement of insulin sensitivity in the mature adipocyte is sufficient for systemic metabolic improvements. Nat. Commun. 6:7906. http ://dx .doi .org /10 .1038 /ncomms8906
Mortensen, S.B., C.H. Jensen, M. Schneider, M. Thomassen, T.A. Kruse, J. Laborda, S.P. Sheikh, and D.C. Andersen. 2012. Membrane-tethered delta-like 1 homolog (DLK1) restricts adipose tissue size by inhibiting preadipocyte proliferation. Diabetes. 61:2814–2822. http ://dx .doi .org /10 .2337 /db12 -0176
Moya-Camarena, S.Y., J.P. Vanden Heuvel, S.G. Blanchard, L.A. Leesnitzer, and M.A. Belury. 1999. Conjugated linoleic acid is a potent naturally oc-curring ligand and activator of PPARalpha. J. Lipid Res. 40:1426–1433.
Mullican, S.E., T. Tomaru, C.A. Gaddis, L.C. Peed, A. Sundaram, and M.A. Lazar. 2013. A novel adipose-specific gene deletion model demonstrates potential pitfalls of existing methods. Mol. Endocrinol. 27:127–134. http ://dx .doi .org /10 .1210 /me .2012 -1267
Murtaugh, L.C., B.Z. Stanger, K.M. Kwan, and D.A. Melton. 2003. Notch signaling controls multiple steps of pancreatic differentiation. Proc. Natl. Acad. Sci. USA. 100:14920–14925. http ://dx .doi .org /10 .1073 /pnas .2436557100
Muzumdar, M.D., B. Tasic, K. Miyamichi, L. Li, and L. Luo. 2007. A global double-fluorescent Cre reporter mouse. Genesis. 45:593–605. http ://dx .doi .org /10 .1002 /dvg .20335
Nakayama, R., T. Nemoto, H. Takahashi, T. Ohta, A. Kawai, K. Seki, T. Yoshida, Y. Toyama, H. Ichikawa, and T. Hasegawa. 2007. Gene expression analysis of soft tissue sarcomas: characterization and reclassification of malignant fibrous histiocytoma. Mod. Pathol. 20:749–759. http ://dx .doi .org /10 .1038 /modpathol .3800794
Ou, W.B., J. Zhu, G. Eilers, X. Li, Y. Kuang, L. Liu, A. Mariño-Enríquez, Z. Yan, H. Li, F. Meng, et al. 2015. HDACi inhibits liposarcoma via targeting of the MDM2-p53 signaling axis and PTEN, irrespective of p53 mutational status. Oncotarget. 6:10510–10520. http ://dx .doi .org /10 .18632 /oncotarget .3230
Pajvani, U.B., M.E. Trujillo, T.P. Combs, P. Iyengar, L. Jelicks, K.A. Roth, R.N. Kitsis, and P.E. Scherer. 2005. Fat apoptosis through targeted activation of caspase 8: a new mouse model of inducible and reversible lipoatrophy. Nat. Med. 11:797–803. http ://dx .doi .org /10 .1038 /nm1262
Pajvani, U.B., L. Qiang, T. Kangsamaksin, J. Kitajewski, H.N. Ginsberg, and D. Accili. 2013. Inhibition of Notch uncouples Akt activation from hepatic lipid accumulation by decreasing mTorc1 stability. Nat. Med. 19:1054–1060. http ://dx .doi .org /10 .1038 /nm .3259
Peng, T., P. Zhang, J. Liu, T. Nguyen, S. Bolshakov, R. Belousov, E.D. Young, X. Wang, K. Brewer, D.H. López-Terrada, et al. 2011. An experimental model for the study of well-differentiated and dedifferentiated
liposarcoma; deregulation of targetable tyrosine kinase receptors. Lab. Invest. 91:392–403. http ://dx .doi .org /10 .1038 /labinvest .2010 .185
Pettersson, S., M. Sczaniecka, L. McLaren, F. Russell, K. Gladstone, T. Hupp, and M. Wallace. 2013. Non-degradative ubiquitination of the Notch1 receptor by the E3 ligase MDM2 activates the Notch signalling pathway. Biochem. J. 450:523–536. http ://dx .doi .org /10 .1042 /BJ20121249
Puzio-Kuter, A.M., S.V. Laddha, M. Castillo-Martin, Y. Sun, C. Cordon-Cardo, C.S. Chan, and A.J. Levine. 2015. Involvement of tumor suppressors PTEN and p53 in the formation of multiple subtypes of liposarcoma. Cell Death Differ. 22:1785–1791. http ://dx .doi .org /10 .1038 /cdd .2015 .27
Rosen, E.D., and O.A. MacDougald. 2006. Adipocyte differentiation from the inside out. Nat. Rev. Mol. Cell Biol. 7:885–896. http ://dx .doi .org /10 .1038 /nrm2066
Safar Zadeh, E., A.O. Lungu, E.K. Cochran, R.J. Brown, M.G. Ghany, T. Heller, D.E. Kleiner, and P. Gorden. 2013. The liver diseases of lipodystrophy: the long-term effect of leptin treatment. J. Hepatol. 59:131–137. http ://dx .doi .org /10 .1016 /j .jhep .2013 .02 .007
Sczaniecka, M., K. Gladstone, S. Pettersson, L. McLaren, A.S. Huart, and M. Wallace. 2012. MDM2 protein-mediated ubiquitination of numb protein: identification of a second physiological substrate of MDM2 that employs a dual-site docking mechanism. J. Biol. Chem. 287:14052–14068. http ://dx .doi .org /10 .1074 /jbc .M111 .303875
Smith, K.B., L.M. Tran, B.M. Tam, E.M. Shurell, Y. Li, D. Braas, W.D. Tap, H.R. Christofk, S.M. Dry, F.C. Eilber, and H. Wu. 2013. Novel dedifferentiated liposarcoma xenograft models reveal PTEN down-regulation as a malignant signature and response to PI3K pathway inhibition. Am. J. Pathol. 182:1400–1411. http ://dx .doi .org /10 .1016 /j .ajpath .2013 .01 .002
Starley, B.Q., C.J. Calcagno, and S.A. Harrison. 2010. Nonalcoholic fatty liver disease and hepatocellular carcinoma: a weighty connection. Hepatology. 51:1820–1832. http ://dx .doi .org /10 .1002 /hep .23594
Stern, J.H., and P.E. Scherer. 2015. Adipose tissue biology in 2014: Advances in our understanding of adipose tissue homeostasis. Nat. Rev. Endocrinol. 11:71–72. http ://dx .doi .org /10 .1038 /nrendo .2014 .219
Subramanian, A., P. Tamayo, V.K. Mootha, S. Mukherjee, B.L. Ebert, M.A. Gillette, A. Paulovich, S.L. Pomeroy, T.R. Golub, E.S. Lander, and J.P. Mesirov. 2005. Gene set enrichment analysis: a knowledge-based approach for interpreting genome-wide expression profiles. Proc. Natl. Acad. Sci. USA. 102:15545–15550. http ://dx .doi .org /10 .1073 /pnas .0506580102
Tao, J., M.M. Jiang, L. Jiang, J.S. Salvo, H.C. Zeng, B. Dawson, T.K. Bertin, P.H. Rao, R. Chen, L.A. Donehower, et al. 2014. Notch activation as a driver of osteogenic sarcoma. Cancer Cell. 26:390–401. http ://dx .doi .org /10 .1016 /j .ccr .2014 .07 .023
Thway, K., R. Flora, C. Shah, D. Olmos, and C. Fisher. 2012. Diagnostic utility of p16, CDK4, and MDM2 as an immunohistochemical panel in distinguishing well-differentiated and dedifferentiated liposarcomas from other adipocytic tumors. Am. J. Surg. Pathol. 36:462–469. http ://dx .doi .org /10 .1097 /PAS .0b013e3182417330
Tontonoz, P., E. Hu, and B.M. Spiegelman. 1994. Stimulation of adipogenesis in fibroblasts by PPAR gamma 2, a lipid-activated transcription factor. Cell. 79:1147–1156. http ://dx .doi .org /10 .1016 /0092 -8674(94)90006 -X
Tontonoz, P., S. Singer, B.M. Forman, P. Sarraf, J.A. Fletcher, C.D. Fletcher, R.P. Brun, E. Mueller, S. Altiok, H. Oppenheim, et al. 1997. Terminal differentiation of human liposarcoma cells induced by ligands for peroxisome proliferator-activated receptor gamma and the retinoid X receptor. Proc. Natl. Acad. Sci. USA. 94:237–241. http ://dx .doi .org /10 .1073 /pnas .94 .1 .237
Tseng, W.W., N. Somaiah, A.J. Lazar, D.C. Lev, and R.E. Pollock. 2013. Novel systemic therapies in advanced liposarcoma: a review of recent clinical
on February 6, 2017
Dow
nloaded from
Published August 29, 2016
2037JEM Vol. 213, No. 10
trial results. Cancers (Basel). 5:529–549. http ://dx .doi .org /10 .3390 /cancers5020529
Valenti, L., R.M. Mendoza, R. Rametta, M. Maggioni, C. Kitajewski, C.J. Shawber, and U.B. Pajvani. 2013. Hepatic notch signaling correlates with insulin resistance and nonalcoholic fatty liver disease. Diabetes. 62:4052–4062. http ://dx .doi .org /10 .2337 /db13 -0769
Varga, T., Z. Czimmerer, and L. Nagy. 2011. PPARs are a unique set of fatty acid regulated transcription factors controlling both lipid metabolism and inflammation. Biochim. Biophys. Acta. 1812:1007–1022. http ://dx .doi .org /10 .1016 /j .bbadis .2011 .02 .014
Villanueva, A., C. Alsinet, K. Yanger, Y. Hoshida, Y. Zong, S. Toffanin, L. Rodriguez-Carunchio, M. Solé, S. Thung, B.Z. Stanger, and J.M. Llovet. 2012. Notch signaling is activated in human hepatocellular carcinoma and induces tumor formation in mice. Gastroenterology. 143:1660–1669.e7. http ://dx .doi .org /10 .1053 /j .gastro .2012 .09 .002
Weng, A.P., A.A. Ferrando, W. Lee, J.P. Morris IV, L.B. Silverman, C. Sanchez-Irizarry, S.C. Blacklow, A.T. Look, and J.C. Aster. 2004. Activating mutations of NOT CH1 in human T cell acute lymphoblastic leukemia. Science. 306:269–271. http ://dx .doi .org /10 .1126 /science .1102160
Wirbisky, S.E., G.J. Weber, M.S. Sepúlveda, C. Xiao, J.R. Cannon, and J.L. Freeman. 2015. Developmental origins of neurotransmitter and transcriptome alterations in adult female zebrafish exposed to atrazine during embryogenesis. Toxicology. 333:156–167. http ://dx .doi .org /10 .1016 /j .tox .2015 .04 .016
Zhang, P., K. Bill, J. Liu, E. Young, T. Peng, S. Bolshakov, A. Hoffman, Y. Song, E.G. Demicco, D.L. Terrada, et al. 2012. MiR-155 is a liposarcoma oncogene that targets casein kinase-1α and enhances β-catenin signaling. Cancer Res. 72:1751–1762. http ://dx .doi .org /10 .1158 /0008 -5472 .CAN -11 -3027
on February 6, 2017
Dow
nloaded from
Published August 29, 2016