Not Just Another Pie in the Sky
11
1 COLD COFFEES, 10-PINS & THE QUEST FOR POCKET MONEY 1
-
Upload
sanket-nadhani -
Category
Documents
-
view
132 -
download
4
description
Come hear the story of how FusionCharts went from a quest for more pocket money a company that has 20,000 customers and 450,000 users in 118 countries, powers over a billion charts per month and does $7M in annual revenues. "I really enjoyed the FusionCharts story. Great stuff! Loved the writing style." ~ Derek Sivers, Founder of CD Baby and Author of Anything You Want
Transcript of Not Just Another Pie in the Sky
1
COLD COFFEES, 10-PINS& THE QUEST FORPOCKET MONEY
1
2
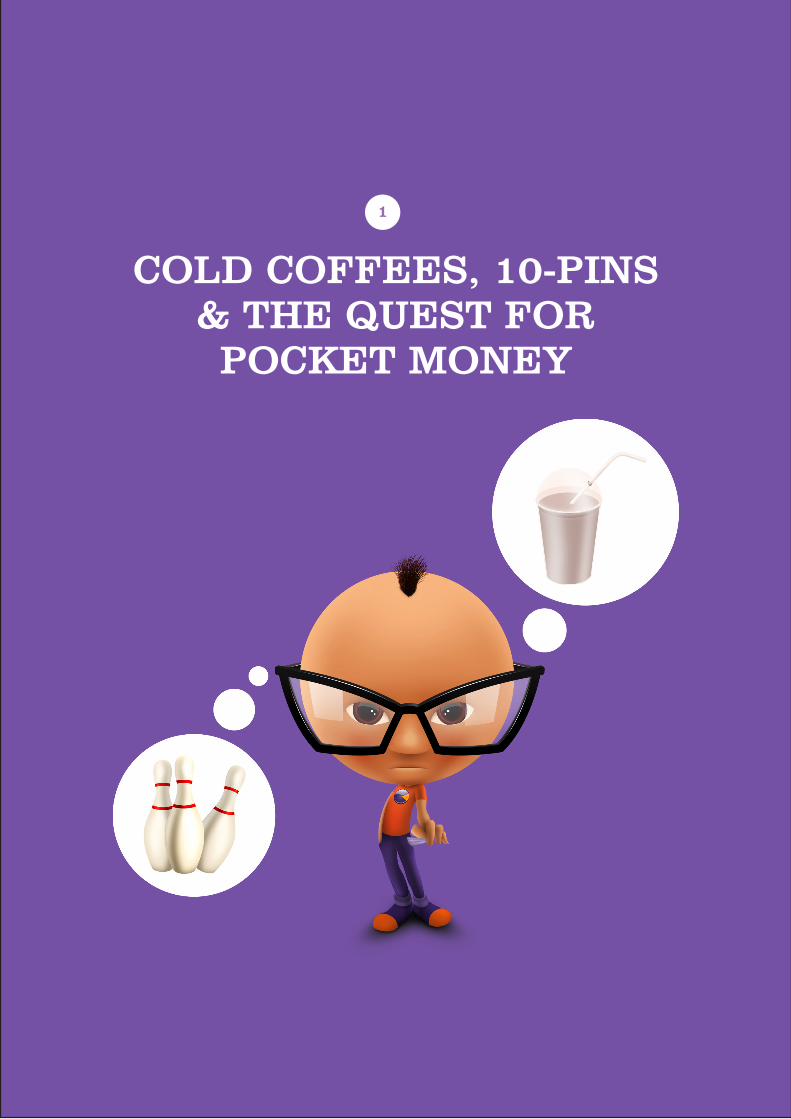
It was 2001. Pallav Nadhani, a bubbling 16-year old, was in high school. Like any other teenager back in the day, he wanted to go bowling and sip cold coffee in cafés. In the hot
and humid Kolkata, cold coffees are always a good idea. It’s just that the boy didn’t really care much about the coffee. He was there for the cute girls that hung around in these cafés.
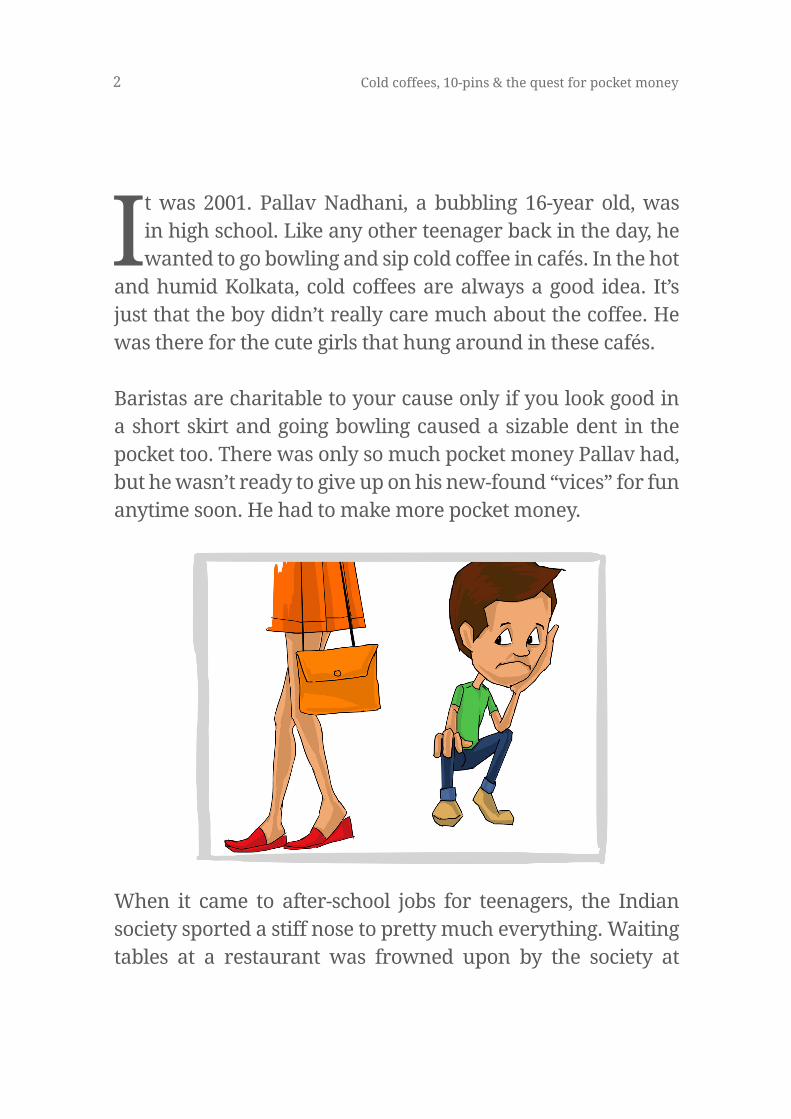
Baristas are charitable to your cause only if you look good in a short skirt and going bowling caused a sizable dent in the pocket too. There was only so much pocket money Pallav had, but he wasn’t ready to give up on his new-found “vices” for fun anytime soon. He had to make more pocket money.
When it came to after-school jobs for teenagers, the Indian society sported a stiff nose to pretty much everything. Waiting tables at a restaurant was frowned upon by the society at
Cold coffees, 10-pins & the quest for pocket money
3
large, as was working in a mall. Nobody from a respected family did that, and more importantly, nobody gave teenagers a job. Teenagers went to school, studied hard and attended a good college to become an engineer or a doctor. When they weren’t studying, they played cricket and discussed the state of Indian cricket as if it was a fundamental duty mentioned in the Constitution. But we digress. Essentially, teenagers had to make do with whatever pocket money they got. Pallav wasn’t exactly ready for that.
Meanwhile in the world of Information Technology, the landscape was changing. The era of eager investors putting sacks of money into online pet-supply stores and grocery delivery business was over. The world was coming out of the dotcom hangover and was ready to experiment with new technologies. And users were ready to pay money for things that solved an actual problem.
Pallav had been helping with the web development arm of his dad’s firm for a couple of years now, which developed websites for local businesses. While at it, he got a pretty good hold of creating dynamic websites in ASP and jazzy animations in Macromedia Flash 4. Concocting these two technologies together could yield interesting results; he just needed to create something useful that people would pay for.
While the search was on, he chanced upon a website called ASPToday. The website paid handsomely for writing articles
Cold coffees, 10-pins & the quest for pocket money
4
that talked about how to do cool stuff with ASP. Handsomely meant anything from $600 to $1,500 depending on the size and usefulness of the article. This was a godsend.
The idea for the article struck quickly too. Pallav was sick and tired of the boring charts Microsoft Excel generated, someth-ing he had seen and made tons of for his school projects. Flash was jazzy, Flash was fun. Why not use it to make sexy animated charts for web applications? And ASP could then help connect the charts to databases, thus making it actually useful. What people were using those days were bulky components that put a heavy load on the web servers, and generated boring output at the end of it all. This was it.
He wrote a long article on how to combine the very-very-business ASP with the hey-how-you-doing Flash to create animated charts for web applications. The concoction was a first to create charts for web applications. He sent the article to the ASPToday guys at the end of 2001, who published it on their website and featured it on the homepage for a week as well. Developers hanging out on the website were intrigued by the idea and liked the output. Most importantly, $1,500 hit the bank. One thousand five hundred dollars!
The ASPToday community also started suggesting feature additions that Pallav could make. Not having much to do after school, he started working on these features and bounced them off with the techies who had suggested them. They quite
Cold coffees, 10-pins & the quest for pocket money
5
liked what they saw, and soon the idea of converting it into a
product started germinating.
The pre-cursor to FusionCharts
At the start of 2002, Pallav began work on converting his find into a product. Specifically, a product he could sell in the market. The only business learnings he had were the pickings from his dad’s web development business. Unlike today, not every startup was telling every other startup how to a run a startup in those days. The web was a small place with limited business lessons, so this was going to be an experiment. And Pallav was determined to run with it.
By March, all the coding was done and it was time to get ready for the launch.
He put together a 12-page documentation on how to use the product. While it sounds like a hastily done job, it was all of what you needed to get the charts up and running. His dad had a website that offered web development services for local businesses, and sold accounting and payroll-related software. Even though there was no overlap between the two target markets, he didn’t have to pay for a domain name and web hosting. A penny saved was a penny earned for the boy.
He decided to call the product fXgraph for a reason he doesn’t remember today, except that it sounded cool back then. Heck,
Cold coffees, 10-pins & the quest for pocket money
6
it sounds pretty cool even now.
It was time to figure out two more things and get rolling. How much should the software cost and how should the money be collected, in that order. The order that was ultimately followed was the exact opposite. Since Pallav didn’t know how the complex world of finance works and that too with the plethora of rules and regulations in India, he sought his dad’s help. Kisor, Pallav’s and your dear author’s dad, recommended having two payment options — checks, just like his business had all these years, and online through credit cards.
They started looking for an online payment gateway. They identified a company called Virtual Software Store that charg-ed a hefty 25% fee for processing online payment in addition to the bank remittance fees but back then, they didn’t know better. Now on to the final barrier, the price. They wanted to keep the software low-priced but without any international exposure as such, they couldn’t exactly place a finger on what was low. Luckily for them, the price chose itself. The lowest a software could be priced on the Virtual Software Store was $15, and that was chosen as the price for fXgraph. They also introduced another version at $49 for people who wanted to buy the source code of fXgraph. The idea behind making the source code available for purchase was that people would feel safe about their purchase — even if fXgraph went down under, they could keep their charting up-to-date by building on the source code. Nobody was really going to buy the $49 version
Cold coffees, 10-pins & the quest for pocket money
7
— it was a lot of money to pay for a charting component but just in case. The $15 version was called the User Edition and the $49 version the Developer Edition. There was one small problem, however.
Virtual Software Store required a $29 setup fee. Not only was that a reasonably big amount for a setup, neither Pallav nor Kisor had a credit card. They decided to get started with checks itself, and that they would come back to the online payment option if there were enough people asking for it.
fXgraph was launched in April. The first version had four chart types. You could toggle between the chart types using icons at the top to see the same data represented in different forms. Supposedly, each of these different forms gave you different insights into your data and animated the chart again — something that was so fancy people would want to see it all day long.
To promote fXgraph, Pallav wrote articles on technical sites talking about how to combine the very-very-business ASP with the hey-how-you-doing Flash to create animated charts for web
The idea behind making the source code available for purchase was that people would
feel safe about their purchase.
Cold coffees, 10-pins & the quest for pocket money
8
applications. All the articles started with how a picture is worth a thousand words, but thankfully, you had a different chart type at the end. He also got in touch with the developers he had met on ASPToday, and told them that he had a complete product now. That’s all the marketing he knew, and that’s all the marketing he did.
In mid-April, a fine gentleman from the US wrote to him with an intent to purchase the User Edition. Pallav still recalls that as the sweetest email anyone has ever written to him. The gentleman was asked to send a check for $15. So there it was. First customer in the bag and many more to come. The check was received in a fortnight and deposited in the bank. Pallav started checking his bank balance every day to see the princely increase in his bank balance. Nothing happened for a fortnight, but boys are boys. He kept at it and finally there was a change.
The bank balance had gone down by $20.
Quite clearly something had gone wrong. He muttered a few solemn words about the bank’s proficiency and called them up. “There has been a goof-up. I deposited a check for $15 a fortnight back, and today my bank balance shows it’s gone down by $20. Can you fix that real quick?” Then he added proudly, “The check came from the US, you know.” “Sir there has been no goof-up. Our clearance fee for an international check is $35, which was deducted from the amount deposited,”
Cold coffees, 10-pins & the quest for pocket money
9
the bank representative replied. She probably empathized with him as well, but those words were lost out on him. So there it was. First customer in the bag and a loss to be had.
The next day, Pallav borrowed his uncle’s credit card and set up the online payment gateway.
Fortunately for him, two more people decided to buy Developer Editions of fXgraph in the same month, and he turned a profit in the first month itself.
Cold coffees, 10-pins & the quest for pocket money
10
The word about fXgraph had started going out, slowly but surely. Pallav was in constant touch with the early downloaders and customers, and they had started sending their feature requests. He got to work on the new features. Being a small and simple product, the release cycles were small and fXgraph went from v1 to v4 in a couple of months.
A steady stream of a couple of hundred dollars was coming in per month, but Pallav was soon moving out from high school to college, and his needs were going to increase. He decided to turn it up a notch.
In July, instead of fXgraph, he launched fXgraph 3D. As the name suggests, fXgraph 3D was supposed to redefine the world of charting with its stunning 3D charts. The first version start-ed small with only a 3D column chart, the column chart being the most commonly used chart type. He put it out in the market and waited for the customers to pour in.
There were no takers.
Pallav was quick to realize what had gone wrong. fXgraph 3D had only one chart type, which didn’t cover even the basic charting needs of people.
He decided to go back to work on the 2D version itself.
Given how disastrous the 3D experiment had been, fXgraph v6
Cold coffees, 10-pins & the quest for pocket money
11
would be regarded as yet another candy factory experiment gone wrong. He had also come to know that very few people were using the chart toggle option to look at the same data. In fact, the choice of chart depended on what kind of analysis you wanted to perform on your data and switching to another chart was wrong by its very fundamentals.
A new type of charting component had to be built. Nothing would change drastically. It would have the new features that fXgraph customers had been asking for, each chart would be a separate file and most importantly, it would have a new name. It would be called FusionCharts.
Like what you read? It only gets better from here. Read how we launched FusionCharts, got to 10,000 customers even without a salesperson, and then got Barack Obama to use our charts. And yes, how Mr. Jobs made a huge dent in our universe.
Go ahead and get yourself a copy of the complete book — Not Just Another Pie In The Sky - from www.fusioncharts.com/story
Cold coffees, 10-pins & the quest for pocket money