
Lowe Hardware is a family operation. Started by Bill Lowe ...
Upload
buck-copelandCategory
view
224download
4
NORWAY High Speed RailwayPhase III Initial Option Testing
Atkins: Warwick Lowe

2
Corridors
● 4 corridors and 6 routes:– Corridor North
● Oslo – Trondheim
– Corridor South● Oslo – Stavanger
– Corridor West● Bergen – Stavanger
● Oslo – Bergen
– Corridor East● Oslo – Gothenburg
● Oslo – Stockholm
● Routes and stopping patterns have been informed by alignment designs
Hamar
Lillehammer
Kristiansand
Stavanger
Haugesund
Bergen
Trondheim
Oslo
Sarpsborg/FredrikstadPorsgrunn/Skien
Sandnes
Geilo
Arendal
Voss
Stord
Odda
Værnes
Gjøvik
Gardermoen
Mandal
Egersund
Notodden
Hønefoss
Oppdal
Tynset
Støren
Otta
Kongsberg Ski
DrammenLillestrøm

3
Purpose and scope of presentationPresent initial set of options and results for Scenario D options:
● Hourly (only) core HSR service: community access + attractive end-to-end journey time
● Notional timetable: ● Stopping pattern● Journey times
● Note this service could be supplemented by faster peak services and extra community orientated services.
● Results are from the first iteration of Phase 3
● Basis for refinement of route and station stops for work going forward

4
Key notes to forecasts
● Demand forecasts presented are for year 2024 ● HSR rail fares modelled at initial 60% of average air fare
(phase 2 Min’= 100% & Max’ = 60%)
● Journey Times based on preliminary timetable – core hourly service● Only captures “long distance” journeys of 100km or more● Focus on journeys to termini and does not capture HSR
intermediate to intermediate station demand ● Primary source of demand is the air market - assumes no
competitive response by air
● Assumptions adopted are for initial testing● Refinements and sensitivity testing in coming months
● Forecasts not at this stage capturing the full market for HSR

5
The Process – Iterative Market Analysis
JBV LIST OF ROUTES AND STOPS
IDENTIFYING “FIXED” STOPS
STOPPING PATTERN AND JOURNEY TIME
JBV DESIGN ASSUMPTIONS
TRAIN PERFORMANCE ASSUMPTIONS
CRITERIA FOR ASSESSING STOPS
STOP ANALYSIS AND RECOMMENDATIONS
ROUTE JOURNEY TIME MODEL
ALIGNMENTDISTANCES /
CHARACTERISTICS
SERVICE STOPPING PATTERN
PROPOSED CORE HSR SERVICE SPECIFICATION
AND JOURNEY TIME
IDENTIFY ADDITONAL HSR SERVICES IN
TIMETABLE
PROPOSED HSR SERVICE SPECIFICATION
FOR TESTING
CONSIDER POTENTIAL IMPACT
ON CAPTURE OF KEY MARKET DEMAND AND
REVENUE
WE ARE HERE
TESTING FOR DEMAND / REVENUE

6
Criteria used for categorising stopsAim:● To provide excellent community access and attractive journey times
with sensible stop spacing
● Process adopted to assess potential stops and place into one of 3 categories - Category 1 most attractive, Category 3 least attractive
● Category 1 stops assumed “fixed” for hourly core HSR service– Population served
● Higher than c.50,000 Category 1
● Between c.10,000 - c.50,000 Category 2
● Less than c.10,000 Category 3
– NSB station usage per year● Higher than c.500,000 Category 1
● Between c.100,000 - c.500,000 Category 2
● Less than c.100,000 Category 3
● Category 2 stops also “fixed” - some additional aspects also considered first to determine Category 2 stops....

7
Criteria used for identifying stops● Proximity to other potential fixed stops– Not located within c.20km of (higher category) stop
● Connectivity aspects considered– Is the station well connected to serve multiple very small communities that would
otherwise not be served?– Does the station serve an airport?– Is the station near a major sea port?– Is the station served by commuter rail services?– Is the station near a motorway / major road / highway intersection?– Is there a coach terminal near the station?
● Also informed by Alignment Teams view on engineering feasibility
● Core Hourly HSR Service to serve feasible Category 1 and 2 stops
● Market analysis iterations will further inform and refine stop patterns

8
HSR Service Journey Time Model ● A flexible spreadsheet model has been developed that enables
relatively quick stopping pattern and journey time analysis
● Sophistication is scalable to utilise available alignment and operational performance information as it evolves
● Utilises preliminary route alignment stop to stop distances and view on achievable operating speeds from alignment teams
● Assumptions on train performance adopted reflect actual HSR train performance specifications / characteristics
● HSR
Speed km/h
Accel. Time/ Distance
0-100 0.63 44s/ 646m
0-200 0.37 120s/3920m
0-300 0.14 318s/17900m
Assumption Remarks
Linear acceleration Different acceleration rates estimated for each speed range
No Constraints No infrastructure of operational constraints assumed
Dwell Time 2min Dwell time of 2mins assumed for all stops

9
Initial Set of Core Service Routes and Journey Times for Testing
Route / alignment Frequency Stops Journey Time
Oslo – Trondheim (Hamar & Gudbrandsdalen)
1 train per hour
Gardermoen, Hamar, Lillehammer, Otta, Oppdal, Støren, Trondheim, Værnes
2:56
Oslo – Stavanger(via Kristiansand)
1 train per hour
Drammen, Porsgrunn, Arendal, Kristiansand, Mandal, Egersund, Sandnes, Stavanger
2:53
Oslo – Bergen(Numedal)
1 train per hour
Drammen, Kongsberg, Geilo, Voss, Bergen
2:27
Bergen – Stavanger (via Stord)
1 train per hour
Stord, Haugesund, Stavanger 1:18
Oslo - Gothenburg Corridor journey times under review – testing to follow confirmation
Oslo - Stockholm
10
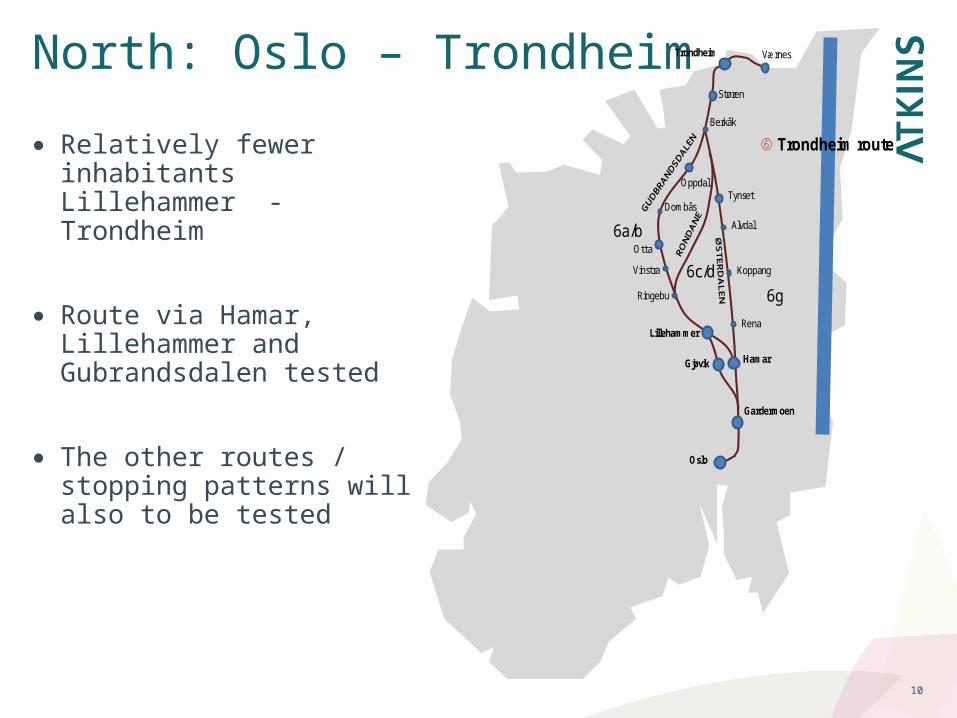
North: Oslo – Trondheim
● Relatively fewer inhabitants Lillehammer - Trondheim
● Route via Hamar, Lillehammer and Gubrandsdalen tested
● The other routes / stopping patterns will also to be tested
Hamar
Lillehammer
Gardermoen
Trondheim
Oslo
Otta
Værnes
Gjøvik
Trondheim route
6a/b
6c/d
6g
Dombås
Vinstra
Ringebu
Oppdal
Berkåk
Støren
Rena
Koppang
Alvdal
Tynset

11
North: Oslo – Trondheim
Trondheim (via Gubrandsdalen ) 2024
Journey Times hr:min
Total Long Distance Rail Market
HSR % of Total Long Distance Rail (core hourly service only)
Phase 2 Min 2:55 2,759,000 65%
Max 2:55 3,160,000 70%
Equiv. Initial Phase 3 Forecast
Max 2:46 3,937,000 76%

12
South: Oslo - Stavanger● Route 3b direct from Drammen to Porsgrunn/Skien tested● Porsgrunn HSR station may be at Skien due to alignment constraints
Stavanger route
Kristiansand
Stavanger
Oslo
Porsgrunn/Skien
SandnesArendal
Drammen
Tønsberg
3b3a
Egersund
Mandal
Lillesand Grimstad
Risør
Kragerø

13
South: Oslo - Stavanger
Stavanger (via K’sand) 2024 Journey Times hr:min
Total Long Distance Rail Market
HSR % of Total Long Distance Rail (core hourly service only)
Phase 2 Min 2:50 3,261,000 60%
Max 2:50 4,364,000 71%
Equiv. Initial Phase 3 Forecast
Max 2:53 4,913,000 74%

14
West: Oslo - Bergen● Numedal & via Stord used for initial testing● Alignment constraints preclude serving Finse & Myrdal on Oslo-Bergen
route● Alignment constraints preclude serving Os on Bergen-Stavanger route
Stavanger
Haugesund
Bergen
Oslo
Geilo
Voss
Stord
Odda
Bø
Bergen route Bergen –Stavanger route
Drammen
Hønefoss
Kongsberg
5a
5b
5c
4a4b
Notodden
Arna
Seljord
Sauda
Ǻmot
Haukeligrend
Nesbyen
GolǺl

15
West: Oslo-Bergen
Bergen (via Numedal) 2024 Journey Time hr:min
Total Long Distance Rail Market
HSR % of Total Long Distance Rail (core hourly service only)
Phase 2 Min 2:40 2,137,000 72%
Max 2:40 3,045,000 81%
Equiv. Initial Phase 3 Forecast
Max 2:27 3,659,000 85%

16
West: Bergen-Stavanger
Bergen (via Numedal) 2024 Journey Time hr:min
Total Long Distance Rail Market
HSR % of Total Long Distance Rail (core hourly service only)
Phase 2 Min 1:45 739,000 100%
Max 1:45 922,000 100%
Equiv. Initial Phase 3 Forecast
Max 1:18 922,000 100%
17
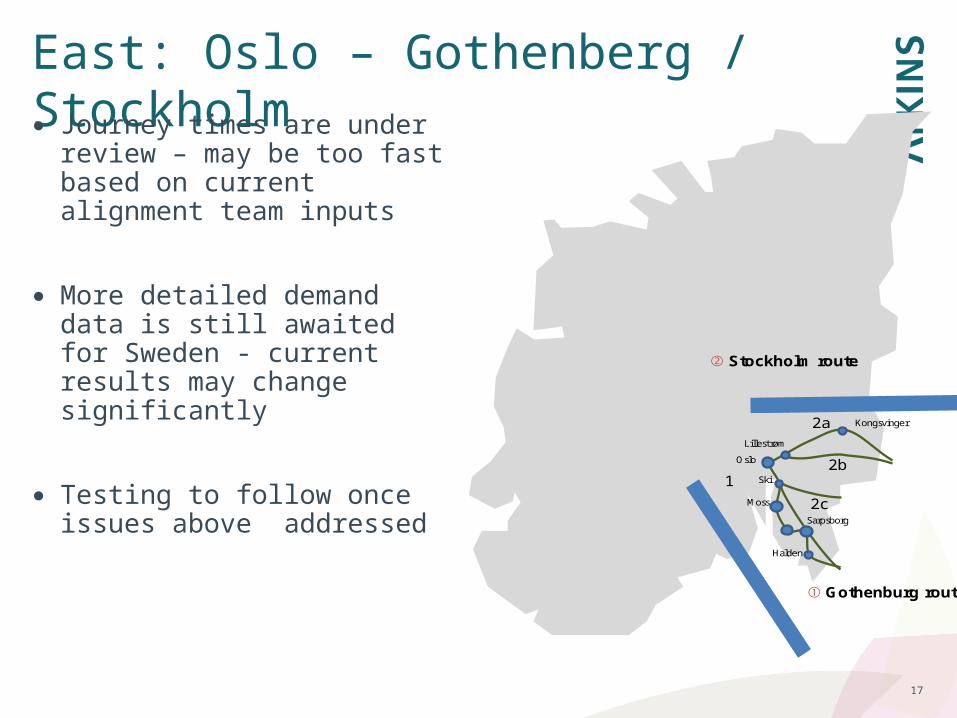
East: Oslo – Gothenberg / Stockholm● Journey times are under review
– may be too fast based on current alignment team inputs
● More detailed demand data is still awaited for Sweden - current results may change significantly
● Testing to follow once issues above addressed Kongsvinger
Oslo
Sarpsborg
Halden
Moss
Stockholm route
Lillestrøm
Gothenburg route
Ski
2a
12b
2c

18
Conclusions and Next Steps ● Additional intermediate stops and in some cases reduced journey
times in Phase 3 has enhanced HSR’s market potential● HSR demand increased by up to 36% compared to Phase 2
● HSR forecasts at this time still significantly underestimate demand:● Intermediate to intermediate station demand ● Journeys <100km● Impact of improved feeder networks● Swedish surface demand● Impact of extra fast (peak) and extra community HSR services
● Process of enhancing the models to capture the above is underway
● Journey times and timetables will reflect evolving alignment designs● Other Scenarios to also be tested● Sensitivity testing with respect to fares, alternative timetables etc.● Headline economic and financial appraisal results to follow