Northwest Territories Energy Report
56
Energy Report Northwest Territories May 2011
Transcript of Northwest Territories Energy Report
Ministers Message
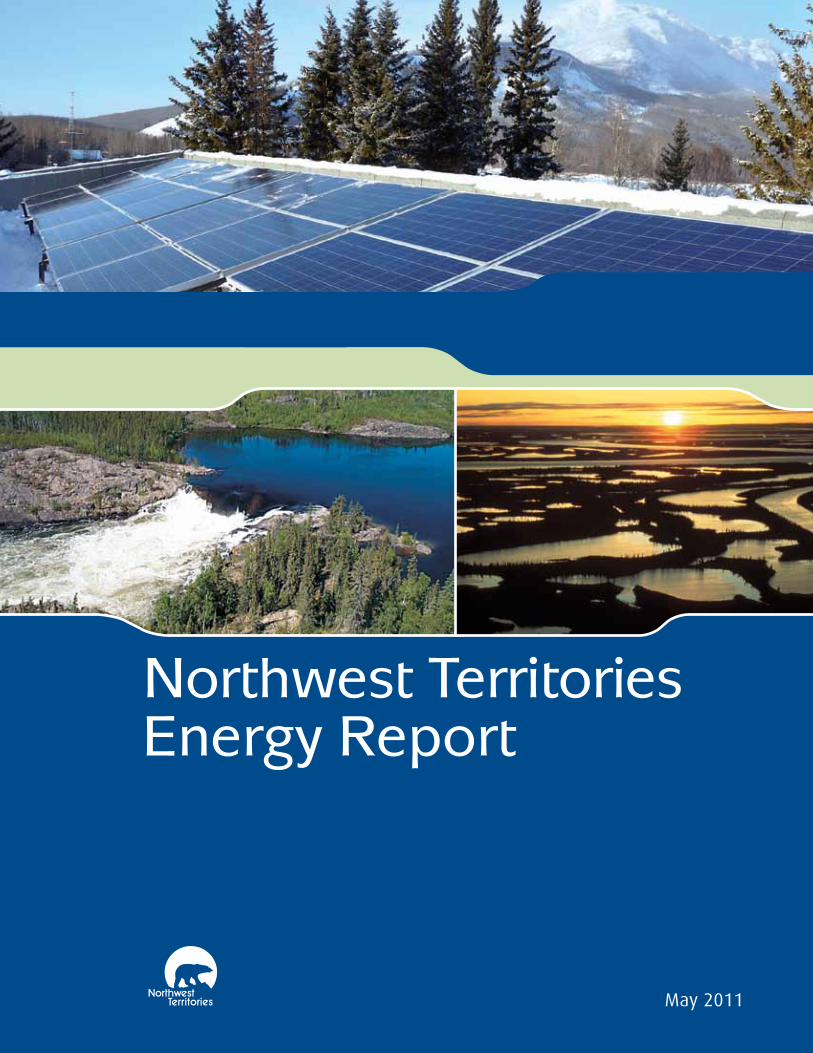
Energy ReportNorthwest Territories
May 2011
For further information, please contact:
Email: [email protected]
Mail: Energy Planning Industry, Tourism and Investment Government of the Northwest Territories P.O. Box 1320 Yellowknife, NT X1A 2L9 Canada
Fax: Energy Planning: (867) 873-0101
www.nwtenergy.ca
Top Picture: A 4.8 kilowatt grid-tied photovoltaic array on top of the Nahanni Butte community gymnasium.
Left Picture: Natalkai Falls on the Taltson River.
Right Picture: Aerial of Mackenzie Delta at sunset (M. Milne/GNWT).
Ministers Message
1
MINISTERS’ MESSAGE ...........................................................................................................................3
INTRODUCTION .....................................................................................................................................4
ENVIRONMENTAL SCAN .......................................................................................................................5
1. Greenhouse Gas Emissions and Energy Consumption .........................................................6
2. Electrical Generation ................................................................................................................7
3. Community Energy Costs ........................................................................................................9
4. Oil and Gas Resources .......................................................................................................... 11
5. Hydro Resources .................................................................................................................... 13
6. Solar Resources ..................................................................................................................... 14
7. Wind Resources ..................................................................................................................... 15
8. Biomass Resources ............................................................................................................... 17
9. Geothermal Resources ......................................................................................................... 18
10. Energy Structure .................................................................................................................. 20
GNWT ENERGY PROJECTS AND PROGRAMS ..................................................................................... 21
PILLAR 1: ENERGY DEVELOPMENT AND SUPPLY .............................................................................. 23
1. Łutselk’e Mini-Hydro Project ................................................................................................ 24
2. La Martre Hydro Development ............................................................................................ 25
3. Sahtu Hydro Development .................................................................................................. 26
4. Fort Providence Transmission Line Extension .................................................................... 27
5. Taltson Hydro Expansion Project ......................................................................................... 28
6. NWT Hydro Strategy.............................................................................................................. 28
7. Natural Gas Conversion ........................................................................................................ 30
PILLAR 2: ALTERNATIVE ENERGY AND EMERGING TECHNOLOGIES ................................................. 31
1. Solar Energy Development .................................................................................................. 32
2. Biomass Strategy Implementation ..................................................................................... 33
3. Wind Energy Development .................................................................................................. 34
4. Geothermal Energy Development ...................................................................................... 35
5. Alternative Energy Technologies Program ......................................................................... 36
6. Hydrokinetic Development .................................................................................................. 37
Table of Contents
2Northwest territories eNergy report – May 2011
Ministers Message Table of Contents
PILLAR 3: ENERGY CONSERVATION AND EFFICIENCY ....................................................................... 38
1. Community Energy Plans ..................................................................................................... 39
2. Increased Presence of the Arctic Energy Alliance.............................................................. 41
3. Energy Efficiency Incentive Program .................................................................................. 42
4. EnerGuide for Houses Program ........................................................................................... 43
5. Commercial Energy Conservation and Efficiency............................................................... 43
6. Energy Information and Awareness ................................................................................... 44
7. Energy Conservation Program ............................................................................................. 45
8. Expansion of Residual Heat Recovery ................................................................................. 45
PILLAR 4: REDUCING GNWT ENERGY USE ........................................................................................ 46
1. Wood Pellet Boilers............................................................................................................... 47
2. Capital Asset Retrofit Fund ................................................................................................... 48
3. Energy Efficiency for Public Housing ................................................................................... 49
PILLAR 5: ENERGY POLICY AND PLANNING ..................................................................................... 50
CONCLUSION ...................................................................................................................................... 52
ACRONYM GLOSSARY ............................................................................................... Inside back cover
Ministers Message
3
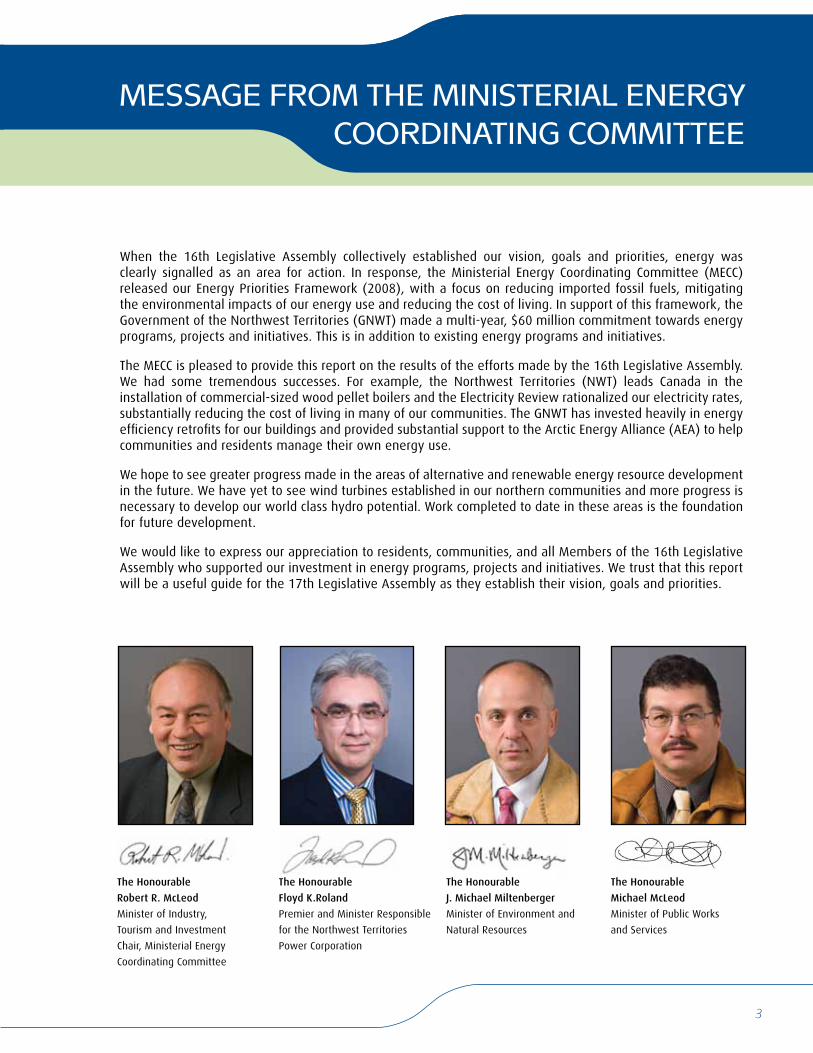
MEssagE FRoM ThE MiNisTERial ENERgy CooRdiNaTiNg CoMMiTTEE
When the 16th Legislative Assembly collectively established our vision, goals and priorities, energy was clearly signalled as an area for action. In response, the Ministerial Energy Coordinating Committee (MECC) released our Energy Priorities Framework (2008), with a focus on reducing imported fossil fuels, mitigating the environmental impacts of our energy use and reducing the cost of living. In support of this framework, the Government of the Northwest Territories (GNWT) made a multi-year, $60 million commitment towards energy programs, projects and initiatives. This is in addition to existing energy programs and initiatives.
The MECC is pleased to provide this report on the results of the efforts made by the 16th Legislative Assembly. We had some tremendous successes. For example, the Northwest Territories (NWT) leads Canada in the installation of commercial-sized wood pellet boilers and the Electricity Review rationalized our electricity rates, substantially reducing the cost of living in many of our communities. The GNWT has invested heavily in energy efficiency retrofits for our buildings and provided substantial support to the Arctic Energy Alliance (AEA) to help communities and residents manage their own energy use.
We hope to see greater progress made in the areas of alternative and renewable energy resource development in the future. We have yet to see wind turbines established in our northern communities and more progress is necessary to develop our world class hydro potential. Work completed to date in these areas is the foundation for future development.
We would like to express our appreciation to residents, communities, and all Members of the 16th Legislative Assembly who supported our investment in energy programs, projects and initiatives. We trust that this report will be a useful guide for the 17th Legislative Assembly as they establish their vision, goals and priorities.
The Honourable
Robert R. McLeod
Minister of Industry,
Tourism and Investment
Chair, Ministerial Energy
Coordinating Committee
The Honourable
Floyd K.Roland
Premier and Minister Responsible
for the Northwest Territories
Power Corporation
The Honourable
J. Michael Miltenberger
Minister of Environment and
Natural Resources
The Honourable
Michael McLeod
Minister of Public Works
and Services
4Northwest territories eNergy report – May 2011
Ministers Message
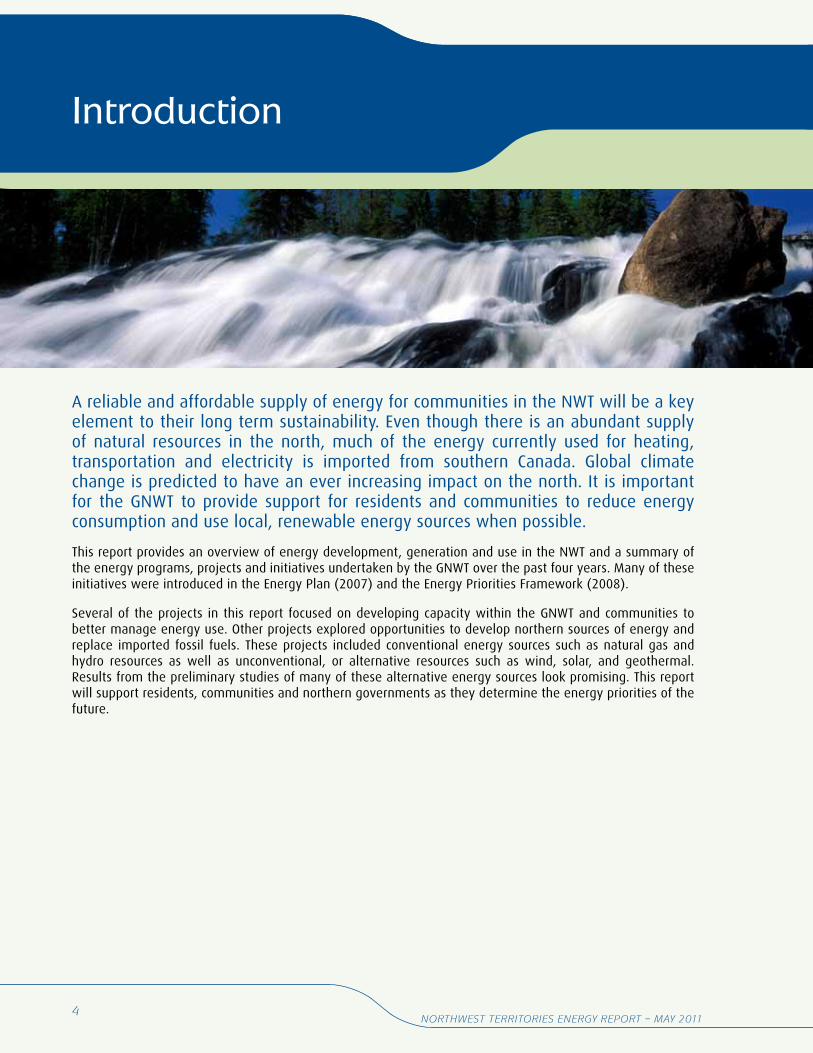
A reliable and affordable supply of energy for communities in the NWT will be a key element to their long term sustainability. Even though there is an abundant supply of natural resources in the north, much of the energy currently used for heating, transportation and electricity is imported from southern Canada. Global climate change is predicted to have an ever increasing impact on the north. It is important for the GNWT to provide support for residents and communities to reduce energy consumption and use local, renewable energy sources when possible.
This report provides an overview of energy development, generation and use in the NWT and a summary of the energy programs, projects and initiatives undertaken by the GNWT over the past four years. Many of these initiatives were introduced in the Energy Plan (2007) and the Energy Priorities Framework (2008).
Several of the projects in this report focused on developing capacity within the GNWT and communities to better manage energy use. Other projects explored opportunities to develop northern sources of energy and replace imported fossil fuels. These projects included conventional energy sources such as natural gas and hydro resources as well as unconventional, or alternative resources such as wind, solar, and geothermal. Results from the preliminary studies of many of these alternative energy sources look promising. This report will support residents, communities and northern governments as they determine the energy priorities of the future.
introduction
Ministers Message
5
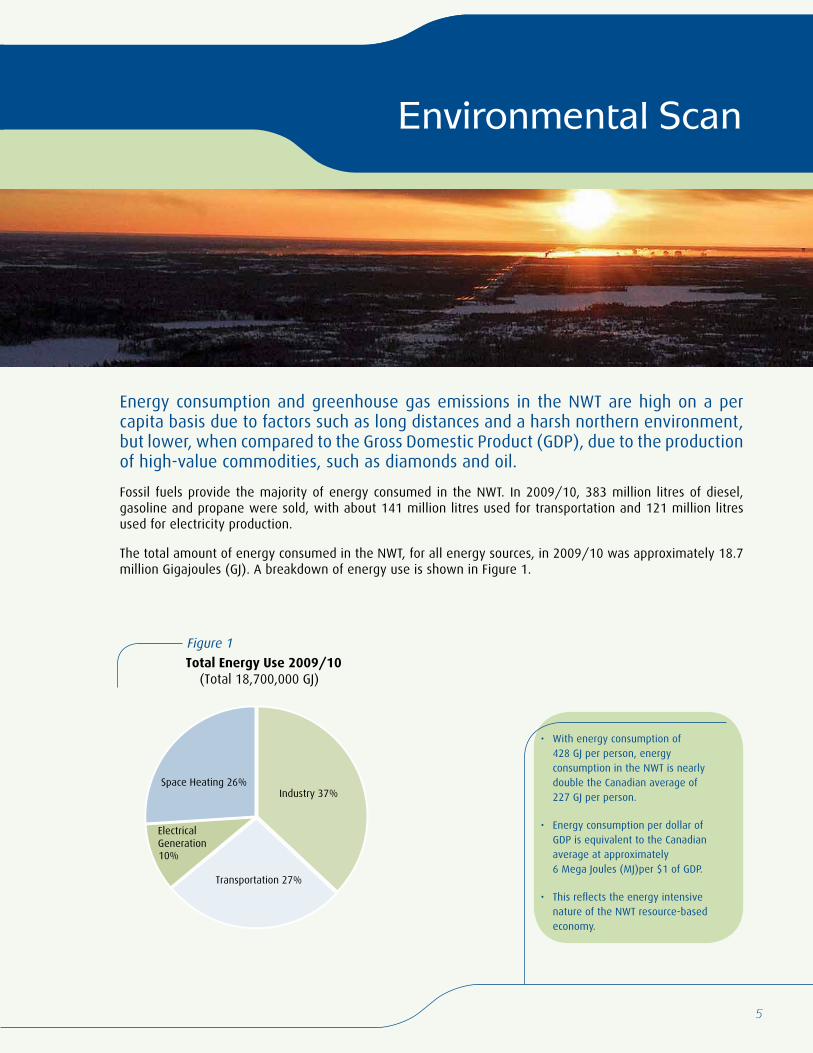
Energy consumption and greenhouse gas emissions in the NWT are high on a per capita basis due to factors such as long distances and a harsh northern environment, but lower, when compared to the Gross Domestic Product (GDP), due to the production of high-value commodities, such as diamonds and oil.
Fossil fuels provide the majority of energy consumed in the NWT. In 2009/10, 383 million litres of diesel, gasoline and propane were sold, with about 141 million litres used for transportation and 121 million litres used for electricity production.
The total amount of energy consumed in the NWT, for all energy sources, in 2009/10 was approximately 18.7 million Gigajoules (GJ). A breakdown of energy use is shown in Figure 1.
Environmental scan
• With energy consumption of 428 GJ per person, energy consumption in the NWT is nearly double the Canadian average of 227 GJ per person.
• Energy consumption per dollar of GDP is equivalent to the Canadian average at approximately 6 Mega Joules (MJ)per $1 of GDP.
• This reflects the energy intensive nature of the NWT resource-based economy.
Industry 37%
Transportation 27%
Electrical Generation 10%
Space Heating 26%
Total Energy Use 2009/10(Total 18,700,000 GJ)
Figure 1
6Northwest territories eNergy report – May 2011
Environmental scan
1. Greenhouse Gas Emissions and Energy Consumption
The total emissions of greenhouse gases (GHG) from the NWT in 2001/02 was 1,750 kilotonnes (kT) in C02
equivalents. Inventories since then show variations between years but emissions tend to average at about 1,500 kT. A recent inventory developed for 2009/10 shows emissions fell to a total of 1,220 kT in C0
2 equivalents.
NWT emissions can vary on an annual basis depending on a number of factors, especially emissions from off-road diesel for large construction projects or aviation fuel for exploration activity. A decline in these activities in the last few years corresponds with the drop in emissions. Emissions are expected to increase as these activities resume and the economy regains strength. Forecasts prepared by the GNWT indicate emissions from new mines and oil and gas production will increase in the future if no new sources of local renewable energy are developed at the same time.
The NWT accounts for a very small portion (less than 0.2 percent) of Canada’s total annual GHG emissions. While this is not much in relative terms, on a per-capita basis the total emissions from all activities in the NWT equal over 27.9 tonnes of emissions per person per year for 2009/10, down from 40 tonnes per person in 2001/02. This is higher than the national average of 21.7 tonnes per person per year. Higher per capita emissions in the NWT can be attributed to long distances between communities, an energy intensive resource industry and long, cold winters.
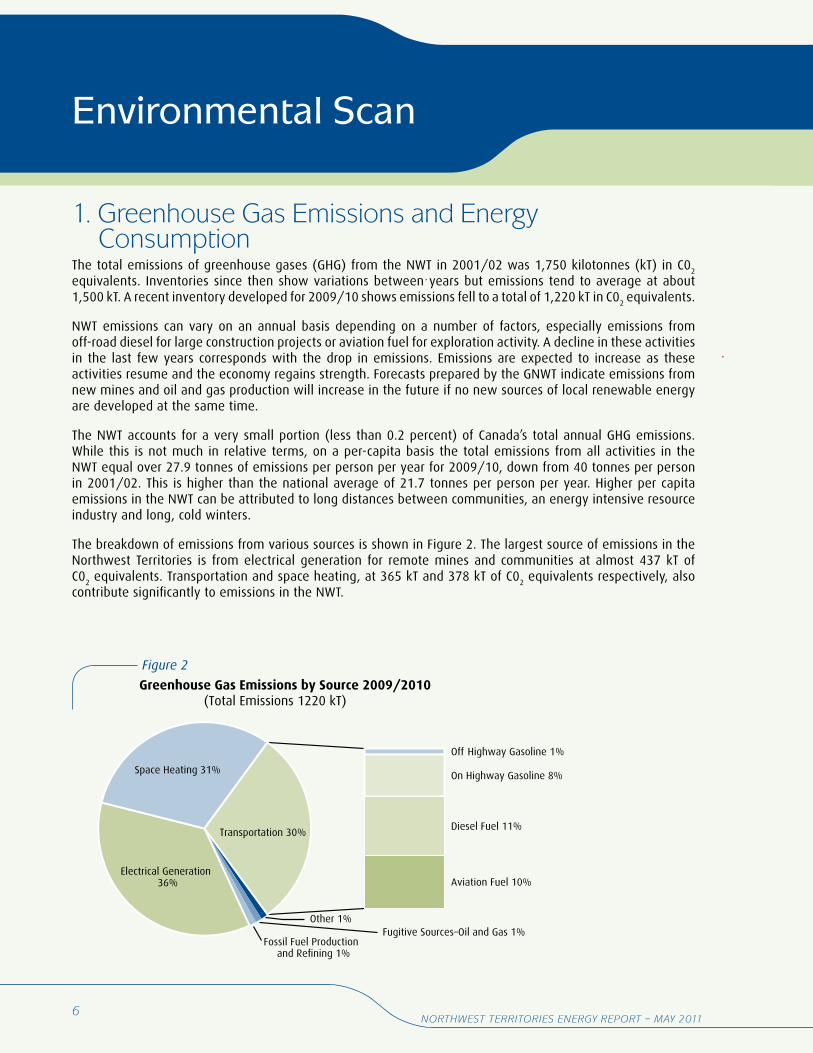
The breakdown of emissions from various sources is shown in Figure 2. The largest source of emissions in the Northwest Territories is from electrical generation for remote mines and communities at almost 437 kT of C0
2 equivalents. Transportation and space heating, at 365 kT and 378 kT of C0
2 equivalents respectively, also
contribute significantly to emissions in the NWT.
Other 1%Fugitive Sources–Oil and Gas 1%
Fossil Fuel Production and Refining 1%
Electrical Generation 36%
Space Heating 31%
Off Highway Gasoline 1%
On Highway Gasoline 8%
Diesel Fuel 11%
Aviation Fuel 10%
Transportation 30%
Greenhouse Gas Emissions by Source 2009/2010(Total Emissions 1220 kT)
Figure 2
7
Environmental scan
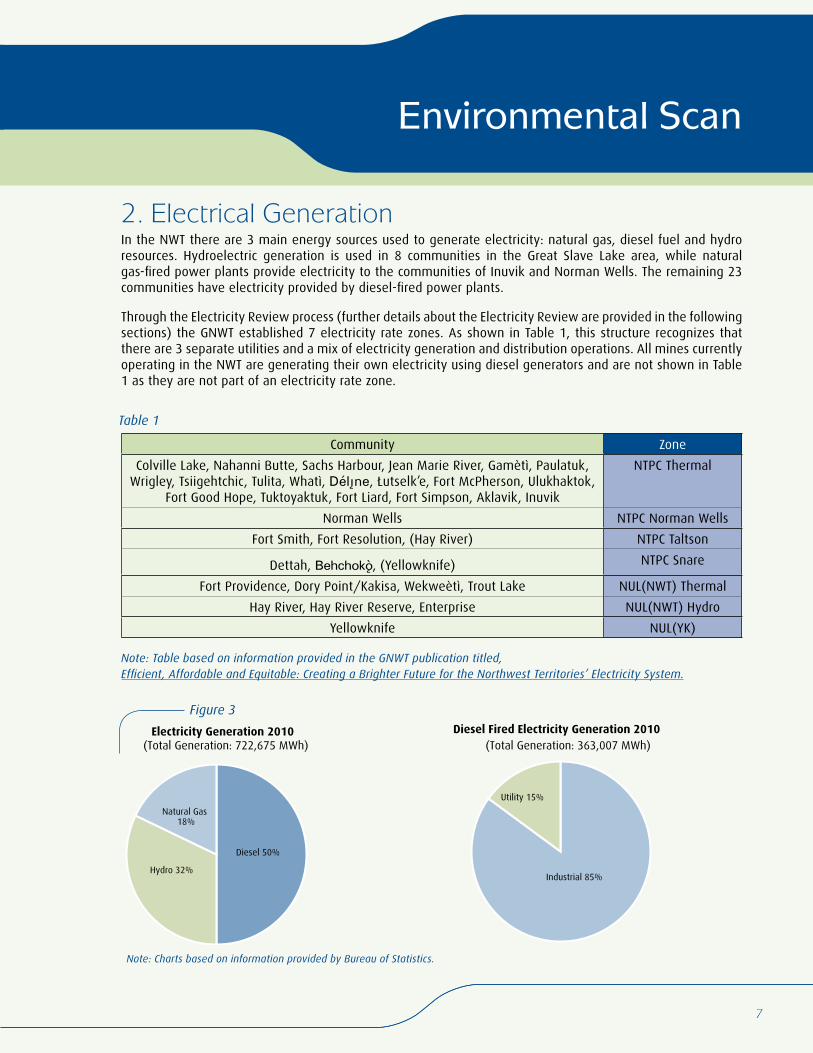
2. Electrical GenerationIn the NWT there are 3 main energy sources used to generate electricity: natural gas, diesel fuel and hydro resources. Hydroelectric generation is used in 8 communities in the Great Slave Lake area, while natural gas-fired power plants provide electricity to the communities of Inuvik and Norman Wells. The remaining 23 communities have electricity provided by diesel-fired power plants.
Through the Electricity Review process (further details about the Electricity Review are provided in the following sections) the GNWT established 7 electricity rate zones. As shown in Table 1, this structure recognizes that there are 3 separate utilities and a mix of electricity generation and distribution operations. All mines currently operating in the NWT are generating their own electricity using diesel generators and are not shown in Table 1 as they are not part of an electricity rate zone.
Community Zone
Colville Lake, Nahanni Butte, Sachs Harbour, Jean Marie River, Gamètì, Paulatuk, Wrigley, Tsiigehtchic, Tulita, Whatì, Délîne, Łutselk’e, Fort McPherson, Ulukhaktok,
Fort Good Hope, Tuktoyaktuk, Fort Liard, Fort Simpson, Aklavik, Inuvik
NTPC Thermal
Norman Wells NTPC Norman Wells
Fort Smith, Fort Resolution, (Hay River) NTPC Taltson
Dettah, Behchokö, (Yellowknife) NTPC Snare
Fort Providence, Dory Point/Kakisa, Wekweètì, Trout Lake NUL(NWT) Thermal
Hay River, Hay River Reserve, Enterprise NUL(NWT) Hydro
Yellowknife NUL(YK)
Note: Table based on information provided in the GNWT publication titled, Efficient, Affordable and Equitable: Creating a Brighter Future for the Northwest Territories’ Electricity System.
Table 1
Diesel 50%
Hydro 32%
Natural Gas 18%
Electricity Generation 2010(Total Generation: 722,675 MWh)
Industrial 85%
Utility 15%
Diesel Fired Electricity Generation 2010(Total Generation: 363,007 MWh)
Note: Charts based on information provided by Bureau of Statistics.
Figure 3
8Northwest territories eNergy report – May 2011
Environmental scan
The NTPC’s Snare Zone includes Yellowknife for the purposes of generation and transmission costs. However, Yellowknife is reflected in a separate zone when it comes to distribution by Northland Utilities Limited (Yellowknife) (NUL(YK)). Hay River is reflected in the NTPC Taltson Zone, but some of the transmission and all of the distribution costs are with Northland Utilities Limited (Northwest Territories) (NUL(NWT)).
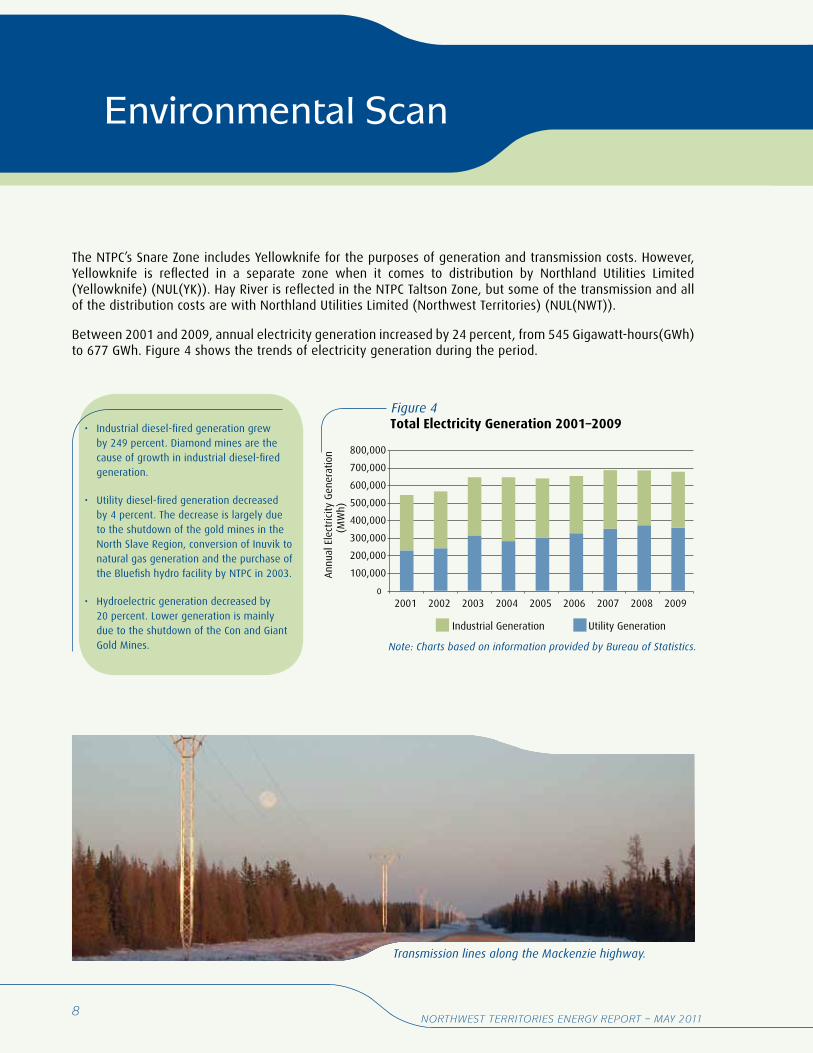
Between 2001 and 2009, annual electricity generation increased by 24 percent, from 545 Gigawatt-hours(GWh) to 677 GWh. Figure 4 shows the trends of electricity generation during the period.
Transmission lines along the Mackenzie highway.
0
100,000
200,000
300,000
400,000
500,000
600,000
700,000
800,000
2001 2002 2003 2004 2005 2006 2007 2008 2009
Ann
ual E
lect
ricity
Gen
erat
ion
(MW
h)
Total Electricity Generation 2001–2009
Industrial Generation Utility Generation
Figure 4
Note: Charts based on information provided by Bureau of Statistics.
• Industrial diesel-fired generation grew by 249 percent. Diamond mines are the cause of growth in industrial diesel-fired generation.
• Utility diesel-fired generation decreased by 4 percent. The decrease is largely due to the shutdown of the gold mines in the North Slave Region, conversion of Inuvik to natural gas generation and the purchase of the Bluefish hydro facility by NTPC in 2003.
• Hydroelectric generation decreased by 20 percent. Lower generation is mainly due to the shutdown of the Con and Giant Gold Mines.
9
Environmental scan
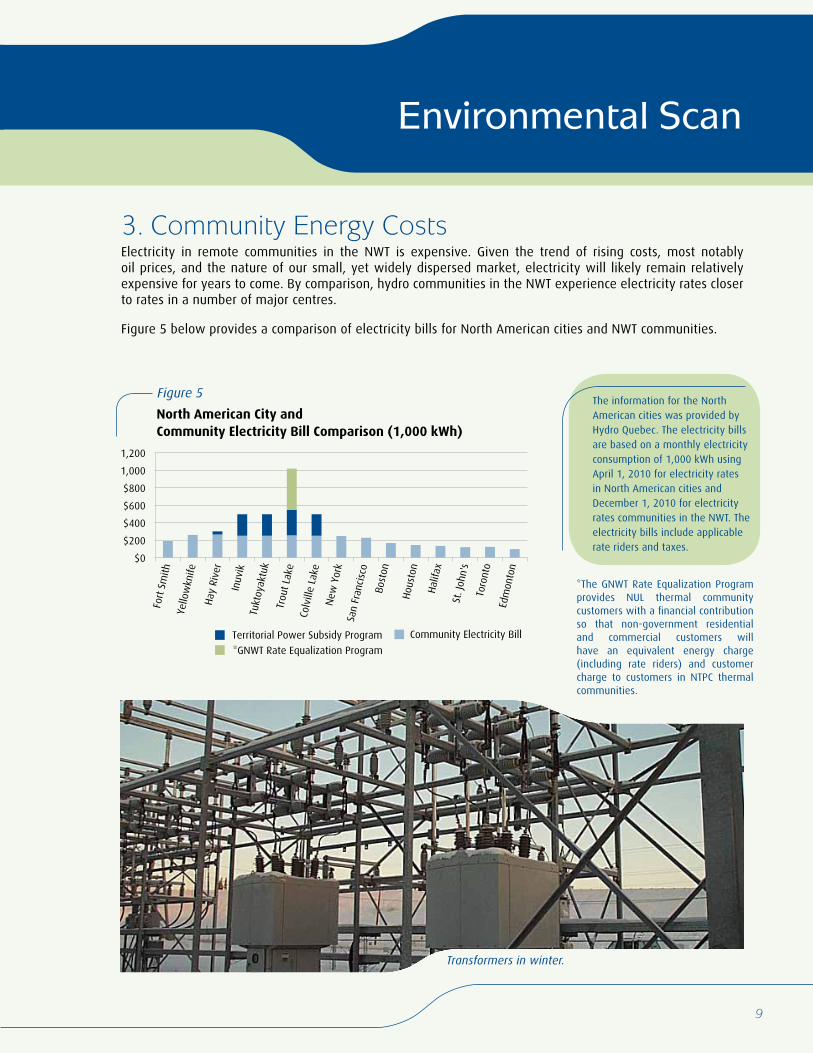
Transformers in winter.
3. Community Energy CostsElectricity in remote communities in the NWT is expensive. Given the trend of rising costs, most notably oil prices, and the nature of our small, yet widely dispersed market, electricity will likely remain relatively expensive for years to come. By comparison, hydro communities in the NWT experience electricity rates closer to rates in a number of major centres.
Figure 5 below provides a comparison of electricity bills for North American cities and NWT communities.
$0
$200
$400
$600
$800
$1,000
$1,200
Fort
Sm
ithYe
llow
knife
Hay
Riv
er
In
uvik
Tukt
oyak
tuk
Trou
t La
keCo
lvill
e La
keN
ew Y
ork
San
Fran
cisc
o
Bo
ston
H
oust
on
H
alifa
x
St. J
ohn'
s
To
ront
o
Edm
onto
n
North American City and Community Electricity Bill Comparison (1,000 kWh)
Community Electricity BillTerritorial Power Subsidy Program
*GNWT Rate Equalization Program
The information for the North American cities was provided by Hydro Quebec. The electricity bills are based on a monthly electricity consumption of 1,000 kWh using April 1, 2010 for electricity rates in North American cities and December 1, 2010 for electricity rates communities in the NWT. The electricity bills include applicable rate riders and taxes.
Figure 5
*The GNWT Rate Equalization Program provides NUL thermal community customers with a financial contribution so that non-government residential and commercial customers will have an equivalent energy charge (including rate riders) and customer charge to customers in NTPC thermal communities.
10Northwest territories eNergy report – May 2011
The NWT is a cold region, and is dark for much of the year. We must import most of the fuel we use to generate electricity in our smaller communities. In addition, unlike many southern jurisdictions, the NWT has neither of the following advantages:
• Economies of Scale: the NWT has a relatively small population that is spread throughout 33 communities. As a result, many of our communities are very small. However, they still require stand-alone generation, as well as all of the services required to generate and distribute electricity.
• Interconnected Grid: the lack of any transmission connection between many of our communities, and between the NWT and other jurisdictions, limits our ability to move electricity from one location to another. From an economic point of view, this means that we cannot share the costs of generation with other customers. From a reliability point of view, it means that communities must be self-reliant and require back-up systems.
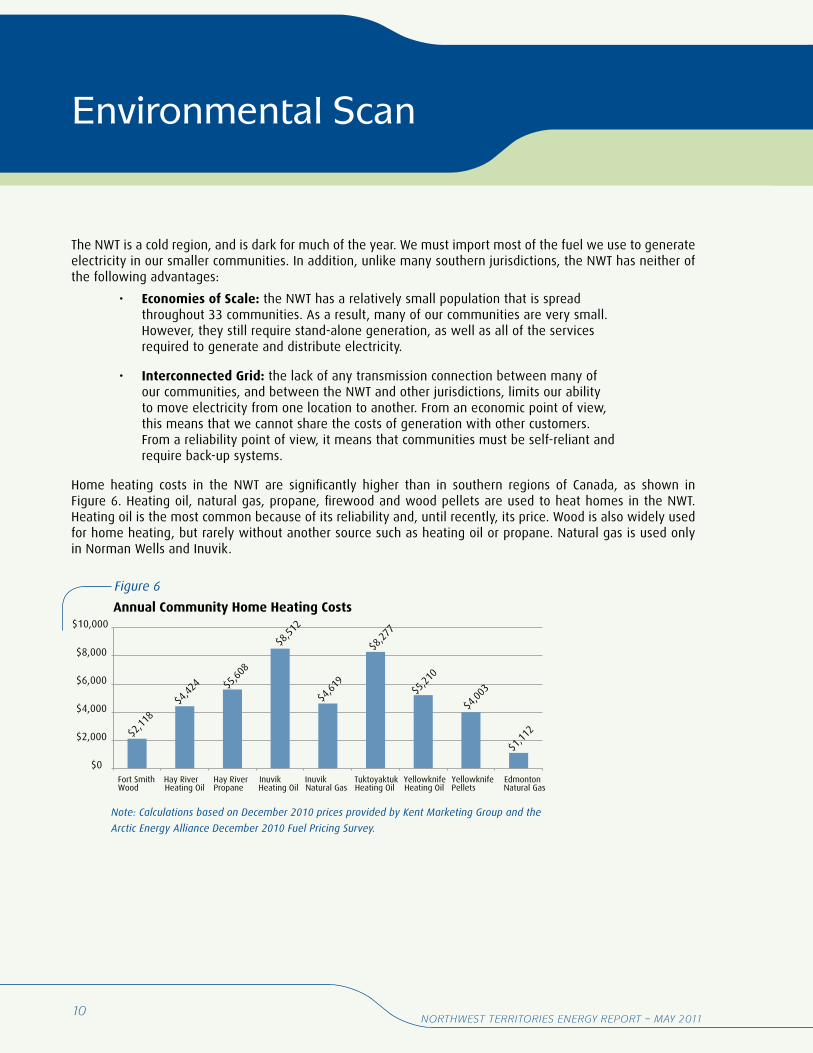
Home heating costs in the NWT are significantly higher than in southern regions of Canada, as shown in Figure 6. Heating oil, natural gas, propane, firewood and wood pellets are used to heat homes in the NWT. Heating oil is the most common because of its reliability and, until recently, its price. Wood is also widely used for home heating, but rarely without another source such as heating oil or propane. Natural gas is used only in Norman Wells and Inuvik.
Note: Calculations based on December 2010 prices provided by Kent Marketing Group and the
Arctic Energy Alliance December 2010 Fuel Pricing Survey.
Environmental scan
Annual Community Home Heating Costs
$2,11
8$4
,424 $5
,608
$8,51
2
$4,61
9
$8,27
7
$5,21
0
$4,00
3
$1,11
2
$0
$2,000
$4,000
$6,000
$8,000
$10,000
Fort Smith Wood
Hay River Heating Oil
Hay River Propane
Inuvik Heating Oil
InuvikNatural Gas
Tuktoyaktuk Heating Oil
Yellowknife Heating Oil
Yellowknife Pellets
EdmontonNatural Gas
Figure 6
11
Environmental scan
4. Oil and Gas ResourcesOil and gas exploration has a long history in the NWT, dating back to the Norman Wells oil discovery, drilled in 1920. Exploration initially increased through the southern NWT in the late 1940s and 1950s. This was followed by increased exploration throughout the NWT from 1960 to 1985, motivated by the oil price shock of 1974 and concerns for domestic supply. The Norman Wells oil field, in the central Mackenzie Valley, was expanded and a pipeline was constructed from Norman Wells to northern Alberta in the mid-1980s.
With the depletion of conventional oil and gas resources from the traditional producing areas of western Canada, the NWT is becoming an increasingly important potential source of oil and natural gas. The development of resources in the NWT complements oil sands production and shale gas development in Western Canada, enhancing Canada’s position as a secure source of energy supply.
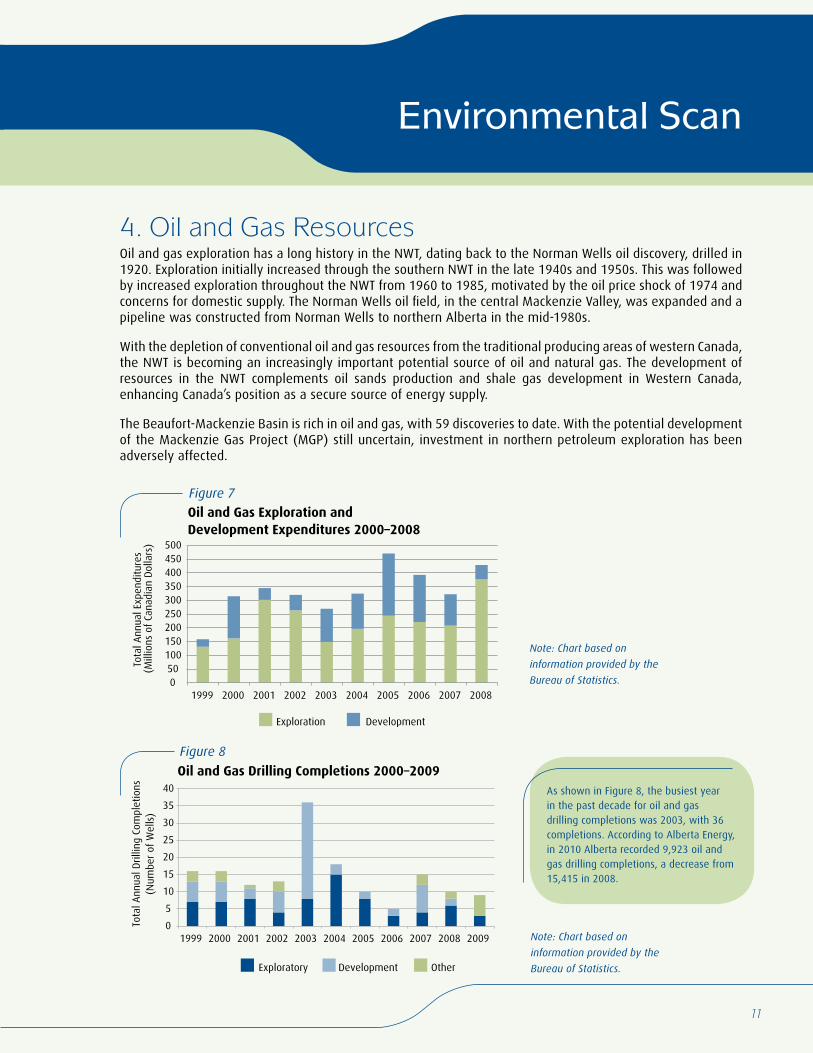
The Beaufort-Mackenzie Basin is rich in oil and gas, with 59 discoveries to date. With the potential development of the Mackenzie Gas Project (MGP) still uncertain, investment in northern petroleum exploration has been adversely affected.
050100150200250300350400450500
1999 2000 2001 2002 2003 2004 2005 2006 2007 2008
Tota
l Ann
ual E
xpen
ditu
res
(Mill
ions
of
Cana
dian
Dol
lars
)
Oil and Gas Exploration and Development Expenditures 2000–2008
Exploration Development
Note: Chart based on
information provided by the
Bureau of Statistics.
Note: Chart based on
information provided by the
Bureau of Statistics.
0
5
10
15
20
25
30
35
40
1999 2000 2001 2002 2003 2004 2005 2006 2007 2008 2009
Tota
l Ann
ual D
rillin
g Co
mpl
etio
ns(N
umbe
r of
Wel
ls)
Oil and Gas Drilling Completions 2000–2009
Exploratory Development Other
Figure 8
Figure 7
As shown in Figure 8, the busiest year in the past decade for oil and gas drilling completions was 2003, with 36 completions. According to Alberta Energy, in 2010 Alberta recorded 9,923 oil and gas drilling completions, a decrease from 15,415 in 2008.
12Northwest territories eNergy report – May 2011
Environmental scan
0.01.02.03.04.05.06.07.08.09.010.0
0.0
10.0
20.0
30.0
40.0
50.0
60.0
1998 2000 2002 2004 2006 2008 2010 2012
Oil
Prod
uctio
n(M
illio
n Ba
rrel
s)
Nat
ural
Gas
Pro
duct
ion
(Bill
ion
Cubi
c Fe
et)
NWT Oil and Gas Production 2000–2010
Natural Gas Production Oil Production
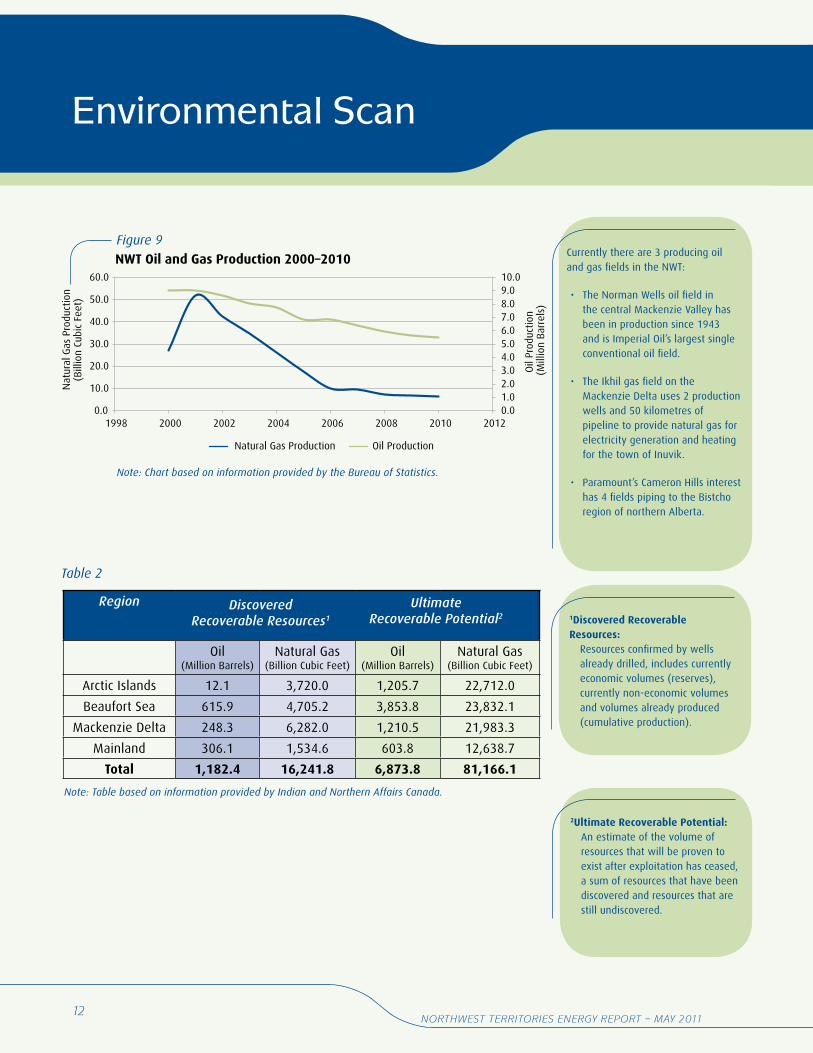
Note: Chart based on information provided by the Bureau of Statistics.
Currently there are 3 producing oil and gas fields in the NWT:
• The Norman Wells oil field in the central Mackenzie Valley has been in production since 1943 and is Imperial Oil’s largest single conventional oil field.
• The Ikhil gas field on the Mackenzie Delta uses 2 production wells and 50 kilometres of pipeline to provide natural gas for electricity generation and heating for the town of Inuvik.
• Paramount’s Cameron Hills interest has 4 fields piping to the Bistcho region of northern Alberta.
Figure 9
Table 2
Region
Oil (Million Barrels)
Natural Gas (Billion Cubic Feet)
Oil (Million Barrels)
Natural Gas (Billion Cubic Feet)
Arctic Islands 12.1 3,720.0 1,205.7 22,712.0
Beaufort Sea 615.9 4,705.2 3,853.8 23,832.1
Mackenzie Delta 248.3 6,282.0 1,210.5 21,983.3
Mainland 306.1 1,534.6 603.8 12,638.7
Total 1,182.4 16,241.8 6,873.8 81,166.1
Discovered Recoverable Resources1
Ultimate Recoverable Potential2 1Discovered Recoverable
Resources: Resources confirmed by wells already drilled, includes currently economic volumes (reserves), currently non-economic volumes and volumes already produced (cumulative production).
2Ultimate Recoverable Potential:An estimate of the volume of resources that will be proven to exist after exploitation has ceased, a sum of resources that have been discovered and resources that are still undiscovered.
Note: Table based on information provided by Indian and Northern Affairs Canada.
13
Environmental scan
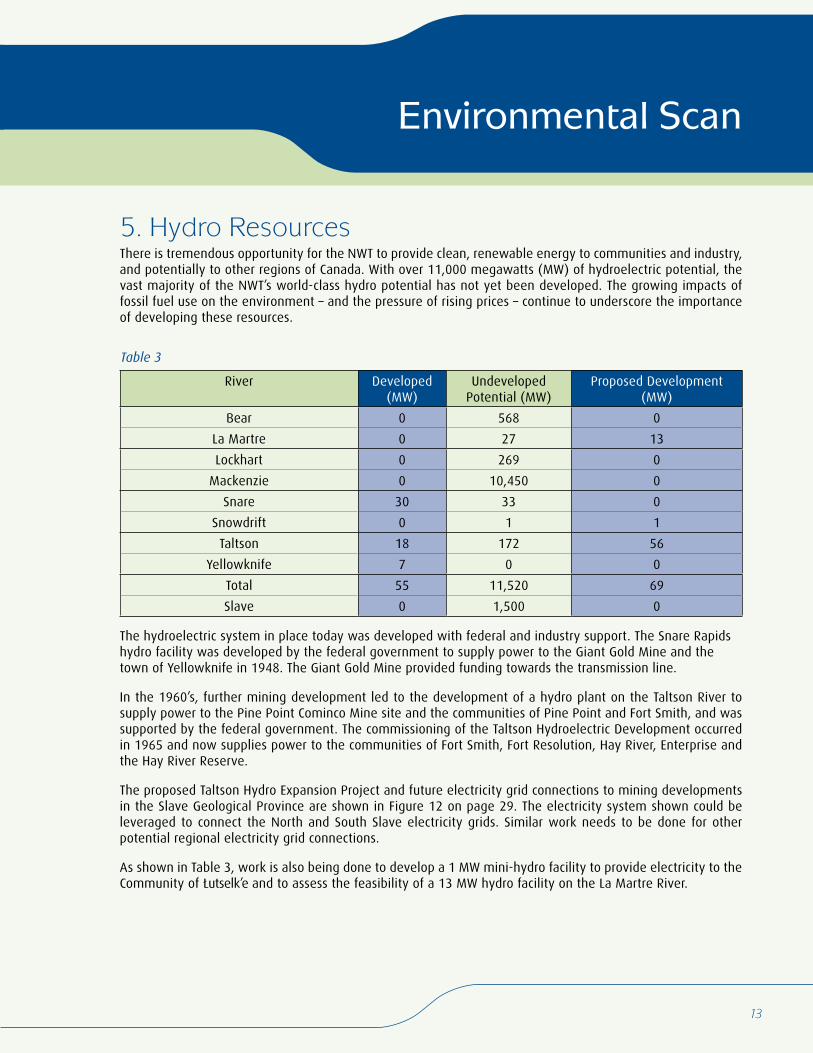
5. Hydro ResourcesThere is tremendous opportunity for the NWT to provide clean, renewable energy to communities and industry, and potentially to other regions of Canada. With over 11,000 megawatts (MW) of hydroelectric potential, the vast majority of the NWT’s world-class hydro potential has not yet been developed. The growing impacts of fossil fuel use on the environment – and the pressure of rising prices – continue to underscore the importance of developing these resources.
River Developed (MW)
Undeveloped Potential (MW)
Proposed Development (MW)
Bear 0 568 0
La Martre 0 27 13
Lockhart 0 269 0
Mackenzie 0 10,450 0
Snare 30 33 0
Snowdrift 0 1 1
Taltson 18 172 56
Yellowknife 7 0 0
Total 55 11,520 69
Slave 0 1,500 0
The hydroelectric system in place today was developed with federal and industry support. The Snare Rapids hydro facility was developed by the federal government to supply power to the Giant Gold Mine and the town of Yellowknife in 1948. The Giant Gold Mine provided funding towards the transmission line.
In the 1960’s, further mining development led to the development of a hydro plant on the Taltson River to supply power to the Pine Point Cominco Mine site and the communities of Pine Point and Fort Smith, and was supported by the federal government. The commissioning of the Taltson Hydroelectric Development occurred in 1965 and now supplies power to the communities of Fort Smith, Fort Resolution, Hay River, Enterprise and the Hay River Reserve.
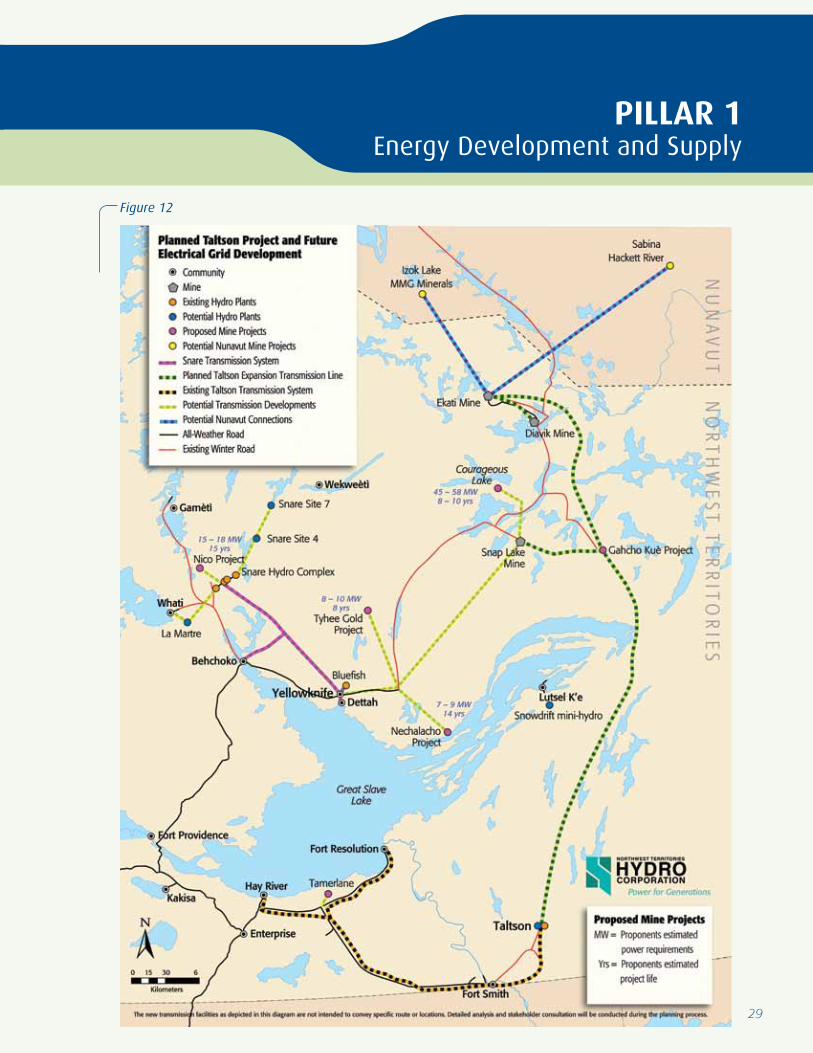
The proposed Taltson Hydro Expansion Project and future electricity grid connections to mining developments in the Slave Geological Province are shown in Figure 12 on page 29. The electricity system shown could be leveraged to connect the North and South Slave electricity grids. Similar work needs to be done for other potential regional electricity grid connections.
As shown in Table 3, work is also being done to develop a 1 MW mini-hydro facility to provide electricity to the Community of Łutselk’e and to assess the feasibility of a 13 MW hydro facility on the La Martre River.
Table 3
14Northwest territories eNergy report – May 2011
Environmental scan
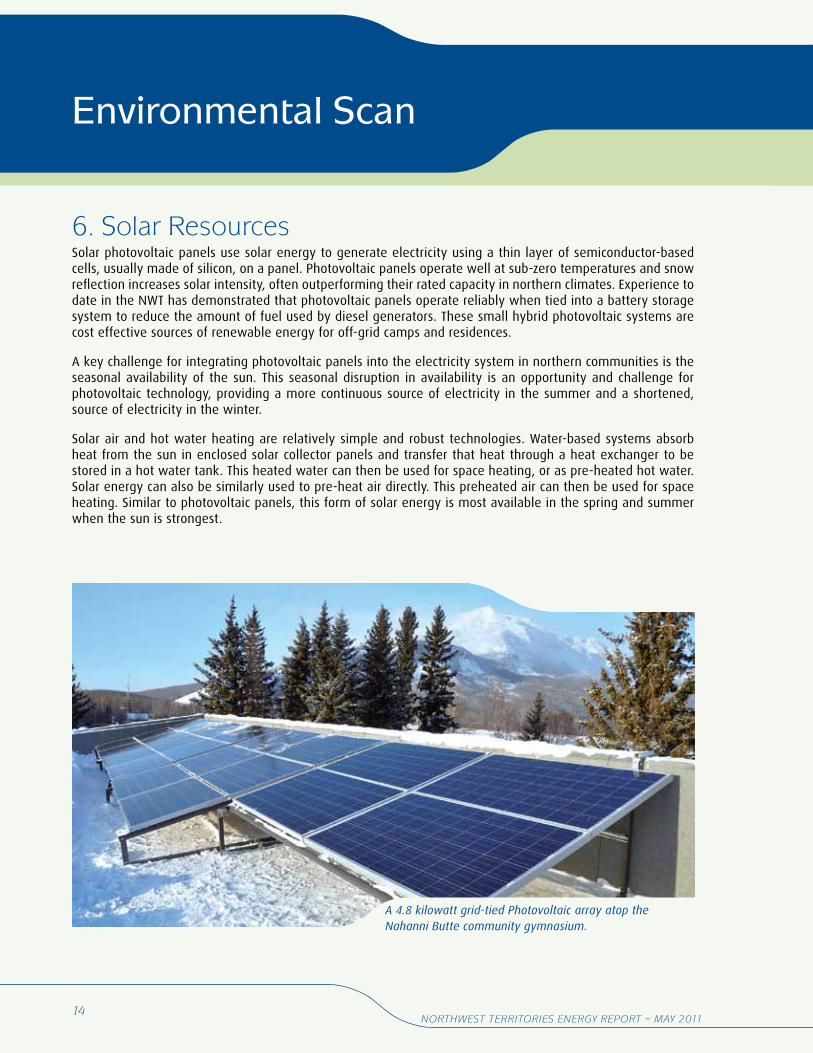
6. Solar ResourcesSolar photovoltaic panels use solar energy to generate electricity using a thin layer of semiconductor-based cells, usually made of silicon, on a panel. Photovoltaic panels operate well at sub-zero temperatures and snow reflection increases solar intensity, often outperforming their rated capacity in northern climates. Experience to date in the NWT has demonstrated that photovoltaic panels operate reliably when tied into a battery storage system to reduce the amount of fuel used by diesel generators. These small hybrid photovoltaic systems are cost effective sources of renewable energy for off-grid camps and residences.
A key challenge for integrating photovoltaic panels into the electricity system in northern communities is the seasonal availability of the sun. This seasonal disruption in availability is an opportunity and challenge for photovoltaic technology, providing a more continuous source of electricity in the summer and a shortened, source of electricity in the winter.
Solar air and hot water heating are relatively simple and robust technologies. Water-based systems absorb heat from the sun in enclosed solar collector panels and transfer that heat through a heat exchanger to be stored in a hot water tank. This heated water can then be used for space heating, or as pre-heated hot water. Solar energy can also be similarly used to pre-heat air directly. This preheated air can then be used for space heating. Similar to photovoltaic panels, this form of solar energy is most available in the spring and summer when the sun is strongest.
A 4.8 kilowatt grid-tied Photovoltaic array atop the Nahanni Butte community gymnasium.
15
Environmental scan
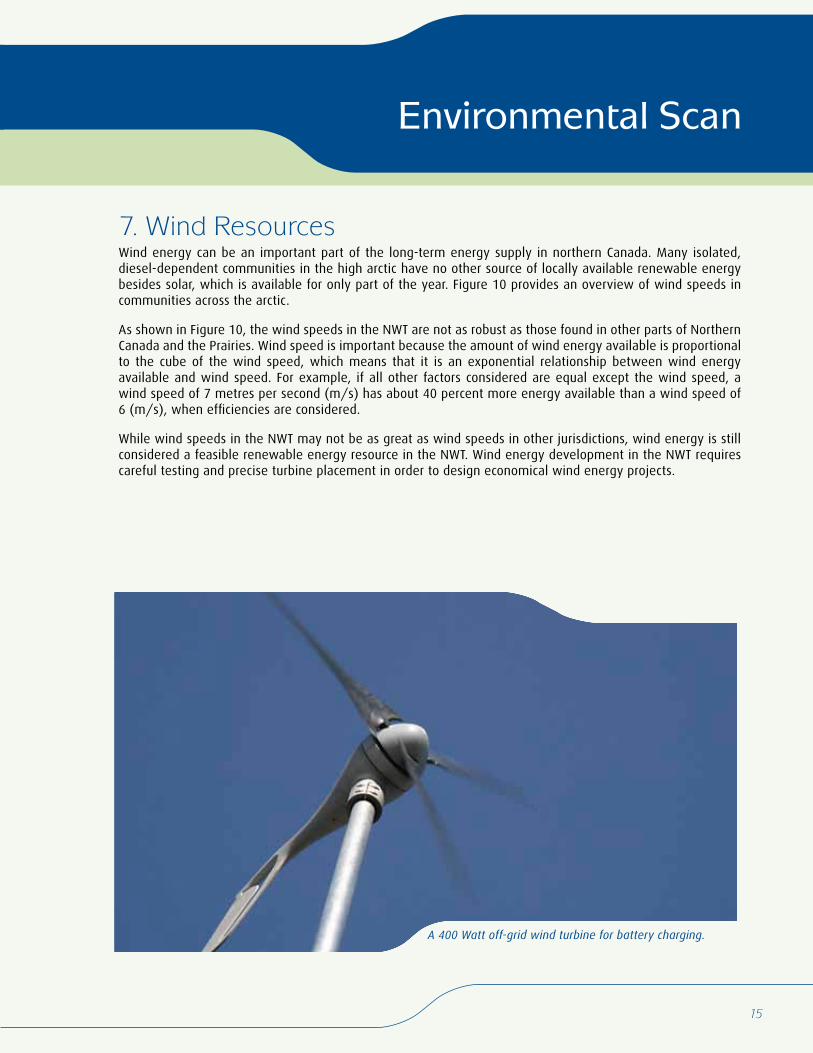
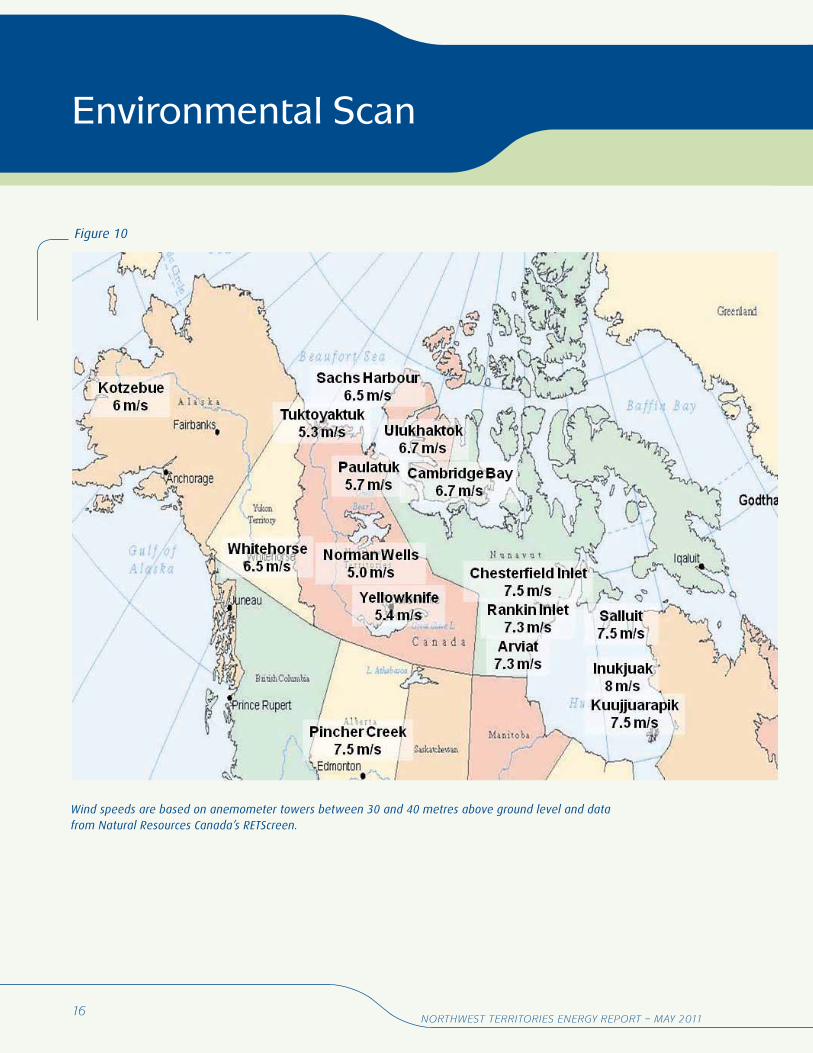
7. Wind ResourcesWind energy can be an important part of the long-term energy supply in northern Canada. Many isolated, diesel-dependent communities in the high arctic have no other source of locally available renewable energy besides solar, which is available for only part of the year. Figure 10 provides an overview of wind speeds in communities across the arctic.
As shown in Figure 10, the wind speeds in the NWT are not as robust as those found in other parts of Northern Canada and the Prairies. Wind speed is important because the amount of wind energy available is proportional to the cube of the wind speed, which means that it is an exponential relationship between wind energy available and wind speed. For example, if all other factors considered are equal except the wind speed, a wind speed of 7 metres per second (m/s) has about 40 percent more energy available than a wind speed of 6 (m/s), when efficiencies are considered.
While wind speeds in the NWT may not be as great as wind speeds in other jurisdictions, wind energy is still considered a feasible renewable energy resource in the NWT. Wind energy development in the NWT requires careful testing and precise turbine placement in order to design economical wind energy projects.
A 400 Watt off-grid wind turbine for battery charging.
16Northwest territories eNergy report – May 2011
Environmental scan
Figure 10
Wind speeds are based on anemometer towers between 30 and 40 metres above ground level and data from Natural Resources Canada’s RETScreen.
17
Environmental scan
8. Biomass ResourcesHistorically, firewood was one of the primary energy sources throughout the NWT. Fossil fuels eventually replaced wood as a source of heat, but with rising fossil fuel costs, wood and wood pellets have received renewed interest in the last few years. The development of new technologies has made wood a reliable source of energy for large-scale applications. For example, large wood pellet boilers are able to heat institutional buildings, fuel district heat systems and generate electricity.
Forest covers 33.3 million hectares of land in the NWT and represents 28 percent of the Canadian boreal forest. While forests in the NWT grow more slowly than in southern jurisdictions, with careful planning, they can be harvested sustainably to provide biomass energy. The most productive forest is concentrated in the southern NWT. Broad areas of harvestable forestland can be found throughout the Mackenzie Valley and the North Slave and Tåîchô regions.
The absence of a forestry industry provides the NWT with a unique challenge to support a biomass industry. Southern biomass energy projects have focused on the use of large volumes of waste wood available from the forestry industry, with an extremely low cost of wood pellet production. The NWT does not have a low cost supply of waste wood and, therefore, must harvest trees to produce pellets. Biomass is also available in the NWT from the following sources:
• Wood residue in the form of woodchips from:
~ road building and maintenance;
~ forest thinning for community protection;
~ forest fire burn areas; and
~ pipeline or seismic line cutting.
• Cardboard, paper or construction and demolition waste.
• Fast growing willow or poplar.
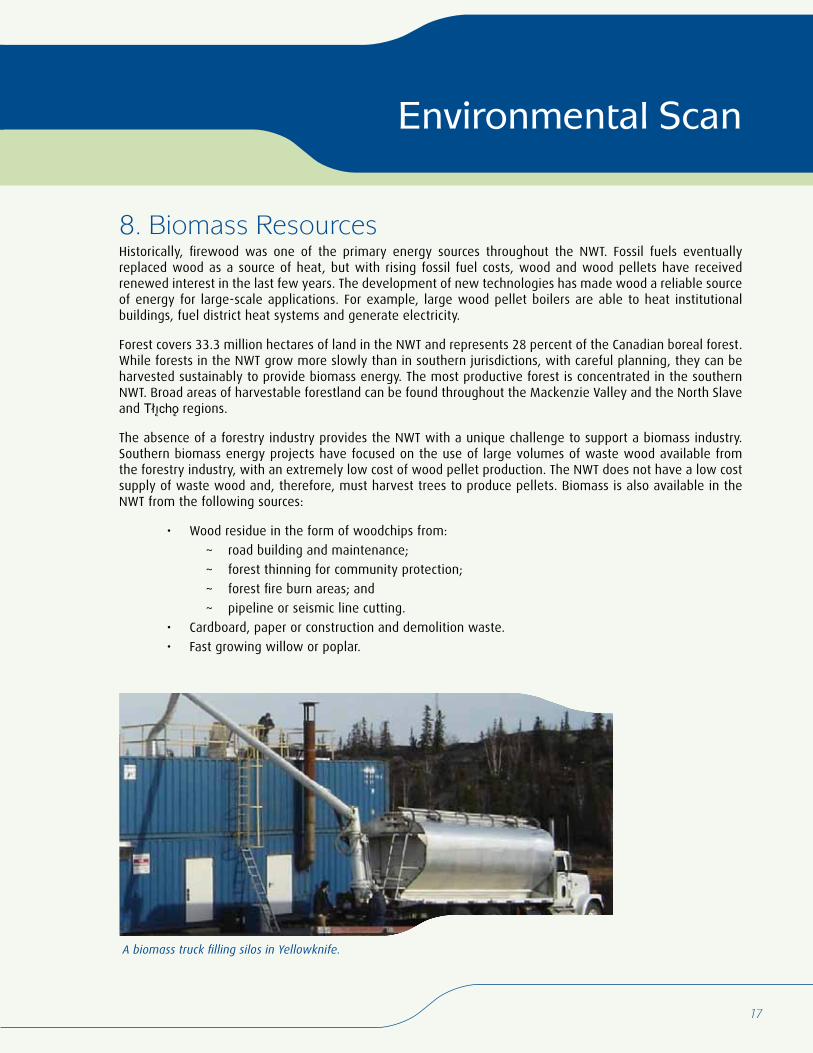
A biomass truck filling silos in Yellowknife.
18Northwest territories eNergy report – May 2011
Environmental scan
9. Geothermal ResourcesGeothermal energy is a largely untapped energy resource in Canada. Deep beneath the Earth’s surface, temperatures are hot enough to make hot water or steam. It is possible to use the Earth’s heat to generate electricity or for direct heating, using district heating or heat pumps.
Geothermal energy has many advantages that include:
• providing reliable base-load electricity;
• diversifying the mix of fuels used to produce electricity and stabilize costs;
• reducing environmental impacts and greenhouse gas emissions associated with space heating and electricity generation; and,
• providing heating for agricultural, industrial and space heating.
The NWT has a long history of oil and gas drilling activity, with over 1,500 wells drilled and documented. In particular, there are a number of wells with bottom hole temperatures of about 150 degrees Celsius, enough for both district heating and electricity generation applications.
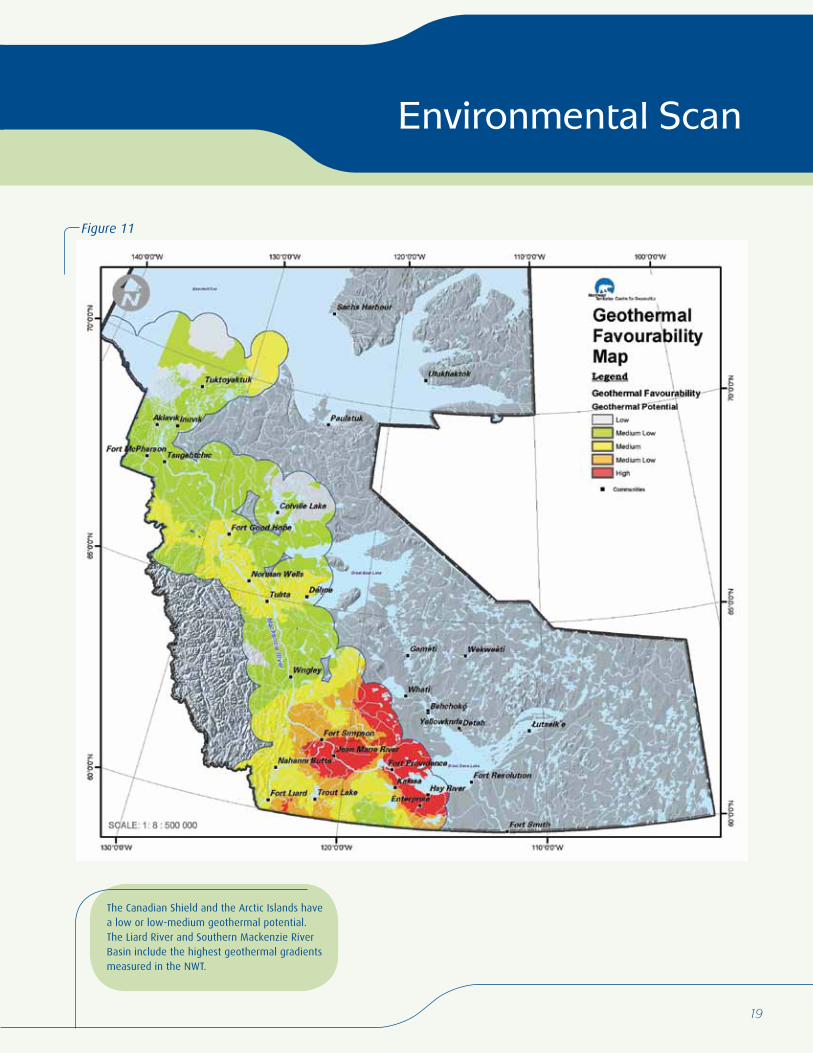
The Geothermal Favourability Map, shown in Figure 11, shows several areas of medium to high geothermal potential in the Mackenzie River basin extending from the Alberta and British Columbia border in the south to the Mackenzie Delta in the north.
19
Environmental scan
Figure 11
The Canadian Shield and the Arctic Islands have a low or low-medium geothermal potential. The Liard River and Southern Mackenzie River Basin include the highest geothermal gradients measured in the NWT.
20Northwest territories eNergy report – May 2011
Environmental scan
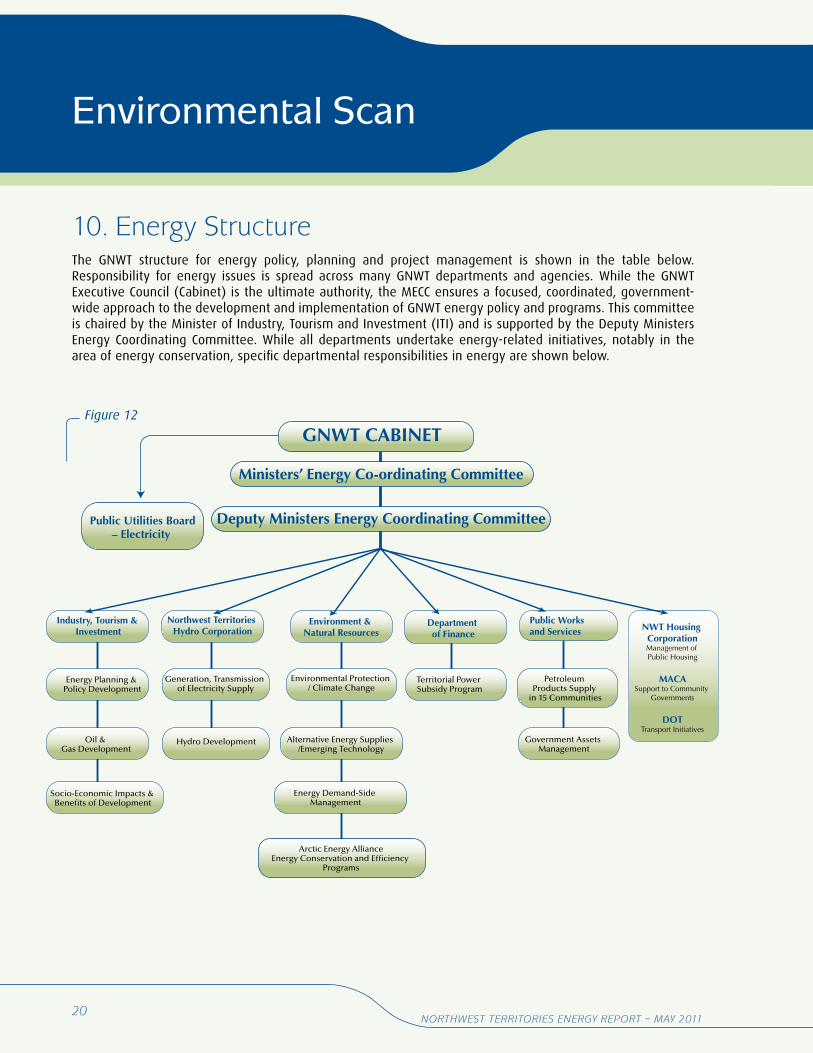
10. Energy StructureThe GNWT structure for energy policy, planning and project management is shown in the table below. Responsibility for energy issues is spread across many GNWT departments and agencies. While the GNWT Executive Council (Cabinet) is the ultimate authority, the MECC ensures a focused, coordinated, government-wide approach to the development and implementation of GNWT energy policy and programs. This committee is chaired by the Minister of Industry, Tourism and Investment (ITI) and is supported by the Deputy Ministers Energy Coordinating Committee. While all departments undertake energy-related initiatives, notably in the area of energy conservation, specific departmental responsibilities in energy are shown below.
Industry, Tourism & Investment
Energy Planning & Policy Development
Oil & Gas Development
Socio-Economic Impacts & Benefits of Development
Generation, Transmission of Electricity Supply
Hydro Development
Northwest Territories Hydro Corporation
Environment & Natural Resources
Department of Finance
Public Works and Services NWT Housing
CorporationManagement of Public Housing
MACASupport to Community
Governments
DOTTransport Initiatives
Environmental Protection / Climate Change
Alternative Energy Supplies /Emerging Technology
Energy Demand-Side Management
Arctic Energy AllianceEnergy Conservation and Efficiency
Programs
Territorial Power Subsidy Program
Petroleum Products Supply
in 15 Communities
Government Assets Management
Public Utilities Board– Electricity
GNWT CABINET
Ministers’ Energy Co-ordinating Committee
Deputy Ministers Energy Coordinating Committee
Figure 12
21
gNWT Energy Projects and Programs
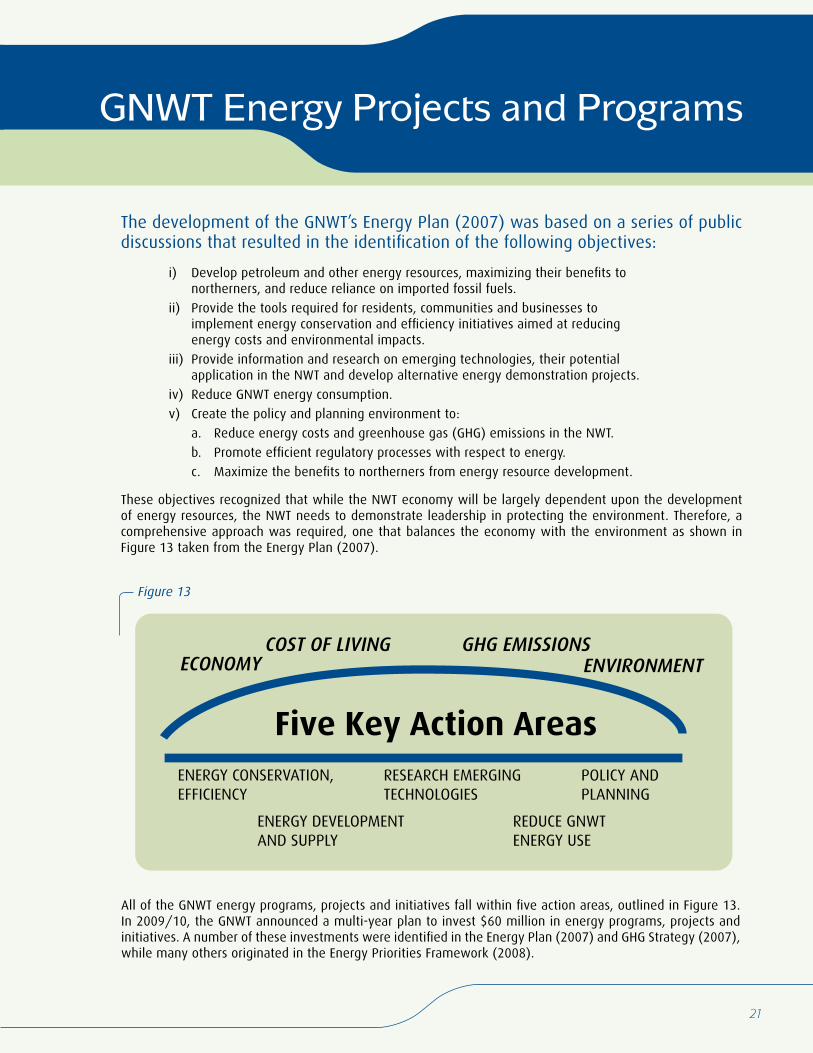
Figure 13
Five Key Action Areas
COST OF LIVING GHG EMISSIONS
ENERGY CONSERVATION, EFFICIENCY
ENERGY DEVELOPMENT AND SUPPLY
REDUCE GNWT ENERGY USE
POLICY AND PLANNING
RESEARCH EMERGING TECHNOLOGIES
ENVIRONMENTECONOMY
The development of the GNWT’s Energy Plan (2007) was based on a series of public discussions that resulted in the identification of the following objectives:
i) Develop petroleum and other energy resources, maximizing their benefits to northerners, and reduce reliance on imported fossil fuels.
ii) Provide the tools required for residents, communities and businesses to implement energy conservation and efficiency initiatives aimed at reducing energy costs and environmental impacts.
iii) Provide information and research on emerging technologies, their potential application in the NWT and develop alternative energy demonstration projects.
iv) Reduce GNWT energy consumption.
v) Create the policy and planning environment to:
a. Reduce energy costs and greenhouse gas (GHG) emissions in the NWT.
b. Promote efficient regulatory processes with respect to energy.
c. Maximize the benefits to northerners from energy resource development.
These objectives recognized that while the NWT economy will be largely dependent upon the development of energy resources, the NWT needs to demonstrate leadership in protecting the environment. Therefore, a comprehensive approach was required, one that balances the economy with the environment as shown in Figure 13 taken from the Energy Plan (2007).
All of the GNWT energy programs, projects and initiatives fall within five action areas, outlined in Figure 13. In 2009/10, the GNWT announced a multi-year plan to invest $60 million in energy programs, projects and initiatives. A number of these investments were identified in the Energy Plan (2007) and GHG Strategy (2007), while many others originated in the Energy Priorities Framework (2008).
22Northwest territories eNergy report – May 2011
22
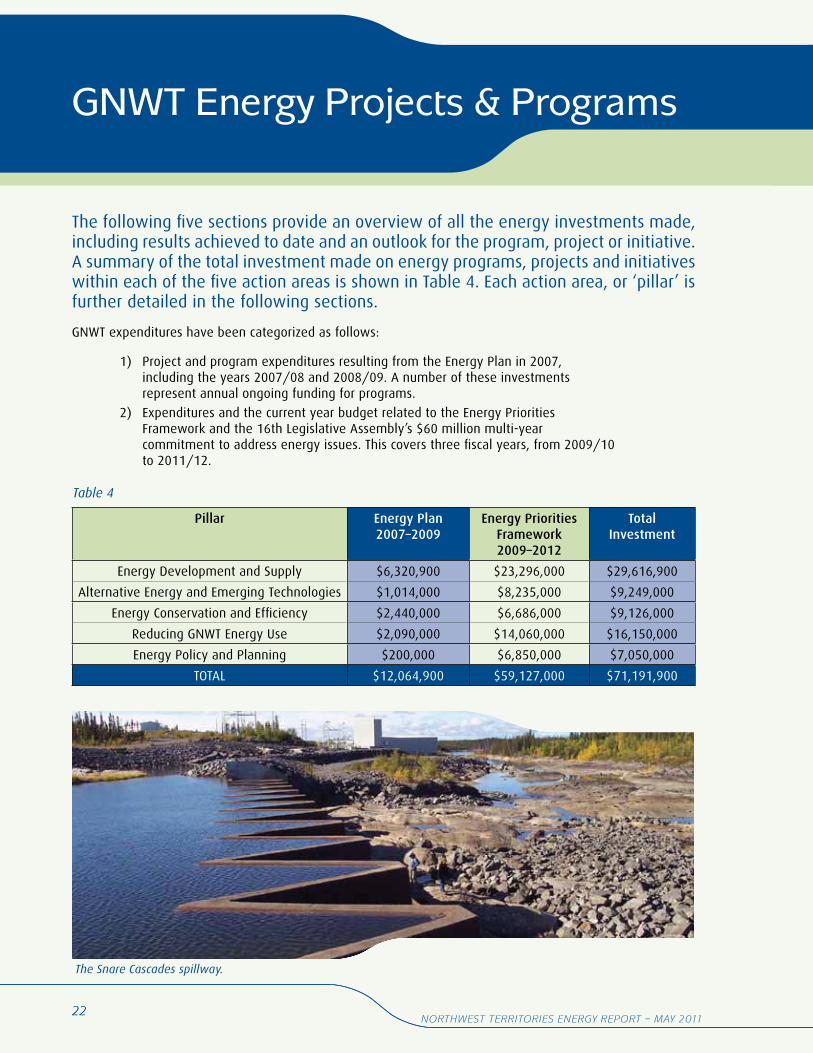
The following five sections provide an overview of all the energy investments made, including results achieved to date and an outlook for the program, project or initiative. A summary of the total investment made on energy programs, projects and initiatives within each of the five action areas is shown in Table 4. Each action area, or ‘pillar’ is further detailed in the following sections.
GNWT expenditures have been categorized as follows:
1) Project and program expenditures resulting from the Energy Plan in 2007, including the years 2007/08 and 2008/09. A number of these investments represent annual ongoing funding for programs.
2) Expenditures and the current year budget related to the Energy Priorities Framework and the 16th Legislative Assembly’s $60 million multi-year commitment to address energy issues. This covers three fiscal years, from 2009/10 to 2011/12.
Pillar Energy Plan 2007–2009
Energy Priorities Framework 2009–2012
Total Investment
Energy Development and Supply $6,320,900 $23,296,000 $29,616,900
Alternative Energy and Emerging Technologies $1,014,000 $8,235,000 $9,249,000
Energy Conservation and Efficiency $2,440,000 $6,686,000 $9,126,000
Reducing GNWT Energy Use $2,090,000 $14,060,000 $16,150,000
Energy Policy and Planning $200,000 $6,850,000 $7,050,000
TOTAL $12,064,900 $59,127,000 $71,191,900
Table 4
The Snare Cascades spillway.
gNWT Energy Projects & Programs
2323
PILLAR 1 Energy Development and Supply
Table 5
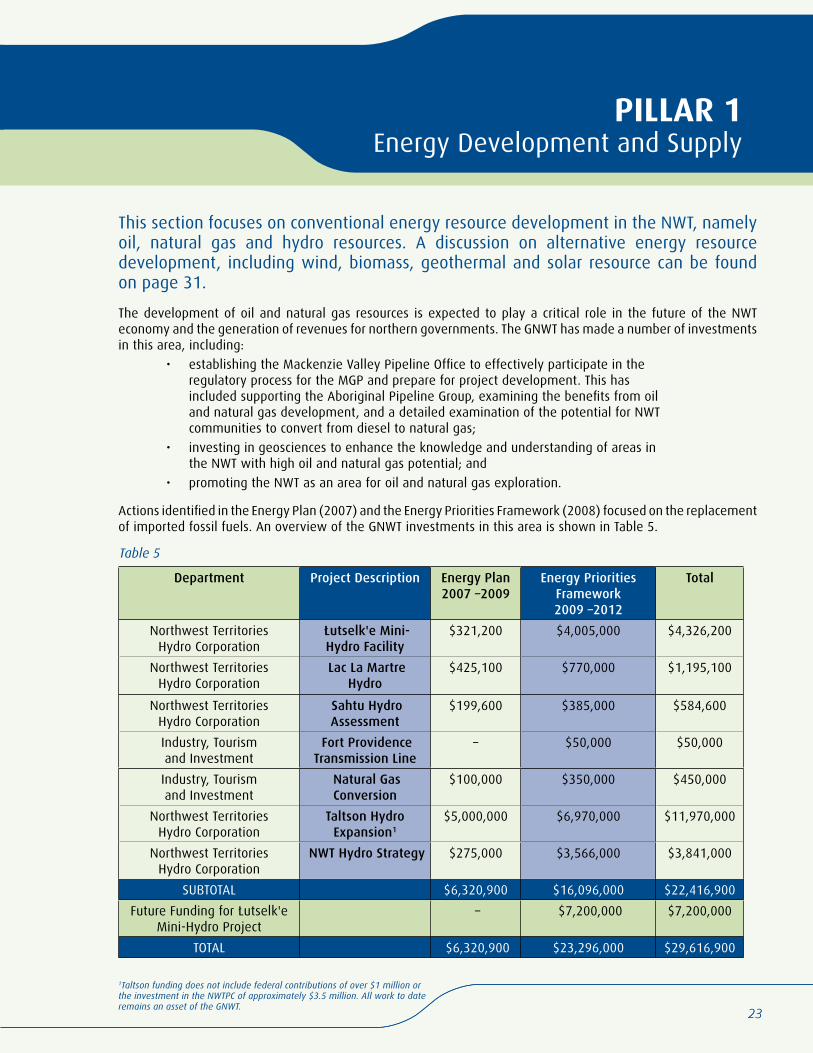
This section focuses on conventional energy resource development in the NWT, namely oil, natural gas and hydro resources. A discussion on alternative energy resource development, including wind, biomass, geothermal and solar resource can be found on page 31.
The development of oil and natural gas resources is expected to play a critical role in the future of the NWT economy and the generation of revenues for northern governments. The GNWT has made a number of investments in this area, including:
• establishing the Mackenzie Valley Pipeline Office to effectively participate in the regulatory process for the MGP and prepare for project development. This has included supporting the Aboriginal Pipeline Group, examining the benefits from oil and natural gas development, and a detailed examination of the potential for NWT communities to convert from diesel to natural gas;
• investing in geosciences to enhance the knowledge and understanding of areas in the NWT with high oil and natural gas potential; and
• promoting the NWT as an area for oil and natural gas exploration.
Actions identified in the Energy Plan (2007) and the Energy Priorities Framework (2008) focused on the replacement of imported fossil fuels. An overview of the GNWT investments in this area is shown in Table 5.
Department Project Description Energy Plan 2007 –2009
Energy Priorities Framework 2009 –2012
Total
Northwest Territories Hydro Corporation
Łutselk'e Mini-Hydro Facility
$321,200 $4,005,000 $4,326,200
Northwest Territories Hydro Corporation
Lac La Martre Hydro
$425,100 $770,000 $1,195,100
Northwest Territories Hydro Corporation
Sahtu Hydro Assessment
$199,600 $385,000 $584,600
Industry, Tourism and Investment
Fort Providence Transmission Line
– $50,000 $50,000
Industry, Tourism and Investment
Natural Gas Conversion
$100,000 $350,000 $450,000
Northwest Territories Hydro Corporation
Taltson Hydro Expansion1
$5,000,000 $6,970,000 $11,970,000
Northwest Territories Hydro Corporation
NWT Hydro Strategy $275,000 $3,566,000 $3,841,000
SUBTOTAL $6,320,900 $16,096,000 $22,416,900
Future Funding for Łutselk'e Mini-Hydro Project
– $7,200,000 $7,200,000
TOTAL $6,320,900 $23,296,000 $29,616,900
1Taltson funding does not include federal contributions of over $1 million or the investment in the NWTPC of approximately $3.5 million. All work to date remains an asset of the GNWT.
24Northwest territories eNergy report – May 2011
PILLAR 1 Energy Development and Supply
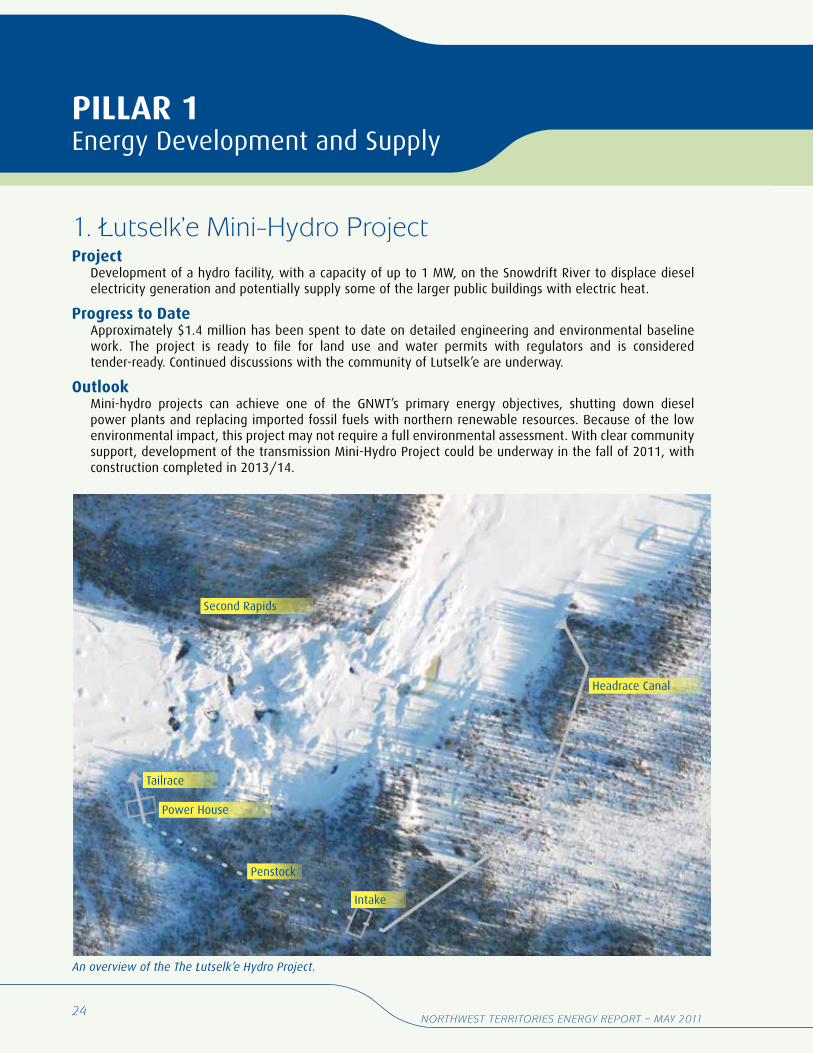
1. Lutselk’e Mini-Hydro ProjectProject
Development of a hydro facility, with a capacity of up to 1 MW, on the Snowdrift River to displace diesel electricity generation and potentially supply some of the larger public buildings with electric heat.
Progress to DateApproximately $1.4 million has been spent to date on detailed engineering and environmental baseline work. The project is ready to file for land use and water permits with regulators and is considered tender-ready. Continued discussions with the community of Lutselk’e are underway.
Outlook Mini-hydro projects can achieve one of the GNWT’s primary energy objectives, shutting down diesel power plants and replacing imported fossil fuels with northern renewable resources. Because of the low environmental impact, this project may not require a full environmental assessment. With clear community support, development of the transmission Mini-Hydro Project could be underway in the fall of 2011, with construction completed in 2013/14.
An overview of the The Łutselk’e Hydro Project.
Second Rapids
Power House
Tailrace
Headrace Canal
Intake
Penstock
25
PILLAR 1 Energy Development and Supply
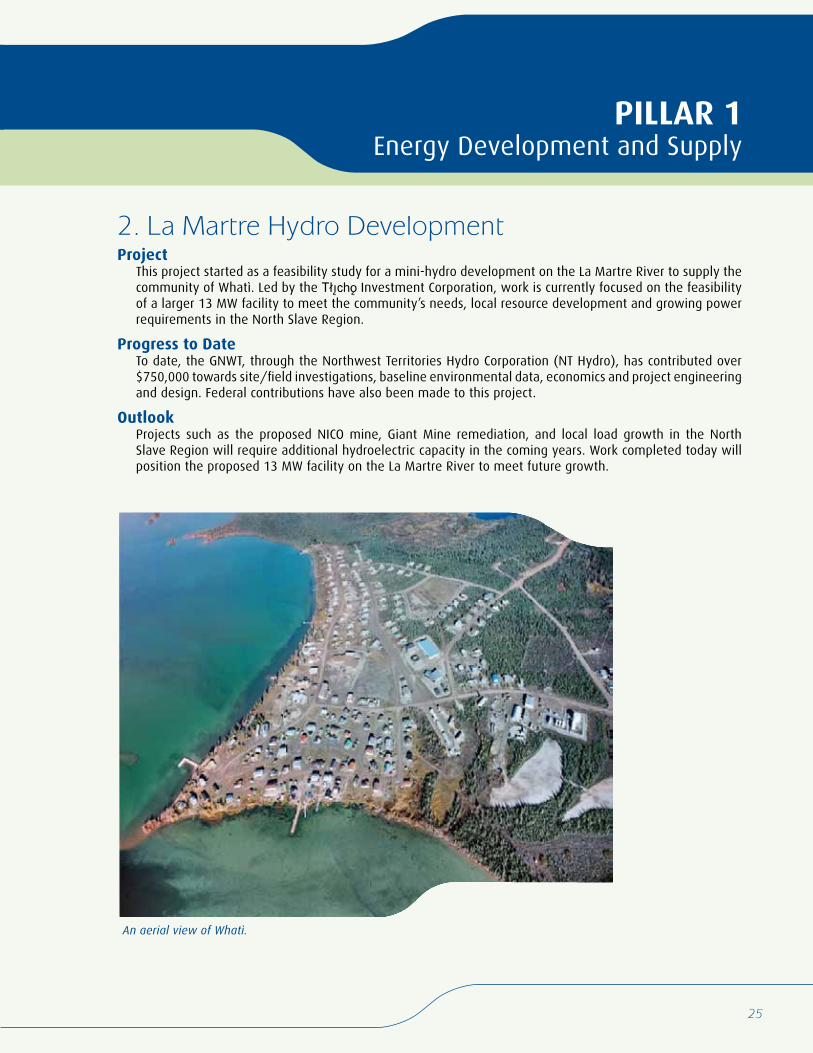
2. La Martre Hydro DevelopmentProject
This project started as a feasibility study for a mini-hydro development on the La Martre River to supply the community of Whatì. Led by the Tåîchô Investment Corporation, work is currently focused on the feasibility of a larger 13 MW facility to meet the community’s needs, local resource development and growing power requirements in the North Slave Region.
Progress to Date To date, the GNWT, through the Northwest Territories Hydro Corporation (NT Hydro), has contributed over $750,000 towards site/field investigations, baseline environmental data, economics and project engineering and design. Federal contributions have also been made to this project.
OutlookProjects such as the proposed NICO mine, Giant Mine remediation, and local load growth in the North Slave Region will require additional hydroelectric capacity in the coming years. Work completed today will position the proposed 13 MW facility on the La Martre River to meet future growth.
An aerial view of Whatì.
26Northwest territories eNergy report – May 2011
PILLAR 1 Energy Development and Supply
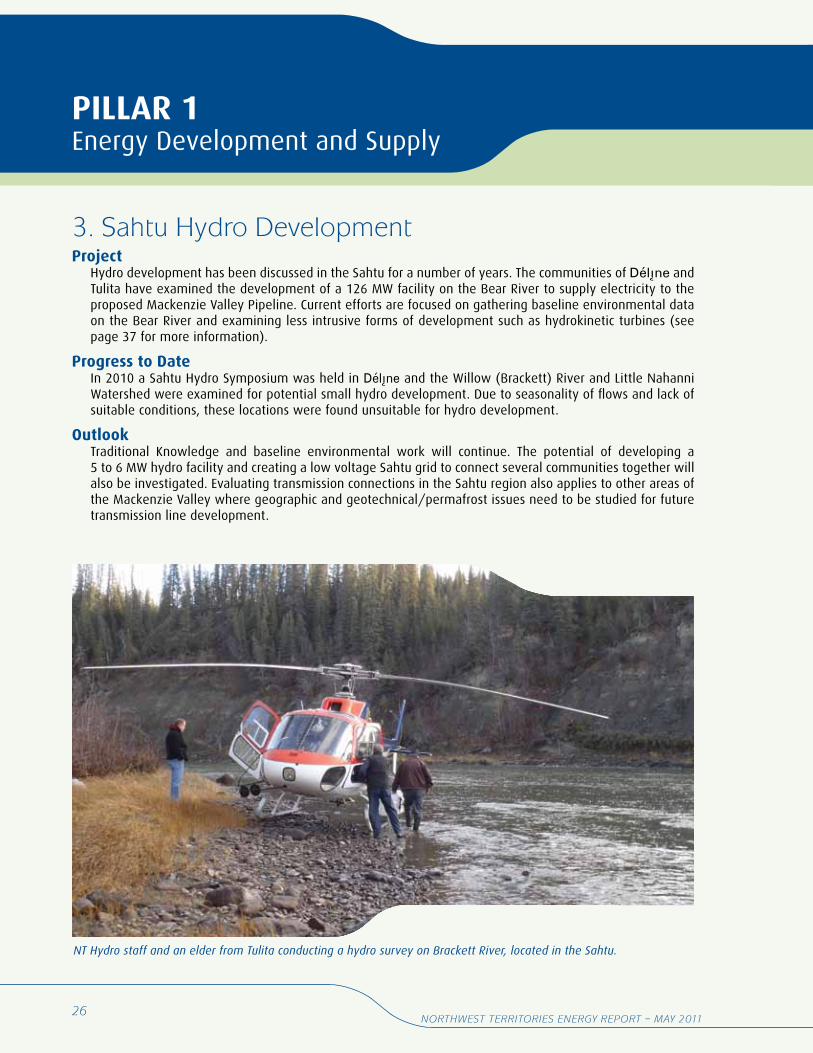
3. Sahtu Hydro DevelopmentProject
Hydro development has been discussed in the Sahtu for a number of years. The communities of Délîne and Tulita have examined the development of a 126 MW facility on the Bear River to supply electricity to the proposed Mackenzie Valley Pipeline. Current efforts are focused on gathering baseline environmental data on the Bear River and examining less intrusive forms of development such as hydrokinetic turbines (see page 37 for more information).
Progress to DateIn 2010 a Sahtu Hydro Symposium was held in Délîne and the Willow (Brackett) River and Little Nahanni Watershed were examined for potential small hydro development. Due to seasonality of flows and lack of suitable conditions, these locations were found unsuitable for hydro development.
Outlook Traditional Knowledge and baseline environmental work will continue. The potential of developing a 5 to 6 MW hydro facility and creating a low voltage Sahtu grid to connect several communities together will also be investigated. Evaluating transmission connections in the Sahtu region also applies to other areas of the Mackenzie Valley where geographic and geotechnical/permafrost issues need to be studied for future transmission line development.
NT Hydro staff and an elder from Tulita conducting a hydro survey on Brackett River, located in the Sahtu.
27
PILLAR 1 Energy Development and Supply
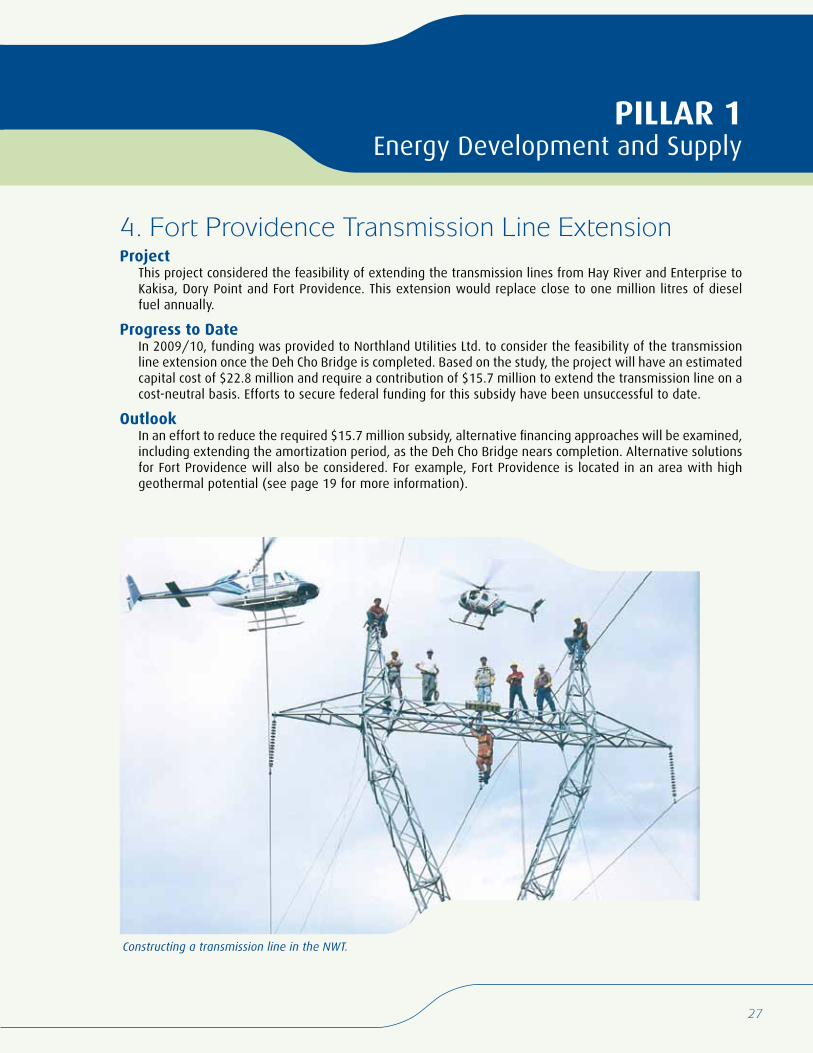
4. Fort Providence Transmission Line ExtensionProject
This project considered the feasibility of extending the transmission lines from Hay River and Enterprise to Kakisa, Dory Point and Fort Providence. This extension would replace close to one million litres of diesel fuel annually.
Progress to Date In 2009/10, funding was provided to Northland Utilities Ltd. to consider the feasibility of the transmission line extension once the Deh Cho Bridge is completed. Based on the study, the project will have an estimated capital cost of $22.8 million and require a contribution of $15.7 million to extend the transmission line on a cost-neutral basis. Efforts to secure federal funding for this subsidy have been unsuccessful to date.
OutlookIn an effort to reduce the required $15.7 million subsidy, alternative financing approaches will be examined, including extending the amortization period, as the Deh Cho Bridge nears completion. Alternative solutions for Fort Providence will also be considered. For example, Fort Providence is located in an area with high geothermal potential (see page 19 for more information).
Constructing a transmission line in the NWT.
28Northwest territories eNergy report – May 2011
PILLAR 1 Energy Development and Supply
5. Taltson Hydro Expansion ProjectProject
Over the course of 7 years, nearly $17 million in territorial, federal and crown corporation funds have been spent on a proposal to expand the current Taltson hydroelectric facility by up to 56 MW to supply hydro power to mines in the Slave Geological Province. This proposed project, a partnership between the NWT Métis, the Akaitcho Territory Government and NT Hydro, could replace up to 100 million litres annually of imported diesel with northern renewable electricity.
Progress to Date A tremendous amount of engineering and environmental work on the Taltson watershed led to an environmental review by the Mackenzie Valley Environmental Impact Review Board of the world-class Developer’s Assessment Report. This process, nearing completion, has been put on hold while the business case undergoes further review.
Outlook The Taltson Hydro Expansion Project presents the single greatest opportunity in the NWT to significantly reduce imported fossil fuels and GHG emissions (300 kT GHG emissions per year). This project will also be required if there is to be a North/South Slave grid, a development that would help manage load growth and reduce overall system costs in the long term. With rising fossil fuel prices, the growing impacts of climate change and the need for critical economic development infrastructure, the question is not “if” the Taltson Expansion will proceed, but “when”.
6. NWT Hydro StrategyProject
The GNWT is investing $1.25 million annually to support NT Hydro in work related to the Hydro Strategy. This is considered core funding for the office responsible for developing hydro resources, including the establishment of engineering, regulatory, business support and communications positions.
Progress to Date Over the past three years, ITI and NT Hydro have been responsible for managing the Taltson Hydro Expansion Project; GNWT efforts on the proposed Łutselk’e and Whatì hydro projects; and undertaking environmental baseline, water monitoring and engineering work in the South Slave and Sahtu regions. The draft NWT Hydro Strategy, will be finalized in August 2011.
Outlook Hydro projects can take up to 10 years to develop. Undertaking baseline environmental and engineering work on NWT river systems can shorten this development timeframe and position NT Hydro to take advantage of future hydro opportunities as they emerge. Future projects will include the feasibility of establishing a small Sahtu grid (Fort Good Hope, Norman Wells, Tulita, and Délîne), a Deh Cho grid and other opportunities to replace imported diesel fuel. Future work will also include the consideration of alternative energy sources such as geothermal, biomass and wind resources.
29
PILLAR 1 Energy Development and Supply
Figure 12
30Northwest territories eNergy report – May 2011
PILLAR 1 Energy Development and Supply
7. Natural Gas Conversion Project
This project was developed to examine the feasibility of converting communities along the route of the proposed Mackenzie Valley Pipeline to natural gas for heating and electricity generation.
Progress to Date Work to date has focused on the communities of Fort Simpson, Tulita and Fort Good Hope. Conversion of these communities to natural gas has been found to be economic.
Outlook Demonstration of the economic feasibility of community conversion to natural gas is now a requirement of the MGP approval by the National Energy Board. The development of an economic test for community conversion will be submitted by the MGP project proponents by December 31, 2011. The GNWT will participate in this process and continue to advance natural gas conversion for NWT communities in preparation for the development of the MGP.
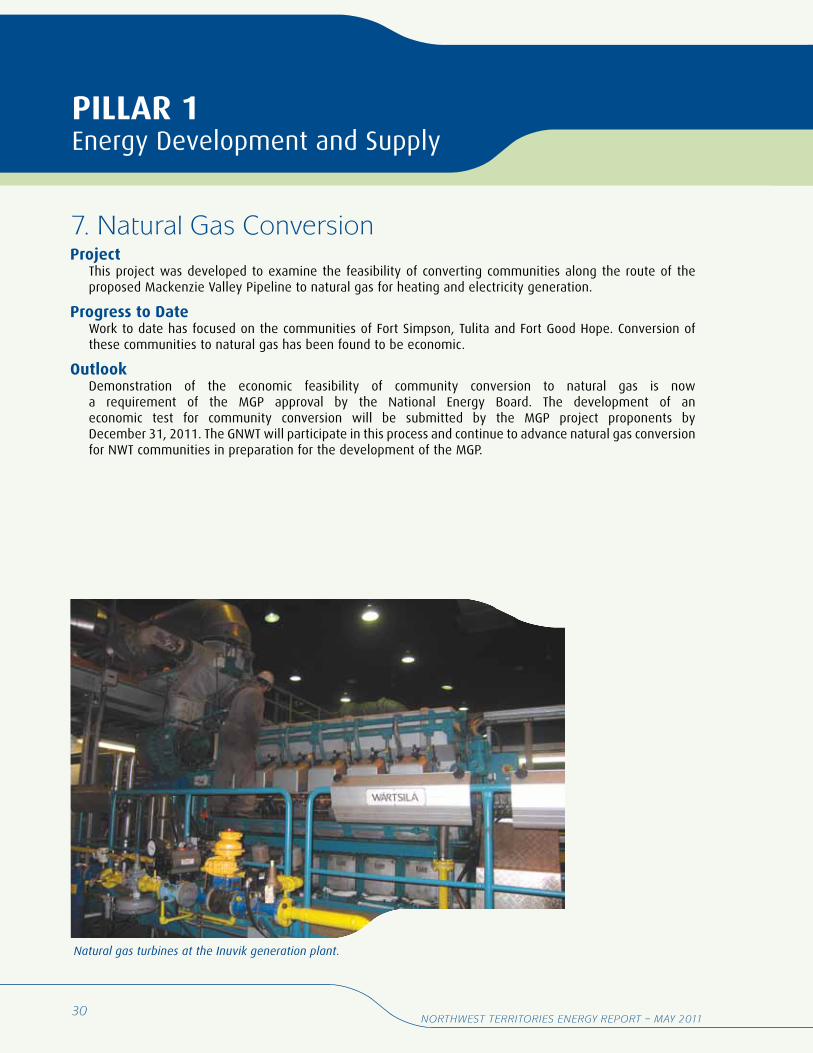
Natural gas turbines at the Inuvik generation plant.
31
PILLAR 2 Alternative Energy and Emerging Technologies
Alternative energy is often derived from renewable sources, such as sunlight, wind, geothermal heat or flowing water. Rising fossil fuel prices have made alternative and renewable energy systems more cost-effective around the world. Concerns about climate change and the need to reduce GHG emissions from the use of fossil fuels when producing heat or electricity rationalize installation of wind turbines and solar panels around the globe.
In the NWT, higher than average energy prices make alternative energy systems even more practical and economical going forward. However, the technologies used in other locations are not always suitable under more extreme northern conditions.
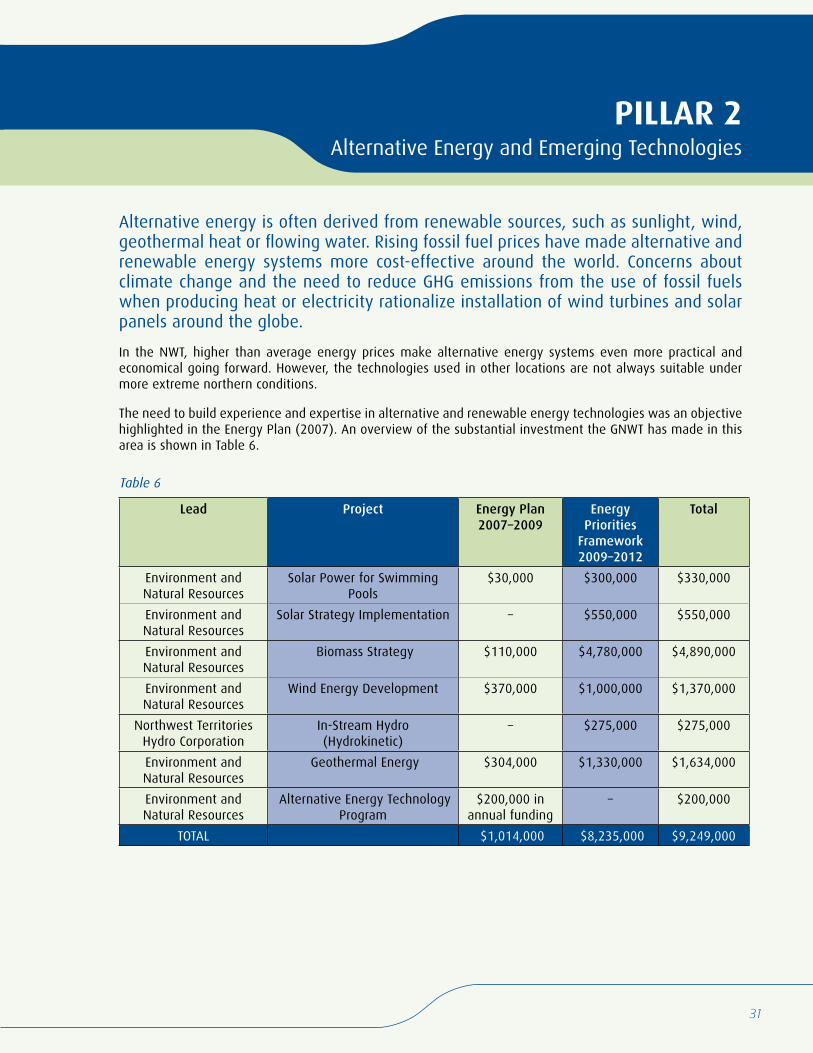
The need to build experience and expertise in alternative and renewable energy technologies was an objective highlighted in the Energy Plan (2007). An overview of the substantial investment the GNWT has made in this area is shown in Table 6.
Lead Project Energy Plan 2007–2009
Energy Priorities
Framework 2009–2012
Total
Environment and Natural Resources
Solar Power for Swimming Pools
$30,000 $300,000 $330,000
Environment and Natural Resources
Solar Strategy Implementation – $550,000 $550,000
Environment and Natural Resources
Biomass Strategy $110,000 $4,780,000 $4,890,000
Environment and Natural Resources
Wind Energy Development $370,000 $1,000,000 $1,370,000
Northwest Territories Hydro Corporation
In-Stream Hydro (Hydrokinetic)
– $275,000 $275,000
Environment and Natural Resources
Geothermal Energy $304,000 $1,330,000 $1,634,000
Environment and Natural Resources
Alternative Energy Technology Program
$200,000 in annual funding
– $200,000
TOTAL $1,014,000 $8,235,000 $9,249,000
Table 6
32Northwest territories eNergy report – May 2011
PILLAR 2 Alternative Energy and Emerging Technologies
1. Solar Energy DevelopmentProject
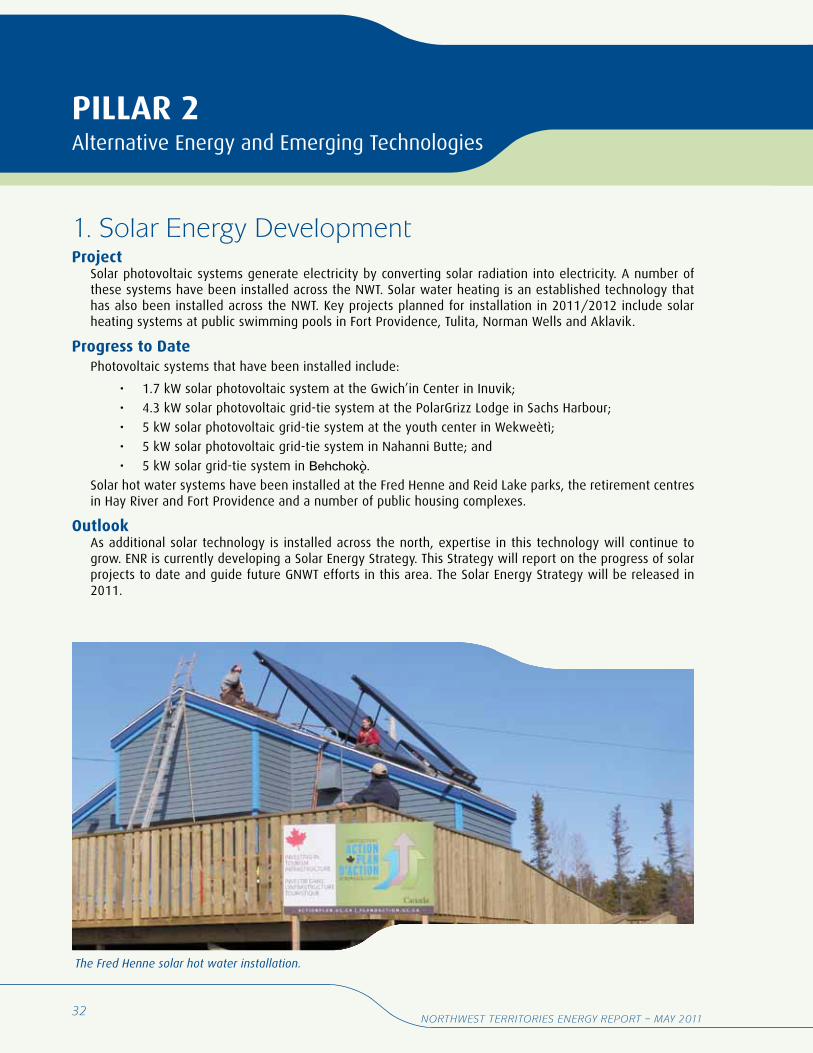
Solar photovoltaic systems generate electricity by converting solar radiation into electricity. A number of these systems have been installed across the NWT. Solar water heating is an established technology that has also been installed across the NWT. Key projects planned for installation in 2011/2012 include solar heating systems at public swimming pools in Fort Providence, Tulita, Norman Wells and Aklavik.
Progress to DatePhotovoltaic systems that have been installed include:
• 1.7 kW solar photovoltaic system at the Gwich’in Center in Inuvik;
• 4.3 kW solar photovoltaic grid-tie system at the PolarGrizz Lodge in Sachs Harbour;
• 5 kW solar photovoltaic grid-tie system at the youth center in Wekweètì;
• 5 kW solar photovoltaic grid-tie system in Nahanni Butte; and
• 5 kW solar grid-tie system in Behchokö.Solar hot water systems have been installed at the Fred Henne and Reid Lake parks, the retirement centres in Hay River and Fort Providence and a number of public housing complexes.
OutlookAs additional solar technology is installed across the north, expertise in this technology will continue to grow. ENR is currently developing a Solar Energy Strategy. This Strategy will report on the progress of solar projects to date and guide future GNWT efforts in this area. The Solar Energy Strategy will be released in 2011.
The Fred Henne solar hot water installation.
33
PILLAR 2 Alternative Energy and Emerging Technologies
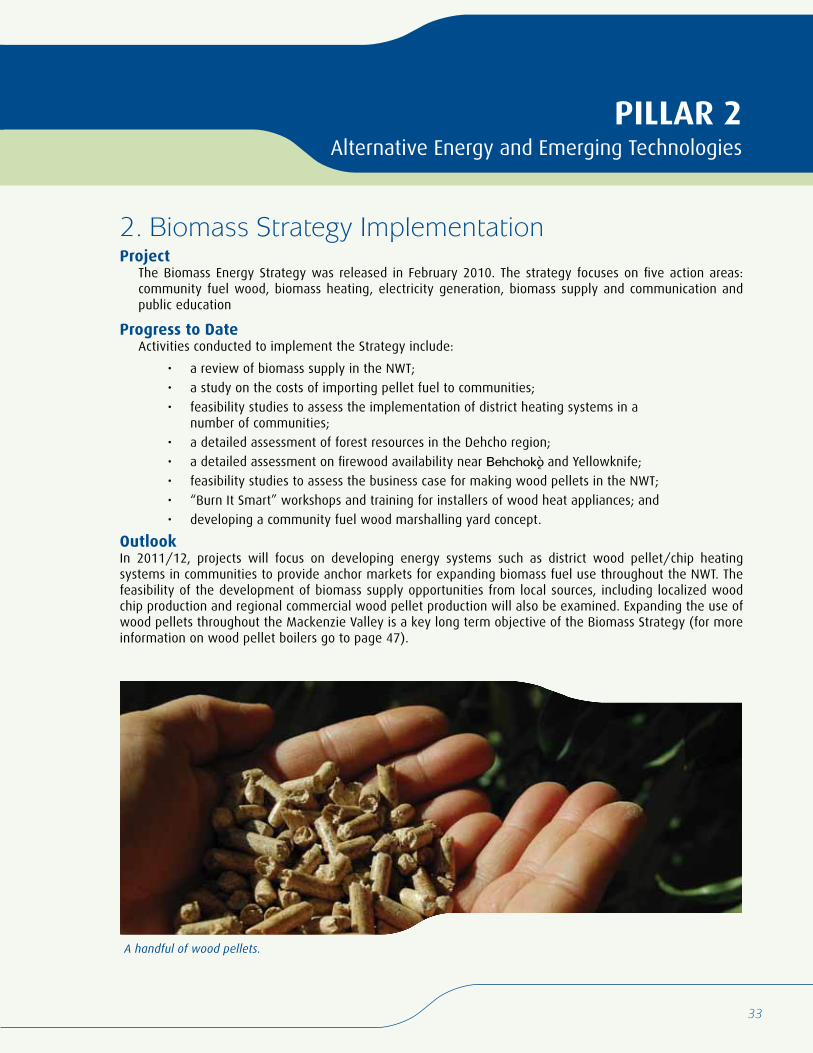
2. Biomass Strategy ImplementationProject
The Biomass Energy Strategy was released in February 2010. The strategy focuses on five action areas: community fuel wood, biomass heating, electricity generation, biomass supply and communication and public education
Progress to DateActivities conducted to implement the Strategy include:
• a review of biomass supply in the NWT;
• a study on the costs of importing pellet fuel to communities;
• feasibility studies to assess the implementation of district heating systems in a number of communities;
• a detailed assessment of forest resources in the Dehcho region;
• a detailed assessment on firewood availability near Behchokö and Yellowknife;
• feasibility studies to assess the business case for making wood pellets in the NWT;
• “Burn It Smart” workshops and training for installers of wood heat appliances; and
• developing a community fuel wood marshalling yard concept.
OutlookIn 2011/12, projects will focus on developing energy systems such as district wood pellet/chip heating systems in communities to provide anchor markets for expanding biomass fuel use throughout the NWT. The feasibility of the development of biomass supply opportunities from local sources, including localized wood chip production and regional commercial wood pellet production will also be examined. Expanding the use of wood pellets throughout the Mackenzie Valley is a key long term objective of the Biomass Strategy (for more information on wood pellet boilers go to page 47).
A handful of wood pellets.
34Northwest territories eNergy report – May 2011
PILLAR 2 Alternative Energy and Emerging Technologies
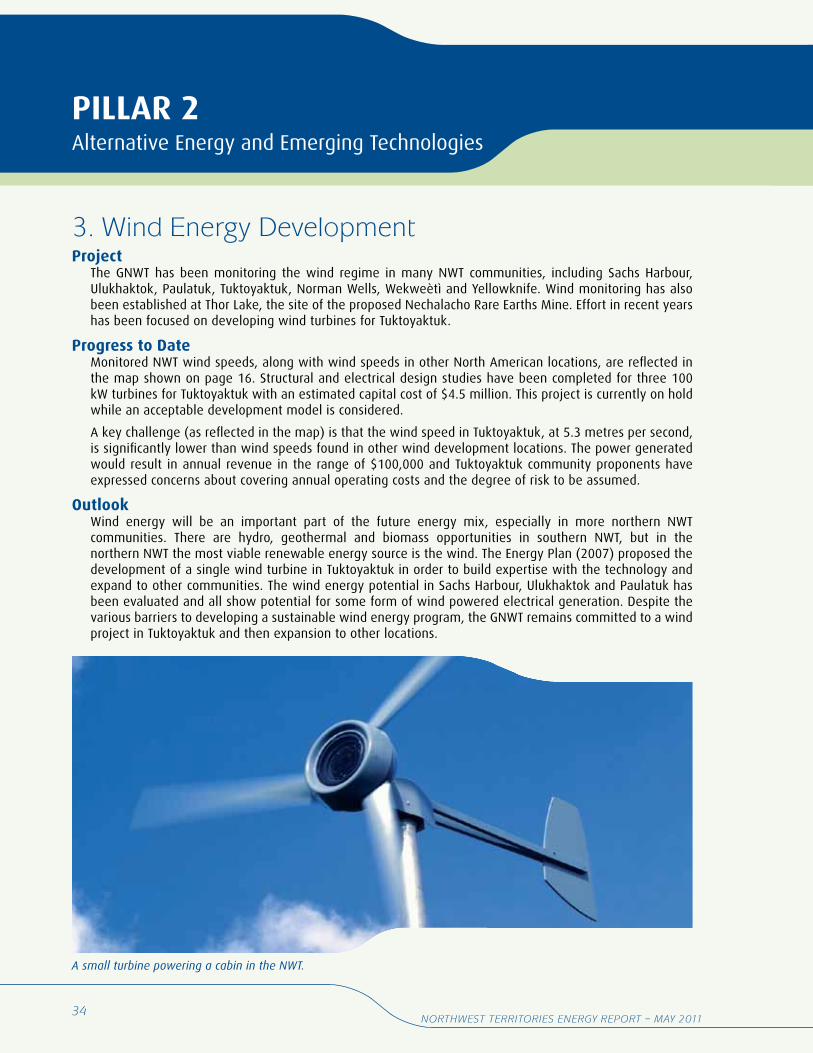
3. Wind Energy DevelopmentProject
The GNWT has been monitoring the wind regime in many NWT communities, including Sachs Harbour, Ulukhaktok, Paulatuk, Tuktoyaktuk, Norman Wells, Wekweètì and Yellowknife. Wind monitoring has also been established at Thor Lake, the site of the proposed Nechalacho Rare Earths Mine. Effort in recent years has been focused on developing wind turbines for Tuktoyaktuk.
Progress to DateMonitored NWT wind speeds, along with wind speeds in other North American locations, are reflected in the map shown on page 16. Structural and electrical design studies have been completed for three 100 kW turbines for Tuktoyaktuk with an estimated capital cost of $4.5 million. This project is currently on hold while an acceptable development model is considered.
A key challenge (as reflected in the map) is that the wind speed in Tuktoyaktuk, at 5.3 metres per second, is significantly lower than wind speeds found in other wind development locations. The power generated would result in annual revenue in the range of $100,000 and Tuktoyaktuk community proponents have expressed concerns about covering annual operating costs and the degree of risk to be assumed.
OutlookWind energy will be an important part of the future energy mix, especially in more northern NWT communities. There are hydro, geothermal and biomass opportunities in southern NWT, but in the northern NWT the most viable renewable energy source is the wind. The Energy Plan (2007) proposed the development of a single wind turbine in Tuktoyaktuk in order to build expertise with the technology and expand to other communities. The wind energy potential in Sachs Harbour, Ulukhaktok and Paulatuk has been evaluated and all show potential for some form of wind powered electrical generation. Despite the various barriers to developing a sustainable wind energy program, the GNWT remains committed to a wind project in Tuktoyaktuk and then expansion to other locations.
A small turbine powering a cabin in the NWT.
35
PILLAR 2 Alternative Energy and Emerging Technologies
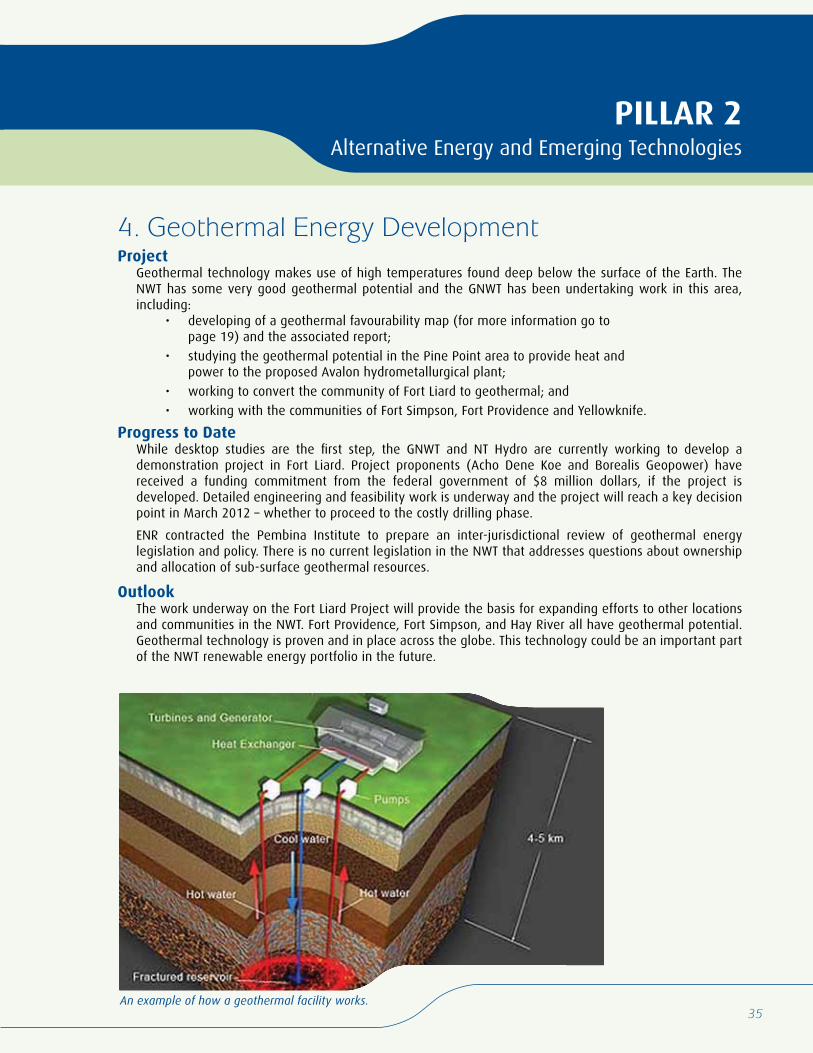
4. Geothermal Energy DevelopmentProject
Geothermal technology makes use of high temperatures found deep below the surface of the Earth. The NWT has some very good geothermal potential and the GNWT has been undertaking work in this area, including:
• developing of a geothermal favourability map (for more information go to page 19) and the associated report;
• studying the geothermal potential in the Pine Point area to provide heat and power to the proposed Avalon hydrometallurgical plant;
• working to convert the community of Fort Liard to geothermal; and
• working with the communities of Fort Simpson, Fort Providence and Yellowknife.
Progress to DateWhile desktop studies are the first step, the GNWT and NT Hydro are currently working to develop a demonstration project in Fort Liard. Project proponents (Acho Dene Koe and Borealis Geopower) have received a funding commitment from the federal government of $8 million dollars, if the project is developed. Detailed engineering and feasibility work is underway and the project will reach a key decision point in March 2012 – whether to proceed to the costly drilling phase.
ENR contracted the Pembina Institute to prepare an inter-jurisdictional review of geothermal energy legislation and policy. There is no current legislation in the NWT that addresses questions about ownership and allocation of sub-surface geothermal resources.
OutlookThe work underway on the Fort Liard Project will provide the basis for expanding efforts to other locations and communities in the NWT. Fort Providence, Fort Simpson, and Hay River all have geothermal potential. Geothermal technology is proven and in place across the globe. This technology could be an important part of the NWT renewable energy portfolio in the future.
An example of how a geothermal facility works.
36Northwest territories eNergy report – May 2011
PILLAR 2 Alternative Energy and Emerging Technologies
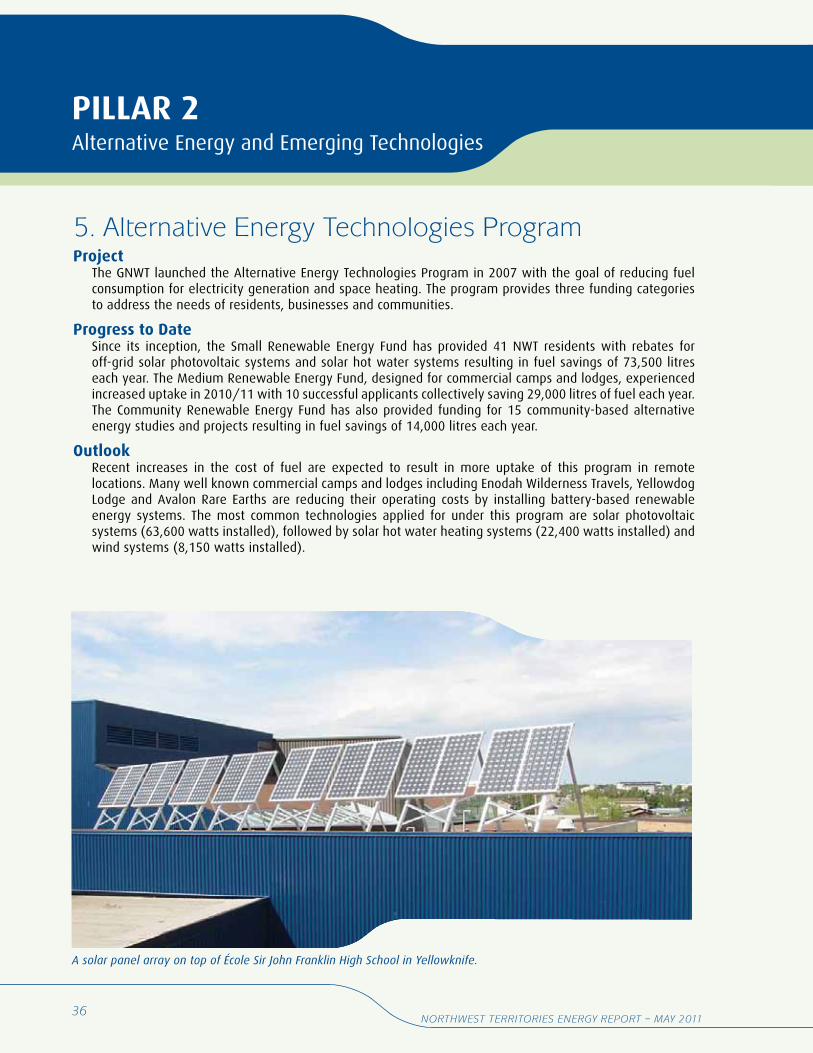
5. Alternative Energy Technologies ProgramProject
The GNWT launched the Alternative Energy Technologies Program in 2007 with the goal of reducing fuel consumption for electricity generation and space heating. The program provides three funding categories to address the needs of residents, businesses and communities.
Progress to DateSince its inception, the Small Renewable Energy Fund has provided 41 NWT residents with rebates for off-grid solar photovoltaic systems and solar hot water systems resulting in fuel savings of 73,500 litres each year. The Medium Renewable Energy Fund, designed for commercial camps and lodges, experienced increased uptake in 2010/11 with 10 successful applicants collectively saving 29,000 litres of fuel each year. The Community Renewable Energy Fund has also provided funding for 15 community-based alternative energy studies and projects resulting in fuel savings of 14,000 litres each year.
OutlookRecent increases in the cost of fuel are expected to result in more uptake of this program in remote locations. Many well known commercial camps and lodges including Enodah Wilderness Travels, Yellowdog Lodge and Avalon Rare Earths are reducing their operating costs by installing battery-based renewable energy systems. The most common technologies applied for under this program are solar photovoltaic systems (63,600 watts installed), followed by solar hot water heating systems (22,400 watts installed) and wind systems (8,150 watts installed).
A solar panel array on top of École Sir John Franklin High School in Yellowknife.
37
PILLAR 2 Alternative Energy and Emerging Technologies
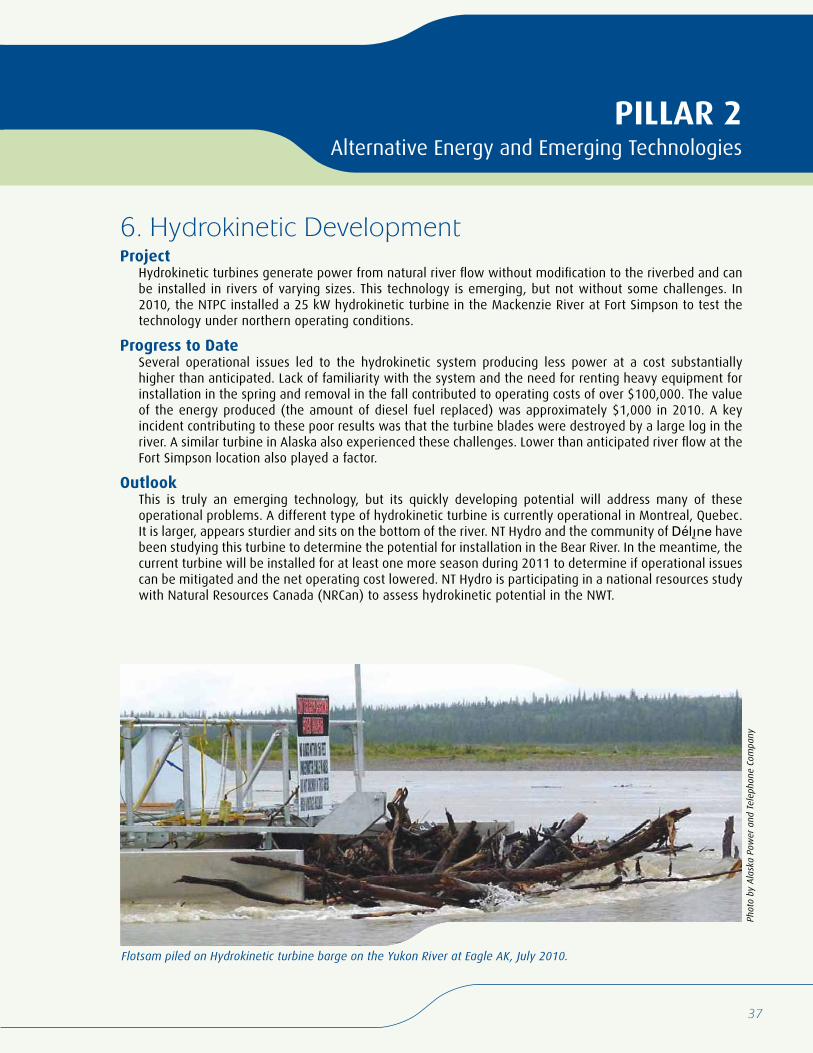
6. Hydrokinetic DevelopmentProject
Hydrokinetic turbines generate power from natural river flow without modification to the riverbed and can be installed in rivers of varying sizes. This technology is emerging, but not without some challenges. In 2010, the NTPC installed a 25 kW hydrokinetic turbine in the Mackenzie River at Fort Simpson to test the technology under northern operating conditions.
Progress to DateSeveral operational issues led to the hydrokinetic system producing less power at a cost substantially higher than anticipated. Lack of familiarity with the system and the need for renting heavy equipment for installation in the spring and removal in the fall contributed to operating costs of over $100,000. The value of the energy produced (the amount of diesel fuel replaced) was approximately $1,000 in 2010. A key incident contributing to these poor results was that the turbine blades were destroyed by a large log in the river. A similar turbine in Alaska also experienced these challenges. Lower than anticipated river flow at the Fort Simpson location also played a factor.
OutlookThis is truly an emerging technology, but its quickly developing potential will address many of these operational problems. A different type of hydrokinetic turbine is currently operational in Montreal, Quebec. It is larger, appears sturdier and sits on the bottom of the river. NT Hydro and the community of Délîne have been studying this turbine to determine the potential for installation in the Bear River. In the meantime, the current turbine will be installed for at least one more season during 2011 to determine if operational issues can be mitigated and the net operating cost lowered. NT Hydro is participating in a national resources study with Natural Resources Canada (NRCan) to assess hydrokinetic potential in the NWT.
Flotsam piled on Hydrokinetic turbine barge on the Yukon River at Eagle AK, July 2010.
Phot
o by
Ala
ska
Pow
er a
nd T
elep
hone
Com
pany
38Northwest territories eNergy report – May 2011
PILLAR 3 Energy Conservation and Efficiency
Rising fuel costs contribute significantly to the high cost of living in the north. While the increasing use of wood and wood pellets will lower heating costs, fossil fuels are likely to remain the dominant form of energy for home heating, transportation and in many communities, electricity generation–for years to come.
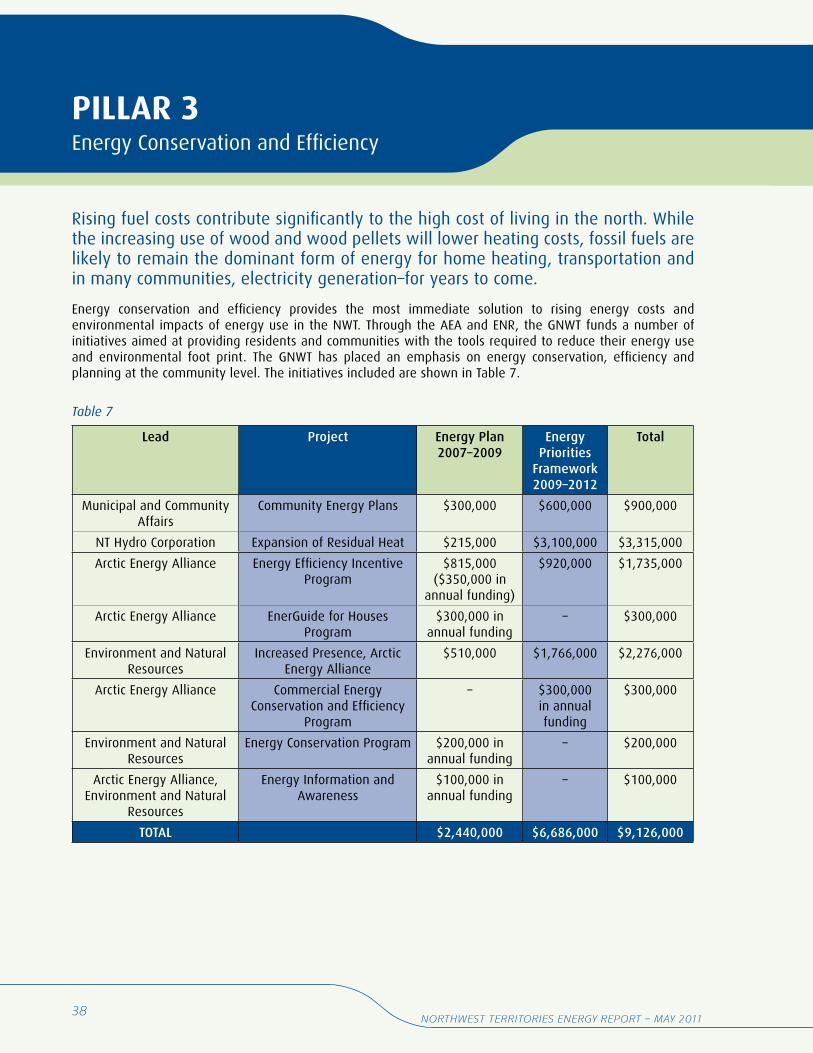
Energy conservation and efficiency provides the most immediate solution to rising energy costs and environmental impacts of energy use in the NWT. Through the AEA and ENR, the GNWT funds a number of initiatives aimed at providing residents and communities with the tools required to reduce their energy use and environmental foot print. The GNWT has placed an emphasis on energy conservation, efficiency and planning at the community level. The initiatives included are shown in Table 7.
Lead Project Energy Plan 2007–2009
Energy Priorities
Framework 2009–2012
Total
Municipal and Community Affairs
Community Energy Plans $300,000 $600,000 $900,000
NT Hydro Corporation Expansion of Residual Heat $215,000 $3,100,000 $3,315,000
Arctic Energy Alliance Energy Efficiency Incentive Program
$815,000 ($350,000 in
annual funding)
$920,000 $1,735,000
Arctic Energy Alliance EnerGuide for Houses Program
$300,000 in annual funding
– $300,000
Environment and Natural Resources
Increased Presence, Arctic Energy Alliance
$510,000 $1,766,000 $2,276,000
Arctic Energy Alliance Commercial Energy Conservation and Efficiency
Program
– $300,000 in annual funding
$300,000
Environment and Natural Resources
Energy Conservation Program $200,000 in annual funding
– $200,000
Arctic Energy Alliance, Environment and Natural
Resources
Energy Information and Awareness
$100,000 in annual funding
– $100,000
TOTAL $2,440,000 $6,686,000 $9,126,000
Table 7
39
1. Community Energy PlansProject
MACA has provided the funding to the AEA to assist communities with Community Energy Plans since 2006/07. The energy plan is one required element of the Integrated Community Sustainability Plans.
Progress to Date MACA worked with the AEA to complete Community Energy Plans for each community by March 2010. The AEA also created a toolkit that included an energy profile (which shows the current energy consumption information for the community) and a number of actions the community could choose to undertake to reduce their energy use.
The focus has now shifted from plan development to implementation of the Integrated Community Sustainability Plans. Work includes a sustainable planning conference and 5 to 8 community-based energy initiatives (at least 1 in each of the 5 regions).
OutlookMACA and the Northwest Territories Association of Communities (NWTAC), with input from the AEA, have developed a work plan to provide support to community governments for implementing their respective Community Energy Plan. It is anticipated that most community governments will implement their Community Energy Plan by the end of 2012.
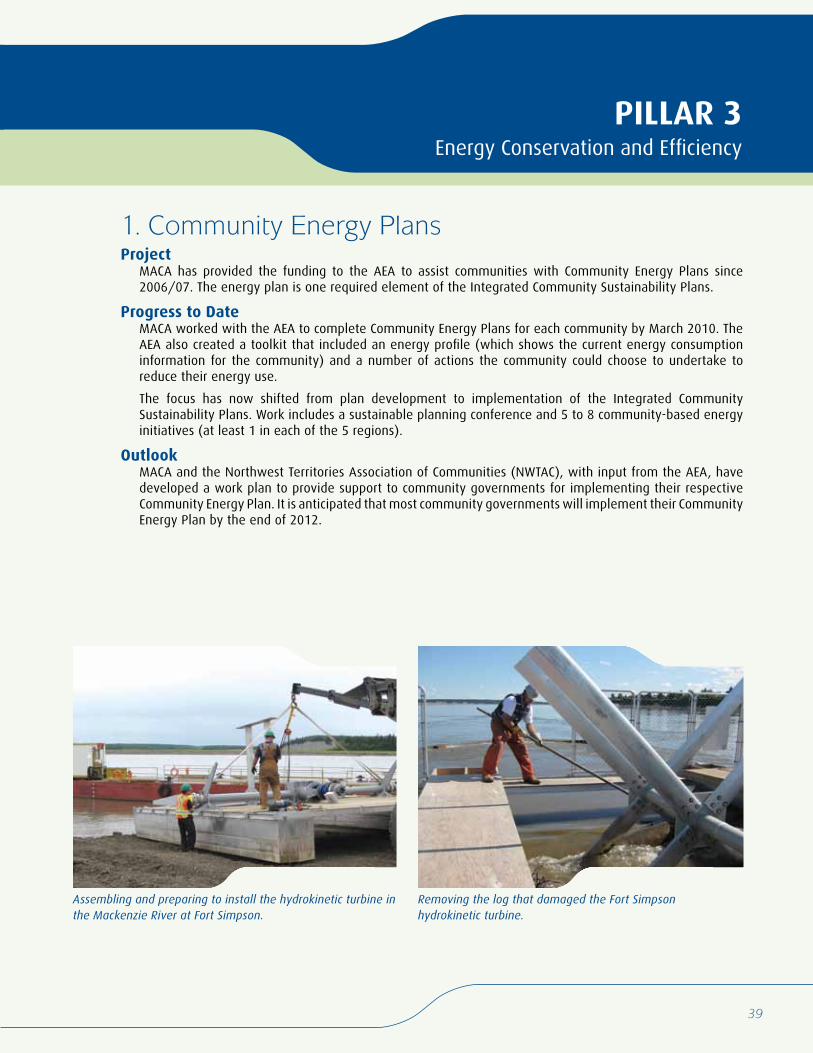
PILLAR 3 Energy Conservation and Efficiency
Assembling and preparing to install the hydrokinetic turbine in the Mackenzie River at Fort Simpson.
Removing the log that damaged the Fort Simpson hydrokinetic turbine.
40Northwest territories eNergy report – May 2011
The arctic Energy alliance
The AEA is a non-government organization that is responsible for delivering the majority of GNWT programs in the areas of energy conservation, efficiency and awareness. The AEA has five business lines aimed at individuals, communities and businesses to reduce energy consumption, reduce green house gas emissions, and replace fossil fuels.
1. Energy Information and Awareness – providing residents, communities and businesses with the information they need to save energy, money and the environment.
2. Energy Efficient Homes and Businesses – this includes energy audits, advice, and financial support for residents and businesses to reduce their energy use and save money.
3. Energy Efficient Appliances – promoted through information and direct financial incentives.
4. Promotion of Alternative Energy – research and promotion of more sustainable energy options such as biomass and solar energy.
5. Innovation – research and promotion of innovative energy solutions such as energy project financing and partnerships with the private sector.
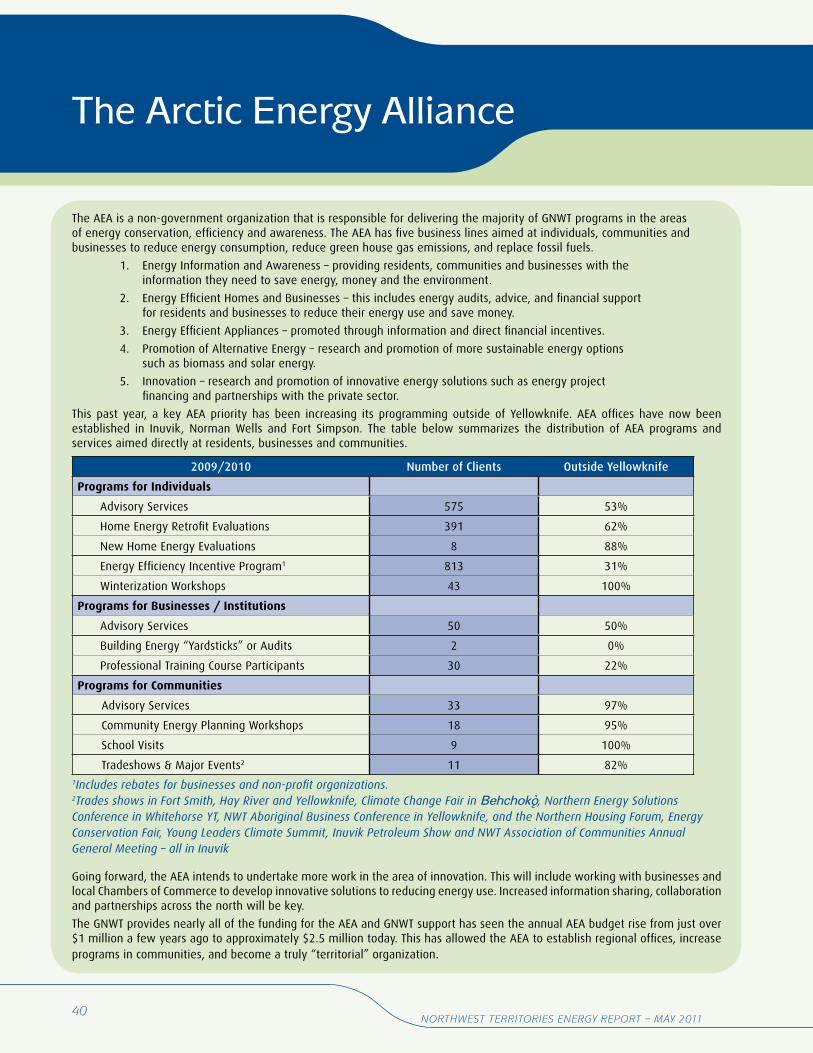
This past year, a key AEA priority has been increasing its programming outside of Yellowknife. AEA offices have now been established in Inuvik, Norman Wells and Fort Simpson. The table below summarizes the distribution of AEA programs and services aimed directly at residents, businesses and communities.
2009/2010 Number of Clients Outside Yellowknife
Programs for Individuals
Advisory Services 575 53%
Home Energy Retrofit Evaluations 391 62%
New Home Energy Evaluations 8 88%
Energy Efficiency Incentive Program1 813 31%
Winterization Workshops 43 100%
Programs for Businesses / Institutions
Advisory Services 50 50%
Building Energy “Yardsticks” or Audits 2 0%
Professional Training Course Participants 30 22%
Programs for Communities
Advisory Services 33 97%
Community Energy Planning Workshops 18 95%
School Visits 9 100%
Tradeshows & Major Events2 11 82%1Includes rebates for businesses and non-profit organizations.2Trades shows in Fort Smith, Hay River and Yellowknife, Climate Change Fair in Behchokö, Northern Energy Solutions Conference in Whitehorse YT, NWT Aboriginal Business Conference in Yellowknife, and the Northern Housing Forum, Energy Conservation Fair, Young Leaders Climate Summit, Inuvik Petroleum Show and NWT Association of Communities Annual General Meeting – all in Inuvik
Going forward, the AEA intends to undertake more work in the area of innovation. This will include working with businesses and local Chambers of Commerce to develop innovative solutions to reducing energy use. Increased information sharing, collaboration and partnerships across the north will be key.
The GNWT provides nearly all of the funding for the AEA and GNWT support has seen the annual AEA budget rise from just over $1 million a few years ago to approximately $2.5 million today. This has allowed the AEA to establish regional offices, increase programs in communities, and become a truly “territorial” organization.
41
PILLAR 3 Energy Conservation and Efficiency
2. Increased Presence of the Arctic Energy AllianceProject
The AEA has been a lead agency in the promotion of energy conservation and efficiency programs in the NWT for several years. Based in Yellowknife, it has been challenging for the AEA to conduct community outreach programs across the entire NWT. The establishment of smaller regional offices was intended to extend the reach of AEA programs from the North Slave Region to communities across the NWT. For more detail on the AEA, see page 40.
Progress to DateTwo regional offices have been created since 2009/10 to increase the presence of the AEA in NWT communities, one in Inuvik (2009/10) and the other in Norman Wells (2010/11), at a total cost of $392,000. The regional offices work to advance energy projects within the region by assisting home owners to overcome barriers faced in implementing advice received from the AEA. The Inuvik Regional office is currently implementing a woodstove exchange pilot project in Aklavik while the Norman Wells office is planning a light bulb switch project in the Sahtu region.
OutlookIn 2011/12, a new office will be opened in Fort Simpson at an estimated cost of $196,000. Combined with the new offices in Norman Wells and Inuvik, the AEA will be in a much better position to deliver its energy efficiency programs across the entire NWT. This will maximize opportunities for businesses and individuals to reduce energy consumption as well as GHG emissions.
The head office of the AEA located in Yellowknife.
42Northwest territories eNergy report – May 2011
PILLAR 3 Energy Conservation and Efficiency
3. Energy Efficiency Incentive Program Project
The Energy Efficiency Incentive Program (EEIP) was launched in 2007/08 to provide financial incentives to residents to purchase more energy efficient products. This program involved the delivery of home energy audits and subsidizing homeowner’s investments in energy efficiency.
Progress to Date Since 2007/08, almost $1 million has been spent to provide 2,850 rebates to residents across the NWT, reducing GHG emissions by an estimated total of 6,000 tonnes. In 2010/11, 750 rebates were given out at a total cost of $250,000 as homeowners took advantage of the federal funding program ending March 2011.
Since 2008/09 this project developed and delivered winterization workshops to train youth in communities about simple energy efficiency upgrades. Ten winterization workshops have been held to date in Inuvik, Fort Providence, Paulatuk, Aklavik, Fort Good Hope, Tuktoyaktuk, Tsiigehtchic, Fort Resolution, Fort Providence and Fort McPherson. A vendor outreach component was also added to the EEIP in 2010/11 to enhance vendor understanding of energy efficiency and the Energy Star and EnerGuide labels on products.
Outlook The program will focus mainly on providing rebates for energy efficient appliances purchased by residents and will continue to provide home renovation rebates for doors and windows, installed in 2010/11.
Financial incentives to purchase energy efficient products.
43
PILLAR 3 Energy Conservation and Efficiency
4. EnerGuide for Houses ProgramProject
The EGH Program is a national program designed by NRCan and implemented in the NWT by the AEA with the financial support of the GNWT. The program provides energy audits with recommendations on potential energy efficiency upgrades for home owners (A inspection). After renovations are complete, auditors evaluates the impact of the renovations on the home’s energy consumption (B inspection).
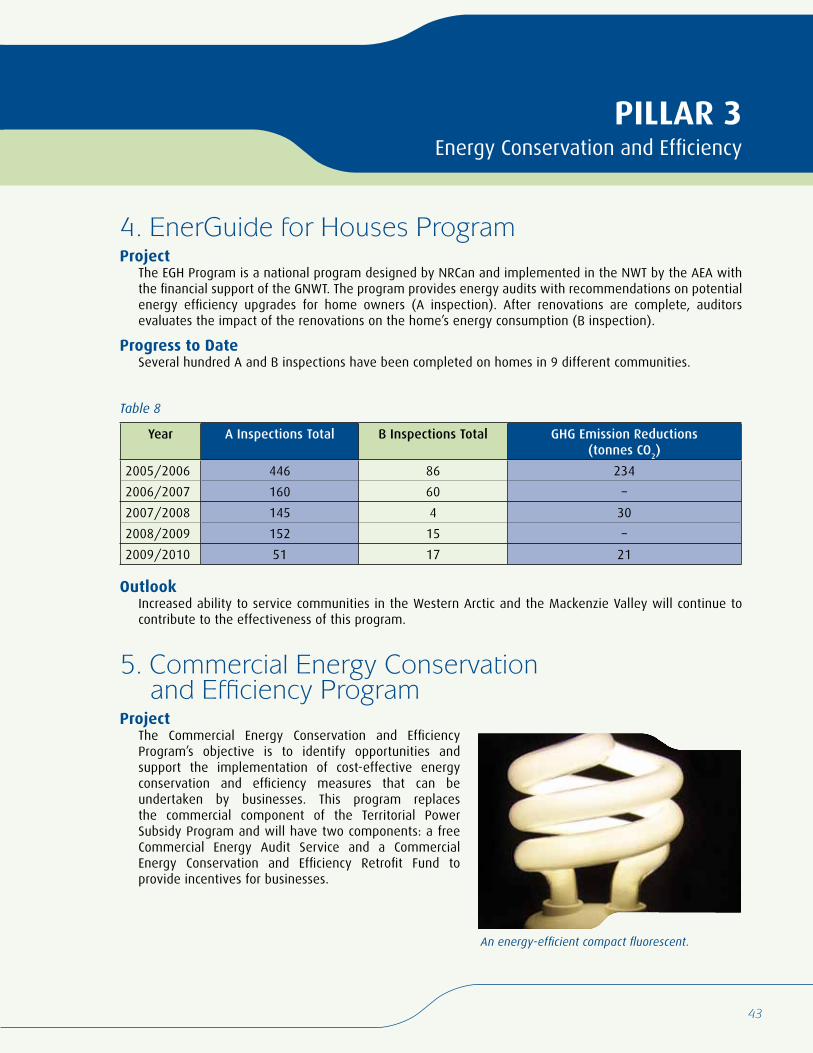
Progress to Date Several hundred A and B inspections have been completed on homes in 9 different communities.
Year A Inspections Total B Inspections Total GHG Emission Reductions (tonnes CO
2)
2005/2006 446 86 234
2006/2007 160 60 –
2007/2008 145 4 30
2008/2009 152 15 –
2009/2010 51 17 21
OutlookIncreased ability to service communities in the Western Arctic and the Mackenzie Valley will continue to contribute to the effectiveness of this program.
5. Commercial Energy Conservation and Efficiency Program
ProjectThe Commercial Energy Conservation and Efficiency Program’s objective is to identify opportunities and support the implementation of cost-effective energy conservation and efficiency measures that can be undertaken by businesses. This program replaces the commercial component of the Territorial Power Subsidy Program and will have two components: a free Commercial Energy Audit Service and a Commercial Energy Conservation and Efficiency Retrofit Fund to provide incentives for businesses.
An energy-efficient compact fluorescent.
Table 8
44Northwest territories eNergy report – May 2011
PILLAR 3 Energy Conservation and Efficiency
Progress to Date The Commercial Energy Conservation and Efficiency Program began April 1, 2011. The Commercial Power Subsidy Program it replaces, had very low uptake. The new program increases the subsidy and provides dedicated resources to assist more businesses to take part. The AEA will administer the program and will be responsible for advertising and marketing, performing energy audits and delivering the rebates.
The AEA has identified 5 key energy conservation and efficiency measures based on their GHG emission reduction and energy consumption reduction potential. Eligible businesses will receive a 25 percent rebate on retrofit costs (to a maximum of $10,000) for projects that result in energy savings. The program will target 10 clients in Yellowknife and 10 clients outside of Yellowknife (2 in each of the 5 regions).
Outlook This program was developed in consultation with the Northern Aboriginal Business Association and the NWT Chamber of Commerce to provide an effective program with free energy audits and rebates to businesses. Businesses will continue to be consulted to ensure that the program is functioning as intended.
The Program is consistent with commitments made in the GNWT Electricity Review to eliminate the commercial component of the TPSP. The Program also aligns with the objectives of the GHG Strategy (2007).
6. Energy Information and AwarenessProject
The GNWT funds the development of energy efficiency marketing materials and public outreach through contributions to the AEA. Many community leaders noted that focus and practical advice for immediate actions were required to reduce energy consumption and this program is designed to meet that need.
Progress to DatePublic education and promotion of energy efficiency programs includes updating and promoting the EEIP, Alternative Energy Technologies Program (AETP) and ECP through print, web, radio and direct mail, as well as development and distribution of application forms, brochures and posters.
Funding will also be provided to produce and distribute two DVDs: “Energy Efficiency Today, Energy Tomorrow – Alternative Energy Technologies Program” and “Wood You Like to Save Some Money? Discover the Benefits of Residential and Industrial Wood Heating.”
Outlook Public education and information campaigns to promote energy efficiency programs to NWT residents create greater energy awareness and efficiency, and ensure the continued uptake and success of these programs. ENR will continue to promote energy information and awareness through a number of initiatives.
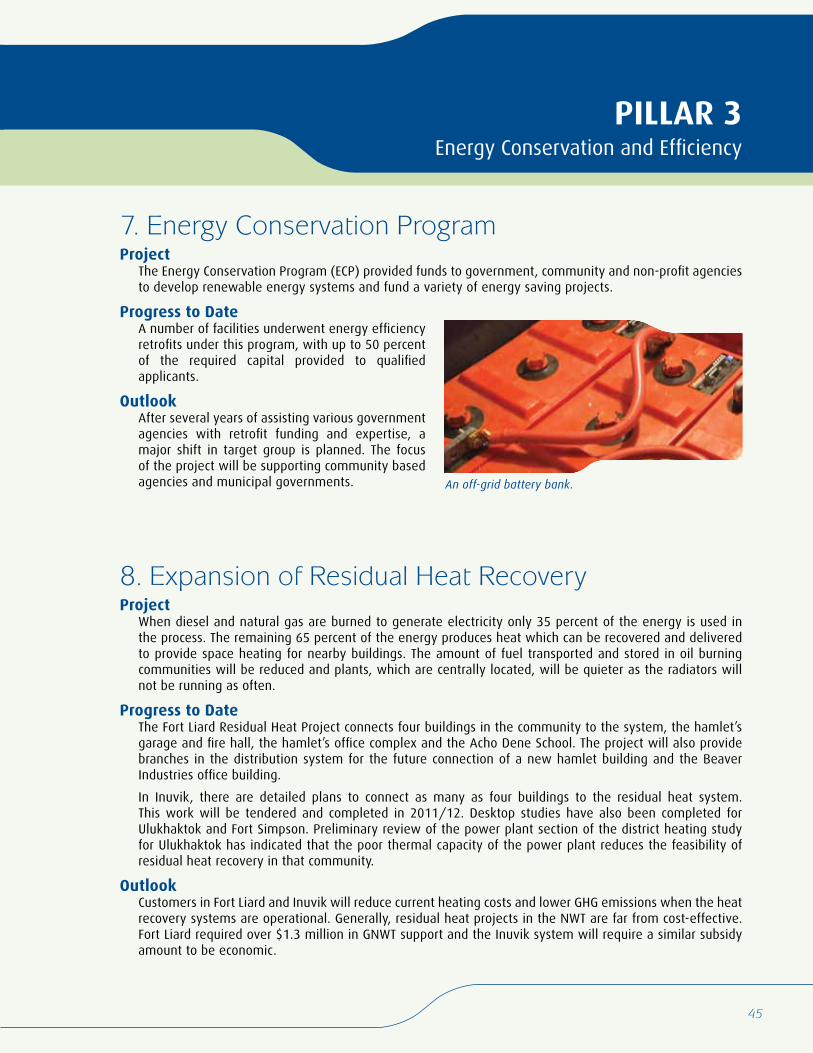
45
PILLAR 3 Energy Conservation and Efficiency
7. Energy Conservation ProgramProject
The Energy Conservation Program (ECP) provided funds to government, community and non-profit agencies to develop renewable energy systems and fund a variety of energy saving projects.
Progress to Date A number of facilities underwent energy efficiency retrofits under this program, with up to 50 percent of the required capital provided to qualified applicants.
Outlook After several years of assisting various government agencies with retrofit funding and expertise, a major shift in target group is planned. The focus of the project will be supporting community based agencies and municipal governments.
8. Expansion of Residual Heat Recovery Project
When diesel and natural gas are burned to generate electricity only 35 percent of the energy is used in the process. The remaining 65 percent of the energy produces heat which can be recovered and delivered to provide space heating for nearby buildings. The amount of fuel transported and stored in oil burning communities will be reduced and plants, which are centrally located, will be quieter as the radiators will not be running as often.
Progress to DateThe Fort Liard Residual Heat Project connects four buildings in the community to the system, the hamlet’s garage and fire hall, the hamlet’s office complex and the Acho Dene School. The project will also provide branches in the distribution system for the future connection of a new hamlet building and the Beaver Industries office building.
In Inuvik, there are detailed plans to connect as many as four buildings to the residual heat system. This work will be tendered and completed in 2011/12. Desktop studies have also been completed for Ulukhaktok and Fort Simpson. Preliminary review of the power plant section of the district heating study for Ulukhaktok has indicated that the poor thermal capacity of the power plant reduces the feasibility of residual heat recovery in that community.
OutlookCustomers in Fort Liard and Inuvik will reduce current heating costs and lower GHG emissions when the heat recovery systems are operational. Generally, residual heat projects in the NWT are far from cost-effective. Fort Liard required over $1.3 million in GNWT support and the Inuvik system will require a similar subsidy amount to be economic.
An off-grid battery bank.
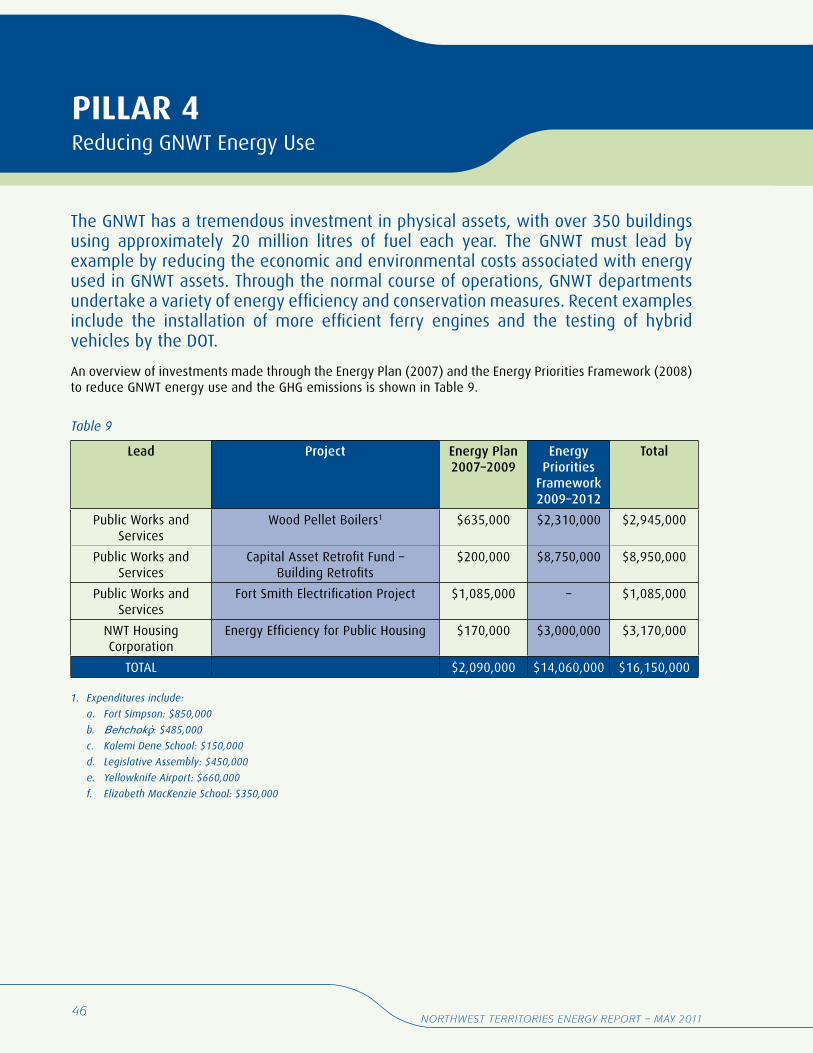
46Northwest territories eNergy report – May 2011
PILLAR 4 Reducing GNWT Energy Use
The GNWT has a tremendous investment in physical assets, with over 350 buildings using approximately 20 million litres of fuel each year. The GNWT must lead by example by reducing the economic and environmental costs associated with energy used in GNWT assets. Through the normal course of operations, GNWT departments undertake a variety of energy efficiency and conservation measures. Recent examples include the installation of more efficient ferry engines and the testing of hybrid vehicles by the DOT.
An overview of investments made through the Energy Plan (2007) and the Energy Priorities Framework (2008) to reduce GNWT energy use and the GHG emissions is shown in Table 9.
Lead Project Energy Plan 2007–2009
Energy Priorities
Framework 2009–2012
Total
Public Works and Services
Wood Pellet Boilers1 $635,000 $2,310,000 $2,945,000
Public Works and Services
Capital Asset Retrofit Fund – Building Retrofits
$200,000 $8,750,000 $8,950,000
Public Works and Services
Fort Smith Electrification Project $1,085,000 – $1,085,000
NWT Housing Corporation
Energy Efficiency for Public Housing $170,000 $3,000,000 $3,170,000
TOTAL $2,090,000 $14,060,000 $16,150,000
1. Expenditures include:
a. Fort Simpson: $850,000
b. Behchokö: $485,000
c. Kalemi Dene School: $150,000
d. Legislative Assembly: $450,000
e. Yellowknife Airport: $660,000
f. Elizabeth MacKenzie School: $350,000
Table 9
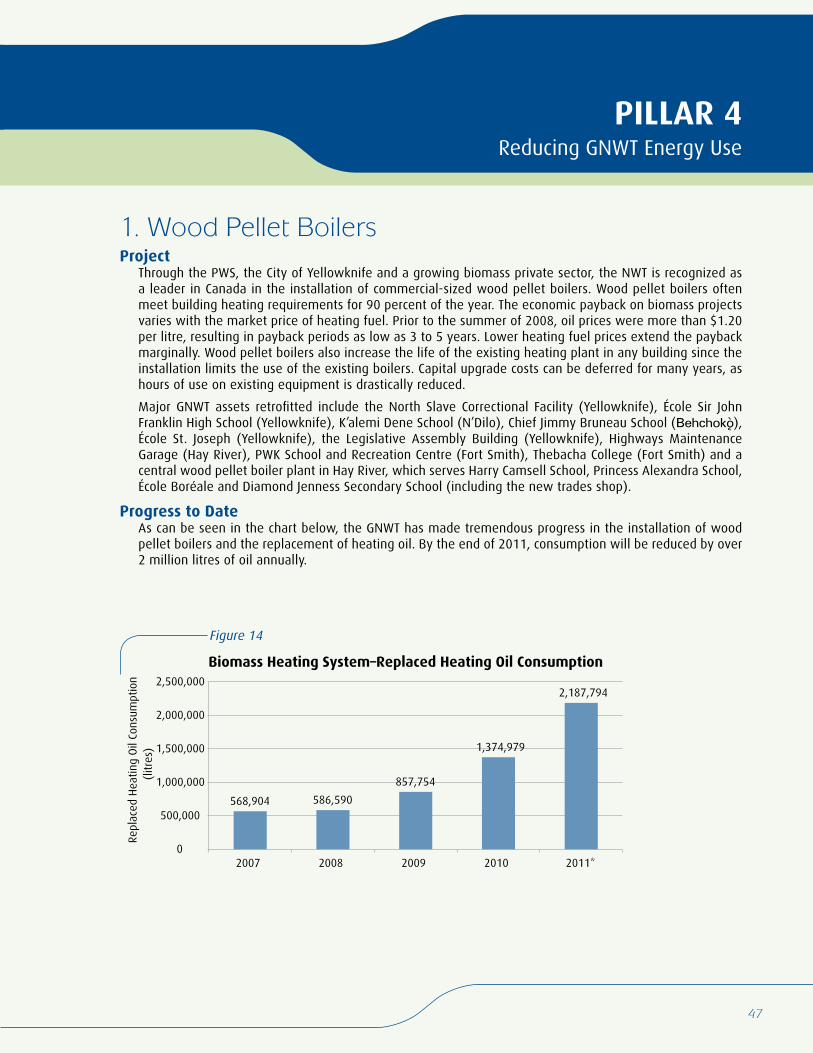
47
PILLAR 4 Reducing GNWT Energy Use
1. Wood Pellet BoilersProject
Through the PWS, the City of Yellowknife and a growing biomass private sector, the NWT is recognized as a leader in Canada in the installation of commercial-sized wood pellet boilers. Wood pellet boilers often meet building heating requirements for 90 percent of the year. The economic payback on biomass projects varies with the market price of heating fuel. Prior to the summer of 2008, oil prices were more than $1.20 per litre, resulting in payback periods as low as 3 to 5 years. Lower heating fuel prices extend the payback marginally. Wood pellet boilers also increase the life of the existing heating plant in any building since the installation limits the use of the existing boilers. Capital upgrade costs can be deferred for many years, as hours of use on existing equipment is drastically reduced.
Major GNWT assets retrofitted include the North Slave Correctional Facility (Yellowknife), École Sir John Franklin High School (Yellowknife), K’alemi Dene School (N’Dilo), Chief Jimmy Bruneau School (Behchokö), École St. Joseph (Yellowknife), the Legislative Assembly Building (Yellowknife), Highways Maintenance Garage (Hay River), PWK School and Recreation Centre (Fort Smith), Thebacha College (Fort Smith) and a central wood pellet boiler plant in Hay River, which serves Harry Camsell School, Princess Alexandra School, École Boréale and Diamond Jenness Secondary School (including the new trades shop).
Progress to DateAs can be seen in the chart below, the GNWT has made tremendous progress in the installation of wood pellet boilers and the replacement of heating oil. By the end of 2011, consumption will be reduced by over 2 million litres of oil annually.
568,904 586,590
857,754
1,374,979
2,187,794
0
500,000
1,000,000
1,500,000
2,000,000
2,500,000
2007 2008 2009 2010 2011*
Repl
aced
Hea
ting
Oil
Cons
umpt
ion
(litr
es)
Biomass Heating System–Replaced Heating Oil Consumption
Figure 14
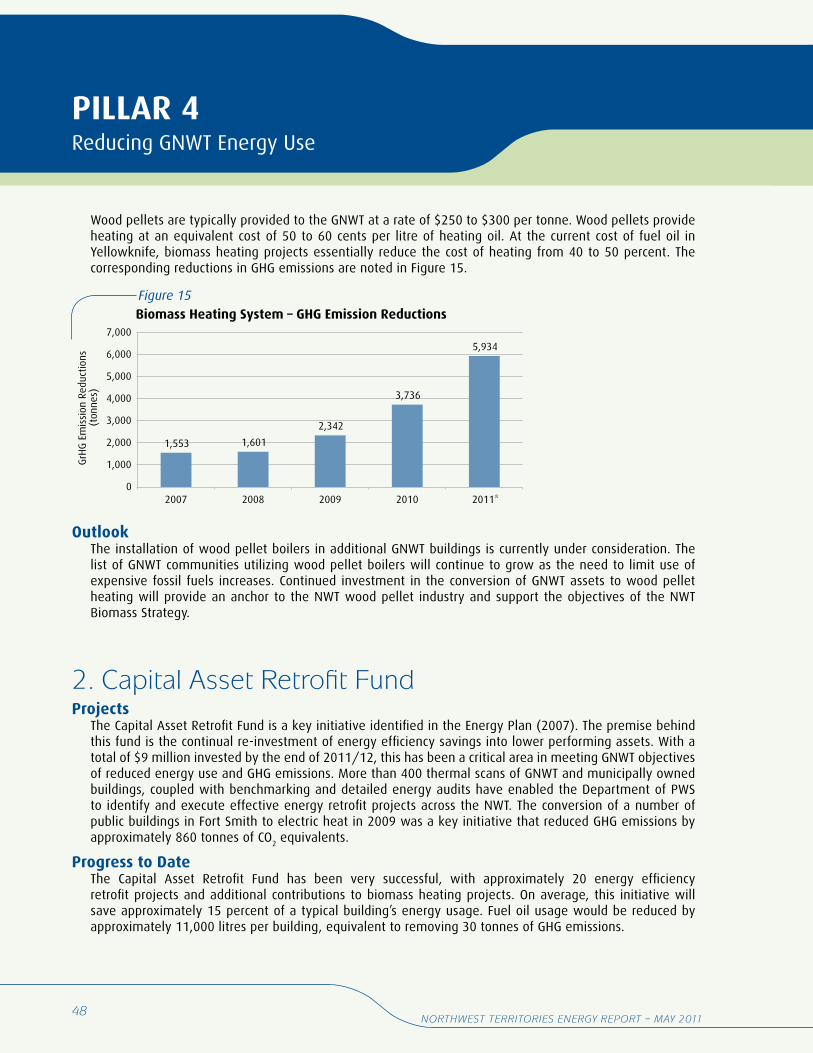
48Northwest territories eNergy report – May 2011
PILLAR 4 Reducing GNWT Energy Use
Wood pellets are typically provided to the GNWT at a rate of $250 to $300 per tonne. Wood pellets provide heating at an equivalent cost of 50 to 60 cents per litre of heating oil. At the current cost of fuel oil in Yellowknife, biomass heating projects essentially reduce the cost of heating from 40 to 50 percent. The corresponding reductions in GHG emissions are noted in Figure 15.
Outlook The installation of wood pellet boilers in additional GNWT buildings is currently under consideration. The list of GNWT communities utilizing wood pellet boilers will continue to grow as the need to limit use of expensive fossil fuels increases. Continued investment in the conversion of GNWT assets to wood pellet heating will provide an anchor to the NWT wood pellet industry and support the objectives of the NWT Biomass Strategy.
2. Capital Asset Retrofit FundProjects
The Capital Asset Retrofit Fund is a key initiative identified in the Energy Plan (2007). The premise behind this fund is the continual re-investment of energy efficiency savings into lower performing assets. With a total of $9 million invested by the end of 2011/12, this has been a critical area in meeting GNWT objectives of reduced energy use and GHG emissions. More than 400 thermal scans of GNWT and municipally owned buildings, coupled with benchmarking and detailed energy audits have enabled the Department of PWS to identify and execute effective energy retrofit projects across the NWT. The conversion of a number of public buildings in Fort Smith to electric heat in 2009 was a key initiative that reduced GHG emissions by approximately 860 tonnes of CO
2 equivalents.
Progress to Date The Capital Asset Retrofit Fund has been very successful, with approximately 20 energy efficiency retrofit projects and additional contributions to biomass heating projects. On average, this initiative will save approximately 15 percent of a typical building’s energy usage. Fuel oil usage would be reduced by approximately 11,000 litres per building, equivalent to removing 30 tonnes of GHG emissions.
1,553 1,601
2,342
3,736
5,934
0
1,000
2,000
3,000
4,000
5,000
6,000
7,000
2007 2008 2009 2010 2011*
GrH
G E
mis
sion
Red
uctio
ns(t
onne
s)
Biomass Heating System – GHG Emission ReductionsFigure 15
49
PILLAR 4 Reducing GNWT Energy Use
There were projects undertaken through the program that experienced challenges, such as a project to install ground source heat pumps at the Aurora College Thebacha Campus. The Project was abandoned due to technical challenges with piping installation and the very low return on investment that would be achieved.
OutlookPWS continues to use utility analysis and detailed energy auditing in the selection of energy efficiency retrofit projects. Large retrofit projects scheduled for 2010/11 and 2011/12, including the Inuvik hospital, Thebacha Campus (Fort Smith) and Mackenzie Mountain School (Norman Wells), will yield significant energy savings in some of the largest energy users in the NWT. Continuous use of biomass heating, residual heat and energy efficiency retrofit projects in smaller assets across the NWT will continue to improve energy conservation and efficiency and benefit overall budget spending on utilities for GNWT assets.
3. Energy Efficiency for Public HousingProject
Since 2008/09 the NWTHC has undertaken substantial energy upgrades on public housing units across the NWT. Types of upgrades for these units include upgrading insulation, replacing heating systems, windows and doors, air sealing and exterior upgrades.
Progress to DateEnergy efficiency often provides the best opportunity for energy savings and rapid return on investment. The NWTHC has targeted the least efficient energy consuming assets in its housing portfolio for energy efficiency upgrades. As of March 2011, a total of 149 units had energy retrofits resulting in lowering operating costs and GHG emission for these units. Proposed units for retrofit were identified through Home Energy Evaluations by the AEA in coordination with the NWTHC. Retrofitted assets are being monitored to assess the effectiveness of the upgrades.
Outlook The NWTHC will continue to retrofit aging public housing to minimize the cost of utility operations and increase the sustainability of the public housing program. The NWTHC plans to implement energy upgrades on 28 public housing units in 2011/12. Collecting baseline data on consumption levels of units pre-retrofitted provides important information on the extent of energy savings from specific renovations.
The minimum standard targeted by the NWTHC is the EGH 80 rating. Going forward, the NWTHC’s overall energy retrofit plan will continue to address several of the highest energy-consuming assets.
The Northwest Territories Housing Corporation recognizes that private homeowners require support to make their homes energy efficient. Through its Contributing Assistance for Repairs and Enhancements (CARE) program, funding is available to qualified homeowners for renovations for energy efficiency upgrades. Eligible improvements could include replacement of heating equipment with an Energy Star® qualified oil or gas furnace, increasing insulation, and replacement of doors or windows with Energy Star® qualified products.
Additionally, the NWTHC has developed and is delivering a home maintenance and repair course under its Solutions to Educate People (STEP) program, an education and counselling program, for clients wishing to access funding or who would like to learn about maintenance. Elements of the course focus on energy conservation.
Recognizing the importance of preventative maintenance in managing energy consumption, the NWTHC also implements ongoing preventative maintenance on its own assets and offers assistance for these activities to low-to moderate-income private homeowners under CARE.
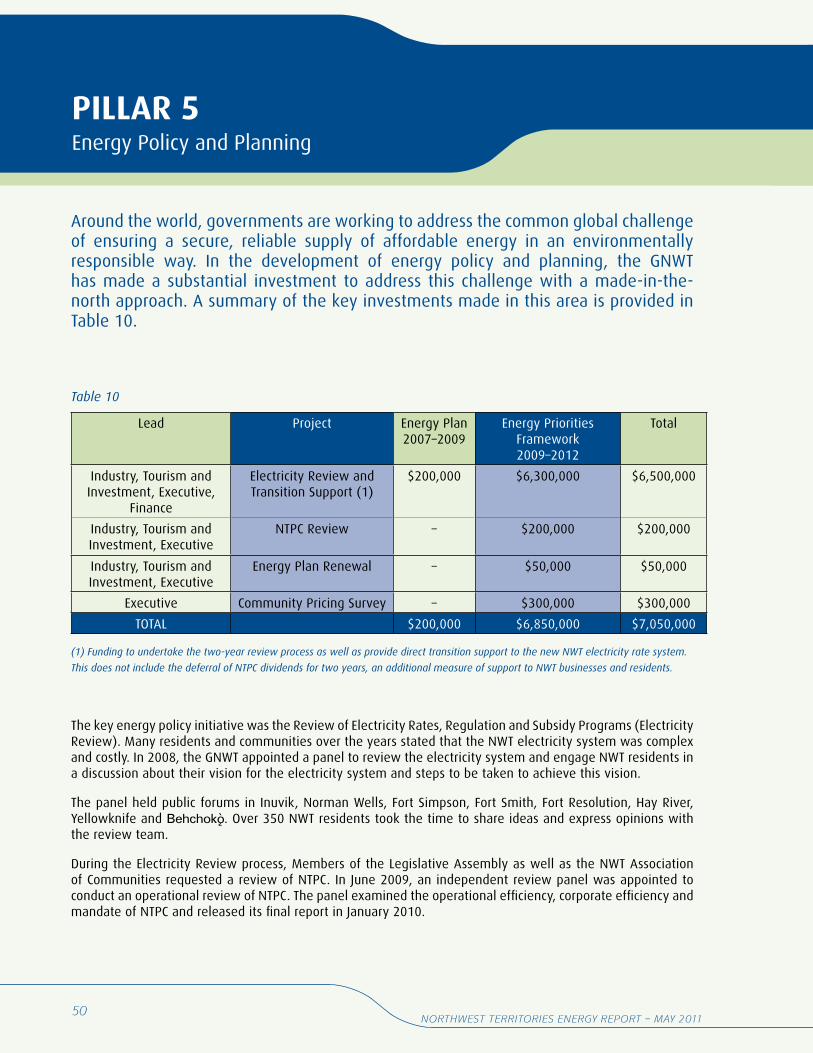
50Northwest territories eNergy report – May 2011
PILLAR 5 Energy Policy and Planning
Around the world, governments are working to address the common global challenge of ensuring a secure, reliable supply of affordable energy in an environmentally responsible way. In the development of energy policy and planning, the GNWT has made a substantial investment to address this challenge with a made-in-the-north approach. A summary of the key investments made in this area is provided in Table 10.
Lead Project Energy Plan 2007–2009
Energy Priorities Framework 2009–2012
Total
Industry, Tourism and Investment, Executive,
Finance
Electricity Review and Transition Support (1)
$200,000 $6,300,000 $6,500,000
Industry, Tourism and Investment, Executive
NTPC Review – $200,000 $200,000
Industry, Tourism and Investment, Executive
Energy Plan Renewal – $50,000 $50,000
Executive Community Pricing Survey – $300,000 $300,000
TOTAL $200,000 $6,850,000 $7,050,000
(1) Funding to undertake the two-year review process as well as provide direct transition support to the new NWT electricity rate system.
This does not include the deferral of NTPC dividends for two years, an additional measure of support to NWT businesses and residents.
The key energy policy initiative was the Review of Electricity Rates, Regulation and Subsidy Programs (Electricity Review). Many residents and communities over the years stated that the NWT electricity system was complex and costly. In 2008, the GNWT appointed a panel to review the electricity system and engage NWT residents in a discussion about their vision for the electricity system and steps to be taken to achieve this vision.
The panel held public forums in Inuvik, Norman Wells, Fort Simpson, Fort Smith, Fort Resolution, Hay River, Yellowknife and Behchokö. Over 350 NWT residents took the time to share ideas and express opinions with the review team.
During the Electricity Review process, Members of the Legislative Assembly as well as the NWT Association of Communities requested a review of NTPC. In June 2009, an independent review panel was appointed to conduct an operational review of NTPC. The panel examined the operational efficiency, corporate efficiency and mandate of NTPC and released its final report in January 2010.
Table 10
51
PILLAR 5 Energy Policy and Planning
In May 2010, the GNWT released Efficient, Affordable and Equitable: Creating a Brighter Future for the Northwest Territories’ Electricity System (Electricity Review). This was a comprehensive response to the Electricity Review Team’s final report and the NTPC Review Panel’s final report. Key changes included the:
• establishment of 7 electricity rate zones, down from 33 community electricity rate zones;
• reduction of the return earned by NTPC in thermal communities;
• consolidation of electricity rate riders to establish territory-wide fuel and low water riders;
• increase of winter thresholds for the TPSP from 700 to 1,000 kWh per month and a decrease of the summer thresholds to 600 kWh per month;
• GNWT investment over 2 years to support the transition to a new system; and
• stronger overall NTPC communication strategy with customers; more direct accountability of NTPC to the NWT Legislative Assembly.
Through the actions detailed in the Electricity Review, the GNWT committed to taking a leadership role to ensure the electricity system is efficient, affordable and all communities in the NWT have equitable access to electricity. The Electricity Review process:
• recognized electricity as an essential service in NWT communities, requiring a territory-wide system;
• took action to dramatically lower the cost of electricity in most NWT communities at no additional cost to any other community;
• reduced the cost of living and the cost of business, making our smaller communities more competitive and sustainable;
• helped stabilize costs for all NWT communities and protected against unexpected price increases; and
• took measures to ensure that our electricity system is efficient and transparent.
The GNWT will continue to monitor the impact of electricity rate reductions and report on the results. The community pricing surveys will quantify the impact of the reduced electricity rates on the cost of living in NWT communities. Lower commercial power rates should be passed onto consumers through lower prices for food and other essential consumer items.
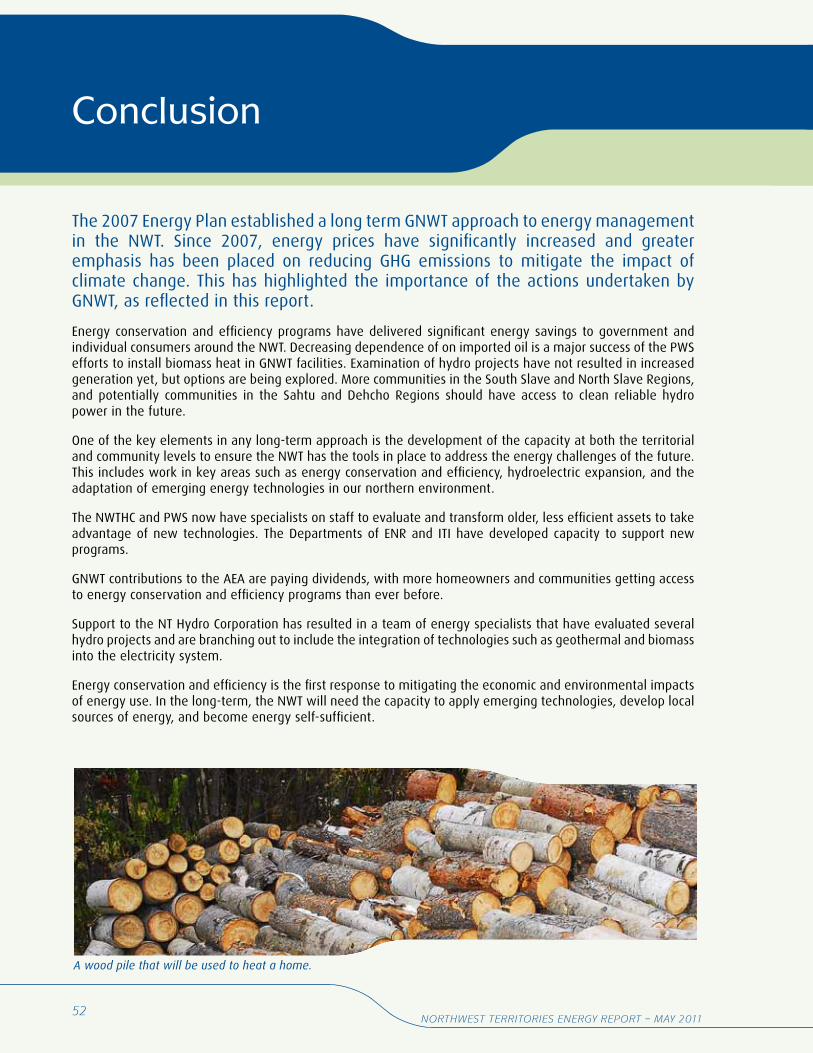
52Northwest territories eNergy report – May 2011
Conclusion
The 2007 Energy Plan established a long term GNWT approach to energy management in the NWT. Since 2007, energy prices have significantly increased and greater emphasis has been placed on reducing GHG emissions to mitigate the impact of climate change. This has highlighted the importance of the actions undertaken by GNWT, as reflected in this report.
Energy conservation and efficiency programs have delivered significant energy savings to government and individual consumers around the NWT. Decreasing dependence of on imported oil is a major success of the PWS efforts to install biomass heat in GNWT facilities. Examination of hydro projects have not resulted in increased generation yet, but options are being explored. More communities in the South Slave and North Slave Regions, and potentially communities in the Sahtu and Dehcho Regions should have access to clean reliable hydro power in the future.
One of the key elements in any long-term approach is the development of the capacity at both the territorial and community levels to ensure the NWT has the tools in place to address the energy challenges of the future. This includes work in key areas such as energy conservation and efficiency, hydroelectric expansion, and the adaptation of emerging energy technologies in our northern environment.
The NWTHC and PWS now have specialists on staff to evaluate and transform older, less efficient assets to take advantage of new technologies. The Departments of ENR and ITI have developed capacity to support new programs.
GNWT contributions to the AEA are paying dividends, with more homeowners and communities getting access to energy conservation and efficiency programs than ever before.
Support to the NT Hydro Corporation has resulted in a team of energy specialists that have evaluated several hydro projects and are branching out to include the integration of technologies such as geothermal and biomass into the electricity system.
Energy conservation and efficiency is the first response to mitigating the economic and environmental impacts of energy use. In the long-term, the NWT will need the capacity to apply emerging technologies, develop local sources of energy, and become energy self-sufficient.
A wood pile that will be used to heat a home.
acronym glossary
Acronym Full Name
AEA Arctic Energy Alliance
AETP Alternative Energy Technologies Program
CARE Contributing Assistance for Repairs and Enhancements
CO2 Carbon Dioxide
DMECC Deputy Minister’s Energy Coordinating Committee
DOT Department of Transportation
ECP Energy Conservation Program
EEIP Energy Efficiency Incentive Program
EGH EnerGuide for Houses
ENR Environment and Natural Resources
GDP Gross Domestic Product
GHG Greenhouse Gas
GJ Gigajoules
GNWT Government of the Northwest Territories
GWh Gigawatt-hours
ITI Industry Tourism and Investment
kT Kilotonne
kW Kilowatt
kWh Kilowatt-hours
m/s Metres per second
MACA Municipal and Community Affairs
MECC Ministerial Energy Coordinating Committee
MGP Mackenzie Gas Project
MJ Megajoules
MW Megawatts
MWh Megawatt-hours
NRCan Natural Resources Canada
NT Hydro Northwest Territories Hydro Corporation
NTPC Northwest Territories Power Corporation
NUL Northland Utilities Limited
NWT Northwest Territories
NWTAC Northwest Territories Association of Communities
NWTHC Northwest Territories Housing Corporation
PWS Public Works and Services
STEP Solutions to Educate People
TPSP Territorial Power Subsidy Program
YK Yellowknife
Northwest TerritoriesEnergy Report
May 2011
Printed on recycled paper


![[Type text] Doing Research in the Northwest Territories Scientific Training Program (NSTP) ... Doing Research in the Northwest Territories. Doing Research in the Northwest Territories](https://static.fdocuments.in/doc/165x107/5add27847f8b9a213e8c7cb5/type-text-doing-research-in-the-northwest-scientific-training-program-nstp-.jpg)