Northside Food Project-Literature Revie · the University of Minnesota, CURA, or NPCR. 3 . Table of...
50
Review of Community Food Security Literature and Future Directions for Addressing Community Food Insecurity in North Minneapolis Prepared by Gillian Lawrence Research Assistant, University of Minnesota Conducted on behalf of the Northside Food Project July, 2007 This report (NPCR 1248) is also available on the CURA website: www.cura.umn.edu/search/index.php
Transcript of Northside Food Project-Literature Revie · the University of Minnesota, CURA, or NPCR. 3 . Table of...
Review of Community Food Security Literature and Future Directions for
Addressing Community Food Insecurity in North Minneapolis
Prepared by Gillian Lawrence
Research Assistant, University of Minnesota Conducted on behalf of the Northside Food Project
July, 2007
This report (NPCR 1248) is also available on the CURA website: www.cura.umn.edu/search/index.php

July, 2007
Neighborhood Planning for Community Revitalization (NPCR) supported the
work of the author of this work, but has not reviewed it for publication. The content is
solely the responsibility of the author and is not necessarily endorsed by NPCR.
NPCR is coordinated by the Center for Urban and Regional Affairs at the University of
Minnesota. NPCR is supported by grants from The Minneapolis Foundation, the
McKnight Foundation, The Bremer Foundation, and The St. Paul Travelers Foundation.
Neighborhood Planning for Community Revitalization
330 Hubert H. Humphrey Center
301 - 19th Avenue South
Minneapolis, MN 55455
phone: 612/625-1020
e-mail: [email protected]
website: http://www.npcr.org

Northside Food Project
Review of Community Food Security Literature
and Future Directions for Addressing Community Food Insecurity
in North Minneapolis
Gillian M. Lawrence
Copyright Gillian M. Lawrence, 2006
1

“Our mission is to be a catalyst for resident empowerment for social, economic and nutritional
improvement in the community.
Our vision is to create a vibrant food advocacy organization that puts the residents of North
Minneapolis at the center of their food system by educating, engaging and organizing the larger
community around the economic, social and nutritional impact of our food choices.”
-Northside Food Project
2

Acknowledgements
This project was supported by Neighborhood Planning for Community Revitalization (NPCR), a
program of the University of Minnesota’s Center for Urban and Regional Affairs (CURA). The
contents of this report are the sole responsibility of the author, and not necessarily endorsed by
the University of Minnesota, CURA, or NPCR.
3

Table of Contents
Executive Summary ........................................................................................................................ 5
Relationship of Diet Patterns to Chronic Disease........................................................................... 7
Food Insecurity ............................................................................................................................... 8
Nutrition-Related Health Disparities in North Minneapolis....................................................... 113
Demographics of North Minneapolis............................................................................................ 14
North Minneapolis and Food Insecurity ....................................................................................... 18
Community-Based Responses to Food Insecurity ........................................................................ 21
Northside Food Project and Other Examples of Responses to Community Food Insecurity....... 24
Conclusion .................................................................................................................................... 27
References..................................................................................................................................... 28
Appendix A................................................................................................................................... 30
Appendix B ................................................................................................................................... 34
4

Executive Summary
The purpose of this report is to provide scientific data to the Northside Food Project
(NFP) community organization. The research goals were threefold: to research existing
literature on food insecurity in low-income communities, to examine demographic and food
insecurity-related data in North Minneapolis, and to explore the need and means for a
community food security assessment in North Minneapolis.
The concept of food insecurity, conventionally defined as “limited or uncertain
availability of nutritionally adequate and safe foods or limited or uncertain ability to acquire
acceptable foods in socially acceptable ways” (Economic Research Service, 2002, p. 3), is
central to this work. Food insecurity is linked to overweight and obesity, which in turn are
heavily related to major chronic diseases such as heart disease, high blood pressure, and type 2
diabetes. Research indicates that low-income communities and communities of color are
especially likely to lack adequate access to healthy foods; supermarkets and farmers markets are
less common in these communities whereas corner stores and “convenience” stores are more
common.
North Minneapolis exhibits many of the symptoms of a food-insecure community. Many
of the risk factors linked to food insecurity are widespread in Minneapolis, including poverty,
high numbers of children, and, importantly, limited access to healthy food outlets. Additionally,
this area has a high prevalence of overweight, obesity, high blood pressure, heart disease, and
type 2 diabetes.
The research into food insecurity has recently produced several suggestions for
increasing a community’s food security, including starting with a comprehensive community
food security assessment (CFSA) such as the one proposed by the United States Department of
5

Agriculture (USDA)’s Food and Nutrition Service (FNS). Other strategies for increasing
community food security focus on providing alternative sources of food production and food
distribution, inducing community gardening, cooperatives, buying clubs, community-supported
agriculture, and farmers markets.
The Northside Food Project (NFP) was started by residents who were concerned about
food insecurity in North Minneapolis. Several other exemplary non-profits organizations aimed
at increasing food security exist in other parts of the country, including Chicago, Oakland,
Boston, and Harlem. These organizations have begun to successfully address food insecurity
through encouraging alternative sources of food production and distribution, and through active
engagement between community members, other community organizations, and in many cases,
partnerships with local universities.
This review of literature, demographic data, and existing models for increasing
community food security, gives a sound backing to the work and mission of the NFP. Future
directions for the NFP should include conducting a comprehensive CFSA to help decide which
strategies for increasing food security in North Minneapolis will be most beneficial to the
community. Such strategies can help reduce the health disparities in North Minneapolis through
increasing the community’s access to the fresh, healthy, and affordable foods necessary for an
active, healthy lifestyle.
6

Relationship of Diet Patterns to Chronic Disease
The era of infectious diseases has passed, and in this new era of chronic diseases,
discussion about healthy diets has moved to the forefront of American discourse. It has now
been well established that the foods people consume have a profound effect on their well-being
and health. Of special concern are the rising rates of overweight and obesity in the U.S.
Overweight and obesity are associated with a myriad of chronic diseases and health conditions,
including hypertension, dyslipidemia (for example, high total cholesterol or high levels of
triglycerides), type 2 diabetes, coronary heart disease, stroke, gallbladder disease, osteoarthritis,
sleep apnea, respiratory problems, and some cancers (endometrial, breast, and colon) (Centers
for Disease Control and Prevention (CDC), Overweight and obesity: home).
The cause of overweight and obesity was once conceptualized merely as people
consuming too many calories and expending too few, thus placing the “fault” with the individual.
More recently, however, researchers have identified a major shift in overweight and obesity to
the lower socio-economic strata as evidence that this conceptualization may be missing an
important piece. It has become apparent that many people with limited financial resources may
be consuming “enough” calories so that they do not appear to be starving (and often are
overweight), yet their bodies may be starved for nutrients. Put another way, it is thought that
many low-income people are now consuming more energy-dense, nutrient-poor foods, such as
fast-foods or prepackaged foods because these foods are usually the most economical to
purchase. Additionally, as it will be demonstrated below, these foods are often the only ones
available for people living in low-income areas to purchase.
7
Food Insecurity
Lack of choice of foods, or access to healthy foods, is integral to the concept of food
insecurity. The United States Department of Agriculture (USDA) defines food insecurity as
“limited or uncertain availability of nutritionally adequate and safe foods or limited or uncertain
ability to acquire acceptable foods in socially acceptable ways” (Economic Research Service,
2002, p. 3). The importance of economics and the environment in determining what people eat
(and consequently, their weight) can not be emphasized enough in light of recent research,
especially in low-income urban neighborhoods. Low-income women are especially at risk for
overweight and obesity due to food insecurity (Townsend, Peerson, Love, Acherberg, &
Murphy, 2001; Olson, 2005.) Yet, as Adam Drewnowski states in his now infamous quote,
“obesity is a low-income problem, yet we offer middle-class solutions. We say you need to eat
more fresh fruits and vegetables and exercise more. Well if you live in the inner city you aren’t
going to suddenly start eating mangoes and playing tennis” (McCarthy, 2004).
Indeed, poverty, constrained budgets, or low income all can make it difficult to access
and consume a healthy diet. Darmon, Ferguson, & Briend (2003), using linear modeling, found
that constrained budgets lead to an increase in choosing energy dense foods, the consumption of
which contributes to obesity. Energy dense foods are those that have low water content and may
contain fat, sugar, or starch. Potato chips, chocolate, and doughnuts are all energy-dense foods,
whereas fruits and vegetables are much less energy-dense due to their high water content
(Drewnowski & Specter, 2004). Additionally, Drewnowski & Specter (2004) established in their
review that energy density is inversely related to energy cost, so that “energy dense foods
composed of refined grains, added sugars, or fats may represent the lowest-cost option to the
8

consumer” (p. 1). Thus, the most affordable foods tend to be the least healthy and therefore
contribute to weight gain in those who can not afford healthier foods.
One of the mechanisms through which it is hypothesized that food insecurity leads to
obesity is the decreased consumption of fruits and vegetables, which are low in fat and calories
and high in nutrients (CDC, Nutrition for Everyone: Fruits and Vegetables). For example,
Kendall, Olson, and Frongillo (1996) found that even though both food secure and food insecure
households are unlikely to meet recommended amounts of fruits and vegetables, there was a
gradient effect of food insecurity on consumption of fruits and vegetables; that is, consumption
and household food stores of fruits and vegetables decreased with increasing food insecurity.
Low fruit and vegetable consumption can affect chronic diseases both indirectly (contributing to
obesity, which in turn can lead to chronic disease) and directly. The Centers for Disease Control
and Prevention advise that “healthy diets rich in fruits and vegetables may reduce the risk of
cancer and other chronic diseases [and] provide essential vitamins and minerals, fiber, and other
substances that are important for good health” (CDC, Nutrition for Everyone: Fruits and
Vegetables). Thus low consumption of fruits and vegetables due to limited resources certainly
puts low-income populations at increased risk of poor health.
Another issue that is closely related to fruit and vegetable consumption is the availability
of healthy foods in a community or neighborhood. The past several years have seen an increase
in research on the local food environment and its relation to food choices, obesity, and social
justice. Supermarkets are a prime example. Supermarkets usually sell the best selection and
quality of produce and healthy food options for the lowest price. However, research has shown
that there are significantly fewer supermarkets located in lower-wealth neighborhoods and in
predominantly African-American communities (Moore & Diez Roux, 2006; Morland, Wing,
9

Diez Roux, & Poole, 2002). Additionally, research has shown that having a supermarket
increases the likelihood of meeting dietary guidelines, especially for eating fruits and vegetables
and recommended amounts of total fats and saturated fats (Morland, Wing, & Diez Roux, 2002).
Figure 1 presents a proposed conceptual model for the relationships between the variables in the
equation linking poverty to chronic diseases via food insecurity.
Low consumption of fruits and vegetables
Poverty, low-income/ low economic resources
Environmental characteristics: poor urban planning, few grocery stores, expensive corner stores, plethora of fast-food
Food insecurity (lack of access to fresh, affordable, nutritious
Overweight and obesity
Chronic diseases: •heart disease •high blood pressure •type 2 diabetes
Figure 1 Conceptual model of relationship between poverty, food insecurity,
overweight/obesity, and chronic health conditions
The following section explores data showing that North Minneapolis suffers from many
of the health problems related to food insecurity. These data also show that the socio-
demographic characteristics of North Minneapolis make it a prime example of an urban area
prone to food insecurity.
10

Nutrition-Related Health Disparities in North Minneapolis
Residents of North Minneapolis suffer a disproportionate burden of many diseases related
to food, including overweight/obesity, heart disease, high blood pressure, and diabetes. A
Hennepin County survey conducted in 2002, called the SHAPE survey, illuminated some of
these disparities. The survey provided data both at the aggregate level (Minneapolis-wide and
Hennepin County-wide) and at the region or area level (broken down into 11 areas), thus
allowing for comparisons of North Minneapolis to the overall health status of Minneapolis. The
region considered to be North Minneapolis was captured with two areas, Camden and Near
North.
Survey findings help
highlight and quantify health
disparities in North Minneapolis,
and give residents added credibility
when addressing local policy
makers. For example, North
Minneapolis residents reported that
their health was Excellent or Very
Good 55.9% (Camden) and 50.7%
(Near North) of the time, whereas Minneapolis residents overall reported Excellent or Very
Good health 59.5% of the time (Figure 2). Additionally, the areas of Camden and Near North
reported some of the highest levels of Fair to Poor Health, with only one other neighborhood
area reporting higher rates of Fair to Poor health.
Fi gur e 2I n ge ne r a l , woul d y ou sa y y our he a l t h i s. . . ?
0.0%
5.0%
10.0%
15.0%
20.0%
25.0%
30.0%
35.0%
40.0%
Excel l ent Ver y Good Good Fai r Poor
H e a l t h S t a t u s
Camden
Near Nor th
M i nneapol i s
11

In addition to a measure of overall health, the SHAPE survey also captured other health
indicators. Using self-reported
height and weight data, the SHAPE
survey revealed that 36.1%
(Camden) to 36.2% (Near North)
of North’s residents are overweight
and 20.3% (Camden) to 26.4%
(Near North) are obese compared
to rates in Minneapolis of 30.7%
for overweight and 16.6% for
obesity, indicating a much higher burden of overweight and obesity in North Minneapolis
compared to the city as a whole (Figure 3). Camden and Near North also had the highest rates of
overweight and obesity of any of the 11 neighborhood areas.
Fi gur e 3We i ght st a t us usi ng Body M a ss I nde x
0.0%
1 0.0%
20.0%
30.0%
40.0%
50.0%
60.0%
Under wei ght Nor mal Over wei ght Obese
W e i g h t S t a t u s
Camden
Near Nor th
M i nneapol i s
Specific disease status was
also addressed with the SHAPE
survey. When asked about heart
trouble or angina, 9.3% (Camden)
and 8.1% (Near North) of North’s
residents indicated this health
problem, whereas only 7.0% of
Minneapolis as a whole indicated
this. High blood pressure or hypertension is also much higher among North Minneapolis
residents with 22.9% of residents in Camden and 23.4% of residents in Near North indicating
Figure 4Has a Doctor or other health professional ever told you that you have...?
0.0%
5.0%
10.0%
15.0%
20.0%
25.0%
Diabetes High Blood Pressure/Hypertension Heart Trouble/Angina
Condition
Perc
enta
ge CamdenNear NorthMinneapolis
12

high blood pressure or hypertension compared to the Minneapolis-wide rate of 16.5%. For
diabetes (excluding gestational diabetes), the survey revealed that 7.4% (Camden) to 7.2% (Near
North) of North’s residents report having diabetes, whereas Minneapolis as a whole reported a
rate of only 5.0% (Figure 4 summarizes these findings). Again, the rates in North Minneapolis
of heart trouble, high blood pressure, and diabetes were higher than almost all the other
neighborhood areas of Minneapolis.
There was one direct measure, although crude, of food insecurity in North Minneapolis.
The question asked, “In the last 12 months, how often did you worry that your food would run
out before you had money to buy more?” The response pattern indicated that there were more
people experiencing food insecurity in North Minneapolis compared to the city as a whole, with
Near North facing more food insecurity than Camden (Figure 5).
Figure 5 In the last 12 months, how often did you worry that your food would run out before you
had money to buy more?
0.0%
10.0%
20.0%
30.0%
40.0%
50.0%
60.0%
70.0%
80.0%
Often Sometimes Rarely Never Frequency
Perc
enta
ge
MinneapolisCamdenNear North
13

Demographics of North Minneapolis
In order to put these health disparities in context, it is important to understand the socio-
cultural backgrounds and demographics of the people living in North Minneapolis. Data were
collected during the SHAPE survey on many different socio-environmental factors, race,
ethnicity, poverty status, household type, household size, language and other demographic
characteristics. Data are also available from the 2000 census about other important
demographics. Taken together, these data help paint a picture of the unique characteristics,
assets, and challenges faced by residents in these neighborhoods.
First, most areas of the city are split fairly evenly between male and female residents;
Minneapolis overall is 49.6% male and 50.4% female. North Minneapolis, however, has slightly
more females (55.4% in
Camden and 55.9% in
Near North) than males.
North Minneapolis also
has the highest percentage
of children of all the areas
of Minneapolis.
According to 2000
Census data, 32.8% of
Camden residents and 41.5% of Near North residents are between ages 0 and 17, compared to
only 22.0% for all of Minneapolis. Additionally, the child dependency ratio—the number of
children aged 14 and younger divided by the number of persons aged 15 to 64—is high in North
Minneapolis (43.7% in Camden and 59.7% in Near North) compared to Minneapolis as a whole
Figure 6Percentage of households where household size is...
0.0%
5.0%
10.0%
15.0%
20.0%
25.0%
30.0%
35.0%
40.0%
1 2 3 4 to 6 7 or more
Household size
Perc
enta
ge
CamdenNear NorthMinneapolis
14

Figure7 Race of Persons Age 18 and Over: Minneapolis
White alone, 72.7%
Black alone, 14.1%
American Indian alone, 1.8%
Asian, Native Hawaiian, or other Pacific Islander alone,
4.9%
Some other race alone, 3.6%Two or more races, 2.9%
(25.9%). This area also has a high number of
persons per household. In Minneapolis
overall, there is a trend toward smaller
households with the highest percentage of
households having only one or two members.
In North Minneapolis, however, this situation
is reversed—the majority of households have
four to six or seven or more members (Figure
6). Figure 8
Race of Persons Age 18 and Over: Camden
White alone, 62.2%
Black alone, 23.4%
American Indian alone, 1.5%
Asian, Native Hawaiian, or other Pacific Islander alone,
8.2%
Some other race alone, 1.7%Two or more races, 2.9% Census data from 2000 also indicates
that North Minneapolis has one of the highest
concentrations of African-American and
Asian-American residents. In Minneapolis
overall, 14.1% report “Black alone” as their
race, whereas fully 23.4% in Camden and
50.7% in Near North indicate this as their
race. Four point nine percent of Minneapolis
residents report “Asian, Native Hawaiian, or
other Pacific Islander alone” as their race; in
Camden this number is 8.2% and in Near
North, this number is the highest in the city—
12.1%. Figures 7-9 summarize these findings.
Together, these numbers indicate that North
Figure 9 Race of Persons Age 18 and Over: Near North
White alone, 27.9%
Black alone, 50.7%
American Indian alone, 1.7%
Asian, Native Hawaiian, or other Pacific Islander alone,
12.1%
Some other race alone, 3.3%
Two or more races, 4.2%
15

Minneapolis has a high concentration of minority groups, so much so that they are a majority,
both giving the neighborhoods richness of experience and posing unique challenges to building
cohesiveness.
North Minneapolis also has a fairly high percentage of households for which the income
is below 200% of
the Federal
poverty level,
although this is
true more so in
Near North than
in Camden.
Minneapolis’
overall
percentage of
households with incomes below 200% of the poverty level is 26.5%; in Camden it is 27.6%, and
in Near North it is 42.8%. Figure 8 shows the participation in various assistance programs for
Minneapolis as a whole, Camden, and Near North.
Figure 10Percentage of households where, in the past 12 months, someone in the household
received...
0.00%
5.00%
10.00%
15.00%
20.00%
25.00%
Subsidized or sliding fee child care
SSI disability benefits Home health
care services Assistance with heating
or energy bills Monthlywelfare
paymentssuch as
AFDC, GA,TANF, MFIP
Low incomehousing
assistance,Section 8
publichousing
WIC(Women,Infants &Children)
Food stamps Food fromfood shelves
Free orreduced-price
schoollunches
Assistance Program
Perc
enta
ge
Minneapolis CamdenNear North
The data from the SHAPE survey and the census indicate two things: 1) North
Minneapolis has very high rates of nutrition and food-related health problems and 2) North
Minneapolis differs in important ways from the rest of Minneapolis including more poverty,
more children, and more racial diversity. These things, taken together, indicate that the food
environment in North Minneapolis is not meeting the needs of the residents. Given the
socioeconomic and demographic characteristics of this neighborhood, this may be an issue not
16

just of nutrition, but of social justice. The next section of this report discusses how the data from
North Minneapolis presented in the previous two sections can be combined with anecdotal
evidence to paint a picture of what the local food environment of North Minneapolis looks like;
it also examines the relationship between race, poverty, and environmental issues related to
access to healthy, affordable food.
17

North Minneapolis and Food Insecurity
Both the health data from the SHAPE survey and the demographic characteristics of
North Minneapolis indicate that North Minneapolis may be experiencing food insecurity.
Residents of North Minneapolis report less Very Good to Excellent health, and more Fair to Poor
health than Minneapolis residents in general. North Minneapolis has the highest rates of
overweight and obesity in all of Minneapolis, and again, food insecurity has been linked to
overweight and obesity. North Minneapolis’ residents also reported some of the highest rates of
specific diseases related to poor diet and obesity, including heart trouble/angina, high blood
pressure/hypertension, and diabetes.
There are more women than men in North Minneapolis, which is especially relevant
because women are more likely to experience food insecurity-attributed to obesity than are men
(Townsend, Peerson, Love, Acherberg, & Murphy, 2001; Olson, 2005.) Additionally, there are
high numbers of children in North Minneapolis and having children in the household is
associated with increased risk of food insecurity (Rose, 1999). Also, North Minneapolis has the
highest numbers of African-American residents, and in Near North, they are the majority.
Several research findings indicate that predominantly African-American neighborhoods often
lack adequate access to supermarkets (Dwyer, 2005; Morland, Wing, & Diez Roux, 2002) The
high level of poverty in North Minneapolis also points to potential food insecurity; although
poverty and food insecurity are not synonymous, they are highly related (Rose, 1999). Also,
recent geographic data using demographic risk factors similar to those mentioned above and
physical accessibility to grocery stores suggests that North Minneapolis is one of the most likely
places in Minneapolis for residents to experience food insecurity (Larson, 2006).
18
Anecdotal reports indicate that food buying patterns in North Minneapolis show a classic
picture of a food insecure community. There is only one supermarket in North Minneapolis to
serve the almost 68,000 residents there. Most people can only make one trip per month to the
one supermarket in North Minneapolis due to transportation issues, including low car ownership.
For many, these infrequent trips necessitate the purchase of foods with a long shelf life and
discourage the purchase of healthier foods that spoil more quickly—especially fresh fruits and
vegetables. Additionally, these infrequent trips may contribute to binge eating at the beginning
of the month when food stamp benefits are dispersed and lead to meager diets later in the month.
Recent research by Bhargava (2004) indicates that people’s food intakes decrease overall and
energy density increases as the time from disbursement of food stamp benefits increases. This
indicates a pattern in which people stock up once a month on food, eating as much as possible
following previous deprivation starting with the healthiest foods and moving to the longer-lasting
foods high in simple carbohydrates and added sugar, salt, and fat as the month wears on.
Anecdotal evidence also suggests that the one-time-a-month disbursement of food stamp benefits
encourages binge eating and the consumption of unhealthy foods with long shelf lives and may
also hurt local grocers (Klinefelter, 2006).
“Fill-in” food purchases, then, usually occur at stores that are walking distance from
residents’ homes, and these are primarily “convenience” stores or corner stores that focus on
selling cigarettes and alcohol—not food. The food available in these outlets has almost no
nutritional value, and is high in added sugar, fat, salt, and preservatives. Additionally, many of
these “convenience” stores have been hot spots for drug dealing and other criminal activities,
creating an even unhealthier environment for finding food. One North Minneapolis resident
joined an action group to reduce the number of these “convenience” stores after her husband
19

purchased a bag of flour from one such store so that the family could make cookies together,
only to find that the flour was infested with weevils (J. Baxa, personal communication, June 2,
2006). This poignantly illustrates that these stores are not focused on selling fresh or healthy
foods, but rather are keeping food on their shelves indefinitely to create the illusion of selling
food while making the majority of their profits from selling cigarettes and alcohol.
The other cheap form of readily accessible foods is from “fast food” restaurants that offer
cheap high-fat options that are a quick solution for some residents. Dwyer’s (2005) exploration
of the food environment in East Harlem highlights this issue eloquently. Building on
Drewnowski’s famous quote about eating mangoes and playing tennis (this report, p.?), Dwyer
shows that at the one large supermarket in East Harlem, Pathmark, mangoes are 67 cents each.
At a mid-sized grocery store, such as Associated Foods, they are 79 cents each. At a small
corner store or “bodega” they are $1.79. What costs $1.79 across the street from that same
bodega is a full hot meal at McDonalds, thus illustrating just how tempting it can be to opt for a
less healthy meal option after a long day at work (p. 30-31). Again, some anecdotal evidence
indicates that the situation in North Minneapolis may be similar.
20

Community-Based Responses to Food Insecurity
As research into food insecurity has expanded over the past several years, there has been
a call to establish guidelines for specific tactics that can be helpful in increasing food security.
Given that food insecurity is dependent on the local food environment, successful interventions
look at food insecurity at the community level, rather than at the individual or family level. The
USDA defines community food security as a situation in which “all people in a community have
access to a culturally acceptable, nutritionally adequate diet through non-emergency (or
conventional) food sources at all times” (Economic Research Service, 2002, p. 4). Some
researchers have proposed more robust definitions encompassing the environmental and
economic implications of food security. McCullum, Desgardins, Kraak, Ladipo, and Costello
(2005) propose the following definition: “A sustainable community food system [italics mine]
improves the health of the community, environment, and individuals over time, involving a
collaborative effort in a particular setting to build locally based, self-reliant food systems and
economies” (p. 278). Several recommendations have been made in the literature to address food
insecurity, including, importantly, beginning with a critical examination of the current food
environment of a community.
The USDA has produced a guide called the “Community Food Security Assessment
Toolkit” which includes six sections, each aimed at helping community organizations assess a
different part of the food environment. These sections are: 1) a profile of community
socioeconomic and demographic characteristics, 2) a profile of community food resources, 3) an
assessment of household food security, 4) an assessment of food resource accessibility, 4) an
assessment of food availability and affordability, and 6) an assessment of community food
production resources. Appendix A outlines these six sections in further detail. The toolkit is
21

extensive, and offers practical advice on recruiting for and conducting focus groups, analyzing
the built environment, and assessing the affordability of foods available in the community. Users
of the toolkit are “guided to look at all resources to understand the community’s potential not
only for identifying an issue but also for addressing it successfully” (p. 5). Conducting a
Community Food Security Assessment (CFSA) allows a community to identify where the most
pressing problems in their unique food system exist, and can shed light on where the best places
to intervene will be. Additionally, a CFSA allows community members to tailor programs and
activities to the specific needs of the community, and help them decide what kinds of activities
and efforts will be most effective in increasing community food security.
Other recommendations that have consistently been made include focusing on alternative
sources of food such as community gardening, cooperatives, buying clubs, community-supported
agriculture, and farmers markets (Kantor, 2001). Community gardens are any place where two
or more people garden together; they are commonly established on vacant lots in central cities
where land for home gardens is limited. Cooperatives are member-owned retail food stores that
“maintain an inventory of food and nonfood items similar to a regular retail store” (p. 22).
Members of cooperatives usually have some input in the products available for purchase and
often are offered discounts in exchange for volunteering time. Kantor describes buying clubs as
members “pool[ing] their resources (money, labor, purchasing, and distribution) to buy food in
bulk quantities at reduced cost” (p. 22). Community-supported agriculture or “CSAs” are
slightly more complex:
In a CSA program, a group of consumers (shareholders) purchase shares at the beginning
of the growing season to buy a portion of the farm’s crop that year. This arrangement
gives growers upfront cash to finance their operation and higher prices for produce, since
22

the middle-man has been eliminated. Share holders receive a weekly box or bag of fresh
produce, typically organically grown, which is usually harvested no more than 1 day
prior to delivery (p. 23).
Farmers markets bring together consumers and producers at the same time and place and allow
direct selling from producer to consumer. These markets often occur a few times a week, and
can range in size from smaller market with only a few farmers to large-scale markets serving
several thousand shoppers. The main draw of farmers markets is typically the huge range of
fresh fruits and vegetables they offer, but many also offer meats, dairy products, honey, maple
syrup, jellies, flowers, baked goods and other products (Kantor, 2001).
According to McCullum, Desjardins, Kraak, Ladipo, and Costallo (2005), “urban
agricultural partnership projects such as community gardening exemplify an integrated approach
to health promotion by increasing community networks, expanding green space, lowering urban-
neighborhood crime rates, and providing employment opportunities” (p. 280). The USDA also
supports and encourages these alternative sources of food. Kantor, an agricultural economist
with the USDA, states that “community-based initiatives, such as farmers markets and
community gardens, can boost the effectiveness of USDA nutrition assistance and education
programs by increasing the availability of high-quality and affordable food in a community.
Such initiatives also support rural communities by strengthening the traditional ties that exist
between farmers and urban consumers” (p. 20).
23

Northside Food Project and Other Examples of Responses to Community Food Insecurity
In response to social justice-related food inequities described in this report and the
adverse sequelae associated with these food inequities, citizens living in North Minneapolis
came together to form the Northside Food Project (NFP) in 2005. Concerned about the health of
their fellow citizens, friends, and family members, this group began to look at the way food was
being accessed in North Minneapolis and its effect on the residents of this area. In fact, many of
the strategies that have been found in the literature to be the most useful are the very strategies
on which the NFP is focused. The mission of the NFP is to be a catalyst for resident
empowerment for social, economic, and nutritional improvement in the community.
Their vision is to create a vibrant food advocacy organization that puts the residents of North
Minneapolis at the center of their food system by educating, engaging and organizing the larger
community around the economic, social, and nutritional impact of our food choices.
Several other examples exist of communities addressing food insecurity using principles
of community organizing (see Maibach, Rothschild, and Novelli, 2002) and the alternative food
systems approaches described above. In Chicago, Illinois, LaDonna Redmond formed the
Chicago Food Systems Collaborative (CFSC) after struggling to find food to feed her son who
suffered from multiple food allergies. The CFSC’s long term goal is to build a locally owned
grocery that provides access to healthy, high-quality foods including fruits and vegetables to
urban residents. The CFSC has partnered with local universities and other local organizations.
Its activities include organizing farmers markets, converting vacant lots to urban farm sites, and
distributing locally grown product to restaurants.
In Oakland, California, the Mo’ Better Food organization was formed to cultivate and
sustain partnerships between Black farmers and predominately Black communities with a
24

mission of increasing markets for produce grown by Black farmers in urban communities. Mo’
Better Food uses methods such as farmers markets, buyers clubs, cooperative grocery stores, in
addition to distributing to restaurants, corner stores, churches, schools, and homes. They also
seek to educate each generation, regardless of age, about the various careers and professions
available in the food industry (Mo’ Better Food, Mission).
The Food Project, located in Boston, Massachusetts, and its surrounding area has been
working on improving the local food environment since 1991. Their mission is to “grow a
thoughtful and productive community of youth and adults from diverse backgrounds who work
together to build a sustainable food system.” They produce healthy food for residents of the city
and suburbs and provide youth leadership opportunities. Most importantly, they “strive to
inspire and support others to create change in their own communities.” Each season, they grow
nearly a quarter-million pounds of food without chemical pesticides, donating half to local
shelters. The remainder is sold through Community Supported Agriculture (CSA) crop shares
and farmers’ markets (The Food Project, About Us).
Central Harlem is one of the poorest neighborhoods in New York City, with over a third
of its primarily African-American residents living in poverty. Affordable, nutritious foods are
not readily available, and the borough’s health statistics reflect that reality—the area has above
average rates of diet-related illnesses like hypertension, heart disease, diabetes, and obesity. In
these ways, it is similar to North Minneapolis. The S.O.U.L. Food Project, part of the New York
City-based FoodChange organization aims to increase access for low-income Harlem residents to
fresh and healthy food grown by farmers in New York state. Farmers supply the Healthy Dining
and Food Pantry programs at FoodChange’s Community Kitchen, giving Harlem’s most food-
insecure residents a fresh and healthy meal. This program also provides discounted shares for a
25

local CSA program, and has frequent nutrition education classes focused on cooking healthy
foods (Food and Society, 2006).
These city-specific organizations are using different combinations of the tactics suggested
in the literature to address community food insecurity—from holding farmers markets, to
offering CSA shares at a discounted rate, to assisting with urban gardening. However, each one
first had to look at how their individual food systems was working (or not working) before any
real productive change could take place; indeed, starting with a comprehensive CFSA is
necessary to identify where the problems with the food system are, and how to tailor efforts to
address these problems in a specific community. The NFP has identified also that a CFSA is
crucial to the development of their organization and its efforts to improve food access for North
Minneapolis residents.
26

Conclusion and Future Directions
This report indicates that North Minneapolis is experiencing higher than average rates of
overweight and obesity and the sequelae associated with these conditions. It also indicates that
this may be due, in a large part, to large barriers to accessing fresh, affordable, and healthy food
faced by residents. This review of literature, demographic data, and existing models for
increasing community food security, gives a sound backing to the work and mission of the NFP
to “create a vibrant food advocacy organization that puts the residents of North Minneapolis at
the center of their food system by educating, engaging and organizing the larger community
around the economic, social and nutritional impact of our food choices.” Future directions for
the NFP should include conducting a comprehensive CFSA to help decide which strategies for
increasing food security in North Minneapolis will be most beneficial to the community. Such
strategies can help reduce the health disparities in North Minneapolis through increasing the
community’s access to the fresh, healthy, and affordable foods necessary for an active, healthy
lifestyle.
27

References
Bhargava, A. (2004). Socio-economic and behavioural factors are predictors of food use in the
National Food Stamp Program Survey. British Journal of Nutrition, 92, 497-506.
Centers for Disease Control and Prevention (CDC). Nutrition for everyone: fruits and
vegetables. Accessed 20 July, 2006 from www.cdc.gov/nccdphp/dnpa/nutrition/
nutrition_for_everyone/fruits_vegetables/index.htm
Centers for Disease Control and Prevention (CDC). Overweight and obesity: home. Accessed
21 July, 2006 at http://www.cdc.gov/nccdphp/dnpa/obesity/
Darmon, N., Ferguson, E., & Briend, A. (2003). Do economic constraints encourage the
selection of energy dense diets? Appetite, 41, 315-322.
Drewnowski, A. & Specter, S. E. (2004). Poverty and obesity: the role of energy density and
energy costs. American Journal of Clinical Nutrition, 79, 6-16.
Dwyer, J. C. (2005). Hunger and obesity in East Harlem: Environmental influences on urban
food access. Accessed 7 July, 2006 at http://nyccah.org/research/harlem.pdf
Economic Research Service. (2002). Community food security assessment toolkit (USDA FNS
E-FAN-02-013). Washington, D.C.: U.S. Government Printing Office.
Food and Society (2006). Keeping the SOUL in Harlem. Food and Society Update, 5.
Accessed August 17, 2006 at http://ola.wkkf.org/fasupdate/2006/february/soul.html
Hennepin County Community Health Department and Bloomington Division of Public Health
(2003). SHAPE 2002: Geographic Data Book, Survey of the Health of Adults, the
Population and the Environment, 1-150.
Kantor, L. S. (2001). Community food security programs improve food access. Food Review,
24, 20-26.
28
Kendall, A., Olson, C. M., Frongillo, E. A. (1996). Relationship of hunger and food insecurity to
food availability and consumption. Journal of the American Dietetic Association, 96,
1019-1024.
Klinefelter, Q. (Reporter). (2006, June 6). Businesses Aim to Smooth Food-Stamp Cycle. In
Morning Edition [Radio Broadcast]. Washington, DC: National Public Radio.
Larson, J. (2006). Food security in urban America: a model based on Minneapolis-St. Paul,
Minnesota. Retrieved July 1, 2006 from
http://digitalcommons.macalester.edu/geography_honors/8/
Maibach, E. W., Rothschild, M. L., & Novelli, W. D. Social Marketing. In K. Glanz, B. K.
Rimer, & F. M. Lewis (Eds.), Health Behavior and Health Education (pp. 437-461).
SanFrancisco: Jossey-Bass.
McCarthy, M. (2004). The economics of obesity. The Lancet, 364, 2169-2170.
McCullum, C., Desjardins, E., Kraak, V. I., Ladipo, P., & Costello, H. (2005). Evidence-based
strategies to build community food security. Journal of the American Dietetic
Association, 105, 278-283.
Mo’ Better Food. Mission. Accessed 8 August, 2006 at http://www.mobetterfood.com/
Mission2.html
Moore, L. V., & Diez Roux, A. V. (2006). Association of neighborhood characteristics with the
location and type of food stores. American Journal of Public Health, 96, 325-331.
Morland, K., Wing, S. & Diez Roux, A. (2002). The contextual effect of the local food
environment on residents’ diets: the Atherosclerosis Risk in Communities study.
American Journal of Public Health, 92, 1761-1767.
29

Morland, K., Wing, S., Diez Roux, A., & Poole, C. (2002). Neighborhood characteristics
associated with the location of food stores and food service places. American Journal of
Preventive Medicine, 22, 23-29.
Olson, C. M. (2005). Food insecurity in women: a recipe for unhealthy trade-offs. Topics in
Clinical Nutrition, 20, 321-328.
Rose, D. (1999). Economic determinants and dietary consequences of food insecurity in the
United States. Journal of Nutrition, 129, 517S-520S.
The Food Project. About Us. Accessed 16 August, 2006 from http://www.thefoodproject.org/
about/index.asp
Townsend, M. S., Peerson, J., Love, B., Achterberg, C., & Murphy, S. P. (2001). Food
insecurity is positively related to overweight in women. Journal of Nutrition, 131, 1738-
1745.
30
Appendix A USDA Community Food Security Assessment (CFSA)
-- Summary of Assessment Toolkit1--
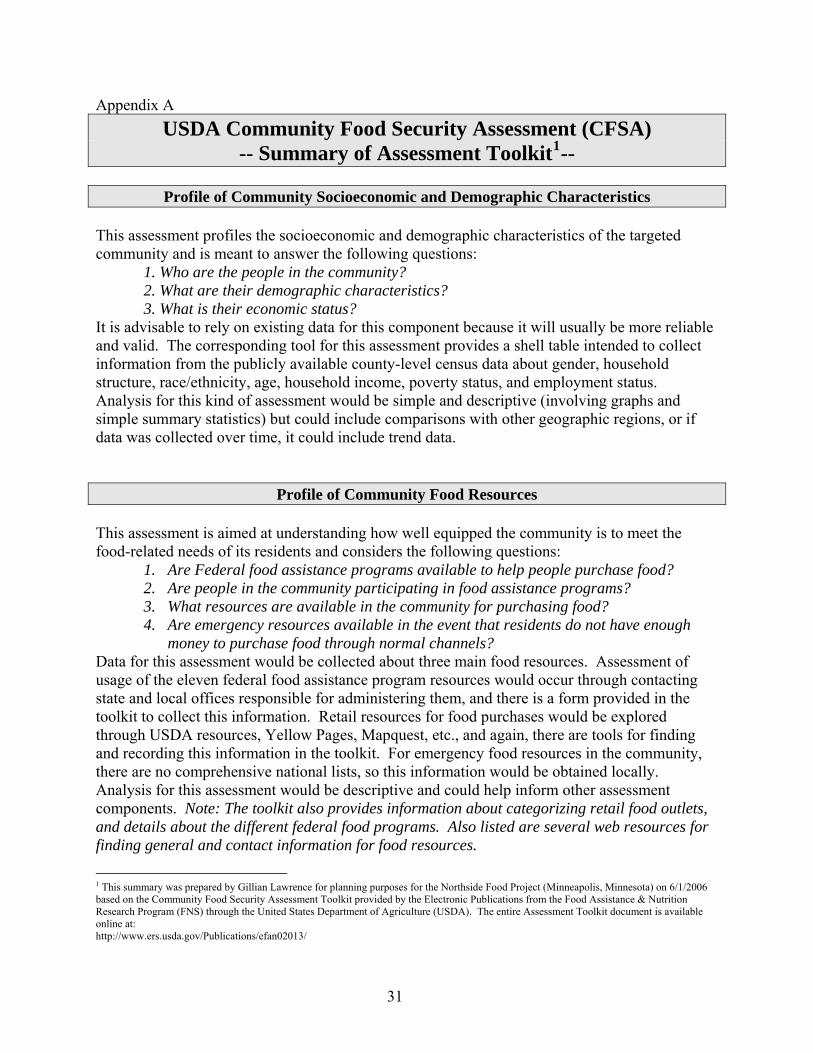
Profile of Community Socioeconomic and Demographic Characteristics This assessment profiles the socioeconomic and demographic characteristics of the targeted community and is meant to answer the following questions: 1. Who are the people in the community? 2. What are their demographic characteristics? 3. What is their economic status? It is advisable to rely on existing data for this component because it will usually be more reliable and valid. The corresponding tool for this assessment provides a shell table intended to collect information from the publicly available county-level census data about gender, household structure, race/ethnicity, age, household income, poverty status, and employment status. Analysis for this kind of assessment would be simple and descriptive (involving graphs and simple summary statistics) but could include comparisons with other geographic regions, or if data was collected over time, it could include trend data.
Profile of Community Food Resources This assessment is aimed at understanding how well equipped the community is to meet the food-related needs of its residents and considers the following questions:
1. Are Federal food assistance programs available to help people purchase food? 2. Are people in the community participating in food assistance programs? 3. What resources are available in the community for purchasing food? 4. Are emergency resources available in the event that residents do not have enough
money to purchase food through normal channels? Data for this assessment would be collected about three main food resources. Assessment of usage of the eleven federal food assistance program resources would occur through contacting state and local offices responsible for administering them, and there is a form provided in the toolkit to collect this information. Retail resources for food purchases would be explored through USDA resources, Yellow Pages, Mapquest, etc., and again, there are tools for finding and recording this information in the toolkit. For emergency food resources in the community, there are no comprehensive national lists, so this information would be obtained locally. Analysis for this assessment would be descriptive and could help inform other assessment components. Note: The toolkit also provides information about categorizing retail food outlets, and details about the different federal food programs. Also listed are several web resources for finding general and contact information for food resources.
1 This summary was prepared by Gillian Lawrence for planning purposes for the Northside Food Project (Minneapolis, Minnesota) on 6/1/2006 based on the Community Food Security Assessment Toolkit provided by the Electronic Publications from the Food Assistance & Nutrition Research Program (FNS) through the United States Department of Agriculture (USDA). The entire Assessment Toolkit document is available online at: http://www.ers.usda.gov/Publications/efan02013/
31

Assessment of Household Food Security
The assessment of household food security is driven by the question: Is household food insecurity a problem that is directly or personally experienced for a significant number of people in the community? The corresponding tools provided examine several general types of household food conditions, events, and behaviors through focus groups and a short survey. These conditions include anxiety about household food budget/supply, perceptions of quality/quantity of household food adequacy, and reported instances of reduced food intake, hunger, or weight loss, for both adult and child members of a household. Focus group information is provided for sessions with key informants and a household food security session. The toolkit provides specific information about setting up and running the focus groups, including scripts, screening tools, and advice about incentives. For analysis, qualitative data analysis would be performed through identifying key themes from the focus group sessions. Quantitative analyses could potentially be performed with the survey data, but unless care is taken to sample randomly from the community, we will not be able to generalize our findings to the larger community.
Assessment of Food Resource Accessibility The Assessment of Food Resource Accessibility is framed by four main questions:
1. Are food resources located near low-income neighborhoods? 2. Is public and/or private transportation available between these resources and low-
income neighborhoods? 3. What barriers influence people’s use of community food resources? 4. Does the community have the infrastructure necessary to deliver Federal food assistance
benefits effectively? Collecting data to answer these questions begins with looking at data previously collected for the Profile of Community Food Resources. From here, the assessment moves to examine access issues such as transportation (through investigating the transportation infrastructure), inconvenient hours of operation, or poor customer service at food outlets. The corresponding toolkit provides information for collecting data about transportation infrastructure and how to conduct a focus group regarding Food Shopping Patterns in the community.
32

Assessment of Food Availability and Affordability
This assessment evaluates the availability and affordability of food in the community through looking at the following questions:
1. Is a variety of food available in retail stores? 2. Are the available foods affordable to low-income households? 3. Can the Thrifty Food Plan (TFP) market basket be purchased from these retailers at or
below the TFP cost threshold set by USDA? This assessment’s corresponding tool is an extensive food store survey instrument that can be used at any food retailer (identified through the Profile of Community Resources.) It systematically examines both the availability and affordability of 87 food items included in the USDA’s TFP market basket. The toolkit provides directions for contacting store managers and tips for collecting and analyzing the data. These data can be analyzed in a variety of ways to answer the bottom line questions of availability and affordability of food for low-income households as compared with national standards set by the USDA. For example, one could break down availability by the genre of food being looked at (e.g. fruits/vegetables or lean meats) or by the type of food retailer (e.g. supermarket, grocery, or corner store.)
Assessment of Community Food Production Resources This assessment of local agricultural and food production resources seeks to answer the following questions:
1. Does the community have food production, value-added processing, or food distribution resources?
2. Do low-income households have the opportunity to participate in community gardens or other food production activities?
3. Are there any school-based gardening programs? 4. Are locally produced foods sold through local food retailers and restaurants? 5. Does the local school district purchase foods from local producers? 6. Are locally produced foods used by other institutional food service outlets, such as
colleges, prisons, and hospitals? The majority of the data on local food production resources can be found from existing data and through conversations or focus groups with farmers, food service managers, and others key informants involved with the local food system. After identifying if local food production exists, it is important to explore whether it is supported politically and financially by the community, and whether the food produced is available and affordable to all community members. This can be done through the focus group on Community Food Production Resources guidelines provided in the toolkit. The analysis would involve collecting themes from focus groups, as well as mapping techniques to identify the location of food production resources, comparing this information with food markets and other community retailing sites (farmers’ markets, co-ops, etc.) as well as community transportation resources to determine whether all residents have access to community produced foods.
33

Appendix B Northside Food Project
List of Works Consulted/Annotated Bibliography
Poverty and Chronic Diseases
Baumann, L. C., Chang, M., & Hoebeke, R. (2002). Clinical outcomes for low-income adults with hypertension and diabetes. Nursing Research, 51, 191-198.
Underscores importance of prevention of chronic diseases in low-SES population, i.e. promoting healthy lifestyles
Acknowledges that the clinical model is not “enough” to effectively treat this issue—more must be done outside the clinic (upstream)
The main risk factors identified for hypertension and diabetes were obesity and smoking Abstract: Background: Long-term management of hypertension and diabetes, which are more prevalent in minority and socioeconomically disadvantaged populations, presents challenges for healthcare providers in community health centers. Objectives:The purpose of the study was twofold: to examine health outcomes for persons with hypertension and diabetes and to compare these outcomes for disparities in patients who were Black, Hispanic, or White. Methods:Medical records ( N_ 280) from an urban community health center that serves predominantly uninsured adults were reviewed for selected clinical outcomes of primary care. Measures included outcomes of hypertension and diabetes control, lifestyle behaviors, preventive care, and patient status. Chi-square tests, t tests, and one-way analysis of covariance were used to analyze racial/ethnic group differences. Results: Data revealed significant differences in smoking status, influenza immunization, and blood pressure. Racial/ethnic group differences were minimal compared with the overall high prevalence of risk factors such as smoking and obesity. Regular access to primary care did not result in improved clinical outcomes. Conclusion:The findings support the need for more effective interventions that promote healthy lifestyle if health disparities in low-income populations with chronic conditions are to be reduced. Mensah, G. A., Mokdad, A. H., Ford, E. S., Greenlund, K. J., & Croft, J. B. (2005). State of disparities in cardiovascular health in the United States. Circulation, 111, 1233-1241.
Looked at national-level data and found that minorities and people of low SES tend to suffer from more cardiovascular conditions/diseases than whites and those of higher SES
Didn’t explore the “why” for these disparities, but encouraged program planners to use the information on disparities to inform programmatic efforts
Abstract: Background—Reducing health disparities remains a major public health challenge in the United States. Having timely access to current data on disparities is important for policy and program development. Accordingly, we assessed the current magnitude of disparities in cardiovascular disease (CVD) and its risk factors in the United States. Methods and Results—Using national surveys, we determined CVD and risk factor prevalence and indexes of morbidity, mortality, and overall quality of life in adults _18 years of age by race/ethnicity, sex, education level, socioeconomic status, and geographic location. Disparities were common in all risk factors examined. In men, the highest prevalence of obesity (29.2%) was found in Mexican Americans who had completed a high school education. Black women with or without a high school education had a high prevalence of obesity (47.3%). Hypertension prevalence was high among blacks (39.8%) regardless of sex or educational status. Hypercholesterolemia was high among white and Mexican American men and white women in both groups of educational status. Ischemic heart disease and stroke were inversely related to education, income, and poverty status. Hospitalization was greater in men for total heart disease and acute myocardial infarction but greater in women for congestive heart failure and stroke. Among Medicare enrollees, congestive heart failure hospitalization was higher in blacks, Hispanics, and American Indians/Alaska Natives than among whites, and stroke hospitalization was highest in blacks. Hospitalizations for congestive heart failure and stroke were highest in the southeastern United States. Life expectancy remains higher in women than men and higher in whites than blacks by _5 years. CVD mortality at all ages tended to be highest in blacks. Conclusions—Disparities in CVD and related risk factors remain pervasive. The data presented here can be invaluable for policy development and in the planning, implementation, and evaluation of interventions designed to eliminate health disparities.
34

Stamler, J., Elliott, P., Appel, L., Chan, Q., Buzzard, M., Dennis, B., Dyer, A. R., Elmer, P., Greenland, P., Jones, D., Kesteloot, H., Kuller, L., Labarthe, D., Liu, K., Moag-Stahlberg, A., Nichaman, M., Okayama, A., Okuda, N., Robertson, C., Rodriguez, B., Stevens, M., Ueshima, H., Van Horn, L., & Zhou, B. (2003). Higher blood pressure in middle-aged American adults with less education—the role of multiple dietary factors: the INTERMAP study. Journal of Human Hypertension, 17, 655-775.
Found higher blood pressure in lower-educated strata, linked primarily through education-obesity link
Suggests that improving “eating patterns” will help reduce the disparity in blood pressure between people with low vs. high levels of education
Abstract: Extensive evidence exists that an inverse relation between education and blood pressure prevails in many adult populations, but little research has been carried out on reasons for this finding. A prior goal of the INTERMAP Study was to investigate this phenomenon further, and to assess the role of dietary factors in accounting for it. Of the 4680 men and women aged 40–59 years, from 17 diverse population samples in Japan, People’s Republic of China, UK, and USA, a strong significant inverse education–BP relation was manifest particularly for the 2195 USA participants, independent of ethnicity. With participants stratified by years of education, and assessment of 100+ dietary variables from four 24-h dietary recalls and two 24-h urine collections/person, graded relationships were found between education and intake of many macro- and micronutrients, electrolytes, fibre, and body mass index (BMI). In multiple linear regression analyses with systolic BP (SBP) and diastolic BP (DBP) of individuals the dependent variables (controlled for ethnicity, other possible nondietary confounders), BMI markedly reduced size of education–BP relations, more so for women than for men. Several nutrients considered singly further decreased size of this association by X10%: urinary 24-h Na and K excretion, Keys dietary lipid score, vegetable protein, fibre, vitamins C and B6, thiamin, riboflavin, folate, calcium, magnesium, and iron. Combinations of these dietary variables and BMI attenuated the education–SBP inverse coefficient by 54– 58%, and the education–DBP inverse coefficient by 59– 67%, with over half these effects attributable to specific nutrients (independent of BMI). As a result, the inverse education–BP coefficients ceased to be statistically significant. Multiple specific dietary factors together with body mass largely account for the more adverse BP levels of less educated than more educated Americans. Special efforts to improve eating patterns of less educated strata can contribute importantly to overcoming this and related health disparities in the population. Tarasuk, V. S. (2001). Household food insecurity with hunger is associated with women’s food intakes, health and household circumstances. Journal of Nutrition, 131, 2670-2676.
Recognized that food security is inextricably linked to economic security May be relevant to the NFP because it suggests improving the economic situation of a
community, not just the food security, as does the NFP Found that women in this study who were food insecure with hunger were more likely to
report longstanding health problems and social isolation Briefly explored the need of non-food interventions in addition to food interventions
Abstract: This study investigated food intake patterns and contextual factors related to household food insecurity with hunger among a sample of 153 women in families seeking charitable food assistance in Toronto. Women in households characterized by food insecurity with severe or moderate hunger over the past 30 d (as assessed by the Food Security Module) reported lower intakes of vegetables and fruit, and meat and alternatives than those in households with no hunger evident. Women were more likely to report household food insecurity with hunger over the past 12 mo and 30 d if they also reported longstanding health problems or activity limitations, or if they were socially isolated. The circumstances that women identified as precipitating acute food shortages in their households included chronically inadequate incomes; the need to meet additional, unusual expenditures; and the need to pay for other services or accumulated debts. Women who reported delaying payments of bills, giving up services, selling or pawning possessions, or sending children elsewhere for a meal when threatened with acute food shortages were more likely to report household food insecurity with hunger. These findings suggest that expenditures on other goods and services were sometimes foregone to free up money for food, but the reverse was also true. Household food insecurity appears inextricably linked to financial insecurity.
35

The Environment-Obesity link
Darmon, N., Ferguson, E., & Briend, A. (2003). Do economic constraints encourage the selection of energy dense diets? Appetite, 41, 315-322.
Used linear modeling to examine the relationships between energy density (ED) and cost of food, using each separately as the predictor variable
Found that high ED diets were more likely when food budgets were constrained but the relationship was not nearly as strong the other way around (food budgets did not decrease with higher ED foods)
Abstract: Economic constraints, by inducing the selection of low cost energy dense diets, could indirectly be responsible for the high prevalence of obesity in low socio-economic status groups. Diet optimisation by linear programming was used to test this hypothesis, by examining the relationship between the cost and the energy density (ED) of modelled diets. Models were developed that minimized the departure from the mean adult French diet estimated from a cross-sectional dietary survey. Palatability constraints were introduced into all models. The impacts of cost on ED and of ED on cost were explored by introducing and strengthening first a constraint on cost and then a constraint on ED. Forcing the cost of the linear programming diets to decrease induced a strong increase in their EDs. In contrast, forcing the ED to increase induced only a moderate decrease in diet costs. These results suggest that, although an energy dense diet can be selected at a relatively high cost, when cost is not influencing food choices, an energy dense diet will be preferentially selected to maintain habitual French dietary patterns when the budget for food is low. This supports the hypothesis that economic constraints play a role in the high prevalence of obesity in low-income people. Drewnowski, A. & Specter, S. E. (2004). Poverty and obesity: the role of energy density and energy costs. American Journal of Clinical Nutrition, 79, 6-16.
Provided an in-depth review of the relationship of energy-dense (and nutrition poor) foods to overweight
High fat/sugar foods are more energy-dense, but are also cheaper than less-dense lower-fat foods (economic explanation)
Abstract: Many health disparities in the United States are linked to inequalities in education and income. This review focuses on the relation between obesity and diet quality, dietary energy density, and energy costs. Evidence is provided to support the following points. First, the highest rates of obesity occur among population groups with the highest poverty rates and the least education. Second, there is an inverse relation between energy density (MJ/kg) and energy cost ($/MJ), such that energy-dense foods composed of refined grains, added sugars, or fats may represent the lowest-cost option to the consumer. Third, the high energy density and palatability of sweets and fats are associated with higher energy intakes, at least in clinical and laboratory studies. Fourth, poverty and food insecurity are associated with lower food expenditures, low fruit and vegetable consumption, and lower-quality diets. A reduction in diet costs in linear programming models leads to high-fat, energy-dense diets that are similar in composition to those consumed by low-income groups. Such diets are more affordable than are prudent diets based on lean meats, fish, fresh vegetables, and fruit. The association between poverty and obesity may be mediated, in part, by the low cost of energy-dense foods and may be reinforced by the high palatability of sugar and fat. This economic framework provides an explanation for the observed links between socioeconomic variables and obesity when taste, dietary energy density, and diet costs are used as intervening variables. More and more Americans are becoming overweight and obese while consuming more added sugars and fats and spending a lower percentage of their disposable income on food.
36

Dwyer, J. C. (2005). Hunger and obesity in East Harlem: Environmental influences on urban food access. WHERE WAS THIS PUBLISHED?
Extremely relevant to the NFP—produced asset maps and linked access issues to obesity and chronic health conditions
Highlighted access issues to retail food outlets with low prices and food assistance program accessibility (both in the hours of operation and the necessary forms)
Address nutritional quality of available foods in relation to economics Looks at infrastructure and urban planning as well Admits limitations of some “alternative” food sources such as CFAs in poorer areas Posits potential solutions to the issues
No Abstract available. Gordon-Larsen, P., Nelson, M. C., Page, P., & Popkin, B. (2006). Inequality in the built environment underlies key health disparities in physical activity and obesity. Pediatrics, 117, 417-424.
Focused primarily on access to recreational facilities in relation to obesity; less access was found in minority and low-SES areas, which was positively related to obesity
Not especially to food access per se, but does speak to the effects of the built environment on health disparities
Abstract: CONTEXT. Environmental factors are suggested to play a major role in physical activity (PA) and other obesity-related behaviors, yet there is no national research on the relationship between disparity in access to recreational facilities and additional impact on PA and overweight patterns in US adolescents. OBJECTIVE. In a nationally representative cohort, we sought to assess the geographic and social distribution of PA facilities and how disparity in access might underlie population-level PA and overweight patterns. DESIGN, SETTING, AND PARTICIPANTS. Residential locations of US adolescents in wave I (1994–1995) of the National Longitudinal Study of Adolescent Health (N _ 20 745) were geocoded, and a 8.05-km buffer around each residence was drawn (N _ 42 857 census-block groups [19% of US block groups]). PA facilities, measured by national databases and satellite data, were linked with Geographic Information Systems technology to each respondent. Logistic-regression analyses tested the relationship of PA-related facilities with block-group socioeconomic status (SES) (at the community level) and the subsequent association of facilities with overweight and PA (at the individual level), controlling for population density. MAIN OUTCOME MEASURES. Outcome measures were overweight (BMI 95th percentile of the Centers for Disease Control and Prevention/National Center for Health Statistics growth curves) and achievement of 5 bouts per week of moderate-vigorous PA. RESULTS. Higher-SES block groups had a significantly greater relative odds of having 1 or more facilities. Low-SES and high-minority block groups were less likely to have facilities. Relative to zero facilities per block group, an increasing number of facilities was associated with decreased overweight and increased relative odds of achieving _5 bouts per week of moderate-vigorous PA. CONCLUSIONS. Lower-SES and high-minority block groups had reduced access to facilities, which in turn was associated with decreased PA and increased overweight. Inequality in availability of PA facilities may contribute to ethnic and SES disparities in PA and overweight patterns. Horowitz, C. R., Colson, K. A., Hebert, P. L., & Lancaster, K. (2004). Barriers to buying healthy foods for people with diabetes: evidence of environmental disparities. American Journal of Public Health, 94, 1549-1554.
Found that East Harlem, compared to its affluent neighbor, the Upper East Side, had lower availability of diabetes-friendly foods
East Harlem also had more smaller stores and bodegas and less large groceries than the Upper East Side (which may link to the overall poor access to healthy food options)
East Harlem had many more stores selling few to no diabetes-appropriate foods (and probably mainly unhealthy options)
Abstract:
37

Objectives. A community coalition compared the availability and cost of diabetes-healthy foods in a racial/ethnic minority neighborhood in East Harlem, with those in the adjacent, largely White and affluent Upper East Side in New York City. Methods. We documented which of 173 East Harlem and 152 Upper East Side grocery stores stocked 5 recommended foods. Results. Overall, 18% of East Harlem stores stocked recommended foods, compared with 58% of stores in the Upper East Side (P<.0001). Only 9% of East Harlem bodegas (neighborhood stores ) carried all items (vs 48% of Upper East Side bodegas), though East Harlem had more bodegas. East Harlem residents were more likely than Upper East Side residents (50% vs 24%) to have stores on their block that did not stock recommended foods and less likely (26% vs 30%) to have stores on their block that stocked recommended foods. Conclusions. A greater effort needs to be made to make available stores that carry diabetes-healthy foods. Kendall, A., Olson, C. M., Frongillo, E. A. (1996). Relationship of hunger and food insecurity to food availability and consumption. Journal of the American Dietetic Association, 96, 1019-1024.
Found lower consumption of and household stores of food of fruits and vegetables in food insecure households w/ a gradient effect (more insecurity lead to less fruits and vegetables)
Both food secure and food insecure households were unlikely to meet recommended amounts of fruits and vegetables, although this was especially low for food insecure households
Abstract: Objective: To describe the relationship of new measures of hunger and food insecurity to household food supplies and individual food nutrient intake. Design and Setting: A questionnaire containing the Radimer/Cornell hunger and food insecurity items and questions on eating patterns and the frequency of fruit and vegetable consumption was administered to subjects during a personal interview in their homes. A 24-hour diet recall and a household food inventory were conducted a the initial interview and at a follow-up visit. Subjects: Participants were 193 women drawn from a random sample of 308 women who had completed a previous health census in a rural New York State county. Subjects: ages ranged from 15 to 40 years. All had children living at home and less than 16 years of education. Statistical analyses: Regression analysis was used to test fo linear trends across food insecurity groups for the household food inventory scores and for the frequency of consumption of fruits and vegetables. t Tests were used to assess differences between the food secure and food insecure groups for nutrient and food group means. A χ2 test for trend was used to examine differences in the distribution of nutrient and fruit and vegetable intake between the food secure and food insecure groups. Results: A significant decrease in the frequency of consumption of fruits and vegetables and the amount of food in the household and a significant increase in scores indicative of disordered eating patterns were associated with a worsening of food insecurity status. Potassium and fiber intake and fruit consumption differed significantly between the food secure and food insecure groups. The percentage of respondents consuming less than the Recommended Dietary Allowance for vitamin C and fewer than five fruits and vegetables per day was significantly greater among food insecure respondents than food secure respondents. Applications/conclusions: The quantity of food available in households and consumption of fruits and vegetables decreased with increasingly severe problems with food insecurity and hunger. In this rural population, the Radimer/Cornell measures were useful in identifying households experiencing food insecurity and providing information about the nature of the food supply and the dietary intake problems experienced by food insecure households and persons, suggesting that these measures may be useful on community surveys designed to examine food insecurity issues. McCarthy, M. (2004). The economics of obesity. The Lancet, 364, 2169-2170.
Explains the economist approach to a problem like obesity Give great quote by Drewnoski (also in Harlem piece); “Obesity is a low-income
problem, yet we offer middle-class solutions. We say you need to eat more fresh fruits and vegetables and exercise more. Well if you live in the inner city you aren’t going to suddenly start eating mangoes and playing tennis.”
Emphasized that many low-income people are both “cash poor” and “time poor’ so using the Thrifty Food Plan can be impossible; people make rational choices based on limited resources and time
Moore, L. V., & Diez Roux, A. V. (2006). Association of neighborhood characteristics with the location and type of food stores. American Journal of Public Health, 96, 325-331.
38

Provides evidence for race and SES-specific disparities in access to food, especially varied and healthy food options
Abstract: Objectives. We investigated associations between local food environment and neighborhood racial/ethnic and socioeconomic composition. Methods. Poisson regression was used to examine the association of food stores and liquor stores with racial/ethnic composition and income in selected census tracts in North Carolina, Maryland, and New York. Results, Predominantly minority and racially mixed neighborhoods had more than twice as many grocery stores as predominantly White neighborhoods (for predominantly Black tracts, adjusted stores per population ratio [SR] =2.7; 95% confidence interval [Cl] = 2.2, 3.2; and for mixed tracts, SR = 2.2; 95% Cl= 1.9, 2.7) and half as many supermarkets (for predominantly Black tracts, SR^O.5; 95% CI = 0.3, 0.7; and for mixed tracts, SR^O.7; 95% CI = 0.5, 1.0, respectively). Low-income neighborhoods bad 4 times as many grocery stores as the wealthiest neighborhoods SR-4.3;95% Cl=3.6, 5.2) and half as many supermarkets |SR=0.5; 95% CI = 0.3, 0.8). In general, poorer areas and non-White areas also tended to have fewer fruit and vegetable markets, bakeries, specialty stores, and natural food stores. Liquor stores were more common in poorer tban in richer areas (SR^1.3;95%CI = 1.0,1.6). Conclusions. Local food environments vary substantially by neighborhood racial/ethnic and socioeconomic composition and may contribute to disparities in health. (,4m J Public Health, 2006;96:325-331. doi:10.2105/AJPH.2004.058040). Morland, K., Wing, S. & Diez Roux, A. (2002). The contextual effect of the local food environment on residents’ diets: the Atherosclerosis Risk in Communities study. American Journal of Public Health, 92, 1761-1767.
Studied the effect of local food stores on meeting the USDA’s dietary guidelines in four states, including part of Minneapolis’s western suburbs
Found that having a supermarket increased the likelihood of meeting dietary guidelines, especially for eating fruit and vegetables and recommended amounts of total fats and saturated fats
Effect was strongest in African-American communities Abstract: Objectives. We studied the association between the local food environment and residents’ report of recommended dietary intake. Methods. Recommended intakes of foods and nutrients for 10623 Atherosclerosis Risk in Communities participants were estimated from food frequency questionnaires. Supermarkets, grocery stores, and full-service and fast-food restaurants were geocoded to census tracts. Results. Black Americans’ fruit and vegetable intake increased by 32% for each additional supermarket in the census tract (relative risk [RR] = 1.32; 95% confidence interval [CI] = 1.08, 1.60). White Americans’ fruit and vegetable intake increased by 11% with the presence of 1 or more supermarket) RR = 1.11; 95% CI = 0.93, 1.32). Conclusions. These findings suggest the local food environment is associated with residents’ recommended diets. Morland, K., Wing, S., Diez Roux, A., & Poole, C. (2002). Neighborhood characteristics associated with the location of food stores and food service places. American Journal of Preventive Medicine, 22, 23-29.
Examined the location of all types of food stores and food service places by community wealth level and racial diversity
Included parts of Minneapolis suburbs in analysis Found that neighborhood wealth and race were related to the location of food stores/food
service places Supermarkets were much more prevalent in white than black neighborhoods, and
wealthier compared to poorer neighborhoods Abstract: Background: Although the relationship between diet and disease is well established, sustainable dietary changes that would affect risk for disease have been difficult to achieve. Whereas individual factors are traditional explanations for the inability of some people to change dietary habits, little research has investigated how the physical availability of healthy foods affects individuals’ diets. This study examines the distribution of food stores and food service places by neighborhood wealth and racial segregation. Methods: Names and addresses of places to buy food in Mississippi, North Carolina, Maryland, and Minnesota
39

were obtained from respective departments of health and agriculture. Addresses were geocoded to census tracts. Median house values were used to estimate neighborhood wealth, while the proportion of black residents was used to measure neighborhood racial segregation. Results: Compared to the poorest neighborhoods, large numbers of supermarkets and gas stations with convenience stores are located in wealthier neighborhoods. There are 3 times fewer places to consume alcoholic beverages in the wealthiest compared to the poorest neighborhoods (prevalence ratio [PR]_0.3, 95% confidence interval [CI]_0.1– 0.6). Regarding neighborhood segregation, there are 4 times more supermarkets located in white neighborhoods compared to black neighborhoods (PR_4.3, 95% CI_1.5–12.5). Conclusions: Without access to supermarkets, which offer a wide variety of foods at lower prices, poor and minority communities may not have equal access to the variety of healthy food choices available to nonminority and wealthy communities. Popkin, B. M., Duffey, K., & Gordon-Larsen, P. (2005). Environmental influences on food choice, physical activity and energy balance. Physiology & Behavior, 86, 603-613.
Meta-analysis Highlights factors in built environment that affect food consumption Covers research relevant to NFP goals/plans such as access and availability of food
Abstract: In this paper, the environment is defined as the macro- and community-level factors, including physical, legal and policy factors, that influence household and individual decisions. Thus, environment is conceived as the external context in which household and individual decisions are made. This paper reviews the literature on the ways the environment affects diet, physical activity, and obesity. Other key environmental factors discussed include economic, legal, and policy factors. Behind the major changes in diet and physical activity in the US and globally lie large shifts in food production, processing, and distribution systems as well as food shopping and eating options, resulting in the increase in availability of energy-dense foods. Similarly, the ways we move at home, work, leisure, and travel have shifted markedly, resulting in substantial reductions in energy expenditure. Many small area studies have linked environmental shifts with diet and activity changes. This paper begins with a review of environmental influences on diet and physical activity, and includes the discussion of two case studies on environmental influences on physical activity in a nationally representative sample of US adolescents. The case studies illustrate the important role of physical activity resources and the inequitable distribution of such activity-related facilities and resources, with high minority, low educated populations at strong disadvantage. Further, the research shows a significant association of such facilities with individual-level health behavior. The inequity in environmental supports for physical activity may underlie health disparities in the US population. Rose, D. & Richards, R. (2004). Food store access and household fruit and vegetable use among participants in the US food stamp program. Public Health Nutrition, 7, 1081-1088.
Found that easy access to a supermarket (supermarket shopping, short travel time to supermarket, and ownership of a car) was positively associated with increased fruit and vegetable consumption
Shorter distances to food stores was also associated with higher fruit and vegetable consumption
Abstract: Objective: Recent research on access to food among low-income populations in industrialised countries has begun to focus on neighbourhood food availability as a key determinant of dietary behaviour. This study examined the relationship between various measures of food store access and household fruit and vegetable use among participants in the Food Stamp Program, America’s largest domestic food assistance programme. Design: A secondary data analysis was conducted using the 1996–97 National Food Stamp Program Survey. The survey employed a 1-week food inventory method, including two at-home interviews, to determine household food use. Separate linear regression models were developed to analyse fruit and vegetable use. Independent variables included distance to store, travel time to store, ownership of a car and difficulty of supermarket access. All models controlled for a full set of socioeconomic variables.
40

Subjects: A nationally representative sample of participants (n ¼ 963) in the Food Stamp Program. Results: After controlling for confounding variables, easy access to supermarket shopping was associated with increased household use of fruits (84 grams per adult equivalent per day; 95% confidence interval 5, 162). Distance from home to food store was inversely associated with fruit use by households. Similar patterns were seen with vegetable use, though associations were not significant. Conclusions: Environmental factors are importantly related to dietary choice in a nationally representative sample of low-income households, reinforcing the importance of including such factors in interventions that seek to effect dietary improvements.
Effects of Food Insecurity/Hunger and Obesity Link
Casey, P. H., Szeto, K., Lensing, S., Bogle, M., & Weber, J. (2001). Children in food-insufficient, low-income families: prevalence, health, and nutrition status. Archives of Pediatrics and Adolescent Medicine, 155, 508-514.
Study found not differences in children between food-insufficient and food-sufficient low-income households for most outcomes
Low-income food-insufficient children consumed more cholesterol, and less carbohydrates and fruits.
Both the food-sufficient and food-insufficient low-income groups were more likely to be overweight than their higher-income food-sufficient counterparts (poverty could be more important than food insufficiency per se, which could be indicative of access issues)
Study used food insufficiency, a less extreme measure than food insecurity Abstract: Objective: To examine characteristics of US children living in food-insufficient households and to compare food and nutrient intakes, physical inactivity, and overweight and underweight status of children in food-insufficient households with those in food-sufficient households. Design: Cross-sectional, nationally representative sample of children and households from the Continuing Survey of Food Intakes by individuals, from 1994 to 1996. Participants: A group of 3790 households, including 5669 children (ages 0-17 years). Main Outcome Measure(s): Estimates of food insufficiency for children were based on the reported adequacy of their households, described as “often don’t have enough to eat” or sometimes don’t have enough to eat.” Nutrient consumption was based on two 24-hour dietary recalls from in-person interviews. Results: Three percent of all households with children and 7.5% of low-income families with children experienced food insufficiency. Several demographic and characteristic differences were observed between the food-sufficient and food-insufficient low-income groups. Children of low-income families, either food-sufficient or food-insufficient, had similar macronutrient and micronutrient intake, reported exercise, television watching, and percentage of overweight and underweight. When compared with higher-income food-sufficient households, children in the low-income food-insufficient households consumed fewer calories (P=.05) and total carbohydrates (P=0.004), but had higher cholesterol intake (P=.02). The low-income food-insufficient group included more overweight children (P=.04), consumed less fruits (P=.04), and spent more time watching television (P=.02). Conclusions: While not different from low-income families who do not report food insufficiency, low-income families with food insufficiency had children who differed from high-income families in several nutrition and anthropometric measures. Clinicians should be aware of the possible effects of poverty and lack of access to food on child health and nutrition status. The long-term effects of these are not yet known. Hales, C. N., & Barker, D. J. P. (2001). The thrifty phenotype hypothesis. British Medial Bulletin, 60, 5-20.
Examines the strong evidence that maternal malnutrition s a major factors in developing Type 2 Diabetes and metabolic syndrome, especially if the postnatal environment is not malnourished
Abstract: The thrifty phenotype hypothesis proposes that the epidemiological associations between poor fetal and infant growth and the subsequent development of type 2 diabetes and the metabolic syndrome result from the effects of poor nutrition in early life, which produces permanent changes in glucose-insulin metabolism. These changes include reduced capacity for insulin secretion and insulin resistance which, combined with effects of obesity, ageing and physical inactivity, are the most important factors in determining type 2 diabetes. Since the hypothesis was proposed, many studies world-wide have confirmed the initial
41

epidemiological evidence, although the strength of the relationships has varied from on e study to another. The relationship with insulin resistance is clear at all ages studied. Less clear is the relationship with insulin secretion. The relative contribution of genes and environment to these relationships remains a matter of debate. The contributions of maternal hyperglycaemia and the trajectory of postnatal growth need to be clarified. Jyoti, D. F., Frongillo, E. A., & Jones, S. J. (2005). Food insecurity affects school children’s academic performance, weight gain, and social skills. Journal of Nutrition, 12, 2831-2839.
Found longitudinal evidence that food insecurity for children impairs development trajectories (especially reading performance and social skills in girls)
Also found link between food insecurity and later weight gain, especially for girls Abstract: Food insecurity has been associated with diverse developmental consequences for U.S. children primarily from cross-sectional studies. We used longitudinal data to investigate how food insecurity over time related to changes in reading and mathematics test performance, weight and BMI, and social skills in children. Data were from the Early Childhood Longitudinal Study-Kindergarten Cohort, a prospective sample of _21,000 nationally representative children entering kindergarten in 1998 and followed through 3rd grade. Food insecurity was measured by parent interview using a modification of the USDA module in which households were classified as food insecure if they reported _1 affirmative response in the past year. Households were grouped into 4 categories based on the temporal occurrence of food insecurity in kindergarten and 3rd grade. Children’s academic performance, height, and weight were assessed directly. Children’s social skills were reported by teachers. Analyses examined the effects of modified food insecurity on changes in child outcomes using lagged, dynamic, and difference (i.e., fixed-effects) models and controlling for child and household contextual variables. In lagged models, food insecurity was predictive of poor developmental trajectories in children before controlling for other variables. Food insecurity thus serves as an important marker for identifying children who fare worse in terms of subsequent development. In all models with controls, food insecurity was associated with outcomes, and associations differed by gender. This study provides the strongest empirical evidence to date that food insecurity is linked to specific developmental consequences for children, and that these consequences may be both nutritional and nonnutritional. Martins, P. A., Hoffman, D. J., Fernandes, M. T. B., Nascimento, C. R., Roberts, S. B., Sesso, R., & Sawaya, A. L. (2004). Stunted children gain less lean body mass and more fat mass than their non-stunted counterparts: a prospective study. British Journal of Nutrition, 92, 819-825.
Extreme data to examine the link between undernurtition in utero and in early childhood and higher accumulation of body fat and less lean body mass
Study was conducted in Brazil where children were probably severely undernourished, but this sill may be relevant to children in the U.S. who face undernourishment early in life
Abstract: The aim of the present study was to analyse the changes in body composition of stunted children during a follow-up period and to test the hypothesis of a tendency to accumulate body fat as a consequence of undernutrition early in life. We selected fifty boys and girls aged 11 to 15, who were residents of slums in São Paulo, Brazil. Twenty were stunted (S) and thirty had normal stature (NS). The children’s nutritional status and body composition were assessed through anthropometry and dual-energy X-ray absorptiometry, at the beginning of the present study and after 3 years, and changes in lean mass (LM and LM%) and fat mass (FM and FM%) were calculated. Stunted boys accumulated more body fat (FM%: S ¼ 1·62 %, NS ¼ 23·40 %; P¼0·003) and gained less lean mass (LM%: S ¼ 21·46, NS ¼ 3·21 %; P¼0·004). Stunted girls gained less lean mass (S ¼ 7·87 kg, NS ¼ 11·96 kg; P¼0·032) and had significantly higher values of FM% at follow-up when compared with their baseline values (P¼0·008), whereas non-stunted girls had a non-significant difference in FM% over time (P¼0·386). These findings are important to understand the factors involved in the increased prevalence of overweight and obesity among poor populations, which appear to be associated with hunger during infancy and/or childhood. Olson, C. M. (2005). Food insecurity in women: a recipe for unhealthy trade-offs. Topics in Clinical Nutrition, 20, 321-328.
Reviews literature related to food insecurity in women, especially as related to health and overweight and obesity
42

Explains that women are at particular risk for food insecurity because of their unique roles within the family (tend to decrease food intake or variety to allow children to have sufficient nutrient intake)
Indicates that food insecurity may be related to overweight and obesity through the decrease intake of fruits and vegetables
Abstract: Food insecurity means lack of ready, steady access to sufficient nutritious food for an active and healthy life. In 2003, as many as 14 million women were food insecure. Women's roles in managing family feeding make them vulnerable to the consequences of food insecurity. These include inadequate intakes of fruits and vegetables plus associated nutrients and increased risk of obesity. Nutrition and health professionals involved in health promotion programs and dietary counseling with food-insecure mothers need to be aware of the trade-offs between their own and their children's health that these women make. Rose, D. (1999). Economic determinants and dietary consequences of food insecurity in the United States. Journal of Nutrition, 129, 517S-520S.
Explains that income alone can not be used as a proxy for food insecurity (what can? Could this be an issue of access as well?)
Found that food insecurity is often preceded by recent stressful economic life events Abstract: This paper reviews recent research on the economic determinants and dietary consequences of food insecurity and hunger in the United States. The new Current Population Study (CPS) food insecurity and hunger measure shows that hunger rates decline sharply with rising incomes. Despite this strong relationship, confirmed in other national datasets, a one-to-one correspondence between poverty-level incomes and hunger does not exist. In 1995, 13.1% of those in poverty experienced hunger and half of those experiencing hunger had incomes above the poverty level. Panel data indicate that those who are often food insufficient are much more likely than food-sufficient households to have experienced recent events that stress household budgets, such as losing a job, gaining a household member or losing food stamps. Cross-sectional work also demonstrates the importance of food stamps because benefit levels are inversely related to food insufficiency. Concern for the dietary consequences of domestic food insufficiency is well placed; recent research shows that the odds of consuming intakes, 50% of the recommended dietary allowance (RDA) are higher for adult women and elderly individuals from food-insufficient households. Preschoolers from food-insufficient households do not consume significantly lower amounts than those from food-sufficient households, but mean intakes for the rest of members in those very same households are significantly lower for the food insufficient. This research highlights the importance of food insecurity and hunger indicators, further validates the use of self-reported measures and points to areas of need for future research and interventions. Stuff, J. E., Casey, P. H., Szeto, K. L., Gossett, J. M., Robbins, J. M., Simpson, P. M., Connell, C., & Bogle, M. L. (2004). Household food insecurity is associated with adult health status. Journal of Nutrition, 134, 2330-2335.
Population studied was rural, not urban, but included minorities Main finding is that food-insecure people are more likely than food-secure people to
report poor health Can not draw causal relationship, although the data suggest one
Abstract: The prevalence of household food security, which reflects adequacy and stability of the food supply, has been measured periodically in the United States and occasionally in high-risk groups or specific regions. Despite a plausible biological mechanism to suggest negative health outcomes of food insecurity, this relation has not been adequately evaluated. This study was conducted in the Lower Mississippi Delta region to examine the association between household food insecurity and self-reported health status in adults. A two-stage stratified cluster sample representative of the population in 36 counties in the Delta region of Arkansas, Louisiana, and Mississippi was selected using list-assisted random digit dialing telephone methodology. After households were selected and screened, a randomly selected adult was interviewed within each sampled household. Data were collected to measure food security status and self-reported mental, physical, and general health status, using the U.S. Food Security Survey Module and the Short Form 12-item Health Survey (SF-12). Data were reported on a sample of 1488 households. Adults in food-insecure households were significantly more likely to rate their health as poor/fair and scored significantly lower on the physical and mental health scales of the SF-12. In regression models controlling for income, gender,
43

and ethnicity, the interaction between food insecurity status and race was a significant predictor of fair/poor health and lower scores on physical and mental health. Household food insecurity is associated with poorer self-reported health status of adults in this rural, high-risk sample in the Lower Mississippi Delta. Townsend, M. S., Peerson, J., Love, B., Achterberg, C., & Murphy, S. P. (2001). Food insecurity is positively related to overweight in women. Journal of Nutrition, 131, 1738-1745.
First major study that found that for women, overweight increases as food insecurity increases
Suggested mechanism includes binge eating when food is plentiful and general disordered eating patterns
Abstract: Although individuals with poor food security might be expected to have reduced food intake, and thus reduced body fat and less likelihood of being overweight, these associations have not been adequately studied. The purpose of the current study was to examine the relationship between food insecurity and overweight as measured by body mass index (BMI) using data from the nationally representative 1994–1996 Continuing Survey of Food Intakes by Individuals (CSFII). Overweight was defined as BMI .27.3 kg/m2 for women and 27.8 kg/m2 for men. Food insecurity was related to overweight status for women (n 5 4509, P , 0.0001), but not for men (n 5 4970, P 5 0.44). Excluding the 11 severely insecure women, the prevalence of overweight among women increased as food insecurity increased, from 34% for those who were food secure (n 5 3447), to 41% for those who were mildly food insecure (n 5 966) and to 52% for those who were moderately food insecure (n 5 86). Food insecurity remained a significant predictor of overweight status, after adjustment for potentially confounding demographic and lifestyle variables (P , 0.01). In a logistic regression analysis, mildly insecure women were 30% more likely to be overweight than those who were food secure [odds ratio (OR) 1.3, P 5 0.005]. Thus, food insecurity had an unexpected and paradoxical association with overweight status among women with a higher prevalence of overweight among the food insecure, and a resulting potential for increased incidence of obesity-related chronic diseases. Given that the rates of both overweight and food insecurity are on the rise, this research area warrants further investigation.
Evidence of Need for or Effectiveness of Community-Level Approaches
American Dietetic Association (2006). Position of the American Dietetic Association: food insecurity and hunger in the United States. Journal of the American Dietetic Association, 106, 446-458.
The association recognizes access to healthy foods as paramount Examines the link that insecurity has to nutritional deficiencies and the link to obesity Calls for collaborative approaches to solving problems of food insecurity Discusses the potential of farmer’s markets, CFAs, and gleaning in helping end food
insecurity Examines the history of welfare and the effects of its reform on children and families
Abstract It is the position of the American Dietetic Association that systematic and sustained action is needed to bring an end to domestic food insecurity and hunger and to achieve food and nutrition security for all in the United States. The Association believes that immediate and long-range interventions are needed, including adequate funding for and increased utilization of food and nutrition assistance programs, the inclusion of food and nutrition education in all programs providing food and nutrition assistance, and innovative programs to promote and support the economic self-sufficiency of individuals and families, to end food insecurity and hunger in the United States. Food insecurity continues to exist in the United States, with over 38 million people experiencing it sometime in 2004. Negative nutritional and nonnutritional outcomes have been associated with food insecurity in adults, adolescents, and children, including poor dietary intake and nutritional status, poor health, increased risk for the development of chronic diseases, poor psychological and cognitive functioning, and substandard academic achievement. Dietetics professionals can play a key role in ending food insecurity and hunger and are uniquely positioned to make valuable contributions through provision of comprehensive food and nutrition
44

education, competent and collaborative practice, innovative research related to accessing a safe and secure food supply, and advocacy efforts at the local, state, regional, and national levels. Bell, J. & Standish, M. (2005). Communities and health policy: a pathway for change. Health Affairs, 24, 339-342.
Discusses how policy changes can positively affect health issues; use the examples of asthma and obesity
Abstract: Improving the health system can reduce the effects of health disparities, but it can do little to eliminate them. An upsurge in new research is documenting the impact of physical, social, and economic environmental factors: air quality, housing conditions, racism, relationship to community institutions, and neighborhood economic conditions, all of which affect health status over time. A combined focus on community and the policies that affect communities' environments presents opportunities for altering and ameliorating the underlying forces at the heart of the determinants of health. This Perspective presents examples of successful community involvement and policy change. Hamm, M. W. & Bellows, A. C. (2003). Community food security and nutrition educators. Journal of Nutrition Education and Behavior, 35, 37-43.
Proposed a new definition of Community Food Security: “Community food security (CFS) is defined as a situation in which all community residents obtain a safe, culturally acceptable , nutritionally adequate diet through a sustainable food system that maximizes community self-reliance and social justice.”
Encourages nutrition educators to participate in building community food security through collaborations between research, policy, and community
Abstract: Nutrition educators research, teach, and conduct outreach within the field of community food security (CFS), yet no clear consensus exists concerning what the field encompasses. Nutrition education needs to be integrated into the CFS movement for the fundamental reason that optimal health, well-being, and sustainability are at the core of both nutrition education and CFS. Establishing commonalities at the intersection of academic research, public policy development, and distinctive nongovernmental organizations expands opportunities for professional participation. Entry points for nutrition educators' participation are provided, including efforts dedicated to education, research, policy, programs and projects, and human rights. Hampl, J. S., & Hall, R. (2002). Dietetic approaches to US hunger and food insecurity. Journal of the American Dietetic Association, 102, 919-923.
Acknowledges that the typical dietetic approach of targeting individual behaviors is not enough to end hunger and food insecurity
Advises that future research should focus on empowering communities to improve economic and social conditions, which will in turn positively affect food security
Examines some research on the helpfulness of farmers’ markets in improving food access No Abstract available. Kantor, L. S. (2001). Community food security programs improve food access. Food Review, 24, 20-26.
Discusses benefits of assessing the quality/affordability of food in local stores, as well as the benefits of co-ops, CFAs, farmers; markets, and community gardening
No Abstract available; excerpt: “Community-based initiatives, such as farmers markets and community gardens, can boost the effectiveness of USDA nutrition assistance and education programs by increasing the availability of high-quality and affordable food in a community. Such initiatives also support rural communities by strengthening the traditional ties that exist between farmers and urban consumers.”
45

McCullum, C., Desgardins, E., Kraak, V. I., Ladipo, P., & Costello, H. (2005). Evidence-based strategies to build community food security. Journal of the American Dietetic Association, 105, 278-283.
Outlines three states of strategies to building community food security Advocates for “capacity building” and maintaining networks of partnerships with
stakeholders and community members at multiple levels Stresses potential of farmers’ markets, nutrition education, CFAs, etc.
No Abstract available; excerpts: “A sustainable community food system improves the health of the community, environment, and individuals over time (13), involving a collaborative effort in a particular setting to build locally based, self-reliant food systems and economies (14,15).” “This article provides dietetics professionals with a three-stage continuum of evidence-based strategies and activities that applies a food systems approach to building community food security. Stage 1 creates small but significant changes to existing food systems through such strategies as identifying food quality and pricing inequities in low-income neighborhoods and educating consumers regarding both the need and the possibilities for alternative food systems. Stage 2 stabilizes and augments change for food systems in transition by developing social infrastructure through multisector partnerships and networks and fostering participatory decision-making and initial policy development. Based on these changes, stage 3 involves advocacy and integrated policy instruments to redesign food systems for sustainability. Data collection, monitoring, and evaluation are key components of all stages of the community food security continuum.” Tarasuk, V. (2001). A critical examination of community-based responses to household food insecurity in Canada. Health Education & Health Behavior, 28, 487-499.
Examined effectiveness of “community kitchens” in alleviating food insecurity and found that because these programs often loose funding over time, they often do not significantly help families and reduce food insecurity
Emphasized the importance of mutual social support Tarasuk’s position is that community-level approaches to food insecurity will have
limited success if they focus only on food; they must focus more broadly on improving the economic and social environment
Abstract: Over the past two decades, household food insecurity has emerged as a significant social problem and serious public health concern in the “FirstWorld.” In Canada, communities initially responded by establishing ad hoc charitable food assistance programs, but the programs have become institutionalized. In the quest for more appropriate and effective responses, a variety of community development programs have recently been initiated. Some are designed to foster personal empowerment through self-help and mutual support; others promote community-level strategies to strengthen local control over food production. The capacity of current initiatives to improve household food security appears limited by their inability to overcome or alter the poverty that underpins this problem. This may relate to the continued focus on food-based responses, the ad hoc and community based nature of the initiatives, and their origins in publicly funded health and social service sectors.
Federal Food Programs
Bhargava, A. (2004). Socio-economic and behavioural factors are predictors of food use in the National Food Stamp Program Survey. British Journal of Nutrition, 92, 497-506.
Examined data from the National Food Stamp Program Survey (NFSPS) and found evidence of a need for more nutrition education with this population
Supported previous findings of decreased food intakes as time from disbursement of benefits increased, and recommended transfer of half the benefits two times a month to address this issue
46

Regular trips to a grocery store was also found to help diet quality, which speaks to access issues in places like North Minneapolis where it may be difficult to make frequent trips to an adequate store)
Abstract: The unhealthy dietary patterns in the USA especially among low-income households demand complex strategies for health promotion. The present paper analysed the proximate determinants of 7 d food use by 919 participants in the National Food Stamp Program Survey conducted in 1996. The households’ consumption of dietary energy, carbohydrate, protein, fibre, saturated, monounsaturated and polyunsaturated fats, Ca, Fe, b-carotene and vitamin C were explained by background, socio-economic and behavioural factors. Certain methodological issues arising in modelling food use data were addressed. The results showed that the subjects’ knowledge of the US Department of Agriculture food pyramid, reading nutrition labels, adopting a low-fat diet, selecting fruits and vegetables, saving money at grocery stores and frequency of shopping trips were often significantly associated (P,0·05) with the densities of nutrient use. The results identified certain aspects of nutrition education programmes that deserve greater emphasis for improving diet quality. The model for energy intake indicated that disbursing half the food stamp benefits on a 2-week basis and better shopping practices can enhance food availability. Gibson, D. (2003). Food Stamp Program participation is positively related to obesity in low income women. Journal of Nutrition, 133, 2225-2231.
See comment from Frongillo (2003) Found that Food Stamp Program participation is related to obesity in women (but not
men) even after controlling for many potential confounders Didn’t control for food security/insecurity Suggested several mechanisms that could explain the found relationship but this is not
empirically explored o Inexpensive high energy food choices o Disordered eating (e.g. periods of overeating followed by periods of normal
eating or deprivation) o Stress-induced biological changes
Proposed a conceptual framework for this relationship
Abstract: This study examined the relationship between Food Stamp Program (FSP) participation and the obesity of low income individuals using data from the National Longitudinal Survey of Youth 1979. Obesity was defined as body mass index ≥ 30 kg/m2. The data were arranged as a panel with multiple observations per individual, and the models of obesity included current and long-term FSP participation, additional demographic, socioeconomic and environment characteristics and individual fixed effects. Individual fixed effects were used to take into account unobserved differences across individuals that did not vary over time. In ordinary least squares models, current and long-term FSP participation were significantly related to the obesity of low income women (P < 0.05), but not of low income men. For low income women, current participation in the FSP was associated with a 9.1% increase in the predicted probability of current obesity. Participation in the FSP in each of the previous five years compared to no participation over that time period was
47
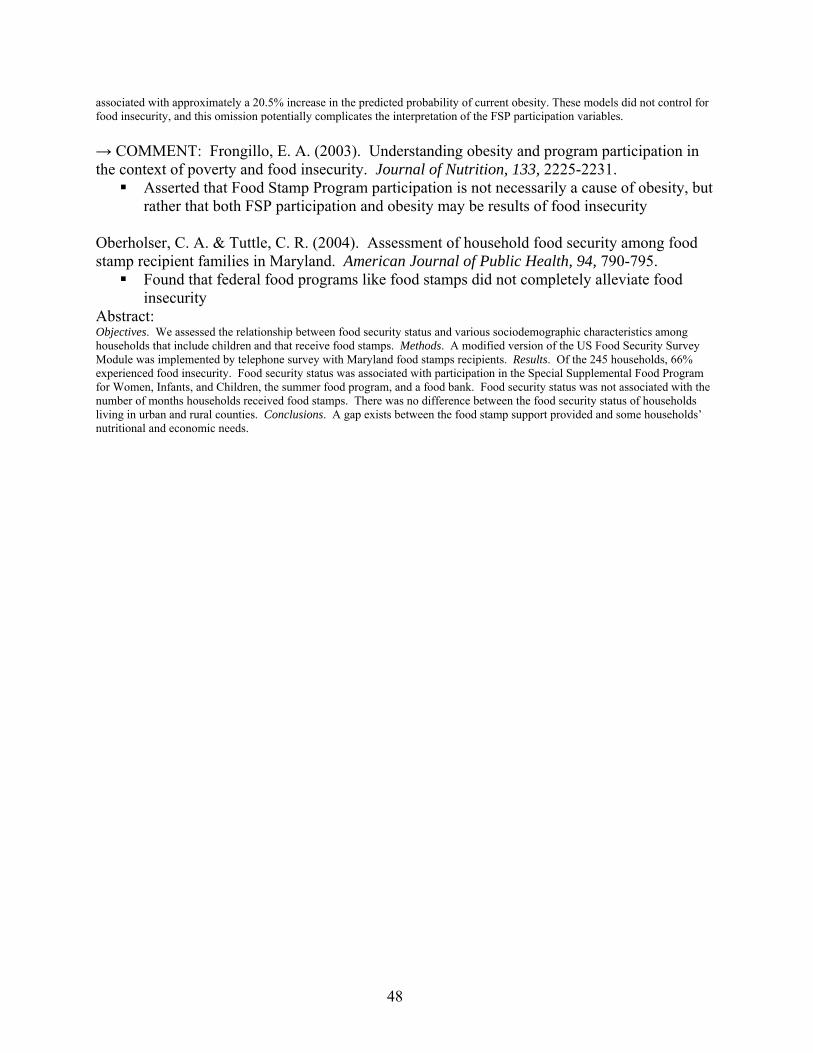
associated with approximately a 20.5% increase in the predicted probability of current obesity. These models did not control for food insecurity, and this omission potentially complicates the interpretation of the FSP participation variables. → COMMENT: Frongillo, E. A. (2003). Understanding obesity and program participation in the context of poverty and food insecurity. Journal of Nutrition, 133, 2225-2231.
Asserted that Food Stamp Program participation is not necessarily a cause of obesity, but rather that both FSP participation and obesity may be results of food insecurity
Oberholser, C. A. & Tuttle, C. R. (2004). Assessment of household food security among food stamp recipient families in Maryland. American Journal of Public Health, 94, 790-795.
Found that federal food programs like food stamps did not completely alleviate food insecurity
Abstract: Objectives. We assessed the relationship between food security status and various sociodemographic characteristics among households that include children and that receive food stamps. Methods. A modified version of the US Food Security Survey Module was implemented by telephone survey with Maryland food stamps recipients. Results. Of the 245 households, 66% experienced food insecurity. Food security status was associated with participation in the Special Supplemental Food Program for Women, Infants, and Children, the summer food program, and a food bank. Food security status was not associated with the number of months households received food stamps. There was no difference between the food security status of households living in urban and rural counties. Conclusions. A gap exists between the food stamp support provided and some households’ nutritional and economic needs.
48