Northern Virginia Regional Projects Fiscal Year 2018 ... · Older Adult Commitment Results: 54...
21
Northern Virginia Regional Projects Fiscal Year 2018 Ending January 31, 2018 Regional Utilization Group Report for the Regional Management Group Alan Wooten Executive Director Prince William CSB Carol Layer Executive Director Alexandria CSB Margaret Graham Executive Director Loudoun CSB Jean Post Regional Projects Director Daryl Washington Acting Executive Director Fairfax-Falls Church CSB Deborah Warren Executive Director Arlington CSB Amy Smiley Facility Director Northern Virginia Mental Health Institute
-
Upload
nguyenlien -
Category
Documents
-
view
213 -
download
0
Transcript of Northern Virginia Regional Projects Fiscal Year 2018 ... · Older Adult Commitment Results: 54...

Northern Virginia Regional Projects
Fiscal Year 2018 Ending January 31, 2018
Regional Utilization Group Report for the
Regional Management Group
Alan Wooten Executive Director Prince William CSB Carol Layer Executive Director Alexandria CSB Margaret Graham Executive Director Loudoun CSB Jean Post Regional Projects Director
Daryl Washington Acting Executive Director Fairfax-Falls Church CSB Deborah Warren Executive Director Arlington CSB Amy Smiley Facility Director Northern Virginia Mental Health Institute

FY 18 DBHDS Region 2/Northern DS Region:
Utilization Management Review: January 2018
January Data FY 18 YTD Data Notes
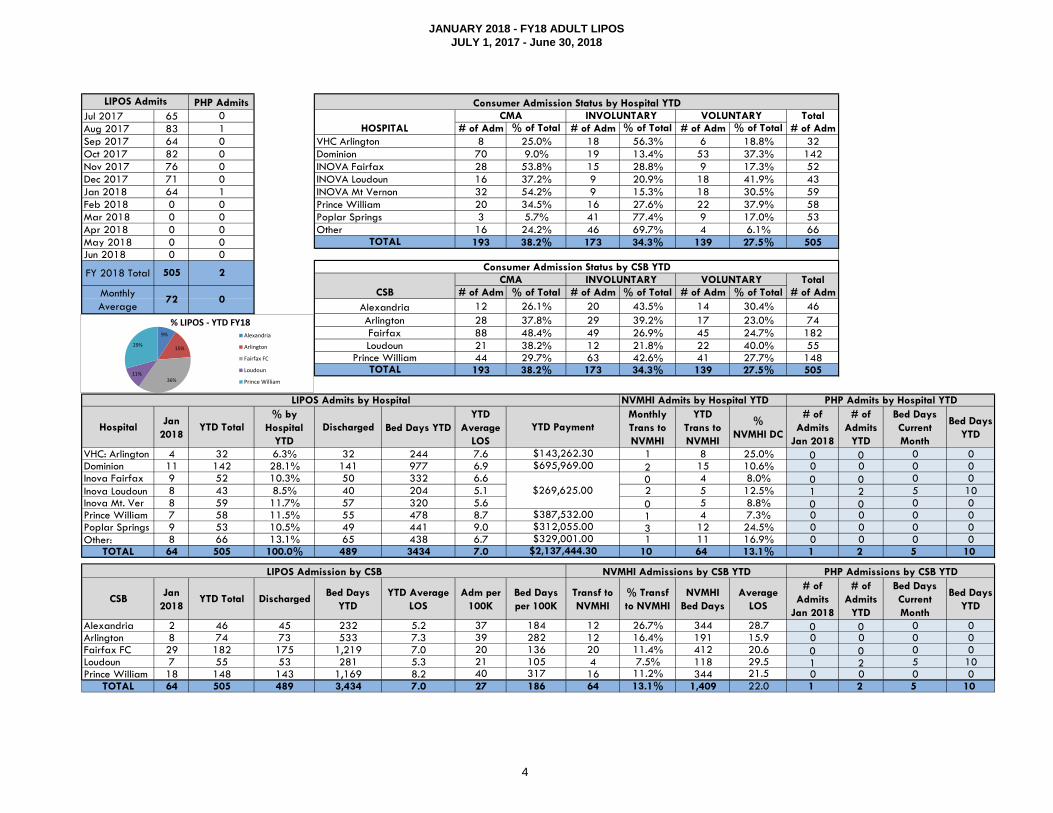
64 Authorized Admissions for 521 Bed days 505 Authorized Admissions for 3434 Bed days Page 4, LIPOS Sum
Monthly Average Admission: 72
Dominion had highest number of Authorized LIPOS
Admissions, 11 (17%)
Dominion Hospital had highest number of Authorized LIPOS
Admissions, 142 (28%)
34 Individuals have stayed 12-14 daysPage 5, LIPOS
Monthly Comparison
13 Individuals have stayed 15-18 days Page 6, LIPOS YOY
6 have stayed 18-20 days
17 have stayed 21 or more days
Admissions are predominantly resulting from civil commitment
process: CMA (38.2%) and Involuntary (34.3%)
Average LOS: 7
Adult PHP: 1 2 Admission
Youth Lipos
6 Authorized Admissions 36 Authorized Admissions for 380 bed days
Page 7, Youth LIPOS
Sum
66.7% at Dominion Hospital
Page 8, PHP and
Youth LIPOS YOY
Average LOS: 10.9
Youth PHP: 2 6 Admissions
2. NVMHI
January Data FY 18 YTD Data Notes
116 Admissions 744 Admissions Page 9, Admissions
98 Discharges 735 Discharges
98 TDO Admissions, 84.5% of Admissions 614 TDO Admissions, 82.5% of Admissions
12 Invol Admissions, 10.3% of Admissions 79 Invol Admissions, 10.6% of AdmissionsPage 10, Year over
Year16 Diversions to NVMHI from other areas YTD (0 over past 3
months)
53% insured admits for January 50% insured admits YTD Page 11, Insured
89% Occupancy Rate 87% Occupancy YTD 12 Admissions had MH/ID Dx.
2 NGRI Admits 7 NGRI Admits These numbers
3 Jail Transfers 32 Jail Transfersare based on NVMHI
Report
1. LIPOS
2

FY 18 DBHDS Region 2/Northern DS Region:
Utilization Management Review: January 2018
3. Other State Facilities
Western State Piedmont Geriatric Hospital CCCA
Average Census of 34 6 Jan Admits, 31 YTD 9 Jan Admits, 75 YTD
14 Region 2 Admissions in January, 117 YTD 6 Jan Discharges, 26 YTD9 Jan Discharges, 74
YTD
6 RFD5 EBL
January Data FY 18 YTD Data Notes
367 TDOs (all ages) in January 2,439 TDOs (all ages) YTD
345 Commitment Hearings in January 2,267 Commitment Hearings YTD Page 12, Summary
Adult Commitment Results: 93 Invol. & 147 CMA
Adult Commitment Results: 619 Invol., 30.6% & 886 CMA,
43.8%
Older Adults Commitment Results: 8 Inv. Older Adult Commitment Results: 54 Inv., 54.5%
Minor Commitment Results: 10 dismissed Minors Commitment Results: 86 dismissed, 59.7%
Page 13, Year over
Year
35 Committed/CMA non-geriatric adults went to
Fairfax, 14.5%
224 Committed/CMA non-geriatric adults went to Dominion,
14.8%
Page 14, Adults by
Hosp
1 Committed/CMA older adults went to Fairfax,
Loudoun, Mt. Vernon and Prince William, 10%
13 Committed/CMA older adults went to VHC and Loudoun,
17%
Page 15, Older Adults
by Hospital Page 16,
Minors by Hosp
2 Committed/CMA Minors went to Dominion, 28.5%
each17 Committed/CMA Minors went to Dominion, 30.3%
5. Crisis Stabilization Units
January Data FY 18 YTD Data Notes
93 Admissions 574 Admissions Page 17-18 Summary
82 Discharges 564 Discharges
67% of Admissions were for Diversion 70% of Admissions were for DiversionPage 19, Year over
Year30% of Admissions were for Step-down 27% of Admissions were for Step-down
7 consumers stayed longer than 15 days 75 consumers stayed longer than 15 daysNo consumers stayed longer than 21 days 7 consumers stayed longer than 21 days
79% Occupancy 82% Occupancy
4. TDO/Commitments
94 Jan Bed Days, 927
YTD
3
JANUARY 2018 - FY18 ADULT LIPOS
JULY 1, 2017 - June 30, 2018
PHP Admits
Jul 2017 65 0 Total
Aug 2017 83 1 # of Adm % of Total # of Adm % of Total # of Adm % of Total # of Adm
Sep 2017 64 0 8 25.0% 18 56.3% 6 18.8% 32
Oct 2017 82 0 70 9.0% 19 13.4% 53 37.3% 142
Nov 2017 76 0 28 53.8% 15 28.8% 9 17.3% 52
Dec 2017 71 0 16 37.2% 9 20.9% 18 41.9% 43
Jan 2018 64 1 32 54.2% 9 15.3% 18 30.5% 59
Feb 2018 0 0 20 34.5% 16 27.6% 22 37.9% 58
Mar 2018 0 0 3 5.7% 41 77.4% 9 17.0% 53
Apr 2018 0 0 16 24.2% 46 69.7% 4 6.1% 66
May 2018 0 0 193 38.2% 173 34.3% 139 27.5% 505
Jun 2018 0 0
Total
# of Adm % of Total # of Adm % of Total # of Adm % of Total # of Adm
12 26.1% 20 43.5% 14 30.4% 46
28 37.8% 29 39.2% 17 23.0% 74
88 48.4% 49 26.9% 45 24.7% 182
21 38.2% 12 21.8% 22 40.0% 55
44 29.7% 63 42.6% 41 27.7% 148193 38.2% 173 34.3% 139 27.5% 505
NVMHI Admits by Hospital YTD
HospitalJan
2018YTD Total
% by
Hospital
YTD
Discharged Bed Days YTD
YTD
Average
LOS
Monthly
Trans to
NVMHI
YTD
Trans to
NVMHI
%
NVMHI DC
# of
Admits
Jan 2018
# of
Admits
YTD
Bed Days
Current
Month
Bed Days
YTD
VHC: Arlington 4 32 6.3% 32 244 7.6 1 8 25.0% 0 0 0 0Dominion 11 142 28.1% 141 977 6.9 2 15 10.6% 0 0 0 0Inova Fairfax 9 52 10.3% 50 332 6.6 0 4 8.0% 0 0 0 0
Inova Loudoun 8 43 8.5% 40 204 5.1 2 5 12.5% 1 2 5 10
Inova Mt. Ver 8 59 11.7% 57 320 5.6 0 5 8.8% 0 0 0 0Prince William 7 58 11.5% 55 478 8.7 1 4 7.3% 0 0 0 0Poplar Springs 9 53 10.5% 49 441 9.0 3 12 24.5% 0 0 0 0
Other: 8 66 13.1% 65 438 6.7 1 11 16.9% 0 0 0 0TOTAL 64 505 100.0% 489 3434 7.0 10 64 13.1% 1 2 5 10
CSBJan
2018YTD Total Discharged
Bed Days
YTD
YTD Average
LOS
Adm per
100K
Bed Days
per 100K
Transf to
NVMHI
% Transf
to NVMHI
NVMHI
Bed Days
Average
LOS
# of
Admits
Jan 2018
# of
Admits
YTD
Bed Days
Current
Month
Bed Days
YTD
Alexandria 2 46 45 232 5.2 37 184 12 26.7% 344 28.7 0 0 0 0Arlington 8 74 73 533 7.3 39 282 12 16.4% 191 15.9 0 0 0 0Fairfax FC 29 182 175 1,219 7.0 20 136 20 11.4% 412 20.6 0 0 0 0Loudoun 7 55 53 281 5.3 21 105 4 7.5% 118 29.5 1 2 5 10Prince William 18 148 143 1,169 8.2 40 317 16 11.2% 344 21.5 0 0 0 0
TOTAL 64 505 489 3,434 7.0 27 186 64 13.1% 1,409 22.0 1 2 5 10
YTD Payment
INOVA Loudoun
0
Arlington
$269,625.00
TOTAL
Poplar Springs
Consumer Admission Status by CSB YTD
72
TOTAL
CMA
Fairfax
Loudoun
2
Monthly
Average
PHP Admissions by CSB YTD
$143,262.30$695,969.00
PHP Admits by Hospital YTD
NVMHI Admissions by CSB YTD
$312,055.00
LIPOS Admits by Hospital
LIPOS Admission by CSB
$329,001.00
$387,532.00
$2,137,444.30
VOLUNTARY
INOVA Mt Vernon
INVOLUNTARY
Other
Alexandria
VOLUNTARY
VHC Arlington
Dominion
Prince William
LIPOS Admits Consumer Admission Status by Hospital YTD
INVOLUNTARY
CMA
Prince William
HOSPITAL
505FY 2018 Total
CSB
INOVA Fairfax
9%
15%
36%11%
29%
% LIPOS - YTD FY18Alexandria
Arlington
Fairfax FC
Loudoun
Prince William
4

FY18 DBHDS Region 2: LIPOS YOY Data
37
72
36 39
62 66
52
74 76
61
83
6671
6876
61
85 87 85 81
98
7166
7565
83
64
8276
7164
0
20
40
60
80
100
120
July August Sept Oct Nov Dec Jan Feb March April May June
FY18 LIPOS Admissions by Month
FY 16 FY 17 FY 18 YTD
3.19
4.673.47
5.544.71 4.32
6.907.65
4.91 4.485.48
4.33
5.86 6.106.7 6.4 6.8 6.4
6.8
6.7 6.6 6.5 6.5 6.6
9.9
6.1 6.6
6.7
6.86.7
7.0
0.00
2.00
4.00
6.00
8.00
10.00
12.00
July August Sept Oct Nov Dec Jan Feb March April May June
FY18 LIPOS Average LOS by Month
FY 16 AVG LOS FY 17 AVG LOS YTD FY 18 YTD AVG LOS
5

FY18, July - January, DBHDS Region 2: LIPOS YOY Data
36 37 39 4147
5951
61
77 72
0
20
40
60
80
100
FY 9 FY 10 FY 11 FY 12 FY 13 FY 14 FY 15 FY 16 FY 17 FY 18YTD
LIPOS Monthly Average Admission Authorizations
5.2
4.3
5.4 5.4 5.2 5.4
4.2
5.4
6.67
0
1
2
3
4
5
6
7
8
FY 9 FY 10 FY 11 FY 12 FY 13 FY 14 FY 15 FY 16 FY 17 FY 18YTD
LIPOS Average LOS
33%
45%
34%31%
35% 36%
48%
41%
21%
13%
0%
10%
20%
30%
40%
50%
60%
FY 9 FY 10 FY 11 FY 12 FY 13 FY 14 FY 15 FY 16 FY 17 FY 18YTD
LIPOS Transfers to NVMHI
2880
3723
2524
3857
5988
3434
0
1000
2000
3000
4000
5000
6000
7000
FY 13 FY 14 FY 15 FY 16 FY 17 FY 18 YTD
LIPOS Total Bed Days Authorized
6

JANUARY 2018 - FY18 YOUTH LIPOS
July 1, 2017 - June 30, 2018
PHP Admits
Jul 2017 4 1 TotalAug 2017 6 0 # of Adm % of Total # of Adm % of Total # of Adm % of Total # of AdmSep 2017 3 0 1 4.2% 3 12.5% 20 83.3% 24Oct 2017 5 2 1 11.1% 0 0.0% 8 88.9% 9Nov 2017 4 0 0 0.0% 1 0.0% 1 0.0% 2Dec 2017 8 1 0 0.0% 0 0.0% 0 0.0% 0Jan 2018 6 2 0 0.0% 0 0.0% 0 0.0% 0Feb 2018 0 0 0 0.0% 0 0.0% 1 0.0% 1Mar 2018 0 0 2 5.6% 4 11.1% 30 83.3% 36Apr 2018 0 0May 2018 0 0Jun 2018 0 0 Total
# of Adm % of Total # of Adm % of Total # of Adm % of Total # of Adm0 0.0% 0 0.0% 5 100.0% 50 0.0% 0 0.0% 3 100.0% 32 11.1% 4 22.2% 12 66.7% 180 0.0% 0 0.0% 7 0.0% 70 0.0% 0 0.0% 3 0.0% 32 5.6% 4 11.1% 30 83.3% 36
HospitalJan
2018YTD Total
% by
Hospital
YTD
Discharged
YTDBed Days YTD
YTD
Average
LOS
YTD Payment# of Admits
Jan 2018
# of
Admits
YTD
Bed Days
Jan 18
Bed Days
YTD
Dominion 2 24 66.7% 23 264 11.5 $200,839.60 1 4 4 36
North Springs 3 9 25.0% 9 83 9.2 $23,285 1 2 0 10Poplar Springs 1 2 5.6% 2 28 0.0 $19,044 0 0 0 0
Snowden 0 0 0.0% 0 0 0.0 $0 0 0 0 0VTCC 0 0 0.0% 0 0 0.0 $0 0 0 0 0Other: 0 1 2.8% 1 5 0.0 -$29,925 0 0 0 0
TOTAL 6 36 100.0% 35 380 10.9 $213,243.60 2 6 4 46
CSBJan
2018YTD Total
Discharged
YTD
Bed Days
YTD
YTD Average
LOS
Adm
per100K
Bed Days
per100KYTD Payment
# of
Admits
Jan 2018
# of
Admits
YTD
Bed Days
Jan 18
Bed Days
YTD
Alexandria 1 5 5 57 11.4 18 207 $20,989.80 0 1 0 8
Arlington 0 3 3 18 6.0 7 45 $15,210 0 0 0 0Fairfax FC 2 17 16 205 21.0 6 73 $149,039 1 3 4 28Loudoun 2 8 8 60 0.0 7 55 $36,805 1 2 0 10Prince William 1 3 3 40 0.0 2 28 -$8,800 0 0 0 0
TOTAL 6 36 35 380 10.9 7 76 $213,243.60 2 6 4 46
VOLUNTARY
Snowden
Consumer Admission Status by Hospital YTD
VOLUNTARYHOSPITAL
Poplar Springs
VTCC
Dominion
PHP Admissions by Hospital YTD
PHP Admissions by CSB YTDLIPOS Admission by CSB
LIPOS Admissions by Hospital
OtherTOTAL
Consumer Admission Status by CSB YTDINVOLUNTARY
Loudoun
LIPOS Admits
TOTAL
AlexandriaArlington
POST HEARING VOL INVOLUNTARY
Prince William
North Springs
Monthly Avg
CSBPOST HEARING VOL
Fairfax5.1
FY18 Total 636
1
14%
9%
47%
22%
8%
% LIPOS - YTD FY18
Alexandria
Arlington
Fairfax FC
Loudoun
Prince William
7

FY18, July - January, DBHDS Region 2: Adult PHP and Youth LIPOS YOY Data
2018
16
910
32
0
5
10
15
20
25
FY 12 FY 13 FY 14 FY 15 FY 16 FY 17 FY 18 YTD
Adult PHP Admits
4.5 4.64.9
3.1
6
5
0
1
2
3
4
5
6
7
FY 13 FY 14 FY 15 FY 16 FY 17 FY 18 YTD
Adult PHP ALOS
33
6067
41
67
36
0
10
20
30
40
50
60
70
80
FY 13 FY 14 FY 15 FY 16 FY 17 FY 18 YTD
Youth LIPOS Admits
7.88.7
6.8
10.6
7.5
10.9
0
2
4
6
8
10
12
FY 13 FY 14 FY 15 FY 16 FY 17 FY 18 YTD
Youth LIPOS ALOS
8

CSB Month % YTD % Month % YTD % Month % YTD % Month % YTD %
Alex 9 64.3% 51 62.2% 0 0.0% 0 0.0% 0 0.0% 0 0.0% 2 14.3% 12 14.6%
Arl 13 92.9% 101 84.2% 0 0.0% 0 0.0% 0 0.0% 2 1.0% 1 7.1% 15 12.5%
Fairfax 29 82.9% 187 84.6% 0 0.0% 0 0.0% 1 2.9% 6 2.7% 5 14.3% 25 11.3%
Loudn 8 80.0% 46 76.7% 0 0.0% 0 0.0% 0 0.0% 0 0.0% 1 10.0% 5 8.3%
PW 38 90.5% 216 90.4% 0 0.0% 1 0.4% 0 0.0% 1 0.4% 3 7.1% 19 7.9%
Other 1 0.0% 13 0.0% 0 0.0% 0 0.0% 0 0.0% 0 0.0% 0 0.0% 3 0.0%
Total 98 84.5% 614 82.5% 0 0.0% 1 0.1% 1 0.9% 9 1.2% 12 10.3% 79 10.6%
CSB Month % YTD % Month Monthly % YTD YTD % Month Monthly % YTD YTD % Month YTD 100K
Alex 0 0.0% 0 0.0% 3 21.4% 18 22.0% 0 0.0% 1 1.2% 14 82 51
Arl 0 0.0% 1 0.8% 0 0.0% 0 0.0% 0 0.0% 1 0.8% 14 120 51
Fairfax 0 0.0% 3 1.4% 0 0.0% 0 0.0% 0 0.0% 0 0.0% 35 221 19
Loudn 1 10.0% 1 1.7% 0 0.0% 8 13.3% 0 0.0% 0 0.0% 10 60 16
PW 1 2.4% 2 0.8% 0 0.0% 0 0.0% 0 0.0% 0 0.0% 42 239 48
Other 0 0.0% 0 0.0% 0 0.0% 6 0.0% 0 0.0% 0 0.0% 1 22 0
Total 2 1.7% 7 0.9% 3 2.6% 32 4.3% 0 0.0% 2 0.3% 116 744 31
CSB Month YTD
Monthly
Bed
Days Bed Days YTD
Bed
Days
YTD
100K
Monthly
Mean LOS
YTD
Mean
LOS
Monthly
Median
LOS
YTD
Median
LOS
Alex 10 81 122 2001 1817.7 12 25 7 14
Arl 12 117 155 4141 2472.8 13 35 7 8
Fairfax-FC 30 214 535 7663 1011.2 18 36 8 9
Loudoun 10 59 152 1358 577.0 15 23 6 7
PW 36 230 812 6425 1981.6 23 28 6 8
Other 0 34 0 3743 0.0 0 110 0 31
Total 98 735 1776 25331 1588.2 18 34 6 8
Jail Transfers
NVMHI Discharges
NVMHI Admissions - January 2018
FY-18
TDO Voluntary CMA Involuntary
Forensics/DOC Other Total
5
2
8
1
0 0 00
1
2
3
4
5
6
7
8
9
Jul-17 Aug-17 Sep-17 Oct-17 Nov-17 Dec-17 Jan-18
NUMBER OF DIVERSION ADMISSIONS
9

FY18, July - January, DBHDS Region 2: NVMHI YOY Data
26% 25% 22% 23% 22%17%
31%
42%
50%
0%
10%
20%
30%
40%
50%
60%
FY 10 FY 11 FY 12 FY 13 FY 14 FY 15 FY 16 FY 17 FY 18YTD
NVMHI Insured Admissions by %
85 8273
53 5846
69
88 90
106
0
20
40
60
80
100
120
FY 9 FY 10 FY 11 FY 12 FY 13 FY 14 FY 15 FY 16 FY 17 FY 18YTD
NVMHI Average Monthly Admissions
33%22% 23%
11%17%
45%
66%
83%
0%
20%
40%
60%
80%
100%
FY 11 FY 12 FY 13 FY 14 FY 15 FY 16 FY 17 FY 18YTD
NVMHI TDO Admissions by %
2024 25 24 22 22
28.2
22
0
10
20
30
FY 11 FY 12 FY 13 FY 14 FY 15 FY 16 FY 17 FY 18YTD
NVMHI Average LOS of LIPOS Transfers in Days
10

FY 12 FY 13 FY 14 FY 15 FY 16FY 17
Qtr 1
FY 17
Qtr 2
FY 17
Jan
FY 17
Feb
FY 17
Mar
FY 17
Qtr 3
FY 17
Apr
FY 17
May
FY 17
June
FY 17
Qtr 4
FY 17
YTD
FY 18
July
FY 18
Aug
FY 18
Sept
FY 18
Qtr 1
FY 18
Oct
FY 18
Nov
FY 18
Dec
FY 18
Qtr 1
FY 18
Jan
Total insured
admissions170 135 121 143 329 79 98 50 33 34 117 41 43 70 154 448 52 54 58 164 59 48 43 150 62
Medicare 119 80 75 66 135 32 38 18 11 16 45 14 11 28 53 168 17 29 24 70 16 23 11 50 20
Medicaid 0 10 18 20 49 9 4 8 7 7 22 6 11 11 28 63 14 8 12 34 13 9 15 37 14
Commercial 51 45 28 57 145 38 56 24 15 11 50 21 21 31 73 217 21 17 22 60 30 16 17 63 28
Total NVMHI
admissions763 555 546 822 1060 241 249 113 85 85 283 87 95 124 306 1079 100 109 109 318 116 96 98 310 116
% insured 22% 24% 22% 17% 31% 33% 39% 44% 39% 40% 41% 47% 45% 56% 50% 42% 52% 50% 53% 52% 51% 50% 44% 48% 53%
Alexandria 13 11 10 8 27 9 8 2 6 4 12 8 7 7 22 51 5 4 5 14 3 6 3 12 7
Arlington 53 35 35 33 50 15 13 6 2 10 18 9 6 10 25 71 8 7 8 23 12 7 7 26 8
Fairfax 44 36 43 43 99 25 31 18 6 9 33 8 12 18 38 127 12 17 14 43 17 16 11 44 20
Loudoun 6 5 7 12 30 4 10 5 2 0 7 3 6 7 16 37 7 6 5 18 4 2 6 12 7
Prince William 54 47 24 47 118 22 27 12 13 10 35 8 9 22 39 123 17 17 20 54 22 16 16 54 20
Other 0 1 1 0 5 4 9 7 4 1 12 5 3 6 14 39 3 3 6 12 1 1 0 2 0
Total 170 135 120 143 329 79 98 50 33 34 117 41 43 70 154 448 52 54 58 164 59 48 43 150 62
By CSB:
January 2018 Insured Admits to NVMHI
11

CSB Month YTD % Month YTD % Month YTD % Month YTD % Month YTD 100K
Alex 15 98 50.8% 5 47 24.4% 0 2 1.0% 0 46 23.8% 20 193 175.3
Arl 10 104 34.9% 15 115 38.6% 0 4 1.3% 10 75 25.2% 35 298 178.0
Fairfax 26 153 19.9% 84 443 57.6% 2 11 1.4% 30 162 21.1% 142 769 101.5
Loudn 9 56 29.3% 10 60 31.4% 1 5 2.6% 13 70 36.6% 33 191 81.2
PW 33 208 36.3% 33 221 38.6% 4 33 5.8% 16 111 19.4% 86 573 176.7
Total 93 619 30.6% 147 886 43.8% 7 55 2.7% 69 464 22.9% 316 2024 126.9
CSB Month YTD % Month YTD % Month YTD % Month YTD % Month YTD 100K
Alex 0 8 88.9% 0 0 0.0% 0 0 0.0% 0 1 11.1% 0 9 56.7
Arl 0 8 38.1% 1 7 33.3% 0 0 0.0% 1 6 28.6% 2 21 96.8
Fairfax 0 4 26.7% 1 8 53.3% 0 0 0.0% 0 3 20.0% 1 15 10.6
Loudn 3 17 70.8% 0 2 8.3% 0 0 0.0% 0 5 20.8% 3 24 77.3
PW 5 17 56.7% 0 6 20.0% 0 2 6.7% 1 5 16.7% 6 30 68.0
Total 8 54 54.5% 2 23 23.2% 0 2 2.0% 2 20 20.2% 12 99 38.9
CSB Month YTD % Month YTD % Month YTD % Month YTD % Month YTD 100K
Alex 0 4 80.0% 0 0 0.0% 0 0 0.0% 0 1 20.0% 0 5 18.1
Arl 0 4 44.4% 0 1 11.1% 0 0 0.0% 0 4 0.0% 0 9 41.5
Fairfax 2 6 8.7% 0 1 1.4% 0 2 2.9% 9 60 87.0% 11 69 24.6
Loudn 1 4 40.0% 0 0 0.0% 0 1 10.0% 0 5 0.0% 1 10 9.2
PW 1 8 15.7% 3 27 52.9% 0 0 0.0% 1 16 31.4% 5 51 36.2
Total 4 26 18.1% 3 29 20.1% 0 3 2.1% 10 86 59.7% 17 144 24.1
CSB Month YTD % Month YTD % Month YTD % Month YTD % Month YTD 100K
Alex 15 110 53.1% 5 47 22.7% 0 2 1.0% 0 48 23.2% 20 207 134.8
Arl 10 116 35.4% 16 123 37.5% 0 4 1.2% 11 85 25.9% 37 328 143.1
Fairfax 28 163 19.1% 85 452 53.0% 2 13 1.5% 39 225 26.4% 154 853 72.3
Loudn 13 77 34.2% 10 62 27.6% 1 6 2.7% 13 80 35.6% 37 225 59.9
PW 39 233 35.6% 36 254 38.8% 4 35 5.4% 18 132 20.2% 97 654 128.4
Total 105 699 30.8% 152 938 41.4% 7 60 2.6% 81 570 25.1% 345 2267 92.6
% = Committed (or other category) YTD / Total YTD for each CSB
MOT #s supplied by ES
Commitment Hearing Results - January 2018
FY-18
Consumers Ages 18 to 64
Involuntary CMA MOT Dismissed Total
Consumers Ages 65 and Over
Involuntary CMA MOT Dismissed Total
Minors
Involuntary Voluntary MOT Dismissed Total
Total
Committed CMA MOT Dismissed Total
12

FY18, July - January, DBHDS Region 2: Average Commitment Hearings Per Month YOY
199 199 192 192201
211
250262
314323
0
50
100
150
200
250
300
350
FY 09 FY 10 FY 11 FY 12 FY 13 FY 14 FY 15 FY 16 FY 17FY 18 YTD
Average Commitment Hearings Per Month
199 198212
222
277
310
333348
0
50
100
150
200
250
300
350
400
FY 11 FY 12 FY 13 FY 14 FY 15 FY 16 FY 17 FY 18 YTD
Average TDOs Per Month
13

CSB
Month YTD Month YTD Month YTD Month YTD Month YTD Month YTD Month YTD Month YTD Month YTD Month YTD Month YTD 100K
Alex 5 34 2 11 2 59 0 0 0 10 0 1 12 65 0 0 3 10 4 25 28 215 195.3
Arl 3 48 0 0 0 0 0 4 1 1 19 136 14 105 0 0 1 6 4 25 42 325 194.1
Fairfax 31 158 33 185 11 98 2 3 4 33 1 4 36 218 0 0 4 19 5 37 127 755 99.6
Loudoun 3 35 2 7 0 4 0 0 17 106 1 3 8 43 0 0 2 5 6 37 39 240 102.0
PW 16 86 1 1 0 2 11 131 0 1 1 4 36 218 0 0 7 41 14 93 86 577 178.0
Total 58 361 38 204 13 163 13 138 22 151 22 148 106 649 0 0 17 81 33 217 322 2112 86.3
CSB
Month YTD Month YTD Month YTD Month YTD Month YTD Month YTD Month YTD Month YTD Month YTD Month YTD Month YTD 100K
Alex 1 23 2 8 3 38 0 0 0 0 0 0 6 46 0 0 2 9 6 23 20 147 133.5
Arl 1 33 0 0 0 0 0 2 0 0 13 98 7 63 0 0 1 6 3 17 25 219 130.8
Fairfax 22 120 33 164 11 88 2 3 5 22 3 7 34 191 0 0 0 0 0 1 110 596 78.6
Loudoun 0 0 0 0 0 0 0 0 14 81 1 1 0 0 0 0 1 4 3 31 19 117 49.7
PW 10 48 0 0 0 2 8 93 0 0 1 3 21 149 0 0 10 50 16 84 66 429 132.3
Total 34 224 35 172 14 128 10 98 19 103 18 109 68 449 0 0 14 69 28 156 240 1508 61.6
CSB
Month YTD Month YTD Month YTD Month YTD Month YTD Month YTD
Alex 11 62 1 35 0 0 3 28 5 22 20 147
Arl 15 122 3 34 0 0 0 0 7 63 25 219
Fairfax 55 278 21 127 0 0 15 106 19 85 110 596
Loudoun 14 81 5 35 0 0 0 1 0 0 19 117
PW 26 167 19 113 0 0 14 69 7 80 66 429
Total 121 710 49 344 0 0 32 204 38 250 240 1508
Total
Hospital TDOs vs. Commitments / Insurance Status
January 2018 (FY-18)
Adults (Age 18-64)
TDO Hospitals
Total
Commitment/CMA Hospitals
Dominion Fairfax Other
State Insured
Poplar Springs OtherLoudoun
Total
CSU
VHC NVMHI CSU
Insured Uninsured/LIPOS CSU
State
Uninsured
Poplar Springs
NVMHIVHC
LoudounMt. Vernon Prince William
Dominion Fairfax Mt. Vernon Prince William
Insurance Status for Commitment/CMA Consumers
Current Month
14

CSB
Month YTD Month YTD Month YTD Month YTD Month YTD Month YTD Month YTD Month YTD Month YTD Month YTD 100K
Alex 0 2 0 0 0 1 0 0 0 1 0 1 0 3 0 0 0 3 0 11 69.3
Arl 0 1 1 1 0 0 0 0 0 0 0 15 0 1 0 0 0 5 1 23 106.0
Fairfax 0 3 0 5 1 6 0 0 0 1 0 0 2 6 0 0 0 3 3 24 16.9
Loudoun 0 0 0 0 0 0 0 0 1 16 0 0 1 4 0 0 1 4 3 24 77.3
PW 1 2 0 0 0 0 1 5 0 0 0 0 2 7 0 0 2 12 6 26 58.9
Total 1 8 1 6 1 7 1 5 1 18 0 16 5 21 0 0 3 27 13 108 42.4
CSB
Month YTD Month YTD Month YTD Month YTD Month YTD Month YTD Month YTD Month YTD Month YTD Month YTD 100K
Alex 0 1 0 0 0 1 0 0 0 0 0 0 0 3 0 0 0 3 0 8 50.4
Arl 0 0 1 1 0 0 0 0 0 0 0 12 0 1 0 0 0 1 1 15 69.1
Fairfax 0 2 0 5 1 4 0 0 0 0 0 1 0 0 0 0 0 0 1 12 8.5
Loudoun 0 0 0 0 0 0 0 0 1 13 0 0 1 2 0 0 1 4 3 19 61.2
PW 0 1 0 0 0 0 1 5 0 0 0 0 2 6 0 0 2 11 5 23 52.1
Total 0 4 1 6 1 5 1 5 1 13 0 13 3 12 0 0 3 19 10 77 30.3
CSB
Month YTD Month YTD Month YTD Month YTD Month YTD Month YTD
Alex 0 4 0 0 0 0 0 0 0 4 0 8
Arl 1 14 0 0 0 0 0 0 0 1 1 15
Fairfax 1 12 0 0 0 0 0 0 0 0 1 12
Loudoun 2 17 0 0 0 0 0 0 1 2 3 19
PW 2 15 1 1 0 0 0 0 2 7 5 23
Total 6 62 1 1 0 0 0 0 3 14 10 77
Older Adults
TDO Hospitals
Total
Commitment/CMA Hospitals
Total
Insurance Status for Commitment/CMA Consumers
Dominion Fairfax Mt. Vernon
Hospital TDOs vs. Commitments / Insurance Status
January 2018 (FY18)
Loudoun VHC
VHC PiedmontPrince William Loudoun CSU Other
Piedmont CSU Other
Current Month
Dominion Fairfax Mt. Vernon Prince William
Insured Uninsured/LIPOS CSU
State
Uninsured State Insured Total
15

CSB
Month YTD Month YTD Month YTD Month YTD Month YTD Month YTD Month YTD Month YTD 100K
Alex 1 3 0 0 1 5 1 5 0 0 0 1 0 3 3 17 61.7
Arl 0 7 0 0 0 2 0 7 0 0 0 1 0 0 0 17 42.5
Fairfax 8 45 0 0 3 8 3 27 0 0 0 3 4 9 18 92 32.8
Loudoun 3 13 0 0 1 3 1 10 0 0 0 9 1 8 6 43 39.4
PW 1 17 0 1 0 4 3 22 0 0 0 1 1 5 5 50 35.5
Total 13 85 0 1 5 22 8 71 0 0 0 15 6 25 32 219 36.6
CSB
Month YTD Month YTD Month YTD Month YTD Month YTD Month YTD Month YTD Month YTD 100K
Alex 0 1 0 0 0 3 0 0 0 0 0 0 0 0 0 4 14.5
Arl 0 1 0 0 0 2 0 1 0 0 0 1 0 0 0 5 12.5
Fairfax 2 7 0 0 0 0 0 0 0 0 0 0 0 0 2 7 2.5
Loudoun 0 0 0 0 0 0 0 0 0 0 0 2 1 3 1 5 4.6
PW 0 8 0 0 0 5 3 16 0 0 0 1 1 5 4 35 24.8
Total 2 17 0 0 0 10 3 17 0 0 0 4 2 8 7 56 9.4
CSB
Month YTD Month YTD Month YTD Month YTD Month YTD Month YTD
Alex 0 4 0 0 0 0 0 0 0 0 0 4
Arl 0 4 0 0 0 0 0 0 0 1 0 5
Fairfax 2 6 0 0 0 1 0 0 0 0 2 7
Loudoun 1 5 0 0 0 0 0 0 0 0 1 5
PW 1 17 0 0 0 2 0 5 3 11 4 35
Total 4 36 0 0 0 3 0 5 3 12 7 56
Current Month
Snowden North Springs Total
Insured CSU Uninsured
State
Uninsured State Insured
CSU
Insurance Status for Commitment/CMA Consumers
Total
Dominion Other
Dominion Snowden Poplar Springs CSU
CCCAPoplar Springs
North Springs
Commitment/CMA Hospitals
Hospital TDOs vs. Commitments / Insurance Status
January 2018 (FY-18)
Minors
TDO Hospitals
CCCA TotalOther
16

Indicator Current Mo Monthly % YTD YTD % Current Mo Monthly % YTD YTD% Current Mo Monthly % YTD YTD% Current Mo Monthly % YTD YTD% Current Mo Monthly % YTD YTD%
Avg Daily Census 15.0 93.8% 14.7 92.1% 3.5 58.3% 4.5 74.9% 3.2 53.2% 3.7 61.0% 5.0 83.3% 5.1 84.5% 26.7 78.5% 28.0 82.2%
Average Length of Stay 9.3 6.0 6.60 17 6.0
Bed Days 465 3175 0 108 966 99 785 137 1042 809 5968
Referral List (mean clients per day) 0.19 0 0 1.6
Indicator Current Mo Monthly % YTD YTD % Current Mo Monthly % YTD YTD% Current Mo Monthly % YTD YTD% Current Mo Monthly % YTD YTD% Current Mo Monthly % YTD YTD%
Admissions
TDOs 0 0 0 0 0 0 0 0 0 0.0% 0 0.0%
CMA 0 0 0 0 0 0 0 0 0 0.0% 0 0.0%
CMI 0 0 0 0 0 0 0 0 0 0.0% 0 0.0%
Diversion 36 252 7 39 4 29 15 80 62 66.7% 400 69.7%
Step Down 7 44 6 40 9 43 6 28 28 30.1% 155 27.0%
NGRI 3 19 0 0 0 0 0 0 3 3.2% 19 3.3%
Respite 0 0 0 0 0 0 0 0 0 0.0% 0 0.0%
Total = 46 315 0 13 79 13 72 21 108 93 574
Homeless at Admission 12 26.1% 77 24.4% 5 38.5% 33 41.8% 6 46.2% 35 48.6% 2 9.5% 18 16.7% 25 26.9% 163 28.4%
First Admission to Crisis Care 23 50.0% 162 51.4% 9 69.2% 47 59.5% 9 69.2% 45 62.5% 20 95.2% 89 82.4% 61 65.6% 343 59.8%
No Case Manager 14 30.4% 107 34.0% 7 53.8% 45 57.0% 4 30.8% 20 27.8% 13 61.9% 57 52.8% 38 40.9% 229 39.9%
ID Diagnosis 0 0.0% 6 1.9% 1 7.7% 5 6.3% 0 0.0% 1 1.4% 0 0.0% 1 0.9% 1 1.1% 13 2.3%
REACH Involved 0 0.0% 0 0.0% 1 7.7% 5 6.3% 0 0.0% 1 1.4% 0 0.0% 0 0.0% 1 1.1% 6 1.0%
SA Diagnosis 23 50.0% 140 44.4% 6 46.2% 28 35.4% 4 30.8% 8 11.1% 10 47.6% 39 36.1% 43 46.2% 215 37.5%
Detox Services 0 0.0% 0 0.0% 0 0.0% 0 0.0% 0 0.0% 0 0.0% 3 14.3% 3 2.8% 3 3.2% 3 0.5%
Referral Sources (CSB)
Alexandria 3 13 0 0 0 0 2 8 18 11 11.8% 33 5.7%
Arlington 0 2 0 0 0 11 49 2 9 13 14.0% 60 10.5%
Fairfax-Falls Church 41 281 0 0 1 0 10 7 48 48 51.6% 340 59.2%
Loudoun 1 7 0 0 5 0 0 1 1 2 2.2% 13 2.3%
Prince William 1 12 0 12 68 2 11 3 30 18 19.4% 121 21.1%
Other 0 0 0 1 5 0 0 0 2 1 1.1% 7 1.2%
Total = 46 315 0 13 79 13 72 21 108 93 574
Fiscal Status
Uninsured 26 160 0 7 49 8 34 11 39 52 55.9% 282 49.1%
Medicaid 14 106 0 6 29 3 25 2 29 25 26.9% 189 32.9%
Medicaid QMB Only 0 0 0 0 0 0 0 0 1 0 0.0% 1 0.2%
Medicare 3 31 0 0 1 0 4 1 11 4 4.3% 47 8.2%
Private Insurance 3 18 0 0 0 0 5 6 24 9 9.7% 47 8.2%
Self-Pay 0 0 0 0 0 0 0 0 0 0 0.0% 0 0.0%
Kaiser admissions 0 0 0 0 2 4 1 4 3 12.0% 8 4.9%
Unknown 0 0 0 0 0 0 0 0 0 0 0.0% 0 0.0%
Total = 46 315 0 13 79 13 72 21 108 93 574
(16 beds) (6 Beds) (6 Beds) (6 Beds) (34 beds)
DBHDS Region II Crisis Care Utilization Report
January 2017 - FY17
Woodburn Place Brandon House Access
Woodburn Place
(16 beds) (6 Beds)
CAREBrandon House Access
(6 Beds) (6 Beds)CARE Grand Total
Grand Total
(34 beds)
17

Indicator Current Mo Monthly % YTD YTD Current Mo Monthly % YTD YTD% Current Mo Monthly % YTD YTD% Current Mo Monthly % YTD YTD% Current Mo Monthly % YTD YTD%
Discharges
Planned = 30 231 0 7 49 3 28 8 81 48 58.5% 389 69.0%
Private Residence 22 157 0 5 32 2 16 6 52 35 72.9% 257 66.1%
MH Program 0 12 0 0 4 0 1 0 14 0 0.0% 31 8.0%
SA Program 1 6 0 0 3 0 0 0 1 1 2.1% 10 2.6%
Other (ACR, NVMHI, etc.) 4 26 0 1 2 0 5 0 1 5 10.4% 34 8.7%
TDO Hearing 0 0 0 0 1 0 0 0 0 0 0.0% 1 0.3%
Shelter/Hotel 3 30 0 1 7 1 6 2 13 7 14.6% 56 14.4%
Unplanned = 14 84 0 5 28 7 40 8 23 34 41.5% 175 31.0%
Involuntary Hospitalization 1 15 0 2 4 1 5 0 0 4 11.8% 24 13.7%
Voluntary Hospitalization 2 10 0 1 7 1 1 1 2 5 14.7% 20 11.4%
Program-initiated 4 19 0 0 1 0 1 0 1 4 11.8% 22 12.6%
Client-initiated 7 40 0 2 16 5 33 7 20 21 61.8% 109 62.3%
Total Discharges = 44 315 0 12 77 10 68 16 104 82 564
Referral List
Total # of persons on Referral list 6 6 0 0 0 0 0 47 47 53 53
persons admitted from Referral list 4 9 0 0 95 0 7 21 148 25 47.2% 259 20.5%
Denied Admission due to:
No Beds Available 0 5 0 2 97 12 19 5 132 19 253
Medical Complexity 1 3 0 1 3 0 0 0 1 2 7
Sexual Offenses or NGRI 0 0 0 1 2 0 0 0 0 1 2
Homeless with no crisis 0 0 0 0 0 0 0 0 4 0 4
SA dx is primary 0 0 0 1 1 0 0 0 7 1 8
Legal Complexity 0 0 0 0 3 0 0 0 9 0 12
No Psychiatric Crisis 0 6 0 0 2 0 0 0 2 0 10
Other 2 12 0 4 4 0 2 4 9 10 27
Extended Stay
persons staying longer than 15 days 6 43 0 0 12 1 6 0 14 7 75
persons staying longer than 21 days 0 6 0 0 0 0 0 0 1 0 7
persons readmitted within 30 days 0 26 0 1 7 1 4 0 7 2 2.4% 44 7.8%
persons readmitted within 12 months 0 47 0 3 15 1 4 0 17 4 4.9% 83 14.7%
(34 beds)(6 Beds)Woodburn Place Brandon House
(16 beds) (6 Beds) (6 Beds)CAREAccess Grand Total
18

FY18, July - January, DBHDS Region 2:
Crisis Care Monthly Admits and Average Occupancy YOY
42
5866 67 64
6973 76 78
82
0
10
20
30
40
50
60
70
80
90
FY 09 FY 10 FY 11 FY 12 FY 13 FY 14 FY 15 FY 16 FY 17 FY 18YTD
Crisis Stab Average Monthly Admits
87% 88% 89%
76%72%
78% 79.6% 82%
0%
10%
20%
30%
40%
50%
60%
70%
80%
90%
100%
FY 11 FY 12 FY 13 FY 14 FY 15 FY 16 FY 17 FY 18YTD
Crisis Stab Average Occupancy
19

1
1
3
1
4
13
13
32
9
38
11
13
48
2
18
0 20 40 60 80 100 120
Alexandria
Arlington
F-FC
Loudoun
PW
Number of Admissions
CS
B
Admissions for January 2018 - FY18
LIPOS
LIPOS to NVMHI
NVMHI
CSU
20

4
13
10
8
10
13
10
0
0
0
0
0
96
96
99
108
86
85
106
0
0
0
0
0
87
82
79
87
74
70
93
0
0
0
0
0
July
August
Sept
Oct
Nov
Dec
Jan
Feb
March
April
May
June
Number of Admissions
Mo
nth
Admissions by Month - FY18
LIPOS
LIPOS to NVMHI
NVMHI
CSU
21