Northern Territory Supplementary Response to CGC Staff ... · NORTHERN TERRITORY SUPPLEMENTARY...
23
NORTHERN TERRITORY SUPPLEMENTARY RESPONSE TO STAFF DISCUSSION PAPER CGC 2007/09-S ADMINISTRATIVE SCALE March 2008 COMMONWEALTH GRANTS COMMISSION GENERAL REVENUE GRANT RELATIVITIES 2010 REVIEW
Transcript of Northern Territory Supplementary Response to CGC Staff ... · NORTHERN TERRITORY SUPPLEMENTARY...

NORTHERN TERRITORY SUPPLEMENTARY RESPONSE TO STAFF DISCUSSION PAPER CGC 2007/09-S
ADMINISTRATIVE SCALE
March 2008
COMMONWEALTH GRANTS COMMISSION
GENERAL REVENUE GRANT RELATIVITIES
2010 REVIEW

Northern Territory Views on Administrative Scale
2
The following submission supplements the Territory’s previous response to the Issues
Paper 2007/09-S.
Introduction
The current administrative scale assessment recognises differences in the costs of
operating the minimum administrative structures required to provide state services.
During the 2004 Review, the Commission defined minimum administrative structures
as those parts of head offices of State departments which provided corporate services,
policy and planning functions and some whole of State services (such as those
provided by Treasuries and State museums1). These costs are generally known as
fixed costs. As acknowledged by the Commission during the 2004 Review, the
concept of fixed costs is well supported by economic theory2.
The Territory considers the Commission’s current estimate of fixed costs understates
the actual level of fixed costs faced by the Territory. This submission contains fixed
costs estimates for the Territory’s Department of Health and Community Services
(DHCS) and the Department of Education, Employment and Training (DEET), to
provide a reference against which the current estimates can be reality checked.
The Conceptual Case
The Territory considers the conceptual case for an administrative scale assessment
robust and amply supported by economic theory. The Territory acknowledges the
debate surrounding the level of fixed costs and considers an approach which takes the
average fixed costs of the three smallest jurisdictions a pragmatic and broadly policy
neutral measure of fixed costs which accords with what states do.
Fixed Costs Estimates
The Territory undertook a project to quantify the fixed costs of the Territory’s two
largest agencies, DHCS and DEET with a view to comparing them against the
Commission's current fixed costs estimates.
1 CGC Working Papers. Administrative Scale 2 CGC Working Papers, Administrative Scale

Northern Territory Views on Administrative Scale
3
The Territory’s estimate of fixed costs include costs related to corporate support and
executive services, policy and strategy, financial services, and information
communications and technology (ICT) costs associated with head office functions.
The estimates mainly comprise salary expenses and on-costs. Capital and depreciation
expenses were excluded. The results are detailed below.
Department of Health and Community Services
DHCS employs over 4 000 staff and is the largest agency within the Territory
Government. DHCS is responsible for the provision of health and community services
throughout the Territory including: public hospitals in Darwin, Alice Springs,
Katherine, Tennant Creek and Nhulunbuy, which provide comprehensive general
inpatient, outpatient, and emergency services and a range of community, oral and
public health services.
DHCS comprises eight divisions (see Appendix A). Table 1 illustrates total DHCS
expenses by division from 2004-05 to 2006-07. It shows an average increase in
expenses per year of around 5.9 per cent.
Table 2 –DHCS Expenses by Division, $M
Division 2004-05 2005-06 2006-07
Acute Care Services 343.72 375.69 411.92
Community Services 130.00 147.60 161.02
Financial Services 48.70 51.92 50.35
Health Services 108.94 116.41 120.58
Information Services 20.94 22.13 28.34
People and Services 17.76 16.44 16.61
Strategy and Quality 5.38 6.51 6.37
Systems Performance 1.98 1.75 2.14
Total* 677.42 738.46 797.33 *Division expenses may not sum to total expenses due to rounding.
Source: Northern Territory Department of Health and Community Services
Table 2 shows DHCS fixed costs by division from 2004-05 to 2006-07. It shows an
average increase in fixed costs per year of around 5.7 per cent. A more detailed
break-up of fixed costs is provided in Appendix B. By comparison, Table 3 shows the

Northern Territory Views on Administrative Scale
4
fixed costs estimates currently used in the Administrative Scale assessment for health
and welfare services.
Table 2 – DHCS Fixed Costs by Division, $M
Division 2004-05 2005-06 2006-07
Acute Care Services 1.874 3.018 2.726
Community Services 7.646 8.727 9.736
Financial Services 25.408 26.087 26.220
Health Services 4.846 6.276 5.776
Information Services 17.980 18.868 25.232
People and Services 5.088 4.430 4.056
Strategy and Quality 5.344 6.462 6.054
Systems Performance 1.726 1.614 1.997
Total* 69.912 75.484 81.797
*Division expenses may not sum to total expenses due to rounding.
Source: Northern Territory Treasury
Table 3 – 2007 Update Health and Welfare Fixed Costs Estimates, $M
Category 2005-06
Inpatient Services 9.3
Non-inpatient and Community Health Services 2.9
Population and Preventative Health Services 5.4
Family and Child Services 1.9
Aged and Disabled Services 4.9
Homeless and General Welfare 1.0
Total 25.4 Includes Commission’s allowance for Indigenous policy costs
Source: CGC 2007 Update Working Papers
Table 2 shows that financial services and information services comprise the bulk of
DHCS fixed costs. Centralised agency costs account for around 90 per cent of
financial services fixed costs. Centralised agency costs refer to the Department of
Corporate and Information Services (DCIS), a Territory Government agency
responsible for processing payrolls, tax services, accounts payable, etc. In some
jurisdictions these functions occur within each agency however the Territory
centralised these services to achieve efficiencies through economies of scale. DHCS
Northern Territory Views on Administrative Scale
5
records a notional DCIS charge in their accounts which represents the cost of DCIS
services used by DHCS. Information services represent fixed ICT costs.
Tables 2 and 3 indicate that, in 2005-06, there was a difference of around $50 million
between the Commission’s estimate of minimum fixed costs and the actual level of
fixed costs faced by the Territory. As details of the Commission’s current estimates
are unavailable the Territory is unable to provide a more comprehensive comparison.
However, given the magnitude of the difference the Territory considers the level of
fixed costs faced by the Territory has not been fully recognised.
The Territory considers it likely that the Commission’s estimates have diverged from
those above because of changes in the way government services are delivered and
increases in the scope of government services since the 1999 and 2004 Reviews. This
is particularly pertinent for health and community services where advances in
technology have significantly improved the scope, quality and safety of services but
added significantly to fixed costs.
For example, the Territory’s 1999 Review response to the Commission’s
Administrative Scale Data Collection Survey showed health ICT costs to be around
$18 000 in 1994-95 (includes hardware, software and support) which covered four
applications; Medilink (hospital information system), Qantal (pharmacy and inventory
system), ANSOS (nurse rostering), and Détente (pathology services). This compares
to current estimates for health and community services ICT of around $25 million,
which incorporate a significantly broader scope of services (see Appendix C) and
offers interoperability on intra and interstate levels.
The Territory’s estimates also show DHCS fixed costs growing almost as fast as total
DHCS costs (5.7 per cent compared with 5.9 per cent, over the last 3 years). This
supports the conclusion that changes in the way services are being delivered and
increases in the scope of services have increased fixed costs.
Changes in Government Services Delivery – The Impact of Technology
The role of ICT in delivering quality health and community care was recognised by
Australian, State and Territory Governments with the establishment of the National
Electronic Health Records Taskforce in November 1999. Based on the Taskforce
recommendations, Health Ministers agreed in November 2000 to jointly fund two
years research and development to assess the value and feasibility of HealthConnect,
which is an overarching national change management strategy to improve safety and

Northern Territory Views on Administrative Scale
6
quality in health care by establishing and maintaining a range of standardised
electronic health information products and services3.
HealthConnect is one of many government strategic initiatives which involve
significant investment in health related ICT. Other examples include Western
Australia’s rolling 10-year $335 million Information Management Capital Investment
Plan to integrate and upgrade state-wide clinical information systems4, Victoria’s
HealthSMART, which is a $323 million technology program operating across the
public health care sector to establish a solid baseline of systems that will support the
system in meeting current and future demands in Victoria5 and Queensland Health’s
Information Management Strategic Plan 2005-10 which aims to align investment in
information, information systems and information infrastructure with Queensland
Health’s Strategic Plan 2005-20116 and has an operational budget exceeding
$100 million7.
In recognition of the increasing role of ICT in health and community care the
Territory has developed and implemented programs to facilitate an integrated health
and community services information system. The system (see Appendix C) enables
information to be shared across government and non-government providers and across
services (acute care, aged and disability services, mental health, etc.). The Territory
continues to enhance the system and has agreed to Territory-wide implementation of
e-Health projects under a Memorandum of Understanding (MOU) signed between the
Australian Government and the Territory in June 2005 in accordance with the
National Implementation Strategy Version 2.18.
The implementation, maintenance and enhancement of ICT systems such as
HealthConnect are a fixed cost to governments as the marginal cost of an additional
user is negligible. The Territory also considers these costs unavoidable as they are the
result of national initiatives and represent the future of health and community care.
3 http://www.health.gov.au/internet/hconnect/publishing.nsf/Content/home 4 http://www.health.gov.au/internet/hconnect/publishing.nsf/Content/wa-1lp 5 http://www.health.gov.au/internet/hconnect/publishing.nsf/Content/vic-1lp 6 http://www.health.qld.gov.au/publications/corporate/imstratplan05/27956.pdf 7 http://www.fujitsu.com/au/news/pr/archives/2005/20051020-01.html 8 http://www.health.gov.au/internet/hconnect/publishing.nsf/Content/nt-1lp
Northern Territory Views on Administrative Scale
7
The prevalence and cost of these systems has increased significantly since the 1999
and 2004 Reviews and is expected to continue apace as ICT systems across the states
and territories are upgraded and the focus on national interoperability increases. The
need for additional electronic data storage and bandwidth capacity is also expected to
increase over time as the use of images, video and sound increases.
The Territory estimates that the development, maintenance, and enhancement costs of
health ICT systems and their associated infrastructure were around $25 million in
2006-07.
Discussions with DHCS staff also highlighted the impact of technology on policy and
strategy development. Specifically, the increasing availability of health data has
enabled more comprehensive policy and strategy development. The additional
complexity has increased the number of FTE required for policy and strategy
development as well as the necessary level of ability/knowledge.
Changes in the Scope of Health and Community Services
The scope of health and community services in the Territory has increased since the
1999 and 2004 Reviews. Changes include the establishment of:
• the National Health Call Centre Network in the Territory as part of the Better
Health for all Australians COAG initiative;
• three advisory councils to provide strategic advice to the relevant Minister
including the:
o health advisory council;
o family and community services advisory council; and
o disability advisory council;
• the Parenting Hotline;
• clinical reference groups to advise DHCS on quality and clinical safety; and
• a Chief Information Officer position in recognition of the increasing emphasis on
ICT in health and community care9.
9 Similar positions now exist in most jurisdictions reflecting the increasing importance of ICT in delivering quality health and community care services.
Northern Territory Views on Administrative Scale
8
DHCS’s regulatory burden has also increased through the strengthening of existing
legislation such as the Community Welfare Act and the introduction of:
• additional reporting requirements such as the development of new data items,
national minimum data sets and performance indicators in accordance with the
National Health Information Agreement;
• the Health Professionals Licensing Authority;
• the Carer’s Recognition Act; and
• the Volatile Substance Abuse Prevention Act
As detailed above, technological changes and increases in the scope of health and
community services have significantly increased the minimum level of fixed costs
required to deliver health and community services. The Territory considers that these
factors combined with an initial underestimation of health and community services
fixed costs in the 1999 Review, and subsequently the 2004 Review, have resulted in
an administrative scale assessment that does not reflect the actual minimum level of
fixed costs.
The Territory’s fixed costs estimates show the actual level of fixed costs for health
and community services was around $75 million in 2005-06. The Territory therefore
considers an additional allowance of $50 million for health and community services
fixed costs appropriate.
The Department of Education, Employment and Training
DEET employs around 4 000 staff and is responsible for developing students through
preschool, primary school and secondary school, employment and training initiatives,
vocational education and training programs and managing work health programs
throughout the Territory.
DEET expenses are divided into 14 areas. Table 4 illustrates total DEET expenses by
area from 2004-05 to 2006-07. It shows an average increase in expenses per year of
around 5.0 per cent.

Northern Territory Views on Administrative Scale
9
Table 4 –DEET Expenses by Area, $M
Area 2004-05 2005-06 2006-07
Australian Government Programs 5.034 20.288 13.039
Consolidated Revenue 0.773 0.580 4.512
Corporate Services 41.616 40.187 42.661
Education Services 19.540 22.893 25.662
Employment and Training 71.763 73.309 77.018
Executive Services 4.302 5.255 5.385
Infrastructure 40.225 39.897 40.661
Non-Government Schools 71.043 83.928 100.311
NT Worksafe 9.843 4.619 5.233
People and Improvement 4.772 6.199 5.657
People and Learning 7.355 7.488 7.038
Remote School Policy and Service 11.909 16.652 18.091
Schools Division 273.469 292.693 303.539
Support Services 11.041 11.963 11.886
Total 582.360 635.735 670.483 Division expenses may not sum to total expenses due to rounding.
Table 5 shows DEET fixed costs by division for 2006-07. By comparison, Table 6
shows the fixed costs estimates currently used in the Administrative Scale assessment
for schools and vocational education and training services.
Table 5 –DEET Fixed Costs by Area, $M
Area 2006-07
Australian Government Programs 0.000
Consolidated Revenue 0.000
Corporate Services* 22.243
Education Services 3.273
Employment and Training 1.403
Executive Services 2.580
Infrastructure 0.582
Non-Government Schools 0.007
NT Worksafe n/a**
People and Improvement 3.453

Northern Territory Views on Administrative Scale
10
People and Learning 1.217
Remote School Policy and Service 1.665
Schools Division 0.000
Support Services 0.004
Total 36.428 Division expenses may not sum to total expenses due to rounding.
* Corporate expenses include DCIS charges.
** For the purposes of this comparison only fixed costs relating to schools and VET have been included.
Table 6 – 2007 Update Education and Training Fixed Costs Estimates, $M
Category 2005-06
Pre-school Education 0.3
Government Primary School Education 5.3
Non-government Primary School Education 1.3
Government Secondary School Education 4.6
Non-government Secondary School Education 1.4
Vocational Education and Training 6.8
Total 19.7 Includes Commission’s allowance for Indigenous policy costs
Source: CGC 2007 Update Working Papers
Similar to health and community services, the data illustrates a disparity between the
Commission’s estimates and the level of fixed costs actually faced by the Territory.
The Territory considers the impact of technology coupled with increases in service
scope/regulatory burden have caused the Commission’s estimates to diverge from
reality over time.
Impact of Technology on Fixed Education and Training Costs
The role of ICT in the delivery of education, training and employment services has
changed significantly since the 1999 and 2004 Reviews. School administration
systems in the Territory have moved from paper based records to centralised
electronic databases and the introduction of online reporting systems such as the
application used for the Measurers of Academic Progress (MAP) reporting have
increased the need for data storage and interoperability. Other changes include the
increasing prevalence of online and interactive learning applications and the

Northern Territory Views on Administrative Scale
11
introduction of an Indigenous student tracking and support system as part of the
National Indigenous English Literacy and Numeracy Strategy (NIELNS)10.
Overall, DEET has around 24 significant applications which underpin:
• school and student administration;
• teacher and staff management;
• online learning and collaboration;
• other business (including VET and workers compensation); and
• data warehouse and business intelligence systems.
The largest of DEET’s applications is the Student Administration Management
System (SAMS) which is used in all government schools for administration and
reporting functions including enrolment and attendance. DEET estimates that the cost
of the current system (implemented in 2002) was around $4 million with recurrent
costs of around $1.7 million per year. The current SAMS contract expires in 2009.
DEET estimates that the replacement/upgrade cost will be around $10 million.
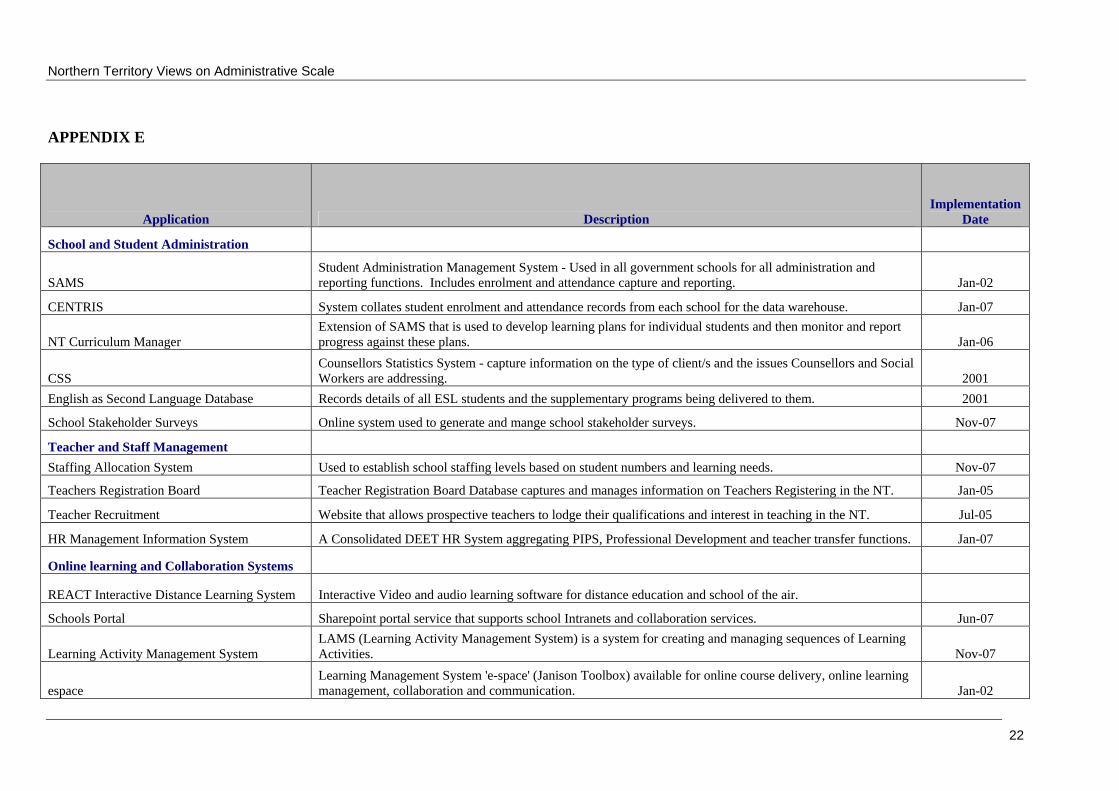
Appendix E details DEET’s ICT applications including SAMS. While specific
applications are likely to vary between jurisdictions the Territory considers it likely
that most states have applications of a similar nature for schools and VET. These
applications represent a fixed cost which has increased as technological advances
have enabled more functionality.
The Territory estimates that the development, maintenance and enhancement costs of
DEET ICT systems and their associated infrastructure were around $6.9 million in
2006-07. These costs are likely to continue to escalate as the use of multimedia tools
utilising video and audio increases and the need to store increasing amounts of
historical data rises.
10 http://www.dest.gov.au/sectors/indigenous_education/policy_issues_reviews/national_indigenous_english_literacy_and_numeracy_strategy.htm
Northern Territory Views on Administrative Scale
12
Regulatory Burden
DEET’s regulatory burden has increased with the introduction of the:
• Higher Education Act; and
• Teacher Registration (Northern Territory) Act
The impetus for the development and implementation of the above Acts stems from
national initiatives, particularly the desire of Australian and state and territory
governments to implement uniform laws and national frameworks across a number of
areas. For example, the Higher Education Act is the result of a Ministerial Council on
Education, Training, Employment and Youth Affairs agreement to implement a
national framework for the future establishment of higher education institutions. The
Territory expects its overall regulatory burden to continue to increase as the push for
nationally consistent policies/frameworks continues.
The Territory’s fixed costs estimates show the actual level of fixed costs for education
and VET services was around $36 million in 2005/06. The Territory therefore
considers an additional allowance of around $17 million for education and VET
services fixed costs appropriate.
Other Service Agencies and Other Jurisdictions
While this submission focuses primarily on health and education services in the
Territory the results are indicative of trends across government services Australia-
wide. An interstate example of the increasing role of technology across government
services is the growth of InTACT in the Australian Capital Territory (ACT).
InTACT was established in 1996 and is a shared ICT service organisation comprising
around 500 staff, which provides a range of ICT and allied services to the ACT
Government. InTACT services include infrastructure, applications support and
development, ICT policy, ICT project services, publishing and records management11.
Since 2001-02, growth in InTACT costs has averaged around 10.2 per cent
per annum, significantly higher than average expenditure or GST revenue growth.
11 http://www.intact.act.gov.au/

Northern Territory Views on Administrative Scale
13
Whole of Government Agencies Fixed Costs
The Commission’s fixed costs estimates include an allowance for central agencies,
such as Treasuries, which perform whole of government functions necessary to
operate a government. In 2005-06, the Commission estimated the minimum level of
fixed costs for these ‘general public services’ functions to be $66.2 million.
Table 7 shows a comparison of general public services fixed costs for the Australian
Capital Territory, Tasmania, and the Northern Territory for 2005-0612. While there are
differences between jurisdictions it clearly shows the current fixed cost estimates
underestimate the actual level of general public services fixed costs faced by all three
jurisdictions by at least around $91 million.
Table 7 – General Public Services Fixed Costs, 2005-06, $000
Department TAS ACT NT
Auditor General 4 524 4 122 2 852
Electoral Commission 1 754 1 050 2 017
Ombudsman 1 676 934 2 110
Premier/Chief Minister 25 3701 38 174 35 151
Legislative Assembly N/a 5 740 20 079
Treasury 49 424 51 853 45 613
Treasury Corporation 4 230 2 496 3 411
Commission Public Employment N/a2 N/a2 8 581
ACT Executive N/a 4 924 N/a
House of Assembly 5 233 N/a N/a
Office of the Governor 2 871 N/a N/a
Legislature General 4 886 N/a N/a
Legislative Council 3 386 N/a N/a
Land Planning and Information 51,903 47,417 32,1573
Shared services for central agencies 1,5004 5,8665 9,2536
Total 156,757 162,576 161,224 Notes to the table: 1. Excludes the ‘Electronic Services for Government Agencies’ output group. 2. Included in the Department of Premier/Chief Minister as an output group. 3. Excludes the Darwin Waterfront Development output group. 4. Assumes 4.53% of total ‘Electronic Services for Government Agencies’ expenses are related to central agencies. 5. Estimate based on the assumption that 7% of total InTACT expenses are related to central agencies. 6. Estimate based on notional DCIS charges for the agencies in Table 7. Source: 2006-07 Budget Papers
12 These estimates have been verified by Tasmania and the Australian Capital Territory.

Northern Territory Views on Administrative Scale
14
Conclusion
The data shows that the estimates currently used in the administrative scale
assessment systemically underestimate the actual level of fixed costs faced by
jurisdictions. The likely causes of the underestimation are an increase in the role of
technology related to national initiatives in delivering government services and
changes in the scope of government services (including regulatory burden) since the
1999 and 2004 Reviews upon which the current fixed costs estimates are predicated.
Estimates in this paper suggest an additional fixed costs allowance of around
$223 million13 is required.
13 $50 million for health and community services, $17 million for education and VET services, $91 million for general public services and $66 million for other services. Other services estimates are based on education and VET estimates (84.91 per cent increase) as the Territory considers the size of the influence of ICT on health and community services fixed costs atypical. Estimates may not sum to total due to rounding.

Northern Territory Views on Administrative Scale
15
APPENDIX A

Northern Territory Views on Administrative Scale
16
APPENDIX B
DHCS Fixed Costs by Branch, $M
Division Branch 2004-05 2005-06 2006-07
Acute Care Services Executive 0.503 0.695 0.746
Policy and Services Development 1.370 2.322 1.980
Community Services Aged and Disability - Executive 0.708 0.559 0.792
Aged and Disability - Policy 0.311 0.469 0.863
Alcohol and Other Drugs - Policy Planning & Development 1.999 1.717 1.554
Executive Support and Community Services Policy 2.121 1.760 1.695
Family and Children’s Services - Policy & Service Development 1.389 2.892 3.517
Mental Health Program Management 1.118 1.329 1.314
Financial Services Accounting and Standards 0.482 0.493 0.383
Budget Management 0.552 0.931 0.589
Centralised Agency Costs 23.204 23.644 23.743
Executive 0.512 0.469 0.988
NGO Support Group 0.659 0.549 0.516
Health Services Community Health Directorate N/a 0.560 0.589
Health Development/Oral Health Executive 0.673 1.046 1.092
Women’s Health Strategy Unit 0.279 0.347 0.121
Executive 1.098 1.252 1.413
Policy 0.814 0.788 0.589
Remote Health Directorate 1.981 2.283 1.973
Information Services Acute Care Information Systems 2.886 2.733 4.146
Chief Information Officer 0.955 0.846 0.656
Community Services Information Systems 2.358 2.925 1.595
Corporate Records Management 1.494 1.473 1.792
Data Warehouse 0.511 0.550 0.712
Health Connect 1.607 2.711 5.005
Health Services Information Systems 1.276 1.222 1.938

Northern Territory Views on Administrative Scale
17
Information Services Infrastructure 6.893 6.408 9.387
People and Services Corporate Support and Office Accommodation 3.112 2.496 2.269
Health Professional Licensing Administration 1.176 1.183 1.103
People and Organisational Learning Directorate 0.496 0.441 0.380
People and Organisational Learning Executive 0.304 0.310 0.304
Strategy & Quality Government Relations and Strategic Policy 0.018 0.918 0.605
Health Gains Planning 1.346 1.274 1.119
Chief Executive Officer 1.084 0.979 1.037
Planning and Coordination 2.218 2.481 2.486
Principal Medical Advisor 0.309 0.394 0.399
Quality Improvement 0.369 0.416 0.408
System Performance and Aboriginal Policy Aboriginal Health Policy 1.029 1.055 1.132
Corporate Reporting 0.096 0.237 0.622
Performance Review and Audit 0.601 0.323 0.243
Total 69.912 75.484 81.797
Division and branch expenses may not sum to total expenses due to rounding.

Northern Territory Views on Administrative Scale
18
APPENDIX C

Northern Territory Views on Administrative Scale
19
DHCS Information Services comprise eight branches including:
• acute care information;
• chief information officer;
• community services information;
• corporate records management;
• data warehouse;
• health connect;
• health services information; and
• information technology and communication.
Acute Care Information
The acute care information branch is located at Royal Darwin Hospital. The branch is
responsible for the maintenance, support and enhancement of multiple systems
including CareSys, Clinical Workstation, Labtrak, Ascribe, Qantel, Onestaff, Patient
Travel System, Lanier, Sterilised Instrument Tracking System, Medchart
ePrescribing, HealthConnect SEHR Service and P2P Service. The branch consists of
21 FTE staff and is responsible for national reporting for acute care statistics.
Community Services Information
The community services information branch is primarily responsible for the
maintenance, support and enhancement of the Community Care Info System (CCIS)
and the Pensioner Concessions System (PCS). The branch is located at Health House
and consists of 13 FTE staff. CCIS covers family and child services, alcohol and
drugs services, mental health, aged and disabled services, urban community health,
disease control and palliative care. The branch is responsible for national reporting for
community services.
Corporate Records Management
The corporate records branch consists of 20 FTE staff and is responsible for TRIM (a
records and information management system), DHCS archives, and mail and registry
services. The branch comprises 20 FTE staff.

Northern Territory Views on Administrative Scale
20
Data Warehouse
The data warehouse branch comprises nine FTE staff and is responsible for the
administration, maintenance and support of the data warehouse. The data warehouse
is the central data repository for all DHCS systems.
HealthConnect
HealthConnect is an overarching national change management strategy to improve
safety and quality in health care by establishing and maintaining a range of
standardised electronic health information products and services14.
The strategy is a partnership between the Australian, state and territory Governments
and is managed under the national e-health governance arrangements established by
the Australian Health Ministers’ Advisory Council. It will facilitate the adoption of
common standards by all e-health systems so that vital health information can be
securely exchanged between health care providers such as doctors, specialists,
pharmacists, hospitals and so on15. The Australian Government is investing $128
million over four years towards the implementation of HealthConnect16.
Health Services Information
The health services information branch comprises 12 FTE staff and is primarily
responsible for the maintenance, support and enhancement of the Primary Care
Information System (PCIS). PCIS is the Territory’s main clinical health system,
covering remote primary health care services and chronic disease management. PCIS
contains electronic health records and patient histories and is a point of care system.
ICT Infrastructure
The ICT infrastructure branch covers expenses related to maintaining and running the
DHCS server farms, data storage networks, IT hardware for the information division
and the data communications network. The branch also includes the cost of the
corporate Microsoft licence.
14 http://www.health.gov.au/internet/hconnect/publishing.nsf/Content/home 15 http://www.health.gov.au/internet/hconnect/publishing.nsf/Content/intro 16 http://www.health.gov.au/internet/hconnect/publishing.nsf/Content/national-1lp

Northern Territory Views on Administrative Scale
21
APPENDIX D
Northern Territory Views on Administrative Scale
22
APPENDIX E
Application Description Implementation
Date
School and Student Administration
SAMS Student Administration Management System - Used in all government schools for all administration and reporting functions. Includes enrolment and attendance capture and reporting. Jan-02
CENTRIS System collates student enrolment and attendance records from each school for the data warehouse. Jan-07
NT Curriculum Manager Extension of SAMS that is used to develop learning plans for individual students and then monitor and report progress against these plans. Jan-06
CSS Counsellors Statistics System - capture information on the type of client/s and the issues Counsellors and Social Workers are addressing. 2001
English as Second Language Database Records details of all ESL students and the supplementary programs being delivered to them. 2001
School Stakeholder Surveys Online system used to generate and mange school stakeholder surveys. Nov-07
Teacher and Staff Management Staffing Allocation System Used to establish school staffing levels based on student numbers and learning needs. Nov-07
Teachers Registration Board Teacher Registration Board Database captures and manages information on Teachers Registering in the NT. Jan-05
Teacher Recruitment Website that allows prospective teachers to lodge their qualifications and interest in teaching in the NT. Jul-05
HR Management Information System A Consolidated DEET HR System aggregating PIPS, Professional Development and teacher transfer functions. Jan-07
Online learning and Collaboration Systems
REACT Interactive Distance Learning System Interactive Video and audio learning software for distance education and school of the air.
Schools Portal Sharepoint portal service that supports school Intranets and collaboration services. Jun-07
Learning Activity Management System LAMS (Learning Activity Management System) is a system for creating and managing sequences of Learning Activities. Nov-07
espace Learning Management System 'e-space' (Janison Toolbox) available for online course delivery, online learning management, collaboration and communication. Jan-02

Northern Territory Views on Administrative Scale
23
Explore NT Explore NT is a digital library of electronic resources that directly relate to the NT Curriculum Framework (NTCF).Teachers can search or browse and download stored resources. Jan-02
Other Business Systems
NT Schools ePASS Used to create and maintain network, email, internet and system access accounts for teachers, staff and students. Mar-07
WHIS Captures workers compensation claims and payments, work safety investigations and dangerous goods licences. 1996
DELTA Used to capture and report on contract issues for Apprenticeships and Traineeships. Jan-03
NT Apprenticeships and Traineeships DB Online inquiry system on all approved apprenticeship/traineeship qualifications in the Northern Territory. n/a
VETiS (VET in Schools) A reporting system for coordinators and administrators to record details of student participations. n/a
Data Warehouse and Business Intelligence Systems
Data Warehouse Hardware and software infrastructure to support corporate and schools performance reporting. Jan-07 MAPRET Map reporting and evaluation tool, an online reporting system to access and interpret MAP data. Jul-06 Enrolment and Attendance on line return (Infopak 2004) Online system for Non-Gov schools to submit their periodic enrolment and attendance collections. 2004
ETDB Employment and Training Database - Captures Information on Registered Training Organisations Contracts and Payments n/a
Indigenous Student Post NTCE Tracking Track and report on indigenous students that have completed their NTCE from 2005 onwards. Sep-07
N/a – Not available