Northern grains research results 2016 - Department of Primary … · 6 | NORTHERN GRAINS RESEARCH...
221
www.dpi.nsw.gov.au Northern grains research results 2016 RESEARCH & DEVELOPMENT – INDEPENDENT RESEARCH FOR INDUSTRY Editors: Steven Simpfendorfer & Loretta Serafin
Transcript of Northern grains research results 2016 - Department of Primary … · 6 | NORTHERN GRAINS RESEARCH...

www.dpi.nsw.gov.au
Northern grains research results 2016RESEARCH & DEVELOPMENT – INDEPENDENT RESEARCH FOR INDUSTRY
Editors: Steven Simpfendorfer & Loretta Serafin
2 | NORTHERN GRAINS RESEARCH RESULTS 2016
© State of New South Wales through NSW Department of Industry, Skills and Regional Development 2016.
You may copy, distribute, display, download and otherwise freely deal with this publication for any purpose, provided that you attribute the Department of Trade and Investment, Regional Infrastructure and Services as the owner. However, you must obtain permission if you wish to charge others for access to the publication (other than at cost); include the publication in advertising or a product for sale; modify the publication; or republish the publication on a website. You may freely link to the publication on a departmental website.
ISSN 1839‑1192
Published by the NSW Department of Primary Industries, a part of NSW Department of Industry, Skills and Regional Development.
Disclaimer
The information contained in this publication is based on knowledge and understanding at the time of writing (July 2016). However, because of advances in knowledge, users are reminded of the need to ensure that the information upon which they rely is up to date and to check the currency of the information with the appropriate officer of NSW Department of Industry, Skills and Regional Development or the user’s independent adviser.
The product trade names in this publication are supplied on the understanding that no preference between equivalent products is intended and that the inclusion of a product name does not imply endorsement by the department over any equivalent product from another manufacturer.
Recognising that some of the information in this document is provided by third parties, the State of New South Wales, the author and the publisher take no responsibility for the accuracy, currency, reliability and correctness of any information included in the document provided by third parties.
Always read the label
Users of agricultural chemical products must always read the label and any permit before using the product, and strictly comply with the directions on the label and the conditions of any permit. Users are not absolved from any compliance with the directions on the label or the conditions of the permit by reason of any statement made or omitted to be made in this publication.
Editing and compilation
This report has been compiled by Steven Simpfendorfer and Loretta Serafin, NSW DPI, Tamworth, on behalf of the authors.
Front cover photos: main–Loretta Serafin, inset left and centre–NSW DPI, inset right–Loretta Serafin Rear cover photo: Steven Simpfendorfer

INDEPENDENT RESEARCH FOR INDUSTRY | 3
Foreword
NSW Department of Primary Industries (NSW DPI) is a major source of applied Research & Development (R&D); especially in collaboration with our major funding partner the GRDC; for cropping systems in the northern grains region, in particular in central and northern NSW. The NSW DPI R&D teams based across the region; at Trangie, Tamworth, Narrabri and Grafton conduct a range of on-farm research trials across plant breeding, agronomy, physiology, nutrition and crop protection.
This is the seventh edition of the Northern Grains Region Trials Book and it has grown significantly since the first edition. The 2016 volume includes 60 papers reporting on trials from across the northern grains region from Dubbo into Southern Queensland. These short papers have been written to improve the awareness and accessibility of the results from NSW DPI run research trials in the region. The papers are based on scientifically sound, independent research but need to be taken in the context of the situation and season that the work has been conducted. In many cases the research that is reported will prompt more questions and we encourage you to contact the authors to discuss any of these queries.
The work that is reported is only possible through the co-operation of the many growers, advisors and consultants who our research teams work with throughout the year and these contributions are acknowledged within each paper. We also collaborate with other research organisations including grower groups such as Grains Orana Alliance and Northern Grower Alliance, agribusinesses, universities, seed companies and other state based research providers.
Finally, we would like to thank the authors and editorial team for all their work compiling and reviewing the diverse range of papers in this year’s edition.
We hope that you find the papers informative and of value to your business and we would welcome any feedback that you might have that would help us to continue to make the Northern Grains Research Results book a valuable resource into the future.
Loretta Serafin,
On behalf of the Northern Cropping Systems Research & Development Team
NSW Department of Primary Industries

4 | NORTHERN GRAINS RESEARCH RESULTS 2016
ContentsAgronomy7 Investigating irrigation management in sorghum – Breeza 2015
Jon Baird and Loretta Serafin
14 Managing dryland wheat for maximum yield potential – Tamarang 2014Rick Graham, Guy McMullen, Steven Simpfendorfer and Bruce Haigh
18 Durum wheat variety response to nitrogen management and sowing time – Tamarang 2015Rick Graham, Stephen Morphett, Jim Perfrement, Michael Dal Santo and Neroli Graham
22 Durum wheat variety response to nitrogen management and time of sowing – Tulloona 2015Rick Graham, Stephen Morphett, Jim Perfrement, Michael Dal Santo and Neroli Graham
26 Influence of seed size on the yield of the faba bean variety PBA NasmaA – Breeza 2015Bill Manning, Stuart Marshman, Joop van Leur and Merv Riley
28 Sorghum in the western zone: row configuration x population x hybrid – “Kelvin”, Gurley 2014–15Loretta Serafin, Mark Hellyer, Peter Perfrement and Guy McMullen
33 Sorghum in the western zone: row configuration × population × hybrid – “Koiwon”, Bellata 2014–15Loretta Serafin, Mark Hellyer, Peter Perfrement and Guy McMullen
38 Sorghum row direction × configuration × hybrid – Spring Ridge 2014–15Loretta Serafin, Mark Hellyer and Peter Perfrement
41 Sorghum row direction × configuration × hybrid – Terry Hie Hie 2014–15Loretta Serafin, Mark Hellyer and Peter Perfrement
44 Sunflower contribution of leaves to grain yield and quality – Pine Ridge 2014–15Loretta Serafin, Mark Hellyer and Peter Perfrement
47 Maize row configuration × population × hybrid – Spring Ridge 2014–15Loretta Serafin, Mark Hellyer and Peter Perfrement
50 Sunflower row configuration × population × hybrid – Pine Ridge 2014–15Loretta Serafin, Mark Hellyer and Peter Perfrement
54 Northern NSW pulse agronomy project – faba bean density experiments 2015Andrew Verrell and Leigh Jenkins
56 PBA NasmaA faba bean – effect of seed size at sowing on grain yieldAndrew Verrell and Leigh Jenkins
59 Integrated management of crown rot in a chickpea – wheat sequenceAndrew Verrell
Crop Protection63 Evaluation of a DNA tool to determine risk of chickpea Phytophthora root rot
Sean Bithell, Kevin Moore, Kristy Hobson, Steve Harden, Willy Martin and Alan McKay
66 Comparing tank mixes of post-emergence herbicides on awnless barnyard grass (NSW pot experiment 2015)Tony Cook, Bill Davidson and Rebecca Miller
70 Comparing tank mixes of post-emergence herbicides on feathertop Rhodes grass (NSW pot experiment 2015)Tony Cook, Bill Davidson and Rebecca Miller
74 Comparing double knock herbicides treatments on the control of awnless barnyard grass (NSW pot experiment 2015)Tony Cook, Bill Davidson and Rebecca Miller

INDEPENDENT RESEARCH FOR INDUSTRY | 5
78 Comparing double knock treatments of herbicides on feathertop Rhodes grass (NSW pot experiment 2015)Tony Cook, Bill Davidson and Rebecca Miller
82 Comparing tank mixes of herbicides for post-emergence control of flaxleaf fleabane (NSW pot experiment 2015)Tony Cook, Bill Davidson and Rebecca Miller
85 Comparing tank mixes of herbicides for post-emergence control of common sowthistle (NSW pot experiment 2015)Tony Cook, Bill Davidson and Rebecca Miller
88 Comparing double knock and individual herbicide treatments on common sowthistle (NSW pot experiment 2015)Tony Cook, Bill Davidson and Rebecca Miller
92 Comparing double knock and individual herbicide treatments on flaxleaf fleabane (NSW pot experiment 2015)Tony Cook, Bill Davidson and Rebecca Miller
96 Rust management strategies for modern faba bean varieties Bill Manning, Joop van Leur, Merv Riley and Stuart Marshman
99 Chickpea Phytophthora root rot – 2015 varietal rankings and yield lossesKevin Moore, Lisa Kelly, Kristy Hobson, Steve Harden, Willy Martin, Kris King, Gail Chiplin and Sean Bithell
101 Effect of chickpea Ascochyta blight on the yield of current varieties and advanced breeding lines – Tamworth 2015Kevin Moore, Kristy Hobson, Steve Harden, Paul Nash, Gail Chiplin and Sean Bithell
105 Yield impact of crown rot and sowing time on winter cereal crop and variety selection – Tulloona 2015Steven Simpfendorfer, Rick Graham and Neroli Graham
110 Impact of wheat variety choice on the build up of Pratylenchus thornei and Pratylenchus neglectus – Wongarbon 2014Steven Simpfendorfer
113 Impact of wheat variety choice on the build up of Pratylenchus thornei – Coolah 2014Steven Simpfendorfer
115 Varietal impact on final soil populations of Pratylenchus thornei – Wongarbon 2015Steven Simpfendorfer
118 Varietal impact on final soil populations of Pratylenchus thornei – Macalister, Qld 2015Steven Simpfendorfer
121 Evaluation of the seed treatment Rancona® Dimension as a standalone option for managing crown rot in wheat – 2015Steven Simpfendorfer
125 Impact of common root rot and crown rot on wheat yield – Tamworth 2015Steven Simpfendorfer
127 Response of barley, durum and bread wheat varieties to crown rot across two sowing times – Tamworth 2014Steven Simpfendorfer
132 Regional crown rot management – Macalister Qld 2015Steven Simpfendorfer and Robyn Shapland
136 Regional crown rot management – Mungindi 2015Steven Simpfendorfer and Robyn Shapland
140 Regional crown rot management – Westmar, Qld 2015Steven Simpfendorfer and Robyn Shapland

6 | NORTHERN GRAINS RESEARCH RESULTS 2016
144 Regional crown rot management – Trangie 2015Steven Simpfendorfer, Greg Brooke and Robyn Shapland
148 Regional crown rot management – Nyngan 2015Steven Simpfendorfer, Greg Brooke and Robyn Shapland
152 Regional crown rot management – Garah 2015Steven Simpfendorfer and Robyn Shapland
156 Regional crown rot management – Coonamble 2015Steven Simpfendorfer and Robyn Shapland
159 Regional crown rot management – Mullaley 2015Steven Simpfendorfer and Robyn Shapland
163 Regional crown rot management – Merriwa 2015Steven Simpfendorfer and Robyn Shapland
166 Regional crown rot management – Wongarbon 2015Steven Simpfendorfer and Robyn Shapland
170 Regional crown rot management – Gilgandra 2015Steven Simpfendorfer and Robyn Shapland
173 Regional crown rot management – North Star 2015Steven Simpfendorfer and Robyn Shapland
Nutrition & Soils177 Nitrogen response of eight wheat varieties – Gilgandra 2015
Greg Brooke
180 Nitrogen response of eight wheat varieties and two sowing times – Trangie 2015Greg Brooke and Tracie Bird-Gardiner
183 Nitrogen response of eight wheat varieties – Nyngan 2015Greg Brooke and Tracie Bird-Gardiner
186 Nitrogen response of eight wheat varieties – Coolah 2015Greg Brooke, Peter Matthews and Tracie Bird-Gardiner
189 Nitrogen response of eight wheat varieties – Merriwa 2015Greg Brooke, Peter Matthews and Tracie Bird-Gardiner
192 Agronomic response of sorghum hybrids to nitrogen management – Tamworth 2014–15Rick Graham and Peter Formann
195 Agronomic response of sorghum varieties to nitrogen management – Terry Hie Hie 2014–15Rick Graham and Peter Formann
198 Strategies to reduce nitrous oxide emissions from nitrogen fertiliser applied to dryland sorghum. 1. Effects on crop production and gross marginsGraeme Schwenke and Bruce Haigh
204 Strategies to reduce nitrous oxide emissions from nitrogen fertiliser applied to dryland sorghum. 2. Nitrous oxide emissionsGraeme Schwenke and Bruce Haigh
208 Strategies to reduce nitrous oxide emissions from nitrogen fertiliser applied to dryland sorghum. 3. Residual impact of N applied in 2013−14 on sorghum grown in 2014−15Graeme Schwenke and Bruce Haigh
211 Strategies to reduce nitrous oxide emissions from nitrogen fertiliser applied to dryland sorghum. 4. Using 15N to discover the fate of N fertiliserGraeme Schwenke and Bruce Haigh
217 Maize nitrogen application rate × hybrid under irrigation – Breeza 2014–15Loretta Serafin, Mark Hellyer and Peter Perfrement
220 Northern NSW pulse agronomy project – nutrition in chickpea 2015Andrew Verrell and Leigh Jenkins

AG
RO
NO
MY
INDEPENDENT RESEARCH FOR INDUSTRY | 7
Investigating irrigation management in sorghum – Breeza 2015Jon Baird1 and Loretta Serafin2
1 NSW DPI, Narrabri 2 NSW DPI, Tamworth
Key findingsHybrid choice and plant population had a significant impact on the yield of sorghum with irrigation. MR Buster yielded significantly higher than the other hybrids evaluated, while the higher population rates of 100,000 and 150,000 plants/ha yielded higher compared with the lower planting rates.
The development and yield potential of the late season heads was compromised, and therefore the later developing sorghum did not take full advantage of the greater soil moisture of the intensive irrigation rate.
IntroductionThe time and expense associated with irrigation can become a major financial burden for farmers. By investigating irrigation management, growers can become aware of the effects and the factors associated with developing a sustainable irrigation management strategy.
A varied rate irrigation trial was established at the Breeza Research Station to improve knowledge around the ability of sorghum to efficiently use applied irrigation water. By evaluating various irrigation treatments the aim was to improve the irrigation management of a sorghum crop, leading to better water use efficiency (WUE) and productivity (yield).
Site detailsLocation: GunnedahCo-operator: NSW DPI Breeza Research StationSowing Date: 19 January 2015Planter set up: Monosem precision planter on 1 m row spacingHarvest date: 9 June 2015
TreatmentsHybrids MR 43
85G33 MR Buster MR Scorpio
Population 50,000 plants/ha 75,000 plants/ha 100,000 plants/ha 150,000 plants/ha
Irrigation I-2 – full irrigation strategy, refill set at a 50 mm soil water deficit I-1 – two in-crop waters: at 7-leaf stage and at head emergence I-0 – rain fed
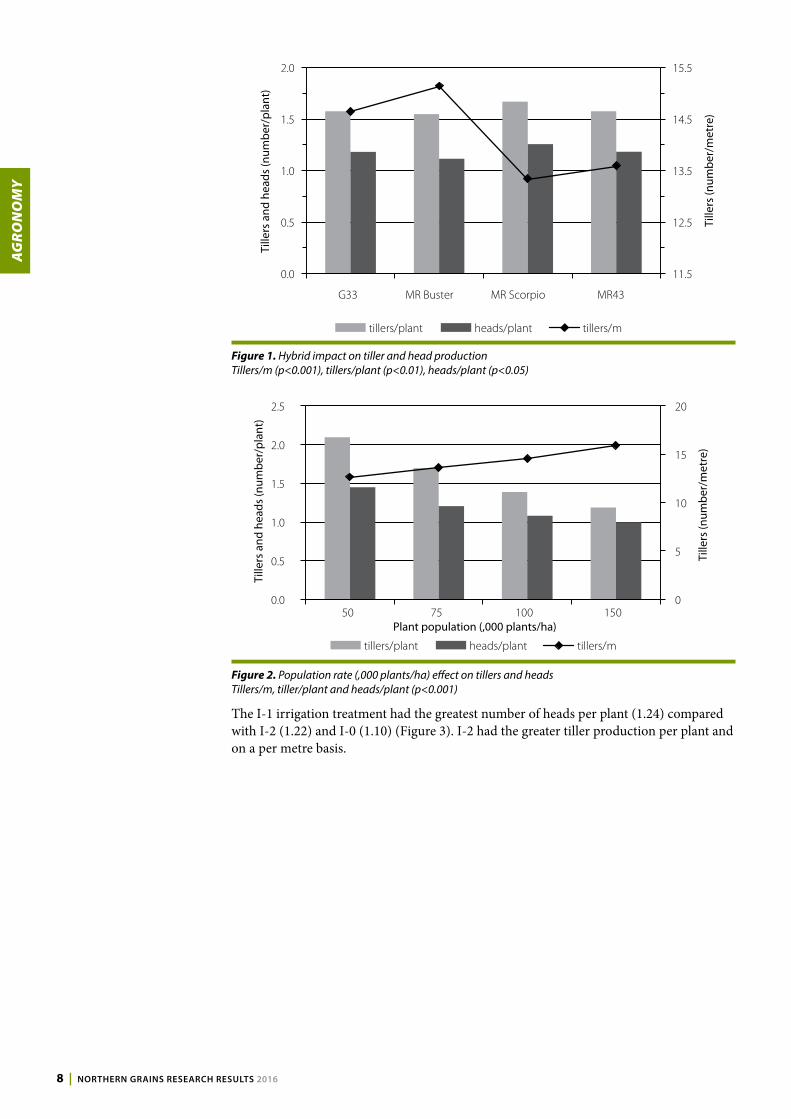
ResultsTiller and head productionHybrid choice had a limited effect on tiller and head production (Figure 1). MR Scorpio produced slightly more tillers and heads per plant than the other hybrids, but this can be explained by the lower plant establishment of this hybrid, as it still resulted in the lowest tillers on a per metre of row basis compared with the other three hybrids in the experiment.
AG
RO
NO
MY
8 | NORTHERN GRAINS RESEARCH RESULTS 2016
11.5
12.5
13.5
14.5
15.5
0.0
0.5
1.0
1.5
2.0
G33 MR Buster MR Scorpio MR43
Tille
rs (n
umbe
r/m
etre
)
Tille
rs a
nd h
eads
(num
ber/
plan
t)
tillers/plant heads/plant tillers/m
Figure 1. Hybrid impact on tiller and head production Tillers/m (p<0.001), tillers/plant (p<0.01), heads/plant (p<0.05)
0
5
10
15
20
0.0
0.5
1.0
1.5
2.0
2.5
50 75 100 150
Tille
rs (n
umbe
r/m
etre
)
Tille
rs a
nd h
eads
(num
ber/
plan
t)
tillers/plant heads/plant tillers/m
Plant population (,000 plants/ha)
Figure 2. Population rate (,000 plants/ha) effect on tillers and heads Tillers/m, tiller/plant and heads/plant (p<0.001)
The I-1 irrigation treatment had the greatest number of heads per plant (1.24) compared with I-2 (1.22) and I-0 (1.10) (Figure 3). I-2 had the greater tiller production per plant and on a per metre basis.

AG
RO
NO
MY
INDEPENDENT RESEARCH FOR INDUSTRY | 9
13.7
13.8
13.9
14.0
14.1
14.2
14.3
14.4
14.5
14.6
0.0
0.2
0.4
0.6
0.8
1.0
1.2
1.4
1.6
1.8
I-0 I-1 I-2
Tille
rs (n
umbe
r/m
etre
)
Tille
rs a
nd h
eads
(num
ber/
plan
t)
tillers/plant heads/plant tillers/m
Irrigation treatment
Figure 3. Irrigation impact on tiller and head production Heads/plant (p<0.05), tillers/m and tiller/plant NS
Water use efficiencyA neutron moisture meter (NMM) was used to monitor the experimental crop water use. One hybrid (MR Scorpio) at two populations (100,000 and 150,000 plants/ha) across the three irrigation treatments (I-0: rain fed, I-1: two in-crop water and I-2: full irrigation – set at a refill point of 50 mm soil water deficit) were monitored for comparison.
All treatments received a pre-water to ensure a full soil moisture profile at planting. The I-1 irrigation treatment received two irrigations with the timing set at plant growth stages 7-leaf (19 Feb 2015) and head emergence (19 Mar 2015), with a total of 133 mm of water applied. The I-2 treatment had four in-crop irrigations applied at the 7-leaf stage (19 Feb 2015), booting stage (3 Mar 2015), head emergence (19 Mar 2015) and at grain fill (31 Mar 2015). The I-2 treatment had 203 mm of water applied in total with an average of 51 mm applied per irrigation. Effective in-crop rainfall during the trial was 152 mm.
The water use efficiency was evaluated by calculating the irrigation water use index (IWUI = yield/applied water) and gross production water use index (GPWUI= yield/ total available water) (Figure 4). IWUI is an important tool for evaluating the benefits of applying irrigation water to the crop. The I-1 irrigation treatment IWUI averaged over 20 kg/mm/ha greater than the I-2 treatment (55.18 kg/mm/ha and 31.72, respectively).
The GPWUI is the crop’s ability to produce grain from all moisture available during the growing season (starting moisture, plus applied water, plus effective rainfall, minus ending soil moisture). The I-0 irrigation treatment averaged a GPWUI of 20.55 kg/mm/ha compared with 18.40 kg/mm/ha for the I-1 treatment and 14.09 kg/mm/ha for the I-2 treatment (Figure 4). Statistical analysis proved that the I-0 and I-1 irrigation treatments had significantly greater GPWUI than the I-2 treatment (p≤0.05). Treatments with the lower amounts of applied irrigation water had an advantage when calculating GPWUI in this trial.
The IWUI and GPWUI calculations highlighted a trend that the higher plant population improved sorghum’s WUE with the target population of 150,000 plants/ha having a greater WUE than the 100,000 plants/ha population (Figure 4). The trend could be explained by the theory that the higher population rates were able to take better advantage of the high levels of plant-available water present throughout the experiment.

AG
RO
NO
MY
10 | NORTHERN GRAINS RESEARCH RESULTS 2016
0
10
20
30
40
50
60
100,000pl/ha
150,000pl/ha
100,000pl/ha
150,000pl/ha
100,000pl/ha
150,000pl/ha
I-0 I-1 I-2
kg/m
m/h
a
IWUI GPWUI
Figure 4. Experiment IWUI (yield/applied mm) and GPWUI (yield/total in-crop mm)
Plant growth characteristicsPlant growth measurements were taken to understand the experimental treatment effects on sorghum plant growth. Hybrid selection and irrigation treatment both had significant effects on plant height (Figure 5). MR Scorpio and MR 43 had an average plant height of over 113 cm, significantly higher than MR Buster (109 cm) and G33 (107 cm). Plant population had no significant effect on plant height.
Plant height can be an indicator of a crop’s level of moisture stress with irrigation having the largest effect on plant height. The I-0 treatment resulted in a height of 103 cm, while the I-1 and I-2 treatments averaged 115 cm and 119 cm, respectively (Figure 5).
In contrast, the irrigation treatments had no effect on head length, while hybrid selection and planting rates did have significant effects (Figure 5). Interestingly, MR Buster resulted in the smallest head size but, as detailed below, it significantly out yielded the other hybrids. Unlike plant height, the planting rate did have an impact on head length with the lower population (50,000 plants/ha = 30.8 cm head length) producing longer heads than the higher planting population of 150,000 plants/ha (28.96 cm).
0
20
40
60
80
100
120
140
G33
MR
Bust
er
MR
Scor
pio
MR4
3 50 75 100
150 I-0 I-1 I-2
Hybrid Population (,000 pl/ha) Irrigation
Hei
ght/
leng
th (c
m)
Head length Plant height
c ba a
b d c a
ns ns ns ns
a ab bc c
b
a a
ns ns ns
Figure 5. Treatment effects on sorghum height and head length Plant height–Hybrid: LSD>1.87 (p≤0.05), Irrigation: LSD>8.7 (p≤0.05), Population NSD Head length–Hybrid: LSD>0.79 (p≤0.05), Population: LSD>0.99 (p≤0.05), Irrigation NSD

AG
RO
NO
MY
INDEPENDENT RESEARCH FOR INDUSTRY | 11
Grain yieldThe yield of the border trial plots were compromised by bird feeding and moderate levels of midge activity. The delayed planting date resulted in later than optimum timing for head development especially with the I-2 irrigation treatment, and was considered a constraint to potential yield. The low yield of I-2 treatments compared with I-1 and in some cases to I-0 highlights this constraint (Figure 6).
0
1
2
3
4
5
6
7
8
G33
MR
Bust
erM
R Sc
orpi
oM
R43
G33
MR
Bust
erM
R Sc
orpi
oM
R43
G33
MR
Bust
erM
R Sc
orpi
oM
R43
G33
MR
Bust
erM
R Sc
orpi
oM
R43
G33
MR
Bust
erM
R Sc
orpi
oM
R43
G33
MR
Bust
erM
R Sc
orpi
oM
R43
G33
MR
Bust
erM
R Sc
orpi
oM
R43
G33
MR
Bust
erM
R Sc
orpi
oM
R43
G33
MR
Bust
erM
R Sc
orpi
oM
R43
G33
MR
Bust
erM
R Sc
orpi
oM
R43
G33
MR
Bust
erM
R Sc
orpi
oM
R43
G33
MR
Bust
erM
R Sc
orpi
oM
R43
50,000 75,000 100,000 150,000 50,000 75,000 100,000 150,000 50,000 75,000 100,000 150,000
I-0 I-1 I-2
Har
vest
ed y
ield
(t/h
a)
Figure 6. Impact of treatments on grain yield Treatment yield = NSD
Population and hybrid impact on yieldThe population treatment of 150,000 plants/ha resulted in significantly higher yield than populations of 50,000 and 75,000 plants/ha (Figure 7). This trend is a continuation from the WUE analysis which indicates that the higher plant populations in the experiment were better placed to fulfill their yield potential.
The hybrid MR Buster yielded significantly higher than the other three hybrids in the experiment (Figure 7). MR Buster trended towards higher or equivalent yield to the other three hybrids in 11 of the 12 treatment interactions across the experiment (irrigations x3 by populations x4; Figure 6).

AG
RO
NO
MY
12 | NORTHERN GRAINS RESEARCH RESULTS 2016
0
1
2
3
4
5
6
7
50 75 100 150 G33 MR
Buster
MR
Scorpio
MR43
Population ('000 pl/ha) Hybrid
Trea
tmen
t yie
ld (t
/ha)
b
b aba
ba
b b
Figure 7. Population and hybrid effects on grain yield LSD–POP >0.75, HYB>0.29 Bars within population or hybrid treatments with the same letter are not significantly different (p≤0.05)
Irrigation impact on yieldSorghum yields were not statistically different across irrigation treatments. There was a trend for improved yield with the I-1 irrigation treatment (6.19 t/ha) compared to the I-0 treatment (5.83 t/ha), but the poor yields associated with delayed maturity of sorghum across the I-2 treatment resulted in the lowest yield (5.63 t/ha; Figure 8). This can be explained by the longer irrigation period, which meant the sorghum was developing grain in sub-optimum conditions and also the higher incidence of midge activity in the later maturing heads.
As stated previously, the agronomic issues that have affected the sorghum within irrigation treatment I-2 greatly impacted on the findings in regards to the effects of the various irrigation management techniques on sorghum yield.
5.3
5.4
5.5
5.6
5.7
5.8
5.9
6.0
6.1
6.2
6.3
I-0 I-1 I-2
Trea
tmen
t yie
ld (t
/ha)
Irrigation treatment
Figure 8. Effect of irrigation treatments on grain yield Irrigation Effect on Yield – NSD
Finishing soil waterSoil cores were taken after harvest to examine finishing plant available water (PAW) remaining under the hybrid MR Scorpio at the populations of 100,000 and 150,000 plants/ha and the three irrigation treatments (Figure 9). Both plant populations in the I-0 treatment followed a similar trend line, where there was levels of PAW remaining above the 20 cm soil depth due to late rainfall, but soil moisture was limited (less than 5 mm PAW) from the 40 cm depth down.

AG
RO
NO
MY
INDEPENDENT RESEARCH FOR INDUSTRY | 13
The irrigated treatments of I-1 and I-2 had greater PAW remaining below the 40 cm depth than treatment I-0 with the late irrigation for I-2 leaving the most residual soil moisture. The higher PAW remaining in the I-2 treatment would potentially benefit production of the following crop, especially if managed in a double cropping rotation sequence.
Soil moisture measurements after harvest also showed that the higher plant population rates with both I-1 and I-2 irrigation treatments left lower levels of PAW in the soil profile indicating that the higher plant populations used more soil moisture during the experiment.
0
20
40
60
80
100
120
0 5 10 15 20 25
Soil
dept
h (c
m)
PAW (mm)
I-0 100,000 I-0 150,000I-1 100,000 I-1 150,000I-2 100,000 I-2 150,000
Figure 9. Plant available water (PAW) after crop harvest
ConclusionsThis experiment demonstrates that growers could make considerable productivity gains by selecting the right hybrid and target plant population with irrigated sorghum production. Irrigation management can significantly influence the growth of sorghum hybrids, affecting plant height, and grain development. Plant population impacted on yield with the higher planting populations of 100,000 and 150,000 plant/ha resulting in significantly higher grain yield than the 50,000 or 75,000 plants/ha treatments. The higher plant populations appear to have taken better advantage of the high PAW present in the irrigation treatments.
AcknowledgementsThis research was jointly funded by GRDC and NSW DPI under project DAN00181: Northern Region high yielding cereal agronomy - NSW. Thanks to Tim Grant, Nicole Carrigan, Peter Perfrement and Mark Hellyer for technical assistance.

AG
RO
NO
MY
14 | NORTHERN GRAINS RESEARCH RESULTS 2016
Managing dryland wheat for maximum yield potential – Tamarang 2014Rick Graham, Guy McMullen, Steven Simpfendorfer and Bruce HaighNSW DPI, Tamworth
Key findingsResults from this study, clearly demonstrated that sowing timing is important. For example, delayed sowing (30 June vs 9 May) reduced the grain yield potential for EGA GregoryA by 1.75 t/ha or ~24%.
Agronomic management factors that affected yield potential from the early sowing time (9 May) included response to nitrogen (N) input (~9% variation), with genotype and crown rot disease pressure both individually accounting for ~8% variations in grain yield.
When the time of sowing was delayed to 30 June, agronomic factors had a larger impact/variation on grain yield potential. With both genotype (variety selection) and crown rot disease pressure responsible for a 13% variation/decline in grain yield.
Delayed sowing also affected yield response to N with no increase in grain yield potential due to N input, whilst targeted plant population affected grain yield, with the low population treatment accounting for ~9%
IntroductionThe Liverpool Plains (LPP) with its fertile, high water-holding capacity vertosol soils is regarded as a high yielding environment within the Northern Grains Region. Despite this, average dryland wheat yields achieved on the LPP are still considered to be substantially lower than the maximum attainable or potential yields. Identifying the key agronomic drivers of yield in these water-limited (rain fed) environments is an important step towards closing the so called ‘yield gap’ – the difference between maximum attainable (potential) yield and the yield that is currently being achieved commercially.
The aim of this co-funded NSW DPI and GRDC research was to determine the maximum attainable grain yield for a given location and year, and to quantify the contributions various agronomic management factors might have on grain yield and quality. Possible yield-limiting agronomic factors or drivers investigated included time of sowing (TOS), variety, plant population, fertiliser inputs (nitrogen and phosphorus rates) and disease pressure (± crown rot infection; CR). Defining the contribution these agronomic factors have on potential grain yield will help growers understand why there are yield gaps and give them some direction as to how they can best bridge these gaps. This is important, as growers are often reluctant to provide the inputs necessary to achieve water-limited yield potential due to the perceived risks associated with the return on investment.
This report outlines findings from a dryland wheat experiment conducted at Tamarang on the LPP of northern NSW in 2014.
Site detailsLocation: “The Point”, TamarangCo-operators: David RonaldPrevious crop: Long fallow out of cottonSoil type: Black vertosolStarting nutrition: Starting soil nutrition is outlined in Table 1.
Soil nitrate N was calculated as 160 kg/ha (0–120 cm)Starting water: ~210 mm PAW (plant available water) to 1.2 m when cored pre-
sowing (TOS 1)In-crop rainfall: 170 mm
Table 1. Starting soil nutrition
Depth (cm)
Nitrate (mg/kg)
Colwell P (mg/kg)
Colwell K (mg/kg)
Sulfur (mg/kg)
Organic carbon
(%)
Conductivity (dS/m)
pH level (CaCl2)
0–10 26 77 737 16.2 1.41 0.223 7.610–30 19 17 319 26.5 0.86 0.255 7.830–60 11 11 244 13.9 0.53 0.245 8.160–90 5 24 261 12.9 0.37 0.401 8.090–120 3 41 275 10.0 0.42 0.404 8.1
TreatmentsA series of 36 treatment combinations (2 TOS × 18 treatments) were investigated in a partially factorial experiment, with three replicates. Treatments were designed similar to an omission trial, with the high input treatment aimed at providing the perceived optimum combination of factors and a low input treatment comprising a base set of agronomic factors. Treatments details are outlined in Table 2.

AG
RO
NO
MY
INDEPENDENT RESEARCH FOR INDUSTRY | 15
Table 2. Treatment details
Treatment Details
Two times of sowing (TOS) TOS 1: 9 May 2014
TOS 2: 30 June 2014Four varieties EGA GregoryA (TOS 1 & 2)
LRPB SpitfireA (TOS 2)
SunvaleA (TOS 1)
LRPB CrusaderA (TOS 1 & 2)Three plant populations 60, 120 or 180 plants/m2
Five nitrogen rates 0, 50, 100,150 or 50 + 50 (split application) kg N/ha all applied as urea (46% N). Treatments were side banded at sowing, apart from the split application, which was applied at sowing and stem elongation (GS31).
Four phosphorus (P) rates 0, 10, 20 or 30 kg/ha P applied as triple super at sowingFour crown rot (CR) inoculum rates
0, 0.5, 1.0 or 2.0 g/m row sterilised durum grain colonised by at least five different isolates of Fusarium pseudograminearum (Fp) +/− added at sowing i.e.; 0, CR+, CR++ or CR+++
Results• Timeliness was shown to have a significant effect on grain yield. Delayed sowing
reduced yield by 1.75 t/ha or ~24% from 7.33 t/ha TOS 1, down to 5.58 t/ha for TOS 2 for the ‘High Input’ EGA Gregory treatment targeting 120 plants/m2, 100 kg N/ha and 20 kg P/ha applied at sowing, with nil additional disease pressure (0 Fp applied at sowing; Table 3). Physical grain quality parameters were also impacted with delayed sowing increasing screenings (% grain below the 2.0 mm screen), decreasing seed weight, and reducing test weight (data not shown).
Table 3. Effect of agronomic factors on grain yield potential, Tamarang 2014
Variety Population (plants/m2)
Applied N (kg N/ha)
Applied P (kg P/ha)
Added ± Fp (CR+,++,+++)
Yield (t/ha)
Yield gap (t/ha)
*EGA Gregory 120 100 20 0 7.33*EGA Gregory 120 0 20 0 6.70 −0.63*EGA Gregory 120 100 20 +++ 6.75 −0.58*Sunvale 120 100 20 0 6.77 −0.56**EGA Gregory 120 100 20 0 5.58 −1.75*TOS 1, **TOS 2
• There was a significant (P<0.001) grain yield (GY) and grain protein concentration (GPC) response to applied N for TOS 1, with a 0.63 t/ha GY increase from applying 100 kg N/ha compared with the nil treatment for EGA Gregory (Table 3). There was no difference between the upfront and split applications (Figure 1). There was no additional GY response at the higher 150 kg N/ha rate, while the 50 kg N/ha rate gave no significant yield benefit over the nil N treatment. In contrast to TOS 1, increasing the N rate provided no GY benefit for LRPB Spitfire, in the delayed sowing (TOS 2). This could have been from the effect of cold temperatures (soil and air) on plant growth, affecting both N uptake and efficiency. Conversely, heat and moisture stress during the shortened critical grain-filling period could also have influenced yield potential. Unlike the GY response to N application, there was a GPC response to increasing N rates for both times of sowing (data not shown).

AG
RO
NO
MY
16 | NORTHERN GRAINS RESEARCH RESULTS 2016
6.0
6.2
6.4
6.6
6.8
7.0
7.2
7.4
0 50 100 50 + 50 150
Gra
in y
ield
(t/h
a)
Applied nitrogen (kg N/ha)
lsd (P = 0.05) = 0.41 t/ha
Figure 1. Grain yield response of wheat to nitrogen rate, Tamarang 2014 Grain yield based on EGA Gregory sown at 120 plants /m2, with 20 kg P/ha and 0 applied CR averaged across the two sowing times
• There was no significant GY or quality response to increasing rates of phosphorus (P) application for either TOS, which probably indicates the high starting Colwell P values of 77 mg/kg at 0–10 cm and 17 mg/kg at 10–30 cm soil depths (Table 1).
• Increasing crown rot (CR) disease pressure (± Fp applied at sowing) when all other variables were held constant, resulted in a significant decrease in GY. Yield decreased from 7.33 t/ha with nil added Fp down to 6.75 t/ha with the 2.0 g/m Fp inoculum rate (CR +++), a 0.58 t/ha (8%) decrease in yield at TOS 1 (Table 3). A similar trend was also observed for TOS 2 for LRPB Spitfire, with a 0.63 t/ha decrease in GY under high crown rot pressure (CR +++) (Table 4). There was also a trend for increased screenings with increasing crown rot disease pressure increasing from 5.1% to 7.0% for TOS 2 (data not shown).
• Variety selection also affected grain yield potential. Changing the variety from EGA Gregory to Sunvale in TOS 1 resulted in a 0.56 t/ha GY decrease (Table 3).
• Plant population targeting 60, 120 or 180 plants/m2 had no significant effect on GY for TOS 1. In contrast, plant population did have a significant effect on GY potential for TOS 2 (Table 4). The low targeted population of 60 plants/m2 was significantly lower yielding than either the 120 and 180 plants/m2 at 4.56 t/ha vs. 4.95t/ha and 4.98 t/ha respectively (Figure 2), supporting the accepted principal of increasing targeted plant populations for delayed sowings.
Table 4. Impact of agronomic factors on grain yield with delayed sowing (TOS 2), Tamarang 2014
Variety Population (plants/m2)
Applied N (kg N/ha)
Applied P (kg P/ha)
Added ± Fp (CR+,++,+++)
Yield (t/ha)
Yield gap (t/ha)
LRPB Spitfire 120 100 20 0 4.95LRPB Spitfire 60 100 20 0 4.52 −0.43LRPB Spitfire 120 100 20 +++ 4.32 −0.63

AG
RO
NO
MY
INDEPENDENT RESEARCH FOR INDUSTRY | 17
4.0
4.5
5.0
5.5
6.0
6.5
7.0
7.5
60 120 180
Gra
in y
ield
(t/h
a)
Plant population (plants/m2)
TOS 1
TOS 2
TOS2 lsd (P = 0.05) = 0.27 t/ha
TOS1 lsd (P = 0.05) = 0.35 t/ha
Figure 2. Grain yield response of wheat to plant population and time of sowing, Tamarang 2014
SummaryAlthough PAW and in-crop rainfall are key determinants of yield in water-limited dryland production systems, agronomic management factors can be manipulated to increase GY potential. Of the agronomic factors considered in this study, sowing time was found to be a key driver of GY potential, emphasising the importance of sowing varieties in the earlier part of their optimal sowing window. Delayed sowing of EGA Gregory (30 June vs. 9 May) for example, reduced grain yield potential by 1.75 t/ha or ~24%. Delayed sowing also adversely affected physical grain quality and GY responsiveness to N application. The reduction in GY was most likely the result of increased maximum temperatures and evapotranspiration, and a shortened grain filling period. Nitrogen input was shown to be a limiting factor in TOS 1, with a 0.63 t/ha or ~9% variation in GY attributed to N applied at 100 kg N/ha compared with the nil N treatment for EGA Gregory. Increasing crown rot disease pressure (±Fp applied at sowing) resulted in a 0.58 t/ha or 8% decrease in GY potential for TOS 1, and was responsible for a 0.63 t/ha or ~13% yield reduction for TOS 2. Variety selection (genotype) accounted for ~8% or a 0.56 t/ha variation in yield for TOS 1 (EGA Gregory vs. Sunvale) and for ~13% or 0.63 t/ha in TOS 2 (EGA Gregory vs. LRPB Spitfire). Plant population was only a significant factor in TOS 2, with the low target population resulting in ~9% or 0.63 t/ha decrease in GY. In this study, P nutrition was not a limiting factor due primarily to the high starting Colwell P values.
AcknowledgementsThis experiment was co-funded by NSW DPI and GRDC under project DAN00181: Northern Region high yielding cereal agronomy – NSW. Thanks to David Ronald for providing the trial site. Technical assistance provided by Stephen Morphett, Jim Perfrement, Peter Formann, Jim Keir, Jan Hosking, Rod Bambach, and Richard Morphett (all NSW DPI) is also gratefully acknowledged.

AG
RO
NO
MY
18 | NORTHERN GRAINS RESEARCH RESULTS 2016
Durum wheat variety response to nitrogen management and sowing time – Tamarang 2015Rick Graham, Stephen Morphett, Jim Perfrement, Michael Dal Santo and Neroli GrahamNSW DPI, Tamworth
IntroductionDurum wheat (Triticum turgidum) production is generally targeted at high yielding environments with the potential to achieve grain protein concentrations (GPC) of 13% and above. In northern NSW and Qld, grain handlers receive durum which mostly needs to meet Grain Trade Australia (GTA) quality receival standards. Only varieties receiving a Wheat Quality Australia (WQA) classification can be delivered to receive Australian Premium Durum (ADR) grades other than feed. Price downgrades are generally associated with decreasing GPC and grain plumpness (screenings), with the lowest quality durum (DR3) accepted for semolina and pasta production having a minimum 10% GPC with a maximum of 10% screenings. Importantly, GPC is a primary receival standard for which growers are paid, and significant differential premiums are offered for higher grain protein levels.
For the major northern durum traders such as Cargill and GrainCorp, their emphasis is on maximising brand advantage and penetration of Australian durum into the Italian market. For GrainCorp, one of the main traders of northern durum, the market is essentially Italy, ex Newcastle, preferably meeting DR1 quality specifications (>13% GPC and <5% screenings), with DR2 (minimum 11.5% GPC and a maximum of 5% screenings) generally less desirable (GrainCorp pers. comm.). The concerns for export markets have been the need to improve consistency of supply of DR1 and DR2 grade durum, and to maintain the high quality standards of Australian durum wheat. The most common cause for grain quality receival downgrading in newer cultivars has generally been due to screenings >5% and GPC below 13%.
The aim of the experiment was to compare variety response to time of sowing (TOS) and nitrogen (N) management to develop variety recommendations and tactical agronomy guidelines. This should improve the potential of varieties to reliably achieve DR1 and DR2 receival specifications, thus enhancing variety adoption through improved yield and quality potential of new durum varieties. The experiment was conducted near Tamarang on the Liverpool Plains in 2015.
Site detailsLocation: “The Point”, Tamarang, Liverpool PlainsCo-operator: David RonaldPrevious crop: Long fallow out of sorghumSoil type: Black vertosolStarting N: Soil nitrate N of ~200 kg N/ha (0–120 cm)Starting water: ~130 mm PAW to 1.2 m when cored pre-sowing (11 March), with
70 mm of rain received after coring and prior to TOS 1Sowing date: 19 May 2015 (TOS 1) and 9 July 2015 (TOS 2)In-crop rainfall: 290 mm (TOS 1)Fertiliser: 70 kg/ha Granulock Z extra at plantingHarvest date: 30 November 2015 (TOS 1) and 7 December 2015 (TOS 2)
TreatmentsDurum wheat Four commercially released varieties CaparoiA, DBA AuroraA, DBA
LillaroiA and JandaroiA, and an advanced breeder’s line from the Northern Durum breeding program 190873 in a fully replicated, factorial design with six N treatments in total.
Key findingsDurum varieties (CaparoiA, DBA AuroraA, DBA LillaroiA and JandaroiA) displayed differential grain quality and yield responses to time of sowing (TOS) and nitrogen (N) management. Increased screenings (>5%) were the most common cause of quality downgrades.
DBA AuroraA, due to increased risk of screenings (>5%) in part because of reduced grain size, would appear to offer less flexibility in terms of agronomic management, specifically delayed sowing and N management.
The newly released Northern Durum breeding program variety DBA LillaroiA appears to offer excellent grain size and grain stability, achieving low screenings from a delayed sowing and high N rates.
Results also highlight the need to sow varieties within recommended sowing windows. An earlier than recommended sowing date of May 19 for the Liverpool Plains resulted in yield losses of ~25% averaged across N treatments for earlier maturing varieties such as JandaroiA and DBA LillaroiA, with possible grain quality implications (e.g. increased screenings).

AG
RO
NO
MY
INDEPENDENT RESEARCH FOR INDUSTRY | 19
Nitrogen (N) rate 0, 40, 80, 120 kg N/ha and two split applications 2 × 40 kg N/ha either at sowing and GS31 or at sowing and GS39, all applied as urea (46% N). All treatments were side banded at sowing, apart from the split applications, which had half applied at planting and half at stem elongation (GS31) or at flag leaf emergence (GS39) (total 80 kg N/ha).
Sowing date 19 May and 9 July, in a split plot design with three replicates.
Results• For both times of sowing, there was no positive grain yield response to N application,
with only a GPC response to increasing rates of N application. This was most likely due to high starting soil N levels, estimated at ~200 kg N/ha.
• All varieties experienced a yield reduction for TOS 1 vs. TOS 2 (Table 1), due primarily to frost-induced sterility at flowering and/or frost impact during grain filling with TOS 1. The 19 May (TOS 1) is generally considered earlier than ideal for this region, with the 4th week of May considered suitable for mid-season varieties such as Caparoi, and the 1st week of June more appropriate for the earlier maturing varieties, such as Jandaroi. The earlier maturing varieties, Jandaroi and DBA Lillaroi, suffered the greatest yield losses with TOS 1 at 1.51 t/ha and 1.64 t/ha, respectively when averaged across N treatments compared with yield obtained from TOS 2 (Table 1).
• In comparison yield losses of 0.89 t/ha and 0.82 t/ha occurred for the later maturing varieties DBA Aurora and Caparoi, respectively with TOS 1.
Table 1. Mean varietal grain yield (t/ha) averaged across nitrogen treatments for two times of sowing – Tamarang 2015
Variety Yield (t/ha)
TOS 1 TOS 2
Caparoi 5.35 6.17190873 5.23 6.36DBA Aurora 5.11 6.00DBA Lillaroi 4.94 6.58Jandaroi 4.75 6.26LSD (P = 0.05) 0.41
• The grain quality parameters of screenings and, to a lesser extent, GPC were affected in TOS 1, with DBA Aurora and DBA Lillaroi downgraded to DR3 across all N treatments due to screening levels >5%. Caparoi only exceeding 5% screenings at the highest N rate of 120 kg N/ha (data not shown).
• An increase in screenings for DBA Lillaroi in TOS 1 compared with TOS 2, was most likely due to a frost event during grain filling. Interestingly, the split application of N at GS39 for DBA Aurora did show a reduced trend in screenings at this sowing time.
• TOS 2, sown on 9 July, although later than preferred (outside the optimum sowing window) was nevertheless considered acceptable. All varieties achieved significant (P<0.001) increases in grain yields over TOS 1 (Table 1), with all varieties, apart from DBA Aurora, achieving DR1 grain receival specifications. DBA Aurora was downgraded to DR3, due to screenings being >5% across all N rates (Figure 1). The difference in variety responses to N application rates averaged across treatments highlights the issues that DBA Aurora has in terms of potential for downgrading due to higher screening levels (Table 2).

AG
RO
NO
MY
20 | NORTHERN GRAINS RESEARCH RESULTS 2016
0
1
2
3
4
5
6
7
8
9
0 40 80 GS31 40+40 GS39 40+40120
Scre
enin
gs (%
)
Applied nitrogen (kg N/ha)
190873 DBA Lillaroi DBA Aurora Caparoi Jandaroi
Figure 1. Varietal screenings (%) response to nitrogen application with delayed sowing (TOS 2)
• Averaged across N treatments, DBA Lillaroi achieved the highest thousand grain weight (TGW) of 41.0 g, which was greater than either Jandaroi or Caparoi, with DBA Aurora at 33.0 g significantly lower than the other durum varieties (Table 2).
• The experimental line 190873, which has an ADR classification, performed comparably with commercially released northern varieties in terms of yield and grain quality specifications.
Table 2. Mean varietal grain yield (t/ha), grain protein concentration (GPC; %), grain nitrogen yield (GNY; kg N/ha), test weight (hL/kg), screenings (%), and thousand grain weight (TGW; g) averaged across nitrogen treatments TOS 2 (9 July) – Tamarang 2015
Variety Yield (t/ha) GPC (%) GNY (kg N/ha) Test weight (g) Screenings (%) TGW (g)
Caparoi 6.17 13.8 150.2 84.7 4.0 36.0190873 6.36 14.1 157.6 85.1 3.9 36.0DBA Aurora 6.00 13.5 142.6 82.9 7.9 33.0DBA Lillaroi 6.58 14.6 169.8 84.9 3.0 41.0Jandaroi 6.26 14.7 161.4 84.2 3.4 36.7LSD (P = 0.05) 0.22 0.2 8.5 0.5 0.5 1.2
SummaryResults from this study showed that durum varieties had differential grain quality and yield responses to time of sowing and N management. The most common cause for quality downgrading in this experiment was due to increased screenings (>5%), with only ~43% of variety by N treatment combinations meeting DR1/DR2 specifications for TOS 1. However, it should be noted that varieties were affected to varying degrees by frost events during flowering and or grain filling with TOS 1. Importantly, only DBA Aurora was outside DR1/DR2 screening specifications (>5%) for all N rates at TOS 2 (Figure 1). From these results, it would appear that DBA Aurora, due to its increased risk of screenings (partly due to reduced grain size), offers less flexibility in terms of agronomic management considerations regarding sowing date and N management. In comparison, the newly released Northern Durum breeding program variety DBA Lillaroi appears to offer excellent grain size and grain stability, achieving low screenings from a delayed sowing time and high available N rates.
Findings from this experiment also highlight the need to sow varieties within their recommended sowing windows for a given environment. An earlier than recommended sowing date of May 19 for the Liverpool Plains region result in yield losses of ~25% averaged across N treatments for earlier maturing varieties such as Jandaroi and DBA Lillaroi, with possible grain quality implications also observed (e.g. increased screenings).

AG
RO
NO
MY
INDEPENDENT RESEARCH FOR INDUSTRY | 21
Given the export focus of the northern durum market, it is assumed that varieties with large, plump grain and reduced risk of screenings, that can consistently achieve DR1/DR2 specifications, will be preferred over varieties with an increased risk of quality downgrading.
AcknowledgementsThis research was co-funded by NSW DPI and GRDC under project DAN00167: Variety Specific Agronomy Packages for southern, central and northern NSW. Thanks to David Ronald for hosting the trial site. Technical assistance provided by Jan Hosking, Peter Formann, Rod Bambach and Richard Morphett (all NSW DPI) is also gratefully acknowledged.

AG
RO
NO
MY
22 | NORTHERN GRAINS RESEARCH RESULTS 2016
Durum wheat variety response to nitrogen management and time of sowing – Tulloona 2015Rick Graham, Stephen Morphett, Jim Perfrement, Michael Dal Santo and Neroli GrahamNSW DPI, Tamworth
Key findingsDurum varieties displayed differential grain quality and yield responses to time of sowing (TOS) and nitrogen (N) management.
DBA AuroraA appears to offer good yield potential, but exhibits an increased risk of screenings with increasing rates of N application at sowing or when N is applied before stem elongation (GS31). It also appears to have an increased potential for lower grain protein concentrations (GPC) due to yield dilution under high yielding situations.
A strategy involving a split application of N at sowing and either GS31 or GS39, could reduce the potential for screening issues in DBA AuroraA while maintaining adequate GPC.
DBA AuroraA, due principally to its increased risk of screenings, would appear to offer less flexibility in terms of agronomic management to durum growers in northern NSW, compared with Jandaroi,A CaparoiA or DBA LillaroiA.
Findings from this experiment further highlight the need to sow appropriate variety maturity types within their recommended sowing windows.
IntroductionDurum wheat (Triticum turgidum) production is generally targeted at high yielding environments with the potential to achieve grain protein concentrations (GPC) of 13% and above. In northern NSW and Qld, grain handlers receive durum which mostly needs to meet Grain Trade Australia (GTA) quality receival standards. Only varieties receiving a Wheat Quality Australia (WQA) classification can be delivered to receive Australian Premium Durum (ADR) grades other than feed. Price downgrades are generally associated with decreasing GPC and grain plumpness (screenings), with the lowest quality durum (DR3) accepted for semolina and pasta production having a minimum 10% GPC with a maximum of 10% screenings. Importantly, GPC is a primary receival standard for which growers are paid, and significant differential premiums are offered for higher grain protein levels.
For the major northern durum traders such as Cargill and GrainCorp, their emphasis is on maximising brand advantage and penetration of Australian durum into the Italian market. For GrainCorp, one of the main traders of northern durum, the market is essentially Italy, ex Newcastle terminal preferably meeting DR1 quality specifications (>13% GPC and <5% screenings), with DR2 (minimum 11.5% GPC and a maximum of 5% screenings) generally less desirable (GrainCorp pers. comm.). The concerns for export markets have been the need to improve consistency of supply of DR1 and DR2 grade durum, and to maintain the high quality standards of Australian durum wheat. The most common cause for grain quality downgrading at receival in newer cultivars has generally been due to screenings >5% and GPC below 13%.
The aim of this experiment conducted near Tulloona on the North West Plains of NSW, was to compare variety response with time of sowing (TOS) and nitrogen (N) management with the objective to develop variety recommendations and tactical agronomy guidelines. This should improve the potential for varieties to reliably achieve DR1 and DR2 receival specifications thereby enhancing variety adoption through improved yield and quality potential of new durum varieties.
Site detailsLocation: “Myling”, Tulloona, North West PlainsCo-operator: Jack GooderhamPrevious crop: Long fallow out of sorghumSoil type: Black vertosolStarting N: Soil nitrate N of ~137 kg N/ha (0–120 cm)Starting water: ~210 mm plant available water (PAW) to 150 cm when cored pre
TOS 2 (4 June)Sowing date: 7 May 2015 (TOS 1) and 6 June 2015 (TOS 2)In-crop rainfall: ~190 mm (May to November)Fertiliser: 70 kg/ha Granulock Z extra at plantingHarvest date: 10 November 2015
TreatmentsDurum wheat Four commercially released varieties CaparoiA, DBA AuroraA, DBA
LillaroiA and JandaroiA, and an advanced breeder’s line from the Northern Durum breeding program 190873 in a fully replicated, factorial design with six N treatments in total.

AG
RO
NO
MY
INDEPENDENT RESEARCH FOR INDUSTRY | 23
Nitrogen (N) rate 0, 40, 80, 120 and two split applications 2 × 40 kg N/ha either at sowing and GS31 or at sowing and GS39, all applied as urea (46% N). All treatments were side banded at sowing, apart from the split applications, which had half applied at planting and half at stem elongation (GS31) or at flag leaf emergence (GS39) (total 80 kg N/ha).
Sowing date 7 May and 6 June, in a split plot design with three replicates.
Results• The yield response of varieties between TOS 1 and TOS 2 was variable. The quicker
maturing varieties, Jandaroi and DBA Lillaroi, suffered yield losses of 44% (2.50 t/ha) and 14% (0.75 t/ha), respectively with TOS 1 averaged across N treatments, due most likely to frost-induced sterility from this earlier sowing date (Table 1).
• In contrast, the later maturing varieties DBA Aurora and Caparoi had yield increases of 19% (1.10 t/ha) and 7% (0.39 t/ha) in TOS 1 compared with TOS 2. The later maturity of these varieties most likely allowed them to escape frost damage in TOS 1 but increasing temperatures and moisture stress during grain fill associated with the later sowing date (TOS 2) would have restricted yield.
• Grain yield response to N application although positive, was relatively flat, with no varietal interactions apparent in either TOS. For TOS 1, yield averaged across varieties increased by 0.18 t/ha over the nil treatment at the 120 kg N/ha rate (5.21 t/ha vs. 5.39 t/ha). Whilst in TOS 2, there was a 0.22 t/ha yield increase over the nil treatment at the 80 kg N/ha rate (5.42 vs. 5.66 t/ha).
• In contrast to grain yield, grain protein concentration (GPC) showed a linear trend with increasing N rates. DBA Aurora failed to achieve DR2 specifications of >11.5% GPC with both the nil N treatments for TOS 1 and TOS 2 and was outside DR1 specifications of >13.0% GPC for all N treatments apart from TOS 2 with high upfront N rates of 80 to 120 kg N/ha (Figure 1).
0123456789
101112131415161718
190873 DBALillaroi
DBAAurora
Caparoi Jandaroi 190873 DBALillaroi
DBAAurora
Caparoi Jandaroi
TOS 1 TOS 2
Gra
in p
rote
in (%
)
0 kg N/ha
40 kg N/ha
80 kg N/ha
120 kg N/ha
GS31 40+40 kg N/ha
GS39 40+40 kg N/ha
lsd (0.05) = 0.86
Figure 1. Effect of nitrogen management on grain protein concentration (GPC; %) over two times of sowing – Tulloona 2015 Note: DR1 >13% GPC (upper dashed line); DR2 >11.5% GPC (lower dashed line).
• With screenings (<2.0 mm), DBA Aurora was outside DR1 and DR2 specifications (i.e. >5%) with all N treatments in TOS 1 and exceeded DR1 and DR2 specifications at 40, 80 and 120 kg N/ha upfront N application treatments in TOS 2. The majority of other varieties were able to achieve DR1 and DR2 screening receival standards (data not shown).
AG
RO
NO
MY
24 | NORTHERN GRAINS RESEARCH RESULTS 2016
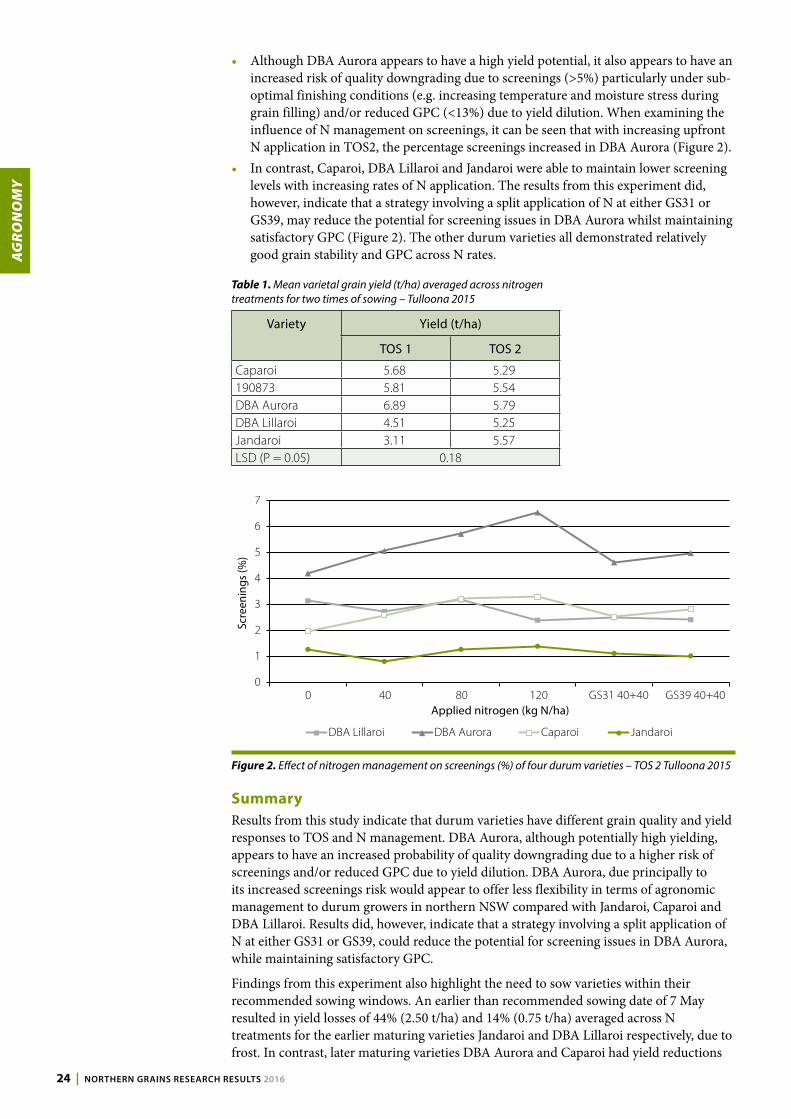
• Although DBA Aurora appears to have a high yield potential, it also appears to have an increased risk of quality downgrading due to screenings (>5%) particularly under sub-optimal finishing conditions (e.g. increasing temperature and moisture stress during grain filling) and/or reduced GPC (<13%) due to yield dilution. When examining the influence of N management on screenings, it can be seen that with increasing upfront N application in TOS2, the percentage screenings increased in DBA Aurora (Figure 2).
• In contrast, Caparoi, DBA Lillaroi and Jandaroi were able to maintain lower screening levels with increasing rates of N application. The results from this experiment did, however, indicate that a strategy involving a split application of N at either GS31 or GS39, may reduce the potential for screening issues in DBA Aurora whilst maintaining satisfactory GPC (Figure 2). The other durum varieties all demonstrated relatively good grain stability and GPC across N rates.
Table 1. Mean varietal grain yield (t/ha) averaged across nitrogen treatments for two times of sowing – Tulloona 2015
Variety Yield (t/ha)
TOS 1 TOS 2
Caparoi 5.68 5.29190873 5.81 5.54DBA Aurora 6.89 5.79DBA Lillaroi 4.51 5.25Jandaroi 3.11 5.57LSD (P = 0.05) 0.18
0
1
2
3
4
5
6
7
0 40 80 120 GS31 40+40 GS39 40+40
Scre
enin
gs (%
)
Applied nitrogen (kg N/ha)
DBA Lillaroi DBA Aurora Caparoi Jandaroi
Figure 2. Effect of nitrogen management on screenings (%) of four durum varieties – TOS 2 Tulloona 2015
SummaryResults from this study indicate that durum varieties have different grain quality and yield responses to TOS and N management. DBA Aurora, although potentially high yielding, appears to have an increased probability of quality downgrading due to a higher risk of screenings and/or reduced GPC due to yield dilution. DBA Aurora, due principally to its increased screenings risk would appear to offer less flexibility in terms of agronomic management to durum growers in northern NSW compared with Jandaroi, Caparoi and DBA Lillaroi. Results did, however, indicate that a strategy involving a split application of N at either GS31 or GS39, could reduce the potential for screening issues in DBA Aurora, while maintaining satisfactory GPC.
Findings from this experiment also highlight the need to sow varieties within their recommended sowing windows. An earlier than recommended sowing date of 7 May resulted in yield losses of 44% (2.50 t/ha) and 14% (0.75 t/ha) averaged across N treatments for the earlier maturing varieties Jandaroi and DBA Lillaroi respectively, due to frost. In contrast, later maturing varieties DBA Aurora and Caparoi had yield reductions

AG
RO
NO
MY
INDEPENDENT RESEARCH FOR INDUSTRY | 25
of 19% (1.10 t/ha) and 7% (0.39 t/ha) when sowing was delayed until 6 June, most likely from increasing temperature and moisture stress during grain filling.
Given the export focus of the northern durum market it is assumed that varieties with good grain stability, namely a reduced risk of screenings and consistency in achieving the desired DR1/DR2 GPC specifications, will be preferred over varieties with an increased risk of quality downgrading.
AcknowledgementsThis research was co-funded by NSW DPI and GRDC under project DAN00167: Variety Specific Agronomy Packages for southern, central and northern NSW. Technical assistance provided by Jan Hosking, Peter Formann, Rod Bambach and Richard Morphett (all NSW DPI) is gratefully acknowledged. We finally thank Jack and Julia Gooderham for allowing us to conduct this experiment on their property ‘Myling’ near Tulloona in 2015.

AG
RO
NO
MY
26 | NORTHERN GRAINS RESEARCH RESULTS 2016
IntroductionFaba bean is a rotation crop used in northern NSW to break disease cycles in winter cereals and to maintain soil nitrogen fertility. The Pulse Breeding Australia (PBA) faba bean breeding program aims to breed locally adapted varieties with improved disease resistance. PBA Nasma, released in 2015, is a large-seeded faba bean classified MR–R (moderately resistant to resistant) to rust. The large seed size can potentially cause blockages in planting machinery if it is not well set up and also requires a very high sowing volume to achieve a targeted plant population. A possible solution is to grade PBA Nasma seed into different size categories and plant the smaller seed.
Site detailsLocation: Liverpool Plains Field Research Station, BreezaCo-operator: Scott Goodworth, NSW DPISowing date: 19 May 2015
TreatmentsPBA Nasma seed was graded into three size categories (Table 1) with ungraded seed used as a control. Data on yield, seed size and above ground biomass were collected.
Table 1. PBA Nasma seed size categories
Category Seed size (g/100 seeds)
Normal (ungraded) –Small 43Medium 76Large 102
ResultsGrain yield results showed significant variation between replications. There was no significant difference in biomass or yield at harvest between the PBA Nasma seed size categories (Table 2). The small seed size category produced significantly smaller seed at harvest than the other treatments at this site in 2015.
Table 2. Biomass, yield and seed weight at harvest resulting from sowing different seed sizes categories of PBA Nasma – Breeza 2015
Treatment Biomass at harvest (t/ha)
Yield (t/ha)
Hundred seed weight (g/100 seeds)
Normal (ungraded) 9.83 a* 4.00 a 51.4 aSmall 9.67 a 3.65 a 43.4 bMedium 9.83 a 4.47 a 53.6 aLarge 9.97 a 4.30 a 57.7 a*Numbers indicated by different letters are significantly different at P = 0.05
Influence of seed size on the yield of the faba bean variety PBA NasmaA – Breeza 2015Bill Manning1, Stuart Marshman2, Joop van Leur2 and Merv Riley2
1 North West LLS, Gunnedah 2 NSW DPI, Tamworth
Key findingsThere is no evidence to support growers grading seed into different size categories and sowing the smaller seed.
In one trial in 2015, sowing seed of different size classes did not significantly influence the yield of PBA NasmaA. Insufficient data is currently available to make a recommendation either way on this practice, but there was a trend towards reduced size of harvested seed and yield from sowing smaller PBA NasmaA seed.

AG
RO
NO
MY
INDEPENDENT RESEARCH FOR INDUSTRY | 27
SummaryAlthough seed size did not significantly influence yield in this trial, further research is required before a definitive recommendation around using a particular seed size for sowing can be made. Growers are currently advised not to grade PBA Nasma in order to plant smaller seed. Planting smaller seed might produce seed of smaller size at harvest which might, in turn, reduce financial returns to the grower.
AcknowledgementsThis research was funded by NSW DPI, NWLLS and GRDC under project UA00127: Pulse Breeding Australia faba bean breeding program. Thanks to Ivan Stace for technical assistance.
AG
RO
NO
MY
28 | NORTHERN GRAINS RESEARCH RESULTS 2016
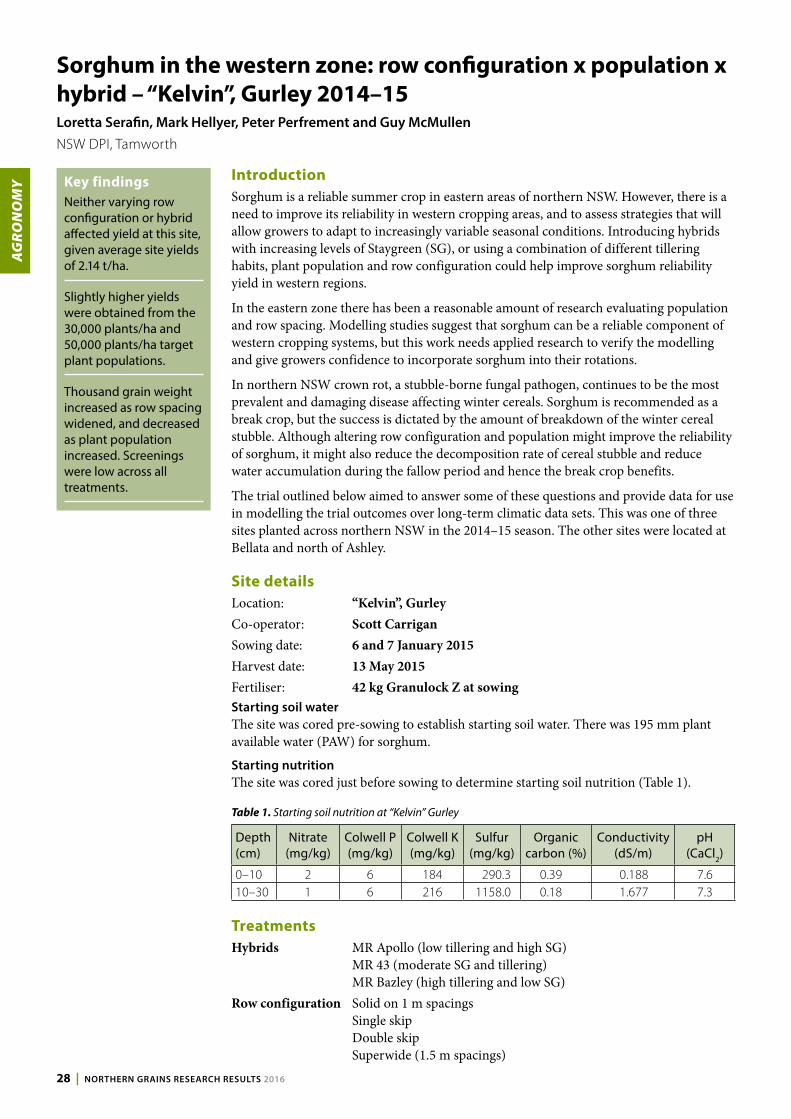
Sorghum in the western zone: row configuration x population x hybrid – “Kelvin”, Gurley 2014–15Loretta Serafin, Mark Hellyer, Peter Perfrement and Guy McMullenNSW DPI, Tamworth
Key findingsNeither varying row configuration or hybrid affected yield at this site, given average site yields of 2.14 t/ha.
Slightly higher yields were obtained from the 30,000 plants/ha and 50,000 plants/ha target plant populations.
Thousand grain weight increased as row spacing widened, and decreased as plant population increased. Screenings were low across all treatments.
IntroductionSorghum is a reliable summer crop in eastern areas of northern NSW. However, there is a need to improve its reliability in western cropping areas, and to assess strategies that will allow growers to adapt to increasingly variable seasonal conditions. Introducing hybrids with increasing levels of Staygreen (SG), or using a combination of different tillering habits, plant population and row configuration could help improve sorghum reliability yield in western regions.
In the eastern zone there has been a reasonable amount of research evaluating population and row spacing. Modelling studies suggest that sorghum can be a reliable component of western cropping systems, but this work needs applied research to verify the modelling and give growers confidence to incorporate sorghum into their rotations.
In northern NSW crown rot, a stubble-borne fungal pathogen, continues to be the most prevalent and damaging disease affecting winter cereals. Sorghum is recommended as a break crop, but the success is dictated by the amount of breakdown of the winter cereal stubble. Although altering row configuration and population might improve the reliability of sorghum, it might also reduce the decomposition rate of cereal stubble and reduce water accumulation during the fallow period and hence the break crop benefits.
The trial outlined below aimed to answer some of these questions and provide data for use in modelling the trial outcomes over long-term climatic data sets. This was one of three sites planted across northern NSW in the 2014–15 season. The other sites were located at Bellata and north of Ashley.
Site detailsLocation: “Kelvin”, GurleyCo-operator: Scott CarriganSowing date: 6 and 7 January 2015Harvest date: 13 May 2015Fertiliser: 42 kg Granulock Z at sowingStarting soil waterThe site was cored pre-sowing to establish starting soil water. There was 195 mm plant available water (PAW) for sorghum.
Starting nutritionThe site was cored just before sowing to determine starting soil nutrition (Table 1).
Table 1. Starting soil nutrition at “Kelvin” Gurley
Depth (cm)
Nitrate (mg/kg)
Colwell P (mg/kg)
Colwell K (mg/kg)
Sulfur (mg/kg)
Organic carbon (%)
Conductivity (dS/m)
pH (CaCl2)
0–10 2 6 184 290.3 0.39 0.188 7.610–30 1 6 216 1158.0 0.18 1.677 7.3
TreatmentsHybrids MR Apollo (low tillering and high SG)
MR 43 (moderate SG and tillering) MR Bazley (high tillering and low SG)
Row configuration Solid on 1 m spacings Single skip Double skip Superwide (1.5 m spacings)

AG
RO
NO
MY
INDEPENDENT RESEARCH FOR INDUSTRY | 29
Plant populations Populations were targeted using germination for each hybrid and an estimated establishment of 80%. Three populations were targeted in each of the row configurations: 15,000 plants/ha 30,000 plants/ha 50,000 plants/ha
ResultsNote Throughout tables values followed by the same letter are not significantly different
at the 95% confidence level (P = 0.05).Plant establishmentPlant establishment was quite good at this site, achieving slightly higher than the targeted 15,000 plants/ha population and slightly lower at the 30,000 and 50,000 plants/ha targets (Table 3). Row configuration also affected plant establishment with the superwide and double skip treatments establishing slightly fewer plants (Table 2).
There was no significant difference in establishment of the different hybrids (data not shown).
Table 2. Impact of row configuration on plant population
Configuration Established population (plants/ha)
Solid 31,500 aSingle skip 29,900 aSuperwide 26,200 bDouble skip 24,800 b
Table 3. Target plant population versus established plant population
Target population (plants/ha)
Established population (plants/ha)
15,000 16,500 c30,000 27,600 b50,000 40,100 a
TilleringThere were significant impacts of nearly all treatments on the number of tillers produced per m2 and per plant. The number of tillers produced per m2 declined as the effective row spacing widened (Table 4). This was most likely due to the additional inter-row competition between plants.
Table 4. Impact of row configuration on tillering
Configuration Tillers (number/m2)
Solid 4.21 aSuperwide 2.85 bcSingle skip 3.12 bDouble skip 2.35 c
Similarly as plant population increased the number of tillers per m2 and per plant decreased (Table 5).
Table 5. Impact of plant population on tillering
Target population (plants/ha)
Tillers (number/m2)
Tillers (number/plant)
15,000 3.55 a 2.15 a30,000 3.28 a 1.21 b50,000 2.58 b 0.65 c

AG
RO
NO
MY
30 | NORTHERN GRAINS RESEARCH RESULTS 2016
The hybrids performed as expected with MR Apollo producing the least number of tillers and MR Bazley the most (Table 6).
Table 6. Impact of hybrid on tillering
Hybrid Tillers (number/m2)
Tillers (number/plant)
MR Apollo 2.60 c 1.09 cMR 43 3.02 b 1.33 bMR Bazley 3.78 a 1.59 a
Head productionThe number of heads produced per m2 decreased as the effective row spacing increased, in the same manner as the tillering (Table 7).
Table 7. Impact of row configuration on head production
Configuration Heads (number/m2)
Solid 5.98 aSuperwide 4.58 bcSingle skip 5.04 bDouble skip 3.99 c
In contrast the number of heads per m2 increased as plant population increased. The number of viable heads produced per plant declined though as the population increased (Table 8).
Table 8. Impact of plant population on head production
Target population (plants/ha)
Head (number/m2)
Heads (number/plant)
15,000 4.56 b 2.76 a30,000 4.98 a 1.83 b50,000 5.15 a 1.29 c
There were also differences in the performance of the hybrids with MR Apollo producing the least heads, followed by MR 43 and then MR Bazley (Table 9).
Table 9. Impact of hybrid on head production
Hybrid Heads (number/m2)
Heads (number/plant)
MR Apollo 4.58 b 1.78 cMR 43 4.77 b 1.96 bMR Bazley 5.34 a 2.15 a
Dry matter productionPlant cuts were taken at flowering and produced an average of 3.26 tonnes of dry matter per ha. There was no difference in the dry matter production between hybrids. However, dry matter production declined as effective row spacing increased (Table 10).
Table 10. Effect of row configuration on dry matter production
Configuration Dry matter (t/ha)
Solid 3.95 aSingle skip 3.39 abSuperwide 3.06 bcDouble skip 2.63 c
The low plant population had the lowest dry matter production but there was no difference in the dry matter production from the 30,000 or 50,000 plants/ha populations (Table 11).

AG
RO
NO
MY
INDEPENDENT RESEARCH FOR INDUSTRY | 31
Table 11. Effect of plant population on dry matter production
Target population (plants/ha)
Dry matter (t/ha)
15,000 2.84 b30,000 3.34 a50,000 3.61 a
Average days to flowering
The days to 50% flowering of the main head was recorded in each plot. The double skip treatments were slightly quicker to flower than the solid plant treatments (Table 12).
Table 12. Effect of row configuration on days to flower
Configuration Days to 50% flowering
Solid 60.00 aSingle skip 59.33 bcSuperwide 59.70 abDouble skip 59.07 c
There was also an impact of increasing plant population, with the lowest plant population being slightly slower to reach 50% flowering (Table 13).
Table 13. Effect of plant population on days to flower
Target population (plants/ha)
Days to 50% flowering
15,000 60.03 a30,000 59.53 b50,000 59.03 c
There was no difference between MR 43 and MR Bazley in the days to flowering. MR Apollo was slower to flower by around three days (Table 14).
Table 14. Effect of hybrid on days to flower
Hybrid Days to 50% flowering
MR Apollo 61.44 aMR 43 58.78 bMR Bazley 58.36 b
Grain yield
The average grain yield at the site was 2.14 t/ha. There was only a significant impact of varying plant population on grain yield (Table 15). The highest yields were achieved with either 30,000 or 50,000 plants/ha. The 15,000 plants/ha population yielded significantly less than the 50,000 plants/ha target population. There was no impact of configuration or hybrid on final grain yield.
Table 15. Impact of varying plant population on grain yield
Target population (plants/ha)
Grain yield (t/ha @ 13.5% moisture)
15,000 1.97 b30,000 2.13 ab50,000 2.33 a
Grain qualitySubsamples were collected from each plot at harvest and were used to measure grain quality parameters including grain protein, 1000 grain weight and test weight.
Grain protein averaged 11.24%, indicating there was sufficient nitrogen to achieve maximum yields. Row configuration did not affect final grain protein. However, increasing plant population reduced grain protein levels (Table 17).

AG
RO
NO
MY
32 | NORTHERN GRAINS RESEARCH RESULTS 2016
Screenings levels were very low across the trial, however, the biggest differences were between the hybrids with the low tillering MR Apollo having a higher level of screenings. MR Apollo also had the lowest test weight (Table 18).
Thousand grain weights increased as row spacing widened (Table 16) and decreased as plant population increased (Table 17).
Table 16. Effect of row configuration on grain quality
Row configuration Screenings (%)
1000 grain weight (g)
Solid 1.86 a 31.21 bSingle skip 1.71 ab 31.59 bSuperwide 1.43 b 32.97 aDouble skip 1.91 a 32.69 a
Table 17. Effect of plant population on grain quality
Target population (plants/ha)
Grain protein (%)
1000 grain weight (g)
15,000 11.39 a 33.74 a30,000 11.24 b 31.90 b50,000 11.01 c 30.70 c
Table 18. Effect of hybrid on grain quality
Hybrid Grain protein (%)
Screenings (%)
1000 grain weight (g)
Test weight (kg/hL)
MR Apollo 11.06 a 2.05 a 33.84 a 72.30 bMR 43 11.14 b 1.64 b 30.18 c 75.50 aMR Bazley 11.06 b 1.50 b 32.32 b 75.22 a
SummaryStarting soil moisture was high at this site, but in-crop rainfall was limited resulting in average sorghum yields of just over 2 t/ha. Neither varying row configuration nor hybrid affected yield at this site, however, slightly higher yields were obtained from the 30,000 plants/ha and 50,000 plants/ha target plant populations. In terms of impacts on grain quality, thousand grain weight increased as row spacing widened and decreased as plant population increased. Screenings were low across all treatments.
AcknowledgementsThis research was co-funded by NSW DPI and GRDC under project DAN00150: Improving reliability of sorghum in the western zone, with support from Pacific Seeds. Thanks to Delphi Ramsden, Peter Formann (NSW DPI) and Nicole Carrigan and Angus Hombsch (formerly NSW DPI) for technical assistance and to Scott Carrigan at “Kelvin”, Gurley for hosting the trial site.

AG
RO
NO
MY
INDEPENDENT RESEARCH FOR INDUSTRY | 33
Sorghum in the western zone: row configuration × population × hybrid – “Koiwon”, Bellata 2014–15Loretta Serafin, Mark Hellyer, Peter Perfrement and Guy McMullenNSW DPI, Tamworth
Key findingsIn a low-yielding season varying row configuration had no effect on sorghum yield.
Yield declined as plant population and hybrid tillering ability increased and staygreen levels decreased.
IntroductionSorghum is a reliable summer crop in eastern areas of northern NSW. However, there is a need to improve its reliability in western cropping areas and to assess strategies that will allow growers to adapt to increasingly variable seasonal conditions. Introducing hybrids with increasing levels of staygreen (SG), or using a combination of different tillering habits, plant population and row configuration may help improve the reliability of sorghum yield in western regions.
In the eastern zone, there has been a reasonable amount of research evaluating population and row spacing. Modelling studies suggest that sorghum can be a reliable component of western cropping systems, but this work needs applied research to verify the modelling and give growers confidence to incorporate sorghum into their rotations.
In northern NSW, crown rot – a stubble-borne fungal pathogen, continues to be the most prevalent and damaging disease affecting winter cereals. Sorghum is recommended as a break crop, but the success is dictated by the amount of breakdown of the winter cereal stubble. Although altering row configuration and population might improve the reliability, it could also reduce the rate of decomposition of cereal stubble and reduce water accumulation during the fallow period and hence the break crop benefits.
The trial outlined below aimed to answer some of these questions and provide data for use in modelling the trial outcomes over long-term climatic data sets. This was one of three sites planted across northern NSW in the 2014–15 season. The other sites were located at Gurley and north of Ashley.
Site detailsLocation: “Koiwon”, BellataCo-operator: Bruce KirkbySowing date: 7 and 8 January, 2015Harvest date: 11 May, 2015Fertiliser: 42 kg Granulock Z at sowingStarting soil waterThe site was cored pre-sowing to establish starting soil water. There was 87 mm of plant available water (PAW) for sorghum.
Starting nutritionThe site was cored just prior to sowing to determine starting soil nutrition (Table 1).
Table 1. Starting soil nutrition at “Koiwon” Bellata
Depth (cm)
Nitrate (mg/kg)
Colwell P (mg/kg)
Colwell K (mg/kg)
Sulfur (mg/kg)
Organic carbon
(%)
Conductivity (dS/m)
pH (CaCl2)
0–10 21 6 189 2202.4 0.18 1.069 6.910–30 23 9 246 826.0 0.10 0.845 7.6
Starting crown rotWheat stubble was collected and plated pre-sowing. Results indicated a 10% infection level in the crown and 18% infection in the first node of the stubble above ground. As such, it was rated as a low risk for crown rot and no further stubble collection was warranted.

AG
RO
NO
MY
34 | NORTHERN GRAINS RESEARCH RESULTS 2016
Rainfall 2015
Table 2. In-crop rainfall (mm) at “Koiwon” Bellata
Jan Feb Mar Apr May Total
0 0 10.5 19 0 29.5
TreatmentsHybrids MR Apollo (low tillering and high SG)
MR 43 (moderate SG and tillering) MR Bazley (high tillering and low SG)
Row configuration Solid on 1 m spacings Single skip Double Skip Superwide (1.5 m spacings)
Plant populations Populations were targeted using germination for each hybrid and an estimated establishment of 80%. Three populations were targeted in each of the row configurations: 15,000 plants/ha 30,000 plants/ha 50,000 plants/ha
ResultsThroughout tables values followed by the same letter are not significantly different at the 95% confidence level (P=0.05).
Plant establishmentThe trial established reasonably well, but achieved plant populations were below the targets (Table 3). Significant differences between the treatments were evident though. There were also differences in establishment between the hybrids with MR Apollo establishing fewer plants than MR 43 and MR Bazley (Table 4). There was no impact of row configuration on plant establishment (data not shown).
Table 3. Target plant population versus established plant population
Target population (plants/ha)
Established population (plants/ha)
15,000 13,220 c30,000 26,520 b50,000 37,190 a
Table 4. Impact of sorghum hybrid on established plant population
Hybrid Established population (plants/ha)
MR Apollo 23,030 bMR 43 26,420 aMR Bazley 27,470 a
TilleringTiller counts revealed significant differences in all three treatments: configuration, plant population and hybrid. The number of tillers per m2 declined as the row configuration widened (Table 5). This was not surprising as there is less competition between plants in the solid rows compared with the double skip configuration. The same relationship was also evident for the number of tillers per plant, with fewer tillers as the effective row spacing widened (Table 5).

AG
RO
NO
MY
INDEPENDENT RESEARCH FOR INDUSTRY | 35
Table 5. Row configuration effect on tillering
Configuration Tillers (number/m2)
Tillers (number/plant)
Solid 3.94 a 1.69 aSuperwide 2.68 b 1.31 bSingle skip 2.60 bc 1.35 bDouble skip 2.03 c 1.10 c
The hybrids also performed as expected with MR Apollo producing the lowest number of tillers, followed by MR 43 and then MR Bazley producing the most tillers both per m2 and per plant (Table 6).
Table 6. Hybrid effect on tillering
Hybrid Tillers (number/m2)
Tillers (number/plant)
MR Apollo 2.30 c 1.17 bMR 43 2.72 b 1.29 bMR Bazley 3.42 a 1.63 a
As the plant population increased the number of tillers per m2 and per plant declined (Table 7). The effect on the number of tillers per plant was more dramatic than the overall tillers per m2, with the highest target population producing less than half the number of tillers when compared to the lowest target population.
Table 7. Target plant population effect on tillering
Target population (plants/ha)
Tillers (number/m2)
Tillers (number/plant)
15,000 3.09 a 2.08 a30,000 3.01 a 1.30 b50,000 2.34 b 0.70 c
Head productionThere was no evidence of significant effect from row configuration or plant population on the measured number of heads produced (data not shown). However, the sorghum hybrid MR Apollo produced fewer heads per m2 and per plant than MR Bazley, with MR 43 being intermediate between the two hybrids (Table 8).
Table 8. Hybrid effect on head production
Hybrid Heads (number/m2)
Heads (number/plant)
MR Apollo 3.13 b 1.50 bMR 43 3.47 ab 1.58 abMR Bazley 3.71 a 1.75 a
Varying plant population only impacted on the number of heads produced per plant with a declining number of heads as plant population increased (Table 9).
Table 9. Plant population effect on heads production
Target population (plants/ha)
Heads (number/plant)
15,000 2.33 a30,000 1.44 b50,000 1.07 c

AG
RO
NO
MY
36 | NORTHERN GRAINS RESEARCH RESULTS 2016
Dry matter productionDry matter production was measured at flowering; neither row configuration nor hybrid selection affected dry matter production (data not shown). Varying plant population did have an effect, with more dry matter produced by the higher target plant populations (Table 10).
Table 10. Plant population effect on dry matter production
Target population (plants/ha)
Dry matter (t/ha)
15,000 1.51 c30,000 2.50 b50,000 3.86 a
Grain yieldThe average grain yield at the site was 1.59 t/ha reflecting the dry finish to the season. Significant differences were still measured between plant population (Table 11) and hybrid selection (Table 12), but not between row configurations (data not shown). The low target plant population of 15,000 plants/ha was the highest yielding, followed by the 30,000 plants/ha and then the 50,000 plants/ha target populations (Table 11). Increasing the target plant population caused declining yields.
Table 11. Varying plant population effect on final grain yield
Target population (plants/ha)
Grain yield (t/ha @ 13.5% moisture)
15,000 1.81 a30,000 1.60 b50,000 1.35 c
At this site, grain yields declined as the hybrid’s tillering ability increased and the staygreen level decreased. Therefore, MR Apollo yielded the highest, followed by MR 43 and then MR Bazley (Table 12).
Table 12. Varying hybrid effect on final grain yield
Hybrid Grain yield (t/ha @ 13.5% moisture)
MR Apollo 1.71 aMR 43 1.59 bMR Bazley 1.45 c
Grain qualitySubsamples were collected from each plot at harvest and were used to measure grain quality parameters including grain protein, 1000 grain weight and test weight.
Grain protein averaged 11.08 %, indicating that there was sufficient nitrogen to achieve maximum yields. No treatments affected final grain protein levels (data not shown).
The test weight averaged 77.82 kg/ hectolitre (hL) showing the grain was sound. The highest yielding hybrid, MR Apollo, had the lowest test weight (Table 13), as did the lowest target plant population (Table 14). There was no difference in test weight between configurations except the superwide, which had a higher test weight (Table 15).
In contrast, MR Apollo had the highest 1000 grain weight (Table 13). Thousand grain weight also declined as plant population increased (Table 14).
Screenings were very low for all treatments at the site with no treatment above 5% (data not shown).

AG
RO
NO
MY
INDEPENDENT RESEARCH FOR INDUSTRY | 37
Table 13. Varying hybrid effect on grain quality
Hybrid Test weight (kg/hL)
1000 grain weight (grams)
MR Apollo 75.83 c 28.90 aMR 43 79.18 a 26.43 cMR Bazley 78.45 b 27.20 b
Table 14. Varying plant population effect on grain quality
Target population (plants/ha)
Test weight (kg/hL)
1000 grain weight (grams)
15,000 77.23 c 28.42 a30,000 78.41 a 27.53 b50,000 77.82 b 26.57 c
Table 15. Varying row configuration effect on grain quality
Configuration Test weight (kg/hL)
1000 grain weight (grams)
Solid 77.16 b 26.76 cSingle skip 77.14 b 27.43 bSuperwide 79.04 a 27.29 bcDouble skip 77.95 b 28.56 a
SummaryAt this site, in a season where starting soil moisture and in-crop rainfall were limited, it is not surprising that final sorghum grain yields were low. Under these low-yielding conditions, grain yield declined as plant population increased. Row configuration did not affect yield. Similarly, grain yield declined as the hybrids’ tillering ability increased and the staygreen level decreased, hence MR Apollo was the highest yielding sorghum hybrid at this site.
AcknowledgementsThis research was co-funded by NSW DPI and GRDC under project DAN00150: Improving the reliability of sorghum in the western zone, with support from Pacific Seeds. Thanks to Delphi Ramsden, Peter Formann (NSW DPI) and Nicole Carrigan and Angus Hombsch (formerly NSW DPI) for technical assistance and to Bruce Kirkby “Koiwon”, Bellata for hosting the trial site.

AG
RO
NO
MY
38 | NORTHERN GRAINS RESEARCH RESULTS 2016
Sorghum row direction × configuration × hybrid – Spring Ridge 2014–15Loretta Serafin, Mark Hellyer and Peter PerfrementNSW DPI, Tamworth
Key findingsRow direction was the only factor that affected final grain yield at this site in this season.
Sorghum sown in a north–south direction yielded 7% more than sowing east–west.
IntroductionSorghum is an important summer crop in north-eastern NSW, in particular on the Liverpool Plains where high sorghum yields under dryland conditions around 5–7 tonnes/ha on average are common. In these farming systems, where grower and advisor confidence in growing sorghum is high and a reasonable amount of other research has been conducted on general crop agronomy, the research emphasis is now focused on lifting yields by increments. This is in contrast to research in the drier, western zone where improving confidence and reliability in crop production are the paramount research focus.
The trial outlined below was designed to compare grain yield and quality responses with variations in row direction (north–south [NS] versus east–west [EW]) across a range of row configurations (to simulate various light interception orientations) and sorghum hybrids. A second site was planted in the 2014–15 season, located further north at Terry Hie Hie, east of Moree.
Site detailsLocation: “Niluan”, Spring RidgeCo-operator: Jim RussellSowing date: 28 October 2014Harvest date: 9 March 2015Plant population: Target of 50,000 plants/haPlanter: Monosem precision planterStarting soil waterThe site was cored pre-sowing to establish starting soil water. There was limited moisture at the start of the season with 133 mm of plant available water (PAW) for sorghum.
Starting nutritionThe site was cored just before sowing to determine starting soil nutrition (Table 1).
Table 1. Starting soil nutrition at “Niluan”, Spring Ridge
Depth (cm)
Nitrate (mg/kg)
Colwell P (mg/kg)
Colwell K (mg/kg)
Sulfur (mg/kg)
Organic carbon
(%)
Conductivity (dS/m)
pH (CaCl2)
0–10 177 45 699 3.6 1.34 0.435 7.610–30 54 19 330 3.2 1.00 0.333 7.9
TreatmentsRow direction North–south (NS)
East–west (EW)Hybrids MR Apollo
MR 43 84G22
Row configuration Solid on 1 m spacings Single skip Superwide (1.5 m spacings)
The trial was blocked by row direction, then by row configuration, and hybrids were randomised within blocks.

AG
RO
NO
MY
INDEPENDENT RESEARCH FOR INDUSTRY | 39
ResultsPlant structuresPlant establishment was lower than the target population of 50,000 plants/ha. On average, 30,900 plants/ha were established due to dry sowing conditions. However, establishment was quite uniform across all treatments with no differences detected.
The treatments also had no effect on the number of tillers or heads produced. On average, 59,600 heads/ha were produced across treatments.
Grain yieldThe average grain yield across the trial was 4.76 t/ha. Neither varying row configuration nor hybrid had any effect on final grain yield at this site in this season (Table 2). However, varying row direction had a significant impact, with the north–south direction out yielding the east–west direction by 0.31 t/ha or 7% (Table 2).
Table 2. Grain yield (corrected to 13.5 % moisture) across treatments at Spring Ridge 2014–15
Direction Configuration Hybrid Grain yield (t/ha)
East–west (4.60 t/ha)
Solid 84G22 4.42MR Apollo 4.98MR 43 5.23
Single skip 84G22 4.03MR Apollo 4.08MR 43 4.50
Superwide 84G22 4.58MR Apollo 4.80MR 43 4.83
North–south (4.91 t/ha)
Solid 84G22 5.25MR Apollo 5.36MR 43 4.40
Single skip 84G22 3.85MR Apollo 3.80MR 43 4.47
Superwide 84G22 5.41MR Apollo 5.64MR 43 6.04
n.s.dn.s.d = no significant difference at the P = 0.05 level
Grain qualityVarious treatments resulted in differing grain qualities. Grain protein averaged 11.05% across treatments. Hybrid grain protein levels varied from 84G22 at 11.19%, down to 11.04% and 10.92% for MR 43 and MR Apollo respectively.
There were also differences in the grain test weight associated with varying row configuration (Table 3) and hybrid selection (Table 4), but all treatments delivered grain above the receival standard (71.0 kg/hL).
Table 3. Varying row configuration effect on grain test weight
Configuration Test weight (kg/hL)
Solid 79.47 bSingle skip 80.55 aSuperwide 80.74 aValues followed by the same letter are not significantly different (P = 0.05)

AG
RO
NO
MY
40 | NORTHERN GRAINS RESEARCH RESULTS 2016
Table 4. Varying hybrid effect on grain test weight
Hybrid Test weight (kg/hL)
MR 43 81.12 a84G22 79.90 bMR Apollo 79.74 bValues followed by the same letter are not significantly different (P = 0.05)
SummaryAt this site, in this season, only row direction caused a significant difference in grain yield. The north–south treatment yielded 7% higher than the east–west treatment. The other treatments (varying row configuration or sorghum hybrid selection) caused no apparent differences in grain yield.
These are preliminary results and, as such, additional data from more sites and seasons is required to validate these preliminary findings.
Varying row direction might also not always be commercially possible or desirable, depending, for example, on paddock layout and slope.
AcknowledgementsThis research was co-funded by NSW DPI and GRDC under project DAN00195: Tactical sorghum and maize agronomy. Thanks to Delphi Ramsden (NSW DPI), Nicole Carrigan and Angus Hombsch (formerly NSW DPI) for technical assistance and to Jim Russell “Niluan”, Spring Ridge for hosting the trial site.

AG
RO
NO
MY
INDEPENDENT RESEARCH FOR INDUSTRY | 41
Sorghum row direction × configuration × hybrid – Terry Hie Hie 2014–15Loretta Serafin, Mark Hellyer and Peter PerfrementNSW DPI, Tamworth
IntroductionSorghum is an important summer crop in north-eastern NSW, where dryland sorghum yields of about 3–5 tonnes/ha on average are common. In these farming systems, where grower and advisor confidence in growing sorghum is high and a reasonable amount of other research has been conducted on general crop agronomy, the research emphasis is now focused on incrementally lifting yields. This is in contrast to research in the drier, western zone where improving confidence and reliability in crop production are the paramount research focus.
The trial outlined below was designed to compare grain yield and quality responses with variations in row direction (north–south versus east–west) across a range of row configurations (to simulate various light interception orientations) and sorghum hybrids. A second site was planted in the 2014–15 season, located further south at Spring Ridge on the Liverpool Plains.
Site detailsLocation: “Grattai East”, Terry Hie HieCo-operator: Michael LedinghamSowing date: 2 October 2014Harvest date: 4 March 2015Plant Population: Target of 50,000 plants/haPlanter: Monosem precision planterStarting nutritionThe site was cored just before sowing to determine starting soil nutrition (Table 1).
Table 1. Starting soil nutrition at “Grattai East”, Terry Hie Hie
Depth (cm)
Nitrate (mg/kg)
Colwell P (mg/kg)
Colwell K (mg/kg)
Sulfur (mg/kg)
Organic carbon
(%)
Conductivity (dS/m)
pH (CaCl2)
0–10 3 21 194 2.4 0.53 0.018 5.510–30 3 4 94 2.2 0.32 0.027 6.0
Treatments
Row direction North–south East–west
Hybrids MR Apollo MR 43 84G22
Row configuration Solid on 1 m spacing Single skip Superwide (1.5 m spacing)
The trial was blocked by row direction, then by row configuration, and hybrids were randomised within blocks.
ResultsPlant structuresPlant establishment was lower than the target population of 50,000 plants/ha. On average, 28,500 plants/ha were established. Differences were detected between the row configurations, but not between varying the row direction or hybrids (Table 2).
Key findingsVarying row direction (north–south vs east–west) had no effect in this trial in this season.
Row configuration did influence final grain yield with the solid plant out yielding the superwide and single skip treatments by 0.93–1.29 t/ha respectively.
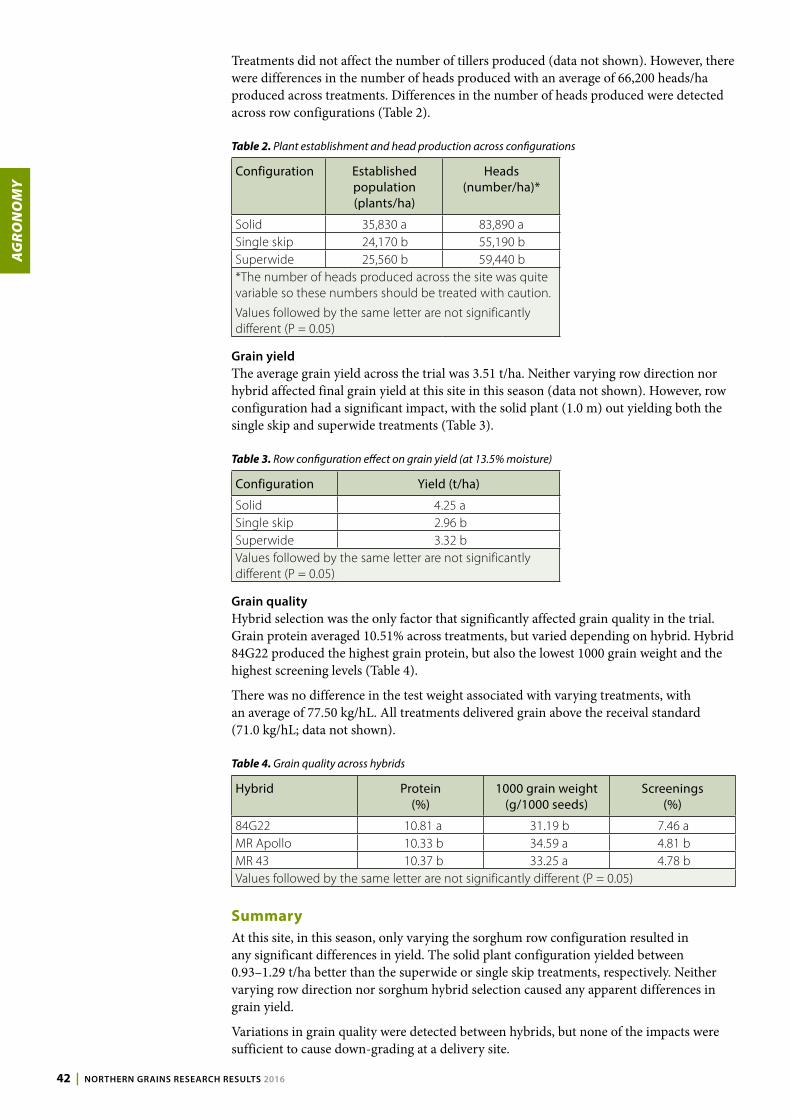
AG
RO
NO
MY
42 | NORTHERN GRAINS RESEARCH RESULTS 2016
Treatments did not affect the number of tillers produced (data not shown). However, there were differences in the number of heads produced with an average of 66,200 heads/ha produced across treatments. Differences in the number of heads produced were detected across row configurations (Table 2).
Table 2. Plant establishment and head production across configurations
Configuration Established population (plants/ha)
Heads (number/ha)*
Solid 35,830 a 83,890 aSingle skip 24,170 b 55,190 bSuperwide 25,560 b 59,440 b*The number of heads produced across the site was quite variable so these numbers should be treated with caution.
Values followed by the same letter are not significantly different (P = 0.05)
Grain yieldThe average grain yield across the trial was 3.51 t/ha. Neither varying row direction nor hybrid affected final grain yield at this site in this season (data not shown). However, row configuration had a significant impact, with the solid plant (1.0 m) out yielding both the single skip and superwide treatments (Table 3).
Table 3. Row configuration effect on grain yield (at 13.5% moisture)
Configuration Yield (t/ha)
Solid 4.25 aSingle skip 2.96 bSuperwide 3.32 bValues followed by the same letter are not significantly different (P = 0.05)
Grain qualityHybrid selection was the only factor that significantly affected grain quality in the trial. Grain protein averaged 10.51% across treatments, but varied depending on hybrid. Hybrid 84G22 produced the highest grain protein, but also the lowest 1000 grain weight and the highest screening levels (Table 4).
There was no difference in the test weight associated with varying treatments, with an average of 77.50 kg/hL. All treatments delivered grain above the receival standard (71.0 kg/hL; data not shown).
Table 4. Grain quality across hybrids
Hybrid Protein (%)
1000 grain weight (g/1000 seeds)
Screenings (%)
84G22 10.81 a 31.19 b 7.46 aMR Apollo 10.33 b 34.59 a 4.81 bMR 43 10.37 b 33.25 a 4.78 bValues followed by the same letter are not significantly different (P = 0.05)
SummaryAt this site, in this season, only varying the sorghum row configuration resulted in any significant differences in yield. The solid plant configuration yielded between 0.93–1.29 t/ha better than the superwide or single skip treatments, respectively. Neither varying row direction nor sorghum hybrid selection caused any apparent differences in grain yield.
Variations in grain quality were detected between hybrids, but none of the impacts were sufficient to cause down-grading at a delivery site.

AG
RO
NO
MY
INDEPENDENT RESEARCH FOR INDUSTRY | 43
These are preliminary results and, as such, additional data from more sites and seasons is required to validate these preliminary findings.
AcknowledgementsThis research was co-funded by NSW DPI and GRDC under project DAN00195: Tactical sorghum and maize agronomy. Thanks to Delphi Ramsden (NSW DPI), Nicole Carrigan and Angus Hombsch (formerly NSW DPI) for technical assistance. Thanks to Michael Ledingham “Grattai East” Terry Hie Hie for hosting the trial site and Gavin McDouall, HMAg for assistance during the season.

AG
RO
NO
MY
44 | NORTHERN GRAINS RESEARCH RESULTS 2016
Sunflower contribution of leaves to grain yield and quality – Pine Ridge 2014–15Loretta Serafin, Mark Hellyer and Peter PerfrementNSW DPI, Tamworth
IntroductionSunflowers are a minor crop in the northern grains region. However, they play an important role in providing a broadleaf summer crop rotation option. Sunflower leaves are the power plant driving yield and oil contents. The sunflower plant produces on average between 2,000–6,000 cm2 of leaf area.
Identifying which leaves contribute most towards yield and oil content helps growers make decisions about disease, pest and general crop management for sunflowers. Whether it is because the crop is infected with a disease such as powdery mildew, or suffering insect damage e.g. loopers, the end result is a need to know where and when to invest money in crop protection to achieve the best economic return on investment to maintain the green leaf area.
Site detailsLocation: “Windy Station”, Pine RidgeCo-operator: Peter WintonSowing date: 23 September 2014Plant Population: Target of 35,000 plants/haFertiliser: 50 units N as anhydrous ammonia and 100 kg/ha of Pasture S42Harvest date: 27 February 2015Hybrid: Ausigold 62Planter: Monosem precision planterStarting soil waterThe site was cored pre-sowing to establish starting soil water, which was measured as 125 mm of plant available water (PAW) to 1.2 m deep.
Starting nutrition and nematodesThe site was cored just before sowing to determine starting soil nutrition (Table 1). The available soil nitrate N was estimated at 128 kg N/ha to 1.2 m deep. Soil nematode testing using PreDicta B® found no Pratylenchus thornei and 0.7 Pratylenchus neglectus per g soil, which represents a low-risk population level.
Table 1. Starting soil nutrition at “Windy Station”, Pine Ridge
Depth (cm)
Nitrate (mg/kg)
Colwell P (mg/kg)
Colwell K (mg/kg)
Sulfur (mg/kg)
Organic carbon
(%)
Conductivity (dS/m)
pH Level (CaCl2)
0–10 14 72 593 5.9 1.46 0.130 6.510–30 10 19 305 6.8 1.06 0.209 7.530–60 9 19 232 17.3 0.69 0.266 7.760–90 7 32 241 13.1 0.69 0.315 8.090–120 5 38 254 17.0 0.52 0.372 8.0
TreatmentsThe trial aimed to quantify the contribution of sunflower leaves to yield and oil quality by applying nine leaf defoliation treatments.
1. Control
2. Budding – total leaf loss
3. Budding – remove top 10 leaves (1/3)
Key findingsThe more area of leaf removed, the greater the yield loss in sunflowers.
The greatest effect on yield was from total leaf defoliation at the start of flowering or the end of flowering, which reduced yield by 1.16 t/ha (78%) and 1.02 t/ha (66%) compared to the control.
Removing the top 10 leaves at the end of flowering had no effect on grain yield or any of the quality parameters measured.

AG
RO
NO
MY
INDEPENDENT RESEARCH FOR INDUSTRY | 45
4. Start of flowering – remove top 10 leaves (1/3)
5. Start of flowering – remove top 20 leaves (2/3)
6. Start of flowering – total leaf loss
7. Flowering complete – remove top 10 leaves (1/3)
8. Flowering complete – remove top 20 leaves (2/3)
9. Flowering complete – total leaf loss.
Treatments were applied on the following dates:• Budding – 24 November, 2014• Start of flowering – 15 December, 2014• Start of grain fill – 22 December, 2014Each treatment was applied by cutting off the leaves using secateurs, but leaving the leaf axil intact.
ResultsPlant structuresNo treatment affected the sunflower plant height, however, head diameter and head arc length were both affected (Table 2).
The greatest effects on head diameter were from total leaf removal at the start of flowering or at the end of flowering. Removing the top 10 leaves at either budding, the start of flowering or the completion of flowering had no effect on head diameter compared with the control. Neither did removing the top 10 leaves at the completion of flowering.
There were minimal impacts on head arc length from the treatments, with only the total leaf loss at budding or the start of flowering resulting in reduced arc length (Table 2).
Table 2. Sunflower plant structure impacts from nine leaf defoliation treatments
Treatment Head diameter (cm)
Head arc length (cm)
1. Control 16.13 ab 20.00 a2. Budding – total leaf loss 11.65 cd 15.33 b3. Budding – remove top 10 leaves (1/3) 14.33 abc 22.02 a4. Start of flowering – remove top 10 leaves (1/3) 17.27 a 22.07 a5. Start of flowering – remove top 20 leaves (2/3) 13.40 bc 20.17 a6. Start of flowering – total leaf loss 9.80 d 17.13 b7. Flowering complete – remove top 10 leaves (1/3) 16.47 a 22.07 a8. Flowering complete – remove top 20 leaves (2/3) 15.07 ab 21.40 a9. Flowering complete – total leaf loss 11.87 cd 20.80 aValues followed by the same letter are not significantly different (P = 0.05)
Grain yield and qualityThe average grain yield across the trial was 0.97 t/ha. Total leaf defoliation at the start of flowering or the end of flowering had the greatest effect on yield, which was reduced by 1.16 t/ha (78%) and 1.02 t/ha (66%) compared with the control (Table 3). Removing the top 10 leaves at the end of flowering did not affect grain yield or any of the quality parameters.
Total leaf removal at the start or end of flowering also had the greatest effect on test weight and oil content (Table 3).

AG
RO
NO
MY
46 | NORTHERN GRAINS RESEARCH RESULTS 2016
Table 3. Impact of leaf defoliation treatments on grain yield (at 9% moisture) and quality
Treatment Grain yield (t/ha)
1000 grain weight (g)
Test weight (kg/hL)
Oil content (%)
1. Control 1.54 a 54.79 a 44.61 ab 41.6 ab2. Budding – Total leaf loss 0.74 c 38.83 e 44.75 a 42.37 a3. Budding – remove top 10 leaves (1/3) 1.18 b 53.83 ab 43.07 c 41.47 ab4. Start of flowering – remove top 10 leaves (1/3) 1.24 b 51.08 abc 43.83 abc 41.1 ab5. Start of flowering – remove top 20 leaves (2/3) 0.81 c 47.51 cd 43.31 bc 39.4 c6. Start of flowering – Total leaf loss 0.35 d 44.77 d 38.44 e 37.4 d7. Flowering complete – remove top 10 leaves (1/3) 1.38 ab 50.01 abcd 43.23 bc 41.33 ab8. Flowering complete – remove top 20 leaves (2/3) 0.92 c 48.71 bcd 40.99 d 40.7 bc9. Flowering complete – Total leaf loss 0.52 d 37.52 e 34.49 f 36.67 dValues followed by the same letter are not significantly different (P = 0.05)
SummaryTotal leaf loss at the start or end of flowering had major impacts on yield and grain quality parameters compared with the control. Not only were grain yields reduced by 66–78%, there was also a significant effect on oil content, which was sufficient to cause major reductions in grain price as the oil content fell below the receival standard of 40% for oilseed sunflower.
In contrast, removing the top 10 leaves at the end of flowering did not affect grain yield or any of the quality parameters. This could have potential implications around the need for disease and insect control around this growth stage.
Repeating this trial at other locations and in other seasons will help to validate this preliminary data set.
AcknowledgementsThis research was co-funded by NSW DPI and GRDC under project DAN00197: Tactical agronomy for minor oilseeds – sunflower, safflower and linseed. Thanks to Peter Winton “Windy Station” and Peter McKenzie for assistance with the site. Thanks to Nuseed and Neil Weier for supplying trial seed. The technical assistance of the following NSW DPI staff are gratefully acknowledged: Delphi Ramsden, Michael Dal Santo, and former staff: Nicole Carrigan and Angus Hombsch.

AG
RO
NO
MY
INDEPENDENT RESEARCH FOR INDUSTRY | 47
Maize row configuration × population × hybrid – Spring Ridge 2014–15Loretta Serafin, Mark Hellyer and Peter PerfrementNSW DPI, Tamworth
IntroductionDryland maize production has declined dramatically in northern NSW since the 1900s. Grain sorghum has largely replaced maize due to greater reliability in yields and higher economic returns. Dryland maize still remains a small component of rotations on the Liverpool Plains and also east of Moree. Research data to support current and future dryland maize production is limited, hence a series of experiments were designed to provide baseline agronomic data.
The trial outlined below was designed to compare grain yield and quality responses to variations in row configurations, plant population and hybrid selection. Two other sites were planted in the 2014–15 season with one east of Moree and the other north-west of Moree. However, due to dry conditions, the data was not useable.
Site detailsLocation: “Niluan” Spring RidgeCo-operator: Jim RussellSowing date: 28 October 2014Harvest date: 9 March 2015Planter: Monosem precision planterStarting soil waterThe site was cored pre-sowing to establish starting soil water. There was limited moisture at the start of the season with 133 mm plant available water (PAW) for maize.
Starting nutritionThe site was cored just before sowing to determine starting soil nutrition (Table 1).
Table 1. Starting soil nutrition at “Niluan” Spring Ridge
Depth (cm)
Nitrate (mg/kg)
Colwell P (mg/kg)
Colwell K (mg/kg)
Sulfur (mg/kg)
Organic carbon
(%)
Conductivity (dS/m)
pH (CaCl2)
0–10 177 45 699 3.6 1.34 0.435 7.610–30 54 19 330 3.2 1.00 0.333 7.9
TreatmentsRow configuration 1. Solid 75 cm
2. Solid 100 cm 3. Single skip 100 cm
Plant populations 1. 15,000 plants/ha 2. 30,000 plants/ha 3. 50,000 plants/ha
Hybrids 1. P1467 2. PAC 624 3. P1070
The trial was blocked by row configuration, then plant population; hybrids were randomised within blocks.
ResultsWith all tables, values followed by the same letter are not significantly different at the 95% confidence levels (P=0.05).
Key findingsThe solid 75 cm or single skip row configurations produced the highest yields at this site in this season.
Plant population also affected yield and grain quality, with the 15,000 plants/ha or 30,000 plants/ha treatments providing the best outcomes.
The maize hybrid P1070 performed best at this site in this season. The larger plant biomass hybrid PAC624 struggled under the tough dryland conditions at this site.

AG
RO
NO
MY
48 | NORTHERN GRAINS RESEARCH RESULTS 2016
Plant structuresPlant establishment was better than anticipated, with established populations higher than the target populations (Table 2). There was no difference in plant establishment between the three hybrids or row configurations.
Varying plant population also resulted in differences in the number of cobs produced per hectare and per plant, with the highest number of cobs produced in the 30,000 target plant population treatment (Table 2).
Table 2. Plant population effect on plant structures
Target population (plants/ha)
Established population (plants/ha)
Cobs (number/ha)
Cobs (number/plant)
15,000 20,490 c 25,190 c 1.26 b30,000 35,190 b 57,410 a 1.64 a50,000 57,470 a 47,040 b 0.82 c
There were differences in the tillering ability of the three hybrids, with P1070 producing a lower number of tillers/m2 than P1467, but produced an equivalent number of cobs per plant (Table 3).
Table 3. Hybrid effect on plant structures
Hybrid Tillers (number/m2)
Tillers (number/plant)
Cobs (number/plant)
P1070 0.15 b 0.04 b 1.33 aPAC 624 0.26 b 0.07 ab 1.10 bP1467 0.42 a 0.13 a 1.30 a
Grain yieldThe average grain yield at the site was 1.83 t/ha. There were significant differences in response to plant population, hybrid and row configuration. The solid 75 cm and single skip treatments yielded the best (Table 4). At this site in this season, the higher the plant population the lower the grain yield; however statistically there was no difference in the yield of the 15,000 and 30,000 plant/ha populations (Table 5).
Table 4. Row configuration effect on grain yield and quality
Row configuration Yield (t/ha)
Solid 75 cm 1.91 aSolid 100 cm 1.74 bSingle skip (100 cm) 1.84 ab
Table 5. Plant population effect on grain yield and quality
Target population (plants/ha)
Yield (t/ha)
1000 grain weight (grams)
15,000 2.04 a 276.6 a30,000 1.88 a 228.6 b50,000 1.58 b 212.8 c
Hybrid performance differed, with P1070 out yielding P1467 and the larger biomass plant type PAC624 (Table 6). There was no apparent correlation between the number of tillers per plant and final yield.

AG
RO
NO
MY
INDEPENDENT RESEARCH FOR INDUSTRY | 49
Table 6. Hybrid effect on grain yield and quality
Hybrid Yield (t/ha) 1000 grain weight (grams)
P1070 2.22 a 229.3 bP1467 1.80 b 230.6 bPAC624 1.48 c 258.1 a
There was also a significant interaction between plant population and hybrid. Typically, each hybrid obtained their highest or equal highest yield at the lowest target plant population (Table 7).
Table 7. Grain yield across the interaction of hybrid × plant population at Spring Ridge 2014–15
Target population (plants/ha)
Hybrid
P1070 P1467 PAC624
15,000 2.30 a 1.93 b 1.88 b30,000 2.31 a 1.99 ab 1.34 c50,000 2.05 ab 1.46 c 1.23 c
Grain qualityThere were differences in the grain quality produced with some of the treatments. The 1000 grain weight declined as the target plant population increased (Table 5). Generally, 1000 grain weight increased as grain yield declined; the hybrid PAC624 therefore had a higher 1000 grain weight than the other two hybrids evaluated (Table 6).
SummaryThe solid 75 cm or single skip row configurations produced the highest maize yields at this site in this season. Differences were also evident with varying plant population and hybrid. At this site in this season the best yields were obtained from either the 15,000 plants/ha or 30,000 plants/ha target plant population treatment using the maize hybrid P1070.
Overall, site yields were not very high, on average 1.83 t/ha as a result of the limited starting soil water and the hot, dry finish to the season.
AcknowledgementsThis research was co-funded by NSW DPI and GRDC under project DAN00195: Tactical sorghum and maize agronomy. Thanks to Delphi Ramsden (NSW DPI), Nicole Carrigan and Angus Hombsch (formerly NSW DPI) for technical assistance and to Jim Russell “Niluan” Spring Ridge for hosting the trial site.

AG
RO
NO
MY
50 | NORTHERN GRAINS RESEARCH RESULTS 2016
Sunflower row configuration × population × hybrid – Pine Ridge 2014–15Loretta Serafin, Mark Hellyer and Peter PerfrementNSW DPI, Tamworth
IntroductionSunflowers are a minor crop in the northern grains region. However, they play an important role in providing a broadleaf summer crop rotation option. Agronomic research in sunflowers has been limited over the past 20 years. As a result, the majority of current commercial practices have been adopted through ‘best bet’ recommendations. GRDC and NSW DPI started a three-year project in 2014 to develop data sets to provide scientific research to investigate new practices to further help develop minor oilseed crops, namely safflower, linseed and sunflower.
The trial outlined below was designed to compare grain yield and oil responses with variations in row configurations, plant population and hybrid selection. One other site was planted in the 2014–15 season north-west of Moree.
Site detailsLocation: “Windy Station”, Pine RidgeCo-operator: Peter WintonSowing date: 23 September 2014Fertiliser: 50 units N as anhydrous ammonia and 100 kg/ha of Pasture S42Harvest date: 27 February 2015Hybrid: Ausigold 62Planter: Monosem precision planterStarting soil waterThe site was cored pre-sowing to establish starting soil water. It was measured as 125 mm of plant available water (PAW) to a depth of 1.2 m.
Starting nutrition and nematodesThe site was cored just before sowing to determine starting soil nutrition (Table 1). The available soil nitrate nitrogen (N) was estimated at 128 kg N/ha to a depth of 1.2 m. Soil nematode testing using PreDicta B® found no Pratylenchus thornei and 0.7 Pratylenchus neglectus per g soil, which represented a low risk population level.
Table 1. Starting soil nutrition at “Windy Station”, Pine Ridge
Depth (cm)
Nitrate (mg/kg)
Colwell P (mg/kg)
Colwell K (mg/kg)
Sulfur (mg/kg)
Organic carbon
(%)
Conductivity (dS/m)
pH Level (CaCl2)
0–10 14 72 593 5.9 1.46 0.130 6.510–30 10 19 305 6.8 1.06 0.209 7.530–60 9 19 232 17.3 0.69 0.266 7.760–90 7 32 241 13.1 0.69 0.315 8.090–120 5 38 254 17.0 0.52 0.372 8.0
TreatmentsRow configuration 1. Solid 75 cm
2. Solid 100 cm 3. Superwide 150 cm
Plant populations 1. 25,000 plants/ha 2. 35,000 plants/ha 3. 45,000 plants/ha
Key findingsYields from the 35,000 plants/ha and 45,000 plants/ha target plant populations were significantly higher than the 25,000 plants/ha treatment (by 0.52–0.56 t/ha). Plant population did not affect oil content.
The solid 75 cm treatment achieved a yield significantly higher than the solid 100 cm and superwide (150 cm) configurations. Varying row configuration did not affect oil content.
Ausigold 62 and Hyoleic 41 produced higher yields than the experimental sunflower hybrid. Ausigold 62 had significantly higher oil content than the other two hybrids evaluated.

AG
RO
NO
MY
INDEPENDENT RESEARCH FOR INDUSTRY | 51
Hybrids 1. Ausigold 62 2. Hyoleic 41 3. T30152 (a Pacific Seeds experimental line)
The trial was blocked by row configuration, then plant population; hybrids were randomised within blocks.
ResultsNote: in all tables, values followed by the same letter are not significantly different at the 95% confidence levels (P=0.05).
Plant structuresPlant establishment was close to the target populations with the exception of the 45,000 plants/ha treatment, which was quite a bit lower than desired at just under 37,000 plants/ha. However, significant differences were established between the three population treatments (Table 2).
The lowest target plant population of 25,000 plants/ha, produced the largest head diameters and head arc lengths (Table 2).
Table 2. Varying plant population effect on plant establishment and structures
Target population (plants/ha)
Established population (plants/ha)
Head diameter (cm) Average head arc length (cm)
25,000 23,150 c 18.50 a 24.70 a35,000 32,560 b 16.85 b 22.99 b45,000 36,980 a 16.71 b 23.08 b
There was no difference between the solid configurations for plant establishment; however, the plant establishment in the superwide treatment was significantly lower (Table 3).
The plants in the superwide treatment grew significantly taller than in the solid 75 cm and solid 100 cm treatments. This is not unusual as the wider row spacing means additional plants within the row, creating extra competition for light interception. Under these conditions, plants tend to grow taller and lean more into the area between the rows to gain access to sunlight and water. This also translated into larger head diameters and arc lengths for the superwide treatment (Table 3).
Table 3. Varying row configuration effect on plant establishment and structures
Row configuration Established population (plants/ha)
Plant height (cm)
Head diameter (cm)
Head arc length (cm)
Solid 75 cm 35,800 a 146.2 b 16.60 b 22.81 cSolid 100 cm 33,310 a 149.3 b 17.00 b 23.39 bSuperwide 150 cm 24,570 b 156.7 a 18.46 a 24.58 a
Hybrid plant establishment was similar for Hyoleic 41 and Ausigold 62, but lower for the experimental sunflower line T30152 (Table 4). Hyoleic 41 was significantly taller than the other two hybrids, but produced the smallest average head diameter and head arc length. The experimental line T30152 produced the largest average head diameters and head arc lengths, most likely in response to the lower plant population.
Table 4. Varying hybrid effect on plant establishment and structures
Hybrid Established population (plants/ha)
Plant height (cm)
Head diameter (cm)
Head arc length (cm)
Hyoleic 41 32,900 a 157.1 a 15.34 c 21.41 cAusigold 62 32,590 a 147.7 b 17.24 b 23.94 bT30152 27,190 b 147.2 b 19.48 a 25.42 a

AG
RO
NO
MY
52 | NORTHERN GRAINS RESEARCH RESULTS 2016
Grain yield, quality and oil contentThe average yield in the trial was 2.68 t/ha, which is quite high for a dryland sunflower crop. Significant differences were found between all the three treatments: plant population, row configuration and hybrid for yield, but not for oil content. The average oil content was 40.37%, which is just above the receival standard of 40%.
Yields from the 35,000 plants/ha and 45,000 plants/ha target plant population were significantly higher than the 25,000 plants/ha treatment (by 0.52–0.56 t/ha). The 35,000 plants/ha and 45,000 plants/ha treatments performed similarly for 1000 grain weight and test weight, but produced a lower grain weight and a higher test weight than the 25,000 plants/ha treatment (Table 5).
Table 5. Varying plant population effect on yield and quality
Target population (plants/ha)
Yield (t/ha @ 9% moisture)
1000 grain weight (grams)
Test weight (kg/hL)
25,000 2.32 b 68.86 a 41.35 b35,000 2.88 a 62.89 b 42.91 a45,000 2.84 a 61.26 b 43.33 a
The solid 75 cm treatment achieved a yield significantly higher than the other two row configurations. However, the superwide treatment had the highest 1000 grain weight (Table 6). Row configuration had no effect on test weight or oil content (data not shown).
Table 6. Varying row configuration effect on yield and quality
Row configuration Yield (t/ha @ 9% moisture)
1000 grain weight (grams)
Solid 75 cm 2.99 a 61.74 bSolid 100 cm 2.64 b 62.37 bSuperwide 150 cm 2.42 b 68.90 a
There was no significant difference in the yield of Hyoleic 41 and Ausigold 62 which were both higher yielding than the experimental line T30152. The two commercial hybrids had a lower 1000 grain weight than the experimental line T30152 (Table 7).
Ausigold 62 produced the highest test weight and oil content of the three hybrids and was the only hybrid to deliver oil content above the receival standard of 40% (Table 7).
Table 7. Varying hybrid effect on yield and quality
Hybrid Yield (t/ha @ 9% moisture)
1000 grain weight (grams)
Test weight (kg/hL)
Oil content (%)
Hyoleic 41 2.84 a 61.75 b 43.43 b 39.89 bAusigold 62 3.01 a 62.51 b 44.52 a 42.04 aT30152 2.19 b 68.76 a 39.63 c 39.17 c
SummaryThe highest yields in this trial were obtained from the solid plant 75 cm row configuration, which is the most common commercial row spacing on the Liverpool Plains. The 35,000 plants/ha and 45,000 plants/ha target plant populations, which established 32,560 and 36,980 plants/ha respectively, produced higher yields than the 25,000 plants/ha treatment, which established 23,150 plants/ha (by 0.52 –0.56 t/ha). Varying plant population had no effect on oil content.
The narrowest of the row configurations, the solid 75 cm treatment, achieved a yield significantly higher than the solid 100 cm or superwide (150 cm) configurations. The different row configurations had no effect on oil content. Differences between the sunflower hybrids were found for both yield and oil content. Ausigold 62 and Hyoleic 41 produced higher yields than the experimental hybrid. Ausigold 62 had significantly higher oil content than either of the other two hybrids.

AG
RO
NO
MY
INDEPENDENT RESEARCH FOR INDUSTRY | 53
AcknowledgementsThis research was co-funded by NSW DPI and GRDC under project DAN00197: Tactical agronomy for minor oilseeds – sunflower, safflower and linseed. Thanks to Peter Winton “Windy Station” and Peter McKenzie for assistance with the site. Thanks to Neil Weier, Nuseed and Tony McCumstie, Pacific Seeds for the supply of trial seed. The technical assistance of the following NSW DPI staff are gratefully acknowledged; Delphi Ramsden, Michael Dal Santo (NSW DPI), Nicole Carrigan and Angus Hombsch formerly (NSW DPI).

AG
RO
NO
MY
54 | NORTHERN GRAINS RESEARCH RESULTS 2016
Northern NSW pulse agronomy project – faba bean density experiments 2015Andrew Verrell1 and Leigh Jenkins2
1 NSW DPI, Tamworth 2 NSW DPI, Trangie
Key findingsFaba beans sown to target 20 plants/m2 appears to optimise yield in northern regions of NSW.
Faba beans sown to target 30 plants/m2 appears to optimise yield in central regions of NSW.
DozaA appears more prone to frost damage than either PBA WardaA or PBA NasmaA
IntroductionThe 2015 season was characterised by severe frost events, episodic cold weather during flowering and terminal drought during grain filling. These seasonal conditions severely affected crop performance, reducing the potential yield of faba beans across most areas of the northern NSW cropping zone.
The Northern Pulse Agronomy Initiative (NPAI; Winter Pulse) project conducted a range of experiments covering a number of different agronomic themes in 2015. This paper reports on the outcomes of a series of faba bean variety × density experiments across northern NSW.
Site detailsThis experiment was conducted at five experimental locations: Bullarah, Cryon and Tamworth in northern NSW and Coonamble and Trangie in central NSW.
TreatmentsThree faba bean varieties were sown; DozaA, PBA WardaA and the new line PBA NasmaA. Four target plant densities were examined; 10, 20, 30 and 40 plants/m2. All five trials were grown under dryland cropping conditions (i.e. not irrigated). The difference in seed size for these commercial lines is shown in Figure 1, where PBA NasmaA, on average, has seed that is 40% larger than DozaA.
ResultsFor grain yield, there were no significant interactions between variety and plant density, only main effects (Table 1). PBA Warda and PBA Nasma out yielded Doza at two of the five sites (Coonamble and Tamworth); while at Trangie, PBA Nasma out yielded both Doza and PBA Warda (Table 1). Plant density showed significant responses at two sites: yield at Cryon plateaued at 20 plants/m2, while at Trangie peak yield was obtained at 30 plants/m2 (Table 1). The remaining sites showed no yield response across different plant densities.
Table 1. Grain yield (kg/ha) for the main effects of variety and plant density at five locations in 2015
Treatment Grain yield (kg/ha)
Bullarah Coonamble Cryon Trangie Tamworth
VarietyDoza 1602 a 2900 b 1547a 2036 b 2954 bPBA Warda 1687 a 3280 a 1700 a 2246 b 3296 aPBA Nasma 1685 a 3452 a 1686 a 2658 a 3359 aDensity (plants/m2)10 1498 a 3376 a 1373 b 1975 c 3177 a20 1670 a 3411 a 1772 a 2275 b 3329 a30 1768 a 3246 a 1673 a 2515 a 3210 a40 1666 a 3270 a 1745 a 2489 a 3096 aValues with the same letter are not significantly different at P <0.05
Frosts were prevalent across the northern region in 2015 and the Tamworth site suffered a number of severe frosts. From 28 July to 8 August, six frosts were recorded ranging from −1.3 to −3.5 °C. The resulting frost damage included elongated stems that developed a bent stick (hockey stick) appearance and blackened leaf margins. Treatments were scored for frost damage on a 1–9 scale on 7 August, with one representing no frost damage and

AG
RO
NO
MY
INDEPENDENT RESEARCH FOR INDUSTRY | 55
nine equal to plant death. Frost damage symptoms were significantly worse for Doza than either PBA Warda or PBA Nasma (Figure 2).
0
10
20
30
40
50
60
70
80
Doza PBA Warda PBA Nasma
100
seed
wei
ght (
g)
Variety
Figure 1. Average 100 seed weight (g) for selected faba bean varieties
0
1
2
3
4
5
6
7
Doza PBA Warda PBA Nasma
Fros
t sco
re (1
–9)
Variety
Figure 2. Frost scores for faba bean varieties (1 = no symptoms, 9 = plant death) at Tamworth in 2015
SummaryLimited data from the first year of trial results in 2015 suggests that for northern and western sites, 20 plants/m2 is a preferred target plant density, while in central areas 30 plants/m2 is a better option to achieve optimum yield with faba bean grown under dryland cropping conditions.
Large seed does not necessarily confer higher yield, with PBA Nasma out yielding PBA Warda at only one location, Trangie, in 2015.
Doza appears more prone to frost damage than either PBA Warda or PBA Nasma. Frost tolerance is a key attribute for the faba bean breeding program in northern NSW, with new releases (particularly PBA Nasma) targeted at having better tolerance than Doza, which was apparent in these trials in 2015.
AcknowledgementsThe research undertaken as part of project DAN00171: Northern pulse agronomy initiative – NSW, is made possible by the significant contributions of growers through both trial co-operation and the support of the GRDC. The authors would like to thank them for their continued support. Thanks to Mat Grinter, Michael Nowland, Jayne Jenkins and Scott Richards (all NSW DPI) for their technical assistance in the trial program.
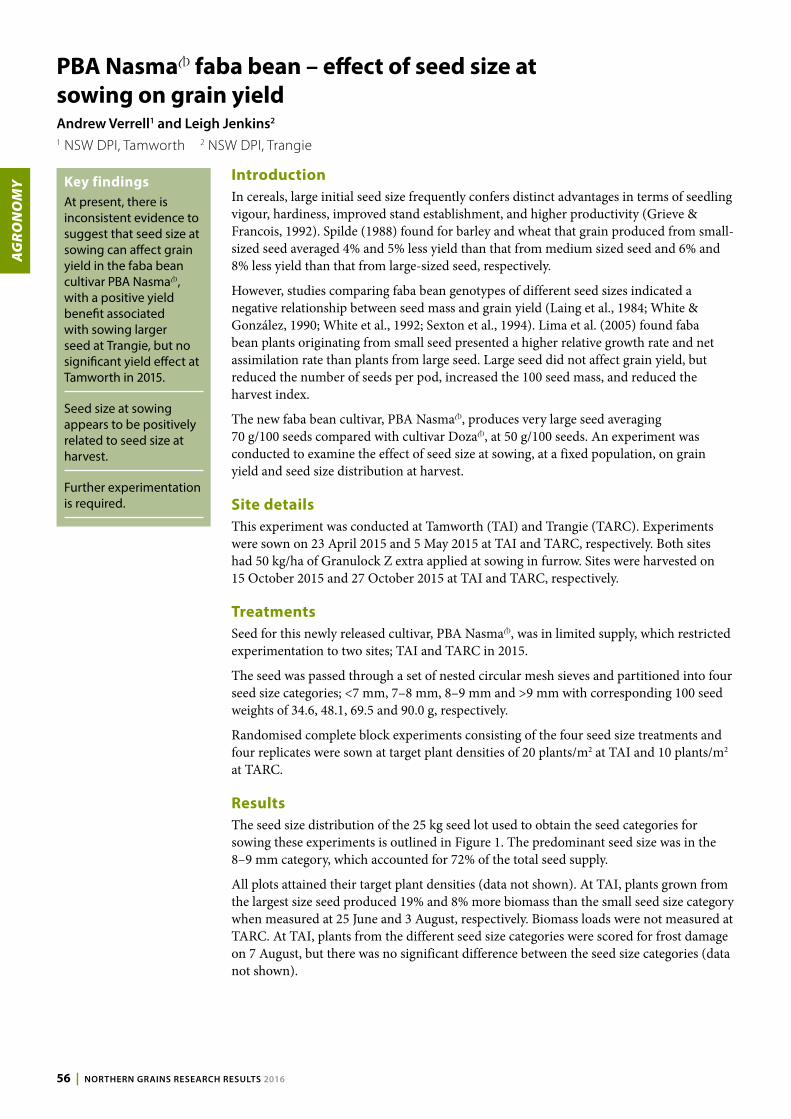
AG
RO
NO
MY
56 | NORTHERN GRAINS RESEARCH RESULTS 2016
PBA NasmaA faba bean – effect of seed size at sowing on grain yieldAndrew Verrell1 and Leigh Jenkins2
1 NSW DPI, Tamworth 2 NSW DPI, Trangie
Key findingsAt present, there is inconsistent evidence to suggest that seed size at sowing can affect grain yield in the faba bean cultivar PBA NasmaA, with a positive yield benefit associated with sowing larger seed at Trangie, but no significant yield effect at Tamworth in 2015.
Seed size at sowing appears to be positively related to seed size at harvest.
Further experimentation is required.
IntroductionIn cereals, large initial seed size frequently confers distinct advantages in terms of seedling vigour, hardiness, improved stand establishment, and higher productivity (Grieve & Francois, 1992). Spilde (1988) found for barley and wheat that grain produced from small-sized seed averaged 4% and 5% less yield than that from medium sized seed and 6% and 8% less yield than that from large-sized seed, respectively.
However, studies comparing faba bean genotypes of different seed sizes indicated a negative relationship between seed mass and grain yield (Laing et al., 1984; White & González, 1990; White et al., 1992; Sexton et al., 1994). Lima et al. (2005) found faba bean plants originating from small seed presented a higher relative growth rate and net assimilation rate than plants from large seed. Large seed did not affect grain yield, but reduced the number of seeds per pod, increased the 100 seed mass, and reduced the harvest index.
The new faba bean cultivar, PBA NasmaA, produces very large seed averaging 70 g/100 seeds compared with cultivar DozaA, at 50 g/100 seeds. An experiment was conducted to examine the effect of seed size at sowing, at a fixed population, on grain yield and seed size distribution at harvest.
Site detailsThis experiment was conducted at Tamworth (TAI) and Trangie (TARC). Experiments were sown on 23 April 2015 and 5 May 2015 at TAI and TARC, respectively. Both sites had 50 kg/ha of Granulock Z extra applied at sowing in furrow. Sites were harvested on 15 October 2015 and 27 October 2015 at TAI and TARC, respectively.
TreatmentsSeed for this newly released cultivar, PBA NasmaA, was in limited supply, which restricted experimentation to two sites; TAI and TARC in 2015.
The seed was passed through a set of nested circular mesh sieves and partitioned into four seed size categories; <7 mm, 7–8 mm, 8–9 mm and >9 mm with corresponding 100 seed weights of 34.6, 48.1, 69.5 and 90.0 g, respectively.
Randomised complete block experiments consisting of the four seed size treatments and four replicates were sown at target plant densities of 20 plants/m2 at TAI and 10 plants/m2 at TARC.
ResultsThe seed size distribution of the 25 kg seed lot used to obtain the seed categories for sowing these experiments is outlined in Figure 1. The predominant seed size was in the 8–9 mm category, which accounted for 72% of the total seed supply.
All plots attained their target plant densities (data not shown). At TAI, plants grown from the largest size seed produced 19% and 8% more biomass than the small seed size category when measured at 25 June and 3 August, respectively. Biomass loads were not measured at TARC. At TAI, plants from the different seed size categories were scored for frost damage on 7 August, but there was no significant difference between the seed size categories (data not shown).

AG
RO
NO
MY
INDEPENDENT RESEARCH FOR INDUSTRY | 57
0
10
20
30
40
50
60
70
80
<7 7–8 8–9 9–10 >10
Seed
dis
trib
utio
n (%
)
Seed size categories (mm)
Figure 1. Seed size distribution per category for PBA NasmaA
At TAI, the plants grown from <7 mm seed were significantly shorter than all other seed categories, while there was no difference in height to top pod across the seed categories (Table 1). There was also no significant difference in grain yield between any of the seed size categories. Hundred seed weight did vary significantly with the large seed category (>9 mm), on average, producing heavier grain than the small seed category (<7 mm).
At TARC, grain yield was significantly higher (13%) for the two large seed size categories compared with the very small seed category. Hundred seed weight at harvest was similar to seed size category at sowing as found at TAI with 100 seed weight generally increasing with larger sown seed size (Table 1).
Table 1. Effect of seed size category at sowing on plant height, height to top pod, grain yield and hundred seed weight for TAI and grain yield and hundred seed weight for TARC in 2015
Seed size category
Tamworth (TAI) Trangie (TARC)
Plant height (mm)
Height to top pod (mm)
Yield (kg/ha)
100 seed weight (g)
Yield (kg/ha)
100 seed weight (g)
<7 mm 1240 b 1000 a 3287 a 55.8 c 1696 c 48.1 d7–8 mm 1358 a 1124 a 3144 a 65.0 ab 1726 bc 50.9 c8–9 mm 1329 a 1030 a 3267 a 59.4 bc 1921 ab 55.2 b>9 mm 1376 a 1078 a 3557 a 68.8 a 2013 a 60.0 aValues with the same letter are not significantly different at P <0.05
SummaryPlants grown from large seeds were taller and had significantly more biomass than the plants grown from small seed. However, this did not translate into a significant difference in grain yield at TAI, but did in the TARC experiment. There could be an interaction between plant density and seed size given these different results (TAI targeted 20 plants/m2 while TARC only targeted 10 plants/m2). These results are similar to that of Agung and McDonald (1998) in South Australia, where yields for cultivar Fiord averaged about 4000 kg/ha, but were not consistently related to seed size, although the highest yielding faba bean varieties at their sites were large seeded.
The size of seed produced at harvest was positively related to seed size at sowing. The largest seed category at sowing produced the biggest size seed at harvest, while conversely the smallest seed category at sowing produced the littlest size seed at harvest at both experimental sites in 2015 (Table 1).
ReferencesAgung S, McDonald GK (1998). Effects of seed size and maturity on the growth and yield of faba bean (Vicia faba L.). Australian Journal of Agricultural Research 49: 79–88.
Grieve CM, Francois LE (1992). The importance of initial seed size in wheat plant response to salinity. Plant and Soil 147: 197–205.

AG
RO
NO
MY
58 | NORTHERN GRAINS RESEARCH RESULTS 2016
Laing DR, Jones PG, Davis JHC (1984). Common bean (Phaseolus vulgaris L.). In: Goldsworthy PR, Fisher NM (eds), The Physiology of Tropical Field Crops, pp. 305–351. John Wiley, New York, USA.
Lima ER, Santiago AS, AraújoII AP, Teixeira MG (2005). Effects of the size of sown seed on growth and yield of common bean cultivars of different seed sizes. Brazilian Journal of Plant Physiology 17.
Sexton PJ, White JW, Boote KJ (1994) Yield-determining processes in relation to cultivar seed size of common bean. Crop Science 34:84–91.
Spilde L A (1988). Influence of Seed Size and Test Weight on Several Agronomic Traits of Barley and Hard Red Spring Wheat. Journal of Production Agriculture 2: 169–172.
White JW, González A (1990) Characterization of the negative association between seed yield and seed size among genotypes of common bean. Field Crops Research 23:159–175.
White JW, Singh SP, Pino C, Rios BMJ, Buddenhagen I (1992) Effects of seed size and photoperiod response on crop growth and yield of common bean. Field Crops Research 28: 295–307.
AcknowledgementsThe research undertaken as part of project DAN00171: Northern pulse agronomy – NSW, is made possible by the significant contributions of growers through both trial co-operation and the support of the GRDC. The authors would like to thank them for their continued support. Thanks to Mat Grinter, Michael Nowland, Jayne Jenkins and Scott Richards (all NSW DPI) for their technical assistance in the trial program.

AG
RO
NO
MY
INDEPENDENT RESEARCH FOR INDUSTRY | 59
Integrated management of crown rot in a chickpea – wheat sequenceAndrew VerrellNSW DPI, Tamworth
Key findingsSow chickpea crops between standing wheat rows.
Sow the following wheat crop directly over the row of the chickpea crop from the previous year.
Keep wheat stubble intact and do not spread it across the soil surface.
This will maximise yield of both chickpea and wheat crops and reduce the incidence of crown rot in the wheat phase of the rotation sequence.
IntroductionCrown rot, caused by the stubble-borne fungus Fusarium pseudograminearum (Fp), remains a major limitation to winter cereal production across the northern grains region of Australia. Crop sequencing with non-host crops has proven to be one of the best means of reducing effects from crown rot (CR) infection (by 3.4–41.3%) and increasing wheat yield (by 0.24–0.89 t/ha) compared with a cereal–wheat sequence (Kirkegaard et al. 2004; Verrell et al. 2005). Inter-row sowing has been shown to reduce CR effects and increase yield, by up to 9%, in a wheat–wheat sequence (Verrell et al. 2009). Verrell et al. (2014) showed that using mustard–wheat and chickpea–wheat crop sequencing resulted in a 40–44% increase in wheat yield over a continuous wheat system under zero-tillage. Adding inter-row sowing increased wheat yield by a further 11–16%, depending on the row placement sequences.
Chickpea is the most prevalent break crop grown in sequence with wheat in the northern NSW region. Chickpea crops rely on using post-sow pre-emergent residual herbicides (groups C and H) for broadleaf weed control. A common commercial practice is to level the seeding furrow after sowing, usually with Kelly chains, to avoid risking herbicide residue concentrating in the furrows and causing damage. The consequence of this levelling is that any standing wheat residue, under a zero-tillage system, is shattered and spread across the entire soil surface. If this wheat residue is infected with Fp, then CR inoculum is no longer confined to the standing wheat rows.
There was a need to examine whether integrating row placement, stubble management, chickpea row spacing and a ground engaging tool would affect Fp incidence and grain yield in wheat in a chickpea–wheat sequence grown under a zero-tillage system.
Site detailsThis experiment was conducted at Tamworth over three years.
Parameter 2012 2013 2014
Soil type Red chromosol Red chromosol Red chromosolCrop Wheat Chickpea WheatSowing dates 31 May 26 June 23 MayFertiliser rate 100 kg N as urea
50 kg/ha starter Zn50 kg/ha starter Zn 100 kg N as urea
50 kg/ha starter ZnHarvest dates 30 November 2 December 10 NovemberPlant available water at sowing
88 mm 60 mm 52 mm
TreatmentsA three-year crop sequence experiment (wheat–chickpea–wheat) was established at Tamworth in 2012 to examine the effect of a ground engaging tool, chickpea row spacing, row placement and wheat residue management on the incidence of Fp and grain yield of a wheat crop.
In 2012, durum wheat (EGA BellaroiA) was sown into a cultivated paddock using a Trimble® RTK auto-steer system fitted to a New Holland TL80A tractor with narrow row crop tyres. The crop was sown with a disc seeder on 40 cm row spacing and bulk harvested with the residue cut at a uniform height of 24 cm.
In 2013, chickpea (cv. PBA HatTrickA) was sown at 80 kg/ha and treatments consisted of:• main plot – row placement (between or on 2012 wheat rows)• sub plot – stubble management (standing or slashed and spread)

AG
RO
NO
MY
60 | NORTHERN GRAINS RESEARCH RESULTS 2016
• sub-sub plot – row spacing (narrow 40 cm or wide 80 cm) • sub-sub-sub plots – ground engaging tools (Barton® single disc opener or Janke®
coulter-tyne-press wheel parallelogram).The stubble management treatment was applied after the plots were sown.
In 2014, wheat (cv. EGA GregoryA) was sown over the chickpea plots. Treatments consisted of:• sub-sub plot – row placement (between or on 2012 wheat rows)• sub-sub-sub plot – ground engaging tools (Barton® single disc opener or Janke®
coulter-tyne-press wheel parallelogram).
ResultsChickpea grain yield increased when sown with a disc opener (by 6%), on narrow rows (by 22%) and sown between the 2012 wheat rows (by 7%), but stubble management did not have an effect on chickpea yield at the main treatment level. However, stubble management had a significant interaction with row spacing where chickpeas sown on narrow rows (40 cm) into standing residue out yielded narrow rows where the residue had been slashed (by 6%) (Figure 1). There was no significant effect on chickpea yield when sown on wide rows (80 cm), whether the wheat residue was left standing or slashed.
800
900
1000
1100
1200
1300
1400
1500
Wide(80 cm)
Stand
Wide(80 cm)
Flat
Narrow(40 cm)
Flat
Narrow(40 cm)
Stand
Row spacing and stubble management
Chic
kpea
gra
in y
ield
(kg/
ha)
Figure 1. Effect of row spacing and wheat stubble management on chickpea grain yield (kg/ha)
In the 2014 wheat crop, sowing with a coulter-tyne-press wheel out yielded the disc opener (by 6.3%). Wheat row placement, relative to the 2012 wheat crop, had a significant interaction with the stubble treatment in the 2013 chickpea crop. Wheat sown into the space between the old wheat rows from 2012 with the stubble left standing in the 2013 chickpea crop resulted in the highest grain yield in 2014 (3718 kg/ha; Figure 2). This was significantly higher than the other row × stubble combinations: on-row × flat; on-row × standing; and between-row × flat, which yielded 3585, 3515 and 3487 kg/ha, respectively, and which were not significantly different from one another.
The incidence of Fp at harvest, as main effects, was lower where chickpeas had been sown between wheat rows (6.6%) compared with on the row (10.0%), and lower when stubble was left standing (6.4%) compared with spreading (9.9%). The type of ground engaging tool, row spacing in the previous chickpea crop or row placement of the 2014 wheat crop, had no significant main effect on the incidence of Fp at harvest. For the narrow row (40 cm) chickpea system, sowing on the old wheat row led to a significant increase in the incidence of Fp at harvest in the following wheat crop (11.8%) compared with sowing between the old wheat rows (5.8%).

AG
RO
NO
MY
INDEPENDENT RESEARCH FOR INDUSTRY | 61
3200
3300
3400
3500
3600
3700
3800
3900
Flat
Between
Stand
On
Flat
On
Stand
Between
Stubble management and row placement
Whe
at g
rain
yie
ld (k
g/ha
)
Figure 2. Effect of row placement (relative to the 2012 wheat crop) and stubble management in the 2013 chickpea crop on grain yield (kg/ha) in the 2014 wheat crop
Under the wide row (80 cm) chickpea system, row placement had no effect on Fp incidence (mean 7.5%). Sowing the 2013 chickpea crop between standing wheat rows, and the following wheat crop directly over the previous chickpea row and between the old wheat rows, resulted in the lowest incidence of Fp (4.6%) (Figure 3).
0
2
4
6
8
10
12
14
W-between
CP-between
W-on
CP-between
W-on
CP-on
W-between
CP-on
Row placement sequences
Fp in
cide
nce
at h
arve
st (%
)
Figure 3. The interaction of chickpea row placement (2013) and wheat row placement (2014) on the incidence of Fusarium pseudograminearum in wheat
Other row placement combinations: chickpea between wheat rows × wheat on-rows, chickpea on wheat rows × wheat on-rows, and chickpea on-rows × wheat between wheat rows resulted in Fp levels of 8.5, 9.4 and 10.2%, respectively (Figure 3).
SummaryAt Tamworth in 2013, sowing chickpea on narrow rows (40 cm) realised a 22% yield advantage over wide rows (80 cm). Also, sowing chickpeas between standing wheat rows resulted in a higher yield (by 6%) compared with sowing the crop then slashing the wheat stubble and spreading it across the surface. Growing chickpeas between standing wheat stubble has been shown to provide a yield advantage in previous studies, largely by reducing the incidence of aphid-transmitted viruses (Verrell & Moore, 2015).
The highest wheat yield (3718 kg/ha) came from sowing the wheat into the inter-row space of the old wheat crop (two years old) and keeping the stubble standing. Using a tyne also resulted in a yield advantage over a disc opener. When stubble was left standing, the Fp incidence was lower (6.4%) compared with spreading stubble across the surface (9.9%). Sowing the 2013 chickpea crop between standing wheat rows, and the following wheat crop directly over the previous chickpea row and between the old wheat rows, resulted in the lowest incidence of Fp (4.6%). Any stubble management practice that spreads residues into the inter-row space is likely to undo row placement benefits associated with

AG
RO
NO
MY
62 | NORTHERN GRAINS RESEARCH RESULTS 2016
reducing the incidence of crown rot infection as Fp inoculum is no longer confined to the standing wheat rows. The perceived crop safety benefits of levelling the seeding furrow after applying post-sow pre-emergent residual herbicides (groups C and H) in chickpeas needs to be balanced against potential impacts on chickpea yield and increased incidence of crown rot infection in the following winter cereal crop.
ReferencesVerrell AG, Simpfendorfer S, Nash P, Moore K (2005). Crop rotation and its effect on crown rot, common root rot, soil water extraction and water use efficiency in wheat. Proceedings 2005 GRDC Grains Research Update, Goondiwindi.
Verrell AG, Simpfendorfer S, Nash P, Moore K (2009). Can inter-row sowing be used in continuous wheat systems to control crown rot and increase yield? 13th Annual Symposium on Precision Agriculture in Australasia, UNE, Armidale.
Verrell A (2014) Managing crown rot through crop sequencing and row placement. GRDC. Available at: http://grdc.com.au/Research-and-Development/GRDC-Update Papers/2014/07/Managing-crown-rot-through-crop-sequencing-and-row-placement
Verrell A, Moore KJ (2015). Managing viral diseases in chickpeas through agronomic practices. Australian Agronomy Conference, Hobart.
AcknowledgementsThe research undertaken as part of project DAN00171: Northern pulse agronomy – NSW, is made possible by the significant contributions of growers through both trial co-operation and the support of the GRDC. The authors would like to thank them for their continued support. Thanks to Mat Grinter, and Michael Nowland for their technical assistance in the trial program.

CR
OP
PR
OTE
CTI
ON
INDEPENDENT RESEARCH FOR INDUSTRY | 63
Evaluation of a DNA tool to determine risk of chickpea Phytophthora root rotSean Bithell1, Kevin Moore1, Kristy Hobson1, Steve Harden1, Willy Martin2 and Alan McKay3
1 NSW DPI, Tamworth 2 QLD DAF, Warwick 3 SARDI, Adelaide
Key findingsIncreasing levels of inoculum (oospores/plant) of Phytophthora medicaginis (P. med) was strongly correlated with the decreasing yield of YorkerA, a moderately resistant chickpea variety.
An inoculum level of 660 oospores/plant (PreDicta B® >5000 P. med copies/g soil) at sowing significantly reduced yield compared with lower inoculum levels under both dryland and irrigated conditions.
Testing soil samples from grower paddocks in 2015 confirmed earlier results, that the PreDicta B® soil P. med test can identify P. med in commercial fields.
These findings provide further evidence that the PreDicta B® P. med test will be a useful tool for growers to determine their risk of Phytophthora root rot before sowing chickpeas.
Note: the SARDI PreDicta B® test for Phytophthora medicaginis is under development and is not yet available commercially.
IntroductionPhytophthora medicaginis, which causes chickpea Phytophthora root rot (PRR), is endemic and widespread in southern QLD and northern NSW. Under conducive conditions, PRR can cause 100% yield loss. The pathogen survives from season to season on chickpea volunteers, lucerne, native medics, sulla and as resistant structures (oospores) in roots and soil.
A PreDicta B® soil DNA test has been developed by the South Australian Research and Development Institute (SARDI) to quantify the amount of P. med DNA in soil samples and so provide a measure of the amount of P. med inoculum (infected root tissue and oospores) in paddocks. In this second season of studies, we assessed the test’s capability to: 1. predict the risk of PRR disease and potential yield losses in chickpea2. detect P. med inoculum in soil from commercial paddocks.
Site and experimental details Disease development and yield loss predictionLocation: Warwick, QLDSowing date: 10 June 2015Variety: YorkerA (moderate PRR resistance)Design: Plots 5 × 2.1 m with five replicatesSampling: P. med DNA in soil, disease symptoms, grain yieldIn-crop rainfall: 160 mmInoculum detectionSoil samples from paddocks in southern NSW, VIC and southern QLD, collected 2014. Glasshouse bioassay to bait P. med isolates from soil samples. SonaliA seedlings grown in a soil-sand mixture, P. med isolated from stem cankers. Soil P. med DNA analyses of a 400 g soil sample from each paddock
TreatmentsDisease development and yield loss predictionInoculum treatments: 0, 40, 130 and 660 P. med oospores per plant applied at sowingIrrigation treatments: in-crop supplementary irrigation, drylandInoculum detectionSoil samples from 43 paddocks and one P. med control sample
ResultsP. med inoculum level, PRR disease development and yield• Post sowing soil P. med DNA results differed significantly among the oospore
treatments, but also indicated that some P. med was already present at the site (Table 1).• On 13 October (end of flowering), the irrigated 130 and 660 oospores/plant treatments
had significantly more PRR than the dryland 130 and 660 oospores/plant treatments (Table 1). By 12 November (dryland treatments senescing), the irrigated 40, 130 and 660 oospores/plant treatments had significantly more PRR than the dryland 40, 130 and 660 oospores/plant treatments.
• The interaction of irrigation (to simulate a PRR conducive season) and oospore treatments on grain yield was complex as indicated in (Table 1 and Figure 1):
1. At low inoculum levels (zero and 40 oospores/plant), irrigation increased yield compared with dryland.
2. For medium inoculum (130 oospores/plant), irrigation had no significant effect on yield.

CR
OP
PR
OTE
CTI
ON
64 | NORTHERN GRAINS RESEARCH RESULTS 2016
3. For the highest inoculum level (660 oospores/plant), irrigation reduced yield compared with the dryland treatment.
These interactions suggest that at low PRR levels, the primary effect of irrigation is on yield, but at high PRR levels the primary effect is on disease development. However, these relationships are likely to vary from season to season due to differences in rainfall (Figure 1).
Table 1. Oospore and irrigation (D dryland, I irrigated) treatment, soil DNA P. med concentration, PRR assessment and yield in 2015 P. med inoculum level trial
Inoculum and irrigation treatment (oospores/plant)
P. med DNA concentration 11 June (DNA/g soil)
PRR rating 13 October
PRR stunted plants 12 November (cm row)
Grain yield (kg/ha)
D-0 342 1.1 16 3198D-40 1986 1.7 18 2961D-130 3051 2.0 88 3038D-660 5357 3.1 203 2402I-0 169 1.2 6 3914I-40 1765 1.8 78 3631I-130 2996 2.8 185 2966I-660 5925 4.2 395 1764LSD (P=0.05) 1092.6 0.58 46.4 480.7
Figure 1. Multiple regression for plot soil P. med concentrations at sowing vs. grain yield for dryland (white symbols, broken line) and irrigated (black symbols, solid line) treatments (model R2 = 0.745), treatment means presented
P. med DNA detection in soil from commercial paddocks• Ten of the 43 paddock soil samples produced PRR-like cankers on plants, P. med-like
cultures were isolated from eight samples from grower’s paddocks; P. med-like cultures were also isolated from the control soil, giving a total of nine P. med isolates. One of the samples produced cankers that were not caused by P. med.
• Of the 43 paddock soil samples (including the control soil), nine had positive P. med DNA results. Comparing the DNA results with the isolation results showed that most (8/9, 89%) samples that had positive DNA results also recovered P. med cultures, and that most (33/34, 97%) samples that had negative DNA results also did not recover P. med cultures (Table 2).
• Notably, one sample (LOU2), which recovered a P. med culture, was negative for P. med DNA.
• One sample (A) was positive for P. med DNA, but seedlings in all five cups remained healthy. This sample had a lower P. med DNA value (1,234 P. med copies/g soil) than other samples (range 2,443–813,436 P. med copies/g soil). Possible explanations for this result are: (i) more time might be required for symptoms to develop, or (ii) that the pathogen had died, but some DNA remained in the soil sample, which is what the PreDicta B® P. med test detected.

CR
OP
PR
OTE
CTI
ON
INDEPENDENT RESEARCH FOR INDUSTRY | 65
Table 2. Comparison of Phytophthora medicaginis (P. med) DNA detection in 43 soil samples and isolation success of P. med from Sonali chickpeas grown in these samples
43 samples analysed for P. med DNA
9/43 + P. med DNA 34/43 nil P. med DNA
43 soil samples baited with chickpeas for P. med
9/43 + P. med isolates 8/9 (positives) 1/34 (negatives)
34/43 nil P. med isolates 1/9 (false positives) 33/34 (false negatives)
SummaryP. med inoculum level, PRR disease and yieldCan the P. med DNA soil test predict the risk of Phytophthora root rot? Based on the results of this trial with Yorker (MR) and the 2014 Tamworth trial with Sonali (S), the answer is YES.
For Yorker, significant yield loss can be expected with starting (pre-sow sampling) inoculum levels above ca 3000 P. med DNA sequences/g soil (ca 130 oospores/plant). However, these values might need to be interpreted with some caution as seasonal conditions will modify outcomes, for instance, in a dry season less disease could develop from the same amount of inoculum.
As Phytophthora can reproduce rapidly and cause new infections over a relatively short period, there was concern that under PRR-conducive conditions (a wet season), low initial levels of inoculum could catch up to high initial levels and cause similar disease severity and yield loss. The 2015 season was wet, but not very wet. Under these conditions separation remained in the disease and yields of the low and high inoculum treatments.
P. med DNA detection in commercial paddocks and disease risk determinationThe second season of detection capability results for the soil P. med DNA test were again generally promising, with most samples with positive and negative P. med DNA results corresponding to expected P. med isolation results. However, results for some samples indicate that further work is required to i) identify what factors could contribute to false negative results and ii) determine if false positives are due to the presence of dead or inactive P. med DNA.
The DNA result for a soil sample collected from a paddock can only provide an indication of inoculum concentration and disease risk for the areas of the paddock that were sampled. Therefore, the spread and locations of sampling across a paddock will affect how representative DNA results are of an entire paddock. Because of the risk of rapid PRR disease build-up following wet conditions, it might be appropriate to treat a negative PreDicta B® test result as indicating a low risk rather than a nil risk, as the pathogen could still be in areas of the paddock that were not adequately sampled and so could still cause PRR and reduce chickpea yield.
Work in 2016 will evaluate maximising the probability of detecting P. med by targeting those areas of the paddock where P. med is more likely to occur. The pathogen thrives in soil with a high moisture content and so often occurs in low lying regions of paddocks where pooling after rain can occur. The pathogen also carries over from season to season on infected chickpea volunteers, lucerne and native medics. Including low lying areas and weedy areas of paddocks during PreDicta B® soil sampling could provide the best strategy for detecting P. med and so identify a paddock’s risk of developing PRR if a chickpea crop is sown.
AcknowledgementsThis research was co-funded by NSW DPI and GRDC under projects DAN00172: Managing Crop Disease – Improving chickpea pathogen resistance (PRR) and DAS00137: National improved molecular diagnostics for disease management. Thanks to Gail Chiplin (NSW DPI) and Kris King (QDAF) for technical support. The co-operation of growers and advisers in facilitating soil sample collection from their paddocks is also greatly appreciated.

CR
OP
PR
OTE
CTI
ON
66 | NORTHERN GRAINS RESEARCH RESULTS 2016
Comparing tank mixes of post-emergence herbicides on awnless barnyard grass (NSW pot experiment 2015)Tony Cook, Bill Davidson and Rebecca Miller NSW DPI, Tamworth
Research questions1. How effective are herbicide tank mixes for the control of BYG?2. How do herbicides applied as single treatments compare with tank mixing with
paraquat?3. Is there potential for tank mix treatments with paraquat to replace the current standard
practice of double knocking to control BYG?
AimsThe main aim of this experiment was to determine whether combining (i.e. tank mixing) some herbicides with paraquat provided additive or synergistic post-emergence control of awnless barnyard grass (BYG) compared with standard singular herbicide treatments such as atrazine, simazine, terbuthylazine, haloxyfop or Balance®. This data could possibly support an additional use pattern that allows tank mixing with paraquat to control established BYG plants. The commercial implication of finding a suitable tank mix treatment which maintains excellent control of fallow BYG infestations would be a single pass control strategy. This would alleviate the current need for a time consuming double knock approach to BYG control. Furthermore, using these new treatments will lessen glyphosate use, reducing selection pressure for glyphosate resistance.
MethodsSite• Tamworth: Tamworth Agricultural Institute glasshouseTreatments• Eleven herbicide treatments + one untreated controlGrowth stages• Late tillering (15 tillers) to inflorescence emergence (Z50–59)Pot size and design• 8 cm square pots one plant per pot, thinned down from two plants• Randomised complete block design of 12 treatments × six replicates (72 pots)• Pots moved outside for two weeks before herbicide application to simulate plants
grown under field conditions.Herbicide application• Herbicides were applied with a hand-held boom sprayer; water volume of 100 L/ha for
all herbicides. Uptake™ spray oil (0.5% v/v) used with all treatments.Herbicide timing• Herbicides treatments applied 30/11/2015: temperature 29 °C, wind 3 km/h, relative
humidity 42%.Measurements• Brownout score 3 days after treatment (DAT; rating system 0–10 where 0 = alive and
green and 10 = brown and completely dead)• Biomass control % (visual estimate) compared with untreated treatment at 14, 28 and
42 DAT• Plant counts of survivors 42 DAT• Destructive sampling of green biomass 42 DAT (dry weight).
Key findingsTank mixing systemic herbicides and paraquat appears to be an effective tactic to control mid to late tillering awnless barnyard grass (BYG).
Tank mixes could be a viable alternative to double knocking for BYG control, although further investigation is needed.

CR
OP
PR
OTE
CTI
ON
INDEPENDENT RESEARCH FOR INDUSTRY | 67
Treatments
Table 1. Herbicide treatments
Trt. No. Herbicide and rate per hectare Tank mix or single application
1 Untreated2 Balance® 100 g Single3 Balance® 100 g + Paraquat (250 g/L) 2 L Tank mix4 Atrazine (500 g/L) 6 L Single5 Atrazine (500 g/L) 6 L + Paraquat (250 g/L) 2 L Tank mix6 Simazine (500 g/L) 3 L Single7 Simazine (500 g/L) 3L+ Paraquat (250 g/L) 2 L Tank mix8 Terbuthylazine (750 g/kg) 1 kg Single9 Terbuthylazine (750 g/kg) 1 kg + Paraquat (250 g/L) 2 L Tank mix10 Haloxyfop (520 g/L) 300 mL Single11 Haloxyfop (520 g/L) 300 mL + Paraquat (250 g/L) 2 L Tank mix12 Paraquat (250 g/L) 2 L SingleNote: All treatments applied at 100 L/ha with TT 110-01 nozzles. All treatments had Uptake™ added at 0.5% v/v
Results Initial brownout scores indicate that there was some antagonism of paraquat with Balance®, haloxyfop and atrazine with significantly lower brownout of BYG compared with the paraquat only treatment (Figure 1).
All tank mix treatments resulted in excellent control of mid-late tillering BYG with control levels of 97–100% at 28 DAT (Figure 2) with no or very little green biomass remaining by 42 DAT (Figure 3). Paraquat applied as a standalone treatment gave excellent control of 96% at 28 DAT. The remaining standalone treatments did not reach commercially acceptable levels of control (Figure 2 and 3).
0 0
5.2
0.5
6.4
0.4
6.8
0.3
8.7
0.9
5.4
7.3
0
1
2
3
4
5
6
7
8
9
10
1 2 3 4 5 6 7 8 9 10 11 12
Herbicide treatment
Brow
nout
sco
re (0
–10)
Figure 1. Brownout score (0–10) three days after application of single herbicides or tank mixes with paraquat tank on awnless barnyard grass LSD (0.05) = 0.5

CR
OP
PR
OTE
CTI
ON
68 | NORTHERN GRAINS RESEARCH RESULTS 2016
0
32
98
29
100
10
100
5
100
49
97 96
0
20
40
60
80
100
120
1 2 3 4 5 6 7 8 9 10 11 12
Herbicide treatment
Biom
ass c
ontr
ol (%
)
Figure 2. Biomass control score (%) 28 days after application of single herbicides or tank mixes with paraquat on awnless barnyard grass LSD (0.05) = 5
7.7
2.3
0
3.5
0
5.9
0
5.7
0
4.9
0.2 0.40
1
2
3
4
5
6
7
8
9
1 2 3 4 5 6 7 8 9 10 11 12
Herbicide treatment
Gre
en b
iom
ass
(g)
Figure 3. Green biomass (g) 42 days after application of single herbicides or tank mixes with paraquat on awnless barnyard grass LSD (0.05) = 1.2
Plate 1. Balance® 100 g/ha compared to Balance® 100 g/ha + Paraquat 2 L/ha at 42 DAT
CR
OP
PR
OTE
CTI
ON
INDEPENDENT RESEARCH FOR INDUSTRY | 69
SummaryTank mixing systemic herbicides and paraquat appears to be an effective tactic to control mid to late tillering BYG. All of the tank mix treatments with paraquat performed at high levels of efficacy, whilst paraquat applied as a single treatment was comparable with these tank mixtures.
It is difficult to conclude that paraquat had a synergistic effect with the herbicides that were used in this experiment, as a single application of paraquat was not significantly different from the mixtures.
These results indicate that tank mixes with paraquat applied as a single spray could be a viable alternative for BYG control which would have the benefit of savings on the extra costs and time associated with sequential applications with double knock strategies. This will need to be confirmed under field conditions and compared with standard double knock treatments. In addition, the robustness of herbicide treatments should be determined when applied over a range of BYG growth stages.
AcknowledgementsThis research was funded by NSW DPI and GRDC under project UQ00080: New uses for existing chemistry.

CR
OP
PR
OTE
CTI
ON
70 | NORTHERN GRAINS RESEARCH RESULTS 2016
Comparing tank mixes of post-emergence herbicides on feathertop Rhodes grass (NSW pot experiment 2015)Tony Cook, Bill Davidson and Rebecca Miller NSW DPI, Tamworth
Key findingsTank mixing systemic herbicides and paraquat for mid-late tillering feathertop Rhodes (FTR) grass control resulted in one potentially useful treatment (paraquat + haloxyfop).
Haloxyfop tank mixed with paraquat, provided excellent control at 35 days after treatment (DAT), which was the only treatment to reach 100% efficacy.
Research questions1. How effective are herbicide tank mixes for the control of FTR grass?2. How do herbicides applied as single treatments compare with tank mixing with
paraquat?3. Is there potential for tank mix treatments with paraquat to replace the current standard
practice of double knocking to control FTR grass?
AimsThe main aim was to determine whether tank mixing some herbicides with paraquat provided additive or synergistic control of feathertop Rhodes (FTR) grass compared with standard singular treatments such as atrazine, simazine, terbuthylazine, haloxyfop or Balance®. The experimental aim is to gather data to possibly obtain an additional use pattern that allows tank mixing with paraquat to control established plants. The commercial effect from finding suitable tank mix treatments is maintaining excellent control of fallow FTR grass infestations without the need for time consuming double knocking strategies. Furthermore, using these new treatments will lessen glyphosate use, reducing selection pressure for glyphosate resistance.
MethodsSite• Tamworth: Tamworth Agricultural Institute glasshouseTreatments• 12 (11 herbicide treatments + one untreated control; Table 1)Growth stage• Mid-late tillering (15 tillers) to inflorescence emergence (Z50–59)Pot size and design• 8 cm square pots; one plant per pot, thinned down from two plants• Randomised complete block design of 12 treatments × six replicates (72 pots)• Pots moved outside for two weeks before spraying to simulate plants grown under field
conditions.Spraying• Herbicides were applied using a hand-held boom sprayer; water volume of 100 L/ha for
all herbicides. Uptake™ spray oil (0.5% v/v) used with all treatments.Herbicide timing• Herbicide treatments were applied on 9/11/2015: temperature 25.6 °C, relative
humidity 49% and wind 5 km/h.Measurements • Brownout score three days after treatment (DAT) (rating system 0–10; where
0 = healthy and green and 10 = brown and completely dead)• Biomass control % (visual estimate) compared with untreated control at 14, 28 and
35 DAT• Plant counts of survivors 35 DAT• Destructive sampling of green biomass 35 DAT (dry weight; g).

CR
OP
PR
OTE
CTI
ON
INDEPENDENT RESEARCH FOR INDUSTRY | 71
Treatments
Table 1. Herbicide treatments
Trt. No. Herbicides and rates per hectare Tank mix or single application
1 Untreated control Nil2 Balance® 100 g Single3 Balance® 100 g + Paraquat (250 g/L) 2 L Tank mix4 Atrazine (500 g/L) 6 L Single5 Atrazine (500 g/L) 6 L + Paraquat (250 g/L) 2 L Tank mix6 Simazine (500 g/L) 3 L Single7 Simazine (500 g/L) 3 L+ Paraquat (250 g/L) 2 L Tank mix8 Terbuthylazine (750 g/kg) 1 kg Single9 Terbuthylazine (750 g/kg) 1 kg + Paraquat (250 g/L) 2 L Tank mix10 Haloxyfop (520 g/L) 300 mL Single11 Haloxyfop (520 g/L) 300 mL + Paraquat (250 g/L) 2 L Tank mix12 Paraquat (250 g/L) 2 L SingleNote: All treatments applied at 100L/ha with TT 110-01 nozzles. All treatments had Uptake™ added at 0.5% v/v.
Results• A short-term brownout score of FTR grass was a good indicator of herbicide
interaction/antagonism (Figure 1). Moderate antagonism occurred when paraquat was tank mixed with most alternative herbicide partners (except for haloxyfop). Brownout rating (3 DAT) for paraquat alone was 6.2 out of 10 but when tank mixed with either atrazine, simazine, Balance® or terbuthlyazine the rating significantly reduced to between 4.2 and 5.8 (Figure 1).
• Haloxyfop (520 g/L) tank mixed with paraquat was the most effective combination treatment to control mid-late tillering FTR grass with 100% control at 35 DAT (Figure 2, Figure 3 and Plate 1).
• Balance®, simazine, atrazine or terbuthylazine mixed with paraquat provided 76–84% control of FTR grass at 35 DAT (Figure 2 & Figure 3).
• Haloxyfop applied as a standalone treatment gave excellent control (98%) at 35 DAT (Figure 2 and Figure 3). The remaining standalone treatments did not reach commercially acceptable levels of control.
0 0
4.2
0
4.8
0
5.0
0
5.8
0
6.0 6.2
0
1
2
3
4
5
6
7
8
9
10
1 2 3 4 5 6 7 8 9 10 11 12
Herbicide treatment
Brow
nout
sco
re (0
–10)
Figure 1. Brownout score (0–10) three days after application of single herbicides or tank mixes with paraquat on feathertop Rhodes grass LSD (0.05) = 0.2

CR
OP
PR
OTE
CTI
ON
72 | NORTHERN GRAINS RESEARCH RESULTS 2016
0
32
80
5
78
14
76
20
84
98 100
60
0
20
40
60
80
100
120
1 2 3 4 5 6 7 8 9 10 11 12Herbicide treatment
Biom
ass c
ontr
ol (%
)
Figure 2. Biomass control score (%) 35 days after application of single herbicides or tank mixes with paraquat on feathertop Rhodes grass LSD (0.05) = 7
12.8
3.5
1
10.3
1.6
6.1
2.4
9.2
1.7
0.3 0
3.6
0
2
4
6
8
10
12
14
1 2 3 4 5 6 7 8 9 10 11 12Herbicide treatment
Gre
en b
iom
ass
(g)
Figure 3. Green biomass (g) 35 days after application of single herbicides or tank mixes with paraquat on feathertop Rhodes grass LSD (0.05) = 1.6
SummaryTank mixing systemic herbicides and paraquat for control of mid-late tillering FTR grass resulted in one potentially useful treatment (paraquat + haloxyfop). Haloxyfop tank mixed with paraquat, provided excellent control at 35 DAT, which was the only treatment to reach 100% efficacy.
The remaining tank mixes did provide reasonable control levels of around 80%. This level of control would be expected to be lower under field conditions, thus making these combinations less than ideal. However, these treatments may attain commercially acceptable levels of control if applied to earlier FTR grass growth stages. The work undertaken in this experiment was for FTR grass at the 15-tiller stage. Further research should be conducted to determine the effect of herbicide treatments on FTR grass at various growth stages ranging from one to two tillers up to that tested in this experiment. Treatments need to be tested in the field to strongly link treatment outcomes with expectations under commercial conditions.
It is further suggested that additional experimental work using haloxyfop in tank mixes with paraquat be conducted in the future, especially for fine-tuning application rates and interaction of weed growth stage (beyond the 15-tiller stage) on efficacy.

CR
OP
PR
OTE
CTI
ON
INDEPENDENT RESEARCH FOR INDUSTRY | 73
Plate 1. Haloxyfop 300 mL/ha compared to Haloxyfop 300 mL/ha + Paraquat 2 L/ha, showing total necrosis of haloxyfop + paraquat tank mix 35 days after application
AcknowledgementsThis research was funded by NSW DPI and GRDC under project UQ0080: New uses for existing chemistry.

CR
OP
PR
OTE
CTI
ON
74 | NORTHERN GRAINS RESEARCH RESULTS 2016
Comparing double knock herbicides treatments on the control of awnless barnyard grass (NSW pot experiment 2015)Tony Cook, Bill Davidson and Rebecca MillerNSW DPI, Tamworth
Key findingsAll of the double knock treatments were very effective in controlling mid-late tillering awnless barnyard grass (BYG).
Herbicides, apart from haloxyfop or glyphosate, have the potential to be used as the first spray in double knock treatments to control mid-late tillering awnless BYG.
Research questions1. How effective are a range of double knock treatments, using herbicide groups A, C or
H followed by group L to control awnless BYG?2. How do herbicides applied as a single treatment compare to double knocking with
paraquat (group L)?3. Can effective control be obtained using a split application of paraquat on mid-tillering
awnless BYG?
AimsThe main aim of the experiment was to determine whether a range of systemic herbicides have the potential to control mid-tillering awnless BYG when used in combination with a following application of paraquat, in a double knock control strategy. If successful then such double knock combinations could replace the industry practice of purely relying on glyphosate or paraquat based treatments. The use of more diverse herbicide groups would reduce the resistance selection pressure on Group M (glyphosate) and L (paraquat) products.
MethodsSite• Tamworth: Tamworth Agricultural Institute glasshouseHerbicide treatments• 13 (12 herbicide treatments + one untreated control)Growth stages• Late tillering (15 tillers) to inflorescence emergence (Z50–59)Pot size and design• 8 cm square pots; one plant per pot, thinned down from two plants• Randomised complete block design 13 treatments × six replicates (78 pots)• Pots moved outside for two weeks before spraying to simulate plants grown under field
conditionsSpraying• Herbicides applied using a hand-held boom sprayer; water volume 100 L/ha for all
herbicides. Uptake spray oil (0.5% v/v) used with all treatments.Herbicide timing• 1st application (single) – 30/11/2015; temperature 29 °C, relative humidity 42%; wind
3 km/h• 2nd application (double knock with paraquat) – 7/12/2015; temperature 23 °C, relative
humidity 19%; wind 5 km/hMeasurements• Brownout score three days after treatment (DAT) (rating system 0–10 where 0 = green
and healthy and 10 = brown and dead)• Biomass control % (visual estimate) compared with untreated control at 14 DAT and
42 DAT• Plant counts of survivors 42 DAT• Destructive sampling of green biomass 42 DAT (dry weight, g)• Note all DAT assessments were following the second double knock herbicide
application of paraquat
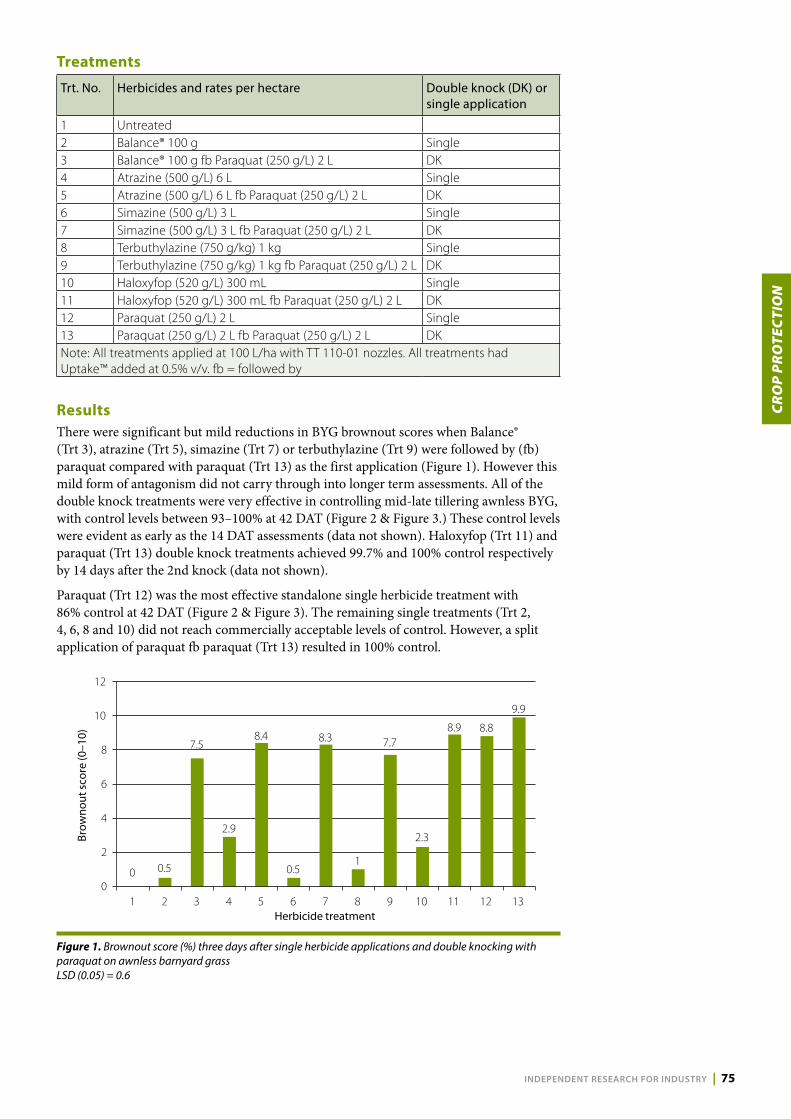
CR
OP
PR
OTE
CTI
ON
INDEPENDENT RESEARCH FOR INDUSTRY | 75
Treatments
Trt. No. Herbicides and rates per hectare Double knock (DK) or single application
1 Untreated2 Balance® 100 g Single3 Balance® 100 g fb Paraquat (250 g/L) 2 L DK4 Atrazine (500 g/L) 6 L Single5 Atrazine (500 g/L) 6 L fb Paraquat (250 g/L) 2 L DK6 Simazine (500 g/L) 3 L Single7 Simazine (500 g/L) 3 L fb Paraquat (250 g/L) 2 L DK8 Terbuthylazine (750 g/kg) 1 kg Single9 Terbuthylazine (750 g/kg) 1 kg fb Paraquat (250 g/L) 2 L DK10 Haloxyfop (520 g/L) 300 mL Single11 Haloxyfop (520 g/L) 300 mL fb Paraquat (250 g/L) 2 L DK12 Paraquat (250 g/L) 2 L Single13 Paraquat (250 g/L) 2 L fb Paraquat (250 g/L) 2 L DKNote: All treatments applied at 100 L/ha with TT 110-01 nozzles. All treatments had Uptake™ added at 0.5% v/v. fb = followed by
ResultsThere were significant but mild reductions in BYG brownout scores when Balance® (Trt 3), atrazine (Trt 5), simazine (Trt 7) or terbuthylazine (Trt 9) were followed by (fb) paraquat compared with paraquat (Trt 13) as the first application (Figure 1). However this mild form of antagonism did not carry through into longer term assessments. All of the double knock treatments were very effective in controlling mid-late tillering awnless BYG, with control levels between 93–100% at 42 DAT (Figure 2 & Figure 3.) These control levels were evident as early as the 14 DAT assessments (data not shown). Haloxyfop (Trt 11) and paraquat (Trt 13) double knock treatments achieved 99.7% and 100% control respectively by 14 days after the 2nd knock (data not shown).
Paraquat (Trt 12) was the most effective standalone single herbicide treatment with 86% control at 42 DAT (Figure 2 & Figure 3). The remaining single treatments (Trt 2, 4, 6, 8 and 10) did not reach commercially acceptable levels of control. However, a split application of paraquat fb paraquat (Trt 13) resulted in 100% control.
0 0.5
7.5
2.9
8.4
0.5
8.3
1
7.7
2.3
8.9 8.8
9.9
0
2
4
6
8
10
12
1 2 3 4 5 6 7 8 9 10 11 12 13Herbicide treatment
Brow
nout
sco
re (0
–10)
Figure 1. Brownout score (%) three days after single herbicide applications and double knocking with paraquat on awnless barnyard grass LSD (0.05) = 0.6
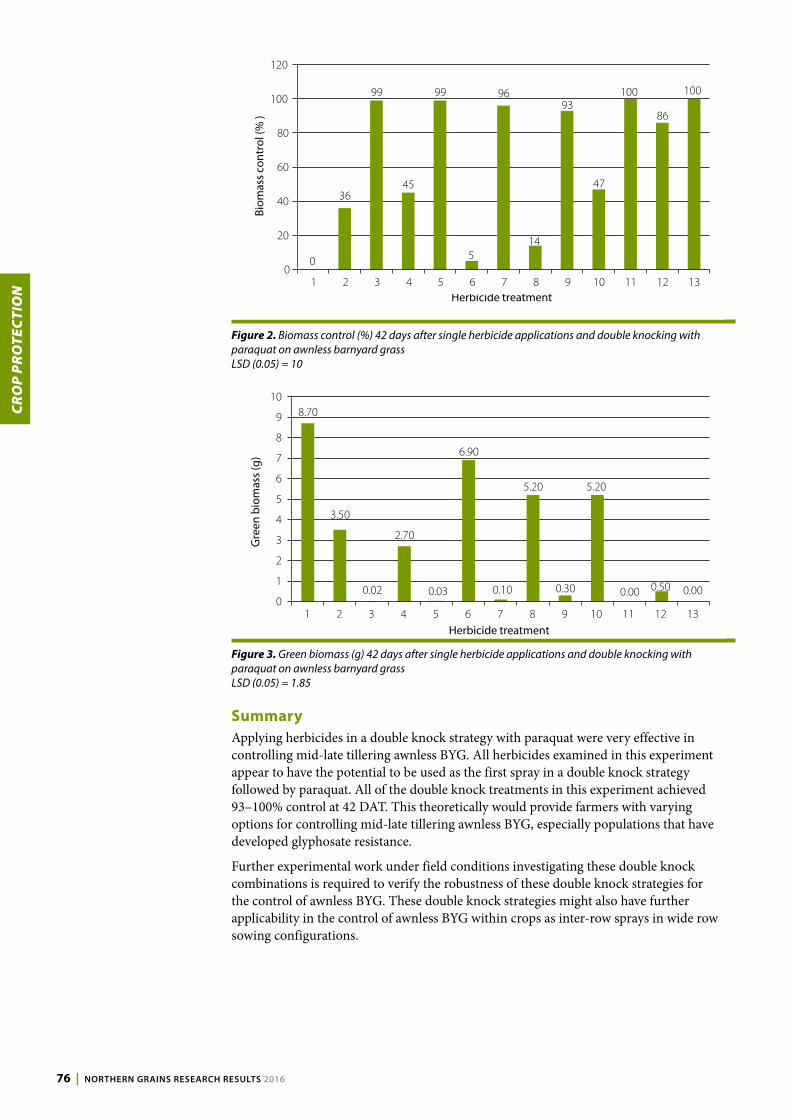
CR
OP
PR
OTE
CTI
ON
76 | NORTHERN GRAINS RESEARCH RESULTS 2016
0
36
99
45
99
5
96
14
93
47
100
86
100
0
20
40
60
80
100
120
1 2 3 4 5 6 7 8 9 10 11 12 13Herbicide treatment
Biom
ass c
ontr
ol (%
)
Figure 2. Biomass control (%) 42 days after single herbicide applications and double knocking with paraquat on awnless barnyard grass LSD (0.05) = 10
8.70
3.50
0.02
2.70
0.03
6.90
0.10
5.20
0.30
5.20
0.00 0.50 0.000
1
2
3
4
5
6
7
8
9
10
1 2 3 4 5 6 7 8 9 10 11 12 13Herbicide treatment
Gre
en b
iom
ass
(g)
Figure 3. Green biomass (g) 42 days after single herbicide applications and double knocking with paraquat on awnless barnyard grass LSD (0.05) = 1.85
SummaryApplying herbicides in a double knock strategy with paraquat were very effective in controlling mid-late tillering awnless BYG. All herbicides examined in this experiment appear to have the potential to be used as the first spray in a double knock strategy followed by paraquat. All of the double knock treatments in this experiment achieved 93–100% control at 42 DAT. This theoretically would provide farmers with varying options for controlling mid-late tillering awnless BYG, especially populations that have developed glyphosate resistance.
Further experimental work under field conditions investigating these double knock combinations is required to verify the robustness of these double knock strategies for the control of awnless BYG. These double knock strategies might also have further applicability in the control of awnless BYG within crops as inter-row sprays in wide row sowing configurations.

CR
OP
PR
OTE
CTI
ON
INDEPENDENT RESEARCH FOR INDUSTRY | 77
Plate 1. Balance® 100 g/ha compared to Balance® 100 g/ha fb Paraquat (250g/L) 2 L/ha, 42 days after application of the double knock treatment
AcknowledgementsThis research was funded by NSW DPI and GRDC under project UQ00080: New uses for existing chemistry.

CR
OP
PR
OTE
CTI
ON
78 | NORTHERN GRAINS RESEARCH RESULTS 2016
Comparing double knock treatments of herbicides on feathertop Rhodes grass (NSW pot experiment 2015)Tony Cook, Bill Davidson and Rebecca MillerNSW DPI, Tamworth
Key findingsBalance® and haloxyfop, followed by a double knock application of paraquat seven days later produced excellent control of mid-late tillering feathertop Rhodes (FTR) grass.
Atrazine and paraquat, followed by paraquat, was slightly less effective than the Balance® and haloxyfop double knock treatments.
Research questions1. How effective are a range of double knock treatments, using herbicide groups A, C or
H followed by group L to control FTR grass?2. How do herbicides applied as single treatments compare with double knocking with
paraquat?3. Can effective control be obtained using a split application of paraquat on mid-tillering
FTR grass?
AimsThe main aim of the experiment was to determine whether a range of systemic herbicides have the potential to control mid-tillering FTR grass when used in combination with a following application of paraquat, in a double knock control strategy. If successful then such double knock combinations could replace the industry practice of purely relying on glyphosate or paraquat based treatments. The use of more diverse herbicide groups would reduce the resistance selection pressure on Group M (glyphosate) and L (paraquat) products.
MethodsSite• Tamworth: Tamworth Agricultural Institute glasshouseHerbicide treatments• 13 (12 herbicide treatments + one untreated control).Growth stages• Late tillering (15 tillers) to inflorescence emergence (Z50–59).Pot size and design• 8 cm square pots; one plant per pot, thinned down from two plants• Randomised complete block design of 13 treatments × six replicates (78 pots)4. Pots moved outside for two weeks before spraying to simulate plants grown under field
conditions.Spraying• Herbicides applied using a hand-held boom sprayer; water volume 100 L/ha for all
herbicides. Uptake™ spray oil (0.5% v/v) used with all treatments.Herbicide timing• 1st application (single) – 9/11/2015; temperature 25.6 °C; relative humidity 49%; wind
9 km/h• 2nd application (double knock with paraquat) – 16/11/2015; temperature 18.5 °C;
relative humidity 51%; wind 10 km/h.Measurements• Brownout score 3 days after treatment application (DAT; rating system 0–10 where
0 = green and healthy and 10 = brown and completely dead)• Biomass control % (visual estimate) compared with untreated control at 14 DAT,
28 DAT and 35 DAT• Plant count of survivors 35 DAT• Destructive sampling of green biomass 35 DAT (dry weight, g). • Note all DAT assessments were following the second double knock herbicide
application of paraquat.

CR
OP
PR
OTE
CTI
ON
INDEPENDENT RESEARCH FOR INDUSTRY | 79
Treatments
Trt. No. Herbicides and rates per hectare Double knock (DK) or single application
1 Untreated2 Balance® 100 g Single3 Balance® 100 g + Paraquat (250 g/L) 2 L DK4 Atrazine (500 g/L) 6 L Single5 Atrazine (500 g/L) 6 L + Paraquat (250 g/L) 2 L DK6 Simazine (500 g/L) 3 L Single7 Simazine (500 g/L) 3 L+ Paraquat (250 g/L) 2 L DK8 Terbuthylazine (750 g/kg) 1 kg Single9 Terbuthylazine (750 g/kg) 1 kg + Paraquat (250 g/L) 2 L DK10 Haloxyfop (520 g/L) 300 mL Single11 Haloxyfop (520 g/L) 300 ml + Paraquat (25 0g/L) 2 L DK12 Paraquat (250 g/L) 2 L Single13 Paraquat (250 g/L) 2 L + Paraquat (250 g/L) 2 L DKNote: All treatments applied at 100L/ha with TT 110-01 nozzles. All treatments had Uptake ™ added at 0.5% v/v
ResultsThere were significant increases in the brownout of FTR grass with a double knock application of paraquat when it was preceded by haloxyfop (Trt 11), atrazine (Trt 5), terbuthylazine (Trt 9) or simazine (Trt7)(Figure 1). Balance® (Trt 3) and haloxyfop (Trt 11), followed by paraquat seven days later were the most effective double knock treatments to control mid-late tillering FTR grass with 100% control at 35 DAT (Figure 2 and Figure 3). Atrazine (Trt 5) followed by paraquat was also very effective with 95% control at 35 DAT. A split application of paraquat fb paraquat (Trt 13) provided 91% control of FTR grass at 35 DAT (Figure 2 and Figure 3).
Haloxyfop applied as a standalone treatment (Trt 10) resulted in 95% control at 35 DAT (Figure 2 and Figure 3). The remaining single treatments did not reach commercially acceptable levels of control.
0
2
4
6
8
10
12
1 2 3 4 5 6 7 8 9 10 11 12Herbicide treatment
Brow
nout
sco
re (0
–10)
0.0
2.4
7.4
0.8
9.1
0.0
8.0
0.7
8.9
3.4
9.7
6.8
9.4
Figure 1. Brownout score (%) three days after single herbicide applications and double knocking with paraquat on feathertop Rhodes grass LSD (0.05) = 0.7

CR
OP
PR
OTE
CTI
ON
80 | NORTHERN GRAINS RESEARCH RESULTS 2016
0
48
100
10
95
10
83
10
86
95 100
73
91
0
20
40
60
80
100
120
1 2 3 4 5 6 7 8 9 10 11 12 13
Biom
ass c
ontr
ol (%
)
Herbicide treatment
Figure 2. Biomass control (%) 35 days after single herbicide applications and double knocking with paraquat on feathertop Rhodes grass LSD (0.05) = 8
8.6
2.1
0.0
9.0
0.2
11.7
0.9
10.4
0.7 0.60.0
2.3
0.50
2
4
6
8
10
12
14
1 2 3 4 5 6 7 8 9 10 11 12 13
Gre
en b
iom
ass
(g)
Herbicide treatment
Figure 3. Green biomass (g) 35 days after single herbicide applications and double knocking with paraquat on feathertop Rhodes grass LSD (0.05) = 1.7
SummaryBalance® and haloxyfop, followed by paraquat seven days later in a double knock strategy, produced excellent control of mid-late tillering FTR grass. Atrazine and paraquat followed by paraquat was slightly less effective, with 95% and 91% control, respectively.
Double knock herbicides applications using paraquat as the second treatment appears to be a very effective tool for controlling FTR grass, provided herbicides such as haloxyfop and Balance® are used as the first application. These two treatments have the additional benefit of being an effective double knock strategy against awnless barnyard grass.
Haloxyfop (Group A) applied individually was moderately effective, but should still be used with a paraquat follow-up double knock treatment to minimise the potential of developing group A resistance.
Further experimental work under field conditions investigating these double knock combinations over a range of weed growth stages is required to verify the robustness of these double knock strategies for the control of FTR grass. These double knock strategies might also have further applicability in the control of FTR grass within crops as inter-row sprays in wide row sowing configurations.

CR
OP
PR
OTE
CTI
ON
INDEPENDENT RESEARCH FOR INDUSTRY | 81
Plate 1. Balance® 100 g/ha compared to Balance® 100 g/ha fb Paraquat (250g/L) 2 L/ha, 35 days after application of the double knock treatment
AcknowledgementsThis research was funded by NSW DPI and GRDC under project UQ00080: New uses for existing chemistry.

CR
OP
PR
OTE
CTI
ON
82 | NORTHERN GRAINS RESEARCH RESULTS 2016
Comparing tank mixes of herbicides for post-emergence control of flaxleaf fleabane (NSW pot experiment 2015)Tony Cook, Bill Davidson and Rebecca MillerNSW DPI, Tamworth
Key findingsTank mixing group H and H/I herbicides with paraquat (Group L) for the control of early flowering fleabane generally only provided moderate efficacy in this experiment.
Tordon® 75-D (Group I) mixed with paraquat and Velocity® (Group H/C) mixed with paraquat, however, provided reasonable control at 89% and 81%, respectively.
AimsThe principal aim was to determine whether a range of herbicides by themselves or in a tank mix with paraquat are a viable option for the control of established flaxleaf fleabane plants. The commercial effect from finding suitable tank mix treatments is maintaining excellent control of flaxleaf fleabane infestations without the need for time consuming double knock strategies.
MethodsSite• Tamworth: Tamworth Agricultural Institute glasshouseTreatments• 12 (11 Herbicide treatments + one untreated control; Table 1)Growth stages• Early flowering (30–40 cm tall)Pot size and design• 8 cm square pots; one plant per pot, thinned down from two plants• Randomised complete block design of 12 treatments × six replicates (72 pots)• Pots moved outside for two weeks before spraying to simulate field conditions.Spraying• Herbicides applied using a hand-held boom sprayer; water volume 100 L/ha for all
herbicides. Uptake™ spray oil (0.5% v/v) used with all treatments.Herbicide timing• Herbicide treatments applied 9/10/2015; temperature 26 °C; relative humidity 40%;
wind 2 km/h.Measurements • Brownout score three days after treatment (DAT) (rating system 0–10; where
0 = healthy and green and 10 = brown and completely dead)• Biomass control % (visual estimate) compared with untreated control at 14, 28 and
56 DAT• Plant counts of survivors 56 DAT• Destructive sampling of green biomass 56 DAT (dry weight; g)
Treatments
Trt.No.
Herbicides and rates per hectare Herbicide group
Tank mix or single application
1 Untreated2 Balance® 100 g H Single3 Balance® 100 g + Paraquat (250 g/L) 2 L H + L Tank mix4 Tordon® 75-D 700 mL I Single5 Tordon® 75-D 700 mL + Paraquat (250 g/L) 2 L I + L Tank mix6 Velocity® 500 mL H/C Single7 Velocity® 500 mL + Paraquat (250 g/L) 2 L H/C + L Tank mix8 Precept® 1 L H/I Single9 Precept® 1 L + Paraquat (250 g/L) 2 L H/I + L Tank mix10 Experimental BCP 250 mL H Single11 Experimental BCP 250 mL + Paraquat (250 g/L) 2 L H + L Tank mix12 Paraquat (250 g/L) 2 L L SingleNote: All treatments applied at 100 L/ha with TT 110-01 nozzles. All treatments had Uptake™ added at 0.5% v/v

CR
OP
PR
OTE
CTI
ON
INDEPENDENT RESEARCH FOR INDUSTRY | 83
ResultsThe initial brownout of flaxleaf fleabane 3 DAT was moderate with ratings of 4.7 to 5.8 out of 10 for all treatments containing paraquat (Table 1).
All of the herbicides examined when applied as standalone treatments provided only moderate control of early flowering flaxleaf fleabane (Table 1).
Tordon® 75-D and Velocity® tank mixed with paraquat were the most effective treatments against early flowering flaxleaf fleabane with control rates of 89% and 81%, respectively 56 DAT (Table1). The remaining herbicide tank mixes with paraquat only provided biomass control of between 48–58% when assessed 56 DAT.
Table 1. Brownout score three days after treatment (DAT), biomass score 28 DAT and 56 DAT, dried green biomass 56 DAT and plant count survivors 56 DAT, after application with herbicides and paraquat tank mixes on flaxleaf fleabane
Herbicides and rates per hectare Brownout score (0-10) 3 DAT
Biomass control score
(%) 28 DAT
Biomass control score
(%) 56 DAT
Green biomass (g/plant) 56 DAT
Plant count survivors
(plants/pot; max=1) 56 DAT
Untreated 0.0 0 0 8.6 1.0Balance® 100 g 0.0 5 13 4.9 1.0Balance® 100 g + Paraquat (250 g/L) 2 L 5.5 53 48 1.9 1.0Tordon® 75-D 700 mL 0.0 40 45 4.5 1.0Tordon® 75-D 700 mL + Paraquat (250 g/L) 2 L 5.8 85 89 0.2 0.8Velocity® 500 mL 0.0 28 21 3.8 1.0Velocity® 500 mL + Paraquat (250 g/L) 2 L 5.2 86 81 0.6 1.0Precept® 1 L 0.0 12 11 6.2 1.0Precept® 1 L + Paraquat (250 g/L) 2 L 4.7 52 58 3.8 1.0BCP 250 mL 0.0 0 10 7.0 1.0BCP 250 mL + Paraquat (250 g/L) 2 L 5.6 68 48 2.4 1.0Paraquat (250 g/L) 2 L 5.3 60 52 2.7 1.0LSD (0.05) 0.4 9 11 1.6 0.1
SummaryTank mixing group H and H/I herbicides and paraquat for early flowering fleabane control generally provided only moderate efficacy in this experiment. Velocity® (Group H/C) tank mixed with paraquat (Group L) was an exception with 81% control when assessed 56 DAT.
Tordon® 75-D (Group I) mixed with paraquat was the best treatment which provided control levels of 89% when assessed 56 DAT. Further experimentation of Velocity® and Tordon® 75-D in tank mixes with paraquat is required to confirm efficacy under field conditions and to fine tune application rates and/or efficacy across weed growth stages. There could still be some merit in persisting with some of the other less effective tank mix treatments in this experiment but assessing their activity against smaller flaxleaf fleabane plants. Further, there could be merit in examining the combination of lower quantities of 2,4-D or Tordon® 75-D in Group H + L tank mixtures to increase levels of flaxleaf fleabane control.

CR
OP
PR
OTE
CTI
ON
84 | NORTHERN GRAINS RESEARCH RESULTS 2016
Plate 1. Velocity® 500 mL/ha compared with Velocity® 500 mL/ha + Paraquat (250 g/L) 2 L/ha showing early brownout of Velocity® and paraquat tank mix three days after application
AcknowledgementsThis research was funded by NSW DPI and GRDC under project UQ0080: New uses for existing chemistry.

CR
OP
PR
OTE
CTI
ON
INDEPENDENT RESEARCH FOR INDUSTRY | 85
Comparing tank mixes of herbicides for post-emergence control of common sowthistle (NSW pot experiment 2015)Tony Cook, Bill Davidson and Rebecca MillerNSW DPI, Tamworth
Research questions1. How effective are a range of herbicides applied as single treatments on the control of
common sowthistle compared to tank mixing with paraquat?2. Do any of these herbicide options provide equivalent common sowthistle control to a
standard treatment of Tordon® 75-D (Group I)?
AimsThe principal aim was to determine whether a range of herbicides by themselves or in a tank mix with paraquat are a viable option for the control of established common sowthistle plants.
MethodsSite• Tamworth: Tamworth Agricultural Institute glasshouseTreatments• 12 (11 Herbicide treatments + one untreated control)Growth stages• Early flowering (50 cm tall).Pot size and design• 8 cm square pots; one plant per pot, thinned down from two plants• Randomised complete block design of 12 treatments × six replicates (72 pots)• Pots moved outside for two weeks before spraying to simulate plants grown under field
conditions.Spraying• Herbicides applied using a hand-held boom sprayer; water volume 100 L/ha for all
herbicides. Uptake™ spray oil (0.5% v/v) used with all treatments.Herbicide timing• Herbicide treatments applied 11/09/2015; temperature 16 °C; relative humidity 46%;
wind 3 km/h.Measurements • Brownout score three days after treatment (DAT) (rating system 0–10; where 0 =
healthy and green and 10 = brown and completely dead)• Biomass control % (visual estimate) compared with untreated control at 14, 28 and 56
DAT• Plant counts of survivors 56 DAT• Destructive sampling of green biomass 56 DAT (dry weight; g).
Key findingsAll of the herbicides examined appear to work well when tank mixed with paraquat to control early flowering common sowthistle.
However, paraquat alone also provided excellent control of early flowering common sowthistle which questions the value of tank mixes with other herbicides.

CR
OP
PR
OTE
CTI
ON
86 | NORTHERN GRAINS RESEARCH RESULTS 2016
Treatments
Trt. No.
Herbicides and rates per hectare Herbicide group
Tank mix or single application
1 Untreated2 Balance® 100 g H Single3 Balance® 100 g + Paraquat (250 g/L) 2 L H + L Tank mix4 Tordon® 75-D 700 mL I Single5 Tordon® 75-D 700 mL + Paraquat (250 g/L) 2 L I + L Tank mix6 Velocity® 500 mL H/C Single7 Velocity® 500 mL + Paraquat (250 g/L) 2 L H/C + L Tank mix8 Precept® 1 L H/I Single9 Precept® 1 L + Paraquat (250 g/L) 2 L H/I + L Tank mix10 Experimental BCP 250 mL H Single11 Experimental BCP 250 mL + Paraquat (250 g/L) 2 L H + L Tank mix12 Paraquat (250 g/L) 2 L L SingleNote: All treatments applied at 100L/ha with TT 110-01 nozzles. All treatments had Uptake™ added at 0.5% v/v
ResultsParaquat (Group L) was the only herbicide which provided significant brownout of common sowthistle when applied as a single herbicide treatment (Figure 1). There appeared to be early antagonism of the herbicides when mixed with paraquat with significantly lower brownout scores 3 DAT compared to paraquat alone (Trt 12). However, this early antagonism had no consequence on the longer-term control achieved with these herbicide combinations when assessed 28 DAT (Figure 2).
Paraquat applied on its own at 2 L/ha (Trt 12) provided 100% control of common sowthistle at 28 DAT (Figure 2). Velocity® had the highest level of efficacy out of the Group H containing herbicides examined when applied as a single application with 81% control 28 DAT (Figure 2). The remaining group H and group I herbicide treatments did not result in commercially acceptable levels of control when applied as single applications.
Tank mixes with each of the herbicides examined and paraquat provided good levels of control of early flowering common sowthistle with all combinations in the range of 95–100% control at 28 DAT (Figure 2).
0 0
3.8
0
4.0
0
3.2
0
3.5
0
3.9
7.3
0
1
2
3
4
5
6
7
8
1 2 3 4 5 6 7 8 9 10 11 12
Herbicide treatment
Brow
nout
sco
re (0
–10)
Figure 1. Brownout score (0–10) three days after application of single herbicides or tank mixes with paraquat on common sowthistle LSD (0.05) = 0.4

CR
OP
PR
OTE
CTI
ON
INDEPENDENT RESEARCH FOR INDUSTRY | 87
0
50
100
53
96
81
100
60
95
28
98 100
0
20
40
60
80
100
120
1 2 3 4 5 6 7 8 9 10 11 12
Biom
ass c
ontr
ol (%
)
Herbicide treatment
Figure 2. Biomass control score (%) 28 days after application of single herbicides or tank mixes with paraquat on common sowthistle LSD (0.05) = 6
SummaryTank mixing group H and group I herbicides with paraquat provided excellent control of early flowering common sowthistle under glasshouse conditions. However, paraquat provided 100% efficacy as a standalone single application. This questions whether it is worth the extra cost of tank mixing group H and group I herbicides with paraquat (Group L) to control common sowthistle in commercial paddock situations.
Further research is required under field conditions to obtain a clearer picture of how effective paraquat is on its own in controlling sowthistle across a range of different growth stages and how group H and group I herbicides may contribute to improved control when tank mixed with paraquat.
Plate 1. Balance® 100 g/ha compared with Balance® 100 g/ha + Paraquat 2 L/ha tank mix 28 days after application
AcknowledgementsThis research was funded by NSW DPI and GRDC under project UQ0080: New uses for existing chemistry.

CR
OP
PR
OTE
CTI
ON
88 | NORTHERN GRAINS RESEARCH RESULTS 2016
Comparing double knock and individual herbicide treatments on common sowthistle (NSW pot experiment 2015)Tony Cook, Bill Davidson and Rebecca Miller NSW DPI, Tamworth
Research questions1. How effective are a range of double knock treatments, using group H containing
herbicides followed by group L on the control of common sowthistle?2. How do herbicides applied as single treatments compare with double knocking with
paraquat?
AimsThe main aim was to determine the efficacy of a range of herbicide treatments or double knock strategies on the post-emergence control of common sowthistle. Development of new herbicide treatments with alternate modes of action to the standard Group I and L double knock approach currently used by growers are likely to reduce resistance selection pressure on Group I chemistry.
MethodsSite• Tamworth: Tamworth Agricultural Institute glasshouseTreatments• 12 (11 Herbicide treatments + one untreated control)Growth stages• Early flowering (50 cm tall).Pot size and design• 8 cm square pots; one plant per pot, thinned down from two plants• Randomised complete block design of 12 treatments × six replicates (72 pots)• Pots moved outside for two weeks before spraying to simulate plants grown under field
conditions.Spraying• Herbicides applied using a hand-held boom sprayer; water volume 100 L/ha for all
herbicides. Uptake™ spray oil (0.5% v/v) used with all treatments.Herbicide timing• 1st application (single) – 24/09/2015: temperature 16 °C; relative humidity 42%; wind
11 km/h• 2nd application (double knock with paraquat) – 1/10/2015; temperature 29 °C; relative
humidity 26%; wind 7 km/h.Measurements• Brownout score three days after treatment (DAT) (rating system 0–10;
where 0 = healthy and green and 10 = brown and completely dead)• Biomass control % (visual estimate) compared with untreated control at 14, 28 and
56 DAT • Plant counts of survivors 56 DAT• Destructive sampling of green biomass 56 DAT (dry weight; g). Note all DAT
assessments were following the second double knock herbicide application of paraquat.
Key findingsDouble knock applications of group H containing herbicides followed by paraquat seven days later appear to be very effective in controlling early flowering common sowthistle.
Paraquat and Velocity® were also very effective as standalone treatments in controlling early flowering common sowthistle.

CR
OP
PR
OTE
CTI
ON
INDEPENDENT RESEARCH FOR INDUSTRY | 89
Treatments
Trt. No.
Herbicides and rates per hectare Herbicide group
Double knock (DK) or single application
1 Untreated2 Balance® 100 g H Single3 Balance® 100 g fb Paraquat (250 g/L) 2 L H fb L DK4 Tordon® 75-D 700 mL I Single5 Tordon® 75-D 700 mL fb Paraquat (250 g/L) 2 L I fb L DK6 Velocity® 500 mL H/C Single7 Velocity® 500 mL fb Paraquat (250 g/L) 2 L H/C fb L DK8 Precept® 1 L H/I Single9 Precept® 1 L fb Paraquat (250 g/L) 2 L H/I fb L DK10 Experimental BCP 250 mL H Single11 Experimental BCP 250 mL fb Paraquat (250 g/L) 2 L H fb L DK12 Paraquat (250 g/L) 2 L L SingleNote: All treatments applied at 100L/ha with TT 110-01 nozzles. All treatments had Uptake™ added at 0.5% v/v fb = followed by
ResultsParaquat (Trt 12) was the only herbicide which caused significant brownout of common sowthistle 3 DAT when applied as a single application (Figure 1). All double knock treatments significantly reduced the initial level of brownout of common sowthistle compared to paraquat alone (Trt 12)(Figure 1). The magnitude of decreases in early brownout was modest and had no implications on longer-term (56 DAT) control but did appear to still have reduced activity at the 28 DAT assessment (Figure 2).
Paraquat (Trt 12) was very effective as a standalone single application treatment with 98% control at 28 DAT and 100% control at 56 DAT (Figure 2 and Figure 3). Velocity® (Trt 6) also attained excellent control as a single application with 82% and 100% control at 28 DAT and 56 DAT, respectively (Figure 2 and Figure 3). However, the remaining single application treatments (Trt 2, 4, 8 and 10) did not provide commercially acceptable levels of common sow thistle control (29–82%) even by the 56 DAT assessment (Figure 3).
All of the double knock treatments with paraquat (group L) produced 100% control at 56 DAT (Figure 3). However, they all took longer than a single application of paraquat to achieve complete control with between only 74–83% control at 28 DAT compared to 98% with the single paraquat application treatment (Trt 12) (Figure 2).
0.0 0.0
5.0
0.0
5.8
0.0
6.3
0.0
6.3
0.0
5.8
6.8
0
1
2
3
4
5
6
7
8
1 2 3 4 5 6 7 8 9 10 11 12
Brow
nout
sco
re (0
–10)
Herbicide treatment
Figure 1. Brownout score (%) three days after single herbicide applications and double knocking with paraquat on common sowthistle LSD (0.05) = 0.4

CR
OP
PR
OTE
CTI
ON
90 | NORTHERN GRAINS RESEARCH RESULTS 2016
0
29
100
82
100 100 100
71
100
45
100 100
0
20
40
60
80
100
120
1 2 3 4 5 6 7 8 9 10 11 12
Biom
ass c
ontr
ol (%
)
Herbicide treatment
Figure 2. Biomass control (%) 28 days after single herbicide applications and double knocking with paraquat on common sowthistle LSD (0.05) = 10
0
29
100
82
100 100 100
71
100
45
100 100
0
20
40
60
80
100
120
1 2 3 4 5 6 7 8 9 10 11 12
Biom
ass c
ontr
ol (%
)
Herbicide treatment
Figure 3. Biomass control (%) 56 days after single herbicide applications and double knocking with paraquat on common sowthistle LSD (0.05) = 18
SummaryEarly flowering common sowthistle appears to be very effectively controlled with double knock applications of a range of group H containing herbicides followed by paraquat (group L) seven days later. Paraquat (group L) and Velocity® (group H/C) also appear very effective as standalone single application treatments.
Further experimental work under field conditions investigating these double knock combinations and single applications of paraquat or Velocity® over a range of weed growth stages is required to verify the robustness of these double knock strategies for the control of common sowthistle. Some of these potentially viable herbicide options appear even more promising as they have activity against other common weed species such as awnless barnyard grass, feathertop Rhodes grass and flaxleaf fleabane.

CR
OP
PR
OTE
CTI
ON
INDEPENDENT RESEARCH FOR INDUSTRY | 91
Plate 1. Velocity® 500 mL/ha compared with Velocity® 500 mL/ha followed by Paraquat (250 g/L) 2L/ha, 56 days after application of the double knock treatment
AcknowledgementsThis research was funded by NSW DPI and GRDC under project UQ00080: New uses for existing chemistry.

CR
OP
PR
OTE
CTI
ON
92 | NORTHERN GRAINS RESEARCH RESULTS 2016
Comparing double knock and individual herbicide treatments on flaxleaf fleabane (NSW pot experiment 2015)Tony Cook, Bill Davidson and Rebecca MillerNSW DPI, Tamworth
Research questions1. How effective are a range of double knock treatments, using group H containing
herbicides followed by group L on the control of flaxleaf fleabane?2. How do herbicides applied as single treatments compare with double knocking with
paraquat?
AimsThe main aim was to determine the efficacy of a range of herbicide treatments or double knock strategies on the post-emergence control of flaxleaf fleabane. Development of new herbicide treatments with alternate modes of action to the standard Group I and L double knock approach currently used by growers are likely to reduce resistance selection pressure on Group I chemistry.
MethodsSite• Tamworth: Tamworth Agricultural Institute glasshouseTreatments• 12 (11 Herbicide treatments + one untreated control)Growth stages• Early flowering (30–40 cm tall).Pot size and design• 8 cm square pots; one plant per pot, thinned down from two plants• Randomised complete block design of 12 treatments × six replicates (72 pots)• Pots moved outside for two weeks before spraying to simulate plants grown under field
conditions.Spraying• Herbicides applied using a hand-held boom sprayer; water volume 100 L/ha for all
herbicides. Uptake™ spray oil (0.5% v/v) used with all treatments.Timing• 1st application (single) – 24/09/2015: temperature 11.4 °C; relative humidity 50%; wind
1 km/h• 2nd application (double knock with paraquat) – 1/10/2015; temperature 29 °C; relative
humidity 26%; wind 7 km/h.Measurements • Brownout score three days after treatment (DAT) (rating system 0–10; where
0 = healthy and green and 10 = brown and completely dead)• Biomass control % (visual estimate) compared with untreated control at 14, 28 and
56 DAT • Plant counts of survivors 56 DAT• Destructive sampling of green biomass 56 DAT (dry weight; g). Note all DAT
assessments were following the second double knock herbicide application of paraquat.
Key findingsDouble knock applications of some group H containing herbicides followed by paraquat seven days later appear to be a viable alternative to double knocking with Tordon® 75D followed by paraquat for the control of early flowering flaxleaf fleabane.
The most effective group H containing herbicides in combination with paraquat as double knock treatments were Precept®, Balance® and Velocity® in order of effectiveness of their control of early flowering flaxleaf fleabane.

CR
OP
PR
OTE
CTI
ON
INDEPENDENT RESEARCH FOR INDUSTRY | 93
Treatments
Trt. No.
Herbicides and rates per hectare Herbicide group
Double knock (DK) or single application
1 Untreated2 Balance® 100 g H Single3 Balance® 100 g fb Paraquat (250 g/L) 2 L H fb L DK4 Tordon® 75-D 700 mL I Single5 Tordon® 75-D 700 mL fb Paraquat (250 g/L) 2 L I fb L DK6 Velocity® 500 mL H/C Single7 Velocity® 500 mL fb Paraquat (250 g/L) 2 L H/C fb L DK8 Precept® 1 L H/I Single9 Precept® 1 L fb Paraquat (250 g/L) 2 L H/I fb L DK10 Experimental BCP 250 mL H Single11 Experimental BCP 250 mL fb Paraquat (250 g/L) 2 L H fb L DK12 Paraquat (250 g/L) 2 L L SingleNote: All treatments applied at 100L/ha with TT 110-01 nozzles. All treatments had Uptake™ added at 0.5% v/v
Fb = followed by
Results Paraquat (Trt 12) was effective as a standalone treatment with 87% control at 28 DAT (Figure 1) and 100% control at 56 DAT (Figure 2). The remaining single application herbicide treatments had significantly lower levels of efficacy ranging from 5 to 54% at 28 DAT (Figure 1) and 5 to 67% at 56 DAT (Figure 2).
Precept® (Trt 9) and Tordon® 75-D (Trt 5) double knock treatments with paraquat achieved 100% control on early flowering fleabane by 56 DAT (Figure 2). Balance® (Trt 3) and Velocity® (Trt 7) double knock treatments with paraquat achieved lower but acceptable levels of control of 92% and 88% by 56 DAT, respectively (Figure 2).
08
83
43
83
54
83
53
76
5
8287
0
10
20
30
40
50
60
70
80
90
100
1 2 3 4 5 6 7 8 9 10 11 12
Biom
ass
cont
rol (
%)
Herbicide treatment
Figure 1. Biomass control (%) 28 days after single herbicide applications and double knocking with paraquat on flaxleaf fleabane LSD (0.05) = 10

CR
OP
PR
OTE
CTI
ON
94 | NORTHERN GRAINS RESEARCH RESULTS 2016
06
92
67
100
41
88
54
100
5
71
100
0
20
40
60
80
100
120
1 2 3 4 5 6 7 8 9 10 11 12
Biom
ass
cont
rol (
%)
Herbicide treatment
Figure 2. Biomass control (%) 56 days after single herbicide applications and double knocking with paraquat on flaxleaf fleabane LSD (0.05) = 15
SummaryDouble knock applications of some group H containing herbicides followed by paraquat (group L) seven days later appear to be a viable alternative to double knocking with Tordon® 75D (group I) followed by paraquat (group L) for the control of early flowering flaxleaf fleabane.
The most effective group H containing herbicides in combination with paraquat as double knock treatments were Precept®, Balance® and Velocity® in order of effectiveness. The Tordon® 75-D double knock treatment resulted in 100% control by 56 DAT. Notably, paraquat as a standalone treatment was 100% effective after the same period, whilst the remaining single herbicide application treatments did not provide adequate levels of control. For these effective herbicide treatment options to achieve registration, they will need to be re-evaluated in future field experiments for consistency and effectiveness over a range of flaxleaf fleabane growth stages.
It appears that the best option currently to control flaxleaf fleabane is probably to double knock, because a comparative experiment that investigated tank mixing paraquat with a range of Group H herbicides achieved lower level of flaxleaf fleabane control. However, more research on tank mixing systemic herbicides with paraquat is recommended as these options could still be a reasonable control option against younger and hence smaller fleabane plants.

CR
OP
PR
OTE
CTI
ON
INDEPENDENT RESEARCH FOR INDUSTRY | 95
Plate 1. Tordon® 75-D 700 mL/ha compared to Tordon®75-D 700 mL/ha followed by Paraquat 2 L/ha, 56 days after application of the double knock treatment
AcknowledgementsThis research was funded by NSW DPI and GRDC under project UQ00080: New uses for existing chemistry.

CR
OP
PR
OTE
CTI
ON
96 | NORTHERN GRAINS RESEARCH RESULTS 2016
Rust management strategies for modern faba bean varieties Bill Manning1, Joop van Leur2, Merv Riley2 and Stuart Marshman2
1 North West LLS, Gunnedah 2 NSW DPI, Tamworth
Key findingsEven in the absence of significant rust development, fungicide application improved yield.
The new variety PBA NasmaA displayed high yield and appears to have a reasonable level of rust resistance under low disease severity.
IntroductionFaba bean is a rotation crop used in northern NSW to break disease cycles in winter cereals and to maintain soil nitrogen fertility. The Pulse Breeding Australia (PBA) faba bean breeding program aims to breed locally adapted varieties with improved disease resistance. Faba bean rust, Uromyces viciae-fabea, is a significant production constraint in the region. Growers are advised to apply a preventative fungicide spray in autumn while continuously monitoring disease development to determine whether follow-up applications are needed in spring. Previous trials have shown that late sprays can increase seed size (an important quality parameter).
Site detailsLocation: Liverpool Plains Field Research Station, BreezaCo-operator: Scott Goodworth, NSW DPISowing date: 12 May 2015
TreatmentsNil No fungicideHigh protection 1st spray 8 July, 1 kg/ha Mancozeb
2nd spray 20 August, 1 kg/ha MancozebLate protection Single spray 20 August, 1 kg/ha MancozebFaba bean plants were grown in pots inside a shadehouse and inoculated with rust before sowing the main trial. Rust sporulating plants were placed in the trial to initiate disease early in the season. Fungicide was applied by boom spray in 120 L/ha water. Individual plants (10 per plot) were tagged and scored visually for rust symptoms (% coverage) on leaves and stems on 29 September and again for stem symptoms on 15 October.
Plant materialsA total of nine faba bean lines were tested:1. PBA WardaA released in 2012, classified MR–R (moderately resistant to resistant)
to rust.2. DozaA released in 2008, classified MR–R to rust.3. PBA NasmaA released in 2015, a large seeded classified MR–R to rust.4 – 6. IX506/1–9, IX474/4–3 and IX477/17–15 advanced breeding lines from the
northern breeding program with rust resistance, high yield and good seed size.
7. Fiesta VFA an old variety classified as S (susceptible) to rust.8. PBA SamiraA a southern variety with high yield potential.9. AF08207 the most rust resistant breeding line from the southern breeding
program.
Results
Table 1. Rainfall at Breeza 2015 (mm)
Jan Feb Mar Apr May Jun Jul Aug Sep Oct Nov Dec
79 42 8 90 54 44 39 32 5 40 37 63
Low rainfall during late August and September (Table 1) resulted in limited rust spread in 2015, as can be seen from the relatively low infection levels in unsprayed plots (Tables 2

CR
OP
PR
OTE
CTI
ON
INDEPENDENT RESEARCH FOR INDUSTRY | 97
and 3). This is an unexpected result as there was sufficient rainfall and appropriate temperatures for rust development earlier in the season. Despite this, fungicide application significantly increased yield (Table 4), but there was no difference in seed size. In previous trials under higher disease pressure, fungicide application and particularly late fungicide application have resulted in larger seed size. The low levels of rust development in the trial in 2015 could explain this lack of interaction with seed size.
Table 2. Rust scores on leaves and stems at Breeza 29 September 2015
Treatment Rust leaf (%) Rust stem (%)
Nil 6.5 a* 1.7 aComplete protection 0.1 b 0.1 bLate spray 1.2 b 0.2 b*Numbers indicated by different letters are significantly different at P = 0.05
a
ab
abcbc bc
bcc c
c
0.0
0.5
1.0
1.5
2.0
2.5
3.0
3.5
4.0
4.5
IX477/17-15 Fiesta Doza PBA Samira IX506/1-9 IX474/4-3 PBA Nasma PBA Warda AF08207
Rust
(%
)
l.s.d. = 1.23 (P <0.05)
Figure 1. Effect of variety on leaf rust in late September 2015
Table 3. Rust scores resulting from different fungicide treatments at Breeza 15 October
Treatment Rust stem (%)
Nil 3.60 a*Complete protection 1.10 bLate spray 1.12 b*Numbers indicated by different letters are significantly different at P = 0.05
Table 4. Yield of different fungicide treatments – Breeza 2015
Treatment Yield (t/ha)
Nil 2.69 b*Complete protection 2.88 aLate spray 2.88 a*Numbers indicated by different letters are significantly different at P = 0.05
Yield results were similar to previous trials and GRDC funded National Variety Trial (NVT) results with the newer varieties PBA Nasma and PBA Warda yielding significantly higher than Doza (Figure 2).

CR
OP
PR
OTE
CTI
ON
98 | NORTHERN GRAINS RESEARCH RESULTS 2016
aa
ab abbc bc
cdd d
0.00
0.50
1.00
1.50
2.00
2.50
3.00
3.50
PBA Nasma PBA Warda IX506/1-9 IX474/4-3 AF08207 IX477/17-15 Doza PBA Samira Fiesta
Yiel
d (t
/ha)
l.s.d. = 0.25 (P <0.05)
Figure 2. Yield of nine faba bean entries – Breeza 2015
SummaryIn a season where rust development was substantially less than expected, fungicide application still provided a significant yield increase. PBA Nasma demonstrated high yield and good rust resistance (Figure 1) under the low disease severity experienced in this trial in 2015. The level of rust resistance in PBA Nasma needs to be confirmed under higher disease pressure in future seasons.
AcknowledgementsThis research was funded by NSW DPI, NWLLS and GRDC under project UA00127: Pulse Breeding Australia faba bean breeding program. Thanks to Ivan Stace (NSW DPI) for technical assistance.

CR
OP
PR
OTE
CTI
ON
INDEPENDENT RESEARCH FOR INDUSTRY | 99
Chickpea Phytophthora root rot – 2015 varietal rankings and yield lossesKevin Moore1, Lisa Kelly2, Kristy Hobson1, Steve Harden1, Willy Martin3, Kris King3, Gail Chiplin1 and Sean Bithell1
1 NSW DPI, Tamworth 2 DAFQ Toowoomba 3 DAFQ Warwick
Key findingsIn a wet season, substantial yield losses (94%) from Phytophthora root rot (PRR) occurred in susceptible chickpea varieties such as PBA BoundaryA.
Varieties with improved resistance to PRR (PBA HatTrickA and YorkerA) can also have large yield losses (68–79%) in a season highly conducive to PRR.
Although yield losses will occur in seasons highly conducive to PRR, crosses between chickpea and wild Cicer species, such as the PBA breeding line CICA1328, currently offer the best levels of PRR resistance.
IntroductionPhytophthora medicaginis (Pm), the cause of Phytophthora root rot (PRR) in chickpea, is endemic and widespread in southern Qld and northern NSW, where it carries over from season to season on infected chickpea volunteers, lucerne, native medics and as resistant structures (oospores) in the soil. Although registered for use on chickpeas, metalaxyl seed treatment is expensive, does not provide season-long protection and is not recommended. There are no in-crop control measures for PRR and reducing losses from the disease are based on avoiding risky paddocks and choosing the right variety.
Detailed information on control of PRR in chickpea is available in the Australian Pulse bulletin Chickpea: Managing phytophthora root rot.
Current commercial varieties differ in their resistance to Pm, with Yorker and PBA HatTrick having the best resistance and are rated MR (moderately resistant). Historically, Yorker has been slightly better than PBA HatTrick, while Jimbour is MR–MS (moderately resistant to moderately susceptible), Flipper and Kyabra are MS and PBA Boundary has the lowest resistance of S (susceptible).
From 2007 to 2015, PRR yield loss trials at the DAF Qld Hermitage Research Station at Warwick in Queensland have evaluated a range of varieties and advanced PBA breeding lines.
Site detailsLocation: Hermitage Research Station, Warwick, QLDDisease and yield loss predictionAll plots inoculated with Pm at sowingPRR level manipulated with and without the fungicide metalaxylThree replicatesCalculating yield loss caused by PRR% loss = 100 x (average yield of metalaxyl-treated plots – average yield of nil metalaxyl plots)/Average yield of metalaxyl treated plots
TreatmentsGenotypes CICA0912
CICA1007 CICA1328 (=D06318>F3BREE2AB016) D06344>F3BREE2AB027 PBA BoundaryA PBA HatTrickA YorkerA
PRR protection (i) seed treatment with thiram, thiabendazole and metalaxyl plus regular soil drenches with metalaxyl (ii) seed treatment with thiram + thiabendazole only with no soil drenches
Results• In the absence of PRR (metalaxyl seed + soil), yields were close to commercial crop
averages for the 2015 season – the lowest yielding lines and varieties (CICA1328, Yorker and PBA HatTrick) achieving close to 2.5 t/ha (Table 1).
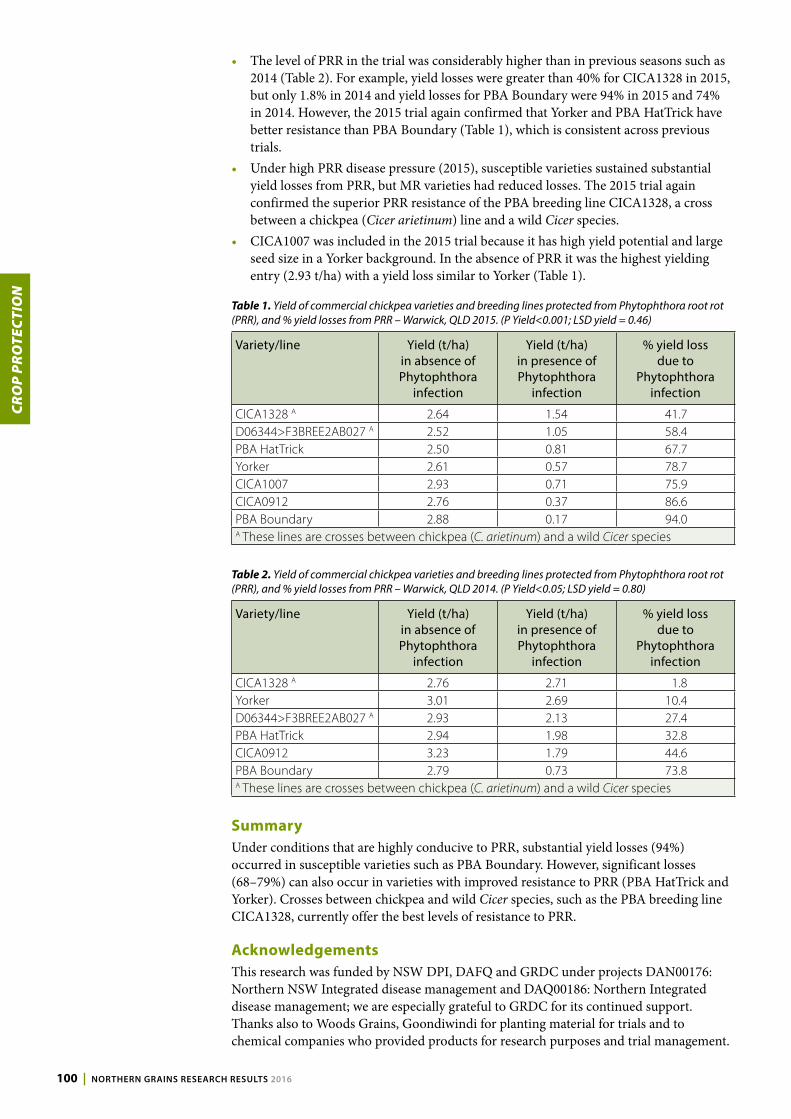
CR
OP
PR
OTE
CTI
ON
100 | NORTHERN GRAINS RESEARCH RESULTS 2016
• The level of PRR in the trial was considerably higher than in previous seasons such as 2014 (Table 2). For example, yield losses were greater than 40% for CICA1328 in 2015, but only 1.8% in 2014 and yield losses for PBA Boundary were 94% in 2015 and 74% in 2014. However, the 2015 trial again confirmed that Yorker and PBA HatTrick have better resistance than PBA Boundary (Table 1), which is consistent across previous trials.
• Under high PRR disease pressure (2015), susceptible varieties sustained substantial yield losses from PRR, but MR varieties had reduced losses. The 2015 trial again confirmed the superior PRR resistance of the PBA breeding line CICA1328, a cross between a chickpea (Cicer arietinum) line and a wild Cicer species.
• CICA1007 was included in the 2015 trial because it has high yield potential and large seed size in a Yorker background. In the absence of PRR it was the highest yielding entry (2.93 t/ha) with a yield loss similar to Yorker (Table 1).
Table 1. Yield of commercial chickpea varieties and breeding lines protected from Phytophthora root rot (PRR), and % yield losses from PRR – Warwick, QLD 2015. (P Yield<0.001; LSD yield = 0.46)
Variety/line Yield (t/ha) in absence of Phytophthora
infection
Yield (t/ha) in presence of Phytophthora
infection
% yield loss due to
Phytophthora infection
CICA1328 A 2.64 1.54 41.7D06344>F3BREE2AB027 A 2.52 1.05 58.4PBA HatTrick 2.50 0.81 67.7Yorker 2.61 0.57 78.7CICA1007 2.93 0.71 75.9CICA0912 2.76 0.37 86.6PBA Boundary 2.88 0.17 94.0A These lines are crosses between chickpea (C. arietinum) and a wild Cicer species
Table 2. Yield of commercial chickpea varieties and breeding lines protected from Phytophthora root rot (PRR), and % yield losses from PRR – Warwick, QLD 2014. (P Yield<0.05; LSD yield = 0.80)
Variety/line Yield (t/ha) in absence of Phytophthora
infection
Yield (t/ha) in presence of Phytophthora
infection
% yield loss due to
Phytophthora infection
CICA1328 A 2.76 2.71 1.8Yorker 3.01 2.69 10.4D06344>F3BREE2AB027 A 2.93 2.13 27.4PBA HatTrick 2.94 1.98 32.8CICA0912 3.23 1.79 44.6PBA Boundary 2.79 0.73 73.8A These lines are crosses between chickpea (C. arietinum) and a wild Cicer species
SummaryUnder conditions that are highly conducive to PRR, substantial yield losses (94%) occurred in susceptible varieties such as PBA Boundary. However, significant losses (68–79%) can also occur in varieties with improved resistance to PRR (PBA HatTrick and Yorker). Crosses between chickpea and wild Cicer species, such as the PBA breeding line CICA1328, currently offer the best levels of resistance to PRR.
AcknowledgementsThis research was funded by NSW DPI, DAFQ and GRDC under projects DAN00176: Northern NSW Integrated disease management and DAQ00186: Northern Integrated disease management; we are especially grateful to GRDC for its continued support. Thanks also to Woods Grains, Goondiwindi for planting material for trials and to chemical companies who provided products for research purposes and trial management.

CR
OP
PR
OTE
CTI
ON
INDEPENDENT RESEARCH FOR INDUSTRY | 101
Effect of chickpea Ascochyta blight on the yield of current varieties and advanced breeding lines – Tamworth 2015Kevin Moore, Kristy Hobson, Steve Harden, Paul Nash, Gail Chiplin and Sean BithellNSW DPI, Tamworth
Key findingsUnder extreme disease pressure, Ascochyta blight can be successfully and economically managed on susceptible varieties such as KyabraA.
However, Ascochyta blight management is easier and more cost effective on varieties with improved resistance such as PBA HatTrickA and PBA BoundaryA.
The 2015 Ascochyta trial, confirmed the next variety planned for release (CICA0912) has an improved level of resistance to Ascochyta blight.
IntroductionAscochyta blight (AB, Phoma rabiei previously called Ascochyta rabiei) first caused widespread damage to chickpeas in eastern Australia in 1998. At the time, all Australian chickpea varieties were susceptible, some highly so. Following the 1998 epidemic, efforts to develop chickpea varieties with resistance to AB were increased, aided by considerable support from GRDC.
HowzatA, released in 2002, had better resistance than Amethyst but it was not until 2005 when FlipperA and YorkerA were released that substantial gains in AB resistance were available to the chickpea industry. PBA HatTrickA (2009) and PBA BoundaryA (2011) provided even better levels of AB resistance. Since 1999, field trials have been conducted to determine yield losses from AB in current chickpea varieties and advanced breeding lines. We report here on the 2015 trial.
Site detailsLocation: Tamworth Agricultural Institute, TamworthSown: 18–19 May 2014, standing cereal stubble, tyne openers, 40 cm row
spacing, plots 4 m × 10 mAscochyta inoculation: 16 June, during a rainfall event, a cocktail of 20
isolates collected from commercial crops (1999–2014), 1,066,666 spores/mL in 200 L/ha water. It rained for four days, and every unprotected plant had multiple AB infections
Rainfall: From inoculation to desiccation (1 December), 341 mm on 46 rain days (32 days >1.0 mm); long-term average for same period 141 mm on 20 rain days (15 days >1.0 mm)
TreatmentsGenotype (10): Six released varieties and four advanced PBA breeding lines
(Table 2)Fungicide (3): Low disease (seven sprays 1.0 L/ha chlorothalonil – 720 g/L active);
High disease (nil sprays); Variety management package (VMP) treatment with a low, off-label rate of chlorothalonil
All fungicides applied before rain. Table 1 summarises the number of rain days, rainfall and application dates for the low disease sprays.
Replicates: FourData for the VMP treatment are not presented here, but we describe the strategies for each genotype as these reflect their AB rating. The genotypes were grouped as susceptible (S), moderately susceptible (MS), moderately resistant (MR) and resistant (R). Timing the first VMP spray was based on these groupings. The first group S VMP spray for KyabraA was applied before inoculation. The first group MS VMP spray for Genesis Kalkee™, PBA MonarchA, CICA1302 and CICA1303 was applied after three infection events (six rain days, 67 mm rain post inoculation); for group MR VMP spray (PBA HatTrickA and PBA BoundaryA, CICA1007) and R (CICA0912, Genesis 425™) the first spray occurred after four infection events (14 rain days, 79 mm rain post inoculation).
The trial was split across two experiments: one on red soil, one on heavy black soil. The latter had waterlogging problems that affected AB resistance (data not presented) so results are presented only for the red soil.

CR
OP
PR
OTE
CTI
ON
102 | NORTHERN GRAINS RESEARCH RESULTS 2016
ResultsThe early and heavy rate of inoculation, combined with extremely favourable conditions, resulted in high levels of AB development, so much so that unprotected susceptible varieties were dead by the end of July and even unprotected PBA HatTrick had severe damage (stem breakage).
The key findings of VMP15 (Table 2) were: • Under extreme disease pressure, AB can be successfully managed on susceptible
varieties by frequently applying registered rates of chlorothalonil.• Well managed Kyabra yielded 1862 kg/ha with a gross margin (GM) of $954/ha.• Under extreme disease pressure, unsprayed PBA HatTrick yielded only 417 kg/ha
(GM $4/ha).• The new line CICA0912 performed well, yielding 1568 kg/ha (GM $844/ha) with no
foliar fungicide application.The PBA HatTrick performance in VMP15 was both a surprise and a disappointment. In all previous VMP trials at Tamworth, unsprayed (nil treatment) PBA HatTrick has produced substantial and profitable yields. For example in the 2010 trial, VMP10, it produced 1707 kg/ha (Table 3), which was a year that also had above average rain in June/July that persisted throughout the season, so was in fact more conducive to AB development than 2015 (although 2015 had more rain days in June/July than 2010).
Both VMP15 and VMP10 were in seasons that favoured AB development and so provide a strong evaluation of current varieties and advanced breeding lines. A number of the key findings of VMP10 were similar to VMP15: • Under extreme disease pressure, AB can be successfully managed on susceptible
varieties with registered rates of chlorothalonil.• Well managed Jimbour yielded nearly 3 t/ha with a GM of $750/ha.• Varieties and advanced breeding lines with improved resistance to AB were the most
profitable.• However, the two VMP experiments differed in that:
■ In 2010 PBA Boundary performed exceptionally well, yielding over 2 t/ha without applying any foliar fungicide, a minimal yield loss (4%), whereas in 2015 AB reduced yield by 53%.
■ Under extreme disease pressure in 2010, unsprayed PBA HatTrick still gave a profitable yield, but in 2015 the unsprayed PBA HatTrick yield was much lower and not profitable.

CR
OP
PR
OTE
CTI
ON
INDEPENDENT RESEARCH FOR INDUSTRY | 103
Table 1. VMP15 dates in 2015, number of rain days (>1 mm rain), mm of rain and number of 1 L/ha chlorothalonil applications; trial sown 18–19 May and inoculated 16 June
Date Rain days (number)
Rainfall (mm)
1 L spray
28–31 May 4 3112 Jun Ist All
genotypes16–19 Jun 4 6122 Jun 1 130 Jun–01 Jul 2 49 Jul 2nd All
genotypes10–17 Jul 8 1221 Jul 3rd All
genotypes24–27 Jul 4 1321 Aug 4th All
genotypes23–24 Aug 2 401 Sep 5th All
genotypes3 Sep 1 114 Sep 1 616 Sep 1 411 Oct 6th All
genotypes14 Oct 1 1622 Oct 1 1823 Oct 1 1226 Oct 1 10 7th All
genotypes
The following factors in VMP15 could have contributed to the nil PBA HatTrick treatment having a poorer yield than in earlier VMP trials:• Parts of VMP15 were waterlogged during June/July. Past experience and commercial
cropping has shown that any stress, including waterlogging, is known to compromise the moderate resistance of PBA HatTrick to AB.
• Interaction between herbicide damage and AB resistance – VMP15 sustained minor herbicide injury in August. This could have also compromised the moderate resistance of PBA HatTrick to AB.
• Change in the pathogen. The isolates used in VMP10 were collected from crops in 2008 and 2009 compared with the isolates used in VMP15, which were collected from 1999 to 2014. Recently collected isolates have shown a higher level of aggressiveness on PBA HatTrick. See Chickpea Ascochyta: latest research on variability and implications for management from the GRDC for further information.

CR
OP
PR
OTE
CTI
ON
104 | NORTHERN GRAINS RESEARCH RESULTS 2016
Table 2. Number and rate/ha of chlorothalonil sprays, cost of application, grain yield, and gross margin (GM) for seven desi and three kabuli chickpea varieties on red soil in the Tamworth VMP15 trial. (GMs also take into account other production costs estimated at $300/ha; chickpea price desi $730/t; kabuli $1000/t) Yield P<0.001, LSD 417 kg/ha; GM P<0.001, LSD $354/ha
Variety and treatment No. sprays Cost ($/ha) Yield (kg/ha) GM ($/ha)
CICA0912 1.0 L 7 105 1853 984Genesis425 1.0 L 7 105 1875 1470CICA1007 1.0 L 7 105 1846 982PBA Boundary 1.0 L 7 105 1755 876PBA Monarch 1.0 L 7 105 1274 869PBA HatTrick 1.0 L 7 105 1722 852CICA1302 1.0 L 7 105 1864 954CICA1303 1.0 L 7 105 1949 1018Kyabra 1.0 L 7 105 1862 954Genesis Kalkee 1.0 L 7 105 1659 1254CICA0912 nil 0 0 1568 844Genesis425 nil 0 0 1144 844CICA1007 nil 0 0 1083 491PBA Boundary nil 0 0 1233 600PBA Monarch nil 0 0 887 587PBA HatTrick nil 0 0 417 4CICA1302 nil 0 0 0 −300CICA1303 nil 0 0 0 −300Kyabra nil 0 0 0 −300Genesis Kalkee nil 0 0 1589 1289
Table 3. Number and rate/ha of chlorothalonil sprays, cost of application, grain yield, and gross margin (GM) for four desi chickpea varieties in the Tamworth VMP10 trial. (GMs also take into account other production costs estimated at $300/ha; chickpea price $450/t)
Variety and treatment No. sprays Cost ($/ha) Yield (kg/ha) GM ($/ha)
Jimbour 1.0 L 14 294 2988 750*Kyabra 1.0 L 14 294 2549 553PBA HatTrick 1.0 L 14 294 2604 578PBA Boundary 1.0 L 14 294 2410 491Jimbour nil 0 0 0 –300Kyabra nil 0 0 0 –300PBA HatTrick nil 0 0 1707 468PBA Boundary nil 0 0 2320 744*KyabraA 1.0 L one of the four reps was severely affected by waterlogging which (i) compromised AB control and (ii) impacted on yield.
SummaryUnder extreme disease pressure, AB can be successfully and economically managed on susceptible varieties such as KyabraA and JimbourA. However, AB management is easier and more cost effective on varieties with improved resistance e.g PBA Boundary. VMP15 confirmed that the next variety planned for release (CICA0912) has improved AB resistance.
AcknowledgementsThis research was made possible by the significant contributions of growers through both trial co-operation, field access and the support of the GRDC; the authors most gratefully thank them and the GRDC. The research was funded by NSW DPI and GRDC under project DAN00176: Northern NSW integrated disease management. Thanks also to Woods Grains, Goondiwindi and Glenn Coughran, Beefwood, Moree for planting material for trials and to chemical companies who provided products for research purposes and trial management.

CR
OP
PR
OTE
CTI
ON
INDEPENDENT RESEARCH FOR INDUSTRY | 105
Yield impact of crown rot and sowing time on winter cereal crop and variety selection – Tulloona 2015Steven Simpfendorfer, Rick Graham and Neroli GrahamNSW DPI, Tamworth
IntroductionCrown rot, caused predominantly by Fusarium pseudograminearum (Fp), is a major constraint to winter cereal (wheat, barley and durum) production in northern NSW and southern Qld. Infection is characterised by a honey–brown discolouration at the base of infected tillers. All winter cereal crops host the crown rot (CR) fungus. Yield losses vary between winter cereal crops, with the approximate order of increasing loss being oats (least), barley, triticale, bread wheat and durum (most). Yield loss is related to the expression of whiteheads in CR infected tillers that are induced by moisture and/or temperature stress during flowering and grain-filling.
Previous NSW DPI research has demonstrated that earlier sowing can reduce CR expression by bringing the grain-filling period forward when temperatures are generally lower and less favourable to CR expression. Earlier sowing also theoretically facilitates increased root growth early in the season, which can result in deeper root exploration and improved access to soil moisture. Evapotranspiration stress during grain-filling can also be manipulated through the relative maturity of crop type and variety choice. Variety maturity interacts with the expression of CR, which depends when stress occurs within a given season and the variety’s developmental stage. In the northern grains region, sowing time and variety maturity need to be balanced against the risk of excessive early vegetative growth depleting soil moisture reserves before grain-filling, and the risk of frost versus terminal heat stress during flowering and grain development.
The impact of crown rot on yield and grain quality was examined in a range of durum, bread wheat and barley varieties across two sowing times near Tulloona in north-western NSW in 2015.
Site detailsLocation: “Myling”, TulloonaCo-operators: Jack and Julia GooderhamSowing dates: Time of sowing: TOS1–6 May 2015; TOS2–4 June 2015Fertiliser: 90 kg/ha urea and 70 kg/ha Granulock® Z at sowingStarting N: 137 kg/ha nitrate nitrogen (N) to 1.2 mStarting water: ~209 mm (0–120 cm)In-crop rainfall: 150 mmPreDicta B®: 2.5 Pratylenchus thornei/g soil (medium risk),
2.0 log Fusarium DNA/g (medium risk) at sowing
Treatments• Twenty-four barley entries (Figure 1)• Five durum wheat entries (Figure 1)• Nineteen bread wheat entries (Figure 1)• Added (plus) or no added (minus) crown rot at sowing using sterilised durum grain
colonised by at least five different isolates of Fp.
ResultsSowing time effectYield was reduced from 5.11 t/ha with TOS1 down to 4.23 t/ha with TOS2 in the no added CR treatment when averaged across the 48 winter cereal entries. This represented a 17% (0.89 t/ha) reduction in yield potential with a delayed sowing of four weeks. In the presence of high levels of crown rot infection (added CR) average yield across entries was
Key findingsSowing date and variety maturity choice is a balance between the risk of frost versus terminal heat stress.
Earlier sowing can increase frost risk, but also generally maximises yield potential and reduces the extent of yield loss from crown rot.
Cereal crop and variety selection can have a significant impact on yield where there are high levels of crown rot infection.
Durum wheat, barley or bread wheat varieties with increased susceptibility to crown rot, should only be grown in paddocks known to have low-risk inoculum levels based on testing (e.g. PreDicta B®).
All winter cereal varieties are susceptible to crown rot infection and will not significantly reduce inoculum levels for subsequent crops. Cereal crop and/or variety choice is not the sole solution to crown rot.
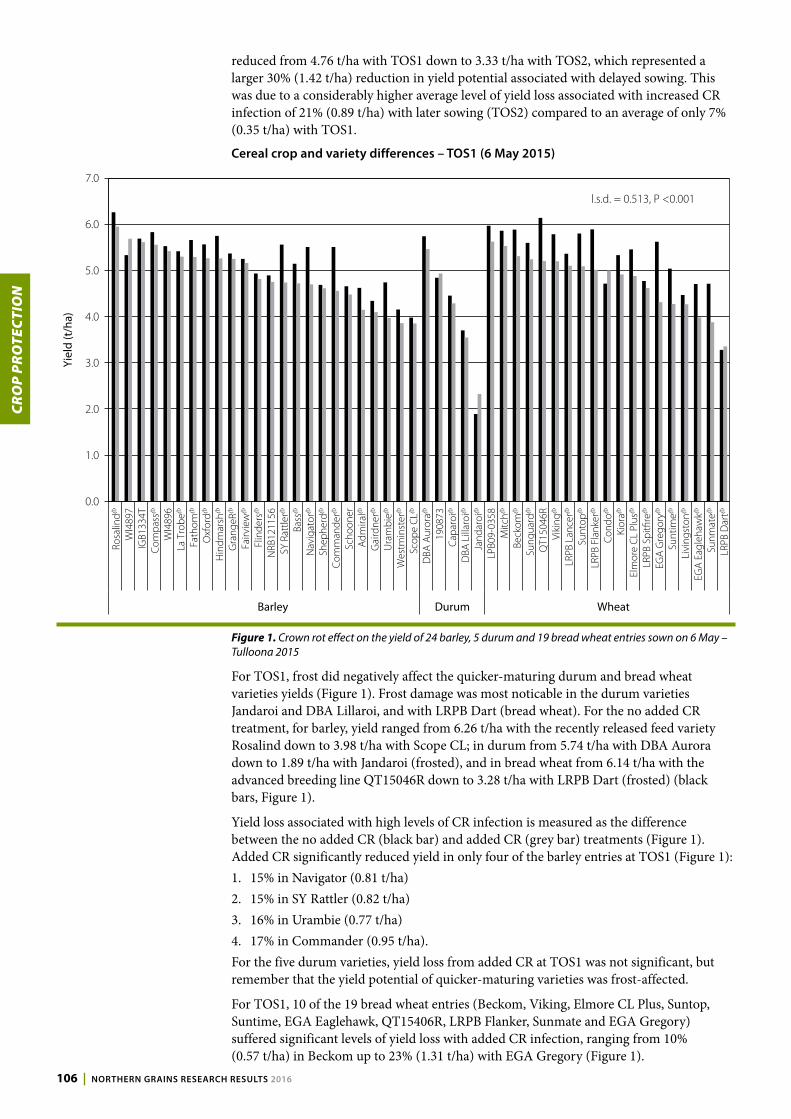
CR
OP
PR
OTE
CTI
ON
106 | NORTHERN GRAINS RESEARCH RESULTS 2016
reduced from 4.76 t/ha with TOS1 down to 3.33 t/ha with TOS2, which represented a larger 30% (1.42 t/ha) reduction in yield potential associated with delayed sowing. This was due to a considerably higher average level of yield loss associated with increased CR infection of 21% (0.89 t/ha) with later sowing (TOS2) compared to an average of only 7% (0.35 t/ha) with TOS1.
Cereal crop and variety differences – TOS1 (6 May 2015)
0.0
1.0
2.0
3.0
4.0
5.0
6.0
7.0
Rosa
lindA
WI4
897
IGB1
334T
Com
pass
A
WI4
896
La T
robe
A
Fath
omA
Oxf
ordA
Hin
dmar
shA
Gra
ngeR
A
Fairv
iew
A
Flin
ders
A
NRB
1211
56SY
Rat
tlerA
Bass
A
Nav
igat
orA
Shep
herd
A
Com
man
derA
Scho
oner
Adm
iralA
Gai
rdne
rA
Ura
mbi
eA
Wes
tmin
ster
A
Scop
e C
LA
DBA
Aur
oraA
1908
73C
apar
oiA
DBA
Lill
aroi
A
Jand
aroi
A
LPB0
9-03
58M
itchA
Beck
omA
Sung
uard
A
QT1
5046
RVi
king
A
LRPB
Lan
cerA
Sunt
opA
LRPB
Fla
nker
A
Con
doA
Kior
aA
Elm
ore
CL
Plus
A
LRPB
Spi
tfire
A
EGA
Gre
gory
A
Sunt
imeA
Livi
ngst
onA
EGA
Eag
leha
wkA
Sunm
ateA
LRPB
Dar
tA
Barley Durum Wheat
Yiel
d (t
/ha)
l.s.d. = 0.513, P <0.001
Figure 1. Crown rot effect on the yield of 24 barley, 5 durum and 19 bread wheat entries sown on 6 May – Tulloona 2015
For TOS1, frost did negatively affect the quicker-maturing durum and bread wheat varieties yields (Figure 1). Frost damage was most noticable in the durum varieties Jandaroi and DBA Lillaroi, and with LRPB Dart (bread wheat). For the no added CR treatment, for barley, yield ranged from 6.26 t/ha with the recently released feed variety Rosalind down to 3.98 t/ha with Scope CL; in durum from 5.74 t/ha with DBA Aurora down to 1.89 t/ha with Jandaroi (frosted), and in bread wheat from 6.14 t/ha with the advanced breeding line QT15046R down to 3.28 t/ha with LRPB Dart (frosted) (black bars, Figure 1).
Yield loss associated with high levels of CR infection is measured as the difference between the no added CR (black bar) and added CR (grey bar) treatments (Figure 1). Added CR significantly reduced yield in only four of the barley entries at TOS1 (Figure 1):1. 15% in Navigator (0.81 t/ha)2. 15% in SY Rattler (0.82 t/ha)3. 16% in Urambie (0.77 t/ha)4. 17% in Commander (0.95 t/ha).For the five durum varieties, yield loss from added CR at TOS1 was not significant, but remember that the yield potential of quicker-maturing varieties was frost-affected.
For TOS1, 10 of the 19 bread wheat entries (Beckom, Viking, Elmore CL Plus, Suntop, Suntime, EGA Eaglehawk, QT15406R, LRPB Flanker, Sunmate and EGA Gregory) suffered significant levels of yield loss with added CR infection, ranging from 10% (0.57 t/ha) in Beckom up to 23% (1.31 t/ha) with EGA Gregory (Figure 1).

CR
OP
PR
OTE
CTI
ON
INDEPENDENT RESEARCH FOR INDUSTRY | 107
Cereal crop and variety differences – TOS2 (4 June 2015)No frost damage was evident in any of the winter cereal entries when sowing time was delayed to 4 June in 2015. In the no added CR treatment, barley yields ranged from from 5.04 t/ha with the advanced breeding line W14896 down to 3.31 t/ha with Gairdner; in the durum from 4.76 t/ha with DBA Aurora down to 4.21 t/ha with Caparoi; and in bread wheat from 4.80 t/ha with Livingston down to 3.40 t/ha with EGA Eagkehawk (black bars, Figure 2).
0.0
1.0
2.0
3.0
4.0
5.0
6.0
7.0
Rosa
lind
IGB1
334T
WI4
897
Com
pass
WI4
896
Fath
omSh
ephe
rdLa
Tro
beH
indm
arsh
Com
man
der
SY R
attle
rFa
irvie
wG
rang
eRN
avig
ator
Scho
oner
NRB
1211
56W
estm
inst
erSc
ope
CL
Ura
mbi
eBa
ssFl
inde
rsO
xfor
dG
aird
ner
Adm
iral
DBA
Lill
aroi
Jand
aroi
DBA
Aur
ora
1908
73C
apar
oiLR
PB D
art
LPB0
9-03
58M
itch
Sung
uard
Con
doSu
ntop
Livi
ngst
onLR
PB L
ance
rEl
mor
e C
L Pl
usQ
T150
46R
LRPB
Spi
tfire
Viki
ngBe
ckom
Kior
aLR
PB F
lank
erEG
A G
rego
rySu
ntim
eSu
nmat
eEG
A E
agle
haw
k
Barley Durum Wheat
Yiel
d (t
/ha)
No added CR Added CR
l.s.d = 0.513, P <0.001
Figure 2. Crown rot effect on the yield of 24 barley, 5 durum and 19 bread wheat entries sown on the 4 June – Tulloona 2015
For TOS2, added CR caused significant levels of yield loss in 19 of the 24 barley entries (except Rosalind, IGB1334T, W14897, La Trobe and Hindmarsh) and ranged from 12% in Shepherd (0.54 t/ha) up to 30% in Admiral (1.07 t/ha) (Figure 2).
Added CR caused all five durum varieties to suffer relatively high and significant levels of yield loss, with no difference between variety. Yield loss ranged from 32% in the advanced durum breeding line 190873 (1.47 t/ha) up to 35% in DBA Aurora (1.65 t/ha).
Added CR infection caused 15 of the 19 bread wheat entries (except LRPB Dart, Sunguard, LRPB Lancer and Elmore CL Plus) to suffer significant levels of yield loss. They ranged from 17% (0.75 t/ha) in Mitch up to 37% (1.64 t/ha) with LRPB Flanker (Figure 2).
Concentrating purely on the extent of yield loss associated with CR infection in the different varieties can potentially be misleading, as entries can vary markedly in their actual yield potential in a given environment and season. Amongst the bread wheat entries, Sunguard and LRPB Lancer had the lowest percentage yield loss from CR when sown on 4 June (TOS2) at Tulloona in 2015. However, in the absence of added CR (black bars) Sunguard was significantly lower yielding than Livingston (0.70 t/ha), Condo (0.59 t/ha), and the two numbered lines LPB09-0358 and QT15046R (0.58 t/ha) (Figure 2). LRPB Lancer, similarly in the no added CR treatment for TOS2, was between 0.99 t/ha to 0.53 t/ha lower yielding than the bread wheat entries Livingston, Condo, LPB09-0358, QT15046R, Suntop, Mitch, LRPB Flanker , Beckom and LRPB Dart at

CR
OP
PR
OTE
CTI
ON
108 | NORTHERN GRAINS RESEARCH RESULTS 2016
Tulloona in 2015. Hence, selecting a variety on the basis of reduced yield loss to CR should not come at the expense of yield potential at the targeted sowing time.
Another option for evaluating the data is to concentrate on the absolute yield achieved under high disease pressure in the added CR treatments at each sowing time (grey bars; Figures 1 and 2). Under high CR pressure for TOS1 (6 May) only three barley varieties (Urambie, Westminster and Scope CL were lower yielding than Commander (range 0.59 to 0.71 t/ha), while 11 barley entries (Fairview to Rosalind) were higher yielding than Commander (range 0.60 to 1.39 t/ha; Figure 1).
Due largely to frost in the durum entries for TOS1, DBA Lillaroi (0.74 t/ha) and Jandaroi (1.97 t/ha) were significantly lower yielding than Caparoi, while DBA Aurora was 1.17 t/ha higher yielding than Caparoi in the added CR treatment.
With the bread wheat entries for TOS1, only the severely frost affected variety LRPB Dart was lower yielding (0.95 t/ha) than the widely grown variety EGA Gregory, while 12 entries (Elmore CL Plus to LPB09-0358) were higher yielding than EGA Gregory (range 0.57 t/ha to 1.31 t/ha; Figure 1).
The effects from high levels of CR infection on yield were considerably greater with the later sowing time of 4 June (TOS2), but significant yield benefits were still apparent with potential crop and variety selections. Under high CR pressure for TOS2, 10 barley varieties (Schooner to Admiral) were lower yielding than Commander (range 0.56 to 1.33 t/ha), while only two barley entries (IGB1334T and Rosalind) were higher yielding than Commander (range 0.55 to 0.77 t/ha; Figure 2).
The five durum entries showed no significant difference in yield under high levels of CR infection for TOS2.
For the bread wheat entries in TOS2 with added CR, only the long-season entry EGA Eaglehawk was lower yielding (0.74 t/ha) than EGA Gregory, while nine entries (Elmore CL Plus to LRPB Dart) provided a significant yield benefit over EGA Gregory (range 0.57 t/ha to 1.05 t/ha; Figure 2)
ImplicationsIn the northern grains region, sowing date and variety maturity choice is a balance between the risk of frost versus terminal heat stress. Both can have a significant impact on grain yield as highlighted at Tulloona in 2015. Frost risk needs to be kept in perspective and sowing date matched to the relative maturity of a chosen variety. A very conservative approach to frost risk, based on recent experience, runs the risk of pushing grain-filling too far into warmer conditions. This, itself, can reduce yield, but if there is also an underlying issue with CR, then delayed sowing significantly exacerbates the expression of this disease with negative effects on both yield and grain quality.
Winter cereal crop types and varieties do differ in their extent of yield loss from CR infection. Hence, producing more susceptible cereal crop types such as durum wheat, or bread wheat varieties such as EGA Gregory, needs to be targeted at low risk paddocks based on either stubble or DNA testing such as PreDicta B®. Unfortunately, grain quality data was not available at the time of writing this paper, but should be included in any variety selection considerations.
Barley is generally considered more CR tolerant (reduced yield impact) than bread wheat as its earlier maturity tends to largely escape severe evapotranspiration stress, which exacerbates expression. However, this trial highlights that this escape mechanism depends on sowing time, with barley entries suffering an average 18% yield loss from CR at the later sowing time (4 June) relative to only 6% with the earlier sowing time (6 May). Barley is very susceptible to infection from the CR fungus and, if sown later in its planting window, will be trying to fill grain under warmer conditions, which can lead to significant yield loss from CR. This interaction is also generally more pronounced in varieties with longer maturity such as Oxford, which did not have significant yield loss at the earlier sowing date, but suffered 26% yield loss from CR infection with delayed sowing.

CR
OP
PR
OTE
CTI
ON
INDEPENDENT RESEARCH FOR INDUSTRY | 109
If forced into planting a cereal crop in a high CR risk situation, then some barley varieties could provide a yield advantage over bread wheat in that season, provided early stress does not occur and the escape mechanism is not lost through delayed sowing. Some of the newer bread wheat varieties do appear to be closing this gap to some extent. However, a key message is that this decision is only potentially maximising profit in the current season. Growing barley over bread wheat will not help to reduce CR inoculum levels, as barley is still very susceptible to infection. Significant yield loss can still occur in the best of the barley and bread wheat varieties from high CR infection. Crop and variety choice is therefore not the sole solution to CR, but rather just one element of an integrated management strategy to limit losses from this disease.
Acknowledgments The research undertaken as part of projects DAN00175: National crown rot epidemiology and management program and DAN00167: Variety Specific Agronomy Packages for southern, central and northern NSW; is made possible by the significant contributions of growers through both trial co-operation and the support of the GRDC, the authors would like to thank them for their continued support. This project is co-funded by the NSW state government through NSW DPI who are also thanked for their support in fully funding two of our positions and for laboratory and other infrastructure costs. Soil-borne pathogen levels were determined using the DNA based soil test service PreDicta B® provided by the South Australian Research and Development Institute. Technical assistance provided by Stephen Morphett, Jim Perfrement, Jan Hosking, Mick Dal Santo, Robyn Shapland and Patrick Mortell is gratefully acknowledged. We finally thank Jack and Julia Gooderham for allowing us to conduct this trial on their property ‘Myling’ near Tulloona in 2015.

CR
OP
PR
OTE
CTI
ON
110 | NORTHERN GRAINS RESEARCH RESULTS 2016
Impact of wheat variety choice on the build up of Pratylenchus thornei and Pratylenchus neglectus – Wongarbon 2014Steven SimpfendorferNSW DPI, Tamworth
IntroductionThe root lesion nematodes (RLNs) Pratylenchus thornei (Pt) and P. neglectus (Pn) are widespread in cropping soils through central and northern NSW with Pt generally more widespread and at higher soil populations than Pn. Winter cereal varieties differ in the extent of yield loss from RLNs (tolerance) and the numbers of nematodes that multiply in their root systems within a season (resistance).
Resistance to RLNs is an important consideration as it dictates a variety’s effect on subsequent crops in the rotation. That is, more susceptible varieties allow greater multiplication of Pt or Pn in their root systems over a season, with wheat varieties often differing in their level of resistance to these two RLNs. The higher the resulting RLN population left in the soil, the greater the potential for a negative impact on the yield of subsequent crops.
A GRDC-funded wheat national variety trial (NVT) examining the yield potential of released and near release cultivars was conducted at Wongarbon in central NSW in 2014. The stubble of harvested plots was left intact and soil cores were taken in March 2015 to assess the effect of variety choice on Pt and Pn build-up in the soil under the 2014 plots. This type of testing evaluates the relative resistance of each variety to Pt and Pn under field conditions.
Site detailsLocation: “Hillview”, Wongarbon, central-west NSWCo-operator: Angus KellySowing date: 16 May 2014Fertiliser: 90 kg/ha Granulock® 12Z and 70 kg/ha urea at sowingPreDicta B®: 2.2 Pn/g soil (low risk), 2.3 Pt/g soil (medium risk) and nil
Fusarium at sowing (0–30 cm)Harvest date: 15 November 2014
Treatments• A total of 34 entries were in the main season evaluation trial: 20 released varieties and
14 advanced experimental lines.• All plots in the main season NVT trial were cored (10 cores/plot at 0–30 cm on
previous crop row) after harvest (March 2015) to determine final (Pf) for each variety.• Pt and Pn populations determined in all soil samples based on PreDicta B® analysis, a
DNA-based test provided by the South Australian Research and Development Institute (SARDI).
• Pt and Pn data transformed for analysis ln(x + 1) to determine significance with back-transformed values presented for released varieties only in Table 1 and Table 2.
Results• This site had a mixed RLN population at sowing following a legume pasture grown in
2012 and wheat crop in 2013. There was a medium level of both Pn and Pt across the site as measured separately for each of the six ranges at sowing. Variety impacts on final RLN numbers, as measured in March 2015, were significant for both Pn and Pt at the 95% confidence level.
• Significant differences were evident between varieties in final Pn populations developed in the top 30 cm of soil, which ranged from 0.6 Pn/g of soil (Viking and
Key findingsCereal variety choice can have a large impact on the build-up of Pratylenchus thornei (Pt) and Pratylenchus neglectus (Pn) populations within paddocks which can then impact on the performance of following crops and/or varieties in the rotation.
Significant differences were evident between varieties, with a 27-fold difference in final Pt populations between the best (LRPB GauntletA and SuntopA) and worst (Elmore CL PlusA) varieties.
Significant differences were also evident between varieties, with a 6.7-fold difference in final Pn populations between the best (VikingA and LivingstonA) and worst (CondoA) varieties.
Very susceptible varieties should be avoided in paddocks with known root lesion nematode (RLN) populations as they can increase the population to medium or high risk levels in one season.

CR
OP
PR
OTE
CTI
ON
INDEPENDENT RESEARCH FOR INDUSTRY | 111
Livingston) up to 4.0 Pn/g soil (Condo). This represents a 6.7-fold difference in final Pn populations between varieties (Table 1).
Table 1. Final Pratylenchus neglectus soil populations (0–30 cm) produced by 20 bread wheat varieties – Wongarbon 2014
Variety Pn/g soil Variety Pn/g soilVikingA 0.6 abc SunmateA 1.6 defghiLivingstonA 0.6 abc LRPB SpitfireA 1.7 defghiSunvaleA 1.1 bcd LRPB GauntletA 1.8 defghijLRPB CrusaderA 1.2 bcde LRPB FlankerA 1.8 defghijLRPB DartA 1.2 bcdef WallupA 2.1 defghijkGascoigneA 1.2 bcdef SunguardA 2.7 ghijklmVenturaA 1.3 cdef EGA GregoryA 2.9 hijklmSuntopA 1.4 cdefg EGA WylieA 3.1 jklmLRPB ImpalaA 1.5 defgh BaxterA 3.3 jklmElmore CL PlusA 1.6 defghi CondoA 4.0 lmValues followed by the same letter are not significantly different at 95% confidence level
• Significant differences were also evident between varieties in final Pt populations developed in the top 30 cm of soil, which ranged from 0.3 Pt/g of soil (LRPB Gauntlet and Suntop) up to 8.1 Pt/g soil (Elmore CL Plus). This represents a 27-fold difference in final Pt populations between varieties (Table 2).
• Some varieties appear to differ considerably in their relative resistance to the two RLNs. For example, LRPB Crusader ranked the 4th lowest variety for Pn but 3rd highest for final Pt population build-up.
• Viking appears to have a reasonable level of resistance to both Pratylenchus species, being equal lowest for Pn and the 3rd lowest variety for final Pt population build-up.
• Conversely, Condo appears to have a poorer level of resistance to both Pratylenchus species, being the highest for Pn and the 6th highest variety for final Pt population build-up.
Table 2. Final Pratylenchus thornei soil populations (0–30 cm) produced by 20 bread wheat varieties – Wongarbon 2014
Variety Pt/g soil Variety Pt/g soil
LRPB Gauntlet 0.3 a Sunvale 1.3 cdefghSuntop 0.3 ab LRPB Flanker 1.4 defghViking 0.5 abc Wallup 1.5 defghSunguard 0.6 abcd Baxter 1.7 efghiSunmate 0.8 abcdef Condo 2.4 hijkLivingston 1.0 abcdef EGA Gregory 3.2 jklLRPB Dart 1.0 abcdef Ventura 3.3 jklGascoigne 1.0 cdef LRPB Crusader 5.2 lmnLRPB Spitfire 1.1 cdef LRPB Impala 5.7 mnEGA Wylie 1.2 cdefg Elmore CL Plus 8.1 nValues followed by the same letter are not significantly different at 95% confidence level
ConclusionsCereal variety choice can have a significant impact on the build-up of RLN populations within paddocks, with a 27-fold difference in final Pt populations and a 6.7-fold difference in final Pn populations between the best and worst wheat varieties at this site in 2014. Starting Pt populations of below 2.0 Pt/ g soil are considered low risk; populations between 2.0 Pt/g and 15.0 Pt/g soil are considered medium risk; and above 15.0 Pt/g soil are considered high risk for yield loss in intolerant crops or varieties in the northern region. This could have serious consequences for production following Pt- or Pn-intolerant crops and/or varieties within the rotation, with some varieties maintaining medium risk RLN populations at this site in 2014. The worst of the varieties increased the Pt population from ~2.3 Pt/g at sowing in 2014 to 8.1 Pt/g soil as measured before sowing

CR
OP
PR
OTE
CTI
ON
112 | NORTHERN GRAINS RESEARCH RESULTS 2016
in 2015. Very susceptible varieties should be avoided in paddocks with known RLN populations as they can dramatically increase the population to medium or high risk levels in one season.
AcknowledgementsThis research was co-funded by NSW DPI and GRDC under the National Variety Trial Program and project DAV00128: National nematode epidemiology and management program. Thanks to the Kelly family for providing the trial site and to Peter Matthews (NSW DPI mobile trials unit) for sowing, maintaining and harvesting the NVT trial. Assistance provided by Robyn Shapland, Patrick Mortell, Finn Fensbo and Carla Lombardo (NSW DPI) in coring plots is greatly appreciated. Soil samples were assessed for RLN populations using PreDicta B® analysis by Dr Alan McKay and his team at SARDI in Adelaide.

CR
OP
PR
OTE
CTI
ON
INDEPENDENT RESEARCH FOR INDUSTRY | 113
Impact of wheat variety choice on the build up of Pratylenchus thornei – Coolah 2014Steven SimpfendorferNSW DPI, Tamworth
IntroductionThe root lesion nematode (RLN) Pratylenchus thornei (Pt) is widespread in cropping soils throughout central and northern NSW. Winter cereal varieties differ in their extent of yield loss from Pt (tolerance) and the numbers of nematodes that multiply in their root systems within a season (resistance). Resistance to Pt is an important consideration as it dictates a variety’s effect on subsequent crops in the rotation. That is, more susceptible varieties allow greater Pt multiplication in their root systems over a season. The higher the resulting Pt population left in the soil, the greater the potential for a negative effect on the yield of subsequent crops.
A GRDC-funded wheat national variety trial (NVT) examining the yield potential of released and near release cultivars was conducted at Coolah in central NSW in 2014. The stubble of harvested plots was left intact and soil cores were taken in March 2015 to assess the effect of variety choice on the build-up of Pt in the soil under the 2014 plots. This type of testing evaluates the relative resistance of each variety to Pt under field conditions.
Site detailsLocation: “Binnia”, Coolah, central western NSWCo-operator: Malcolm McMasterSowing date: 23 May 2014Fertiliser: 70 kg/ha urea and 90 kg/ha Granulock® 12Z at sowingPreDicta B®: 2.4 Pt/g (medium risk), nil Pn and 1.1 log Fusarium DNA/g soil
(low risk) at sowing (0–30 cm)Harvest date: 19 November 2014
Treatments• A total of 36 entries were in the main season evaluation trial consisting of 21 released
varieties and 15 advanced experimental lines.• All plots in the main season NVT trial were cored (10 cores/plot at 0–30 cm on
previous crop row) after harvest (March 2015) to determine final (Pf) for each variety.• Pt populations were determined in all soil samples based on PreDicta B® analysis, a
DNA-based test provided by the South Australian Research and Development Institute (SARDI).
• Pt data transformed for analysis ln(x + 1) to determine significance with back-transformed values for Pt are presented for released varieties only in Table 1.
Results• This site had a medium Pt population (2.4 Pt/g soil) at sowing following a long fallow
after a wheat crop grown in 2012. • Significant differences were evident between varieties in final Pt populations developed
in the top 30 cm of soil, which ranged from 2.8 Pt/g of soil (Suntop) up to 23.7 Pt/g soil (Elmore CL Plus). This represents an 8.5-fold difference in final Pt populations between varieties (Table 1).
• LRPB Crusader, LRPB Impala and Elmore CL Plus all increased the starting Pt population from medium risk to a high risk level (>15.0 Pt/g soil) for the subsequent 2015 crop.
• All other varieties increased the final Pt population to within a medium risk level (2.0–15.0 Pt/g soil) for the subsequent 2015 crop (Table 1).
Key findingsCereal variety choice can have a large impact on the build-up of Pratylenchus thornei (Pt) populations within paddocks, which can then affect the performance of subsequent crops and/or varieties in the rotation.
Significant differences were evident between varieties with an 8.5-fold difference in final Pt populations between the best (SuntopA) and worst (Elmore Cl PlusA) variety.
Very susceptible varieties should be avoided in paddocks with known root lesion nematode (RLN) populations as they can blowout the population to high risk levels in one season.

CR
OP
PR
OTE
CTI
ON
114 | NORTHERN GRAINS RESEARCH RESULTS 2016
Table 1. Final Pratylenchus thornei soil populations (0–30 cm) produced by 21 bread wheat varieties – Coolah 2014
Variety Pt/g soil Variety Pt/g soil
SuntopA 2.8 a SunvaleA 7.4 defghiLRPB GauntletA 3.0 ab BaxterA 7.4 defghiVikingA 4.4 abcd LivingstonA 7.5 defghiEGA WylieA 4.9 abcde CondoA 8.6 efghijkGascoigneA 5.0 abcdef VenturaA 9.6 ghijklSunguardA 5.7 bcdefg EGA GregoryA 9.9 hijklmLRPB DartA 6.0 cdefgh WallupA 10.0 ghijklmnSF OvaloA 6.8 cdefghi LRPB CrusaderA 17.9 opSunmateA 7.1 cdefghi LRPB ImpalaA 18.2 opLRPB FlankerA 7.2 cdefghi Elmore CL PlusA 23.7 pLRPB SpitfireA 7.4 cdefghi Values followed by the same letter are not significantly different at 95% confidence level
ConclusionsCereal variety choice can significantly affect the build-up of Pt populations within paddocks, with an 8.5-fold difference in final populations between the best and worst wheat variety at this site in 2014. In the northern region, starting Pt populations of <2.0 Pt/g soil are considered low risk; populations between 2.0 and 15.0 Pt/g soil are considered medium risk; and >15.0 Pt/g soil are considered high risk for yield loss in intolerant crops or varieties. This could have serious consequences for the production of subsequent Pt-intolerant crops and/or varieties within the rotation, with all varieties maintaining the medium risk, or increasing the Pt population to high risk at this site in 2014. The worst of the varieties increased the Pt population from ~2.4 Pt/g at sowing in 2014 to around 18–24 Pt/g soil – measured before sowing in 2015. Recent NSW DPI research has also demonstrated that significant yield loss still occurred in the moderately tolerant wheat variety EGA Gregory, with high risk (>15.0 Pt/g) populations in the top 30 cm of soil at sowing.
Very susceptible varieties should be avoided in paddocks with known RLN populations as they can dramatically increase the population to high risk levels in one season.
AcknowledgementsThis research was co-funded by NSW DPI and GRDC under the National Variety Trial Program and project DAV00128: National nematode epidemiology and management program. Thanks to the McMaster family for providing the trial site and to Peter Matthews (NSW DPI mobile trials unit) for sowing, maintaining and harvesting the NVT trial. Assistance provided by Robyn Shapland, Patrick Mortell, Finn Fensbo and Carla Lombardo (NSW DPI) in coring plots is greatly appreciated. Soil samples were assessed for RLN populations using PreDicta B® analysis by Dr Alan McKay and his team at SARDI in Adelaide.

CR
OP
PR
OTE
CTI
ON
INDEPENDENT RESEARCH FOR INDUSTRY | 115
Varietal impact on final soil populations of Pratylenchus thornei – Wongarbon 2015Steven SimpfendorferNSW DPI, Tamworth
IntroductionThe root lesion nematode (RLN), Pratylenchus thornei (Pt), has been demonstrated in repeated studies to be widespread across the northern region of NSW. At moderate to high populations it appears to interact with the expression of crown rot (CR), which can exacerbate yield loss from both pathogens. While the relative yield of cereal type and variety in the presence of CR infection in the current season requires consideration, the potential consequences of these choices on Pt build-up for subsequent crops within the rotation should not be overlooked. Final Pt populations developed by 16 different winter cereal entries was determined after harvest at Wongarbon in central NSW in 2015 to determine potential residual impacts on the differential build-up of Pt populations within a rotational sequence. This type of testing evaluates the relative resistance of each variety to Pt under field conditions.
Site detailsLocation: “Hillview”, Wongarbon, central-west NSWCo-operator: Angus Kelly and familySowing date: 27 May 2015Starting N: 44.5 mg/kg nitrate (0–60 cm)Fertiliser: 70 kg/ha urea and 95 kg/ha Granulock® 12Z at sowing; top-
dressed 100 kg/ha urea 9 JulyPreDicta B®: 5.6 Pt/g (medium risk), 0.2 Pn/g (low risk) and
2.3 log Fusarium DNA/g soil (medium risk) at sowing (0–30 cm)In-crop rainfall: 289 mmHarvest date: 2 December 2015
Treatments• A total of 16 winter cereal entries (one durum, two barley and 13 bread wheat;
Figure 1).• Added (plus) or no added (minus) CR at sowing using sterilised durum grain
colonised by at least five different isolates of Fusarium pseudograminearum (Fp).• All plots in the trial were cored (10 cores/plot at 0–30 cm on previous crop row) after
harvest (December 2015) to determine final (Pf) Pt populations for each variety.• Pt populations were determined in all soil samples based on PreDicta B® analysis, a
DNA-based test provided by the South Australian Research and Development Institute (SARDI). Levels of residual CR inoculum (log Fusarium DNA) were also determined from the same samples. Note they were non-spiked (no added stubble) soil cores as collected on the previous crop row primarily for Pt analysis.
• Pt data transformed for analysis ln(x + 1) to determine significance with back-transformed values for Pt presented in Figure 1.
Results• This site had a medium Pt population (5.6 Pt/g soil) at sowing following a wheat crop
grown in 2013 and a chickpea crop in 2014.• Adding Fp inoculum at sowing did not significantly affect final Pt numbers
(P = 0.207), with no significant interaction evident in any of the entries.• Significant differences were evident between varieties in final Pt populations
developed in the top 30 cm of soil, which ranged from 0.9 Pt/g soil after Suntop up
Key findingsCereal variety choice can have a large impact on the build-up of Pratylenchus thornei (Pt) populations within paddocks which can then impact on the performance of following crops and/or varieties in the rotation.
Significant differences were evident between varieties with a 22-fold difference in final Pt populations between the best (SuntopA) and worst (MitchA) variety.
Very susceptible varieties should be avoided in paddocks with known Root Lesion Nematode (RLN) populations as they can increase the population to high risk levels in one season.
There was no significant difference between varieties in the level of crown rot inoculum they developed during the season based on post-harvest PreDicta B® assessment.

CR
OP
PR
OTE
CTI
ON
116 | NORTHERN GRAINS RESEARCH RESULTS 2016
to 19.8 Pt/g soil after Mitch (Figure 1). This represents a 22-fold difference in final Pt populations between varieties (Figure 1).
• Mitch was the only entry which increased the starting Pt population from medium risk at sowing to a high risk level (>15.0 Pt/g soil) at harvest.
• Suntop, LRPB Gauntlet and LRPB Lancer all reduced the final Pt population from a medium risk level as sowing to a low risk level (<2.0 Pt/g soil) at harvest.
• All other varieties maintained the final Pt population to within a medium risk level (2.0–15.0 Pt/g soil) for the following crop in 2016 (Figure 1).
• CR risk is a sum of the DNA levels of all three Fusarium species known to cause CR expressed on a log scale where <0.6 is below detection, 0.6–1.4 is low, 1.4–2.0 is medium and >2.0 is high risk.
• All entries left low inoculum levels (0.6–1.4) in the uninoculated plots and high levels (2.0–3.0) in the inoculated plots, with no significant difference between entries.
cde
efg
a ab
bc cdcdef defg
efg efg fg fg fgg
h
cdef
0
2
4
6
8
10
12
14
16
18
20
Com
man
derA
La T
robe
A
Sunt
opA
LRPB
Gau
ntle
tA
LRPB
Lan
cerA
V071
76-6
9
Viki
ngA
Beck
omA
LRPB
Fla
nker
A
EGA
Gre
gory
A
LRPB
Spi
tfire
A
Sunm
ateA
QT1
5046
R
Sung
uard
A
Mitc
hA
Jand
aroi
A
Barley Wheat Durum
Fina
l Pra
tyle
nchu
s tho
rnei
/g s
oil (
0–30
cm
)
Figure 1. Impact of selected barley, bread wheat and durum entries on final postharvest soil populations of the root lesion nematode, Pratylenchus thornei (Pt/g soil) – Wongarbon 2015
Values within sites followed by the same letter are not significantly different (P = 0.05) based on transformed data (ln (x + 1)). Back-transformed values presented in graph. Sowing Pt soil populations averaged across ranges was 5.6 Pt/g soil at Wongarbon in 2015 at 0–30 cm.
ConclusionsCereal variety choice can significantly affect Pt population build-up within paddocks, with a 22-fold difference in final populations between the best and worst variety at this site in 2015. Starting Pt populations of below 2.0 Pt/g soil are considered low risk, populations between 2.0 and 15.0 Pt/g soil are considered medium risk and above 15.0 Pt/g soil are considered high risk for yield loss in intolerant crops or varieties in the northern region. This could have serious consequences for the production of following Pt intolerant crops and/or varieties within the rotation with all but three varieties (Suntop, LRPB Gauntlet and LRPB Lancer) maintaining medium risk, and with one variety (Mitch) increasing the Pt population to high risk at this site in 2015.
Recent NSW DPI research has also demonstrated that significant yield loss still occurred in the moderately tolerant wheat variety EGA Gregory with high risk (>15.0 Pt/g) populations in the top 30 cm of soil at sowing. Very susceptible varieties should be

CR
OP
PR
OTE
CTI
ON
INDEPENDENT RESEARCH FOR INDUSTRY | 117
avoided in paddocks with known RLN populations as they can dramatically increase the population to high risk levels in one season.
Although varieties appear to significantly differ in their yield in the presence of CR infection, differences in the levels of partial resistance, which limits the rate of spread of the CR fungus through the plant during the season, do not appear to result in significant variation in inoculum levels at harvest. Partial resistance does not actually prevent the plant from being infected, but rather slows the rate of fungal growth in the plant, arguably delaying expression of the disease, which can translate into a yield and grain quality (reduced screenings) benefit. However, the CR fungus, while being a pathogen when the winter cereal plant is alive, is also an effective saprophyte once the plant matures and dies. This saprophytic colonisation of infected tillers late in the season as the crop matures is the likely reason why limited practical differences in residual inoculum levels are created between varieties and winter cereal crop types.
Further research across sites is required to confirm differences in resistance of barley and wheat varieties to Pt, as this can have significant implications for the build-up of Pt populations within a paddock and hence, following rotational choices. For instance, while it appears that Mitch has a useful level of tolerance to CR (average 0.54 t/ha higher yielding than EGA Gregory in 2015), its increased susceptibility to Pt resulted in it taking nematode populations from a medium risk level at sowing to a high risk level by harvest at Wongarbon in 2015 (Figure 1). Hence, Mitch should only be considered for production in paddocks known to be free of Pt as its increased susceptibility to Pt is likely to override the yield gain in the presence of CR when considering the whole rotational sequence.
AcknowledgementsThis research was co-funded by NSW DPI and GRDC under project DAV00128: National nematode epidemiology and management program. Thanks to the Angus Kelly and family for providing the trial site and to Peter Matthews and Ryan Potts (NSW DPI mobile trials unit) for sowing, maintaining and harvesting the trial. Assistance provided by Robyn Shapland, Patrick Mortell and Jason McCulloch (NSW DPI) in coring plots is greatly appreciated. Soil samples were assessed for RLN populations using PreDicta B® analysis by Dr Alan McKay and his team at SARDI in Adelaide.

CR
OP
PR
OTE
CTI
ON
118 | NORTHERN GRAINS RESEARCH RESULTS 2016
Varietal impact on final soil populations of Pratylenchus thornei – Macalister, Qld 2015Steven SimpfendorferNSW DPI, Tamworth
IntroductionRepeated studies have demonstrated that the root lesion nematode, Pratylenchus thornei (Pt), is widespread across the northern region. At moderate to high populations it appears to interact with the expression of crown rot, which can exacerbate yield loss from both pathogens. While the relative yield of cereal type and variety in the presence of crown rot infection in the current season requires consideration, the potential consequences of these choices on Pt build-up for subsequent crops within the rotation should not be overlooked. Final Pt populations developed by 16 different winter cereal entries was determined after harvest at Macalister in southern Qld in 2015 to determine potential residual impacts on the differential build-up of Pt populations within a rotational sequence. This type of testing evaluates the relative resistance of each variety to Pt under field conditions.
Site detailsLocation: “Curraweena”, Macalister, southern QldCo-operator: Rob TaylorSowing date: 1 June 2015Starting N: 126 mg/kg nitrate (0–60cm)Fertiliser: 250 kg/ha urea and 40 kg/ha Granulock® 12Z at sowingPreDicta B®: 5.5 Pt/g (medium risk), nil Pn and 1.8 log Fusarium DNA/g soil
(medium risk) at sowing (0–30 cm)In-crop rainfall: 121 mmHarvest date: 2 November 2015
Treatments• A total of 16 winter cereal entries (one durum, two barley and 13 bread wheat;
Figure 1).• Added (plus) or no added (minus) crown rot at sowing using sterilised durum grain
colonised by at least five different isolates of Fusarium pseudograminearum (Fp).• All plots in the trial were cored (10 cores/plot at 0–15 cm on previous crop row) after
harvest (November 2015) to determine final (Pf) Pt populations for each variety.• Pt populations determined in all soil samples based on PreDicta B® analysis, a DNA-
based test provided by the South Australian Research and Development Institute (SARDI). Levels of residual crown rot inoculum (log Fusarium DNA) were also determined from the same samples. Note: They were non-spiked (no added stubble) soil cores as collected on the previous crop row primarily for Pt analysis.
• Pt data transformed for analysis ln(x + 1) to determine significance with back-transformed values for Pt presented in Figure 1.
Results• This site had a medium Pt population (5.5 Pt/g soil) at sowing following a barley crop
grown in 2013 and a faba bean crop in 2014.• Adding Fp inoculum at sowing did not significantly affect final Pt numbers (P = 0.275)
with no significant interaction evident in any of the entries.• Significant differences were evident between varieties in final Pt populations developed
in the top 15 cm of soil, which ranged from 11.8 Pt/g soil after the barley variety Commander up to 105.0 Pt/g soil after Mitch (Figure 1). This represents an 8.9-fold difference in final Pt populations between entries.
Key findingsCereal variety choice can have a large impact on Pratylenchus thornei (Pt) population build-up within paddocks, which can then affect how following crops and/or varieties perform in the rotation.
Significant differences were evident between varieties with an 8.9-fold difference in final Pt populations between the best (CommanderA) and worst (MitchA) entries.
Very susceptible varieties should be avoided in paddocks with known root lesion nematode (RLN) populations as they can increase the population to high risk levels in one season (e.g. 19.1-fold increase with MitchA).
There was no significant difference between varieties in crown rot inoculum level that developed during the season based on postharvest PreDicta B® assessment.

CR
OP
PR
OTE
CTI
ON
INDEPENDENT RESEARCH FOR INDUSTRY | 119
• Commander (barley) and Suntop (bread wheat) were the only entries that maintained final Pt populations at a medium risk level (2.0–15.0 Pt/g soil) at harvest.
• All other entries increased the final Pt population to within a high risk level (>15.0 Pt/g soil) for the following crop in 2016 (Figure 1).
• Both barley varieties and the durum variety Jandaroi were generally towards the mid to lower end of final Pt populations relative to the bread wheat entries.
• The two barley varieties appear to vary in their resistance to Pt with La Trobe leaving approximately double the Pt population of Commander.
• In barley, Commander increased the starting Pt population around 2.1-fold, while La Trobe had a 4.5-fold increase in Pt numbers over the 2015 season.
• In bread wheat there was between a 2.5-fold (Suntop) and 19.1-fold (Mitch) increase in the Pt population over the 2015 season.
• The one durum entry, Jandaroi, resulted in a 3.8-fold increase in the Pt population over the 2015 season.
• Crown rot risk is a sum of the DNA levels of all three Fusarium species known to cause crown rot expressed on a log scale where <0.6 is below detection, 0.6–1.4 is low, 1.4–2.0 is medium and >2.0 is high risk.
• All entries left low inoculum levels (0.5–1.8) in the uninoculated plots and high levels (2.0–3.0) in the inoculated plots, with no significant difference between entries.
a
cde
abbc
cd
def efgfgh
fghi fghi ghi hi hii
j
c
0
20
40
60
80
100
120
Com
man
derA
La T
robe
A
Sunt
opA
Sunm
ateA
LRPB
Vik
ingA
LRPB
Gau
ntle
tA
LRPB
Lan
cerA
Beck
omA
Sung
uard
A
QT1
5046
R
V071
76-6
9
LRPB
Spi
tfire
A
LRPB
Fla
nker
A
EGA
Gre
gory
A
Mitc
hA
Jand
aroi
A
Barley Wheat Durum
Prat
ylen
chus
thor
nei/g
soi
l (0–
15 c
m)
Figure 1. Impact of selected barley, bread wheat and durum entries on final postharvest soil populations of the root lesion nematode, Pratylenchus thornei (Pt/g soil) – Macalister, Qld 2015
Values within sites followed by the same letter are not significantly different (P = 0.05) based on transformed data (ln(x+1)). Back-transformed values are presented in the graph. Sowing Pt soil populations averaged across ranges was 5.5 Pt/g soil at Macalister in 2015 at 0–30 cm. Final Pt numbers postharvest due to drier soil conditions were collected from 0–15 cm at Macalister.
ConclusionsCereal variety choice can significantly affect Pt population build-up within paddocks, with an 8.9-fold difference in final populations between the best and worst variety at this site in 2015. Starting Pt populations of below 2.0 Pt/g soil are considered low risk, populations between 2.0 and 15.0 Pt/g soil are considered medium risk and above 15.0 Pt/g soil are considered high risk for yield loss in intolerant crops or varieties in the northern region. This could have serious consequences for the production of following Pt intolerant crops and/or varieties within the rotation with all but two entries (Commander and Suntop)

CR
OP
PR
OTE
CTI
ON
120 | NORTHERN GRAINS RESEARCH RESULTS 2016
increasing the Pt population from a medium to a high risk level in one season or with one variety (Mitch) increasing the Pt population as high as 105.0 Pt/g soil at this site in 2015. Recent NSW DPI research has also demonstrated that significant yield loss still occurred in the moderately tolerant wheat variety EGA Gregory with high risk (>15.0 Pt/g soil) populations in the top 30 cm of soil at sowing. Very susceptible varieties should be avoided in paddocks with known RLN populations as they can dramatically increase the population to high risk levels in one season.
Although varieties appear to significantly differ in their yield in the presence of crown rot infection, differences in the levels of partial resistance, which limits the rate of spread of the crown rot fungus through the plant during the season, do not appear to result in significant variation in inoculum levels at harvest. Partial resistance does not actually prevent the plant from being infected, but rather slows the rate of fungal growth in the plant, arguably delaying expression of the disease that can translate into a yield and grain quality (reduced screenings) benefit. However, the crown rot fungus, while being a pathogen when the winter cereal plant is alive, is also an effective saprophyte once the plant matures and dies. This saprophytic colonisation of infected tillers late in the season as the crop matures is the likely reason why limited practical differences in residual inoculum levels are created between varieties and winter cereal crop types.
Further research across sites is required to confirm differences in resistance of barley and wheat varieties to Pt as this can have significant implications for the build-up of Pt populations within a paddock and hence following rotational choices. For instance, while it appears that Mitch has a useful level of tolerance to crown rot (average 0.54 t/ha higher yielding than EGA Gregory in 2015), its increased susceptibility to Pt resulted in it taking nematode populations from a medium risk level at sowing to an extremely high risk level by harvest at Macalister in 2015 (Figure 1). Hence, Mitch should only be considered for production in paddocks known to be free of Pt as its increased susceptibility to Pt is likely to override the yield gain in the presence of crown rot when considering the whole rotational sequence.
AcknowledgementsThis research was co-funded by NSW DPI and GRDC under project DAV00128: National nematode epidemiology and management program. Thanks to the Rob Taylor and family for providing the trial site and to Douglas Lush (QDAF mobile trials unit) for sowing, maintaining and harvesting the trial. Assistance provided by Robyn Shapland, Patrick Mortell, Rachel Bannister, Carla Lombardo and Jason McCulloch (NSW DPI) in coring plots is greatly appreciated. Soil samples were assessed for RLN populations using PreDicta B® analysis by Dr Alan McKay and his team at SARDI in Adelaide.

CR
OP
PR
OTE
CTI
ON
INDEPENDENT RESEARCH FOR INDUSTRY | 121
Evaluation of the seed treatment Rancona® Dimension as a standalone option for managing crown rot in wheat – 2015Steven SimpfendorferNSW DPI, Tamworth
Key findingsTreating EGA GregoryA seed with Rancona® Dimension reduced establishment losses associated with the addition of crown rot inoculum to 7% compared with 26% when no seed treatment was used.
In this instance, Rancona® Dimension did not provide a significant or consistent yield benefit in the presence of high levels of crown rot infection across the 12 trial sites in 2015.
Growers should not expect Rancona® Dimension to provide a significant and consistent reduction in yield loss from crown rot infection when used as a standalone management strategy.
Growers considering the use of Rancona® Dimension should follow the manufacturer’s advice and only consider it as part of an integrated management strategy against crown rot.
IntroductionCrown rot (CR), caused predominantly by the fungus Fusarium pseudograminearum (Fp), is a significant disease of winter cereal crops in the northern NSW and southern Qld. Rancona® Dimension (ipconazole + metalaxyl) was recently registered in Australia as a fungicidal seed treatment with good activity against cereal bunts and smuts, pythium and for the suppression of rhizoctonia. Rancona® Dimension is also the first seed treatment to be registered (at 320 mL/100 kg seed) for the suppression of CR.
Suppression, by definition, indicates that the seed treatment reduces growth of the pathogen for a set period of time early in the season. This is distinct from control, which Rancona® Dimension and other seed treatments provide against bunts and smuts of wheat and barley in that they prevent infection throughout the season.
It is recommended by the manufacturer that Rancona® Dimension is used as part of an integrated disease management strategy for CR and not as a standalone option. However, growers may still be tempted to try and use Rancona® Dimension under medium to high CR risk situations where other management strategies have not sufficiently reduced inoculum levels. This is not uncommon following seasons with low in-crop rainfall that limits the effectiveness of break crops such as chickpea, faba bean, canola and sorghum in decomposing cereal stubble, which harbours the CR fungus. Under this scenario, growers are often forced into sowing another winter cereal within the rotation sequence and could be tempted to resort to a seed treatment as their main option in trying to reduce yield loss associated with CR infection. Replicated research therefore appeared warranted to determine the impact of Rancona® Dimension on yield loss from CR infection across sites in the northern region. This will hopefully ensure that growers have a realistic expectation of what this seed treatment can achieve if used in isolation from other management strategies.
Site detailsLocation: Twelve sites across northern NSW and southern Qld (Table 1)Sowing date: Varied (Table 1)
Treatments• Inoculated versus uninoculated trial design to evaluate the relative seed treatment
effects on the yield impact associated with CR infection at each site.• High levels of (CR) infection induced in inoculated plots (added CR) by incorporating
non-viable durum seed colonised by at least five different isolates of Fp into the seeding furrow (2.0 g/m of row) at sowing.
• One crown rot susceptible bread wheat variety EGA GregoryA was used across all sites at a target plant population of 100 plants/m2 seed treatments evaluated:
■ Nil seed treatment ■ Rancona® Dimension (ipconazole 25 g/L + metalaxyl 20 g/L) at 320 mL/100 kg seed ■ Dividend M® (difeniconazole 92 g/L + metalaxyl-M 23 g/L) at 260 mL/100 kg seed ■ Jockey Stayer® (fluquinconazole 167 g/L) at 450 mL/100 kg seed.
Dividend M® and Jockey Stayer® are NOT registered for the suppression of CR, but were included to represent commonly used wheat seed treatments for bunt and smut control, or early control of stripe rust (a leaf disease), respectively. Including four treatments across each site ensured statistical rigour of yield outcomes.

CR
OP
PR
OTE
CTI
ON
122 | NORTHERN GRAINS RESEARCH RESULTS 2016
Table 1. Site location, sowing dates and background crown rot levels of the 12 trial sites in 2015
Location Sowing date Background crown rot*
Trangie 15 May NilGarah 30 May NilMullaley 20 May MediumCoonamble 28 May HighNorth Star 27 May NilWongarbon 27 May HighGilgandra 12 May NilMerriwa 9 June MediumNyngan 8 May NilMacalister 1 June MediumWestmar 20 May NilMungindi 26 May High*Background crown rot levels as determined by PreDicta B®
Results An across site analysis was conducted to assist in summarising the general trends in the performance of Rancona® Dimension across the 12 sites in 2015.
Crop establishment• In the no added CR treatments, Rancona® Dimension and Dividend M® did not
significantly affect plant establishment compared with the nil fungicide treatment (Figure 1). However, establishment was slightly reduced with Jockey Stayer® compared with the Rancona® Dimension and nil treatments.
a a abb
c
b b
c
0
20
40
60
80
100
120
Nil Rancona® Dimension Dividend M® Jockey Stayer®
Esta
blis
hmen
t (pl
ants
/m2 )
No added CR Added CR
Figure 1. Impact of fungicide seed treatments on establishment of EGA Gregory in the absence and presence of added crown rot inoculum – average 12 sites in 2015
• Addition of CR inoculum at sowing significantly reduced the establishment of EGA Gregory by 26% averaged across sites compared to when no seed treatment was applied (Nil; Figure 1).
• Rancona® Dimension and Dividend M® significantly improved establishment in the presence of added CR with losses reduced to only 7% and 9%, respectively compared with the Nil – no added CR treatment.
• Jockey Stayer® did not significantly improve establishment in the presence of added CR.
• Severe early infection from CR, as can occur with the addition of CR inoculum in the furrow at sowing, can result in seedling blight, which reduces crop establishment. Rancona® Dimension could provide a useful level of protection against seedling blight

CR
OP
PR
OTE
CTI
ON
INDEPENDENT RESEARCH FOR INDUSTRY | 123
associated with severe early Fusarium infections, but further research is required to prove this.
Grain yield• An across-site analysis of the 12 trials conducted in 2015 found that Dividend M® had
a minor yield reduction (0.08 t/ha) compared with using no seed treatment (Nil) in the no added CR treatment (Figure 2).
• Rancona® Dimension did not significantly affect yield in the absence of added CR over the Nil treatment, but was slightly (0.12 t/ha) higher yielding than Dividend M®.
• Across sites, yield loss in the added CR treatment was 27% with Dividend M®, 32% with Rancona® Dimension and 33% with Jockey Stayer®. Seed treatment did not affect the extent of yield loss, with none significantly different from what was measured in the Nil treatment (30%; Figure 2).
• Rancona® Dimension unfortunately did not provide a consistent yield benefit in the presence of high levels of CR infection across the 12 trial sites in 2015.
a a b a
cd d ce
0.0
0.5
1.0
1.5
2.0
2.5
3.0
3.5
4.0
Nil Rancona® Dimension Dividend M® Jockey Stayer®
Yiel
d (t
/ha)
No added CR Added CR
Figure 2. Impact of fungicide seed treatments on the yield of EGA Gregory in the absence and presence of added crown rot inoculum – average 12 sites in 2015
ConclusionsRancona® Dimension is registered in Australia for the suppression of CR infection. Rancona® Dimension reduced establishment losses associated with severe early infection created by the addition of CR inoculum to the seed furrow at sowing to 7%, compared with 26% in the absence of a seed treatment. Further research is required to determine if this improvement in establishment is associated with reduced Fusarium seedling blight. It should also be established whether such severe establishment losses are an artefact of the inoculation process used in the trials or occurs naturally in paddocks with high stubble-borne inoculum loads.
In a separate larger trial conducted at Tamworth in 2015 in which infected stubble at the surface was the inoculum source, Rancona® Dimension did not significantly affect EGA Gregory establishment compared with the Nil seed treatment (data not presented).
Establishment benefits apparent in the 12 trials reported here unfortunately did not translate into any improvement in grain yield. Rancona® Dimension did not provide a significant yield benefit over the nil seed treatment or the two other commonly used seed treatments examined in this study under high CR pressure in 2015.
Although Rancona® Dimension is registered for the suppression of CR, with activity against early infection and potential establishment losses evident in this study, growers should not expect this to translate into a significant and consistent reduction in yield loss from CR infection when the product is used as a standalone management strategy. Integrated management remains the best strategy to reduce losses to CR. Growers might like to consider including Rancona® Dimension (320 mL/100 kg seed) as one additional component in their integrated management of crown rot.
CR
OP
PR
OTE
CTI
ON
124 | NORTHERN GRAINS RESEARCH RESULTS 2016
AcknowledgementsThis research was undertaken as part of project DAN00175: National crown rot epidemiology and management program and is made possible by the significant contributions of growers through both trial co-operation and the support of the GRDC; the author would like to thank them for their continued support. The project is co-funded by the NSW State Government through NSW DPI which is also thanked for its support in fully funding my position, laboratory and other infrastructure costs. Technical assistance provided by Robyn Shapland, Tim O’Brien, Finn Fensbo, Patrick Mortell, Carla Lombardo, Chrystal Fensbo, Kay Warren, Karen Cassin and Rachael Bannister is gratefully acknowledged. Soil-borne pathogen levels were determined using the DNA-based soil test service PreDicta B® provided by the South Australian Research and Development Institute. We are also extremely thankful to NVT operators Peter Matthews (NSW DPI), Douglas Lush (QDAF) and Research Agronomist Rick Graham (NSW DPI) and their staff for sowing, managing and harvesting the trials and cooperating growers for use of their paddocks.

CR
OP
PR
OTE
CTI
ON
INDEPENDENT RESEARCH FOR INDUSTRY | 125
Impact of common root rot and crown rot on wheat yield – Tamworth 2015Steven SimpfendorferNSW DPI, Tamworth
Key findingsA medium level of common root rot infection reduced the yield of LRPB GauntletA by 11% with a high level of infection resulting in 20% yield loss.
Crown rot infection had around double the impact on yield loss with a medium level of inoculum reducing yield by 23% and a high level of crown rot infection resulting in 41% yield loss.
Combined infection with both pathogens further exacerbated yield loss which equated to 31% and 52% with a medium or high level of inoculum of both pathogens, respectively.
IntroductionCrown rot (CR), caused by the stubble-borne fungus Fusarium pseudograminearum (Fp), is a significant disease of winter cereals across the northern grains region. Considerable research has established the impact of CR on the yield of commonly grown wheat, barley and durum varieties across environments and seasons.
Common root rot (CRR), caused by the fungus Bipolaris sorokiniaina (Bs), is a widespread pathogen of winter cereal crops throughout Australia, which is often found in association with CR. Bs survives as mycelium inside winter cereal and grass weed residues, but also has a thick-walled spore structure (conidium) that allows it to survive in soil for around two years. Bs infects the sub-crown internode where it causes complete or partial dark brown to black discolouration of the tissue. CRR symptoms are fairly indistinct in the paddock, with severely infected plants having reduced thrift and decreased tiller numbers.
CRR is generally considered a less significant pathogen of winter cereals across the northern grains region compared with CR and root lesion nematodes. A 15% yield loss from CRR under severe levels of infection is often quoted, but there is limited published data to support this value. The prevalence of CRR has increased across the region in recent seasons, usually associated with deeper sowing where growers are forced to moisture seek at planting due to diminishing soil water in the surface layers. This practice unfortunately lengthens the sub-crown internode, which appears to be exacerbating CRR infection.
This study aimed to compare the relative impact of CRR and CR on wheat yield and determine if mixed infection exacerbates losses.
Site detailsLocation: Paddock 25, Tamworth Agricultural InstituteSowing date: 12 June 2015Fertiliser: 100 kg/ha urea and 50 kg/ha Granulock® 12Z at sowingHarvest date: 19 November 2015
Treatments• One variety, LRPB GauntletA, which is rated moderately susceptible–susceptible
(MS–S) to both CRR and CR.Pathogen treatments• Added CRR inoculum at sowing using sterilised durum grain colonised by at
least three different isolates of Bs at three rates to create nil (0 g/m row), medium (1.0 g/m row) or high (2.0 g/m row) infection levels.
• Added CR inoculum at sowing using sterilised durum grain colonised by at least five different isolates of Fp at three rates to create nil (0 g/m row), medium (1.0 g/m row) or high (2.0 g/m row) infection levels.
• Different inoculum rates of the two pathogens added alone or in combination at sowing with viable LRPB GauntletA seed with four replicates of each treatment.
• A control uninoculated nil treatment consisted of nil (0 g/m row) for both pathogens.
Results• A medium level of CRR (Bs) inoculum reduced the LRPB Gauntlet yield by 0.41 t/ha
(11%) with a high level of inoculum reducing yield by 0.73 t/ha (20%) compared with plants not inoculated with either fungal pathogen (Figure 1).

CR
OP
PR
OTE
CTI
ON
126 | NORTHERN GRAINS RESEARCH RESULTS 2016
• A medium level of CR (Fp) inoculum reduced the yield of LRPB Gauntlet by 0.86 t/ha (23%) with a high level of inoculum reducing yield by 1.50 t/ha (41%) compared with plants not inoculated with either fungal pathogen (Figure 1).
a
b
cc
e
d
f
de
0.0
0.5
1.0
1.5
2.0
2.5
3.0
3.5
4.0
Nil Medium High Nil Nil Medium High High
Nil Nil Nil Medium High Medium High Medium
Yiel
d (t
/ha)
Fusarium
Bipolaris
Figure 1. Varying inoculum rate effect of CRR (Bs) and/or CR (Fp) on the yield of LRPB Gauntlet – Tamworth 2015
• A medium level of CR (Fp) inoculum reduced yield to a similar extent as a high level of CRR (Bs) inoculum (Figure 1).
• A medium level of inoculum of both CRR (Bs) and CR (Fp) reduced the yield of LRPB Gauntlet by 1.15 t/ha (31%). A high level of inoculum of both pathogens reduced yield by 1.91 t/ha (52%). The yield effect from a combination of inoculation with both pathogens was significantly higher than inoculation with either pathogen alone at the same inoculum rates (Figure 1).
ConclusionsCR infection was shown to cause around double (23–41%) the extent of yield loss as CRR (11–20%) in the MS–S bread wheat variety LRPB Gauntlet. Although causing a lower level of yield loss, CRR is still a significant pathogen of wheat. It appears to be increasing in prevalence in the NSW northern grains region in association with deeper seeding to capture diminishing soil moisture in the surface layer around sowing. The potential importance of CRR in the farming system is intensified by its interaction with CR, with yield losses appearing to be exacerbated by the presence of both pathogens. CRR infects the sub-crown internode, which is believed to reduce the efficacy of the primary root system. Yield loss from CR is known to be associated with increased moisture/evapotranspiration stress during grain filling. A reduced ability of the primary root system to extract soil moisture at depth, as a result of CRR infection, could potentially be increasing the expression of CR and hence yield loss from these diseases. Growers using integrated management strategies aimed at reducing losses from CR should also consider their effect on CRR and the interaction between these two pathogens.
AcknowledgementsThis research was co-funded by NSW DPI and GRDC under project DAN00176: Northern NSW integrated disease management. Assistance provided by Robyn Shapland, Tim O’Brien, Patrick Mortell, Finn Fensbo, Chrystal Fensbo and Carla Lombardo (NSW DPI) is greatly appreciated.

CR
OP
PR
OTE
CTI
ON
INDEPENDENT RESEARCH FOR INDUSTRY | 127
Response of barley, durum and bread wheat varieties to crown rot across two sowing times – Tamworth 2014Steven SimpfendorferNSW DPI, Tamworth
Key findingsYield in the presence of crown rot was generally barley > bread wheat > durum across both sowing times, but significant differences were evident between varieties.
Barley, bread wheat and durum varieties differ in their extent of yield loss from crown rot and their actual yield and grain quality (screenings) in the presence of this disease.
However, all varieties are susceptible to crown rot infection and will not significantly reduce inoculum levels for subsequent crops. Variety choice is not a sole solution to crown rot.
IntroductionCrown rot (CR), caused predominantly by the fungus Fusarium pseudograminearum (Fp), is a major constraint to winter cereal (wheat, barley and durum) production in the northern grains region. Yield loss is related to the expression of whiteheads that are induced by moisture and/or temperature stress during flowering and grain-fill. Previous NSW DPI research has demonstrated that earlier sowing can reduce the expression of CR by bringing grain-fill forward a week or two to when temperatures are generally lower. Earlier sowing potentially also facilitates increased root growth early in the season, which might result in deeper root exploration and access to additional soil moisture throughout the season. However, sowing time needs to be balanced against the risk of excessive early vegetative growth depleting soil moisture reserves before grain-fill and the risk of frost versus terminal heat stress during flowering and grain development. The impact of crown rot on yield and grain quality was examined in 22 barley, six durum and 34 bread wheat entries across two sowing times at Tamworth in northern NSW in 2014.
Site detailsLocation: Tamworth Agricultural Institute, NSW DPI, TamworthSowing dates: TOS1: 20 May 2014; TOS2: 10 June 2014Fertiliser: 180 kg/ha urea and 50 kg/ha Granulock® Supreme Z at sowingIn-crop rainfall: 225 mm (TOS1) and 192 mm (TOS2)PreDicta B®: Nil RLN and 2.6 log Fusarium DNA/g (high risk) at sowingHarvest date: 17 November 2014
Treatments• Twenty-two barley; six durum wheat and 34 bread wheat entries (Table 1).• Added (plus) or no added (minus) CR at sowing using sterilised durum grain
colonised by at least five different isolates of Fp.
Results• No frost damage was evident across entries for either sowing time.• The average yield of all entries and CR treatments was 3.80 t/ha across TOS1 (20 May)
and 2.90 t/ha across TOS2 (10 June), which represents a 24% reduction in yield with a three-week delay in sowing.
• Sowing time did not significantly affect grain protein levels averaged across treatments.• Average screening levels increased from 13.3% with TOS1 to 18.9% with TOS2, a 43%
increase (P = 0.108).• CR had limited impact on protein resulting in a 0.3% reduction in the added CR
treatment compared with the no added CR treatment, which was only significant when averaged across all entries and sowing times.
• There was only a 0.7% increase in screening levels in the added CR treatment compared with the no added CR treatment when averaged across all entries and sowing times, due to high background inoculum levels across the site.
20 May sowing (TOS1)• For barley, yield in the no added CR (high background inoculum levels) treatment
ranged from 5.53 t/ha (La Trobe) down to 4.19 t/ha (Westminster); in durum from 3.34 t/ha (Hyperno) to 2.51 t/ha (Caparoi); and in bread wheat from 4.97 t/ha (Condo) to 2.99 t/ha (Sunvale; Table 1).

CR
OP
PR
OTE
CTI
ON
128 | NORTHERN GRAINS RESEARCH RESULTS 2016
• TOS1 for the long season wheat variety Einstein was still too late for this variety, which struggled to meet its vernalisation requirement and was significantly later to produce heads and mature than any other entry, obtaining a yield of only 0.81 t/ha.
• Yield loss (difference between no added CR and added CR treatments) ranged in barley from 0.32 t/ha (6.5%) with Fathom to 1.32 t/ha (29.8%) with Oxford; in durum from 0.71 t/ha (21.6%) with entry 290564 to 1.18 t/ha (41.1%) with DBA Aurora; and in bread wheat from 0.32 t/ha (7.8%) with Suntop to 1.24 t/ha (34.5%) with Justica CL Plus (Table 1).
• The extent of yield loss has been underestimated due to high background inoculum levels across the site. A level of CR infection had already occurred in the no added CR plots. Focusing on yield in the presence of high levels of CR infection (added CR) provides a related measure of variety tolerance.
• Yield in the added CR (high infection levels) treatment ranged in barley from 4.91 t/ha (Hindmarsh) down to 3.11 t/ha (Oxford); in durum from 2.58 t/ha (290564) down to 1.64 t/ha (Caparoi); and in bread wheat from 4.03 t/ha (Condo) down to 2.36 t/ha (Justica CL Plus; Table 1).
• Adding CR inoculum did not significantly affect grain quality in any of the entries (data not presented). Hence the average of added CR and no added CR treatments for each entry are presented (Table 1).
• Quite high grain protein levels were achieved across the site for TOS1, which ranged in barley from 16.4% (IGB1140) to 13.5% (Grout); in durum from 14.8% (Caparoi) to 13.9% (Jandaroi); and in bread wheat from 15.5% (Lancer) to 12.5% (Sunmate; Table 1).
• Screening levels with TOS1 ranged in barley from 4.8% (NRB121156) to 60.5% (Urambie); in durum from 8.0% (Jandaroi) to 23.3% (Caparoi); and in bread wheat from 6.4% (Gauntlet) to 20.9% (Lincoln; Table 1).
Table 1. Impact of crown rot and sowing time on the yield and grain quality of barley, durum and bread wheat – Tamworth 2014
Variety Yield (t/ha @ 11% moisture) Protein (%) Screenings (%)
20 May 10 June 20 May 10 June 20 May 10 June
No added CR
Added CR No added CR
Added CR
BarleyBassA 4.71 4.27 3.52 2.34 15.2 15.5 8.6 16.5BulokeA 4.76 4.15 3.89 3.02 14.4 14.7 10.5 18.2CommanderA 5.14 4.25 4.54 3.69 14.2 14.1 15.6 13.7CompassA 5.15 4.59 4.67 3.71 13.8 13.8 9.4 10.8FairviewA 4.91 3.74 3.46 2.79 15.0 14.7 13.8 21.6FathomA 4.89 4.57 4.38 3.67 15.1 14.8 9.1 9.2FlindersA 4.88 3.48 3.60 3.03 15.8 15.3 12.8 31.7GairdnerA 4.55 3.70 3.52 2.86 16.3 15.6 19.5 29.7GrangeRA 5.20 4.34 4.16 3.43 14.9 15.2 8.0 13.4GroutA 4.89 3.79 4.05 3.42 13.5 14.2 12.1 18.1HindmarshA 5.33 4.91 5.08 4.48 14.4 14.8 10.0 9.5IGB1140 4.62 3.82 3.99 3.11 16.4 15.1 7.7 13.1La TrobeA 5.53 4.77 4.96 4.64 13.7 14.4 11.7 12.2NavigatorA 4.33 3.67 3.67 2.79 15.9 15.1 19.4 25.2NRB121156 4.61 3.61 3.49 2.81 15.3 15.3 4.8 12.7OxfordA 4.43 3.11 3.06 2.20 15.7 14.1 16.9 33.4Scope CLA 4.72 4.03 4.09 3.41 14.9 14.8 9.9 13.9SkipperA 5.16 4.81 4.63 4.31 14.8 14.6 9.0 7.8SY RattlerA 4.47 3.45 4.09 3.16 13.9 14.2 22.1 26.1UrambieA 4.39 3.91 3.26 2.56 15.4 15.0 60.5 54.1WestminsterA 4.19 3.54 3.08 2.28 14.9 14.7 18.7 23.4

CR
OP
PR
OTE
CTI
ON
INDEPENDENT RESEARCH FOR INDUSTRY | 129
Variety Yield (t/ha @ 11% moisture) Protein (%) Screenings (%)
20 May 10 June 20 May 10 June 20 May 10 June
No added CR
Added CR No added CR
Added CR
WimmeraA 4.62 3.84 3.58 3.00 15.9 15.7 16.3 20.7Durum wheat290564 3.29 2.58 2.21 1.44 14.4 15.2 15.1 26.0CaparoiA 2.51 1.64 1.46 0.88 14.8 15.0 23.3 39.1DBA LillaroiA 3.02 1.90 1.94 0.97 14.5 14.9 15.4 31.2DBA AuroraA 2.87 1.69 1.79 1.22 14.3 14.5 21.9 30.6HypernoA 3.34 2.50 2.16 1.32 14.7 15.4 22.1 35.8JandaroiA 3.29 2.54 2.61 2.09 13.9 14.5 8.0 14.1Bread wheatBaxterA 4.49 3.75 3.40 2.86 13.9 15.0 7.1 7.6CondoA 4.97 4.03 3.40 2.82 12.7 14.0 10.7 15.5CorackA 4.43 3.88 3.58 3.13 12.6 13.7 10.8 10.4CrusaderA 4.16 3.43 3.57 3.19 13.3 13.4 14.7 11.9DartA 4.45 3.56 3.50 3.02 13.2 13.9 14.3 16.3DerrimutA 4.40 3.87 3.11 2.49 13.6 14.5 13.2 18.0EGA GregoryA 3.79 3.01 2.69 1.97 13.1 13.5 11.2 21.4EGA WylieA 4.25 3.22 2.89 2.29 14.5 15.3 11.2 12.4EinsteinA 0.81 0.76 0.25 0.22 16.5 16.2 9.0 9.0Elmore CL PlusA 4.04 3.65 3.20 2.39 13.8 15.1 10.3 22.1Emu RockA 4.35 3.95 3.52 2.96 14.2 14.9 12.1 13.2GauntletA 3.92 2.96 3.06 2.14 13.9 14.6 6.4 10.1Grenade CL PlusA 3.87 3.19 2.97 1.91 12.6 13.7 8.2 13.8ImpalaA 4.18 3.51 3.52 2.80 13.2 14.0 8.6 15.8Justica CL PlusA 3.60 2.36 2.35 1.84 14.5 15.2 14.5 20.0KioraA 3.82 3.06 2.41 1.89 14.7 15.8 14.9 30.2LancerA 3.78 3.13 2.92 2.46 15.5 15.9 7.3 17.1LincolnA 3.21 2.43 2.09 1.55 13.9 15.1 20.9 28.5LivingstonA 4.40 3.36 3.53 2.30 13.7 14.5 11.0 17.5LPB09-0515 4.35 3.38 3.01 2.01 14.1 15.1 17.1 24.0MaceA 4.30 3.73 3.51 2.79 12.8 13.6 11.6 15.3MerlinA 4.48 3.82 3.51 2.46 14.5 16.0 8.7 11.5MitchA 4.20 3.32 3.15 2.60 13.2 14.4 10.8 16.8PhantomA 3.98 3.18 2.75 1.87 14.0 14.8 10.5 14.2SpitfireA 4.28 3.88 3.55 2.84 14.6 16.0 8.6 9.1StrzeleckiA 3.07 2.48 1.76 1.21 14.8 15.1 16.3 30.9SunguardA 4.07 3.60 3.26 2.90 14.1 14.3 7.9 12.1SunmateA 4.27 3.62 3.30 2.35 12.5 13.5 10.2 11.6SuntimeA 4.35 3.71 3.10 2.41 13.3 14.3 10.9 15.7SuntopA 4.17 3.84 3.37 2.62 13.5 14.4 13.7 12.6SunvaleA 2.99 2.66 2.71 2.03 15.2 15.7 11.1 21.1VenturaA 4.33 3.65 3.57 2.84 13.6 14.1 14.1 15.5VikingA 4.05 2.92 2.22 1.30 14.2 15.4 14.1 28.8WallupA 4.52 4.01 3.56 2.89 13.9 15.2 7.7 10.3LSD 0.388 0.81 7.65P value 0.119 <0.001 <0.001CV (%) 8.3 3.8 30.7
10 June sowing (TOS2)• Yield in the no added CR (high background inoculum levels) treatment ranged
in barley from 5.08 t/ha (Hindmarsh) down to 3.06 t/ha (Oxford); in durum from
CR
OP
PR
OTE
CTI
ON
130 | NORTHERN GRAINS RESEARCH RESULTS 2016
2.61 t/ha (Jandaroi) to 1.46 t/ha (Caparoi); and in bread wheat from 3.58 t/ha (Corack) to 1.76 t/ha (Strzelecki; Table 1).
• TOS2 for the long-season wheat variety Einstein was even later, which did not meet its vernalisation requirement and was significantly later to produce only a few heads and mature than any other entry obtaining a yield of only 0.25 t/ha.
• Yield loss (difference between no added CR and added CR treatments) ranged in barley from 0.32 t/ha (6.5%) with La Trobe to 1.18 t/ha (33.5%) with Bass; in durum from 0.52 t/ha (19.9%) with Jandaroi to 0.97 t/ha (50.2%) with DBA Lillaroi; and in bread wheat from 0.36 t/ha (11.0%) with Sunguard to 1.23 t/ha (34.8%) with Livingston (Table 1).
• Yield in the added CR (high infection levels) treatment ranged in barley from 4.64 t/ha (La Trobe) down to 2.20 t/ha (Oxford); in durum from 2.09 t/ha (Jandaroi) down to 0.88 t/ha (Caparoi); and in bread wheat from 3.19 t/ha (Crusader) down to 1.21 t/ha (Strzelecki; Table 1).
• Adding CR inoculum did not significantly affect grain quality in any of the entries (data not presented). Hence the average of added CR and no added CR treatments for each entry are presented (Table 1).
• High grain protein levels were also achieved across the site with TOS2, which ranged in barley from 15.7% (Wimmera) to 13.8% (Compass); in durum from 15.4% (Hyperno) to 14.5% (DBA Aurora and Jandaroi); and in bread wheat from 16.0% (Merlin and Spitfire) to 13.4% (Crusader; Table 1).
• Screening levels with TOS2 ranged in barley from 7.8% (Skipper) to 54.1% (Urambie); in durum from 14.1% (Jandaroi) to 39.1% (Caparoi); and in bread wheat from 7.6% (Baxter) to 30.9% (Strzelecki; Table 1).
ConclusionsSowing date and variety maturity choice is a balance between frost risk and terminal heat stress in the northern grain region. Both can significantly affect grain yield. No frost damage was evident at this site in 2014 with either sowing time, but terminal heat stress did occur, which was more severe during grain filling with the second sowing time. A three-week delay in sowing time resulted in an average 24% reduction in yield across the winter cereal entries. Later sowing pushed grain-fill too far into hotter conditions. This can reduce yield by itself, but if there is also an underlying issue with CR then delayed sowing significantly exacerbates the expression of this disease with negative effects on both yield and grain quality.
Varieties do differ in their extent of yield loss from CR and in their relative yield in the presence of high levels of infection, which is often referred to as tolerance. This is a function of a variety’s level of partial resistance to infection, but appears to also interact with its environmental adaptation and maturity relative to the timing of stress (moisture and heat), which exacerbates the expression of CR. Generally quicker maturing barley, durum and bread wheat entries were higher yielding in the presence of CR infection in this trial. This does not necessarily mean that these varieties have improved levels of resistance to CR infection, but rather their quicker maturity allowed them to minimise stress during grain filling relative to longer season entries, reducing the expression of CR.
If forced into planting a cereal crop in a high CR risk situation then some barley varieties could provide a yield advantage over bread wheat in that season, as long as early stress does not occur. Some of the newer bread wheat varieties do appear to be closing this gap to some extent. Barley tends to yield better in the presence of CR infection due to its earlier maturity relative to bread wheat, providing an escape mechanism that reduces its exposure to moisture stress during the critical grain filling stage. However, a key message is that this decision is only potentially maximising profit in the current season. Growing barley over bread wheat will not help to reduce CR inoculum levels as barley is very susceptible to infection. Significant yield loss is still occurring in the best of the barley and bread wheat varieties in the presence of high CR infection.

CR
OP
PR
OTE
CTI
ON
INDEPENDENT RESEARCH FOR INDUSTRY | 131
Profit can be maximised in the current season with variety selected for yield even with CR present, although all varieties still suffer yield loss. But this strategy will not reduce inoculum levels for subsequent crops.
Winter cereal crop and variety choice is therefore not the sole solution to CR, but rather just one element of an integrated management strategy to limit losses from this disease.
AcknowledgementsThis research was co-funded by NSW DPI and GRDC under project DAN00175: National crown rot epidemiology and management. Thanks to Tim O’Brien, Robyn Shapland, Paul Nash, Rachael Bannister, Patrick Mortell, Finn Fensbo, Karen Cassin, Kay Warren and Carla Lombardo (all NSW DPI) for technical assistance.

CR
OP
PR
OTE
CTI
ON
132 | NORTHERN GRAINS RESEARCH RESULTS 2016
Regional crown rot management – Macalister Qld 2015Steven Simpfendorfer and Robyn ShaplandNSW DPI, Tamworth
IntroductionCrown rot (CR), caused predominantly by the fungus Fusarium pseudograminearum (Fp), remains a major constraint in producing winter cereals in the NSW northern grains region. Cereal varieties differ in their resistance to CR which can have a significant impact on their relative yield in the presence of this disease.
Rancona® Dimension (ipconazole + metalaxyl) was recently registered in Australia as a fungicide seed treatment with good activity against cereal bunts and smuts, pythium and for the suppression of rhizoctonia. Rancona® Dimension is also the first seed treatment to be registered (at 320 mL/100 kg seed) for the suppression of CR. Suppression, by definition, indicates that the seed treatment reduces the pathogen’s growth for a set period of time early in the season.
Two trials were conducted at this site: 1. A variety trial, which was one of 12 conducted by NSW DPI in 2015 across central/
northern NSW extending into southern Qld to examine the effect of CR on the yield of two barley, one durum and 13 bread wheat varieties.
2. A second trial aimed to evaluate the efficacy of Rancona® Dimension as a standalone option to control CR was also conducted across the same 12 sites in the northern region. This will hopefully ensure that growers have a realistic expectation of what this seed treatment can achieve if used in isolation from other integrated disease management strategies.
Site detailsLocation: “Curraweena”, Macalister, QldCo-operator: Rob TaylorSowing date: 1 June 2015Fertiliser: 250 kg/ha urea and 40 kg/ha Granulock® 12Z at sowingStarting N: 126 mg/kg to 0.6 mIn-crop rainfall: 121 mmPreDicta B®: 5.5 Pratylenchus thornei/g soil (medium risk),
1.8 log Fusarium DNA/g (medium) at sowing (0–30 cm)Harvest date: 2 November 2015
TreatmentsTrial 1. Variety evaluation• Two barley varieties: (CommanderA and La TrobeA)• One durum variety: (JandaroiA)• Eleven commercial bread wheat varieties: (EGA GregoryA, LRPB FlankerA, SunmateA,
LRPB GauntletA, LRPB LancerA, LRPB VikingA, LRPB SpitfireA, BeckomA, MitchA, SuntopA and SunguardA; listed in order of increasing resistance to CR) and two numbered lines (VO7176-69 and QT15046R).
• Added or no added CR at sowing using sterilised durum grain colonised by at least five different isolates of Fp.
Trial 2. Fungicide seed treatment evaluation• EGA GregoryA with added or no added CR at sowing using infected durum grain.• Seed treatments evaluated:
1. Nil seed treatment2. Rancona® Dimension (ipconazole 25 g/L + metalaxyl 20 g/L) at 320 mL/100 kg seed
Key findingsYield loss from crown rot ranged from 6.9% in the bread wheat variety VikingA up to 31.9% in the durum variety JandaroiA.
Bread wheat variety choice had a large effect on yield where there were high levels of crown rot infection with SuntopA, SunguardA, BeckomA and VikingA, being between 0.37 t/ha to 0.62 t/ha higher yielding than EGA GregoryA.
The barley varieties La TrobeA and CommanderA were 0.62 t/ha and 0.84 t/ha higher yielding than EGA GregoryA under high levels of crown rot infection, respectively.
Rancona® Dimension did not provide a yield benefit in the presence of high levels of crown rot infection at this site in 2015.

CR
OP
PR
OTE
CTI
ON
INDEPENDENT RESEARCH FOR INDUSTRY | 133
3. Dividend M® (difeniconazole 92 g/L + metalaxyl-M 23 g/L) at 260 mL/100 kg seed4. Jockey Stayer® (fluquinconazole 167 g/L) at 450 mL/100 kg seed.
Dividend M® and Jockey Stayer® are NOT registered for the suppression of CR, but were included to represent a commonly used wheat seed treatment for bunt and smut control, or early control of stripe rust (leaf disease), respectively. Including four treatments across each site ensured statistical rigour for yield outcomes.
ResultsTrial 1. Variety evaluationYield• In the no added CR treatment, yield ranged from 3.47 t/ha in the bread wheat variety
LRPB Spitfire up to 4.52 t/ha in the barley variety Commander (Table 1).• All varieties suffered significant yield loss under high levels of CR infection (added
CR), which ranged from 6.9% in the bread wheat variety Viking (0.28 t/ha) up to 31.9% in the durum variety Jandaroi (1.12 t/ha). Yield loss was potentially underestimated at this site as a medium level of background CR inoculum already existed across the site. Hence, there was a level of infection in the no added CR plots.
• Only the durum variety Jandaroi was lower yielding (0.73 t/ha) than EGA Gregory under high CR infection (added CR). Nine bread wheat entries (LRPB Gauntlet down to LRPB Spitfire) produced yield equivalent to EGA Gregory in the added CR treatment (Table 1).
• The bread wheat varieties Suntop (0.37 t/ha), Sunguard (0.38 t/ha), Beckom (0.44 t/ha) and Viking (0.62 t/ha) were all higher yielding than EGA Gregory under high levels of CR infection (added CR).
• The two barley varieties were 0.62 t/ha (La Trobe) and 0.84 t/ha (Commander) higher yielding than EGA Gregory under high levels of CR infection (added CR, Table 1).
Table 1. Yield and grain quality of varieties with no added and added crown rot – Macalister 2015
Crop Variety Yield (t/ha) Protein(%)
Screenings (%)
No added CR Added CR No added CR Added CR
Barley Commander 4.52 3.96 13.4 2.3 3.4La Trobe 4.40 3.74 13.5 2.2 5.1
Durum Jandaroi 3.52 2.40 14.6 1.3 3.5Bread wheat
Viking 4.02 3.74 12.3 6.1 6.3Beckom 4.39 3.56 11.9 4.8 7.1Sunguard 3.79 3.50 13.0 4.6 6.7Suntop 3.91 3.49 12.3 7.6 7.4LRPB Gauntlet 4.13 3.37 12.8 2.5 4.9LRPB Lancer 3.94 3.36 13.6 3.7 5.1Mitch 3.83 3.34 12.3 7.2 9.0V07176-69 4.18 3.27 12.1 4.6 7.4QT15046R 4.02 3.24 12.1 4.1 6.6EGA Gregory 4.22 3.12 12.4 4.2 8.2Sunmate 3.96 3.04 11.9 4.0 5.9LRPB Flanker 4.16 3.04 12.3 4.1 8.9LRPB Spitfire 3.47 3.01 13.8 4.3 6.2
Site mean 4.03 3.32 12.8 4.2 6.3CV (%) 4.3 2.0 15.9LSD 0.257 0.29 1.37P value <0.001 <0.001 <0.001

CR
OP
PR
OTE
CTI
ON
134 | NORTHERN GRAINS RESEARCH RESULTS 2016
Grain quality• Adding CR inoculum did not significantly affect grain protein levels in any of the
entries (data not presented). Hence, the average of added CR and no added CR treatments for each entry are presented (Table 1).
• Protein levels ranged between 11.9% (Beckom and Sunmate) to 14.6% (Jandaroi; Table 1).
• In the no added CR treatment, screening levels ranged from 1.3% in the durum variety Jandaroi up to 7.6% in the bread wheat variety Suntop (Table 1).
• Screening levels were increased in the added CR treatment with all entries except the barley variety Commander and bread wheat varieties Viking, Suntop and LRPB Lancer.
• In the added CR treatment, screening levels ranged from 3.4% in the barley variety Commander up to 9.0% in the bread wheat variety Mitch (Table 1).
Trial 2. Fungicide seed treatment evaluation• Plant establishment was significantly (P = 0.003) lower with Rancona® Dimension
(49 plants/m2) and Dividend M® (52 plants/m2) compared with no seed treatment (78 plants/m2) in the no added CR treatment.
• Only Dividend M® (52 plants/m2) had significantly different establishment from no seed treatment (35 plants/m2) in the added CR treatment.
• There was no significant (P = 0.124) difference in the yield of EGA Gregory with any of the seed treatments in the no added CR treatment (Figure 1).
• Yield loss in the added CR treatment was 20.3% with Dividend M®, 21.7% with no seed treatment, 27.0% with Rancona® Dimension and 25.7% with Jockey Stayer® compared with the corresponding no added CR treatment (Figure 1).
• Rancona® Dimension slightly reduced yield by 0.17 t/ha compared with the nil control, and by 0.21 t/ha compared with Dividend M® in the added CR treatment (Figure 1).
a a a a
bc b d cd
0.0
0.5
1.0
1.5
2.0
2.5
3.0
3.5
4.0
4.5
Nil Dividend M® Rancona® Dimension Jockey Stayer®
Yiel
d (t
/ha)
No added CR Added CR
Figure 1. Impact of fungicide seed treatments on the yield of EGA GregoryA in the absence and presence of added crown rot inoculum – Macalister 2015 Bars with the same letter are not significantly different (P = 0.124)
ConclusionsCereal crop and variety choice provided a 12–27% yield benefit over growing the susceptible bread wheat variety EGA Gregory under high levels of CR infection at Macalister in 2015. This can maximise profit in the current season but will not reduce inoculum levels for subsequent crops, because all winter cereal varieties are susceptible to CR infection. Winter cereal crop and variety choice is therefore not the sole solution to CR, but rather just one element of an integrated management strategy to limit losses from this disease.
Rancona® Dimension did not provide a significant yield benefit over using no seed treatment or the two other commonly used seed treatments examined under high CR pressure at Macalister in 2015. Although Rancona® Dimension is registered for the suppression of CR, with activity against early infection and potential establishment losses evident in this study (data not shown), growers should not expect this to translate into a

CR
OP
PR
OTE
CTI
ON
INDEPENDENT RESEARCH FOR INDUSTRY | 135
significant and consistent reduction in yield loss from CR infection when the product is used as a standalone management strategy.
Integrated management remains the best strategy to reduce losses to CR.
AcknowledgementsThis research was co-funded by NSW DPI and GRDC under project DAN00175: National crown rot epidemiology and management. Thanks to Rob Taylor for providing the trial site and Douglas Lush (QDAF Mobile Trial Unit) for sowing, maintaining and harvesting the trial. Thanks to Chrystal Fensbo (NSW DPI) for grain quality assessments and to Jason Lowien (GrainCorp) for access to an NIR machine to determine grain protein levels.

CR
OP
PR
OTE
CTI
ON
136 | NORTHERN GRAINS RESEARCH RESULTS 2016
Regional crown rot management – Mungindi 2015Steven Simpfendorfer and Robyn ShaplandNSW DPI, Tamworth
IntroductionCrown rot (CR), caused predominantly by the fungus Fusarium pseudograminearum (Fp), remains a major constraint in producing winter cereals in the NSW northern grains region. Cereal varieties differ in their resistance to CR which can have a significant impact on their relative yield in the presence of this disease.
Rancona® Dimension (ipconazole + metalaxyl) was recently registered in Australia as a fungicide seed treatment with good activity against cereal bunts and smuts, pythium and for the suppression of rhizoctonia. Rancona® Dimension is also the first seed treatment to be registered (at 320 mL/100 kg seed) for the suppression of CR. Suppression, by definition, indicates that the seed treatment reduces the pathogen’s growth for a set period of time early in the season.
Two trials were conducted at this site: 1. A variety trial, which was one of 12 conducted by NSW DPI in 2015 across central/
northern NSW extending into southern Qld to examine the effect of CR on the yield of two barley, one durum and 13 bread wheat varieties.
2. A second trial aimed to evaluate the efficacy of Rancona® Dimension as a standalone option to control CR was also conducted across the same 12 sites in the northern region. This will hopefully ensure that growers have a realistic expectation of what this seed treatment can achieve if used in isolation from other integrated disease management strategies.
Site detailsLocation: “Bullawarie”, Mungindi, QldCo-operator: Andrew EarleSowing date: 26 May 2015Fertiliser: 60 kg/ha Urea and 40 kg/ha Granulock® 12Z at sowingStarting N: 24 mg/kg to 0.6 mPreDicta B®: Nil root lesion nematodes, 2.1 log Fusarium DNA/g (high risk) at
sowing (0–30 cm)Harvest date: 23 October 2015
TreatmentsTrial 1. Variety evaluation• Two barley varieties: (CommanderA and La TrobeA)• One durum variety: (JandaroiA)• Eleven commercial bread wheat varieties: (EGA GregoryA, LRPB FlankerA, SunmateA,
LRPB GauntletA, LRPB LancerA, LRPB VikingA, LRPB SpitfireA, BeckomA, MitchA, SuntopA and SunguardA; listed in order of increasing resistance to CR) and two numbered lines (VO7176-69 and QT15046R).
• Added or no added CR at sowing using sterilised durum grain colonised by at least five different isolates of Fp.
Trial 2. Fungicide seed treatment evaluation• EGA GregoryA with added or no added CR at sowing using infected durum grain.• Seed treatments evaluated:
1. Nil seed treatment2. Rancona® Dimension (ipconazole 25 g/L + metalaxyl 20 g/L) at 320 mL/100 kg seed3. Dividend M® (difeniconazole 92 g/L + metalaxyl-M 23 g/L) at 260 mL/100 kg seed
Key findingsYield loss from crown rot ranged from 11.0% (not significant) in the barley variety La TrobeA up to 70.0% in the bread wheat variety EGA GregoryA.
Bread wheat variety choice had a large effect on yield where there were high levels of crown rot infection with nine varieties being between 0.46 t/ha to 1.69 t/ha higher yielding than EGA GregoryA.
The barley variety La TrobeA was 2.08 t/ha higher yielding than EGA GregoryA under high levels of crown rot infection.
Rancona® Dimension provided a small (0.29 t/ha) yield benefit compared to no seed treatment in the presence of high levels of crown rot infection at this site in 2015 but was far from providing complete control of the disease with 63% yield loss still occurring.

CR
OP
PR
OTE
CTI
ON
INDEPENDENT RESEARCH FOR INDUSTRY | 137
4. Jockey Stayer® (fluquinconazole 167 g/L) at 450 mL/100 kg seed.Dividend M® and Jockey Stayer® are NOT registered for the suppression of CR, but were included to represent a commonly used wheat seed treatment for bunt and smut control, or early control of stripe rust (leaf disease), respectively. Including four treatments across each site ensured statistical rigour for yield outcomes.
ResultsTrial 1. Variety evaluationYield• Results from the barley variety Commander were excluded from analysis at this
site due to severe damage from the herbicide Topik® which was applied across the predominantly wheat trial site. Data for La Trobe was still included as it did not appear to be significantly impacted.
• In the no added CR treatment, yield ranged from 2.34 t/ha in the bread wheat variety Viking up to 3.56 t/ha in the bread wheat variety Beckom (Table 1).
• All varieties with the exception of the barley variety La Trobe, suffered significant yield loss under high levels of CR infection (added CR), which ranged from 19.8% in the bread wheat variety Sunguard (0.53 t/ha) up to 70.0% in the bread wheat variety EGA Gregory (2.07 t/ha). Yield loss was potentially underestimated at this site as a high level of background CR inoculum already existed across the site. Hence, there was a level of infection in the no added CR plots.
• No entry was lower yielding than EGA Gregory under high CR infection (added CR). The durum variety Jandaroi and bread wheat entries QT15046R, VO7176-69 and LRPB Flanker all produced yield equivalent to EGA Gregory in the added CR treatment (Table 1).
• The bread wheat varieties Viking (0.46 t/ha), LRPB Lancer (0.52 t/ha), LRPB Gauntlet (0.59 t/ha), Sunmate (0.79 t/ha), Mitch (0.90 t/ha), LRPB Spitfire (0.97 t/ha), Suntop (1.25 t/ha), Sunguard (1.28 t/ha) and Beckom (1.69 t/ha) were all higher yielding than EGA Gregory under high levels of CR infection (added CR).
• The barley variety La Trobe was 2.08 t/ha higher yielding than EGA Gregory under high levels of CR infection (added CR, Table 1).
Table 1. Yield and grain quality of varieties with no added and added crown rot – Mungindi 2015
Crop Variety Yield (t/ha) Protein (%)
Screenings (%)
No added CR Added CR No added CR Added CR
Barley La Trobe 3.34 2.97 12.8 17.9 22.3Commander na na na na na
Durum Jandaroi 2.61 1.15 14.3 5.2 23.2Bread wheat
Beckom 3.56 2.58 12.1 9.3 14.7Sunguard 2.70 2.17 13.5 5.7 12.6Suntop 3.01 2.14 12.8 9.1 14.5LRPB Spitfire 2.73 1.86 13.9 5.2 9.8Mitch 2.66 1.79 12.9 12.3 16.8Sunmate 2.96 1.68 12.0 6.7 12.8LRPB Gauntlet 2.86 1.48 13.3 3.0 11.0LRPB Lancer 2.54 1.41 14.3 6.5 14.8Viking 2.34 1.35 13.1 9.2 18.2QT15046R 2.92 1.00 12.6 8.2 18.1V07176-69 2.76 0.95 12.6 7.0 16.0LRPB Flanker 2.78 0.93 13.1 6.6 20.1EGA Gregory 2.96 0.89 12.6 5.7 20.0
Site mean 2.72 1.57 13.1 7.8 16.4CV (%) 10.9 3.8 19.2LSD 0.383 0.577 3.781P value <0.001 <0.001 <0.001

CR
OP
PR
OTE
CTI
ON
138 | NORTHERN GRAINS RESEARCH RESULTS 2016
Grain quality• Adding CR inoculum did not significantly affect grain protein levels in any of the
entries (data not presented). Hence, the average of added CR and no added CR treatments for each entry are presented (Table 1).
• Protein levels ranged between 12.0% (Sunmate) up to 14.3% (Jandaroi and LRPB Lancer; Table 1).
• In the no added CR treatment, screening levels ranged from 3.0% in the bread wheat variety LRPB Gauntlet up to 17.9% in the barley variety La Trobe (Table 1).
• Screening levels were increased in the added CR treatment with all entries by between an additional 4.4% in the barely variety La Trobe up to 18.0% in the durum variety Jandaroi.
• In the added CR treatment, screening levels ranged from 9.8% in the bread wheat variety LRPB Spitfire up to 23.2% in the durum variety Jandaroi (Table 1).
Trial 2. Fungicide seed treatment evaluation• Averaged across seed treatments plant establishment was significantly higher in
the no added CR treatment (89 plants/m2) compared to the added CR treatment (70 plants/m2).
• Averaged across CR inoculum treatments plant establishment with Rancona® Dimension (90 plants/m2) was better than that achieved with Jockey Stayer® (76 plants/m2) or no seed treatment (71 plants/m2) but was not significantly different from Dividend M® (81 plants/m2). The interaction between seed treatment and CR inoculum was not significant (P=0.243).
• Dividend M® slightly reduced the yield of EGA Gregory by 0.35 t/ha compared to no seed treatment in the no added CR treatment but was not significantly different from either of the two other fungicide seed treatments examined (Figure 1).
• Yield loss in the added CR treatment was 63% with Rancona® Dimension, 70% with Dividend M®, 72% with Jockey Stayer® and 75% with no seed treatment compared to the corresponding no added CR treatment (Figure 1).
• Rancona® Dimension provided a small (0.29 t/ha) yield benefit compared to no seed treatment in the presence of high levels of crown rot infection (added CR) but was not significantly different from the two other fungicide seed treatments examined. This benefit was not evident under high background levels of infection (no added CR) at the site and was far from complete control of crown rot with 63% yield loss still occurring (Figure 1).
a
bab ab
dcd c cd
0.0
0.5
1.0
1.5
2.0
2.5
3.0
3.5
Nil Dividend M® Rancona® Dimension Jockey Stayer®
Yiel
d (t
/ha)
No added CR Added CR
Figure 1. Impact of fungicide seed treatments on the yield of EGA GregoryA in the absence and presence of added crown rot inoculum – Mungindi 2015 Bars with the same letter are not significantly different (P=0.064)

CR
OP
PR
OTE
CTI
ON
INDEPENDENT RESEARCH FOR INDUSTRY | 139
ConclusionsCereal crop and variety choice provided a 52–234% yield benefit over growing the susceptible bread wheat variety EGA Gregory under high levels of CR infection at Mungindi in 2015. This can maximise profit in the current season but will not reduce inoculum levels for subsequent crops, because all winter cereal varieties are susceptible to CR infection. Winter cereal crop and variety choice is therefore not the sole solution to CR, but rather just one element of an integrated management strategy to limit losses from this disease.
Rancona® Dimension provided a small but significant yield benefit (0.29 t/ha) over the use of no seed treatment under high crown rot pressure at Mungindi in 2015, but was not significantly different from the two other commonly used seed treatments examined. Although Rancona® Dimension is registered for the suppression of crown rot, with activity against early infection and potential establishment losses evident in this study, growers should not expect this to translate into a significant and consistent reduction in yield loss from CR infection when the product is used as a standalone management strategy.
Integrated management remains the best strategy to reduce losses to CR.
AcknowledgementsThis research was co-funded by NSW DPI and GRDC under project DAN00175: National crown rot epidemiology and management. Thanks to Andrew Earle for providing the trial site and Douglas Lush (QDAF Mobile Trial Unit) for sowing, maintaining and harvesting the trial. Thanks to Chrystal Fensbo (NSW DPI) for grain quality assessments and to Jason Lowien (GrainCorp) for use of an NIR machine to determine grain protein levels.

CR
OP
PR
OTE
CTI
ON
140 | NORTHERN GRAINS RESEARCH RESULTS 2016
Regional crown rot management – Westmar, Qld 2015Steven Simpfendorfer and Robyn ShaplandNSW DPI, Tamworth
IntroductionCrown rot (CR), caused predominantly by the fungus Fusarium pseudograminearum (Fp), remains a major constraint in producing winter cereals in the NSW northern grains region. Cereal varieties differ in their resistance to CR which can have a significant impact on their relative yield in the presence of this disease.
Rancona® Dimension (ipconazole + metalaxyl) was recently registered in Australia as a fungicide seed treatment with good activity against cereal bunts and smuts, pythium and for the suppression of rhizoctonia. Rancona® Dimension is also the first seed treatment to be registered (at 320 mL/100 kg seed) for the suppression of CR. Suppression, by definition, indicates that the seed treatment reduces the pathogen’s growth for a set period of time early in the season.
Two trials were conducted at this site: 1. A variety trial, which was one of 12 conducted by NSW DPI in 2015 across central/
northern NSW extending into southern Qld to examine the effect of CR on the yield of two barley, one durum and 13 bread wheat varieties.
2. A second trial aimed to evaluate the efficacy of Rancona® Dimension as a standalone option to control CR was also conducted across the same 12 sites in the northern region. This will hopefully ensure that growers have a realistic expectation of what this seed treatment can achieve if used in isolation from other integrated disease management strategies.
Site detailsLocation: “Wongle”, Westmar, QldCo-operator: James CogganSowing date: 20 May 2015Fertiliser: 40 kg/ha Urea and 40 kg/ha Granulock® 12Z at sowingStarting N: 34 mg/kg to 0.6 mPreDicta B®: Nil root lesion nematodes, nil crown rot at sowing (0–30 cm)Harvest date: 20 October 2015
TreatmentsTrial 1. Variety evaluation• Two barley varieties: (CommanderA and La TrobeA)• One durum variety: (JandaroiA)• Eleven commercial bread wheat varieties: (EGA GregoryA, LRPB FlankerA, SunmateA,
LRPB GauntletA, LRPB LancerA, LRPB VikingA, LRPB SpitfireA, BeckomA, MitchA, SuntopA and SunguardA; listed in order of increasing resistance to CR) and two numbered lines (VO7176-69 and QT15046R).
• Added or no added CR at sowing using sterilised durum grain colonised by at least five different isolates of Fp.
Trial 2. Fungicide seed treatment evaluation• EGA GregoryA with added or no added CR at sowing using infected durum grain.• Seed treatments evaluated:
1. Nil seed treatment2. Rancona® Dimension (ipconazole 25 g/L + metalaxyl 20 g/L) at 320 mL/100 kg seed3. Dividend M® (difeniconazole 92 g/L + metalaxyl-M 23 g/L) at 260 mL/100 kg seed4. Jockey Stayer® (fluquinconazole 167 g/L) at 450 mL/100 kg seed.
Key findingsYield loss from crown rot ranged from 9.9% (not significant) in the bread wheat variety LRPB SpitfireA up to 60.1% in the bread wheat entry VO7176-69.
Bread wheat variety choice had a large effect on yield where there were high levels of crown rot infection with nine varieties being between 0.54 t/ha to 1.76 t/ha higher yielding than EGA GregoryA.
The barley varieties CommanderA and La TrobeA were 1.56 t/ha and 2.27 t/ha higher yielding than EGA GregoryA under high levels of crown rot infection, respectively.
Rancona® Dimension did not provide a yield benefit in the presence of high levels of crown rot infection at this site in 2015.

CR
OP
PR
OTE
CTI
ON
INDEPENDENT RESEARCH FOR INDUSTRY | 141
Dividend M® and Jockey Stayer® are NOT registered for the suppression of CR, but were included to represent a commonly used wheat seed treatment for bunt and smut control, or early control of stripe rust (leaf disease), respectively. Including four treatments across each site ensured statistical rigour for yield outcomes.
ResultsTrial 1. Variety evaluationYield• In the no added CR treatment, yield ranged from 3.14 t/ha in the durum variety
Jandaroi up to 4.64 t/ha in the barley variety La Trobe (Table 1).• All varieties with the exception of the bread wheat variety LRPB Spitfire, suffered
significant yield loss under high levels of CR infection (added CR) which ranged from 14.0% in the barley variety La Trobe (0.65 t/ha) up to 60.1% in the bread wheat entry VO7176-69 (2.14 t/ha).
• No entry was lower yielding than EGA Gregory under high CR infection (added CR). The new bread wheat variety LRPB Flanker and bread wheat entries QT15046R and VO7176-69 all produced yield equivalent to EGA Gregory in the added CR treatment (Table 1).
• The bread wheat varieties Viking (0.54 t/ha), Sunmate (0.81 t/ha), LRPB Lancer (0.88 t/ha), Mitch (0.88 t/ha), Sunguard (0.90 t/ha), LRPB Gauntlet (0.98 t/ha), Beckom (1.06 t/ha), Suntop (1.10 t/ha) and LRPB Spitfire (1.76 t/ha) were all higher yielding than EGA Gregory under high levels of CR infection (added CR).
• The durum variety Jandaroi was 0.73 t/ha higher yielding than EGA Gregory under high levels of CR infection (added CR, Table 1).
• The barley varieties Commander (1.56 t/ha) and La Trobe (2.27 t/ha) were both higher yielding than EGA Gregory under high levels of CR infection (added CR, Table 1).
Table 1. Yield and grain quality of varieties with no added and added crown rot – Westmar, Qld 2015
Crop Variety Yield (t/ha) Protein(%) Screenings (%)
No added CR Added CR No added CR Added CR
Barley La Trobe 4.64 3.99 11.9 3.9 7.9Commander 4.18 3.28 12.9 7.7 17.3
Durum Jandaroi 3.14 2.45 14.0 1.7 6.5Bread
wheat
LRPB Spitfire 3.86 3.48 12.8 3.5 4.5Suntop 3.75 2.82 12.4 9.0 13.0Beckom 4.02 2.78 11.6 7.4 17.4LRPB Gauntlet 3.80 2.70 12.0 1.7 7.6Sunguard 3.70 2.62 11.8 3.2 10.8Mitch 3.76 2.60 11.7 6.6 15.0LRPB Lancer 3.48 2.60 12.8 4.4 8.9Sunmate 4.17 2.53 11.6 4.7 12.2Viking 3.47 2.26 11.9 6.8 19.0QT15046R 3.65 1.99 11.9 6.7 19.5LRPB Flanker 3.61 1.81 12.0 6.2 23.7EGA Gregory 3.73 1.72 11.4 6.0 22.8V07176-69 3.55 1.42 11.8 5.1 24.7
Site mean 3.78 2.57 12.2 5.3 14.4CV (%) 9.6 6.3 31.1LSD 0.496 0.89 5.00P value <0.001 <0.001 <0.001
Grain quality• Adding CR inoculum did not significantly affect grain protein levels in any of the
entries (data not presented). Hence, the average of added CR and no added CR treatments for each entry are presented (Table 1).
• Protein levels ranged between 11.4% (EGA Gregory) up to 14.0% (Jandaroi; Table 1).

CR
OP
PR
OTE
CTI
ON
142 | NORTHERN GRAINS RESEARCH RESULTS 2016
• In the no added CR treatment, screening levels ranged from 1.7% in the bread wheat variety LRPB Gauntlet and durum variety Jandaroi up to 9.0% in the bread wheat variety Suntop (Table 1).
• Screening levels were increased in the added CR treatment with all entries, with the exception of La Trobe, Jandaroi, LRPB Spitfire, Suntop and LRPB Lancer, by between an additional 5.9% in LRPB Gauntlet up to 19.5% in VO7176-69.
• In the added CR treatment, screening levels ranged from 4.5% in the bread wheat variety LRPB Spitfire up to 24.7% in the bread wheat entry VO7176-69 (Table 1).
Trial 2. Fungicide seed treatment evaluation• Jockey Stayer® (79 plants/m2) had lower establishment than no seed treatment
(91 plants/m2) and Rancona® Dimension (94 plants/m2) in the no added CR treatment but was not significantly (P=0.04) different from Dividend M® (90 plants/m2).
• The addition of Fp inoculum at sowing reduced establishment to 62 plants/m2 where no seed treatment was used but this loss was overcome by the use of Dividend M® (86 plants/m2) or Rancona® Dimension (82 plants/m2) but not Jockey Stayer® (68 plants/m2) in the added CR treatment.
• There was no significant (P=0.153) difference in the yield of EGA Gregory with any of the seed treatments in the no added CR treatment (Figure 1).
• Yield loss in the added CR treatment was 49% with Dividend M®, 59% with Rancona® Dimension and no seed treatment; and 63% with Jockey Stayer® compared to the corresponding no added CR treatment (Figure 1).
• Dividend M® provided a small yield benefit compared to no seed treatment (0.26 t/ha) and Jockey Stayer® (0.40 t/ha) in the presence of high levels of crown rot infection (added CR) but was not significantly different from Rancona® Dimension (Figure 1).
a a a a
cb
bc c
0.0
0.5
1.0
1.5
2.0
2.5
3.0
3.5
4.0
4.5
Nil Dividend M® Rancona® Dimension Jockey Stayer®
Yiel
d (t
/ha)
No added CR Added CR
Figure 1. Impact of fungicide seed treatments on the yield of EGA GregoryA in the absence and presence of added crown rot inoculum – Westmar 2015 Bars with the same letter are not significantly different (P=0.153)
ConclusionsCereal crop and variety choice provided a 31–132% yield benefit over growing the susceptible bread wheat variety EGA Gregory under high levels of CR infection at Westmar in 2015. This can maximise profit in the current season but will not reduce inoculum levels for subsequent crops, because all winter cereal varieties are susceptible to CR infection. Winter cereal crop and variety choice is therefore not the sole solution to CR, but rather just one element of an integrated management strategy to limit losses from this disease.
Dividend M® provided a small but significant yield benefit (0.26 t/ha) over the use of no seed treatment under high CR pressure at Westmar in 2015, but was not significantly different from Rancona® Dimension. Rancona® Dimension did not provide a yield benefit in the presence of high levels of CR infection at this site in 2015. Although Rancona® Dimension is registered for the suppression of CR, with activity against early infection and potential establishment losses evident in this study, growers should not expect this to

CR
OP
PR
OTE
CTI
ON
INDEPENDENT RESEARCH FOR INDUSTRY | 143
translate into a significant and consistent reduction in yield loss from crown rot infection when the product is used as a standalone management strategy.
Integrated management remains the best strategy to reduce losses to CR.
AcknowledgementsThis research was co-funded by NSW DPI and GRDC under project DAN00175: National crown rot epidemiology and management. Thanks to James Coggan for providing the trial site and Douglas Lush (QDAF Mobile Trial Unit) for sowing, maintaining and harvesting the trial. Thanks to Chrystal Fensbo (NSW DPI) for grain quality assessments and to Jason Lowien (GrainCorp) for use of an NIR machine to determine grain protein levels.

CR
OP
PR
OTE
CTI
ON
144 | NORTHERN GRAINS RESEARCH RESULTS 2016
Regional crown rot management – Trangie 2015Steven Simpfendorfer1, Greg Brooke2 and Robyn Shapland1
1 NSW DPI, Tamworth 2 NSW DPI, Trangie
IntroductionCrown rot (CR), caused predominantly by the fungus Fusarium pseudograminearum (Fp), remains a major constraint in producing winter cereals in the NSW northern grains region. Cereal varieties differ in their resistance to CR which can have a significant impact on their relative yield in the presence of this disease.
Rancona® Dimension (ipconazole + metalaxyl) was recently registered in Australia as a fungicide seed treatment with good activity against cereal bunts and smuts, pythium and for the suppression of rhizoctonia. Rancona® Dimension is also the first seed treatment to be registered (at 320 mL/100 kg seed) for the suppression of CR. Suppression, by definition, indicates that the seed treatment reduces the pathogen’s growth for a set period of time early in the season.
Two trials were conducted at this site: 1. A variety trial, which was one of 12 conducted by NSW DPI in 2015 across central/
northern NSW extending into southern Qld to examine the effect of CR on the yield of two barley, one durum and 13 bread wheat varieties.
2. A second trial aimed to evaluate the efficacy of Rancona® Dimension as a standalone option to control CR was also conducted across the same 12 sites in the northern region. This will hopefully ensure that growers have a realistic expectation of what this seed treatment can achieve if used in isolation from other integrated disease management strategies.
Site detailsLocation: “Trangie Agricultural Research Centre”, TrangieSowing date: 15 May 2015Fertiliser: 80 kg/ha Granulock® 12Z at sowing; 70 kg/ha Easy N® on
10 July 2015Starting N: 60 mg/kg to 0.6 mPreDicta B®: Nil root lesion nematodes, nil crown rot at sowing (0–30 cm)In-crop rainfall: ~176 mmHarvest date: 10 November 2015
TreatmentsTrial 1. Variety evaluation• Two barley varieties: (CommanderA and La TrobeA)• One durum variety: (JandaroiA)• Eleven commercial bread wheat varieties: (EGA GregoryA, LRPB FlankerA, SunmateA,
LRPB GauntletA, LRPB LancerA, LRPB VikingA, LRPB SpitfireA, BeckomA, MitchA, SuntopA and SunguardA; listed in order of increasing resistance to CR) and two numbered lines (VO7176-69 and QT15046R).
• Added or no added CR at sowing using sterilised durum grain colonised by at least five different isolates of Fp.
Trial 2. Fungicide seed treatment evaluation• EGA GregoryA with added or no added CR at sowing using infected durum grain.• Seed treatments evaluated:
1. Nil seed treatment2. Rancona® Dimension (ipconazole 25 g/L + metalaxyl 20 g/L) at 320 mL/100 kg seed3. Dividend M® (difeniconazole 92 g/L + metalaxyl-M 23 g/L) at 260 mL/100 kg seed
Key findingsYield loss from crown rot was relatively low at this site in 2015 which ranged from 2.2% (not significant) in the bread wheat variety SuntopA up to 12.7% in the bread wheat variety LRPB FlankerA.
Bread wheat variety choice impacted on yield in the presence of high levels of crown rot infection with LRPB SpitfireA and BeckomA being 0.30 t/ha and 0.48 t/ha higher yielding than EGA GregoryA, respectively.
The barley variety La TrobeA was 0.99 t/ha higher yielding than EGA GregoryA under high levels of crown rot infection.
Rancona® Dimension did not provide a yield benefit in the presence of high levels of crown rot infection at this site in 2015.

CR
OP
PR
OTE
CTI
ON
INDEPENDENT RESEARCH FOR INDUSTRY | 145
4. Jockey Stayer® (fluquinconazole 167 g/L) at 450 mL/100 kg seed.Dividend M® and Jockey Stayer® are NOT registered for the suppression of CR, but were included to represent a commonly used wheat seed treatment for bunt and smut control, or early control of stripe rust (leaf disease), respectively. Including four treatments across each site ensured statistical rigour for yield outcomes.
ResultsTrial 1. Variety evaluationYield• In the no added CR treatment, yield ranged from 3.41 t/ha in the durum variety
Jandaroi up to 4.75 t/ha in the barley variety La Trobe (Table 1).• All entries with the exception of the bread wheat varieties Suntop and Sunguard and
the barley variety La Trobe, suffered significant yield loss under high levels of CR infection (added CR) which ranged from 5.9% in the bread wheat variety LRPB Spitfire (0.24 t/ha) up to 12.7% in the bread wheat variety LRPB Flanker (0.53 t/ha).
• The bread wheat variety Mitch (0.23 t/ha) and entry VO7176-69 (0.37 t/ha), along with the durum variety Jandaroi (0.47 t/ha) were lower yielding than EGA Gregory under high CR infection (added CR).
• Only the bread wheat varieties LRPB Spitfire (0.30 t/ha) and Beckom (0.48 t/ha), along with the barley variety La Trobe (0.99 t/ha) were higher yielding than EGA Gregory under high levels of CR infection (added CR).
• All remaining entries produced yield equivalent to EGA Gregory in the added CR treatment (Table 1).
Table 1. Yield and grain quality of varieties with no added and added crown rot – Trangie 2015
Crop Variety Yield (t/ha) Protein (%)
Screenings (%)
No added CR Added CR
Barley La Trobe 4.75 4.57 12.7 8.3Commander 4.08 3.77 13.7 9.9
Durum Jandaroi 3.41 3.11 14.4 5.0Bread wheat
Beckom 4.39 4.06 12.5 13.9LRPB Spitfire 4.12 3.88 13.4 7.9Suntop 3.84 3.76 13.1 11.9QT15046R 4.11 3.75 12.7 9.1LRPB Gauntlet 3.97 3.73 13.2 3.8Viking 3.97 3.70 12.9 10.7Sunmate 4.03 3.68 12.3 7.3LRPB Flanker 4.19 3.66 13.3 10.4EGA Gregory 3.99 3.58 13.1 8.9LRPB Lancer 3.80 3.57 14.0 6.8Sunguard 3.61 3.51 13.5 8.7Mitch 3.58 3.35 12.6 12.2V07176-69 3.64 3.21 12.9 12.1
Site mean 3.97 3.68 13.1 9.2CV (%) 3.1 4.9 33.2LSD 0.191 0.74 3.52P value 0.139 <0.001 <0.001
Grain quality • Adding CR inoculum did not significantly impact on grain quality in any of the entries
(data not presented). Hence, the average of added CR and no added CR treatments for each entry are presented (Table 1).
• Protein levels were generally good across entries which ranged between 12.3% (Sunmate) up to 14.4% (Jandaroi; Table 1).
• Screening levels ranged from 3.8% in the bread wheat variety LRPB Gauntlet up to 13.9% in the bread wheat variety Beckom (Table 1).

CR
OP
PR
OTE
CTI
ON
146 | NORTHERN GRAINS RESEARCH RESULTS 2016
Trial 2. Fungicide seed treatment evaluation• The addition of Fp inoculum at sowing reduced establishment in the added CR
treatment (61 plants/m2) compared to the no added CR treatment (75 plants/m2), averaged across seed treatments.
• None of the fungicide seed treatments significantly impacted on establishment in the presence or absence of CR infection.
• There was no significant (P=0.162) difference in the yield of EGA Gregory with any of the seed treatments in the no added CR treatment (Figure 1).
• Yield loss in the added CR treatment was 8% with no seed treatment, 12% with Dividend M®, 10% with Jockey Stayer® and 16% with Rancona® Dimension compared to the corresponding no added CR treatment (Figure 1).
• Rancona® Dimension slightly reduced yield by 0.21 t/ha compared to the Nil control in the added CR treatment, but was not significantly different from the other two fungicide seed treatments examined (Figure 1).
a a a ab bc
cbc
0.0
0.5
1.0
1.5
2.0
2.5
3.0
3.5
4.0
4.5
Nil Dividend M® Rancona® Dimension Jockey Stayer®
Yiel
d (t
/ha)
No added CR Added CR
Figure 1. Impact of fungicide seed treatments on the yield of EGA GregoryA in the absence and presence of added crown rot inoculum – Trangie 2015 Bars with the same letter are not significantly different (P=0.162)
ConclusionsCereal crop and variety choice provided an 8–28% yield benefit over growing the susceptible bread wheat variety EGA Gregory under high levels of crown rot infection at Trangie in 2015. The level of yield loss from crown rot infection was modest at this site relative to other trials conducted across the northern grains region in 2015. Reasonable rainfall throughout the growing season, with the exception of September, at this site limited the expression of the disease and hence level of associated yield loss. Crop and variety choice can maximise profit in the current season but will not reduce inoculum levels for subsequent crops, because all winter cereal varieties are susceptible to crown rot infection. Winter cereal crop and variety choice is therefore not the sole solution to CR, but rather just one element of an integrated management strategy to limit losses from this disease.
Rancona® Dimension did not provide a significant yield benefit over the use of no seed treatment or the two other commonly used seed treatments examined under high crown rot pressure at Trangie in 2015. Although Rancona® Dimension is registered for the suppression of CR, with activity against early infection and potential establishment losses (not evident at this site), growers should not expect this to translate into a significant and consistent reduction in yield loss from CR infection when the product is used as a standalone management strategy.
Integrated management remains the best strategy to reduce losses to CR.

CR
OP
PR
OTE
CTI
ON
INDEPENDENT RESEARCH FOR INDUSTRY | 147
AcknowledgementsThis research was co-funded by NSW DPI and GRDC under project DAN00175: National crown rot epidemiology and management. Thanks to Lizzie Smith, Paddy Steele, Sally Wright, Rachel Hayden and Jayne Jenkins for technical assistance sowing, maintaining and harvesting the trial. Thanks to Chrystal Fensbo (NSW DPI) for grain quality assessments and to Jason Lowien (GrainCorp) for use of an NIR machine to determine grain protein levels.

CR
OP
PR
OTE
CTI
ON
148 | NORTHERN GRAINS RESEARCH RESULTS 2016
Regional crown rot management – Nyngan 2015Steven Simpfendorfer1, Greg Brooke2 and Robyn Shapland1
1 NSW DPI, Tamworth 2 NSW DPI, Trangie
IntroductionCrown rot (CR), caused predominantly by the fungus Fusarium pseudograminearum (Fp), remains a major constraint in producing winter cereals in the NSW northern grains region. Cereal varieties differ in their resistance to CR which can have a significant impact on their relative yield in the presence of this disease.
Rancona® Dimension (ipconazole + metalaxyl) was recently registered in Australia as a fungicide seed treatment with good activity against cereal bunts and smuts, pythium and for the suppression of rhizoctonia. Rancona® Dimension is also the first seed treatment to be registered (at 320 mL/100 kg seed) for the suppression of CR. Suppression, by definition, indicates that the seed treatment reduces the pathogen’s growth for a set period of time early in the season.
Two trials were conducted at this site: 1. A variety trial, which was one of 12 conducted by NSW DPI in 2015 across central/
northern NSW extending into southern Qld to examine the effect of CR on the yield of two barley, one durum and 13 bread wheat varieties.
2. A second trial aimed to evaluate the efficacy of Rancona® Dimension as a standalone option to control CR was also conducted across the same 12 sites in the northern region. This will hopefully ensure that growers have a realistic expectation of what this seed treatment can achieve if used in isolation from other integrated disease management strategies.
Site detailsLocation: “Innaminna”, NynganCo-operater: Jack and Dione CarterSowing date: 8 May 2015Fertiliser: 80 kg/ha Granulock® 12Z at sowing; 70 kg/ha Easy N® on
10 July 2015Starting N: 48.5 mg/kg to 0.6 mPreDicta B®: Nil root lesion nematodes, nil crown rot at sowing (0–30 cm)In-crop rainfall: ~179 mmHarvest date: 30 October 2015
TreatmentsTrial 1. Variety evaluation• Two barley varieties: (CommanderA and La TrobeA)• One durum variety: (JandaroiA)• Eleven commercial bread wheat varieties: (EGA GregoryA, LRPB FlankerA, SunmateA,
LRPB GauntletA, LRPB LancerA, LRPB VikingA, LRPB SpitfireA, BeckomA, MitchA, SuntopA and SunguardA; listed in order of increasing resistance to CR) and two numbered lines (VO7176-69 and QT15046R).
• Added or no added CR at sowing using sterilised durum grain colonised by at least five different isolates of Fp.
Trial 2. Fungicide seed treatment evaluation• EGA GregoryA with added or no added CR at sowing using infected durum grain.• Seed treatments evaluated:
1. Nil seed treatment2. Rancona® Dimension (ipconazole 25 g/L + metalaxyl 20 g/L) at 320 mL/100 kg seed
Key findingsYield loss from crown rot ranged from 0.5% (not significant) in the bread wheat variety SunguardA up to 47.3% in the bread wheat variety EGA GregoryA.
Bread wheat variety choice had a large effect on yield where there were high levels of crown rot infection with eleven entries being between 0.65 t/ha to 1.35 t/ha higher yielding than EGA GregoryA.
The barley varieties CommanderA and La TrobeA were 1.64 t/ha and 2.47 t/ha higher yielding than EGA GregoryA under high levels of crown rot infection, respectively.
Rancona® Dimension did not provide a yield benefit in the presence of high levels of crown rot infection at this site in 2015.

CR
OP
PR
OTE
CTI
ON
INDEPENDENT RESEARCH FOR INDUSTRY | 149
3. Dividend M® (difeniconazole 92 g/L + metalaxyl-M 23 g/L) at 260 mL/100 kg seed4. Jockey Stayer® (fluquinconazole 167 g/L) at 450 mL/100 kg seed.
Dividend M® and Jockey Stayer® are NOT registered for the suppression of CR, but were included to represent a commonly used wheat seed treatment for bunt and smut control, or early control of stripe rust (leaf disease), respectively. Including four treatments across each site ensured statistical rigour for yield outcomes.
ResultsTrial 1. Variety evaluationYield• In the no added CR treatment, yield ranged from 2.48 t/ha in the bread wheat variety
Sunguard up to 4.37 t/ha in the barley variety La Trobe (Table 1).• All entries with the exception of the bread wheat varieties LRPB Spitfire, Viking and
Sunguard, suffered significant yield loss under high levels of CR infection (added CR) which ranged from 12.9% in the barley variety Commander (0.44 t/ha) up to 47.3% in the bread wheat variety EGA Gregory (1.22 t/ha).
• Concentrating purely on the extent of yield loss associated with CR infection in the different varieties can potentially be misleading as entries can vary markedly in their actual yield potential in a particular environment and season.
• Amongst the bread wheat entries, Viking and Sunguard had the lowest yield loss from CR at Nyngan in 2015. However, in the absence of added CR, Viking was significantly lower yielding than Beckom (0.62 t/ha), QT15046R (0.56 t/ha) and LRPB Gauntlet (0.47 t/ha) (Table 1).
• Sunguard similarly in the no added CR treatment was between 0.80 t/ha to 0.44 t/ha lower yielding than the bread wheat entries Beckom, QT15046R, LRPB Gauntlet, LRPB Flanker, Sunmate, LRPB Spitfire and Suntop at Nyngan in 2015. Hence, selecting a variety on the basis of reduced yield loss to CR should not come at the expense of yield potential.
• Under high CR pressure (added CR) yield ranged from 3.83 t/ha in the barley variety La Trobe down to 1.36 t/ha in the widely grown bread wheat variety EGA Gregory.
• Only the advanced bread wheat line V07176-69 and the durum variety Jandaroi were not significantly higher yielding than EGA Gregory in the presence of added CR.
• The average yield benefit over growing EGA Gregory under high CR infection ranged from 2.47 t/ha (182%) with the barley variety La Trobe down to 0.65 t/ha (48%) with the recently released bread wheat variety Mitch.
• However, the relative yield benefit compared to EGA Gregory was considerably greater with other bread wheat varieties such as LRPB Spitfire (1.35 t/ha), Beckom (1.33 t/ha), Viking (1.27 t/ha), LRPB Lancer (1.15 t/ha), Sunguard (1.11 t/ha) and Suntop (1.09 t/ha).
• Commander, the second barley variety in the trial, had a 1.64 t/ha (121%) yield benefit over EGA Gregory under high levels of CR infection in the added CR treatments at Nyngan in 2015 (Table 1).

CR
OP
PR
OTE
CTI
ON
150 | NORTHERN GRAINS RESEARCH RESULTS 2016
Table 1. Yield and grain quality of varieties with no added and added crown rot – Nyngan 2015
Crop Variety Yield (t/ha) Protein (%)
Screenings (%)
No added CR Added CR
Barley La Trobe 4.37 3.83 12.1 36.8Commander 3.45 3.00 12.6 40.6
Durum Jandaroi 2.37 1.40 13.9 15.4Bread wheat
LRPB Spitfire 2.93 2.71 12.7 12.3Beckom 3.28 2.69 12.0 25.1Viking 2.66 2.63 13.2 30.6LRPB Lancer 2.96 2.51 12.9 9.8Sunguard 2.48 2.47 12.3 15.1Suntop 2.92 2.45 11.8 19.4Sunmate 2.94 2.28 11.2 13.9LRPB Flanker 2.94 2.23 12.4 18.5QT15046R 3.22 2.20 11.8 16.7LRPB Gauntlet 3.13 2.17 11.5 8.2Mitch 2.75 2.01 12.4 19.9V07176-69 2.72 1.55 12.3 22.0EGA Gregory 2.57 1.36 11.9 18.8
Site mean 2.98 2.34 12.3 20.2CV (%) 7.0 7.9 39.4LSD 0.306 1.12 9.17P value <0.001 0.002 <0.001
Grain quality • Adding CR inoculum did not significantly impact on grain quality in any of the entries
(data not presented). Hence, the average of added CR and no added CR treatments for each entry are presented (Table 1).
• Protein levels ranged between 11.2% (Sunmate) up to 13.9% (Jandaroi; Table 1).• Screening levels in the bread wheat entries ranged from 8.2% in LRPB Gauntlet up to
30.6% in Viking (Table 1).• Screening levels were quite high in the barley varieties with 36.8% in La Trobe and
40.6% in Commander.Trial 2. Fungicide seed treatment evaluation• The addition of Fp inoculum at sowing reduced establishment in the added CR
treatment (63 plants/m2) compared to the no added CR treatment (80 plants/m2), averaged across seed treatments.
• Jockey Stayer® (65 plants/m2) had lower establishment than Dividend M® (76 plants/m2) and Rancona® Dimension (75 plants/m2) averaged across the CR treatments. The interaction between CR treatment and seed treatment was not significant (P=0.255).
• There was no significant (P=0.097) difference in the yield of EGA Gregory with any of the seed treatments in the no added CR treatment (Figure 1).
• Yield loss in the added CR treatment was 34% with Dividend M®, 43% with Jockey Stayer®, 48% with no seed treatment and 50% with Rancona® Dimension compared to the corresponding no added CR treatment (Figure 1).
• Dividend M® was slightly higher yielding (0.37 t/ha) than Rancona® Dimension in the added CR treatment, but was not significantly different from Jockey Stayer® or no seed treatment (Figure 1).

CR
OP
PR
OTE
CTI
ON
INDEPENDENT RESEARCH FOR INDUSTRY | 151
aa
aa
bc
b
c bc
0.0
0.5
1.0
1.5
2.0
2.5
3.0
3.5
Nil Dividend M® Rancona® Dimension Jockey Stayer®
Yiel
d (t
/ha)
No added CR Added CR
Figure 1. Impact of fungicide seed treatments on the yield of EGA GregoryA in the absence and presence of added crown rot inoculum – Nyngan 2015 Bars with the same letter are not significantly different (P=0.097)
ConclusionsCereal crop and variety choice provided a 48–182% yield benefit over growing the susceptible bread wheat variety EGA Gregory under high levels of crown rot infection at Nyngan in 2015. This choice can maximise profit in the current season but will not reduce inoculum levels for subsequent crops because all winter cereal varieties are susceptible to CR infection. Winter cereal crop and variety choice is therefore not the sole solution to CR but rather just one element of an integrated management strategy to limit losses from this disease.
The barley variety La Trobe appeared quite promising for maximising yield in the presence of high CR infection at Nyngan in 2015 and was also considerably higher yielding than other entries in the no added treatment. La Trobe achieved a significant yield benefit over Commander barley (0.83 t/ha) and the best performing bread wheat variety LRPB Spitfire (1.22 t/ha) in the presence of high CR infection at Nyngan in 2015. La Trobe is malt accredited but relative grain price (malt vs feed barley; wheat vs barley), the increased susceptibility of La Trobe to BYDV, impact on Pt populations, segregation by grain accumulators and performance of other barley and bread wheat varieties not included in these trials (www.nvt.online.com.au) should be considered as part of potential variety choices for the Nyngan district. Although achieving high yield in this trial, La Trobe also had a very high level of screenings at 36.8% which also needs to be taken into consideration.
Rancona® Dimension did not provide a significant yield benefit over the use of no seed treatment or the two other commonly used seed treatments examined under high CR pressure at Nyngan in 2015. Although Rancona® Dimension is registered for the suppression of crown rot, with activity against early infection and potential establishment losses (not evident at this site), growers should not expect this to translate into a significant and consistent reduction in yield loss from CR infection when the product is used as a standalone management strategy.
Integrated management remains the best strategy to reduce losses to CR.
AcknowledgementsThis research was co-funded by NSW DPI and GRDC under project DAN00175: National crown rot epidemiology and management. Thanks to Jack and Dione Carter for allowing us to conduct this trial on their property ‘Innaminna’ near Nyngan in 2015. Thanks to Lizzie Smith, Sally Wright, Rachel Hayden and Ray Platt for technical assistance sowing, maintaining and harvesting the trial. Thanks to Chrystal Fensbo (NSW DPI) for grain quality assessments and to Jason Lowien (GrainCorp) for use of an NIR machine to determine grain protein levels.

CR
OP
PR
OTE
CTI
ON
152 | NORTHERN GRAINS RESEARCH RESULTS 2016
Regional crown rot management – Garah 2015Steven Simpfendorfer and Robyn ShaplandNSW DPI, Tamworth
IntroductionCrown rot (CR), caused predominantly by the fungus Fusarium pseudograminearum (Fp), remains a major constraint in producing winter cereals in the NSW northern grains region. Cereal varieties differ in their resistance to CR which can have a significant impact on their relative yield in the presence of this disease.
Rancona® Dimension (ipconazole + metalaxyl) was recently registered in Australia as a fungicide seed treatment with good activity against cereal bunts and smuts, pythium and for the suppression of rhizoctonia. Rancona® Dimension is also the first seed treatment to be registered (at 320 mL/100 kg seed) for the suppression of CR. Suppression, by definition, indicates that the seed treatment reduces the pathogen’s growth for a set period of time early in the season.
Two trials were conducted at this site: 1. A variety trial, which was one of 12 conducted by NSW DPI in 2015 across central/
northern NSW extending into southern Qld to examine the effect of CR on the yield of two barley, one durum and 13 bread wheat varieties.
2. A second trial aimed to evaluate the efficacy of Rancona® Dimension as a standalone option to control CR was also conducted across the same 12 sites in the northern region. This will hopefully ensure that growers have a realistic expectation of what this seed treatment can achieve if used in isolation from other integrated disease management strategies.
Site detailsLocation: “Miroobil”, GarahCo-operator: Andrew and Bill YatesSowing date: 30 May 2015Fertiliser: 95 kg/ha Urea and 70 kg/ha Granulock® 12Z at sowingStarting N: 123 kg N/ha to 120 cmPAW: 114 mm plant available soil water (0–120 cm)In-crop rainfall: 180 mmPreDicta B®: 1.6 Pt/g soil (low risk), nil Pn and nil crown rot at sowing
(0–30 cm)Harvest date: 9 November 2015
TreatmentsTrial 1. Variety evaluation• Two barley varieties: (CommanderA and La TrobeA)• One durum variety: (JandaroiA)• Eleven commercial bread wheat varieties: (EGA GregoryA, LRPB FlankerA, SunmateA,
LRPB GauntletA, LRPB LancerA, LRPB VikingA, LRPB SpitfireA, BeckomA, MitchA, SuntopA and SunguardA; listed in order of increasing resistance to CR) and two numbered lines (VO7176-69 and QT15046R).
• Added or no added CR at sowing using sterilised durum grain colonised by at least five different isolates of Fp.
Trial 2. Fungicide seed treatment evaluation• EGA GregoryA with added or no added CR at sowing using infected durum grain.• Seed treatments evaluated:
1. Nil seed treatment
Key findingsYield loss from crown rot ranged from 10.5% in the barley variety La TrobeA up to 61.1% in the bread wheat variety EGA GregoryA.
Bread wheat variety choice had a large effect on yield where there were high levels of crown rot infection with ten entries being between 0.55 t/ha to 1.18 t/ha higher yielding than EGA GregoryA.
The barley varieties CommanderA and La TrobeA and were 1.66 t/ha and 2.37 t/ha higher yielding than EGA GregoryA under high levels of crown rot infection, respectively.
Rancona® Dimension did not provide a yield benefit in the presence of high levels of crown rot infection at this site in 2015 over the use of no seed treatment at planting.

CR
OP
PR
OTE
CTI
ON
INDEPENDENT RESEARCH FOR INDUSTRY | 153
2. Rancona® Dimension (ipconazole 25 g/L + metalaxyl 20 g/L) at 320 mL/100 kg seed3. Dividend M® (difeniconazole 92 g/L + metalaxyl-M 23 g/L) at 260 mL/100 kg seed4. Jockey Stayer® (fluquinconazole 167 g/L) at 450 mL/100 kg seed.
Dividend M® and Jockey Stayer® are NOT registered for the suppression of CR, but were included to represent a commonly used wheat seed treatment for bunt and smut control, or early control of stripe rust (leaf disease), respectively. Including four treatments across each site ensured statistical rigour for yield outcomes.
ResultsTrial 1. Variety evaluationYield• In the no added CR treatment, yield ranged from 2.89 t/ha in the bread wheat variety
LRPB Lancer up to 4.00 t/ha in the barley variety La Trobe (Table 1).• All varieties suffered significant yield loss under high levels of CR infection (added
CR) which ranged from 10.5% in the barley variety La Trobe (0.42 t/ha) up to 61.1% in the bread wheat variety EGA Gregory (1.90 t/ha).
• No entry was lower yielding than EGA Gregory under high CR infection (added CR). The new bread wheat variety LRPB Flanker and bread wheat entries VO7176-69 both produced yield equivalent to EGA Gregory in the added CR treatment (Table 1).
• The bread wheat entries QT15046R (0.55 t/ha), Viking (0.69 t/ha), Mitch (0.93 t/ha), LRPB Lancer (0.95 t/ha), Sunmate (1.02 t/ha), Sunguard (1.03 t/ha), Suntop (1.10 t/ha), LRPB Spitfire (1.11 t/ha), LRPB Gauntlet (1.11 t/ha) and Beckom (1.18 t/ha) were all higher yielding than EGA Gregory under high levels of CR infection (added CR).
• The durum variety Jandaroi was 0.70 t/ha higher yielding than EGA Gregory under high levels of CR infection (added CR, Table 1).
• The barley varieties Commander (1.66 t/ha) and La Trobe (2.37 t/ha) were both higher yielding than EGA Gregory under high levels of CR infection (added CR, Table 1).
Table 1. Yield and grain quality of varieties with no added and added crown rot – Garah 2015
Crop Variety Yield (t/ha) Protein (%) Screenings (%)
No added CR Added CR No added CR Added CR No added CR Added CR
Barley La Trobe 4.00 3.58 12.3 12.0 8.5 14.6Commander 3.75 2.87 13.9 12.5 13.2 22.2
Durum Jandaroi 3.30 1.91 15.4 15.0 5.7 23.0Bread wheat
Beckom 3.56 2.39 12.9 12.9 18.2 29.4Gauntlet 3.04 2.32 14.8 13.7 9.8 15.8LRPB Spitfire 3.10 2.32 14.9 14.8 11.8 17.9Suntop 3.14 2.31 14.0 13.5 14.7 23.0Sunguard 3.12 2.24 14.1 14.2 10.4 21.0Sunmate 3.41 2.23 12.8 12.4 8.7 16.9LRPB Lancer 2.89 2.16 15.8 14.3 13.0 15.4Mitch 2.96 2.14 14.0 13.7 13.8 25.4Viking 3.11 1.90 14.6 13.5 15.3 28.8QT15046R 3.19 1.76 13.7 12.5 14.4 28.6V07176-69 3.12 1.40 13.8 13.0 14.3 34.5LRPB Flanker 3.16 1.29 14.1 13.0 13.9 42.8EGA Gregory 3.12 1.21 14.3 12.8 14.8 34.9
Site mean 3.25 2.13 14.1 13.4 12.5 24.6CV (%) 5.8 3.7 20.3LSD 0.255 0.84 6.15P value <0.001 0.08 <0.001

CR
OP
PR
OTE
CTI
ON
154 | NORTHERN GRAINS RESEARCH RESULTS 2016
Grain quality • Protein levels were relatively high at this site in 2015 which in the no added CR
treatment ranged between 12.8% (Sunmate) up to 15.4% (Jandaroi; Table 1).• Crown rot infection (added CR) significantly reduced grain protein levels by 1.4% in
the barley variety Commander and by between 1.1 to 1.5% in the bread wheat entries LRPB Gauntlet , Viking , LRPB Flanker, QT15046R, LRPB Lancer and EGA Gregory (Table 1).
• In the no added CR treatment, screening levels ranged from 5.7% in the durum variety Jandaroi up to 18.2% in the bread wheat variety Beckom (Table 1).
• Screening levels were increased in the added CR treatment with all entries with the exception of the barley variety La Trobe and bread wheat varieties LRPB Gauntlet, LRPB Spitfire and LRPB Lancer.
• In the added CR treatment, screening levels ranged from 14.6% in the barley variety La Trobe up to 42.8% in the bread wheat variety LRPB Flanker (Table 1).
Trial 2. Fungicide seed treatment evaluation• Plant establishment was significantly (P=0.018) lower with Dividend M® (67 plants/m2)
compared to no seed treatment (86 plants/m2) and the other two fungicide seed treatments in the no added CR treatment.
• The addition of Fp inoculum at sowing significantly reduced establishment with Jockey Stayer® (56 plants/m2) and no seed treatment (57 plants/m2) with better establishment maintained with Rancona® Dimension (74 plants/m2) and Dividend M® (75 plants/m2).
• There was no significant (P=0.047) difference in the yield of EGA Gregory with any of the seed treatments in the no added CR treatment (Figure 1).
• Yield loss in the added CR treatment was 52% with Rancona® Dimension, 58% with Jockey Stayer®, 60% with no seed treatment and 61% with Dividend M® compared to the corresponding no added CR treatment (Figure 1).
• Rancona® Dimension slightly increased yield by 0.27 t/ha compared to Dividend M® in the added CR treatment but was not significantly different from no seed treatment of Jockey Stayer® (Figure 1).
a a a a
c cb bc
0.0
0.5
1.0
1.5
2.0
2.5
3.0
3.5
4.0
Nil Dividend M® Rancona® Dimension Jockey Stayer®
Yiel
d (t
/ha)
No added CR Added CR
Figure 1. Impact of fungicide seed treatments on the yield of EGA GregoryA in the absence and presence of added crown rot inoculum – Garah 2015 Bars with the same letter are not significantly different (P=0.047)
ConclusionsCereal crop and variety choice provided a 46–196% yield benefit over growing the susceptible bread wheat variety EGA Gregory under high levels of CR infection at Garah in 2015. This can maximise profit in the current season but will not reduce inoculum levels for subsequent crops, because all winter cereal varieties are susceptible to CR infection. Winter cereal crop and variety choice is therefore not the sole solution to CR but rather just one element of an integrated management strategy to limit losses from this disease.

CR
OP
PR
OTE
CTI
ON
INDEPENDENT RESEARCH FOR INDUSTRY | 155
Rancona® Dimension provide a small but significant yield benefit (0.27 t/ha) over the use of Dividend M® under high CR pressure at Garah in 2015, but was not significantly different from the use of no seed treatment or Jockey Stayer®. The effect of Rancona® Dimension on yield in the presence of CR was far from complete control with 52% yield loss still occurring. Although Rancona® Dimension is registered for the suppression of CR, with activity against early infection and potential establishment losses evident in this study, growers should not expect this to translate into a significant and consistent reduction in yield loss from CR infection when the product is used as a standalone management strategy.
Integrated management remains the best strategy to reduce losses to CR.
AcknowledgementsThis research was co-funded by NSW DPI and GRDC under project DAN00175: National crown rot epidemiology and management. Thanks to Andrew and Bill Yates for providing the trial site and Rick Graham, Jim Perfrement, Stephen Morphett (NSW DPI) for sowing, maintaining and harvesting the trial. Thanks to Chrystal Fensbo (NSW DPI) for grain quality assessments and to Jason Lowien (GrainCorp) for use of an NIR machine to determine grain protein levels.

CR
OP
PR
OTE
CTI
ON
156 | NORTHERN GRAINS RESEARCH RESULTS 2016
Regional crown rot management – Coonamble 2015Steven Simpfendorfer and Robyn ShaplandNSW DPI, Tamworth
IntroductionCrown rot (CR), caused predominantly by the fungus Fusarium pseudograminearum (Fp), remains a major constraint in producing winter cereals in the NSW northern grains region. Cereal varieties differ in their resistance to CR which can have a significant impact on their relative yield in the presence of this disease.
Rancona® Dimension (ipconazole + metalaxyl) was recently registered in Australia as a fungicide seed treatment with good activity against cereal bunts and smuts, pythium and for the suppression of rhizoctonia. Rancona® Dimension is also the first seed treatment to be registered (at 320 mL/100 kg seed) for the suppression of CR. Suppression, by definition, indicates that the seed treatment reduces the pathogen’s growth for a set period of time early in the season.
Two trials were conducted at this site: 1. A variety trial, which was one of 12 conducted by NSW DPI in 2015 across central/
northern NSW extending into southern Qld to examine the effect of CR on the yield of two barley, one durum and 13 bread wheat varieties.
2. A second trial aimed to evaluate the efficacy of Rancona® Dimension as a standalone option to control CR was also conducted across the same 12 sites in the northern region. This will hopefully ensure that growers have a realistic expectation of what this seed treatment can achieve if used in isolation from other integrated disease management strategies.
Site detailsLocation: “Naratigah”, CoonambleCo-operator: Tony SingleSowing date: 28 May 2015Fertiliser: 60 kg/ha Granulock® 12Z at sowingStarting N: 41.4 mg/kg (0–60 cm)In-crop rainfall: 174 mmPreDicta B®: Nil root lesion nematodes and 2.2 log Fusarium DNA/g (high) at
sowing (0–30 cm)Harvest date: 19 November 2015
TreatmentsTrial 1. Variety evaluation• Two barley varieties: (CommanderA and La TrobeA)• One durum variety: (JandaroiA)• Eleven commercial bread wheat varieties: (EGA GregoryA, LRPB FlankerA, SunmateA,
LRPB GauntletA, LRPB LancerA, LRPB VikingA, LRPB SpitfireA, BeckomA, MitchA, SuntopA and SunguardA; listed in order of increasing resistance to CR) and two numbered lines (VO7176-69 and QT15046R).
• Added or no added CR at sowing using sterilised durum grain colonised by at least five different isolates of Fp.
Trial 2. Fungicide seed treatment evaluation• EGA GregoryA with added or no added CR at sowing using infected durum grain.• Seed treatments evaluated:
1. Nil seed treatment2. Rancona® Dimension (ipconazole 25 g/L + metalaxyl 20 g/L) at 320 mL/100 kg seed
Key findingsHigh background crown rot inoculum levels existed at this site in 2015, resulting in high infection levels in all plots, so the actual extent of yield loss within each variety could not be determined.
Bread wheat variety choice had a large effect on yield where there were high levels of crown rot infection with nine entries being between 0.34 t/ha to 0.84 t/ha higher yielding than EGA GregoryA.
The barley varieties CommanderA and La TrobeA and were 1.03 t/ha and 1.28 t/ha higher yielding than EGA GregoryA under high levels of crown rot infection, respectively.
Rancona® Dimension did not provide a yield benefit in the presence of high levels of crown rot infection at this site in 2015.

CR
OP
PR
OTE
CTI
ON
INDEPENDENT RESEARCH FOR INDUSTRY | 157
3. Dividend M® (difeniconazole 92 g/L + metalaxyl-M 23 g/L) at 260 mL/100 kg seed4. Jockey Stayer® (fluquinconazole 167 g/L) at 450 mL/100 kg seed.
Dividend M® and Jockey Stayer® are NOT registered for the suppression of CR, but were included to represent a commonly used wheat seed treatment for bunt and smut control, or early control of stripe rust (leaf disease), respectively. Including four treatments across each site ensured statistical rigour for yield outcomes.
ResultsTrial 1. Variety evaluationYield• Due to high background crown rot inoculum levels at this site the interaction between
winter cereal entry and inoculum level was not significant (P=0.363) as high infection levels occurred in both the no added CR and added CR treatments. Hence, the average of added CR and no added CR treatments for each entry are presented (Table 1).
• However, entries still varied in their yield performance under these high levels of crown rot infection which ranged from 3.05 t/ha in the bread wheat variety EGA Gregory up to 4.33 t/ha in the barley variety La Trobe (Table 1).
• No entry was lower yielding than EGA Gregory. The durum variety Jandaroi and bread wheat varieties LRPB Flanker, Viking and Sunguard all produced yield equivalent to EGA Gregory (Table 1).
• The bread wheat entries VO7176-69 (0.34 t/ha), QT15046R (0.35 t/ha), Suntop (0.38 t/ha), LRPB Spitfire (0.44 t/ha), LRPB Lancer (0.45 t/ha), Mitch (0.50 t/ha), Sunmate (0.56 t/ha), LRPB Gauntlet (0.64 t/ha) and Beckom (0.84 t/ha) were all higher yielding than EGA Gregory under high CR infection levels at this site in 2015 (Table 1).
• The barley varieties Commander (1.03 t/ha) and La Trobe (1.28 t/ha) were both higher yielding than EGA Gregory under high CR infection levels at this site in 2015 (Table 1).
Table 1. Yield and grain quality of varieties averaged over treatments (no added and added crown rot) – Coonamble 2015
Crop Variety Yield (t/ha) Protein (%) Screenings (%)
Barley La Trobe 4.33 13.1 16.4Commander 4.08 13.1 13.2
Durum Jandaroi 3.23 15.1 13.4Bread wheat
Beckom 3.89 13.1 30.5LRPB Gauntlet 3.69 13.8 10.8Sunmate 3.61 13.1 19.4Mitch 3.55 13.7 19.0LRPB Lancer 3.50 14.0 11.9LRPB Spitfire 3.49 14.6 15.6Suntop 3.43 13.8 20.1QT15046R 3.40 12.9 17.5V07176-69 3.39 13.2 17.3Sunguard 3.33 13.9 18.7Viking 3.33 13.2 18.8LRPB Flanker 3.18 13.6 19.8EGA Gregory 3.05 13.1 17.1
Site mean 3.53 13.6 17.5CV (%) 7.0 3.6 18.5LSD 0.286 0.56 3.74P value <0.001 <0.001 <0.001

CR
OP
PR
OTE
CTI
ON
158 | NORTHERN GRAINS RESEARCH RESULTS 2016
Grain quality • The addition of CR inoculum did not significantly impact on grain quality in any of
the entries (data not presented). Hence, the average of added CR and no added CR treatments for each entry are presented (Table 1).
• Protein levels were relatively high at this site in 2015 which ranged between 12.9% (QT15046R) up to 15.1% (Jandaroi; Table 1).
• Screening levels were also quite high at this site in 2015 which ranged from 10.8% in the bread wheat variety LRPB Gauntlet up to 30.5% in the bread wheat variety Beckom averaged across the no added CR and added CR treatments (Table 1).
Trial 2. Fungicide seed treatment evaluation• The addition of Fp inoculum at sowing reduced establishment in the added CR
treatment (54 plants/m2) compared to the no added CR treatment (62 plants/m2), averaged across seed treatments.
• Jockey Stayer® and nil seed treatment (both 53 plants/m2) had lower establishment than Rancona® Dimension (68 plants/m2) averaged across the CR treatments with Dividend M® (58 plants/m2) having intermediate establishment. The interaction between CR treatment and seed treatment was not significant (P=0.769).
• Yield loss in the added CR treatment averaged 22% (0.68 t/ha) across seed treatments compared to the no added CR treatment.
• There was no significant (P=0.704) effect of any of the seed treatments on the yield of EGA Gregory in either the no added CR or added CR treatments (data not shown).
ConclusionsCereal crop and variety choice provided an 11–42% yield benefit over growing the susceptible bread wheat variety EGA Gregory under high levels of CR infection at Coonamble in 2015. This can maximise profit in the current season but will not reduce inoculum levels for subsequent crops, because all winter cereal varieties are susceptible to CR infection. Winter cereal crop and variety choice is therefore not the sole solution to CR but rather just one element of an integrated management strategy to limit losses from this disease.
Rancona® Dimension did not provide a yield benefit under high CR pressure at Coonamble in 2015. Although Rancona® Dimension is registered for the suppression of CR, with activity against early infection and potential establishment losses evident in this study, growers should not expect this to translate into a significant and consistent reduction in yield loss from CR infection when the product is used as a standalone management strategy.
Integrated management remains the best strategy to reduce losses to CR.
AcknowledgementsThis research was co-funded by NSW DPI and GRDC under project DAN00175: National crown rot epidemiology and management. Thanks to Tony Single and family for providing the trial site and Peter Matthews and Gerard Lonergan (NSW DPI) for sowing, maintaining and harvesting the trial. Thanks to Chrystal Fensbo (NSW DPI) for grain quality assessments and to Jason Lowien (GrainCorp) for use of an NIR machine to determine grain protein levels.

CR
OP
PR
OTE
CTI
ON
INDEPENDENT RESEARCH FOR INDUSTRY | 159
Regional crown rot management – Mullaley 2015Steven Simpfendorfer and Robyn ShaplandNSW DPI, Tamworth
IntroductionCrown rot (CR), caused predominantly by the fungus Fusarium pseudograminearum (Fp), remains a major constraint in producing winter cereals in the NSW northern grains region. Cereal varieties differ in their resistance to CR which can have a significant impact on their relative yield in the presence of this disease.
Rancona® Dimension (ipconazole + metalaxyl) was recently registered in Australia as a fungicide seed treatment with good activity against cereal bunts and smuts, pythium and for the suppression of rhizoctonia. Rancona® Dimension is also the first seed treatment to be registered (at 320 mL/100 kg seed) for the suppression of CR. Suppression, by definition, indicates that the seed treatment reduces the pathogen’s growth for a set period of time early in the season.
Two trials were conducted at this site: 1. A variety trial, which was one of 12 conducted by NSW DPI in 2015 across central/
northern NSW extending into southern Qld to examine the effect of CR on the yield of two barley, one durum and 13 bread wheat varieties.
2. A second trial aimed to evaluate the efficacy of Rancona® Dimension as a standalone option to control CR was also conducted across the same 12 sites in the northern region. This will hopefully ensure that growers have a realistic expectation of what this seed treatment can achieve if used in isolation from other integrated disease management strategies.
Site detailsLocation: “Lambrook”, MullaleyCo-operators: James Vince and William AdamsSowing date: 20 May 2015Fertiliser: 70 kg/ha Granulock® 12Z at sowingStarting N: 225 kg/ha to 1.2 mPreDicta B®: Nil root lesion nematodes, 1.6 log Fusarium DNA/g (medium) at
sowing (0–30 cm)In-crop rainfall: ~154 mmHarvest date: 25 November 2015
TreatmentsTrial 1. Variety evaluation• Two barley varieties: (CommanderA and La TrobeA)• One durum variety: (JandaroiA)• Eleven commercial bread wheat varieties: (EGA GregoryA, LRPB FlankerA, SunmateA,
LRPB GauntletA, LRPB LancerA, LRPB VikingA, LRPB SpitfireA, BeckomA, MitchA, SuntopA and SunguardA; listed in order of increasing resistance to CR) and two numbered lines (VO7176-69 and QT15046R).
• Added or no added CR at sowing using sterilised durum grain colonised by at least five different isolates of Fp.
Trial 2. Fungicide seed treatment evaluation• EGA GregoryA with added or no added CR at sowing using infected durum grain.• Seed treatments evaluated:
1. Nil seed treatment2. Rancona® Dimension (ipconazole 25 g/L + metalaxyl 20 g/L) at 320 mL/100 kg seed
Key findingsYield loss from crown rot was relatively low at this site in 2015 which ranged from 2.6% (not significant) in the barley variety La TrobeA up to 15.2% in the bread wheat variety SunmateA.
Bread wheat variety choice had a large effect on yield where there were high levels of crown rot infection with LRPB LancerA, SuntopA, BeckomA and MitchA being between 0.31 t/ha and 0.51 t/ha higher yielding than EGA GregoryA.
The barley variety La TrobeA was 0.59 t/ha higher yielding than EGA GregoryA under high levels of crown rot infection.
Rancona® Dimension did not provide a yield benefit in the presence of high levels of crown rot infection at this site in 2015.

CR
OP
PR
OTE
CTI
ON
160 | NORTHERN GRAINS RESEARCH RESULTS 2016
3. Dividend M® (difeniconazole 92 g/L + metalaxyl-M 23 g/L) at 260 mL/100 kg seed4. Jockey Stayer® (fluquinconazole 167 g/L) at 450 mL/100 kg seed.
Dividend M® and Jockey Stayer® are NOT registered for the suppression of CR, but were included to represent a commonly used wheat seed treatment for bunt and smut control, or early control of stripe rust (leaf disease), respectively. Including four treatments across each site ensured statistical rigour for yield outcomes.
ResultsTrial 1. Variety evaluationYield• In the no added CR treatment yield ranged from 4.18 t/ha in the bread wheat variety
LRPB Spitfire up to 4.96 t/ha in the bread wheat variety Mitch (Table 1).• All entries with the exception of the bread wheat varieties LRPB Lancer, Sunguard and
LRPB Spitfire; and the barley varieties La Trobe and Commander, suffered significant yield loss under high levels of CR infection (added CR) which ranged from 5.3% in the bread wheat variety Beckom (0.26 t/ha) up to 15.2% in the bread wheat variety Sunmate (0.68 t/ha). Yield loss was potentially underestimated at this site as a medium level of background CR inoculum already existed across the site. Hence, there was a level of infection in the no added CR plots.
• Only the bread wheat varieties LRPB Lancer (by 0.31 t/ha), Suntop (by 0.38 t/ha), Beckom (by 0.48 t/ha) and Mitch (by 0.51 t/ha), along with the barley variety La Trobe (0.59 t/ha) were higher yielding than EGA Gregory under high levels of CR infection (added CR).
• All remaining entries produced yield equivalent to EGA Gregory in the added CR treatment (Table 1).
Table 1. Yield and grain quality of varieties with no added and added crown rot – Mullaley 2015
Crop Variety Yield (t/ha) Protein (%)
Screenings (%)
No added CR Added CR
Barley La Trobe 4.82 4.69 11.6 11.3Commander 4.32 4.15 11.8 9.7
Durum Jandaroi 4.57 3.90 11.8 3.3Bread wheat
Mitch 4.96 4.61 10.9 6.0Beckom 4.84 4.58 11.4 13.1Suntop 4.77 4.48 11.4 8.5LRPB Lancer 4.60 4.41 11.9 3.9V07176-69 4.58 4.28 10.8 7.2Viking 4.80 4.27 10.5 7.4QT15046R 4.70 4.24 11.0 8.1Sunguard 4.35 4.21 11.3 5.6LRPB Gauntlet 4.63 4.12 11.6 4.2EGA Gregory 4.55 4.10 11.1 7.7LRPB Spitfire 4.18 4.00 11.8 7.6LRPB Flanker 4.54 3.94 11.1 9.5Sunmate 4.46 3.78 11.3 8.6
Site mean 4.60 4.24 11.3 7.6CV (%) 3.1 3.7 17.7LSD 0.222 0.49 1.55P value 0.001 <0.001 <0.001

CR
OP
PR
OTE
CTI
ON
INDEPENDENT RESEARCH FOR INDUSTRY | 161
Grain quality• The addition of CR inoculum did not significantly impact on grain quality in any of
the entries (data not presented). Hence, the average of added CR and no added CR treatments for each entry are presented (Table 1).
• Protein levels were relatively low across entries at this site in 2015 which ranged between 10.5% (Viking) up to 11.9% (LRPB Lancer; Table 1).
• Screening levels ranged from 3.3% in the durum variety Jandaroi up to 13.1% in the bread wheat variety Beckom (Table 1).
Trial 2. Fungicide seed treatment evaluation• The addition of Fp inoculum at sowing reduced establishment in the added CR
treatment (96 plants/m2) compared to the no added CR treatment (105 plants/m2), averaged across seed treatments.
• Averaged across CR inoculum treatments plant establishment with Dividend M® (114 plants/m2) and Rancona® Dimension (107 plants/m2) was better than that achieved with Jockey Stayer® (93 plants/m2) and no seed treatment (89 plants/m2). The interaction between seed treatment and CR inoculum was not significant (P=0.25).
• There was no significant (P=0.044) difference in the yield of EGA Gregory with any of the seed treatments in the no added CR treatment (Figure 1).
• Yield loss in the added CR treatment was 10% with Dividend M®, 11% with Rancona® Dimension, 13% with no seed treatment and 18% with Jockey Stayer® compared to the corresponding no added CR treatment (Figure 1).
• Jockey Stayer® slightly reduced yield by 0.27 t/ha compared to Dividend M® and Rancona® Dimension in the added CR treatment, but was not significantly different from the use of no seed treatment (Figure 1).
a a a a
bc b b c
0.00.51.01.52.02.53.03.54.04.55.05.5
Nil Dividend M® Rancona® Dimension Jockey Stayer®
Yiel
d (t
/ha)
No added CR Added CR
Figure 1. Impact of fungicide seed treatments on the yield of EGA GregoryA in the absence and presence of added crown rot inoculum – Mullaley 2015 Bars with the same letter are not significantly different (P=0.044)
ConclusionsCereal crop and variety choice provided an 8–14% yield benefit over growing the susceptible bread wheat variety EGA Gregory under high levels of CR infection at Mullaley in 2015. The level of yield loss from crown rot infection was modest at this site relative to other trials conducted across the northern grains region in 2015. Reasonable rainfall throughout the growing season, with the exception of July and October, along with a full soil moisture profile at sowing at this site limited the expression of the disease and hence level of associated yield loss. Crop and variety choice can maximise profit in the current season but will not reduce inoculum levels for subsequent crops, because all winter cereal varieties are susceptible to CR infection. Winter cereal crop and variety choice is therefore not the sole solution to CR but rather just one element of an integrated management strategy to limit losses from this disease.
Rancona® Dimension did not provide a significant yield benefit over the use of no seed treatment or one of the other commonly used seed treatments examined under high

CR
OP
PR
OTE
CTI
ON
162 | NORTHERN GRAINS RESEARCH RESULTS 2016
CR pressure at Mullaley in 2015. Although Rancona® Dimension is registered for the suppression of CR, with activity against early infection and potential establishment losses, growers should not expect this to translate into a significant and consistent reduction in yield loss from CR infection when the product is used as a standalone management strategy.
Integrated management remains the best strategy to reduce losses to CR.
AcknowledgementsThis research was co-funded by NSW DPI and GRDC under project DAN00175: National crown rot epidemiology and management. Thanks to James Vince and William Adams for hosting this trial on their property in 2015. Thanks to Rick Graham, Stephen Morphett and Jim Perfrement (NSW DPI) for technical assistance sowing, maintaining and harvesting the trial. Thanks to Chrystal Fensbo (NSW DPI) for grain quality assessments and to Jason Lowien (GrainCorp) for use of an NIR machine to determine grain protein levels.

CR
OP
PR
OTE
CTI
ON
INDEPENDENT RESEARCH FOR INDUSTRY | 163
Regional crown rot management – Merriwa 2015Steven Simpfendorfer and Robyn ShaplandNSW DPI, Tamworth
IntroductionCrown rot (CR), caused predominantly by the fungus Fusarium pseudograminearum (Fp), remains a major constraint in producing winter cereals in the NSW northern grains region. Cereal varieties differ in their resistance to CR which can have a significant impact on their relative yield in the presence of this disease.
Rancona® Dimension (ipconazole + metalaxyl) was recently registered in Australia as a fungicide seed treatment with good activity against cereal bunts and smuts, pythium and for the suppression of rhizoctonia. Rancona® Dimension is also the first seed treatment to be registered (at 320 mL/100 kg seed) for the suppression of CR. Suppression, by definition, indicates that the seed treatment reduces the pathogen’s growth for a set period of time early in the season.
Two trials were conducted at this site:1. A variety trial, which was one of 12 conducted by NSW DPI in 2015 across central/
northern NSW extending into southern Qld to examine the effect of CR on the yield of two barley, one durum and 13 bread wheat varieties.
2. A second trial aimed to evaluate the efficacy of Rancona® Dimension as a standalone option to control CR was also conducted across the same 12 sites in the northern region. This will hopefully ensure that growers have a realistic expectation of what this seed treatment can achieve if used in isolation from other integrated disease management strategies.
Site detailsLocation: “Farley”, MerriwaCo-operators: Ray InderSowing date: 9 June 2015Fertiliser: 95 kg/ha Granulock® 12Z and 70 kg/ha of urea at sowingStarting N: 20.6 mg/kg (0–60 cm)PreDicta B®: 1.8 Pt/g (low), nil Pn and 1.8 log Fusarium DNA/g (medium) at
sowing (0–30 cm)In-crop rainfall: ~288 mm (142 mm in November)Harvest date: 9 December 2015
TreatmentsTrial 1. Variety evaluation• Two barley varieties: (CommanderA and La TrobeA)• One durum variety: (JandaroiA)• Eleven commercial bread wheat varieties: (EGA GregoryA, LRPB FlankerA, SunmateA,
LRPB GauntletA, LRPB LancerA, LRPB VikingA, LRPB SpitfireA, BeckomA, MitchA, SuntopA and SunguardA; listed in order of increasing resistance to CR) and two numbered lines (VO7176-69 and QT15046R).
• Added or no added CR at sowing using sterilised durum grain colonised by at least five different isolates of Fp.
Trial 2. Fungicide seed treatment evaluation• EGA GregoryA with added or no added CR at sowing using infected durum grain.• Seed treatments evaluated:
1. Nil seed treatment2. Rancona® Dimension (ipconazole 25 g/L + metalaxyl 20 g/L) at 320 mL/100 kg seed
Key findingsYield loss from crown rot was relatively low at this site in 2015, ranging from 3.6% (not significant) in the barley variety La TrobeA up to 19.7% in the bread wheat entry VO7176-69.
Only the bread wheat varieties SuntopA and MitchA were higher yielding than EGA GregoryA under high levels of crown rot infection by 0.24 t/ha and 0.52 t/ha, respectively.
This site was noticeably infected with an aphid transmitted virus, Barley Yellow Dwarf Virus (BYDV) which appears to have impacted considerably on the yield of the more BYDV susceptible barley variety La TrobeA.
Rancona® Dimension did not provide a yield benefit in the presence of high levels of crown rot infection at this site in 2015.

CR
OP
PR
OTE
CTI
ON
164 | NORTHERN GRAINS RESEARCH RESULTS 2016
3. Dividend M® (difeniconazole 92 g/L + metalaxyl-M 23 g/L) at 260 mL/100 kg seed4. Jockey Stayer® (fluquinconazole 167 g/L) at 450 mL/100 kg seed.
Dividend M® and Jockey Stayer® are NOT registered for the suppression of CR, but were included to represent a commonly used wheat seed treatment for bunt and smut control, or early control of stripe rust (leaf disease), respectively. Including four treatments across each site ensured statistical rigour for yield outcomes.
ResultsTrial 1. Variety evaluationYield• In the no added CR treatment yield ranged from 2.84 t/ha in the barley variety
La Trobe up to 4.02 t/ha in the bread wheat variety Mitch (Table 1).• Barley yellow dwarf virus (BYDV) was evident in this trial site with the yield impact
appearing to be greater in La Trobe (2.78 t/ha) than in Commander (3.44 t/ha). Based on Western Australian data Commander is rated moderately resistant-moderately susceptible (MR-MS) to BYDV while La Trobe has a provisional rating of susceptible (S).
• The impact of BYDV on yield is generally greater in barley than in wheat, but as appears to have occurred at Merriwa in 2015, varieties can differ significantly in their levels of resistance.
Table 1. Yield and grain quality of varieties with no added and added crown rot – Merriwa 2015
Crop Variety Yield (t/ha) Protein (%)
Screenings (%)
No added CR Added CR
Barley Commander 3.73 3.15 8.4 2.6La Trobe 2.84 2.74 9.2 6.9
Durum Jandaroi 3.24 2.96 9.5 0.6Bread wheat
Mitch 4.02 3.69 8.7 1.4Suntop 3.63 3.41 9.2 2.0Viking 3.62 3.35 9.0 2.5LRPB Flanker 3.68 3.34 8.8 2.7Beckom 3.61 3.30 9.1 2.6QT15046R 3.89 3.23 9.0 2.0LRPB Gauntlet 3.43 3.21 9.4 1.7Sunguard 3.36 3.19 9.6 1.3EGA Gregory 3.67 3.17 9.1 2.7Sunmate 3.56 3.05 8.9 1.4LRPB Spitfire 3.37 3.01 9.7 1.3LRPB Lancer 3.43 2.99 10.5 1.8V07176-69 3.68 2.96 9.0 3.4
Site mean 3.55 3.17 9.2 2.3CV (%) 4.3 2.7 35.4LSD 0.238 0.29 0.94P value 0.013 <0.001 <0.001
• The National Variety Trial (NVT) trial conducted at this site was all treated with the seed treatment Hombre® which contains a fungicide and the insecticide imidacloprid. Imidacloprid has been shown to provide early season control of aphids which transmit BYDV. No BYDV symptoms were evident in the NVT trial while interveinal yellowing/reddening of leaves characteristic of BYDV infection was obvious throughout this trial which was all treated with the fungicide seed treatment Dividend M® which does not contain imidacloprid.
• All entries with the exception of the barley variety La Trobe and bread wheat varieties Suntop, LRPB Gauntlet and Sunguard; suffered significant yield loss under higher levels of CR infection (added CR) which ranged from 7.4% in the bread wheat variety Viking (0.27 t/ha) up to 19.7% in the bread wheat entry VO7176-69 (0.73 t/ha). Yield

CR
OP
PR
OTE
CTI
ON
INDEPENDENT RESEARCH FOR INDUSTRY | 165
loss was potentially underestimated at this site as a medium level of background CR inoculum already existed across the site. Hence, there was a level of infection in the no added CR plots.
• Only the barley variety La Trobe was lower yielding than EGA Gregory (by 0.44 t/ha) under high levels of CR infection (added CR).
• Only the bread wheat variety Suntop (by 0.24 t/ha) and Mitch (by 0.52 t/ha) were significantly higher yielding than EGA Gregory in the added CR treatment (Table 1).
• All remaining entries produced yield equivalent to EGA Gregory in the added CR treatment (Table 1).
Grain quality • The addition of CR inoculum did not significantly impact on grain quality in any of
the entries (data not presented). Hence, the average of added CR and no added CR treatments for each entry are presented (Table 1).
• Protein levels were very low across entries at this site in 2015 which ranged between 8.4% (Commander) up to 10.5% (LRPB Lancer; Table 1).
• Rainfall late in the season during grain filling (142 mm in November) resulted in quite low screening levels across entries which ranged from 0.6% in the durum variety Jandaroi to 6.9% in the barley variety Commander (Table 1).
Trial 2. Fungicide seed treatment evaluation• There was no difference in plant establishment between any of the treatments
(fungicide seed treatment or crown rot inoculum) at this site in 2015.• Yield loss in the added CR treatment averaged 14% (0.52 t/ha) across seed treatments
compared to the no added CR treatment.• There was no significant (P=0.674) effect of any of the seed treatments on the yield of
EGA Gregory in either the no added CR or added CR treatments (data not shown).
ConclusionsCereal crop and variety choice provided an 8–16% yield benefit over growing the susceptible bread wheat variety EGA Gregory under high levels of CR infection at Merriwa in 2015. The level of yield loss from CR infection was modest at this site relative to other trials conducted across the northern grains region in 2015. Reasonable rainfall throughout the growing season, with the exception of September, at this site limited the expression of the disease and hence level of associated yield loss. Late rain (142 mm) during grain filling in November in particular limited disease expression impacts on yield and screenings which were quite low across entries. Crop and variety choice can maximise profit in the current season but will not reduce inoculum levels for subsequent crops, because all winter cereal varieties are susceptible to CR infection. Winter cereal crop and variety choice is therefore not the sole solution to crown rot but rather just one element of an integrated management strategy to limit losses from this disease.
Rancona® Dimension did not provide a significant yield benefit over the use of no seed treatment or the two other commonly used seed treatments examined under high CR pressure at Merriwa in 2015. Although Rancona® Dimension is registered for the suppression of CR, with activity against early infection and potential establishment losses (not evident at this site), growers should not expect this to translate into a significant and consistent reduction in yield loss from CR infection when the product is used as a standalone management strategy.
Integrated management remains the best strategy to reduce losses to CR.
AcknowledgementsThis research was co-funded by NSW DPI and GRDC under project DAN00175: National crown rot epidemiology and management. Thanks to Ray Inder for hosting this trial on their property in 2015. Thanks to Peter Matthews and Ryan Potts (NSW DPI) for technical assistance sowing, maintaining and harvesting the trial. Thanks to Chrystal Fensbo (NSW DPI) for grain quality assessments and to Jason Lowien (GrainCorp) for use of an NIR machine to determine grain protein levels.

CR
OP
PR
OTE
CTI
ON
166 | NORTHERN GRAINS RESEARCH RESULTS 2016
Regional crown rot management – Wongarbon 2015Steven Simpfendorfer and Robyn ShaplandNSW DPI, Tamworth
IntroductionCrown rot (CR), caused predominantly by the fungus Fusarium pseudograminearum (Fp), remains a major constraint in producing winter cereals in the NSW northern grains region. Cereal varieties differ in their resistance to CR which can have a significant impact on their relative yield in the presence of this disease.
Rancona® Dimension (ipconazole + metalaxyl) was recently registered in Australia as a fungicide seed treatment with good activity against cereal bunts and smuts, pythium and for the suppression of rhizoctonia. Rancona® Dimension is also the first seed treatment to be registered (at 320 mL/100 kg seed) for the suppression of CR. Suppression, by definition, indicates that the seed treatment reduces the pathogen’s growth for a set period of time early in the season.
Two trials were conducted at this site: 1. A variety trial, which was one of 12 conducted by NSW DPI in 2015 across central/
northern NSW extending into southern Qld to examine the effect of CR on the yield of two barley, one durum and 13 bread wheat varieties.
2. A second trial aimed to evaluate the efficacy of Rancona® Dimension as a standalone option to control CR was also conducted across the same 12 sites in the northern region. This will hopefully ensure that growers have a realistic expectation of what this seed treatment can achieve if used in isolation from other integrated disease management strategies.
Site detailsLocation: “Hillview”, WongarbonCo-operators: Kelly familySowing date: 27 May 2015Fertiliser: 95 kg/ha Granulock® 12Z and 70 kg/ha of urea at sowing;
100 kg/ha of urea on 9 July 2015Starting N: 44.5 mg/kg (0–60 cm)PreDicta B®: 5.6 Pt/g (medium), nil Pn and 2.3 log Fusarium DNA/g (high) at
sowing (0–30 cm)In-crop rainfall: ~289 mmHarvest date: 2 December 2015
TreatmentsTrial 1. Variety evaluation• Two barley varieties: (CommanderA and La TrobeA)• One durum variety: (JandaroiA)• Eleven commercial bread wheat varieties: (EGA GregoryA, LRPB FlankerA, SunmateA,
LRPB GauntletA, LRPB LancerA, LRPB VikingA, LRPB SpitfireA, BeckomA, MitchA, SuntopA and SunguardA; listed in order of increasing resistance to CR) and two numbered lines (VO7176-69 and QT15046R).
• Added or no added CR at sowing using sterilised durum grain colonised by at least five different isolates of Fp.
Trial 2. Fungicide seed treatment evaluation• EGA GregoryA with added or no added CR at sowing using infected durum grain.• Seed treatments evaluated:
1. Nil seed treatment
Key findingsYield loss from crown rot ranged from 5.3% (not significant) in the bread wheat variety SuntopA up to 31.0% in the durum variety JandaroiA.
Bread wheat variety choice had a large effect on yield where there were high levels of crown rot infection with BeckomA, LRPB LancerA and SuntopA being between 0.30 t/ha and 0.41 t/ha higher yielding than EGA GregoryA.
The barley varieties CommanderA and La TrobeA were 0.93 t/ha and 1.65 t/ha higher yielding than EGA GregoryA under high levels of crown rot infection, respectively.
Rancona® Dimension did not provide a yield benefit in the presence of high levels of crown rot infection at this site in 2015.

CR
OP
PR
OTE
CTI
ON
INDEPENDENT RESEARCH FOR INDUSTRY | 167
2. Rancona® Dimension (ipconazole 25 g/L + metalaxyl 20 g/L) at 320 mL/100 kg seed3. Dividend M® (difeniconazole 92 g/L + metalaxyl-M 23 g/L) at 260 mL/100 kg seed4. Jockey Stayer® (fluquinconazole 167 g/L) at 450 mL/100 kg seed.
Dividend M® and Jockey Stayer® are NOT registered for the suppression of CR, but were included to represent a commonly used wheat seed treatment for bunt and smut control, or early control of stripe rust (leaf disease), respectively. Including four treatments across each site ensured statistical rigour for yield outcomes.
ResultsTrial 1. Variety evaluationYield• In the no added CR treatment yield ranged from 2.81 t/ha in the bread wheat variety
LRPB Flanker up to 4.64 t/ha in the barley variety La Trobe (Table 1).• All entries with the exception of the bread wheat varieties LRPB Gauntlet and Suntop,
suffered significant yield loss under higher levels of CR infection (added CR) which ranged from 7.3% in the barley variety Commander (0.28 t/ha) up to 31.0% in the durum variety Jandaroi (1.08 t/ha). Yield loss was potentially underestimated at this site as a high level of background CR inoculum already existed across the site. Hence, there was a level of infection in the no added CR plots.
• Only the bread wheat variety Viking (0.34 t/ha) was lower yielding than EGA Gregory under high levels of CR infection (added CR).
• The bread wheat varieties Beckom (0.30 t/ha), LRPB Lancer (0.30 t/ha) and Suntop (0.41 t/ha) along with the barley varieties Commander (0.93 t/ha) and La Trobe (1.65 t/ha) were all higher yielding than EGA Gregory in the added CR treatment (Table 1).
• All remaining entries produced yield equivalent to EGA Gregory in the added CR treatment (Table 1).
Table 1. Yield and grain quality of varieties with no added and added crown rot – Wongarbon 2015
Crop Variety Yield (t/ha) Protein (%)
Screenings(%)
No added CR Added CR No added CR Added CR
Barley La Trobe 4.64 4.20 14.5 14.5 11.9Commander 3.76 3.48 16.3 27.5 31.9
Durum Jandaroi 3.47 2.40 17.9 5.3 21.1Bread wheat
Suntop 3.12 2.96 16.1 25.5 30.0LRPB Lancer 3.21 2.85 16.2 10.6 16.8Beckom 3.17 2.85 15.6 37.2 49.6LRPB Gauntlet 2.97 2.74 16.6 11.4 22.7Sunguard 2.98 2.68 15.9 20.3 24.6Mitch 2.95 2.64 16.1 22.6 24.0Sunmate 3.24 2.64 15.8 18.3 30.4V07176-69 3.33 2.61 15.0 12.0 21.8LRPB Spitfire 3.04 2.58 17.5 22.1 32.4QT15046R 3.68 2.56 15.3 9.3 26.2EGA Gregory 3.04 2.55 15.4 11.1 20.0LRPB Flanker 2.81 2.45 16.2 20.0 26.9Viking 2.82 2.21 16.2 16.4 29.8
Site mean 3.27 2.78 16.0 17.8 26.3CV (%) 5.2 3.4 19.5LSD 0.257 0.629 7.01P value <0.001 <0.001 0.01
Grain quality • The addition of CR inoculum did not significantly impact on grain protein levels in
any of the entries (data not presented). Hence, the average of added CR and no added CR treatments for each entry are presented (Table 1).

CR
OP
PR
OTE
CTI
ON
168 | NORTHERN GRAINS RESEARCH RESULTS 2016
• Protein levels were very high across entries at this site in 2015 which ranged between 14.5% (La Trobe) up to 17.9% (Jandaroi; Table 1).
• In the no added CR treatment (high background inoculum level), screening levels ranged from 5.3% in the durum variety Jandaroi up to 37.2% in the bread wheat variety Suntop (Table 1).
• Screening levels were increased in the added CR treatment with all entries with the exception of the barley varieties La Trobe and Commander and bread wheat varieties Suntop, LRPB Lancer, Sunguard, Mitch and LRPB Flanker.
• In the added CR treatment, screening levels ranged from 11.9% in the barley variety La Trobe up to 49.6% in the bread wheat variety Beckom (Table 1).
Trial 2. Fungicide seed treatment evaluation• There was no significant difference in plant establishment between seed treatments or
CR inoculum treatments at this site in 2015.• There was no significant (P=0.028) difference in the yield of EGA Gregory with any of
the seed treatments in the no added CR treatment (Figure 1).• Yield loss in the added CR treatment was 9% with Jockey Stayer® and no seed
treatment, 21% with Dividend M® and 26% with Rancona® Dimension compared to the corresponding no added CR treatment (Figure 1).
• Rancona® Dimension slightly reduced yield by 0.42 to 0.46 t/ha compared to the use of no seed treatment and Jockey Stayer® in the added CR treatment, but was not significantly different from the use of Dividend M® (Figure 1).
abca a ab
cdde e
bc
0.0
0.5
1.0
1.5
2.0
2.5
3.0
3.5
4.0
Nil Dividend M® Rancona® Dimension Jockey Stayer®
Yiel
d (t
/ha)
No added CR Added CR
Figure 1. Impact of fungicide seed treatments on the yield of EGA GregoryA in the absence and presence of added crown rot inoculum – Wongarbon 2015 Bars with the same letter are not significantly different (P=0.028)
ConclusionsCereal crop and variety choice provided a 12–65% yield benefit over growing the susceptible bread wheat variety EGA Gregory under high levels of CR infection at Wongarbon in 2015. Crop and variety choice can maximise profit in the current season but will not reduce inoculum levels for subsequent crops, because all winter cereal varieties are susceptible to CR infection. Winter cereal crop and variety choice is therefore not the sole solution to CR but rather just one element of an integrated management strategy to limit losses from this disease.
Rancona® Dimension did not provide a significant yield benefit over the use of no seed treatment or the two other commonly used seed treatments examined under high CR pressure at Wongarbon in 2015. Although Rancona® Dimension is registered for the suppression of CR, with activity against early infection and potential establishment losses (not evident at this site), growers should not expect this to translate into a significant and consistent reduction in yield loss from CR infection when the product is used as a standalone management strategy.
Integrated management remains the best strategy to reduce losses to CR.

CR
OP
PR
OTE
CTI
ON
INDEPENDENT RESEARCH FOR INDUSTRY | 169
AcknowledgementsThis research was co-funded by NSW DPI and GRDC under project DAN00175: National crown rot epidemiology and management. Thanks to the Kelly family for hosting this trial on their property in 2015. Thanks to Peter Matthews and Ryan Potts (NSW DPI) for technical assistance sowing, maintaining and harvesting the trial. Thanks to Chrystal Fensbo (NSW DPI) for grain quality assessments and to Jason Lowien (GrainCorp) for use of an NIR machine to determine grain protein levels.
CR
OP
PR
OTE
CTI
ON
170 | NORTHERN GRAINS RESEARCH RESULTS 2016
Regional crown rot management – Gilgandra 2015Steven Simpfendorfer and Robyn ShaplandNSW DPI, Tamworth
IntroductionCrown rot (CR), caused predominantly by the fungus Fusarium pseudograminearum (Fp), remains a major constraint in producing winter cereals in the NSW northern grains region. Cereal varieties differ in their resistance to CR which can have a significant impact on their relative yield in the presence of this disease.
Rancona® Dimension (ipconazole + metalaxyl) was recently registered in Australia as a fungicide seed treatment with good activity against cereal bunts and smuts, pythium and for the suppression of rhizoctonia. Rancona® Dimension is also the first seed treatment to be registered (at 320 mL/100 kg seed) for the suppression of CR. Suppression, by definition, indicates that the seed treatment reduces the pathogen’s growth for a set period of time early in the season.
Two trials were conducted at this site: 1. A variety trial, which was one of 12 conducted by NSW DPI in 2015 across central/
northern NSW extending into southern Qld to examine the effect of CR on the yield of two barley, one durum and 13 bread wheat varieties.
2. A second trial aimed to evaluate the efficacy of Rancona® Dimension as a standalone option to control CR was also conducted across the same 12 sites in the northern region. This will hopefully ensure that growers have a realistic expectation of what this seed treatment can achieve if used in isolation from other integrated disease management strategies.
Site detailsLocation: “Inglewood”, WongarbonCo-operators: Kevin KilbySowing date: 12 May 2015Fertiliser: 95 kg/ha Granulock® 12Z and 70 kg/ha of urea at sowing;
100 kg/ha of urea on 9 July 2015Starting N: 20.0 mg/kg (0–60 cm)PreDicta B®: nil root lesion nematodes and 0.9 log Fusarium DNA/g (low) at
sowing (0–30 cm)In-crop rainfall: ~272 mmHarvest date: 16 November 2015
TreatmentsTrial 1. Variety evaluation• Two barley varieties: (CommanderA and La TrobeA)• One durum variety: (JandaroiA)• Eleven commercial bread wheat varieties: (EGA GregoryA, LRPB FlankerA, SunmateA,
LRPB GauntletA, LRPB LancerA, LRPB VikingA, LRPB SpitfireA, BeckomA, MitchA, SuntopA and SunguardA; listed in order of increasing resistance to CR) and two numbered lines (VO7176-69 and QT15046R).
• Added or no added CR at sowing using sterilised durum grain colonised by at least five different isolates of Fp.
Trial 2. Fungicide seed treatment evaluation• EGA GregoryA with added or no added CR at sowing using infected durum grain.• Seed treatments evaluated:
1. Nil seed treatment
Key findingsYield loss from crown rot ranged from 2.5% (not significant) in the bread wheat variety LRPB GauntletA up to 21.9% in the bread wheat entry VO7176-69.
Bread wheat variety choice impacted on yield in the presence of high levels of crown rot infection with ten entries being between 0.34 t/ha and 0.76 t/ha higher yielding than EGA GregoryA.
The barley varieties CommanderA and La TrobeA were 0.75 t/ha and 0.99 t/ha higher yielding than EGA GregoryA under high levels of crown rot infection, respectively.
Rancona® Dimension did not provide a yield benefit in the presence of high levels of crown ot infection at this site in 2015.

CR
OP
PR
OTE
CTI
ON
INDEPENDENT RESEARCH FOR INDUSTRY | 171
2. Rancona® Dimension (ipconazole 25 g/L + metalaxyl 20 g/L) at 320 mL/100 kg seed3. Dividend M® (difeniconazole 92 g/L + metalaxyl-M 23 g/L) at 260 mL/100 kg seed4. Jockey Stayer® (fluquinconazole 167 g/L) at 450 mL/100 kg seed.
Dividend M® and Jockey Stayer® are NOT registered for the suppression of CR, but were included to represent a commonly used wheat seed treatment for bunt and smut control, or early control of stripe rust (leaf disease), respectively. Including four treatments across each site ensured statistical rigour for yield outcomes.
ResultsTrial 1. Variety evaluationYield• In the no added CR treatment yield ranged from 3.55 t/ha in the durum variety
Jandaroi up to 4.66 t/ha in the barley variety La Trobe (Table 1).• All entries with the exception of the bread wheat varieties LRPB Gauntlet, Sunguard,
Mitch and LRPB Spitfire suffered significant yield loss under higher levels of CR infection (added CR) which ranged from 6.8% in the bread wheat variety Beckom (0.29 t/ha) up to 21.9% in the bread wheat entry VO7176-69 (0.79 t/ha).
• Only the bread wheat entry VO7176-69 (0.43 t/ha) was lower yielding than EGA Gregory under high levels of CR infection (added CR).
• The new bread wheat variety LRPB Flanker and the durum variety Jandaroi both produced yield equivalent to EGA Gregory in the added CR treatment (Table 1).
• The bread wheat entries LRPB Spitfire (0.34 t/ha), Mitch (0.34 t/ha), Viking (0.34 t/ha), Sunmate (0.34 t/ha), QT15046R (0.36 t/ha), LRPB Lancer (0.39 t/ha), Suntop (0.40 t/ha), Sunguard (0.42 t/ha), LRPB Gauntlet (0.59 t/ha) and Beckom (0.76 t/ha) were all higher yielding than EGA Gregory under high levels of CR infection (added CR).
• The barley varieties Commander (0.75 t/ha) and La Trobe (0.99 t/ha) were both higher yielding than EGA Gregory under high levels of CR infection (added CR, Table 1).
Table 1. Yield and grain quality of varieties with no added and added crown rot – Gilgandra 2015
Crop Variety Yield (t/ha) Protein (%)
Screenings (%)
No added CR Added CR No added CR Added CR
Barley La Trobe 4.66 4.23 10.4 1.4 2.1Commander 4.44 3.99 11.1 3.0 2.6
Durum Jandaroi 3.55 3.14 12.5 0.9 3.4Bread wheat
Beckom 4.29 4.00 10.7 1.1 1.5LRPB Gauntlet 3.93 3.83 11.2 0.8 1.2Sunguard 3.79 3.66 11.4 1.0 1.8Suntop 4.04 3.64 11.3 2.8 4.9LRPB Lancer 4.01 3.63 11.8 1.1 1.6QT15046R 4.21 3.60 10.5 1.1 2.9Sunmate 4.08 3.58 10.8 1.4 1.8Viking 4.00 3.58 11.0 1.4 3.7Mitch 3.68 3.58 11.0 2.8 3.1LRPB Spitfire 3.72 3.58 11.7 1.0 2.0LRPB Flanker 4.06 3.30 10.3 1.1 4.4EGA Gregory 3.95 3.24 10.9 1.8 4.7V07176-69 3.60 2.82 11.0 5.4 7.3
Site mean 4.00 3.59 11.1 1.7 3.1CV (%) 4.6 3.6 33.2LSD 0.286 0.46 0.92P value 0.006 <0.001 0.002

CR
OP
PR
OTE
CTI
ON
172 | NORTHERN GRAINS RESEARCH RESULTS 2016
Grain quality• The addition of CR inoculum did not significantly impact on grain protein levels in
any of the entries (data not presented). Hence, the average of added CR and no added CR treatments for each entry are presented (Table 1).
• Protein levels were relatively low at this site which ranged between 10.3% (LRPB Flanker) up to 12.5% (Jandaroi; Table 1).
• Screening levels were quite low across entries at this site in 2015, averaging 1.7% in the no added CR and 3.1% in the added CR treatments.
• In the no added CR treatment, screening levels ranged from 0.8% in the bread wheat variety LRPB Gauntlet up to 5.4% in the bread wheat entry VO7176-69 (Table 1).
• Screening levels were increased in the added CR treatment by between 1.0 to 3.3% in LRPB Spitfire, QT15046R, VO7176-69, Suntop, Mitch, Commander, EGA Gregory and LRPB Flanker.
• In the added CR treatment, screening levels ranged from 1.2% in the bread wheat variety LRPB Gauntlet up to 7.3% in the bread wheat entry VO7176-69 (Table 1).
Trial 2. Fungicide seed treatment evaluation• The addition of Fp inoculum at sowing reduced establishment in the added CR
treatment compared to the no added CR treatment with all seed treatments except Dividend M®.
• With Nil seed treatment establishment was reduced from 130 plants/m2 down to 89 plants/m2, with Jockey Stayer® the reduction was from 126 plants/m2 down to 101 plants/m2 and with Rancona® Dimension the reduction was from 130 plants/m2 down to 117 plants/m2.
• In the added CR treatment, Rancona® Dimension (117 plants/m2) and Dividend M® (135 plants/m2) had better establishment than the use of no seed treatment (89 plants/m2).
• Yield loss in the added CR treatment averaged 23% (0.86 t/ha) across seed treatments compared to the no added CR treatment.
• There was no significant (P=0.281) effect of any of the seed treatments on the yield of EGA Gregory in either the no added CR or added CR treatments (data not shown).
ConclusionsCereal crop and variety choice provided a 10–31% yield benefit over growing the susceptible bread wheat variety EGA Gregory under high levels of CR infection at Gilgandra in 2015. Crop and variety choice can maximise profit in the current season but will not reduce inoculum levels for subsequent crops, because all winter cereal varieties are susceptible to CR infection. Winter cereal crop and variety choice is therefore not the sole solution to CR but rather just one element of an integrated management strategy to limit losses from this disease.
Rancona® Dimension did not provide a significant yield benefit over the use of no seed treatment or the two other commonly used seed treatments examined under high CR pressure at Gilgandra in 2015. Although Rancona® Dimension is registered for the suppression of CR, with activity against early infection and potential establishment losses, growers should not expect this to translate into a significant and consistent reduction in yield loss from CR infection when the product is used as a standalone management strategy.
Integrated management remains the best strategy to reduce losses to CR.
AcknowledgementsThis research was co-funded by NSW DPI and GRDC under project DAN00175: National crown rot epidemiology and management. Thanks to the Kevin Kilby and family for hosting this trial on their property in 2015. Thanks to Peter Matthews and Ryan Potts (NSW DPI) for technical assistance sowing, maintaining and harvesting the trial. Thanks to Chrystal Fensbo (NSW DPI) for grain quality assessments and to Jason Lowien (GrainCorp) for use of an NIR machine to determine grain protein levels.

CR
OP
PR
OTE
CTI
ON
INDEPENDENT RESEARCH FOR INDUSTRY | 173
Regional crown rot management – North Star 2015Steven Simpfendorfer and Robyn ShaplandNSW DPI, Tamworth
IntroductionCrown rot (CR), caused predominantly by the fungus Fusarium pseudograminearum (Fp), remains a major constraint in producing winter cereals in the NSW northern grains region. Cereal varieties differ in their resistance to CR which can have a significant impact on their relative yield in the presence of this disease.
Rancona® Dimension (ipconazole + metalaxyl) was recently registered in Australia as a fungicide seed treatment with good activity against cereal bunts and smuts, pythium and for the suppression of rhizoctonia. Rancona® Dimension is also the first seed treatment to be registered (at 320 mL/100 kg seed) for the suppression of CR. Suppression, by definition, indicates that the seed treatment reduces the pathogen’s growth for a set period of time early in the season.
Two trials were conducted at this site: 1. A variety trial, which was one of 12 conducted by NSW DPI in 2015 across central/
northern NSW extending into southern Qld to examine the effect of CR on the yield of two barley, one durum and 13 bread wheat varieties.
2. A second trial aimed to evaluate the efficacy of Rancona® Dimension as a standalone option to control CR was also conducted across the same 12 sites in the northern region. This will hopefully ensure that growers have a realistic expectation of what this seed treatment can achieve if used in isolation from other integrated disease management strategies.
Site detailsLocation: “Glenhoma”, North StarCo-operators: Malcolm DoolinSowing date: 27 May 2015Fertiliser: 90 kg/ha Granulock® 12Z and 80 kg/ha of urea at sowingStarting N: 21.2 mg/kg (0–60 cm)PreDicta B®: 1.0 Pt/g (low), nil Pn and nil crown rot at sowing (0–30 cm)In-crop rainfall: ~156 mmHarvest date: 11 November 2015
TreatmentsTrial 1. Variety evaluation• Two barley varieties: (CommanderA and La TrobeA)• One durum variety: (JandaroiA)• Eleven commercial bread wheat varieties: (EGA GregoryA, LRPB FlankerA, SunmateA,
LRPB GauntletA, LRPB LancerA, LRPB VikingA, LRPB SpitfireA, BeckomA, MitchA, SuntopA and SunguardA; listed in order of increasing resistance to CR) and two numbered lines (VO7176-69 and QT15046R).
• Added or no added CR at sowing using sterilised durum grain colonised by at least five different isolates of Fp.
Trial 2. Fungicide seed treatment evaluation• EGA GregoryA with added or no added CR at sowing using infected durum grain.• Seed treatments evaluated:
1. Nil seed treatment2. Rancona® Dimension (ipconazole 25 g/L + metalaxyl 20 g/L) at 320 mL/100 kg seed3. Dividend M® (difeniconazole 92 g/L + metalaxyl-M 23 g/L) at 260 mL/100 kg seed
Key findingsYield loss from crown rot ranged from 1.4% (not significant) in the bread wheat variety SuntopA up to 35.0% in the bread variety EGA GregoryA.
Bread wheat variety choice impacted on yield in the presence of high levels of crown rot infection with all 12 entries being between 0.33 t/ha to 1.53 t/ha higher yielding than EGA GregoryA.
The yield of the two barley varieties was impacted by late rain at this site in 2015 which resulted in considerable lodging, especially in La TrobeA. The barley data from this site should be considered with caution.
Rancona® Dimension provided a small (0.22 t/ha) yield benefit compared to no seed treatment in the presence of high levels of crown rot infection (added CR) at this site in 2015 but was far from providing complete control of the disease with 29% yield loss still occurring.

CR
OP
PR
OTE
CTI
ON
174 | NORTHERN GRAINS RESEARCH RESULTS 2016
4. Jockey Stayer® (fluquinconazole 167 g/L) at 450 mL/100 kg seed.Dividend M® and Jockey Stayer® are NOT registered for the suppression of CR, but were included to represent a commonly used wheat seed treatment for bunt and smut control, or early control of stripe rust (leaf disease), respectively. Including four treatments across each site ensured statistical rigour for yield outcomes.
ResultsTrial 1. Variety evaluationYield• In the no added CR treatment yield ranged from 1.92 t/ha in the barley variety
La Trobe up to 3.68 t/ha in the durum variety Jandaroi (Table 1). • Late rainfall near harvest resulted in significant lodging in some entries at this site and
was most severe in the two barley varieties. This appears to have negatively impacted on yield of the barley varieties, particularly La Trobe, which were difficult to harvest as they were nearly flat on the ground. Barley yield at this site should therefore be considered with caution.
• All entries with the exception of the bread wheat varieties Suntop, LRPB Lancer and Mitch suffered significant yield loss under high levels of CR infection (added CR) which ranged from 9.1% in the bread wheat variety Beckom (0.28 t/ha) up to 35.0% in the bread wheat variety EGA Gregory (0.94 t/ha).
Table 1. Yield and grain quality of varieties with no added and added crown rot – North Star 2015
Crop Variety Yield (t/ha) Protein (%) Screenings (%)
No added CR Added CR No added CR Added CR No added CR Added CR
Barley Commander 2.66 2.41 14.3 14.5 9.0 13.4La Trobe 1.92 1.63 14.2 14.0 16.1 17.6
Durum Jandaroi 3.68 2.65 14.7 14.7 3.8 16.1Bread
wheat
Suntop 3.32 3.27 12.8 12.7 9.8 11.3LRPB Spitfire 3.43 2.95 14.4 14.3 5.8 6.7LRPB Lancer 3.10 2.91 14.5 13.8 7.8 9.8Sunmate 3.55 2.91 12.5 12.2 6.7 10.6Beckom 3.04 2.77 12.8 12.6 15.5 21.0Mitch 2.82 2.74 12.9 12.2 11.6 10.8LRPB Gauntlet 3.13 2.62 13.4 13.1 2.8 6.0Viking 3.17 2.62 13.7 13.2 12.8 18.7Sunguard 3.01 2.42 14.2 13.7 8.0 9.1LRPB Flanker 2.99 2.20 13.6 12.8 8.7 16.2V07176-69 2.90 2.19 13.0 12.3 7.8 13.1QT15046R 2.70 2.07 13.2 12.4 11.3 17.4EGA Gregory 2.69 1.74 13.7 12.6 9.6 18.8
Site mean 3.01 2.51 13.6 13.2 9.2 13.5CV (%) 4.8 2.1 15.8LSD 0.218 0.46 2.93P value <0.001 0.01 <0.001
• No entry was lower yielding than EGA Gregory under high levels of CR infection (added CR) with only the barley variety La Trobe producing a similar yield to EGA Gregory due to severe lodging which restricted its yield.
• The bread wheat entries QT15046R (0.33 t/ha), VO7176-69 (0.45 t/ha), LRPB Flanker (0.46 t/ha), Sunguard (0.68 t/ha), Viking (0.88 t/ha), LRPB Gauntlet (0.88 t/ha), Mitch (1.00 t/ha), Beckom (1.03 t/ha), Sunmate (1.17 t/ha), LRPB Lancer (1.17 t/ha), LRPB Spitfire (1.21 t/ha) and Suntop (1.53 t/ha) were all higher yielding than EGA Gregory under high levels of CR infection (added CR).
• The durum variety Jandaroi was 0.91 t/ha higher yielding than EGA Gregory under high levels of CR infection (added CR, Table 1).

CR
OP
PR
OTE
CTI
ON
INDEPENDENT RESEARCH FOR INDUSTRY | 175
• The barley variety Commander was 0.67 t/ha higher yielding than EGA Gregory under high levels of CR infection (added CR, Table 1).
Grain quality• Protein levels were relatively high at this site in 2015 which in the no added CR
treatment ranged between 12.5% (Sunmate) up to 14.7% (Jandaroi; Table 1).• Crown rot infection (added CR) significantly reduced grain protein levels by between
0.5 to 1.1% in the bread wheat entries Viking, LRPB Lancer, Sunguard, Mitch, VO7176-69, LRPB Flanker, QT15046R and EGA Gregory (Table 1).
• In the no added CR treatment, screening levels ranged from 2.8% in the bread wheat variety LRPB Gauntlet up to 16.1% in the barley variety La Trobe (Table 1).
• Screening levels were increased in the added CR treatment with all entries with the exception of the barley variety La Trobe and bread wheat varieties Suntop, LRPB Spitfire, LRPB Lancer, Mitch and Sunguard.
• In the added CR treatment, screening levels ranged from 6.0% in the bread wheat variety LRPB Gauntlet up to 21.0% in the bread wheat variety Beckom (Table 1).
Trial 2. Fungicide seed treatment evaluation• The addition of Fp inoculum at sowing reduced establishment in the added CR
treatment (92 plants/m2) compared to the no added CR treatment (102 plants/m2), averaged across seed treatments.
• None of the fungicide seed treatments significantly impacted on establishment in the presence or absence of CR infection.
• Rancona® Dimension increased the yield of EGA Gregory by 0.24 t/ha compared to no seed treatment and 0.34 t/ha compared to Dividend M® in the no added CR treatment but was not significantly different from Jockey Stayer® (Figure 1).
• Yield loss in the added CR treatment was 28% with Dividend M®, 29% with Rancona® Dimension, 31% with no seed treatment and 39% with Jockey Stayer® compared to the corresponding no added CR treatment (Figure 1).
• Rancona® Dimension provided a small (0.22 t/ha) yield benefit compared to no seed treatment in the presence of high levels of CR infection (added CR) and was also higher yielding (0.21 to 0.38 t/ha) than the other fungicide seed treatments examined. This benefit was far from complete control of CR with 29% yield loss still occurring (Figure 1).
bc c
a ab
ef e d
f
0.0
0.5
1.0
1.5
2.0
2.5
3.0
3.5
Nil Dividend M® Rancona® Dimension Jockey Stayer®
Yiel
d (t
/ha)
No added CR Added CR
Figure 1. Impact of fungicide seed treatments on the yield of EGA GregoryA in the absence and presence of added crown rot inoculum – North Star 2015 Bars with the same letter are not significantly different (P=0.03)
ConclusionsCereal crop and variety choice provided a 19–88% yield benefit over growing the susceptible bread wheat variety EGA Gregory under high levels of CR infection at North Star in 2015. The interaction of environment with the expression of CR and lodging was interesting at this site in 2015. Limited rainfall in September and October (9.0 mm total) exacerbated the expression of CR with significant yield loss occurring. However, a rainfall

CR
OP
PR
OTE
CTI
ON
176 | NORTHERN GRAINS RESEARCH RESULTS 2016
event of around 30 mm at harvest maturity caused lodging which was more severe in the two barley varieties, especially La Trobe. The two barley varieties were generally higher yielding than the bread wheat entries in similar trials conducted across a further 11 sites in 2015, with La Trobe being particularly high yielding.
Crop and variety choice can maximise profit in the current season but will not reduce inoculum levels for subsequent crops, because all winter cereal varieties are susceptible to CR infection. Winter cereal crop and variety choice is therefore not the sole solution to CR but rather just one element of an integrated management strategy to limit losses from this disease.
Rancona® Dimension provided a small but significant yield benefit (0.22 t/ha) over the use of no seed treatment under high CR pressure at North Star in 2015 but did not provide complete control with 29% yield loss still occurring. Although Rancona® Dimension is registered for the suppression of CR, with activity against early infection and potential establishment losses, growers should not expect this to translate into a significant and consistent reduction in yield loss from CR infection when the product is used as a standalone management strategy.
Integrated management remains the best strategy to reduce losses to CR.
AcknowledgementsThis research was co-funded by NSW DPI and GRDC under project DAN00175: National crown rot epidemiology and management. Thanks to the Malcolm Doolin and family for hosting this trial on their property in 2015. Thanks to Peter Matthews and Gerard Lonergan (NSW DPI) for technical assistance sowing, maintaining and harvesting the trial. Thanks to Chrystal Fensbo (NSW DPI) for grain quality assessments and to Jason Lowien (GrainCorp) for use of an NIR machine to determine grain protein levels.

NU
TRIT
ION
& S
OIL
S
INDEPENDENT RESEARCH FOR INDUSTRY | 177
Nitrogen response of eight wheat varieties – Gilgandra 2015Greg BrookeNSW DPI, Trangie
Key findingsThis site was very responsive to nitrogen (N) application. Yield and protein increased in all varieties, even up to the highest applied rate of 160 kg N/ha.
Yield averaged across varieties increased from 2.80 t/ha with no application of N up to 3.58 t/ha with the application of 160 kg N/ha.
Grain protein levels across varieties rose from 9.8% (nil applied N) to 12.4% with 160 kg N/ha.
Screening levels were not affected by N application rates up to 80 kg N/ha but rose slightly from 2.7% to 3.8% with 160 kg N/ha.
KioraA was the only variety which produced screening levels above 5% which were exacerbated by higher N application rates of 80 and 160 kg N/ha.
IntroductionNitrogen (N) is the nutrient most required by wheat. It is essential for growth and development, yield and grain protein levels. In recent seasons in Central West NSW there has been a significant trend towards very low grain protein with more than 30% of grain receivals meeting ASW or lower specifications. Protein levels of <10.5% in a prime hard variety usually indicate that insufficient N levels have not only limited grain protein concentrations, but also yield. Soil testing for N levels before sowing remains an important budgeting tool. It is the most useful indicator of whether additional applied N, to support crop growth and to maximise yield and grain protein potential, is needed within a given season. Consideration must also be given to starting soil water and target yield. This trial aimed to determine the effect of N application rates on the yield and grain quality of eight popular bread wheat varieties at Gilgandra in central NSW in 2015.
Site detailsLocation: GilgandraCo-operator: Kevin KilbySoil type: Red loam2014 crop: Canola2013 crop: WheatSowing date: 12 May 2015Starting moisture: Very wet at sowing to below 120 cm (216 mm rain recorded
January–May)In-crop rainfall: 196 mm June–OctoberFertiliser: 90 kg/ha Granulock Z Extra at sowingFungicide: 2.5 L/t flutriafol (500 g/L) fungicide on fertiliser;
prothioconazole (210 g/L) + tebuconazole (210 g/L) at 300 mL/ha on 21 August and 15 September
Starting N: 104 kg N/ha (0–60 cm)Harvest date: 16 November 2015
TreatmentsVariety DartA, EGA GregoryA, KioraA, LancerA, SpitfireA, SunmateA,
SuntopA and VikingA
Nitrogen (N) 0, 20, 40, 80, 160 kg N/ha at sowing, and 40+40 (40 kg N/ha applied at both sowing and GS31). All N applied as urea.

NU
TRIT
ION
& S
OIL
S
178 | NORTHERN GRAINS RESEARCH RESULTS 2016
Results
Table 1. Effect of various nitrogen treatments on the yield, grain protein and screening levels of eight bread wheat varieties – Gilgandra 2015
Variety N treatment Predicted yield (t/ha)
Protein (%)
Screenings (%)
Dart 0 2.71 10.0 3.420 2.99 10.3 1.940 3.25 10.3 2.740 + 40 3.32 10.9 2.680 3.41 11.0 2.3160 3.48 11.8 5.0
EGA Gregory 0 2.88 9.2 2.320 3.17 9.6 1.940 3.43 9.9 1.540+40 3.49 10.6 1.580 3.58 11.2 2.0160 3.65 12.2 3.0
Kiora 0 2.57 9.6 4.420 2.86 9.7 4.140 3.11 10.4 4.740+40 3.18 11.0 5.180 3.27 11.4 9.0160 3.34 13.2 9.4
Lancer 0 2.73 10.8 1.320 3.02 10.6 1.740 3.27 11.0 1.140+40 3.34 11.3 1.480 3.43 11.7 1.1160 3.50 12.9 1.5
Spitfire 0 2.63 10.8 2.820 2.92 10.8 2.040 3.18 10.9 2.140+40 3.24 11.8 1.780 3.33 11.8 1.3160 3.40 13.5 1.8
Sunmate 0 2.86 9.7 2.720 3.14 9.8 2.440 3.40 9.9 2.040+40 3.47 10.3 2.080 3.56 10.3 1.7160 3.63 11.5 2.5
Suntop 0 2.94 9.5 2.420 3.23 9.8 2.340 3.49 9.9 2.040+40 3.55 10.4 1.980 3.64 10.5 1.9160 3.71 12.1 3.9
Viking 0 3.12 8.7 1.720 3.41 9.0 1.240 3.67 10.1 1.540+40 3.73 10.6 2.480 3.82 11.1 2.2160 3.89 12.1 3.3
LSD (P = 0.05) 0.120 0.66 1.87

NU
TRIT
ION
& S
OIL
S
INDEPENDENT RESEARCH FOR INDUSTRY | 179
SummaryThere were strong responses in yield and grain protein to all rates of applied N in all varieties.
Conditions at sowing were very wet. There was no effective in-crop rainfall after August which, combined with temperatures above 35 °C in September, resulted in a hard finish to the season. Despite this, moderate grain yields were obtained and screening levels were generally low with no negative effect from even moderate to high N application rates except for increased screening levels at 80 kg N/ha and 160 kg N/ha in Kiora.
AcknowledgementsThis research was funded by NSW DPI and GRDC under project DAN00129: Variety specific agronomy packages for new varieties in NSW. Thanks to Gavin Melville for biometric analysis and Tracie Bird-Gardiner, Ryan Potts, Lizzie Smith, Paddy Steele, Sally Wright and Rachel Hayden for technical assistance.

NU
TRIT
ION
& S
OIL
S
180 | NORTHERN GRAINS RESEARCH RESULTS 2016
Nitrogen response of eight wheat varieties and two sowing times – Trangie 2015Greg Brooke and Tracie Bird-GardinerNSW DPI, Trangie
Key findingsThere was a decline in yield with all rates of applied nitrogen (N), which was likely to be associated with high levels of residual soil N at the site.
Grain protein increased with all rates of applied N in all varieties, most likely due to decreased grain size.
Sowing time had the greatest influence on yield, with the earlier sowing time yielding close to 1 t/ha better than the later sowing time for each variety.
IntroductionNitrogen (N) is the nutrient wheat most needs for growth, development and yield. In recent seasons in Central West NSW there has been a significant trend towards above average yields and very low grain protein levels with more than 30% of grain receivals meeting ASW or lower specifications. Protein levels of <10.5% in a prime hard variety usually indicate that insufficient N levels have not only limited grain protein concentrations, but also yield. Soil testing for N levels before sowing remains an important budgeting tool. It is the most useful indicator within that season if additional applied N is needed to maximise yield and grain protein levels, along with starting soil water and target yield. This trial aimed to determine the effect of N application and sowing time on the yield and grain quality of eight popular bread wheat varieties at Trangie in central NSW in 2015.
Site detailsLocation: Trangie Agricultural Research CentreSoil type: Red loam2014 crop: Field peas2013 crop: BarleySowing dates: TOS 1: 1 May 2015; TOS 2: 13 May 2015Starting moisture: Very wet; 186 mm rainfall January–AprilIn-crop rainfall: 172 mm May–SeptemberFertiliser: 80 kg/ha Trifos at sowingFungicide: Prothioconazole (210 g/L) + tebuconazole (210 g/L) at 300 mL/ha
at GS32 and GS39Starting N: 233 kg N/ha (0–120 cm)Harvest date: TOS 1: 20 November 2015; TOS 2: 29 November 2015
TreatmentsVariety DartA, EGA GregoryA, KioraA, LancerA, SpitfireA, SunmateA,
SuntopA and VikingA
Nitrogen (N) 0, 20, 40, 80, 160 kg N/ha at sowing, and 40+40 (40 kg N/ha applied at both sowing and GS31).
Nitrogen was applied as urea pre-drilled immediately before sowing excepting the 40 + 40 treatment, which had 40 kg N/ha pre-drilled at sowing and 40 kg N/ha top-dressed at GS31 to take advantage of suitable topdressing rain.
ResultsNitrogen treatmentProtein levels significantly increased with increasing N application rates across all varieties (Figure 1). However, grain yield significantly declined with increasing rates of nitrogen application in all varieties. There was no significant difference in yield between nitrogen applied as a split treatment of 40 + 40 (sowing: GS31) or 80 kg N/ha at sowing. There was a linear relationship between nitrogen application rate and the level of screenings (%), which increased as the N rate increased (data not shown). There was no difference in screening levels between the 40 + 40 split N treatment and 80 kg N/ha at sowing except for Dart, Kiora and Suntop, which had significantly higher screenings with the 80 kg N/ha at sowing application (data not shown).

NU
TRIT
ION
& S
OIL
S
INDEPENDENT RESEARCH FOR INDUSTRY | 181
3.5
3.7
3.9
4.1
4.3
4.5
4.7
4.9
5.1
11.5
12.0
12.5
13.0
13.5
14.0
14.5
15.0
15.5
0 20 40 40 + 40 80 160
Gra
in y
ield
(t/h
a)
Gra
in p
rote
in (%
)
Nitrogen treatment
protein yield
Figure 1. Effect of nitrogen (N) rate across sowing times and varieties – Trangie 2015 LSD yield = 0.1 t/ha; LSD protein = 0.2%
Time of sowing Sowing time had a significant effect on grain protein, yield and screening levels (screenings data not shown) achieved by all varieties at Trangie in 2015 (Figure 2). A two-week delay in sowing from early May to mid-May reduced yield by 1.0 t/ha, increased protein by 1.4% and increased screenings by 5.8% when averaged across the eight wheat varieties. All varieties were significantly higher yielding for TOS 1 than TOS 2, but conversely there were higher grain protein levels with TOS 2 than TOS 1 (Figure 2).
Lancer_1
Lancer_2
Suntop_1
Suntop_2
EGA_Gregory_1
EGA_Gregory_2
Kiora_1
Kiora_2
Spitfire_1
Spitfire_2
Sunmate_1
Sunmate_2
Viking_1
Viking_2
Dart_1
Dart_2
11.5
12.0
12.5
13.0
13.5
14.0
14.5
15.0
15.5
16.0
3.00 3.50 4.00 4.50 5.00 5.50
Gra
in p
rote
in (%
)
Grain yield (t/ha)
Figure 2. Effect of sowing time on yield and grain protein levels (adjusted for nitrogen rates) of eight bread wheat varieties – Trangie 2015 LSD yield = 0.14 t/ha; protein = 0.37% Number after variety name indicates sowing date where 1 = TOS 1 (1 May 2015) and 2 = TOS 2 (13 May 2015)
SummaryThis trial site had a high starting soil N level of 233 kg N/ha (0–120 cm) which probably contributed to declining yield with increasing rates of N application. However, protein levels still increased with increasing rates of N application, but this was most likely due to decreased grain size. Most varieties yielded almost 1 t/ha higher with TOS 1 compared with TOS 2. Sunmate and Suntop generally performed similarly at both sowing times. They were the highest yielding varieties at each sowing date, but also had lower protein achievement. Lancer and Spitfire also performed similarly at the two sowing dates and were generally lower yielding than Sunmate or Suntop at each sowing time, but obtained higher grain protein levels.

NU
TRIT
ION
& S
OIL
S
182 | NORTHERN GRAINS RESEARCH RESULTS 2016
AcknowledgementsThis research was funded by NSW DPI and GRDC under the project DAN00129: Variety specific agronomy packages for new varieties in NSW. Thanks to Gavin Melville for biometric analysis and Lizzie Smith, Paddy Steele, Sally Wright, Rachel Hayden and Jayne Jenkins for technical assistance.

NU
TRIT
ION
& S
OIL
S
INDEPENDENT RESEARCH FOR INDUSTRY | 183
Nitrogen response of eight wheat varieties – Nyngan 2015Greg Brooke and Tracie Bird-GardinerNSW DPI, Trangie
Key findingsThis site was only moderately responsive to nitrogen (N) application. Yield and protein generally increased in all varieties with the 20 kg N/ha and 40 kg N/ha rates. However, yield decreased with higher application rates.
Protein and screening levels increased with N rates above 40 kg N/ha.
KioraA produced the highest screening levels. The sowing date of 5 May at Nyngan is probably a bit late for KioraA, which would have exacerbated screenings.
Varieties with comparatively lower biomass such as DartA, LancerA, SpitfireA and SunmateA maintained higher yield and lower screening levels even with the higher N application rates with a corresponding lower impact on harvest index also observed in these varieties.
IntroductionNitrogen (N) is the nutrient most needed by wheat. It is essential for growth and development, and yield and grain protein levels. In recent seasons in Central West NSW there has been a significant trend towards very low grain protein levels with more than 30% of grain receivals meeting ASW or lower specifications. Protein levels of <10.5% in a prime hard variety usually indicate that insufficient N levels have not only limited grain protein concentrations, but also yield. Soil testing for N levels before sowing remains an important budgeting tool. It is the most useful indicator if additional applied N is needed to support crop growth and to maximise yield and grain protein potential within a given season. Consideration must also be given to starting soil water and target yield. This trial aimed to determine the effect of N rate on the yield and grain quality of eight popular bread wheat varieties at Gilgandra in central NSW in 2015.
Site detailsLocation: NynganCo-operator: Jack and Dione CarterSoil type: Red loam2014 crop: Canola2013 crop: WheatSowing date: 5 May 2015Starting moisture: Full profile to 120 cm. (153 mm rain January–April). Wet sowing
conditionsIn-crop rainfall: 166 mm May–September. Good early season growth but a hard
finishFertiliser: 70 kg/ha Trifos at sowingFungicide: Prothioconazole (210 g/L) + tebuconazole (210 g/L) applied at
300 mL/ha on 21 August and 15 SeptemberInsecticides: 300 g/ha pirimicarb (500 g/kg) (aphids)Starting N: 230 kg N/ha (0–120 cm)Harvest date: 29 October 2015
TreatmentsVariety DartA, EGA GregoryA, KioraA, LancerA, SpitfireA, SunmateA,
SuntopA and VikingA
Nitrogen (N) 0, 20, 40, 80, 160 kg N/ha at sowing, and 40+40 (40 kg N/ha applied at both sowing and GS31).
Nitrogen was applied as urea pre-drilled immediately before sowing excepting the 40 + 40 treatment, which had 40 kg N/ha pre-drilled at sowing and 40 kg N/ha top-dressed at GS 31 to take advantage of suitable topdressing rain.

NU
TRIT
ION
& S
OIL
S
184 | NORTHERN GRAINS RESEARCH RESULTS 2016
Results
Table 1. Effect of various nitrogen treatments on the yield, grain protein and screening levels of eight bread wheat varieties – Nyngan 2015
Variety N rate (kg/ha) Yield (t/ha) Protein (%) Screenings (%)
Dart 0 3.21 10.3 9.520 3.43 11.7 11.840 3.08 13.2 18.740+40 3.10 13.7 14.880 2.93 14.4 18.7
160 2.83 15.8 19.9EGA Gregory 0 3.69 10.0 0.7
20 3.46 11.3 4.640 3.23 12.4 11.240+40 3.21 13.9 14.880 2.68 14.8 22.0160 2.42 15.2 24.3
Kiora 0 2.76 12.3 17.920 2.75 13.0 22.240 3.02 14.1 24.740+40 2.61 15.9 36.180 2.60 15.9 37.2160 2.33 17.8 48.3
Lancer 0 3.10 10.1 4.120 3.69 11.2 6.440 3.40 13.0 3.340+40 2.80 14.6 15.980 2.92 14.7 14.7160 2.67 16.2 16.6
Spitfire 0 3.55 11.6 7.120 3.32 12.1 5.840 3.11 13.1 10.240+40 3.59 13.5 10.480 3.40 14.0 11.2160 2.89 16.7 18.0
Sunmate 0 3.49 10.7 7.720 3.70 11.2 4.840 3.30 11.6 7.740+40 3.09 13.2 9.480 2.93 14.0 14.2160 2.67 15.3 16.4
Suntop 0 3.28 10.7 8.720 3.54 10.8 8.440 3.33 12.1 15.340+40 3.47 12.8 17.780 3.07 12.7 18.4160 2.68 15.3 32.6
Viking 0 3.52 10.9 10.320 3.37 11.2 13.440 3.22 12.3 17.640+40 2.65 14.3 28.980 2.78 14.1 28.9160 2.29 17.0 42.5
LSD (P = 0.05) 0.56 1.4 9.0Note: The LSD for screenings level is high; screenings data should be used with caution.

NU
TRIT
ION
& S
OIL
S
INDEPENDENT RESEARCH FOR INDUSTRY | 185
0
0.5
1.0
1.5
2.0
2.5
3.0
3.5
4.0
0 20 40 40 + 40 80 160
Yiel
d (t
/ha)
Nitrogen treatment
Figure 1. Effect of nitrogen application on yield across varieties – Nyngan 2015
0
5
10
15
20
25
30
35
0 20 40 40 + 40 80 160
Har
vest
inde
x (%
)
Nitrogen treatment
Figure 2. Harvest Index averaged across wheat varieties and nitrogen application rates – Nyngan 2015
SummaryConditions at sowing were very wet. There was no effective in-crop rainfall after August and, combined with temperatures above 35 °C in September, resulted in a hard finish to the season.
This site had a high background starting N level (233 kg N/ha), which was surprising given the history of continuous cropping – 17 years of crop (wheat 40%, canola 20%, barley 20%, pulse 20%) with additional N (above starter fertiliser application) only applied in 1999. The lower rates of 20 kg N/ha and 40 kg N/ha gave modest yield increases in most varieties however, rates higher than this tended to reduce yield and also caused screenings levels to increase in this trial. Protein levels increased with N application rates of 40 kg N/ha and above as seed size decreased.
Biomass and harvest index (data not shown) demonstrated that increasing N rate in heavier biomass producing varieties such as EGA Gregory, Viking and Kiora produced more dry matter with comparatively less grain yield, i.e. a lower harvest index.
AcknowledgementsThis research was funded by NSW DPI and GRDC under project DAN00129: Variety specific agronomy packages for new varieties in NSW. Thanks to Gavin Melville for biometric analysis and Ryan Potts, Lizzie Smith, Paddy Steele, Sally Wright and Rachel Hayden for technical assistance and Steven Simpfendorfer for editing.

NU
TRIT
ION
& S
OIL
S
186 | NORTHERN GRAINS RESEARCH RESULTS 2016
Nitrogen response of eight wheat varieties – Coolah 2015Greg Brooke1, Peter Matthews2 and Tracie Bird-Gardiner1
1 NSW DPI, Trangie 2 NSW DPI, Orange
Key findingsThis site was fairly unresponsive to nitrogen (N) application. Yield and screenings did not significantly change with increasing rates of N, but there were moderate responses in grain protein to all rates of applied N in all varieties.
The 40 kg N/ha at sowing + 40 kg N/ha in crop treatment had a significant increase in grain protein above the 40 kg N/ha at sowing only treatment in all varieties, but was not significantly different from the 80 kg N/ha at sowing treatment.
IntroductionNitrogen (N) is the nutrient most required by wheat. It is essential for growth and development, and yield and grain protein levels. In recent seasons in Central West NSW there has been a significant trend towards very low grain protein levels with more than 30% of grain receivals meeting ASW or lower specifications. Protein levels of <10.5% in a prime hard variety usually indicate that insufficient N levels have not only limited grain protein concentrations, but also yield. Soil testing for N levels before sowing remains an important budgeting tool. It is the most useful indicator if more applied N is needed to support crop growth and to maximise yield and grain protein potential within a given season. Consideration must also be given to starting soil water and target yield. This trial aimed to determine the effect of N rate on the yield and grain quality of eight popular bread wheat varieties at Coolah in central NSW in 2015.
Site detailsLocation: CoolahCo-operator: “Binnia Creek”Soil type: Black basalt2014 crop: WheatSowing date: 13 June 2015Starting moisture: Very wet at sowing to below 120 cm (315 mm rain January–May)In-crop rainfall: 228 mm June–OctoberFertiliser: 90 kg/ha Trifos at sowingFungicide: Prothioconazole (210 g/L) + tebuconazole (210 g/L) applied at
300 mL/ha on 14 September and 7 OctoberInsecticide: 300 g/ha pirimicarb (500 g/kg) 7 October (aphids)Starting N: 93 kg N/ha (0–60 cm)Harvest date: 8 December 2015
TreatmentsVariety DartA, EGA GregoryA, KioraA, LancerA, SpitfireA, SunmateA,
SuntopA and VikingA
Nitrogen (N) 0, 20, 40, 80, 160 kg N/ha at sowing, and 40+40 (40 kg N/ha applied at both sowing and GS31).
Nitrogen applied as urea, pre-drilled immediately prior to sowing, with exception of the 40 + 40 treatment which had 40 kg N/ha pre-drilled at sowing and 40 kg N/ha top dressed at GS31.

NU
TRIT
ION
& S
OIL
S
INDEPENDENT RESEARCH FOR INDUSTRY | 187
Results
Table 1. Effect of various nitrogen treatments on the yield, grain protein and screening levels of eight bread wheat varieties – Coolah 2015
Variety N rate (kg/ha) Yield (t/ha) Protein (%) Screenings (%)
Dart 0 4.1 12.0 4.920 4.1 12.4 5.240 4.1 12.9 5.240+40 4.1 13.4 4.980 4.1 13.2 5.4160 4.1 13.6 5.1
EGA Gregory 0 4.4 10.8 2.820 4.4 11.3 3.240 4.5 11.7 3.140+40 4.5 12.2 2.980 4.5 12.0 3.3160 4.5 12.4 3.0
Kiora 0 4.2 11.7 3.520 4.2 12.1 3.940 4.2 12.6 3.840+40 4.2 13.1 3.680 4.2 12.9 4.0160 4.2 13.3 3.7
Lancer 0 3.8 12.7 2.620 3.8 13.1 2.940 3.8 13.6 2.940+40 3.8 14.1 2.680 3.8 13.9 3.1160 3.8 14.3 2.8
Spitfire 0 4.2 12.6 2.120 4.2 13.1 2.540 4.2 13.5 2.440+40 4.2 14.1 2.280 4.2 13.9 2.6160 4.2 14.2 2.3
Sunmate 0 4.3 11.2 3.120 4.3 11.7 3.440 4.3 12.1 3.440+40 4.3 12.6 3.280 4.3 12.5 3.6160 4.3 12.8 3.3
Suntop 0 4.2 10.9 2.620 4.2 11.4 3.040 4.3 11.8 3.040+40 4.3 12.4 2.780 4.3 12.2 3.1160 4.3 12.5 2.8
Viking 0 3.9 10.9 3.820 3.9 11.4 4.140 4.0 11.8 4.140+40 4.0 12.3 3.880 4.0 12.1 4.3160 4.0 12.5 3.9
LSD (P=0.05) 0.12 0.28 0.53

NU
TRIT
ION
& S
OIL
S
188 | NORTHERN GRAINS RESEARCH RESULTS 2016
Dart
EGA_Gregory
Kiora
Lancer Spitfire
Sunmate
Viking
Av. yield L.S.D. (0.10)
Av. protein L.S.D. (0.23)
11.5
12.0
12.5
13.0
13.5
14.0
3.7 3.8 3.9 4.0 4.1 4.2 4.3 4.4 4.5
Gra
in p
rote
in (%
)
Grain yield (t/ha)
Figure 1. Protein dilution relationship of eight bread wheat varieties across nitrogen rates – Coolah 2015
SummaryThere were moderate responses in grain protein to all rates of applied N in all varieties. The 40 kg N/ha at sowing + 40 kg N/ha in-crop treatment showed a significant increase in grain protein above the 40 kg N/ha at sowing only treatment in all varieties, but was not significantly different from the 80 kg N/ha at sowing treatment.
Screening levels were low, with only Dart above 5% in some treatments. Dart, being the quickest variety in this trial, flowered and reached grain filling ahead of the other varieties, most likely causing it to be filling grain and losing green leaf during the hotter and drier part of September. The slower varieties probably benefited more from the late spring rains in this season.
AcknowledgementsThis research was funded by NSW DPI and GRDC under project DAN00129: Variety specific agronomy packages for new varieties in NSW. Thanks to Gavin Melville for biometric analysis and Ryan Potts, Lizzie Smith, Paddy Steele, Sally Wright and Rachel Hayden for technical assistance.

NU
TRIT
ION
& S
OIL
S
INDEPENDENT RESEARCH FOR INDUSTRY | 189
Nitrogen response of eight wheat varieties – Merriwa 2015Greg Brooke1, Peter Matthews2 and Tracie Bird-Gardiner1
1 NSW DPI, Trangie 2 NSW DPI, Orange
IntroductionNitrogen (N) is the nutrient wheat needs in greatest quantity for growth, development and yield. In recent seasons in Central West NSW there has been a significant trend towards above average yields and very low grain protein levels, with greater than 30% of grain receivals meeting ASW or lower specifications. Protein levels of <10.5% in a prime hard variety usually indicates that insufficient N levels have not only limited grain protein concentrations but also yield. Soil testing for N levels before sowing remains an important budgeting tool. It is the most useful indicator in that season if additional applied N is needed to maximise yield and grain protein levels. Consideration must also be given to starting soil water and target yield. This trial aimed to determine the effect of N application on the yield and grain quality of eight popular bread wheat varieties at Merriwa in central NSW in 2015.
Site detailsLocation: MerriwaCo-operator: Ray Inder, “Farley”Soil type: Black basalt2014 crop: Canola2013 crop: BarleySowing date: 9 June 2015Starting moisture: 315 mm rainfall January to end May; conditions very wet at
sowingIn-crop rainfall: 288 mmFertiliser: 95 kg/ha Granulock Supreme Z Extra at sowingFungicide: 2.5 L/t flutriafol (500 g/L; Sapphire) fungicide on fertiliser;
prothioconazole (210 g/L) + tebuconazole (210 g/L) applied at 300 mL/ha on 14 September and 7 October
Starting N: 90 kg N/ha (0–60 cm)Harvest date: 9 Dec 2015
TreatmentsVariety DartA, EGA GregoryA, KioraA, LancerA, SpitfireA, SunmateA,
SuntopA and VikingA
Nitrogen (N) 0, 20, 40, 80, 160 kg N/ha at sowing, and 40+40 (40 kg N/ha applied at both sowing and GS31).
Nitrogen applied as urea, pre-drilled immediately prior to sowing, with exception of the 40 + 40 treatment which had 40 kg N/ha pre-drilled at sowing and 40 kg N/ha top dressed at GS 31.
Key findingsThere was a significant response in yield and grain protein across increasing rates of applied nitrogen (N) in all varieties.
Yield averaged across varieties rose from 2.88 t/ha with no applied N, to 4.06 t/ha with 160 kg/ha of applied N.
Grain protein levels across varieties increased from 9.0% (nil applied N) to 12.2% with 160 kg/ha of applied N.
Screening levels were not significantly affected by increasing N application rates in any variety and averaged close to 6% across varieties and N rates.

NU
TRIT
ION
& S
OIL
S
190 | NORTHERN GRAINS RESEARCH RESULTS 2016
Results
Table 1. Effect of various nitrogen treatments on the yield, grain protein, screening levels and grain nitrogen yield (GNY) of eight bread wheat varieties – Merriwa 2015
Variety N treatment Yield (t/ha) Protein (%) Screenings (%)
GNY (kg N/ha)
Dart 0 2.9 9.1 5.7 46.120 3.3 9.6 5.9 54.840 3.5 10.2 5.9 63.640+40 3.9 11.3 6.0 77.780 3.9 11.2 5.8 77.1160 4.1 12.2 6.0 87.7
EGA Gregory 0 2.8 8.7 6.6 43.320 3.2 9.3 6.8 51.740 3.5 9.9 6.8 60.240+40 3.9 11.0 6.9 74.080 3.9 10.9 6.6 73.3160 4.0 11.9 6.8 83.7
Kiora 0 2.9 9.3 6.6 47.420 3.3 9.8 6.9 56.340 3.5 10.5 6.8 65.240+40 3.9 11.5 6.9 79.580 3.9 11.5 6.7 78.9160 4.1 12.5 6.9 89.5
Lancer 0 2.7 9.8 4.3 45.820 3.0 10.4 4.5 54.840 3.3 11.0 4.5 63.640+40 3.7 12.1 4.6 77.980 3.7 12.0 4.4 77.3160 3.8 13.0 4.6 87.6
Spitfire 0 2.7 9.5 7.2 45.520 3.1 10.0 7.5 54.340 3.4 10.6 7.4 63.140+40 3.8 11.7 7.5 77.380 3.8 11.6 7.3 76.6160 3.9 12.6 7.5 87.0
Sunmate 0 2.9 8.6 7.0 43.520 3.3 9.1 7.3 51.940 3.5 9.8 7.2 60.440+40 3.9 10.8 7.3 74.380 3.9 10.7 7.1 73.6160 4.1 11.7 7.3 84.0
Suntop 0 3.2 8.6 4.8 47.820 3.5 9.1 5.0 56.440 3.8 9.8 5.0 65.340+40 4.2 10.8 5.1 79.680 4.2 10.7 4.8 78.9160 4.4 11.7 5.0 89.9
Viking 0 2.9 8.6 5.4 42.720 3.2 9.1 5.7 51.140 3.5 9.7 5.6 59.540+40 3.9 10.8 5.7 73.380 3.9 10.7 5.5 72.6160 4.0 11.7 5.7 83.0
LSD (P=0.05) 0.05 0.11 0.38

NU
TRIT
ION
& S
OIL
S
INDEPENDENT RESEARCH FOR INDUSTRY | 191
Dart
EGA_Gregory
Kiora
Lancer
Spitfire
Sunmate SuntopViking
Av. yield
L.S.D. (0.08)
Av. protein
L.S.D. (0.17)
10.0
10.2
10.4
10.6
10.8
11.0
11.2
11.4
11.6
3.3 3.4 3.5 3.6 3.7 3.8 3.9 4.0
Grai
n pr
otei
n (%
)
Grain yield (t/ha)
Figure 1. Protein dilution relationship of eight bread wheat varieties across nitrogen rates – Merriwa 2015
SummaryThere was a strong positive yield and grain quality response to applied N in all varieties at all rates. At the highest rate of applied N (160 kg N/ha), both yield and protein appeared to still be rising at this site in 2015. The protein levels (8.6% to 13.0%) indicate that N could have still been in short supply to meet higher yield potential levels in some varieties (e.g. EGA Gregory, Sunmate, Suntop and Viking). Dart, Kiora, Lancer and Spitfire all achieved grain protein levels above 10% with only 40 kg N/ha applied at sowing. Screenings levels were very stable across N rates in all varieties indicating timely rainfall during grain filling. Grain nitrogen calculations show that at the highest rate of applied N (160 kg N/ha), N was still being taken up by all varieties at this site in 2015.
AcknowledgementsThis research was funded by NSW DPI and GRDC under project DAN00129: Variety specific agronomy packages for new variaties in NSW. Thanks to Gavin Melville for biometric analysis and Ryan Potts, Lizzie Smith, Paddy Steele, Sally Wright and Rachel Hayden for technical assistance.

NU
TRIT
ION
& S
OIL
S
192 | NORTHERN GRAINS RESEARCH RESULTS 2016
Agronomic response of sorghum to nitrogen management – Tamworth 2014–15Rick Graham and Peter FormannNSW DPI, Tamworth
Key findingsDespite only 71 mm (0–150 cm) of plant available water (PAW) at sowing, in-crop rainfall of 392 mm substantially increased yield potential.
There was a significant grain yield response to applied nitrogen (N). Adding 40 kg N/ha resulted in a 0.9 t/ha or 10% increase in grain yield over the nil applied N treatment.
Optimum yield was achieved through applying 160 kg N/ha, which resulted in a 21% or 1.7 t/ha increase in grain yield over the nil treatment. There was a corresponding 10% increase in yield with the 40 kg N/ha treatment.
Maximum grain yields were achieved when grain protein was >9.0%, supporting previous observations that the critical grain protein value of sorghum is 9–10% to maximise yield.
These results highlight the need to consider yield potential in terms of probable and starting soil N values.
IntroductionThe Northern Grains Region of NSW with its characteristic black/grey cracking clays (vertosols) relies heavily on stored moisture and subsoil nutrient reserves for crop production. Although PAW is the principal driver of yield potential, nitrogen (N) is considered one of the most important limitations of yield. Importantly, a crop’s optimum N requirement depends on yield potential which, in turn, depends on plant available soil moisture. Furthermore, declining soil organic matter and/or N reserves has created an increased reliance on N fertilisers. Subsequently, as yield potential rises and soil fertility declines, N fertiliser management becomes more important. While there are N response guidelines for crops such as wheat, information for sorghum tends to be more limited.
Critical grain protein values can be used to help monitor how effective N management decisions are in crops such as sorghum. Optimum sorghum grain yields are generally achieved when grain protein concentration (GPC) levels of 9–10% are attained, with yield affected at levels below 9%. Conversely, at levels >10% grain protein, higher N rates might only increase grain protein and not yield, which is uneconomical when protein premiums do not exist for sorghum.
The aim of this research was to determine the agronomic response of sorghum to N management to help develop more robust soil test/crop response guidelines. Results from a dryland N response sorghum trial conducted at Tamworth in the 2014–15 season are outlined in this report.
Site detailsLocation: Tamworth Agricultural Institute (Paddock 3)Soil type: Black vertosolStarting N: Available soil nitrate N ~85 kg/ha (0–120 cm)Planter: Monosem double disc precision planter – row configuration
75 cm solidVariety: Hybrid, MR BazleyTarget population: 60,000 plants/haFertiliser: 50 kg/ha Granulock Z applied at plantingSowing date: 27 October 2014PAW at sowing: 71 mm (0–150 cm)In-crop rainfall: 392 mmHarvest date: 6 March 2015
Table 1. Monthly in-crop rainfall 2014–15 season
November December January February March Total (mm)
44.0 146.8 165.2 29.3 6.0 391.6
TreatmentNitrogen (N) rate 0, 40, 80, 120, 160 and 180 kg N/ha applied as urea (46% N) at
planting, with five replicates per treatment.

NU
TRIT
ION
& S
OIL
S
INDEPENDENT RESEARCH FOR INDUSTRY | 193
Results Although PAW at sowing was only 71 mm, excellent December/January rainfall (~312 mm) resulted in 391.6 mm of in-crop rainfall (Table 1). Plant establishment of ~ 61,500 plants/ha, when averaged across all treatments, exceeded the targeted population of 60,000 plants/ha.
Grain yieldThere was a significant grain yield response to applied N. Adding 40 kg N/ha (~87 kg/ha of urea), resulted in a 0.9 t/ha or 10% increase in grain yield over the nil applied N treatment (8.67 t/ha vs 7.86 t/ha), with no significant difference between the 40, 80 and 120 kg N/ha treatments (Figure 1). Optimum yield was achieved by adding 160 kg N/ha (~348 kg/ha urea) resulting in a 1.7 t/ha or 21% increase in grain yield over the nil N treatment and a corresponding 10% increase in yield over the 40 kg N/ha treatment (9.55 t/ha vs 8.67 t/ha). Increasing the N rate to 180 kg N/ha however, resulted in no significant yield increase over either the 120 kg N/ha or 160 N/ha treatments, with a typical plateaued N response curve observed (Figure 1).
7.0
7.5
8.0
8.5
9.0
9.5
10.0
0 50 100 150 200
Gra
in y
ield
(t/h
a)
Applied nitrogen (kg N/ha)
lsd (p=0.05) = 0.62 t/ha
Figure 1. Grain yield response to varying rates of applied N at Tamworth in the 2014–15 season
Grain protein concentration (GPC)Increased levels of grain protein were achieved through increasing applied N (Figure 2). At the nil rate of applied N, the GPC achieved in this experiment, was only 6.6%. Increasing N application to >80 kg N/ha increased GPC to >9.0%, with yield optimised at around 9.3% GPC at the 160 kg N/ha rate. Results from this experiment showed that grain yield tends to be maximised when GPC is >9.0%, supporting observations that maximum grain yield for sorghum is believed to be achieved when grain protein values are between 9–10%.
5.0
6.0
7.0
8.0
9.0
10.0
0 50 100 150 200
Gra
in p
rote
in (%
)
Applied nitrogen (kg N/ha)
lsd (p=0.05) = 1.00 %
Figure 2. Grain protein concentration response to varying rates of applied N at Tamworth in the 2014–15 season

NU
TRIT
ION
& S
OIL
S
194 | NORTHERN GRAINS RESEARCH RESULTS 2016
SummaryIn water-limited/dryland environments, sorghum grain yield response to N application can vary, depending on starting soil N and PAW. The difficulty in predicting yield responses in dryland environments centres on PAW, the principal determinant of grain yield potential. In this instance with only ~71 mm (0–150 cm) of PAW at sowing, yield potential was considered low to average. However, as was the case in the 2014–15 season, with good in-crop rainfall, crop yield potential can increase substantially. In these occurrences, N supply can become an important factor limiting grain yield potential.
If grain yield, and hence fertiliser decisions for example, were made on PAW at sowing and only a conservative approach to N application was taken (i.e. only 50 kg/ha of Granulock Z applied) as per this experiment, 1.7 t/ha or 21% of grain yield potential would have been lost given the optimum N response rate (160 kg N/ha). Significantly, even at modest levels of N application (e.g. 40–80 kg N/ha) grain yield was increased by ~10% or 0.8 t/ha.
Critical GPC values were shown to assist a grower to evaluate the effectiveness of N management decisions. As per previous findings, optimum sorghum grain yields were achieved when a GPC of 9–10% were attained. Importantly, these results highlight the need to consider yield potential in terms of probable PAW and starting soil N values. If you have low starting soil available N reserves and/or potentially good PAW (starting plus in-crop rainfall), then grain yield responses to applied N are considered more probable, whilst critical GPC values are considered excellent for determining the effectiveness of N management strategies.
AcknowledgementsThis research was co-funded by the GRDC and NSW DPI, as part of the collaborative GRDC, University of Queensland/NSW DPI funded project UQ00063: ‘MPCNII – Regional soil testing for the Northern Grains Region. We thank Dr Neroli Graham (NSW DPI) for statistical analyses. Technical assistance provided by Peter Perfrement and Bruce Haigh (NSW DPI), is gratefully acknowledged.

NU
TRIT
ION
& S
OIL
S
INDEPENDENT RESEARCH FOR INDUSTRY | 195
Agronomic response of sorghum varieties to nitrogen management – Terry Hie Hie 2014–15Rick Graham and Peter FormannNSW DPI, Tamworth
Key findingsAlthough plant available water (PAW) at sowing was ~47 mm (0–120 cm), timely in-crop rainfall of 257 mm improved yield potential.
If yield and subsequently fertiliser decisions were made on PAW at sowing and a low input approach to nitrogen (N) application was taken, as per the nil treatment in this experiment (42 kg/ha of Granulock Z), 0.9 t/ha or 20% of yield potential would have been lost, compared with the optimum N response rate (120 kg N/ha).
Significantly, even at modest levels of N application (e.g. 40–80 kg N/ha), grain yield was increased by 0.56 t/ha or 13% over the nil N treatment.
Although maximum yield was achieved at 11.1% grain protein content (GPC), the rate of grain yield increase per unit of additional N declined at GPC >10%. Importantly, results from this experiment did show that yield was compromised by N deficiency when GPC was <9%.
Results from this experiment highlight the need to consider yield potential in terms of targeted yields and hence N requirements. Importantly, if N inputs are limited then yield potential can be negatively affected.
IntroductionThe Northern Grains Region of NSW, with its typical black/grey cracking clays (vertosols), relies heavily on stored moisture and subsoil nutrient reserves for crop production. Although plant available water (PAW) is the principal driver of yield potential, nitrogen (N) is considered one of the most important limitations of yield. The optimum N requirement of a crop is dependent on yield potential, which in turn depends on total PAW in the soil profile. Declining soil organic matter and/or N reserves has also resulted in an increased reliance on N fertilisers. Subsequently, as yield potential rises and soil fertility declines, nitrogen fertiliser management becomes more important. While there are N response guidelines for crops such as wheat, information for sorghum is more limited.
Critical grain protein values can be used to help monitor the effectiveness of N management decisions in crops such as sorghum. Optimum sorghum grain yields are generally achieved when grain protein concentration (GPC) levels of 9–10% are attained, with yield affected at levels below 9%. Conversely, at levels >10% grain protein, higher rates of N might only increase grain protein.
The aim of this research was to determine the agronomic response of sorghum to N management, to help develop more robust soil test/crop response guidelines. Results from a dryland N response sorghum trial conducted at Terry Hie Hie in the 2014–15 season are outlined in this report.
Site detailsLocation: “East Grattai”, Terry Hie HieCo-operator: Michael LedinghamSoil type: Grey vertosolStarting nutrition: Starting soil nutrition is outlined in Table 1. The available soil
nitrate N was calculated as ~50 kg N/ha (0–120 cm)Planter: Monosem double disc precision planter with single skip row
configurationTarget population: 30,000 plants/haFertiliser: 42 kg/ha Granulock Z extra applied at plantingSowing date: 2 October 2014PAW (sowing): ~47 mm (0–120 cm)In-crop rainfall: 257.5 mmHarvest date: 4 March 2015
Table 1. Starting soil nutrition
Depth (cm)
Nitrate (mg/kg)
Colwell P (mg/
kg)
Colwell K (mg/
kg)
Sulfur (mg/kg)
Organic carbon
(%)
Conductivity (dS/m)
pH (CaCl2)
BSES P (mg/kg)
0–10 3 21 194 2.4 0.53 0.018 5.5 37.9410–30 3 4 94 2.2 0.32 0.027 6.0 10.2230–60 4 3 66 3.9 0.42 0.066 7.1 5.5760–90 2 < 0.2 106 9.0 0.30 0.137 7.6 –90–120 1 < 0.2 123 35.1 0.06 0.234 7.7 –

NU
TRIT
ION
& S
OIL
S
196 | NORTHERN GRAINS RESEARCH RESULTS 2016
TreatmentsVarieties: Three hybrids, Pacific MR 43, MR Bazley and MR Buster.Nitrogen (N) rate: 0, 40, 80, 120, and 180 kg N/ha applied as urea (46% N) upfront at
sowing, with six replicates per treatment.
Results Although PAW at sowing was only ~47 mm, good December/January rainfall of 200 mm resulted in 257 mm of in-crop rainfall being received. The starting soil nitrate N at ~50 kg N/ha (0–120 cm) was very low and would be considered likely to be responsive to N application.
Grain yieldThere was a significant (P<0.001) variety and grain yield response to applied N, but no variety by N interaction. Adding 40 kg N/ha (~87 kg/ha of urea), resulted in a 0.56 t/ha or 13% increase in grain yield over the nil applied N treatment (4.96 t/ha vs 4.40 t/ha), with no significant difference between the 40 kg N/ha or 80 kg N/ha treatments (Figure 1). Optimum yield was achieved by adding 120 kg N/ha (~260 kg/ha urea) resulting in a 0.9 t/ha or 20% increase in grain yield over the nil N treatment and a 7% yield increase over the 40 kg N/ha treatment. Increasing the N rate to 180 kg N/ha resulted in no significant yield increase over the 120 kg N/ha application rate, with the N response curve plateauing (Figure 1).
In terms of variety response, averaged across all treatments Pacific MR 43 and MR Buster both out yielded MR Bazley (5.05 t/ha and 5.10 t/ha vs 4.82 t/ha, respectively), possibly reflecting maturity differences. There was no significant difference in yield between Pacific MR 43 and MR Buster.
4.0
4.2
4.4
4.6
4.8
5.0
5.2
5.4
0 50 100 150 200
Gra
in y
ield
(t/h
a)
Applied nitrogen (kg N/ha)
lsd (P=0.05) = 0.21 t/ha
Figure 1. Grain yield response to varying rates of applied nitrogen at Terry Hie Hie in the 2014–15 season
Grain protein concentrationIncreasing rates of N application resulted in higher levels of grain protein with significant increases observed in GPC up to 120 kg N/ha (Figure 2). The GPC achieved with no addition of N in this experiment was only 8.6%, an indication that the available N compromised grain yield achievement, supporting previous findings that yield will increase with additional N when GPC is <9%. Grain yield in this experiment was maximised at around 11% GPC with the 120 kg N/ha rate, which is slightly above the critical 10% GPC. Importantly however, the grain yield response per unit of additional N did decline above 10% GPC (>40 kg N/ha). The rate of yield gain associated with each kg of N applied declined from 14 kg/unit of N at 40 kg N/ha (10.0% GPC), to ~7.6 kg/unit N at 120 kg N/ha (11.1% GPC) and only ~4.8 kg/unit of additional N at the 180 kg N/ha rate (11.2% GPC).
In terms of variety responses, there was an inverse relationship between grain yield and GPC, with the lowest yielding variety (MR Bazley) achieving the highest GPC (data not shown).

NU
TRIT
ION
& S
OIL
S
INDEPENDENT RESEARCH FOR INDUSTRY | 197
6.0
7.0
8.0
9.0
10.0
11.0
12.0
0 50 100 150 200
Gra
in p
rote
in (%
)
Applied nitrogen (kg N/ha)
lsd (P=0.05) = 0.21 %
Figure 2. Grain protein concentration response to applied nitrogen at Terry Hie Hie 2014–15 in the season
SummaryIn the water-limited environments of the northern grains region, yield potential tends to decline as you move to the north and west of the region and is associated with increasing temperature and decreasing rainfall. As a consequence, lower target plant populations and wider row configurations are often used to improve reliability, but this can decrease yield potential under more favourable conditions. The difficulty in predicting yield responses in these dryland environments centres principally on the fact that estimates are heavily reliant on PAW levels at sowing which are traditionally considered the main determinant of yield potential. In this instance, with only ~47 mm (0–120 cm) of PAW at sowing, yield potential was considered low and was further compounded by low starting soil N. However, as was the case in the 2014–15 season with early sowing and timely in-crop rainfall (200 mm December/January and 52 mm February), yield potential can improve substantially. In these incidences, N can become an important factor that limits grain yield potential.
If yield and subsequently fertiliser decisions were made on PAW at sowing, and a conservative approach or low input approach to N application was taken (i.e. only 42 kg/ha of Granulock Z applied i.e. ~5 kg N/ha) as per this experiment, 0.9 t/ha or 20% of grain yield potential would have been lost compared with the optimum N response rate (120 kg N/ha). Significantly, even at modest levels of N application (e.g. 40–80 kg N/ha) grain yield was increased by 0.56 t/ha or 13% over the nil N treatment. Although maximum yield was achieved at 11.1% GPC, the rate of grain yield increase per unit of additional N declined at GPC >10%, bringing into question the economic return per unit of additional N applied. These results did, however, show yield potential was compromised when GPC was <10%.
Results from this experiment highlight the need to consider yield potential in terms of targeted yields and N requirements. Under conditions of low starting soil N reserves and or potentially good PAW (starting plus in-crop rainfall), then grain yield responses to applied N are considered more likely. Importantly, if N inputs are limited then yield potential likewise is potentially negatively affected.
AcknowledgementsThis research was co-funded by the GRDC and NSW DPI as part of the collaborative GRDC, University of Queensland/NSW DPI project UQ00063: MPCNII – Regional soil testing for the Northern Grains Region. We thank Dr Neroli Graham (NSW DPI) for statistical analyses. Technical assistance provided by Nicole Carrigan, Peter Perfrement and Michael Dal Santo (all NSW DPI), is gratefully acknowledged. Thanks to the Ledingham family for hosting the site and to Gavin McDouall, HMAg for his assistance.

NU
TRIT
ION
& S
OIL
S
198 | NORTHERN GRAINS RESEARCH RESULTS 2016
Strategies to reduce nitrous oxide emissions from nitrogen fertiliser applied to dryland sorghum. Part 1. Effects on crop production and gross marginsGraeme Schwenke and Bruce HaighNSW DPI, Tamworth
Key findingsFertiliser nitrogen (N) rates should be tailored to suit paddock history and soil mineral N levels at sowing.
Sorghum yields without N fertiliser, although high in a favourable season, were still well below those achieved using additional N fertiliser.
At Tamworth, in-season rainfall ideally suited a split-N application strategy resulting in the highest yields.
At Breeza, drier conditions meant that neither split N application nor slow-release N products boosted grain yields above those reached using urea all applied at sowing.
Gross margins for most alternative N strategies were greater than that achieved when no N was applied.
IntroductionGrain sorghum is a profitable, major summer crop in northwest NSW, and is often grown on medium–heavy clay vertosols (cracking clay soils). Nitrogen (N) fertiliser is typically applied either before, or at, sowing. Where intense rainfall occurs on these slowly permeable soils before the crop has reached the stage of rapid N uptake, waterlogging can result in substantial loss of soil nitrate N to the atmosphere through denitrification. The gases emitted include nitrous oxide (N2O), a greenhouse-warming gas, and di-nitrogen (N2). Most of the N lost during denitrification occurs as N2, which does not affect global warming but can constitute a significant loss of applied N from the paddock.
The trials described here are the final year of a three-year project focused on investigating options for reducing nitrous oxide emissions from dryland summer grain cropping in northern NSW. The aim in 2014–15 was to optimise both N rate and fertiliser N release to benefit both crop production and reduce N2O emissions. At the Tamworth site, optimum N fertiliser rates varied depending on the previous crop (sorghum or soybean), which affected the amount of starting soil mineral N (Figure 1). An additional 120 kg N/ha post-sorghum and 40 kg N/ha post-soybean was applied to achieve optimal yield, based on residual soil mineral N levels measured in these two prior cropping histories before sowing. Nitrogen fertiliser was then applied, either all at sowing or split 33:67 between applications at sowing and at booting, about 45 days after sowing. At the Breeza site, there was no difference in previous crop history, so treatments instead focused on comparing alternative slow-release fertilisers, fertiliser blends, and split application strategies.
This paper reports the agronomic and economic results of these two trials, while another paper reports the gaseous emissions results.
0
20
40
60
80
100
120
140
0 10 20 30 40
Soil
dept
h (c
m)
Mineral N (mg/kg)
after sorghum
after soybean
Figure 1. Concentration of mineral N (ammonium + nitrate) in the soil profile at sowing, as influenced by the previous summer crops (sorghum or soybean) – Tamworth 2014–15

NU
TRIT
ION
& S
OIL
S
INDEPENDENT RESEARCH FOR INDUSTRY | 199
Site details2014–15Location: TamworthCo-operator: NSW Department of Primary Industries (Tamworth Agricultural
Institute)Agronomy: MR Bazley sown on 75 cm rows on 28 November 2014, harvested
on 6 March 2015In-crop rain: 422 mmLocation: BreezaCo-operator: NSW Department of Primary Industries (Liverpool Plains Field
Station)Agronomy: MR Bazley sown on 100 cm rows on 11 November 2014, harvested
on 20 March 2015In-crop rain: 264 mm
Treatments
Table 1. Treatment details of the Tamworth and Breeza trials in 2014–15
Tamworth Breeza
Name Pre-crop, fertiliser No. N side-banded at sowing N topdressed at booting
sorg_0_N After sorghum, no N applied 1 0 0sorg_+N After sorghum, 120 kg N/ha urea
side-banded at sowing2 90 kg N/ha urea 0
soy_0_N After soybean, no N applied. 3 90 kg N/ha Entec* 0soy_+N After soybean, 40 kg N/ha urea
side-banded at sowing4 90 kg N/ha polymer-urea** 0
sorg_split After sorghum, 40 kg N/ha urea side banded at sowing + 80 kg N/ha topdressed as urea at booting.
5 30 kg N/ha urea + 60 kg N/ha Entec 0
6 30 kg N/ha urea + 60 kg N/ha polymer-urea
0
7 30 kg N/ha urea + 30 kg N/ha Entec + 30 kg N/ha polymer-urea
0
8 30 kg N/ha urea 60 kg N/ha urea9 30 kg N/ha Entec 60 kg N/ha urea10 30 kg N/ha polymer-urea 60 kg N/ha urea11 30 kg N/ha urea 60 kg N/ha NV-urea***12 30 kg N/ha Entec 60 kg N/ha NV-urea13 30 kg N/ha polymer-urea 60 kg N/ha NV-urea
*Entec® is urea coated with the nitrification inhibitor 3,4-dimethylpyrazole phosphate (DMPP) [Incitec Pivot Fertilisers Ltd]
**Polymer-coated urea delays conversion of urea for up to 2 months
***NV®-urea is urea coated with the urease inhibitor N-(n-butyl) thiophosphoric triamide (NBPT). [Incitec Pivot Fertilisers Ltd]

NU
TRIT
ION
& S
OIL
S
200 | NORTHERN GRAINS RESEARCH RESULTS 2016
Results – Tamworth• Biomass cuts at plant anthesis showed no treatment effect on dry matter (Figure 2–left)
but the N concentration of the biomass was significantly less in the nil-N fertilised plots after a previous sorghum crop.
0
2
4
6
8
10
12
14
16
sorg_0_N sorg_+N soy_0_N soy_+N sorg_split
Dry
mat
ter (
t/ha
)
0
0.2
0.4
0.6
0.8
1.0
1.2
1.4
1.6
sorg_0_N sorg_+N soy_0_N soy_+N sorg_split
N c
onte
nt (%
)
Figure 2. Plant biomass (left) and biomass N concentration (right) at flowering – Tamworth 2014–15
• Biomass at harvest also showed no significant treatment effects (data not shown).• N application treatment and previous crop significantly affected the number of mature
grain heads per hectare (Figure 3) with the non-fertilised post-sorghum treatment having much fewer heads than any of the other treatments.
0
20
40
60
80
100
120
140
160
180
sorg_0_N sorg_+N soy_0_N soy_+N sorg_split
Mat
ure
head
s (’0
00 p
er h
ecta
re)
a
bb
b b
Figure 3. Number of mature grain heads at harvest – Tamworth 2014–15
• Average grain yield across the trial was 9.5 t/ha and mean protein was 6.8%. Grain yield (Figure 4–left) and protein (Figure 4–right) results were strongly affected by previous crop and N application treatment. There were clear and highly significant differences in grain yield according to both previous crop and N application treatment.
• When no fertiliser N was applied, sorghum grown after soybean yielded more than sorghum grown after sorghum.
• When N fertiliser was applied at the calculated rate for optimum production, the yields after the two different previous crops were not different, meaning our N budgeting had achieved an optimum yield for both initial N scenarios.
• However, when the same rate of N fertiliser was used on sorghum after sorghum, but was applied as a split instead of all at sowing, the yield was significantly greater again.
• Grain protein results showed different treatment trends than the yields, with most treatments having similar proteins levels except the post-soybean nil-N (lowest) and the post-sorghum +N treatments (highest). These results reflected the differing levels of N supply available, with the post-soybean treatment showing the effects of limited N supply through reduced protein, and the post-sorghum+N showing an excess of available N going into the grain protein rather than further increasing yield.

NU
TRIT
ION
& S
OIL
S
INDEPENDENT RESEARCH FOR INDUSTRY | 201
0
1
2
3
4
5
6
7
8
9
Gra
in p
rote
in (%
)
ab
a
bab ab
sorg_0_N sorg_+N soy_0_N soy_+N sorg_split0
2
4
6
8
10
12
14G
rain
yie
ld (t
/ha)
sorg_0_N sorg_+N soy_0_N soy_+N sorg_split
Figure 4. Sorghum grain yield (left) and grain protein (right) – Tamworth 2014–15
• The gross margin results for these treatments (Figure 5) closely reflected the grain yield results since sorghum grain quality does not affect pricing (unless weather damage occurs). All treatments had essentially the same variable input costs, except for the split N application, which had an additional cost for the topdressing operation, though this was small in relation to the total gross margins.
• The previous crop influenced gross margins with post-soybean making $1763/ha compared with post-sorghum at $1441/ha. The N budgeted after each previous crop led to similar returns with the post-soybean+N making $2185/ha and the post-sorghum+N making $2112/ha. Again, this indicates our budgeting based on soil N supply and prior crop history was accurate for the season.
• Adding the N as a split application increased returns above an at sowing application by an extra $320/ha.
0
500
1000
1500
2000
2500
sorg_0_N sorg_+N soy_0_N soy_+N sorg_split
Gro
ss m
argi
n ($
/ha)
Figure 5. Gross margins for sorghum nitrogen treatments – Tamworth 2014–15
Results – Breeza• No significant treatment differences were apparent in biomass at flowering or
at harvest (data not shown), but N treatments did affect the N concentration of aboveground biomass at flowering (Figure 6). The N concentration of all applied N treatments was well above that of the nil N control (T1), with the next lowest being the mixed urea/Entec treatment (T5) which was not significantly different from a range of other N treatments (T3, 7, 9, 10, 11 and 13). The highest N concentrations were seen in the 100% urea (T2), 100% polymer (T4), urea/polymer mix (T6), urea+urea topdress (T8) and the Entec+NV topdress treatments (T12).
• There were no treatment effects on the number of plants or the number of grain heads at flowering (data not shown).

NU
TRIT
ION
& S
OIL
S
202 | NORTHERN GRAINS RESEARCH RESULTS 2016
0
0.2
0.4
0.6
0.8
1.0
1.2
1.4
1.6
1.8
1 2 3 4 5 6 7 8 9 10 11 12 13N
con
cent
ratio
n (%
)
a
cd bcdd
b
dbcd cd bcd
bc bcdcd
bcd
Figure 6. Nitrogen concentration (%) in N application treatments at flowering – Breeza 2014–15
• N treatment affected both grain yield (Figure 7–left) and grain protein (Figure 7–right).
• The nil N control (T1) had the lowest grain yield at 5.3 t/ha, whereas most other treatment yields were around 7 t/ha. Only two treatments yielded below the optimum: the 33% urea/67% polymer mixture (T6), and the 33% Entec at sowing + 67% urea top dress (T9).
• Treatment differences on grain protein were similar to those seen with the biomass N content at flowering (Figure 6).
• The nil N control (T1) had lower grain protein than any other treatment. The highest protein was found in the 100% polymer-coated urea treatment (T4), which was statistically similar to several other treatments, including the 100% urea treatment (T2).
0
1
2
3
4
5
6
7
8
1 2 3 4 5 6 7 8 9 10 11 12 13
Gra
in y
ield
(t/h
a)
Treatment number
0
1
2
3
4
5
6
7
8
9
10
1 2 3 4 5 6 7 8 9 10 11 12 13
Gra
in p
rote
in (%
)
Treatment number
a
bccde bcdbcd bcdeb
bc cdecde dedee
a
dcd
dd dbcd
dcd
abcd
bc
d
Figure 7. Grain yield and protein associated with various nitrogen treatments – Breeza 2014–15
• Gross margin analysis (Figure 8) did not include polymer-coated urea as this is currently not a commercially available product and thus could not be costed.
• Compared with the nil N treatment (T1), which returned $1050/ha, the highest grossing treatment was the urea all applied at sowing (T2), which made an extra $362/ha.
• Most other treatments returned about $1250/ha, except the 33% Entec at sowing/67% urea at booting treatment (T9) which yielded and grossed no better than the control (T1). Using NV-urea for topdressing (instead of urea) increased gross margins by $35/ha for urea (T11) and $194/ha for Entec (T12), although the latter difference was again mainly due to the poor grain yield of T9.

NU
TRIT
ION
& S
OIL
S
INDEPENDENT RESEARCH FOR INDUSTRY | 203
0
200
400
600
800
1000
1200
1400
1600
1 2 3 5 8 9 11 12
Gro
ss m
argi
n ($
/ha)
Treatment number
Figure 8. Gross margins for trial treatments (not polymer treatments) – Breeza 2014–15
SummaryThe Tamworth trial results demonstrate the importance of knowing starting soil mineral N levels, either through soil testing or through calculations based on previous crop information. In what was a very good sorghum growing season, yields without N fertiliser were still high, but the N-budget calculated additional application of N fertiliser substantially lifted yield and gross margins well above the nil-N strategy. The split-N strategy provided the best yield and profit outcome, thanks to good in-crop rainfall conditions at the Tamworth site in 2014–15.
At Breeza, the nil-N fertilised grain yield was also good, but adding N fertiliser again substantially increased yields and profit margins. All but two of the alternative product/application strategies examined provided equivalent grain yield to the typical urea side-banded at sowing treatment, so their additional costs (for product or for additional fertiliser spreading) make them less profitable than the current industry practice. Two of the treatments aimed at slower N release resulted in sub-optimal yields, which is a warning that further research is needed to better align N release with N uptake into sorghum grain.
AcknowledgementsThis project was funded by NSW DPI and the Australian Government Department of Agriculture as part project DAN00129: NANORP Filling the Research Gap. Many thanks to Helen Squires, Mandy Holland, and Peter Sanson for assistance with field sampling and measurements, and the Tamworth cereal agronomy team for assistance with crop agronomy. Thanks also to Incitec Pivot Fertilisers Ltd for the supply of Entec®, NV®, and the polymer-coated urea (not currently a commercial product).

NU
TRIT
ION
& S
OIL
S
204 | NORTHERN GRAINS RESEARCH RESULTS 2016
IntroductionThis paper reports the nitrous oxide (N2O) emission results from the 2014–15 grain sorghum trials, which aimed to optimise both nitrogen (N) rate and fertiliser N release to benefit crop production and reduce N2O emissions. The concentration of N2O, a potent greenhouse warming gas, in the atmosphere is increasing, largely as a consequence of increased N inputs into the soil through N fertiliser, legume N2-fixation and manures. Once in the soil, all sources of N are subject to the biologically-driven soil processes of nitrification and denitrification, with soil water content determining the timing and amount of N2O emitted. Emissions are typically characterised by an emissions factor (EF) – the proportion of added N emitted as N2O.
Modern agriculture requires substantial N inputs for sustainable production, so a balance must be found between optimising grain yields and also minimising N2O emissions while producing these yields. Simply aiming to minimise N2O emissions with no regard to continued profitable grain production can result in strategies that are unlikely to be adopted by grain growers. An integrative measure of both emissions and productivity is the emissions intensity (EI), which calculates the quantity of N2O emitted in relation to grain yield produced per hectare.
Trial results from previous years of this project have established that optimising the N-fertiliser rate for optimum grain yield is crucial for minimising N2O, as N applied in excess of crop uptake can lead to exponentially increasing rates of N2O loss (2012–13). In 2013–14, we found that applying urea with a nitrification inhibitor can lead to large reductions in N2O emissions, as can delaying applying urea until the period of rapid crop N uptake (7-leaf stage or booting).
In 2014–15, the trial at the Tamworth site tailored the N fertiliser applied to the amount present in the soil at sowing to assess the reduction in N2O emissions. Different previous crop histories in 2013–14 (sorghum or soybean) led to different N fertiliser rates for sorghum in 2014–15. We also had a nil-N fertiliser rate treatment on each of these previous histories as a background for the N2O emission factor calculations. At Breeza, the treatments focused on comparing alternative slow-release fertilisers, fertiliser blends, and split application strategies. Products used were urea, Entec® (urea + nitrification inhibitor), and polymer-coated urea. These products were all applied either individually or in various blends together at sowing at a total N rate of 90 kg N/ha. We also applied these products individually at 30 kg N/ha at sowing followed by 60 kg N/ha at the 7-leaf stage as either straight urea or urea + NV® (urease inhibitor). Results presented for both sites relate to N2O emissions between sowing and harvest.
Site details2014–15Location: TamworthCo-operator: NSW Department of Primary Industries (Tamworth Agricultural
Institute)Agronomy: MR Bazley sown in 75 cm rows on 28 October 2014, harvested on
6 March 2015In-crop rainfall: 422 mmLocation: BreezaCo-operator: NSW Department of Primary Industries (Liverpool Plains Field
Station)
Strategies to reduce nitrous oxide emissions from nitrogen fertiliser applied to dryland sorghum. Part 2. Nitrous oxide emissionsGraeme Schwenke and Bruce HaighNSW DPI, Tamworth
Key findingsFertiliser nitrogen (N) rates tailored to suit paddock history/soil mineral N levels optimised N2O emissions.
At Tamworth, withholding N fertiliser on a high mineral N soil reduced N2O emissions, but did not optimise grain yield.
At Breeza, most strategies of urea + nitrification inhibitor, polymer-coated urea and split N application substantially reduced N2O emissions. Most alternatives produced similar grain yields to the current practice of urea all applied at sowing, so the N2O emissions intensity per tonne of grain produced was also reduced.
A 1:3 blend of urea + polymer-coated urea all applied at sowing, increased N2O emissions compared with the urea all at sowing treatment. The treatment also reduced grain yield, so potential slow-release treatments need to be carefully evaluated from both an N2O emissions and grain production point of view.

NU
TRIT
ION
& S
OIL
S
INDEPENDENT RESEARCH FOR INDUSTRY | 205
Agronomy: MR Bazley sown on 100 cm rows on 11 November 2014, harvested 20 March 2015
In-crop rainfall: 264 mm
Treatments
Table 1. Treatment details of the Tamworth and Breeza trials in 2014–15
Tamworth Breeza
Name Pre-crop, fertiliser No. N side-banded at sowing N topdressed at booting
sorg_0_N After sorghum, no N applied 1 0 0sorg_+N After sorghum, 120 kg N/ha urea
side-banded at sowing2 90 kg N/ha urea 0
soy_0_N After soybean, no N applied. 3 90 kg N/ha Entec* 0soy_+N After soybean, 40 kg N/ha urea
side-banded at sowing4 90 kg N/ha polymer-urea** 0
sorg_split After sorghum, 40 kg N/ha urea side banded at sowing + 80 kg N/ha topdressed as urea at booting.
5 30 kg N/ha urea + 60 kg N/ha Entec 0
6 30 kg N/ha urea + 60 kg N/ha polymer-urea
0
7 30 kg N/ha urea + 30 kg N/ha Entec + 30 kg N/ha polymer-urea
0
8 30 kg N/ha urea 60 kg N/ha urea9 30 kg N/ha Entec 60 kg N/ha urea10 30 kg N/ha polymer-urea 60 kg N/ha urea11 30 kg N/ha urea 60 kg N/ha NV-urea***12 30 kg N/ha Entec 60 kg N/ha NV-urea13 30 kg N/ha polymer-urea 60 kg N/ha NV-urea
*Entec® is urea coated with the nitrification inhibitor 3,4-dimethylpyrazole phosphate (DMPP) [Incitec Pivot Fertilisers Ltd]
**Polymer-coated urea delays conversion of urea for up to 2 months
***NV®-urea is urea coated with the urease inhibitor N-(n-butyl) thiophosphoric triamide (NBPT). [Incitec Pivot Fertilisers Ltd]
Results – Tamworth• The N fertilised post-sorghum treatment emitted more N2O than the nil-N fertilised
post-sorghum plots (Table 1).• There was no significant difference in cumulative N2O emissions from the N fertilised
versus the nil-N fertilised post-soybean plots, both of which were greater than the nil-N post-sorghum.
• Twice the long-term average rainfall was experienced at this site in December 2014, which was the third wettest December since 1959, with 175 mm rainfall recorded in December out of the 422 mm total over the growing season. In comparison, total rainfall during the previous two growing seasons at the Tamworth site was 322 mm (2012–13) and 226 mm (2013–14). Despite these wetter conditions, the cumulative loss of N2O was less than that measured in the previous two summer seasons for a similar treatment (sorghum +100 kg N/ha), because of different timings and patterns of rainfall in relation to the N demands of the sorghum crop.
• Despite the high rainfall totals this season, the timing and intensity of the rainfall events was generally not sufficient to cause the degree of waterlogging experienced at the site in past seasons. Also, the soil profile in the current season was not fully wet at sowing, so it could accommodate further filling in-season compared with previous seasons, where the in-season rain fell on fully wet profiles that ponded more readily.
• N2O emission factors for the post-sorghum and post-soybean N fertiliser were low (and not significantly different), indicating good synchrony between fertiliser N supply and crop N demand (Table 1).

NU
TRIT
ION
& S
OIL
S
206 | NORTHERN GRAINS RESEARCH RESULTS 2016
Table 1. Grain yield and cumulative N2O emissions summary for the Tamworth trial (2014–15)
Treatment Grain yield (t/ha)
N2O emission (g/ha)
N2O emission factor (%)
Emissions intensity (g N2O/t grain)
Emissions reduction (%)*
sorg_0_N 7.0 a 87 a – 13 a 72 bsorg_+N 10.3 c 309 c 0.19 30 b *soy_0_N 8.3 b 208 b – 25 b 33 asoy_+N 10.2 c 215 bc 0.02 21 ab 30 asorg_split 11.6 d – – – –* Compared with N2O emissions from 120 kg N/ha post-sorghum treatment.
Results – Breeza• Cumulative N2O emission from the standard urea-at-sowing treatment (T2) at this site
was greater than that of the sorghum (120N) treatment at the Tamworth site, despite the drier conditions at Breeza.
• The addition of 33% urea/67% polymer-coated urea mixture all at sowing (T6) led to significantly greater N2O emissions than the 100% urea-at-sowing treatment, particularly between mid-December 2014 and mid-January 2015 (data not shown). It appears that the delayed release of mineral N from the polymer-coated urea continued to supply mineral N during times conducive to emissive losses, whereas the mineral N release from straight urea occurred over a more concentrated period of in time. This treatment also yielded significantly less than the optimum yield, which indicated that disconnect occurred between fertiliser N supply into the soil and crop N uptake.
• N2O emissions from 100% polymer at sowing (T4) were less than the 100% urea-at-sowing treatment (T2), but still greater than most other treatments (Table 2).
• There was still sufficient mineral N in the soil near the end of the season for a noticeable increase in emissions in response to rain in late February 2015 (data not shown), but the similarity of this emission response in all treatments, including the nil-N control, indicates that the mineral N was sourced from soil N mineralisation rather than from N fertiliser additions.
• The urea/polymer-coated mixture applied all at sowing (T6) increased N2O emissions by 44% above that of 100% urea-at-sowing (T2), and therefore gave a higher emission factor (EF).
• All other treatments significantly reduced emissions compared with T2 and therefore lowered EF.
• 100% polymer-coated urea at sowing (T4) reduced emissions by 27% compared with urea-at-sowing (T2).
• Most other options led to reductions of over 50%, which were statistically similar to the amount of reduction measured in the nil-N treatment (T1).
• The reduction in emissions from the 100% Entec® at sowing (T3) was 64%, which is similar to previous trials with Entec in this project.
• There was a trend for both the split urea treatments (T8 and T11) to show greater N2O losses than the splits using either Entec® (T9 and T12) or polymer-urea (T10 and T13).
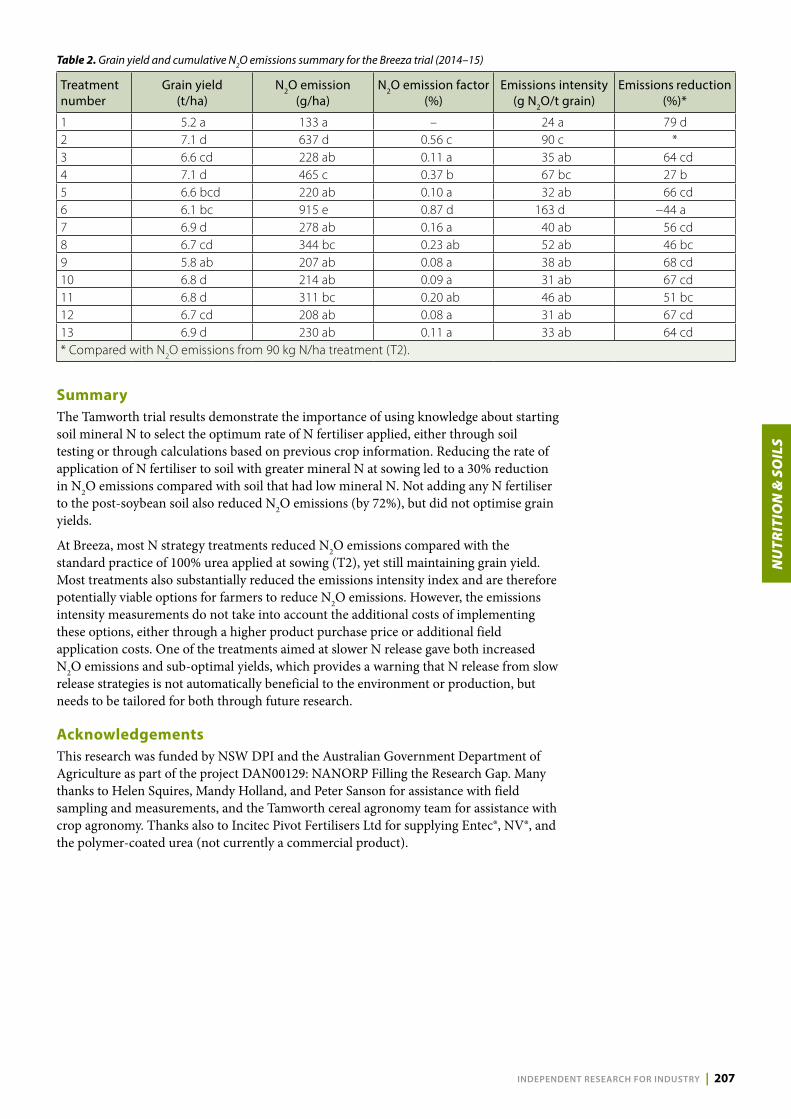
NU
TRIT
ION
& S
OIL
S
INDEPENDENT RESEARCH FOR INDUSTRY | 207
Table 2. Grain yield and cumulative N2O emissions summary for the Breeza trial (2014–15)
Treatment number
Grain yield (t/ha)
N2O emission (g/ha)
N2O emission factor (%)
Emissions intensity (g N2O/t grain)
Emissions reduction (%)*
1 5.2 a 133 a – 24 a 79 d2 7.1 d 637 d 0.56 c 90 c *3 6.6 cd 228 ab 0.11 a 35 ab 64 cd4 7.1 d 465 c 0.37 b 67 bc 27 b5 6.6 bcd 220 ab 0.10 a 32 ab 66 cd6 6.1 bc 915 e 0.87 d 163 d −44 a7 6.9 d 278 ab 0.16 a 40 ab 56 cd8 6.7 cd 344 bc 0.23 ab 52 ab 46 bc9 5.8 ab 207 ab 0.08 a 38 ab 68 cd10 6.8 d 214 ab 0.09 a 31 ab 67 cd11 6.8 d 311 bc 0.20 ab 46 ab 51 bc12 6.7 cd 208 ab 0.08 a 31 ab 67 cd13 6.9 d 230 ab 0.11 a 33 ab 64 cd* Compared with N2O emissions from 90 kg N/ha treatment (T2).
SummaryThe Tamworth trial results demonstrate the importance of using knowledge about starting soil mineral N to select the optimum rate of N fertiliser applied, either through soil testing or through calculations based on previous crop information. Reducing the rate of application of N fertiliser to soil with greater mineral N at sowing led to a 30% reduction in N2O emissions compared with soil that had low mineral N. Not adding any N fertiliser to the post-soybean soil also reduced N2O emissions (by 72%), but did not optimise grain yields.
At Breeza, most N strategy treatments reduced N2O emissions compared with the standard practice of 100% urea applied at sowing (T2), yet still maintaining grain yield. Most treatments also substantially reduced the emissions intensity index and are therefore potentially viable options for farmers to reduce N2O emissions. However, the emissions intensity measurements do not take into account the additional costs of implementing these options, either through a higher product purchase price or additional field application costs. One of the treatments aimed at slower N release gave both increased N2O emissions and sub-optimal yields, which provides a warning that N release from slow release strategies is not automatically beneficial to the environment or production, but needs to be tailored for both through future research.
AcknowledgementsThis research was funded by NSW DPI and the Australian Government Department of Agriculture as part of the project DAN00129: NANORP Filling the Research Gap. Many thanks to Helen Squires, Mandy Holland, and Peter Sanson for assistance with field sampling and measurements, and the Tamworth cereal agronomy team for assistance with crop agronomy. Thanks also to Incitec Pivot Fertilisers Ltd for supplying Entec®, NV®, and the polymer-coated urea (not currently a commercial product).

NU
TRIT
ION
& S
OIL
S
208 | NORTHERN GRAINS RESEARCH RESULTS 2016
Strategies to reduce nitrous oxide emissions from nitrogen fertiliser applied to dryland sorghum. Part 3. Residual impact of N applied in 2013−14 on sorghum grown in 2014−15Graeme Schwenke and Bruce HaighNSW DPI, Tamworth
Key findingsVery dry conditions during the 2013−14 summer meant that much of the nitrogen (N) fertiliser applied was not taken up by the sorghum crop, especially if it had been applied in-crop at booting. Between 46–65% of the applied N remained in the soil at harvest in 2013−14.
A following crop of unfertilised sorghum accessed the remaining N for crop growth and, at rates of 100 kg N/ha and above in the 2013−14 crop, increased grain yield and protein above the control. Late N application by topdressing in the 2013−14 crop gave similar crop production results to treatments where N was side-banded at sowing.
Two-year gross margins showed a significant benefit from N application as urea either at sowing or in-crop.
IntroductionThis paper reports the biomass, grain production, and gross margin results from sorghum grown in 2014−15 on plots where nitrogen (N) fertiliser was applied in 2013−14 and no additional N was applied to the current crop. In 2013−14, we compared current practice (urea side-banded at sowing) with two alternative methods of delaying the availability of soil nitrate N from fertiliser N: 1. applying a nitrification inhibitor with the urea at sowing (Entec®)2. applying urea post-sowing (at booting).There were also three N rates of the urea and the Entec® at sowing treatments. While the 2013−14 crop showed a clear grain yield and protein response to N fertiliser compared with the nil-N control, there was no treatment difference between N rates of 80, 100 or 120 kg/ha applied as either urea or Entec® at sowing. Plots with urea applied post-sowing had grain yields no different from the nil-N control, and the post-sowing Entec® treatment was only marginally better. Grain protein from the two post-sowing N application treatments was also no different from the nil-N control treatment. These results reflected the limited rainfall between when these late N applications were made in December 2013 and grain harvest. Overall, the grain yields for the site were considerably lower than long-term average yields for the region.
A companion trial in 2013−14 using 15N-labelled urea, Entec® and late-applied surface urea, showed that after accounting for N losses and grain N offtake, there was still 46%, 60% and 65% remaining of the N applied as urea-at-sowing, Entec-at-sowing, or post-sowing-urea, respectively. This remaining N was mostly located in the top 10−20 cm of the soil at harvest, with some also present on the surface as crop residues.
Since the poor rainfall in the 2013−14 summer prevented uptake of much of the applied N, we decided to grow unfertilised sorghum on the same trial plots during 2014−15 to assess the residual value of last season’s N application treatments. The crop production and gaseous emissions results from the 2013−14 phase of the trial have been reported previously. This paper focuses on the agronomic results of the trial in the 2014−15 residual year and presents economic data for both years at the site. Gaseous emissions were not measured during this residual N trial.
Site details2014–15Location: TamworthCo-operator: NSW Department of Primary Industries (Tamworth Agricultural
Institute)Agronomy: MR Bazley sown on 75 cm rows on 28 October 2014, harvested
6 March 2015In-crop rain: 422 mm

NU
TRIT
ION
& S
OIL
S
INDEPENDENT RESEARCH FOR INDUSTRY | 209
Treatments
Name 2013−14 fertiliser treatment
Nil_0 no N appliedUrea_80 80 kg N/ha urea side-banded at sowingEntec_80 80 kg N/ha Entec® side-banded at sowingUrea_100 100 kg N/ha urea side-banded at sowingEntec_100 100 kg N/ha Entec® side-banded at sowingUrea_120 120 kg N/ha urea side-banded at sowingEntec_120 120 kg N/ha Entec® side-banded at sowingUrea_0+100 100 kg N/ha urea side-banded at sowingEntec_0+100 100 kg N/ha Entec® side-banded at sowingEntec® is urea coated with the nitrification inhibitor 3,4-dimethylpyrazole phosphate (DMPP) [Incitec Pivot Fertilisers Ltd]
Results• Biomass cuts at plant anthesis showed that, except for the urea_80 and Entec_80
treatments, all treatments were not significantly different in biomass from the nil-N control (Figure 1–left).
• Biomass N concentration showed a different pattern however, with the nil-N control and the two 80 kg N/ha treatments significantly lower in N content than all other treatments (Figure 1–right).
• Previous N treatment also affected the number of tillers per hectare, with the least number of tillers in the nil-N plots and the most in the two 80 kg N/ha treatments, with all others in between these extremes (data not shown).
Nil Urea80
Entec80
Urea100
Entec100
Urea120
Entec120
Urea0+100
Entec0+100
Nil Urea80
Entec80
Urea100
Entec100
Urea120
Entec120
Urea0+100
Entec0+100
0
2
4
6
8
10
12
14
16
Biom
ass
dry
mat
ter (
t/ha
)
0
0.2
0.4
0.6
0.8
1.0
1.2
1.4
1.6
1.8
2.0
Biom
ass
N c
once
ntra
tion
(%)
Figure 1. Plant biomass (left) and biomass N concentration (right) in the Tamworth residual nitrogen trial at flowering
• The grain yield and grain protein results indicate that any residual effect of the 80 kg N/ha urea or Entec® treatments had been used up in vegetative growth, thus not available to increase yield or protein levels (Figure 2).
• The higher N rate treatments of 100 kg N/ha and 120 kg N/ha left sufficient residual N in the soil to benefit both yield and protein more than 12 months after it was applied.
• The highest yield and protein was obtained where the N fertiliser was applied at booting in the previous crop and had not had sufficient rainfall to affect yield or protein last season. This appears to have higher residual N levels to benefit yield and grain protein levels in the subsequent sorghum crop.
• Gross margins for this trial covered both years of crop growth. For the second year of cropping in the trial area, there were no N fertiliser input costs as these were incurred in the first year, but all other inputs of sowing, harvesting, spraying, seed, P fertiliser, herbicides etc. were included as variable costs.
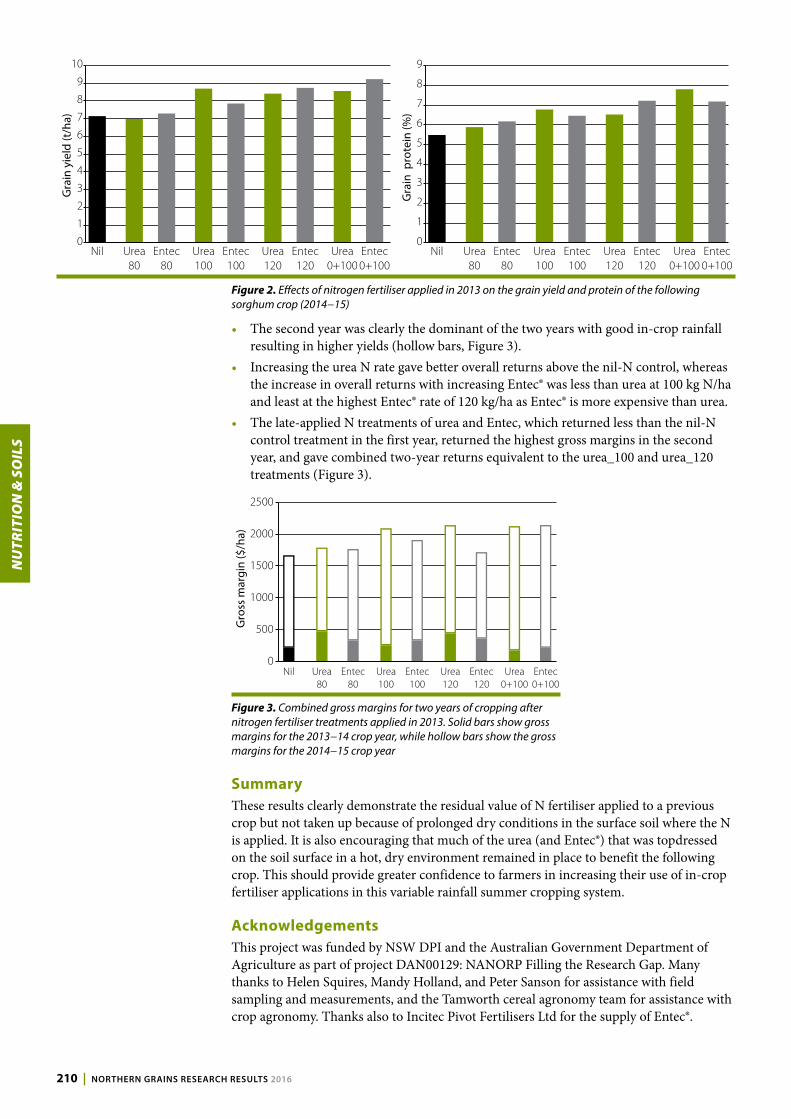
NU
TRIT
ION
& S
OIL
S
210 | NORTHERN GRAINS RESEARCH RESULTS 2016
0
1
2
3
4
5
6
7
8
9
10
Nil Urea80
Entec80
Urea100
Entec100
Urea120
Entec120
Urea0+100
Entec0+100
Gra
in y
ield
(t/h
a)
0
1
2
3
4
5
6
7
8
9
Nil Urea80
Entec80
Urea100
Entec100
Urea120
Entec120
Urea0+100
Entec0+100
Gra
in p
rote
in (%
)
Figure 2. Effects of nitrogen fertiliser applied in 2013 on the grain yield and protein of the following sorghum crop (2014−15)
• The second year was clearly the dominant of the two years with good in-crop rainfall resulting in higher yields (hollow bars, Figure 3).
• Increasing the urea N rate gave better overall returns above the nil-N control, whereas the increase in overall returns with increasing Entec® was less than urea at 100 kg N/ha and least at the highest Entec® rate of 120 kg/ha as Entec® is more expensive than urea.
• The late-applied N treatments of urea and Entec, which returned less than the nil-N control treatment in the first year, returned the highest gross margins in the second year, and gave combined two-year returns equivalent to the urea_100 and urea_120 treatments (Figure 3).
0
500
1000
1500
2000
2500
Gro
ss m
argi
n ($
/ha)
Nil Urea80
Entec80
Urea100
Entec100
Urea120
Entec120
Urea0+100
Entec0+100
Figure 3. Combined gross margins for two years of cropping after nitrogen fertiliser treatments applied in 2013. Solid bars show gross margins for the 2013−14 crop year, while hollow bars show the gross margins for the 2014−15 crop year
SummaryThese results clearly demonstrate the residual value of N fertiliser applied to a previous crop but not taken up because of prolonged dry conditions in the surface soil where the N is applied. It is also encouraging that much of the urea (and Entec®) that was topdressed on the soil surface in a hot, dry environment remained in place to benefit the following crop. This should provide greater confidence to farmers in increasing their use of in-crop fertiliser applications in this variable rainfall summer cropping system.
AcknowledgementsThis project was funded by NSW DPI and the Australian Government Department of Agriculture as part of project DAN00129: NANORP Filling the Research Gap. Many thanks to Helen Squires, Mandy Holland, and Peter Sanson for assistance with field sampling and measurements, and the Tamworth cereal agronomy team for assistance with crop agronomy. Thanks also to Incitec Pivot Fertilisers Ltd for the supply of Entec®.
NU
TRIT
ION
& S
OIL
S
INDEPENDENT RESEARCH FOR INDUSTRY | 211
Strategies to reduce nitrous oxide emissions from nitrogen fertiliser applied to dryland sorghum. Part 4. Using 15N to discover the fate of N fertiliserGraeme Schwenke and Bruce HaighNSW DPI, Tamworth
IntroductionDuring the past three years we have used isotope-labelled (15N) urea fertiliser to trace the fate of applied nitrogen (N) in six season-long mini-plot field experiments with sorghum near Tamworth and Quirindi/Breeza in NSW. Normal N fertiliser contains 14N, so using 15N allows us to trace the urea-N applied into the harvested grain, the plant residues, large roots, and the soil profile after harvest. Due to its high cost, we used a 10% blend of 15N with 90% 14N fertiliser, which is a high enough ratio for us to easily identify and trace the fate of the applied N fertiliser. The difference between what we applied and the total of what we were able to find, either in the plant at harvest or in the soil post-harvest, was generally assumed to be N lost by denitrification when urea was mixed/banded into the soil at sowing. In treatments where we split the N application between banding at sowing and topdressing at the 7-leaf stage, some of the N loss could have occurred as ammonia volatilisation from the topdressing application.
At harvest, adjacent crop rows were sampled to quantify any applied N had been scavenged. We also excavated all the soil in the whole row-width around the application band to account for possible lateral movement of the 15N. The mini-plots used for these experiments were either 0.75 m2 or 1.0 m2 and had raised steel borders to minimise surface runoff as a possible loss pathway. Possible leaching of applied N as nitrate in soil water was accounted for by deep coring to 150 cm depth.
Trials conducted in 2012–13 using 15N applied at three N rates (40, 120 and 200 kg N/ha) were reported previously, but those results are repeated here for comparison with more recent trial results.
Trials in 2013–14 compared urea applied at 100 kg N/ha as either:1. urea side-banded at sowing2. urea topdressed at 7-leaf stage3. Entec® urea side-banded at sowing.Entec® urea is urea coated with the nitrification inhibitor 3,4-dimethylpyrazole phosphate (DMPP) [Incitec Pivot Fertilisers Ltd]. Trials were run at Tamworth and Quirindi.
In 2014–15, our treatments compared urea added at sowing, and urea split between sowing (33%) and 7-leaf stage topdressing (67%). At the Tamworth site, there were also two different N rates applied, depending on whether the previous crop was sorghum (120 kg N/ha) or soybean (40 kg N/ha). At Breeza, there was just one N rate (90 kg N/ha).
Site details2012–13Location: TamworthCo-operator: NSW Department of Primary Industries (Tamworth Agricultural
Institute)Agronomy: MR Bazley sown on 75 cm rows on 23 October 2012, harvested on
21 March 2013In-crop rainfall: 322 mmLocation: QuirindiCo-operator: Ian Carter (Romney Vale)Agronomy: MR Bazley sown on 75 cm rows on 8 December 2012,
harvested on 3 March 2013
Key findingsFor three seasons, we applied isotope-labelled urea (15N) to sorghum in small (0.75–1.0 m2) plots, then calculated nitrogen (N) recovery by comparing the amount applied with the total 15N found in grain, crop residues and soil.
Between 55–85% of the N fertiliser applied was recovered at harvest, meaning a 15–45% loss, presumably during wet soil conditions when nitrate denitrification led to N2 and N2O gaseous losses.
In very wet conditions, little of the applied N remained in the soil at harvest, while in a dry season there was more of the applied N found in the soil at harvest than in the plant.

NU
TRIT
ION
& S
OIL
S
212 | NORTHERN GRAINS RESEARCH RESULTS 2016
In-crop rainfall: 407 mm2013–14Location: TamworthCo-operator: NSW Department of Primary Industries (Tamworth Agricultural
Institute)Agronomy: MR Bazley sown on 75 cm rows on 5 November 2013,
harvested on 10 March 2014In-crop rainfall: 226 mmLocation: QuirindiCo-operator: Ian Carter (Romney Vale)Agronomy: MR Bazley sown on 75 cm rows on 22 October 2013,
harvested on 19 March 2014In-crop rainfall: 183 mm2014–15Location: TamworthCo-operator: NSW Department of Primary Industries (Tamworth Agricultural
Institute)Agronomy: MR Bazley sown on 75 cm rows on 28 October 2014,
harvested on 6 March 2015In-crop rainfall: 422 mm.Location: BreezaCo-operator: NSW Department of Primary Industries (Liverpool Plains Field
Station)Agronomy: MR Bazley sown on 100 cm rows on 11 November 2014, harvested
on 20 March 2015In-crop rainfall: 264 mm
Treatments
Tamworth 2012–13 Quirindi 2012–13
40 kg N/ha urea side-banded at sowing 40 kg N/ha urea side-banded at sowing120 kg N/ha urea side-banded at sowing 120 kg N/ha urea side-banded at sowing200 kg N/ha urea side-banded at sowing 200 kg N/ha urea side-banded at sowing
Tamworth 2013–14 Quirindi 2013–14
100 kg N/ha urea side-banded at sowing 100 kg N/ha urea side-banded at sowing100 kg N/ha Entec® urea side-banded at sowing
100 kg N/ha Entec® urea side-banded at sowing
100 kg N/ha urea topdressed at 7-leaf stage 100 kg N/ha urea topdressed at 7-leaf stage
Tamworth 2014–15 Breeza 2014–15
Name Pre-crop, fertiliser N side-banded at sowing
N topdressed at booting
sorg_+N After sorghum, 120 kg N/ha urea side-banded at sowing
90 kg N/ha urea 0
soy_+N After soybean, 40 kg N/ha urea side-banded at sowing
30 kg N/ha urea 60 kg N/ha urea
sorg_split After sorghum, 40 kg N/ha urea side banded at sowing + 80 kg N/ha topdressed as urea at booting.
soy_split After soybean, 10 kg N/ha urea side banded at sowing + 30 kg N/ha topdressed as urea at booting.

NU
TRIT
ION
& S
OIL
S
INDEPENDENT RESEARCH FOR INDUSTRY | 213
Results2012–13• Total N loss (as N2 + N2O) was 28–45% of applied N (Figure 1). All loss was assumed
to be through denitrification since the fertiliser was incorporated to prevent volatilisation, and no 15N was detected below 60 cm depth, so no leaching occurred. The metal sides of the mini-plots prevented surface runoff losses. The 2–10% of applied 15N detected in the adjoining plant rows was included with the plot grain and crop residue values.
• At the Tamworth (drier) site, there was no effect from N fertiliser rate on the proportion lost (21%; Figure 1–left).
• At the Quirindi (wetter) site, N losses were 43%, 44% and 27% from the 40, 120 and 200 kg N/ha treatments, respectively (Figure 1–right). It is likely that the proportion lost from the 200 kg N/ha rate was lower either because the denitrification process became carbon limited, or because some of the excess nitrate N moved lower down the soil profile during the heavy rainfall period rather than being denitrified. As a result, some of the excess N was available late in the season for uptake leading to increased grain protein in this treatment at Quirindi.
-50
0
50
100
150
200
40 120 200
Fate
of 15
N a
pplie
d (k
g N
/ha)
N lost
Grain
Stem & leaf
Soil 30-60 cm
Soil 20-30 cm
Soil 10-20 cm
Soil 0-10 cm
Large root
-50
0
50
100
150
200
40 120 200
Nitrogen applied (kg N/ha) Nitrogen applied (kg N/ha)
Tamworth Quirindi
Average0.51% N
2O
19.7% N2
2.4% N2O
40.9% N2
1.5% N2O
43.5% N2
3.2% N2O
24.9% N2
Figure 1. Fate of applied 15N in trials at Tamworth (left) and Quirindi (right) in the 2012–13 sorghum season. At both trials, rates of N applied were 40, 120 and 200 kg N/ha side-banded at sowing. Loss percentages written on graphs are estimates of N lost through nitrous oxide (N2O) and di-nitrogen (N2) during denitrification
2013–14• At the Tamworth site, there was an average N loss of 26%, with no difference in total N
loss between the three treatments. However, there were distinct treatment differences in the fate of the recovered N (Figure 2–left).
• Only 10% of the N applied was found in plant tissue at harvest when urea was applied at the 7-leaf stage, compared with an average of 36% of the fertiliser N in the plant when N was applied at sowing. This is because there was only one rainfall event after the late-applied N fertiliser, and therefore limited opportunity for plant uptake of the top-dressed N.
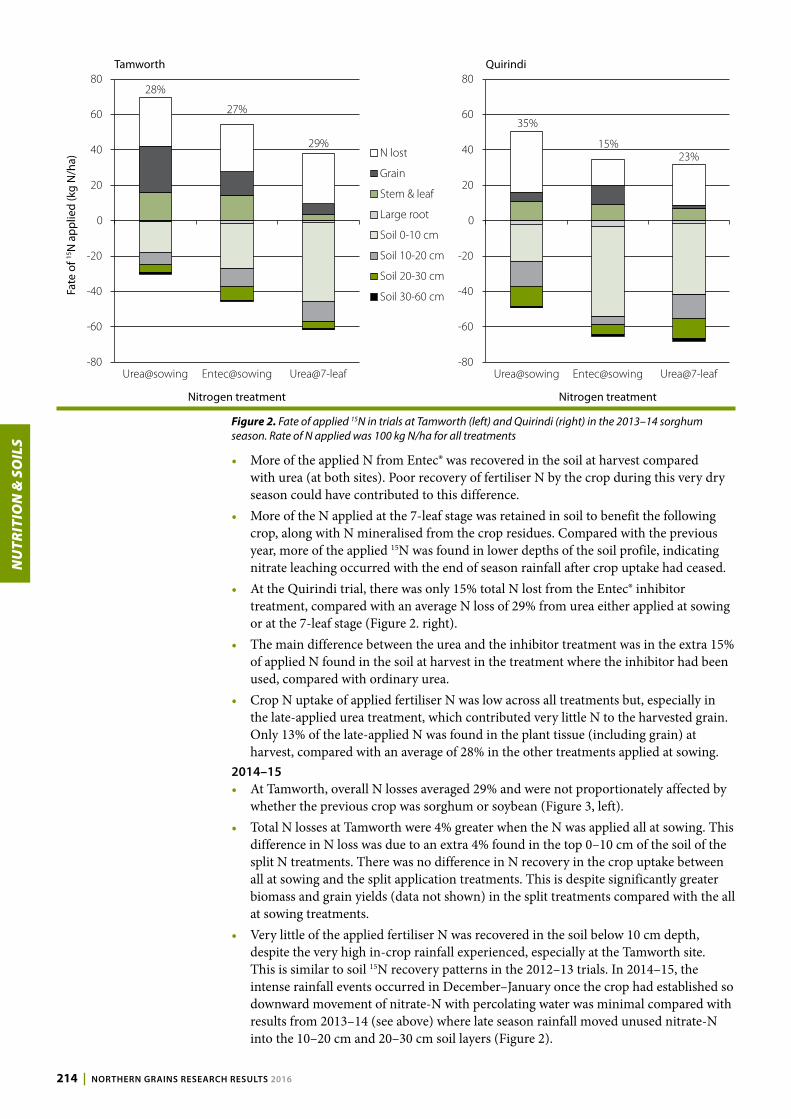
NU
TRIT
ION
& S
OIL
S
214 | NORTHERN GRAINS RESEARCH RESULTS 2016
N lost
Grain
Stem & leaf
Soil 30-60 cm
Soil 20-30 cm
Soil 10-20 cm
Soil 0-10 cm
Large root
Tamworth Quirindi
-80
-60
-40
-20
0
20
40
60
80
Urea@sowing Entec@sowing Urea@7-leaf-80
-60
-40
-20
0
20
40
60
80
Urea@sowing Entec@sowing Urea@7-leaf
Fate
of 15
N a
pplie
d (k
g N
/ha)
28%
23%15%
35%
29%
27%
Nitrogen treatment Nitrogen treatment
Figure 2. Fate of applied 15N in trials at Tamworth (left) and Quirindi (right) in the 2013–14 sorghum season. Rate of N applied was 100 kg N/ha for all treatments
• More of the applied N from Entec® was recovered in the soil at harvest compared with urea (at both sites). Poor recovery of fertiliser N by the crop during this very dry season could have contributed to this difference.
• More of the N applied at the 7-leaf stage was retained in soil to benefit the following crop, along with N mineralised from the crop residues. Compared with the previous year, more of the applied 15N was found in lower depths of the soil profile, indicating nitrate leaching occurred with the end of season rainfall after crop uptake had ceased.
• At the Quirindi trial, there was only 15% total N lost from the Entec® inhibitor treatment, compared with an average N loss of 29% from urea either applied at sowing or at the 7-leaf stage (Figure 2. right).
• The main difference between the urea and the inhibitor treatment was in the extra 15% of applied N found in the soil at harvest in the treatment where the inhibitor had been used, compared with ordinary urea.
• Crop N uptake of applied fertiliser N was low across all treatments but, especially in the late-applied urea treatment, which contributed very little N to the harvested grain. Only 13% of the late-applied N was found in the plant tissue (including grain) at harvest, compared with an average of 28% in the other treatments applied at sowing.
2014–15• At Tamworth, overall N losses averaged 29% and were not proportionately affected by
whether the previous crop was sorghum or soybean (Figure 3, left).• Total N losses at Tamworth were 4% greater when the N was applied all at sowing. This
difference in N loss was due to an extra 4% found in the top 0–10 cm of the soil of the split N treatments. There was no difference in N recovery in the crop uptake between all at sowing and the split application treatments. This is despite significantly greater biomass and grain yields (data not shown) in the split treatments compared with the all at sowing treatments.
• Very little of the applied fertiliser N was recovered in the soil below 10 cm depth, despite the very high in-crop rainfall experienced, especially at the Tamworth site. This is similar to soil 15N recovery patterns in the 2012–13 trials. In 2014–15, the intense rainfall events occurred in December–January once the crop had established so downward movement of nitrate-N with percolating water was minimal compared with results from 2013–14 (see above) where late season rainfall moved unused nitrate-N into the 10–20 cm and 20–30 cm soil layers (Figure 2).

NU
TRIT
ION
& S
OIL
S
INDEPENDENT RESEARCH FOR INDUSTRY | 215
• At Quirindi there was a 4% greater loss from the split application treatment, which was primarily due to less of the applied 15N being recovered from the 0–10 cm soil depth (Figure 3–right). There was less rainfall in total at Quirindi and none for six days after the topdressing application, so ammonia volatilisation could have contributed to the N loss in this trial.
-40
-20
0
20
40
60
80
100
120
-40
-20
0
20
40
60
80
100
120
@ sowing splitsorg_splitsorg_+N soy_+N soy_split
Tamworth Breeza
Fate
of 15
N a
pplie
d (k
g N
/ha)
Nitrogen treatment Nitrogen treatment
N lost
Grain
Stem & leaf
Soil 30-60 cm
Soil 20-30 cm
Soil 10-20 cm
Soil 0-10 cm
Large root32%
37%
28%
27%30%
33%
Figure 3. Fate of applied 15N in trials at Tamworth (left) and Breeza (right) in the 2014–15 sorghum season. Rate of N applied was 120 kg N/ha (post-sorghum) and 40 kg N/ha (post-soybean) at Tamworth; and 90 kg N/ha at Breeza
SummaryIn three very different sorghum seasons in terms of rainfall conditions, our 15N trials have shown total N losses were 15–45% depending on the N application strategy. Total N loss results were often surprising, with those from the very dry 2013–14 season higher than expected, probably because of late rainfall events on unused soil nitrate, while those from the very wet 2014–15 season were perhaps lower than expected, probably because the intensive rainfall conditions occurred after the crop had established and already taken up much of the 15N applied.
In 2012–13, increasing the rate of applied N led to more N loss, especially in the very wet Quirindi trial, but losses from the 200 kg N/ha rate treatment could have been limited by available carbon at the soil surface.
In 2013–14, strategies employed to delay the availability of soil nitrate during the initial two months before rapid crop N uptake, were found to either reduce total N loss compared with the standard urea applied all at sowing (Breeza), or were no different in terms of N loss (Tamworth). Both trials found the Entec® treatment retained more of the applied N in the soil at harvest. The delayed urea application strategy led to poor crop N uptake due to prolonged dry conditions post-application, but much of the applied N was recovered in, or returned to, soil in crop residues after harvest.
The split N strategy examined in 2014–15 slightly reduced total N loss at Tamworth, compared with the all at sowing standard practice, with the difference being related to more N retained in the soil at harvest. The opposite effect was found in the Breeza trial where dry conditions after applying N as topdressing most likely led to losses through ammonia volatilisation.
It should be remembered that the 15N recovered in the grain, crop residue and soil represent only the N applied as fertiliser and does not include the uptake of N sourced from mineralisation of soil organic matter and previous crop residues.

NU
TRIT
ION
& S
OIL
S
216 | NORTHERN GRAINS RESEARCH RESULTS 2016
AcknowledgementsThis project was funded by NSW DPI and the Australian Government Department of Agriculture as part of project DAN00129: NANORP filling the research gap. Many thanks to Annabelle McPherson, Bill Keene, Kamal Hossain, Helen Squires, Mandy Holland, and Peter Sanson for assistance with field sampling and measurements, and the Tamworth cereal agronomy team for assistance with crop agronomy. Thanks also to Incitec Pivot Fertilisers Ltd for the supply of Entec®, NV®, and the polymer-coated urea (not currently a commercial product).

NU
TRIT
ION
& S
OIL
S
INDEPENDENT RESEARCH FOR INDUSTRY | 217
IntroductionIrrigated maize production remains a minor crop in the northern grains region. Matching optimum nitrogen (N) nutrition to irrigation water is essential to ensure the maximum efficiency from inputs is achieved.
The trial outlined below was designed to compare grain yield responses with variations in three maize hybrids and six nitrogen rates under raised-bed flood irrigation at Breeza on the Liverpool Plains. A dryland site was also planted at Gurley in the 2014–15 season.
Site detailsLocation: Liverpool Plains Field Station, BreezaCo-operator: NSW DPISowing date: 21 November 2014Plant population: 70,000 plants/haFertiliser: 42 kg/ha Triple Super at sowingHarvest date: 30 April 2015Planter: Monosem precision planterStarting soil water and irrigationsThe site was cored pre-sowing to establish starting soil water. It was measured as 121 mm of plant available water (PAW) to a depth of 1.2 m.
Three in-crop irrigations were applied on:1. 30 January, 20152. 16 February, 20153. 3 March, 2015Starting nutritionThe site was cored just before sowing to determine starting soil nutrition (Table 1). The available soil nitrate N was estimated to be 145 kg N/ha to a depth of 1.2 m.
Table 1. Starting soil nutrition at Breeza
Depth (cm)
Nitrate (mg/kg)
Colwell P (mg/kg)
Colwell K (mg/kg)
Sulfur (mg/kg)
Organic carbon (%)
Conductivity (dS/m)
pH Level (CaCl2)
0–10 16 49 562 7.4 1.17 0.211 7.710–30 11 23 371 8.9 0.80 0.277 7.930–60 4 – – – – – –60–90 3 – – – – – –90–120 2 – – – – – –
TreatmentsMaize hybrids1. P10702. P14673. PAC606Nitrogen ratesNitrogen rates were selected to target a yield potential of 12 t/ha.
Treatments were applied as urea at sowing for treatments 1–5. Treatment six had urea applied half at sowing and the other half was surface spread in crop.
1. 0 kg N/ha
Maize nitrogen application rate × hybrid under irrigation – Breeza 2014–15Loretta Serafin, Mark Hellyer and Peter PerfrementNSW DPI, Tamworth
Key findingsThere was no difference in the yield performance of the three hybrids. Differences between the hybrids were evident for cob number and grain quality only.
The highest maize yields were obtained from the 150 kg N/ha, 200 kg N/ha at sowing and the 75:75 kg N/ha split nitrogen (N) treatments, which all produced similar yields.

NU
TRIT
ION
& S
OIL
S
218 | NORTHERN GRAINS RESEARCH RESULTS 2016
2. 50 kg N/ha3. 100 kg N/ha4. 150 kg N/ha5. 200 kg N/ha6. 75 kg N/ha: 75 kg N/ha split – applied at sowing and at 6–8-leaf stage.
ResultsThere was no difference in plant establishment across the six nitrogen application rates. However, there was a difference in the establishment of the different hybrids. The pioneer hybrid P1070 established fewer plants and also produced fewer cobs/ha than P1467 or PAC606 (Table 2).
Varying hybrid selection had no other effect on dry matter production, cobs/plant, tiller numbers or yield (data not shown).
Differences were evident between grain quality parameters though, with P1467 having a higher 1000 grain weight than PAC606; P1070 was the lowest. Screening levels were generally low, but P1467 was significantly higher than the other two hybrids. P1070 had the highest test weight, followed by P1467 and then PAC606 (Table 2).
Table 2. Varying hybrid effect on plant establishment, cob number and grain quality
Hybrid Plant establishment (plants/ha)
Cob number (cobs/ha)
1000 grain weight (g)
Screenings (%)
Test weight (kg/hL)
P1070 63,190 b 62,220 b 286.0 c 1.29 b 79.32 aP1467 70,830 a 68,330 a 326.7 a 1.96 a 78.42 bPAC 606 73,330 a 70,690 a 317.4 b 0.96 b 75.83 cValues followed by the same letter are not significantly different at the 95% confidence levels (P=0.05)
Varying the nitrogen application rate had a bigger impact on plant structures and grain yield than hybrid selection. The nil nitrogen treatment produced significantly less dry matter than any other nitrogen treatment (Table 3).
The nitrogen application treatments resulted in significant differences in tillering and cob numbers, but the response did not follow a clear trend.
Final grain yields (adjusted to 14% moisture) were disappointing on the whole. However, they showed a strong response to increasing nitrogen application rate. There was no significant difference in the yield of the 150 kg N/ha, 200 kg N/ha at sowing and 75:75 kg N/ha split N treatments, which all produced a similar yield.
The same response to nitrogen application rate was measured with test weight (Table 3). Test weight was lowest in the nil N treatment, which increased incrementally up to 100 kg N/ha (Table 3).
The 1000 grain weight generally increased as the nitrogen application rate increased.
Screenings were very low on average across the site at 1.40%. Adding N resulted in lower screenings levels than the nil treatment (Table 3).

NU
TRIT
ION
& S
OIL
S
INDEPENDENT RESEARCH FOR INDUSTRY | 219
Table 3. Varying nitrogen rate effect dry matter production, tiller and cob number, yield and grain quality
Nitrogen rate (kg/ha)
Dry matter (t/ha)
Tiller number Cob number Yield (t/ha)
1000 grain weight (g)
Screenings (%)
Test weight (kg/hL)(tillers/ha) (tillers/
plant)(cobs/ha) (cobs/
plant)
0 7.33 b 38,890 bc 0.05 bc 562.7 bc 0.94 bc 2.28 d 267.4 e 2.68 a 75.92 d50 10.72 a 11,110 c 0.01 c 162.1 c 0.93 c 4.42 c 285.5 d 1.52 b 77.30 c100 10.66 a 50,000 ab 0.07 ab 740.0 ab 0.98 ab 5.31 b 298.7 c 0.91 b 78.21 b150 11.96 a 36,110 bc 0.05 bc 510.6 bc 0.98 ab 6.05 ab 330.8 b 1.13 b 78.29 ab200 10.69 a 55,560 ab 0.08 ab 821.0 ab 1.00 a 6.64 a 347.0 a 0.95 b 78.99 a75:75 12.51 a 69,440 a 0.11 a 1079.1 a 1.00 a 6.36 a 331.0 b 1.22 b 78.43 abValues followed by the same letter are not significantly different at the 95% confidence levels (P=0.05)
SummaryThe grain yields in this irrigated maize trial were disappointing, especially considering that three in-crop irrigations were applied during the growing season. However, a significant response to nitrogen application was still evident with the 150 kg N/ha, 200 kg N/ha at sowing and 75:75 kg N/ha split N treatments all producing the highest yield.
Dry matter production responded well to N application, but this was only from adding any N over the nil treatment, with no incremental increase evident with higher application rates.
There was no difference in the yield performance of the three maize hybrids. Differences between the hybrids were evident for cob number and grain quality only.
In conclusion, this trial should be repeated in another season under irrigated conditions to try and improve overall crop performance and validate these responses across different seasons and sites.
AcknowledgementsThis research was co-funded by NSW DPI and GRDC under project DAN00195: Tactical sorghum and maize agronomy. Thanks to Scott Goodworth and Steve Jengos, NSW DPI for assisting with site management at the Liverpool Plains Field Station. Thanks to Pioneer Hi-Bred and Pacific Seeds for the supply of trial seed. The technical assistance of the following NSW DPI staff are gratefully acknowledged; Delphi Ramsden, Michael Dal Santo, and former staff, Nicole Carrigan and Angus Hombsch.

NU
TRIT
ION
& S
OIL
S
220 | NORTHERN GRAINS RESEARCH RESULTS 2016
Northern NSW pulse agronomy project – nutrition in chickpea 2015Andrew Verrell1 and Leigh Jenkins2
1 NSW DPI, Tamworth 2 NSW DPI, Trangie
Key findingsPhosphorus (P) was a limiting factor to chickpea yield at four of the seven trial sites in 2015.
Zinc (Zn) limited chickpea yield in three trial locations in 2015.
Waterlogged induced iron (Fe) deficiency was a limiting factor to chickpea yield on a grey–brown vertosol with a 50 year cropping history.
IntroductionThe 2015 season was characterised by episodic cold weather events during flowering and terminal drought during grain filling. These seasonal conditions had considerable impact, reducing the potential yield of chickpeas across most areas of the northern NSW cropping zone.
The Northern Pulse Agronomy Initiative project had a range of experiments covering a number of agronomic themes in 2015. This paper reports on the outcomes of the nutrition experiments conducted across northern NSW in 2015.
Site detailsThis experiment was conducted at seven experimental locations; North Star, Moree, Rowena, Edgeroi, Coonamble, Nowley and Trangie. Soil chemistry parameters for a selection of sites, is contained in Table 1.
TreatmentsNutrients were applied in a nutrient omission format. In nutrient omission trials, one nutrient is deliberately omitted in each treatment, while all other nutrients are applied at rates considered as non-limiting. It is therefore not possible to determine optimum nutrient application rates directly from the results of these experiments.
The 12 treatments were: 1. zero nutrients 7. −B2. all nutrients 8. −Cu3. −N 9 −Zn4. −P 10. −Mn5. −K 11. −Mg6. −Ca 12. −FeThe application method varied between nutrients. Both phosphorus (P) and nitrogen (N) were applied at sowing, at 10 kg P/ha as Trifos and 10 kg N/ha as urea, respectively. Calcium (Ca), magnesium (Mg), zinc (Zn), manganese (Mn), copper (Cu) and iron (Fe) were applied as chelates in a foliar spray. Potassium (K) was applied as potassium citrate and boron (B) as boron ethanolamine as foliar sprays. Besides N and P (applied at sowing), all other nutrients were sprayed on the crop at the mid-vegetative period.
PBA HatTrickA was used as the chickpea variety for all trial sites and sown at a target plant population of 30 plants/m2. There were three replicates of each treatment at each site.
Table 1. Selected soil chemistry parameters for four experimental sites in northern NSW in 2015
Parameter Units North Star Moree Edgeroi Nowley
0–10 cm 10–30 cm 0–10 cm 10–30 cm 0–10 cm 10–30 cm 0–10 cm 10–30 cm
pH (1:5 in CaCl2) pH 7.69 7.98 5.76 7.56 7.40 7.82 7.28 7.67Organic carbon % 0.57 0.44 0.50 0.38 0.60 0.39 1.47 1.10Phosphorus (Colwell) mg/kg 15.4 10.6 19.9 11.0 18.8 9.66 28.5 9.88Ext. phosphorus(BSES) mg/kg 42.1 26.7 38.0 29.9 202 187 271 240Extractable zinc mg/kg 1.02 1.04 0.81 0.68 0.69 1.14 1.46 1.25Extractable iron mg/kg 10.6 11.6 30.2 17.9 22.0 24.3 19.5 29.5

NU
TRIT
ION
& S
OIL
S
INDEPENDENT RESEARCH FOR INDUSTRY | 221
ResultsThe Trangie, Edgeroi and Coonamble sites showed yield responses to applied Zn of 28%, 18% and 7%, respectively. Coonamble, Nowley, Moree and North Star had responses to applied P of 4%, 15%, 15% and 11%, respectively (Table 2). The trial at Rowena showed no significant grain yield responses to any of the applied nutrients.
The Coonamble site, which has a grey–brown vertosol that has been cropped since the early 1960s, also showed an 8% yield response to applied Fe, likely due to Fe deficiency induced by early waterlogging.
None of the seven sites had a significant yield response to K, Ca, B, Cu, Mn or Mg (data not presented).
Table 2. Effect of selected nutrient omission treatments on grain yield (kg/ha) in chickpea at seven sites in northern NSW in 2015
Treatment Grain yield (kg/ha)
Trangie Rowena Edgeroi Coonamble Nowley Moree North Star
Minus Zn 559 b 788 a 1498 b 1816 b 1619 a 1928 a 2129 aMinus P 626 ab 986 a 1613 ab 1864 b 1425 b 1697 b 2005 bMinus Fe 678 a 852 a 1600 ab 1804 b 1588 ab 1891 a 2112 abAll 714 a 1019 a 1772 a 1947 a 1643 a 1956 a 2226 aValues with the same letter are not significantly different at P <0.05
• Frosts and cold periods during flowering at sites led to floral abortion and a reduced yield.
• Extended dry periods at sites during September and October led to pod and seed abortion.
• Older cropping country generally appeared to show responses to applied P as well as Zn.
• Waterlogging might induce Fe deficiency on vertosols.
SummaryResponses to phosphorus application in chickpeas have been evident in trial sites located on older cropped country for the past two years. Responses to Zn were evident at trial sites in 2015 which were located in paddocks with a longer history of crop production. If growers are unsure of whether their paddocks will respond to applied fertiliser they should conduct soil tests and are also advised to establish a simple test strip and monitor crop response.
AcknowledgementsThe research undertaken as part of project DAN00171: Northern pulse agronomy – NSW, is made possible by the significant contributions of growers through both trial co-operation and the support of the GRDC. The authors would like to thank them for their continued support. Thanks to Mat Grinter, Michael Nowland, Jayne Jenkins and Scott Richards (all NSW DPI) for their technical assistance in the trial program.