Northern Beaches Hospital Connectivity and Network … · 2016-06-09 · Hydrology, surface water...
28
Northern Beaches Hospital Road Connectivity and Network Enhancement Project Stage 2 Environmental Impact Statement: Volume 1 Chapter 16 July 2015
Transcript of Northern Beaches Hospital Connectivity and Network … · 2016-06-09 · Hydrology, surface water...
Northern Beaches Hospital Road Connectivity and Network Enhancement Project Stage 2
Environmental Impact Statement: Volume 1 Chapter 16
July 2015


Northern Beaches Hospital Road Connectivity and Network Enhancements Project – Environmental Impact Statement Roads and Maritime Services
333
Hydrology, surface water quality and 16flooding
This Section provides an assessment of impacts to hydrology, water quality and flooding for the Stage 2 Project as identified in the SEARs.
The assessment is supported by detailed investigations, which have been documented in the Hydrology, surface water and flooding: Northern Beaches Hospital Connectivity and Network Enhancement Project – Stage 2 Project (GHD, 2014) (refer to Appendix L).
The proposed management and mitigation measures in this section are collated in Section 21.
Secretary’s environmental assessment requirements Where addressed
Water quantity and stormwater impacts including: · A hydraulic/hydrological study of the impacts on Council’s stormwater drainage system · Potential impacts of road widening and decreased permeability on downstream
catchments and wetlands · Impacts on water flows into and surrounding The Forest High School and Frenchs
Forest Public School · Impacts on groundwater recharge and flow path · Details of any work likely to intercept, connect with or infiltrate groundwater services
and of any proposed groundwater extraction, and · Measures to mitigate or prevent an increase in downstream stormwater flows.
Section 16.4 Appendix L Section 17.3 and 17.4 Section 17.3 and 17.4 Section Section 17.3 and 17.4 Section 16.6 and 17.6
Impacts on water sources, sharing and licensing including: · Consistency with relevant water sharing plans · Details of water supply sources and the purpose, location, construction and expected
annual extraction volumes, and · Potential cumulative impacts on water sources and mitigation measures to manage the
cumulative impacts.
Section 16.1 Section 17.2, 17.3 and 17.4 Section 20.3
Assessment methodology 16.1
Surface water assessment 16.1.1The methodology followed in the surface water assessment to address surface water concerns outlined in the SEARs is detailed below.
· Desktop surface water assessment:
- Review of map data from the NSW Land Property Information (LPI) 2012 dataset
- Review of the Stage 1 and Concept Proposal surface water reports and models including:
o Northern Beaches Hospital Connectivity and Network Enhancement Project: Proposed Construction and Operational Phase Surface Water Management Strategy Concept

334 Northern Beaches Hospital Road Connectivity and Network Enhancements – Environmental Impact Statement Roads and Maritime Services
Proposal and Stage 1 Project, Volumes 1 and 2 prepared by Lyall & Associates (August, 2014)
o DRAINS models
o MUSIC models.
- Review of Warringah Council stormwater reference information including:
o The Council stormwater network including pits and pipes
o Waterway locations
o Locations of existing water quality treatment devices.
- Review of Flood Information
· Manly Lagoon Flood Study (BMT WBM, August 2013)
· Narrabeen Lagoon Flood Study (BMT WBM, September 2013).
· Site inspection
· Detailed hydrologic and hydraulic (DRAINS) modelling and analysis of the existing and proposed drainage network that drains the Stage 2 Project site, and cross-comparison with the Northern Beaches Hospital Road Connectivity and Network Enhancements Project EIS Appendix M (Lyall & Associates, 2014) conceptual results
· Water quality (MUSIC) modelling and analysis of subcatchments draining the Stage 2 Project site under existing and proposed conditions, including the estimation of mean annual nutrient, sediment and gross pollutant loads
· Assessment of downstream water quantity and quality impacts, including the ecological and geomorphic condition of receiving waterways
· Assessment of potential stormwater control measures to address water quantity and quality concerns, with particular attention paid to impacts on downstream council assets, scour and erosion along major drainage lines, and pollutant loads reaching downstream waterways
· Development of surface water management strategy for construction and operation phases.
A detailed methodology for the surface water assessment is provided in Section 3 of Appendix L.
Surface water management strategy 16.1.2Surface water and groundwater water (refer to Section 16.2.3 and 17.2.5) sampling has been carried out for the Stage 1 and Stage 2 Project for the purposes of characterising the baseline water quality conditions and environmental values on which impacts can be assessed and management measures can be based.
The philosophy, management framework and guiding principles outlined in the ANZECC guidelines have formed the basis for development of Stage 2 Project specific assessment criteria.
Based on the existing and proposed conditions assessment, a strategy to manage the potential impacts on downstream council assets and receiving environments has been prepared. The objectives and procedures adopted to form the surface water management strategy are outlined below.

Northern Beaches Hospital Road Connectivity and Network Enhancements Project – Environmental Impact Statement Roads and Maritime Services
335
Water quality management objectives Stage 2 Project impacts on water quality were estimated using the Model for Urban Stormwater Improvement Conceptualisation (MUSIC). Specifically, MUSIC was used to estimate annual pollutant loads, generated under existing and proposed conditions, for nitrogen, phosphorus, suspended solids and gross pollutants.
Operational water quality management objectives were prepared for the Concept Proposal and have been considered as part of the Stage 2 Project surface water assessment.
Ecosystems downstream of the Stage 2 Project site are of high ecological value and require protection. Consistent with the Concept Proposal, the Stage 2 Project is aimed at mitigating as far as practical the impacts from the road work. The ability to install controls to meet the northern beaches stormwater reduction targets is constrained by topography and limited corridor space. Therefore, it is not considered practical to treat runoff from the road in isolation of the surrounding catchment and a more holistic approach to water quality has been adopted for the Stage 2 Project (consistent with the Concept Proposal).
Water quantity management objectives The impact of the Stage 2 Project was assessed by comparing:
· The level of service of downstream council assets, measured by the capacity of the pipe system to carry 1-year, 5-year, 10-year and 100-year average recurrence interval (ARI) flows, before and after the proposed development
· Peak 100-year ARI overland flows before and after the proposed development. Where proposed conditions reduced levels of flood protection, or increased 100-year ARI overland flows, stormwater management options were considered in the Stormwater Management Plan.
Water resources management objectives The objective of the water resources assessment is to address:
· Consistency with water sharing plans
· Detail of the supply sources and the purpose, location, construction and expected annual extraction volumes
· Potential cumulative impacts on water resources and mitigation measures to manage cumulative impacts.

336 Northern Beaches Hospital Road Connectivity and Network Enhancements – Environmental Impact Statement Roads and Maritime Services
Existing environment 16.2
Catchment overview 16.2.1The Stage 2 Project, which has an approximate footprint of 17.8 hectares, lies within the Warringah Council LGA on a ridge at the top of three catchments: Middle Creek to the north; Bantry Bay to the southwest and Curl Curl Creek to the south (refer to Figure 16.1). The site is located at a maximum elevation of 160 metres AHD and minimum of 130 metres AHD.
The stormwater drainage network conveys stormwater flows for minor storm events (i.e. less than 10-year ARI flows) throughout the Stage 2 Project site. Stormwater runoff is predominantly generated by roads, roofs and pavements, which discharges into the major drainage lines described in Section 16.2.2. The existing drainage network capacity is assessed further in Section 5.1.7.
The waterways are tidal in their lower reaches but dominated by rainfall-runoff on the upper reaches in the vicinity of the Stage 2 Project.

Stage 2 Project Catchment Area Figure 16-1Stage 2 construction impact areaRegional catchments
Bantry BayCurl Curl CreekMiddle Creek
0 600 1,200 1,800 2,400300
Metres

338 Northern Beaches Hospital Road Connectivity and Network Enhancements – Environmental Impact Statement Roads and Maritime Services
Major waterways 16.2.2Middle Creek Under existing conditions, about 4.2 hectares (24 per cent) of the Stage 2 Project site drains north to Middle Creek via Catchment 1 and Catchment 3, which have total surface areas of about 92.6 hectares and 60.8 hectares, respectively. This differs to the Stage 1 Project, which in part drains Catchment 1, Catchment 2 (Trefoil Creek) and Catchment 3 to the north. Trefoil Creek is a tributary of Middle Creek with headwaters to the northeast of Wakehurst Parkway and Frenchs Forest Road East. The Stage 2 Project does not impact surface water flows received by Trefoil Creek. Groundwater interaction with Trefoil Creek is discussed in Section 17.2.
Middle Creek is a major tributary of Narrabeen Lagoon and has a catchment area of around 1,500 hectares. The catchment is relatively steep through the upper and middle reaches of Middle Creek, flattening to form a delta plain through the lower reaches approaching the mouth of the Narrabeen Lagoon.
The catchment is mainly covered by residential land-use in the upper reaches near the Stage 2 Project site. Further downstream, land-use is a mix of residential, public use, retail and forested areas. Development includes a number of schools at Oxford Falls and the Sydney Academy of Sport and Recreation near Narrabeen Lagoon. The dominant land cover is native forest, with the majority of the catchment downstream of Oxford Falls West Road lying within the Garigal National Park.
Curl Curl Creek Under existing conditions, about 9.5 hectares (53 per cent) of the Stage 2 Project site drains south to Curl Curl Creek via Catchment 6, which has a total surface area of about 135 hectares.
The Curl Curl Creek catchment area is about 700 hectares in total, which includes the Manly Dam catchment. Manly Dam was formerly a water supply reservoir for Manly that, since 1942, has been used entirely for recreational purposes. Downstream of the dam the creek continues in open channel before discharging into Manly Lagoon.
Catchment grades are up to eight per cent in the upper reaches of the catchment. In the vicinity of the Stage 2 Project site, land-use is predominantly commercial. The Manly Dam catchment consists predominantly of forested areas known as the Manly Dam Reserve, as well as a golf course and residential development. Downstream of the dam, the land-use is predominantly residential with some commercial lots and open-space public reserves.
According to Warringah Council information, the main creek arm upstream of the dam is known as Curl Curl Creek. Downstream of the dam it is known as Manly Creek. For simplicity, Curl Curl Creek is used throughout this report to refer to the major waterway to which the Stage 2 Project site drains.
Bantry Bay The catchment draining to Bantry Bay includes Bates Creek and an unnamed tributary to which about 4.2 hectares (24 per cent) of the Stage 2 Project site drains. The unnamed tributary is split into Catchments 4 and 5, which have total catchment areas of 34.2 hectares and 26.7 hectares, respectively.
The Bantry Bay catchment is steep, with grades of around six per cent to 20 per cent. Land-use in the headwaters of Catchments 4 and 5 is largely residential and includes the Frenchs Forest

Northern Beaches Hospital Road Connectivity and Network Enhancements Project – Environmental Impact Statement Roads and Maritime Services
339
Public School, a retirement village and an aquatic centre. These areas drain to Bantry Bay via drainage lines that cut through the southern catchments of Garigal National Park.
Erosion, sediment and water quality 16.2.3Erosion and scour The catchment walkover identified waterways downstream of the Stage 2 Project, in Catchments 1, 4, 5 and 6, which were generally stable with minimal signs of erosion or scour. However, there were some instances where stormwater control measures in Catchment 4 and Catchment 6 were observed to have been undermined by high flows.
Soils and sediment Site topography has been influenced by the subsurface geology and surface geomorphological processes. Typically the site subsurface is characterised by organic topsoil (nominally 0.25 millimetres thick) in the near surface, overlying a thin residual soil profile (commonly less than one metre thick, although this deepens to in excess of 1.5 metres toward the eastern extent of the Stage 2 Project).
Fill materials were encountered along the existing road alignment and in discreet pockets related to other construction activities. Aside from within the existing road alignment, the largest quantities of fill material are expected within the council depot at the western end of Aquatic Drive.
Colluvial soil, (e.g. slope-wash) was also encountered at discreet locations within the site.
Surface water quality Surface water sampling was carried out at five locations (SW1 to SW5) across the wider catchment. The sampling locations are presented in Figure 16.2. Four sample events have been completed on:
· 12 November 2014
· 6 January 2015
· 4 February 2015
· 10 March 2015.
Sampling was carried out during low flow conditions for all events and field parameters including pH, electrical conductivity, oxidation reduction potential, dissolved oxygen, and temperature were collected. The samples were analysed at a national association of testing authorities (NATA) accredited laboratory for the following analyses:
· pH
· Phosphate
· Electrical conductivity
· Total dissolved solids
· Total suspended solids
· Total and dissolved heavy metals (arsenic, cadmium, chromium, copper. iron, lead, manganese, mercury, nickel, zinc)
· Total recoverable hydrocarbons (TRH)

340 Northern Beaches Hospital Road Connectivity and Network Enhancements – Environmental Impact Statement Roads and Maritime Services
· Benzene, toluene, ethyl benzene and total xylenes (BTEX)
· Polycyclic aromatic hydorcarbons (PAHs)
· Major cations and anions
· Nutrients – ammonia, nitrate, nitrate and phosphorus.
Field parameters monitored at the time of sampling are detailed in Table E5 of Appendix __. A summary of the analytical results includes:
· The TRH, BTEX and PAHs were all below the laboratory limit of detection.
· Parameters that exceeded the nominated screening criteria and which highlight the differences between existing water quality and the selected ANZECC threshold criteria included:
- pH: two minor exceedances for SW3 and SW5 in November 2014, which suggest that the existing pH variation may be outside those normally present in lowland rivers within south east Australia
- Electrical conductivity: majority of results were above the nominated screening criteria suggesting that existing catchment water quality has a higher conductance
- Total suspended solids: the existing (background) total suspended solids concentration in one surface water sample (January 2015 event) at SW3 exceeded the nominated screening criteria
- Copper, iron and zinc: the existing (background) copper, iron and zinc concentrations in surface water samples exceeded the nominated screening criteria, however these exceedances could be natural background concentrations
- Nitrate: the existing (background) nitrate concentrations in surface water samples exceeded the nominated screening criteria at SW1, SW2, SW3 and SW4.
- Total dissolved solids results are indicative of freshwater conditions and is of drinking water quality (< 500 mg/L) for the majority of samples analysed.

Surface water quality sampling locations Figure 16-2
SW3
SW4
SW5
SW6
SW1
SW2
Water Sample Locations - SW Stage 2 construction impact area
0 100 200 300 40050
Metres

342 Northern Beaches Hospital Road Connectivity and Network Enhancements – Environmental Impact Statement Roads and Maritime Services
Existing drainage description 16.2.4Catchment 1 (Middle Creek) About 2.3 ha (13 per cent) of the Stage 2 Project site contributes to Catchment 1 runoff, mainly via stormwater drainage infrastructure connected to Warringah Road, east of Forest Way.
Overland flow is generally conveyed by kerb and channel along Warringah Road to Rabbett Street, via Forest Way.
Catchment 2 (Middle Creek) The Stage 2 Project site does not contribute to runoff within Catchment 2.
Catchment 3 (Middle Creek) About 1.9 hectares (11 per cent) of the Stage 2 Project site contributes to Catchment 3 runoff, mainly via stormwater drainage infrastructure connected to Warringah Road and Rodborough Road, west of Allambie Road.
Overland flow is generally conveyed by kerb and channel to a low point on the northern side of Warringah Road at the intersection with Rodborough Road.
Flood levels on the road above the kerb height would likely spill north to connect with drainage infrastructure and overland flow paths within the Allambie Grove Business Park. DRAINS modelling indicates that surface flows drain overland from Warringah Road to the Business Park during peak 5-year, 10-year and 100-year ARI design storm events.
Catchment 4 (Bantry Bay) About 3.7 hectares (21 per cent) of the Stage 2 Project site contributes to Catchment 4 surface water runoff, mainly via stormwater drainage infrastructure connected to Warringah Road.
Overland flow is generally conveyed south along Warringah Road by kerb and channel.
Kerb and channel on the northern side of Warringah Road connects overland flows to a low point on Warringah Road, west of Maxwell Parade.
Flood levels on the road above the kerb height would likely spill south through residential properties to connect with drainage infrastructure and overland flow paths in Maxwell Parade. DRAINS modelling indicates that surface water flows drain overland through these properties from Warringah Road during peak 100-year ARI design storm events.
Kerb and channel on the southern side of Warringah Road connects overland flows to stormwater infrastructure and overland flow paths in the Pipeline Reserve, north of Parni Place.
Catchment 5 (Bantry Bay) About 0.5 hectares (three per cent) of the Stage 2 Project site contributes to Catchment 5 surface water runoff, mainly via kerb and channel connected to Hilmer Street. Overland flow is generally conveyed south along Hilmer Street to connect with stormwater infrastructure and overland flow paths draining south.
Catchment 6 (Curl Curl Creek) About 9.5 ha (53 per cent) of the Stage 2 Project site contributes to Catchment 6 runoff, mainly via stormwater drainage infrastructure connected to Warringah Road, to the east and west of the intersection with Wakehurst Parkway, and Wakehurst Parkway itself.

Northern Beaches Hospital Road Connectivity and Network Enhancements Project – Environmental Impact Statement Roads and Maritime Services
343
Overland flows are generally conveyed by kerb and channel, following the underground network alignment, before entering natural waterways and cross-drainage infrastructure.
Stormwater quality control measures Council provided GIS information indicating the locations of existing stormwater quality treatment measures near the Stage 2 Project site. The measures include a range of trash racks; other gross pollutant traps (GPTs) and bioretention measures. GPTs and trash racks predominantly treat gross pollutants such as litter and large debris. Sediment basins, wetlands and reed beds remove sediments and varying amounts of nutrients such as phosphorous and nitrogen.
Council had no data available for the bioretention systems in Aurora Business Park on Aquatic Drive, as they are on private property. It is assumed that these systems treat flows from the business park only, with external catchment flows bypassing the systems.
Site investigations also found other stormwater quality control measures in the Stage 2 Project study area that were not included in the Council GIS database. Notably, a trash rack is located downstream of the existing piped culvert under Aquatic Drive in Catchment 6. However, the intended function and existing performance of the control measure is unknown.
Stage 2 Project drainage design description 16.3Stormwater runoff from the widened sections of road pavement would be controlled by new or upgraded pit and pipe pavement drainage systems which would typically discharge to Council’s existing piped stormwater drainage system.
For the majority of the Stage 2 Project’s new and upgraded road drainage systems, including the slot drainage design, a 100-year ARI system capacity would be provided. 100-year ARI flood depths on the road would generally be below 50 millimetres, except at the junction of east and west draining pipes in the slot (approximately 60 metres west of Wakehurst Parkway) where surface water would pool on the road up to 200 millimetres in depth and 5 five metres wide during the 100-year ARI.
In addition to the above, the slot drainage design would include provision for separation of groundwater inflow and surface water and include capture, treatment and discharge requirements for groundwater. The design would be based on inflow estimates provided in Appendix M and would consider the amount of treatment required on a long term (operational) basis and would typically discharge to Council’s existing piped stormwater drainage system following treatment (as required).
The Stage 2 Project concept design proposes two separate below ground detention storages, one at the southeastern corner of the intersection of Fitzpatrick Avenue East and Warringah Road and one below Aquatic Drive at the intersection of Wakehurst Parkway. The proposed detention basins at Aquatic Drive and Fitzpatrick Avenue East are designed to maintain existing peak 5-year, 10-year and 100-year flows at the outlet.
Where the Stage 2 Project’s new or upgraded road drainage systems connects to natural drainage lines (e.g. in locations south of Warringah Road), there would be a need to provide scour protection to prevent erosion and scour, such as rock rip rap apron with an energy dissipation structure. Similarly, to maintain hydrological performance and minimise potential erosion and scour, minor realignment to the natural drainage lines may be required immediately adjacent the inlet and outlet of the new cross-drainage under Wakehurst Parkway, south of the Warringah Road intersection.

344 Northern Beaches Hospital Road Connectivity and Network Enhancements – Environmental Impact Statement Roads and Maritime Services
Assessment of construction impacts 16.4
Erosion, sediment and water quality impacts 16.4.1Erosion, scour and sedimentation Soil erosion and sedimentation are risks posed to surface water quality throughout the construction phase where earthwork, vehicle access and alterations to drainage lines and connections can lead to increased sediment loads entering downstream environments.
Construction of the Stage 2 Project involves the removal of sections of road and drainage infrastructure in addition to the installation of new connections between proposed drains and existing pits. During the construction of these connections there is an increased risk that disturbed soil would enter drainage lines and waterways.
Stormwater control and treatment measures, such as the systems located within the Aurora Business Park on Aquatic Drive in Catchment 6, are located immediately downstream of the construction footprint. Whilst council drainage within the construction footprint is not directly connected to the Aurora Business Park drainage system, overland flow from the construction site may still enter the Aurora Business Park drainage catchment if not managed carefully.
In the event that runoff from the site is permitted to leave the site in an uncontrolled manner and discharge into downstream waterways, localised scour could occur at the points of discharge.
During road construction, sediment loads would be managed once erosion risks have been reduced. Stormwater control measures that reduce the amount of sediment leaving the site are to be included in the Soil and Water Management Plan and implemented on site before, during and after construction until the site conditions have settled and operational measures are established.
With provision of appropriate construction stage erosion and sediment controls (refer to Section 16.6), nutrient loads would be unlikely to increase significantly during the construction phase, however particulate phosphorous is likely to increase where erosion and scour is allowed to propagate.
Water quality Chemical contamination
The release of harmful chemicals is a risk to downstream environments during construction. Substances may include acids and chemicals from washing processes, fuels, oils, lubricants and hydraulic fluids. Release may occur due to:
· Spills
· Refuelling
· Inappropriate storage, handling and use of the substances
· Disturbance and handling of contaminated soils.
These substances have the potential to be transported by surface water runoff to downstream waterways. The degrading influence of chemicals on downstream ecology is of particular concern.
During construction, surface water can enter the slot from direct rainfall, groundwater seepage and overland flows. Surface water interacting with groundwater may be contaminated from the adjacent service station and pose a risk to downstream waterways and receiving environments.

Northern Beaches Hospital Road Connectivity and Network Enhancements Project – Environmental Impact Statement Roads and Maritime Services
345
In addition, the Stage 2 Project alignment encroaches on existing dwellings, commercial buildings and infrastructure on the southern side of the site. Depending on the extent of excavation for Warringah Road surface lanes, there is potential to unearth contaminated land from the adjacent service station. Demolition and clearing activities also have the potential to increase pollutant loads entering downstream waterways, including:
· Asbestos and other building materials
· Toxic or pollutant laden soils
· Heavy metals
· Chemicals (including hydrocarbons) associated with demolition processes and machinery
· Dust and airborne pollutants (which eventually come to rest and drain into existing waterways).
With the implementation of appropriate mitigation and monitoring measures (refer to Section 16.6), it is expected that chemical contamination water quality risks posed by construction activities would be low.
Water quantity and stormwater 16.4.2As discussed in Section 16.4.2, there is an increased risk of sediment loads being transported from the Stage 2 Project site during construction. Sediment loads deposited in downstream Council drainage assets could lead to increased flooding due to decreased drainage capacity within the network. Exposed soil may also reduce the infiltration rates and lead to increases in surface flow. Changes to the flow regime can also be caused by temporary bunds, fencing and on-site stormwater detention used to control sediment loads.
It is also possible that changes to the stormwater drainage system during construction, if not made in conjunction with any necessary temporary bypass or diversion work, have the potential to cause localised flooding during rainfall events.
Where the work involves decommissioning or upgrade of existing assets, temporary stormwater drainage or diversion work would be provided. This would maintain system operation in the event of a large rainfall event during construction.
With the implementation of appropriate mitigation and monitoring measures (refer to Section 16.6), it is expected that the risk posed by construction activities would be low.
Assessment of operational impacts 16.5As discussed in Section 16.1, DRAINS and MUSIC models were prepared for the Stage 2 Project. DRAINS models the impacts on stormwater flow regimes and drainage network capacity, and the MUSIC model was used to estimate annual pollutant loads, generated under existing and proposed conditions, for nitrogen, phosphorus, suspended solids and gross pollutants. Detention storages were simulated in Catchment 4 and 6 in accordance with the Stage 2 Project stormwater design.
A summary of the outcomes is provided in Section 16.5. Figure 16.3 illustrates the modelled locations, as referred to in the following assessment.

Modelled locations of the Stage 2 Project (DRAINS and MUSIC) Fig. 16-3
SWS00050
SWS00055SWS00056
SWS00018
SWS00042
SWT00001
SWS00005SWT00038
SWS00058
SWT00056
1.031.02 1.01
1.04
1.05
1.07
1.06
3.013.02
3.03
3.04 3.06
3.05
3.07
6.036.01
6.026.05
6.04
6.06
6.07
6.10
6.08
6.09
5.025.01
5.03
5.04
5.05
4.06
4.05
4.04
4.034.024.01
Key reference pointsExisting water qualitydevicesStage 2 Boundary
Existing drainage pitExisting drainage conduit
Study area catchmentsCatchment 1
Catchment 2Catchment 3Catchment 4 and 5Catchment 6
Northern Beaches Hospital Connectivity and Network Enhancements Project 30011560
Location: I:\projects\30011560 - Northern Beaches Hospital Roadworks EIS\008 DATA\1002 GIS\02 EIS 2\Maps\REF\GHD\16-3.mxd Last updated by: RC10721 on 21/05/2015 at 12:31
0 200 400100
Metres

Northern Beaches Hospital Road Connectivity and Network Enhancements Project – Environmental Impact Statement Roads and Maritime Services
347
Erosion, sediment and water quality impacts 16.5.1Erosion, scour and sedimentation Post-construction, some areas within the Stage 2 Project footprint may take time to stabilise and remain susceptible to erosion well into the operational phase. In addition, changes to land cover and stormwater management have the potential to increase erosion and scour within waterways. Potential impacts include:
· Increases to the frequency, magnitude and velocity of runoff as a result of increased impervious area and the hydraulic efficiency of drainage systems
· Increases to the duration of runoff as a result of increased stormwater detention.
Generally, an increase in peak flow from the Stage 2 Project would be accompanied by an increase in flow velocities, increasing the risk of erosion. Rainfall-runoff modelling generated flows for 1-year ARI, 5-year ARI, 10-year ARI design storm events and 100-year ARI design storm events, suggesting drainage lines in Catchment 3 and Catchment 6 are subject to increases in peak flows.
Peak flow increases in Catchment 3 immediately downstream of the Stage 2 Project (i.e.. Points 3.02 and 3.03), are controlled by pipes and overland flow paths designed to convey stormwater (i.e. sealed roads), which mitigates the risk of scour and erosion at these points. Further downstream (Points 3.04 and 3.07), increases in peak flows are marginal (less than five per cent) compared to the existing peak flow, which is within the margin of error within the model. Overall, the increased risk of erosion due to the Stage 2 Project is negligible within Catchment 3.
The Stage 2 Project increases impervious areas in Catchment 4 and generates higher peak flows upstream of the below ground detention storage proposed at the intersection of Fitzpatrick Avenue and Warringah Road. Downstream, DRAINS modelling indicates the proposed detention storage reduces peak flows to existing levels. The risk of scour and erosion is therefore no worse under the Stage 2 Project.
Peak overland flow increases in Catchment 6 at the following locations:
· Aquatic Drive (Point 6.02)
· Downslope of culvert upgrades on Wakehurst Parkway (Points 6.08 and 6.09)
· Further downstream where impacted drainage lines enter Curl Curl Creek (Points 6.11 and 6.12).
Increases in peak flows on Aquatic Drive (in the order of 50 to 100 per cent) are offset by reduced peak overland flows from Warringah Road cross-drainage through Point 6.03. The combined effect immediately downstream (modelled at Point 6.04 and 6.05) is an overall decrease in peak flows carried by downstream pipes, roads and waterways. The risk of scour and erosion is therefore no worse under the Stage 2 Project at these points.
Increases in peak flows (in the order of 10 to 100 per cent) immediately downslope of culvert upgrades on Wakehurst Parkway (see SPI03303 and SPI08537 in Appendix L) impact existing waterways, which are susceptible to erosion and scour. These drainage lines also impact upon Red-crowned Toadlet breeding habitat. The proposed upgrades include erosion protection immediately downstream of the culverts. However, increased flows propagate further downstream (Point 6.10) up to 80 per cent higher than existing overland flows. The impact is less prominent further downstream (less than 10 per cent) where flows enter Curl Curl Creek. The increase in

348 Northern Beaches Hospital Road Connectivity and Network Enhancements – Environmental Impact Statement Roads and Maritime Services
peak flows poses a risk of erosion, which can be mitigated with alterations to the Wakehurst Parkway cross-drainage configuration.
Increased flows at Points 6.08, 6.09 and 6.10 downstream of the culvert upgrades on Wakehurst Parkway near the southern limit of work would be mitigated through minor modifications during detailed design, specifically to the Stage 2 Project drainage configuration (including cross-drainage upgrades) on Wakehurst Parkway south of Aquatic Drive. The Stage 2 Project detailed design would aim to reduce peak flows entering waterways to the east of Wakehurst Parkway by redirecting flows further south via existing road drainage. This can be achieved without causing additional flooding on Wakehurst Parkway and therefore presents a low-risk and cost-neutral mitigation option.
Increased flows are also expected in Catchment 3 and Catchment 4, though the assessed impact is minimal. Given the minimal impact a monitoring and maintenance based approach is recommended for these catchments. Drainage outlet conditions in Catchment 3 and Catchment 4, downstream of the Stage 2 Project, should be monitored for evidence of erosion and scour as part of regular maintenance. Where erosion and scour becomes apparent, suitable erosion control measures including rock armouring, gabion baskets, matting or concrete lining; depending on the specific site conditions, should be implemented.
Water quality Chemical contamination
There is an existing risk of chemical contamination to downstream waterways from traffic within the Stage 2 Project area. The Stage 2 Project allows for an increase in traffic and therefore a higher risk of waterway contamination in the occurrence of an accident or spill.
Consideration would be given during detailed design to the incorporation of end-of-line and slot spill capture to account for the increased risk of spill due to increased traffic volumes. In the event that any spills do occur, the spill would be directed to surface water capture systems.
Nutrient loads
MUSIC model estimates of pollutant loads along impacted drainage lines, under existing and proposed conditions, are summarised in Table 16.1.
The following key points are made in regard to the information presented in Table 16.1.
· There are no significant increases associated with the Stage 2 Project for total suspended solids, total phosphorus and gross pollutants. This is expected to be due to the influence of the sub-surface detention tanks attenuating flow from these catchments
· Nitrogen concentration at Point 4.01 and 6.01 (which in the MUSIC model is simulated to be the exit point of the detention basin on Aquatic Drive) are simulated to have increases of up to 13 per cent. With the inclusion of inflows from other sub-catchments, the loads are expected to fall to existing levels (within an acceptable margin of error) before entering tributaries of Bantry Bay Creek at Point 4.06 and tributaries of Curl Curl Creek at Point 6.06 and 6.13. As such, the results suggest that the increased nitrogen loads would be localised only. The localised increase in nitrogen between 4.01 and 4.06 is not an area of identified sensitive aquatic systems and is therefore not considered to represent a potential adverse impact. The impacted area down gradient of Point 6.01 and up gradient of 6.06 has been identified as Red-crowned Toadlet habitat

Northern Beaches Hospital Road Connectivity and Network Enhancements Project – Environmental Impact Statement Roads and Maritime Services
349
· Peak nitrogen loads during large rainfall events between 6.01 and 6.06 are reduced which is considered to represent a positive outcome from the Stage 2 Project stormwater design
· The most common difference between existing nitrogen loads and nitrogen loads associated with the Stage 2 Project design between 6.01 and 6.06 are apparent immediately after rainfall. It is noted however, that the higher values are more consistent (less variable) and are within the normal range of total nitrogen discharging under lower flow conditions
· The modelling results suggest the Stage 2 Project design would result in a net reduction in nutrient loads from the Stage 2 Project area as a whole. This is consistent with the Concept Proposal surface water strategy (Lyall and Associates, 2014).

350 Northern Beaches Hospital Road Connectivity and Network Enhancements – Environmental Impact Statement Roads and Maritime Services
Table 16.1 MUSIC model results under existing and proposed conditions
Pollutant
1.05 3.04 4.01 5.05 4.06
Existing conditions
Proposed conditions
% Change Existing conditions
Proposed conditions
% Change Existing conditions
Proposed conditions
% Change Existing conditions
Proposed conditions
% Change Existing conditions
Proposed conditions
% Change
Total Suspended Solids (kg/yr)
35,783 33,626 N.I. 59,013 59,679 1% 24,825 19,969 N.I. 29,015 28,332 N.I. 96,251 92,218 N.I.
Total Phosphorus (kg/yr)
60 57 N.I. 99 100 1% 43 41 N.I. 50 48 N.I. 166 163 N.I.
Total Nitrogen (kg/yr) 452 420 N.I. 748 750 0.30% 317 347 9% 370 364 N.I. 1,247 1271 2%
Gross Pollutants (kg/yr) 5,233 4,909 N.I. 8,643 8,687 1% 3,682 0 N.I. 4330 4,225 N.I. 143,776 10,607 N.I.
Pollutant
6.01 (exit point of retention storage on Aquatic Drive)
6.04 6.06 6.13
Existing conditions
Proposed conditions
% Change Existing conditions
Proposed conditions
% Change Existing conditions
Proposed conditions
% Change Existing conditions
Proposed conditions
% Change
Total Suspended Solids (kg/yr)
11,418 7,945 N.I. 31,154 29,717 N.I. 58,013 42,778 N.I. 48,897 48,721 N.I.
Total Phosphorus (kg/yr)
21 19 N.I. 51 49 N.I. 102 81 N.I. 89 89 N.I.
Total Nitrogen (kg/yr) 163 184 13% 377 373 N.I. 759 651 N.I. 678 670 N.I.
Gross Pollutants (kg/yr) 1,599 0 N.I. 4,401 4,295 N.I. 8,433 4,295 N.I. 7,355 7,171 N.I.
Text in bold indicates pollutant and nutrient load increases over existing conditions outside of 5 per cent modelling error. N.I. denotes no increase
Northern Beaches Hospital Road Connectivity and Network Enhancements Project –Environmental Impact Statement Roads and Maritime Services
351
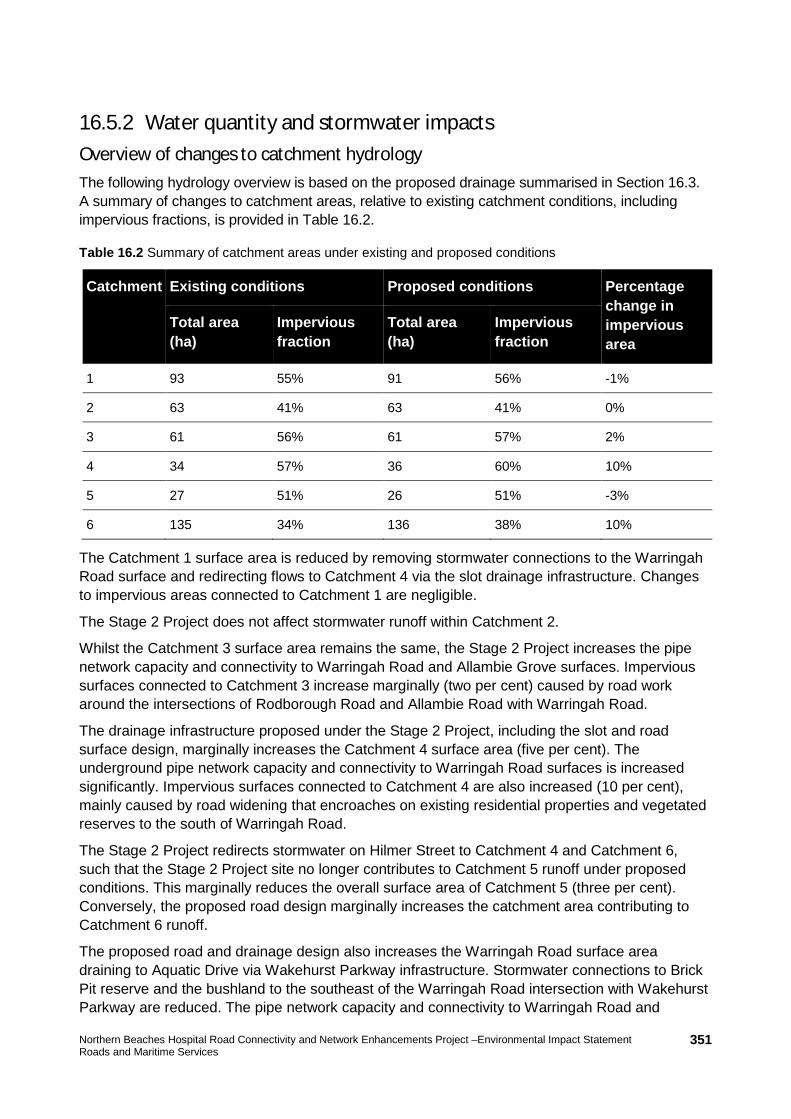
Water quantity and stormwater impacts 16.5.2Overview of changes to catchment hydrology The following hydrology overview is based on the proposed drainage summarised in Section 16.3. A summary of changes to catchment areas, relative to existing catchment conditions, including impervious fractions, is provided in Table 16.2.
Table 16.2 Summary of catchment areas under existing and proposed conditions
Catchment Existing conditions Proposed conditions Percentage change in impervious area
Total area (ha)
Impervious fraction
Total area (ha)
Impervious fraction
1 93 55% 91 56% -1%
2 63 41% 63 41% 0%
3 61 56% 61 57% 2%
4 34 57% 36 60% 10%
5 27 51% 26 51% -3%
6 135 34% 136 38% 10%
The Catchment 1 surface area is reduced by removing stormwater connections to the Warringah Road surface and redirecting flows to Catchment 4 via the slot drainage infrastructure. Changes to impervious areas connected to Catchment 1 are negligible.
The Stage 2 Project does not affect stormwater runoff within Catchment 2.
Whilst the Catchment 3 surface area remains the same, the Stage 2 Project increases the pipe network capacity and connectivity to Warringah Road and Allambie Grove surfaces. Impervious surfaces connected to Catchment 3 increase marginally (two per cent) caused by road work around the intersections of Rodborough Road and Allambie Road with Warringah Road.
The drainage infrastructure proposed under the Stage 2 Project, including the slot and road surface design, marginally increases the Catchment 4 surface area (five per cent). The underground pipe network capacity and connectivity to Warringah Road surfaces is increased significantly. Impervious surfaces connected to Catchment 4 are also increased (10 per cent), mainly caused by road widening that encroaches on existing residential properties and vegetated reserves to the south of Warringah Road.
The Stage 2 Project redirects stormwater on Hilmer Street to Catchment 4 and Catchment 6, such that the Stage 2 Project site no longer contributes to Catchment 5 runoff under proposed conditions. This marginally reduces the overall surface area of Catchment 5 (three per cent). Conversely, the proposed road design marginally increases the catchment area contributing to Catchment 6 runoff.
The proposed road and drainage design also increases the Warringah Road surface area draining to Aquatic Drive via Wakehurst Parkway infrastructure. Stormwater connections to Brick Pit reserve and the bushland to the southeast of the Warringah Road intersection with Wakehurst Parkway are reduced. The pipe network capacity and connectivity to Warringah Road and

352 Northern Beaches Hospital Road Connectivity and Network Enhancements – Environmental Impact Statement Roads and Maritime Services
Wakehurst Parkway surfaces is increased. Impervious surfaces connected to Catchment 6 are increased by about 10 per cent.
Proposed pipe culvert upgrades, would increase the cross-drainage capacity under Warringah Road, Wakehurst Parkway and Aquatic Drive.
Modelling indicates that peak flows would increase at drainage outlets in Catchment 3 (Points 3.02, 3.03, 3.04 and 3.07) and Catchment 6 (Points 6.02, 6.08, 6.10, 6.11 and 6.12). Some increases in peak overland flows are also expected in Catchment 3 and Catchment 6.
Stage 2 Project drainage capacity DRAINS modelling indicated the proposed road drainage design for the Stage 2 Project, including the slot drainage design, generally has 100-year ARI system capacity. 100-year ARI flood depths on the road are generally below 50 millimetres, except at the junction of east and west draining pipes in the slot approximately 60 metres west of Wakehurst Parkway (Catchment 6) where surface water pools on the road up to 200 millimetres in depth and five metres wide.
The proposed detention basins at Aquatic Drive and Fitzpatrick Avenue East are designed to reduce peak 5-year, 10-year and 100-year flows back to existing levels at the outlet.
In the scenario of an unlined slot (refer to Section 17 for groundwater detail) the ground water flows would be accommodated within the capacity of the proposed surface water system. The tank under Aquatic Drive is designed for a 1:100 year ARI for slot drainage, it would accommodate up to 1,800m3 of water, and the ground water at its highest modelled volume is 54m3 per day (i.e. around three per cent of tank capacity). As such, there is ample capacity for the tank to manage groundwater inflows, in additional to surface water volumes, under an unlined slot scenario.
Any groundwater would be suitably treated prior to discharge into creek lines (refer to Section 17.6). The details of a water treatment system would be investigated during detailed design and in consultation with EPA, NoW.
Impacts on Councils stormwater drainage system Given the existing capacity of the drainage system is generally less than the peak 10-year ARI flow, any increase in flow is likely to reduce the drainage standard further. The Stage 2 Project has potential to reduce the hydraulic standard of Council’s drainage system downstream of Points 3.01, 3.02 and 3.03 in Catchment 3. These impacts do not propagate further downstream and can be managed by upgrading local pipe infrastructure in conjunction with Stage 1 Project work as described in Northern Beaches Hospital Road Connectivity and Network Enhancements Project EIS Appendix M (Lyall & Associates, 2014).
In addition, during development of the detailed design, consideration must be given to the potential for localised increases in ponding from stormwater pits or road flood widths and mitigated accordingly.
Impacts on stormwater flows into and surrounding The Forest High School and Frenchs Forest Public School The Forest High School lies within Catchment 1 on the northern side of Warringah Road and is not adversely affected by changes to catchment hydrology caused by the Stage 2 Project.
The Frenchs Forest Public School lies partly within Catchment 4 to the west of the Warringah Road intersection with Forest Way and is not adversely affected by changes to catchment hydrology caused by the Stage 2 Project.

Northern Beaches Hospital Road Connectivity and Network Enhancements Project –Environmental Impact Statement Roads and Maritime Services
353
Impacts on downstream catchments and wetlands Rainfall-runoff
As outlined above, (overview of changes to catchment hydrology) impervious areas directly draining to Catchments 3, 4 and 6 increase by two per cent, 10 per cent and 10 per cent respectively due to the Stage 2 Project.
Where catchment impervious areas increase, the volume of stormwater reaching downstream waterways is also likely to increase. Given the highly developed nature of the existing catchment, and the relatively small project area relative to the overall catchment, the potential for these changes to adversely affect the existing ecological condition of downstream environments is considered to be limited. The Stage 2 Project is therefore expected to have little impact on the flow regime entering catchments or wetlands downstream of the study area.
Groundwater inflows
As discussed in Section 17, the groundwater assessment estimated groundwater inflows to surface water under existing and post-developed conditions. The findings of the groundwater assessment are discussed in greater detail in the Northern Beaches Hospital Network Enhancement – Stage 2 Groundwater Assessment (refer to Appendix M). A summary of the changes to groundwater seepage is provided in Table 16.3.
The average creek flows generated from surface water runoff would be many times greater than the predicted changes in groundwater seepage resulting in negligible change to annual flow volumes.
An assessment was carried out of the groundwater seepage likely to occur during periods of low or no surface water flows. The possibility of the groundwater flows supplying the Red-crowned Toadlet habitat was investigated. During dry periods, it is expected the groundwater seepage would be on the lower end of the range indicated in column A of Table 16.3.
Table 16.3 Potential impacts of changes to groundwater seepage flows, dry periods
Location A: Estimated groundwater inflow to surface water (m3/day)+
B: Estimated change in groundwater inflows as a result of the Stage 2 Project, long-term (%) +
C: Dry period minimum change in groundwater inflow as a result of the Stage 2 Project (m3/day)
D: Dry period maximum change in groundwater inflow as a result of the Stage 2 Project (m3/day) +
Red-crowned Toadlet habitat on Trefoil Creek
15 – 97 2.0 – 2.5 0.3 0.4
Red-crowned Toadlet habitat on Curl Curl Creek
3 – 51 30.0 – 50.0 0.9 1.5
Middle Creek southwest tributary
20 – 162 3.0 – 6.0 0.6 1.2
Bantry Bay tributary
121 – 971 0.2 – 1.5 0.2 1.8
+From groundwater assessment

354 Northern Beaches Hospital Road Connectivity and Network Enhancements – Environmental Impact Statement Roads and Maritime Services
During times of no surface water flow, changes to groundwater seepage are predicted to be of the order of that presented in Table 16.3.
The Stage 2 Project biodiversity assessment (SMEC, 2015) found that breeding habitat for the Red-crowned Toadlet is likely to have a low dependence on groundwater and is therefore unlikely to be vulnerable to changes in groundwater resulting from the Stage 2 Project as documented in the above table.
Cumulative impacts on water sources The potential impacts of the Stage 1 Project were assessed by Lyall & Associates in the Northern Beaches Hospital Road Connectivity and Network Enhancements Project EIS Appendix M (Lyall and Associates, 2014).
Surface water runoff interaction between the Stage 1 Project and Stage 2 Project sites was also assessed by Lyall & Associates, though only at a conceptual level (Northern Beaches Hospital Road Connectivity and Network Enhancements Project EIS Appendix M, Lyall &Associates, 2014). Interactions are most prominent in Catchment 3, with work to be completed in the vicinity of the Warringah Road intersection with Allambie Road under both the Stage 1 and Stage 2 Projects. The longitudinal connectivity of drainage infrastructure in Catchment 3, that receives stormwater from both the Stage 1 Project and the Stage 2 Project, presents a risk of cumulative impact. The impacts include potential for localised surface ponding or flooding where flow increases occur.
Table 16.1 presents the catchment flows from each of the main surface water catchments intersecting the Stage 2 Project. The results are summarised below:
· The results suggest that there would be a small decrease in average flows from the Curl Curl Creek (4.6 per cent) and Middle Creek Catchments (one per cent)
· The small decrease in flows from the Middle Creek catchment (0.1 m3/day) is due to catchment changes associated with the Stage 2 Project and results in equal increases in flows in Bantry Bay catchment. Under the water sharing plan this represents a migration of water from the North Sydney Coastal management unit to the Middle Harbour management unit. When compared to allocated water sharing volumes for Northern Sydney Rivers water source (in which these management units are located) such as the share component for domestic and stock use (15 m3/day), it is considered to be negligible (i.e. <1 %)
· There is an overall reduction in average flows from all catchments intersecting the Stage 2 Project (0.4 m3/day), which approximates 1.5 per cent of total average flows from these catchments. The reduction is due to flow reductions in Curl Curl Creek catchment (Catchment 6). Plotting the existing and Stage 2 Project flows simulated by the MUSIC model at the confluence of all of the sub-catchments draining Catchment 6, suggests that while there are small decreases in overall flows, relative to the overall flow regime the flow changes appear to relatively minor
· The flow changes in Curl Curl Creek are not expected to result in more than negligible changes in the water budget for Manly Dam.
Based on findings of the MUSIC modelling the contribution of the Stage 2 Project to cumulative impacts on water sources are considered to be minor.

Northern Beaches Hospital Road Connectivity and Network Enhancements Project –Environmental Impact Statement Roads and Maritime Services
355
Table 16.4 Average flow outputs (MUSIC modelling) from Stage 2 Project within
Water Sharing Plan management units Existing condition Mean flow (m3/day)
Proposed condition Mean flow (m3/day)
Change Mean flow (m3/day)
North Sydney Coastal Management Unit Curl Curl Creek catchment
8.9 8.5 -0.4 (-4.6%)
North Sydney Coastal Management Unit Middle Creek catchment
11.7 11.6 0.1 (-1%)
Middle Harbour Management Unit Bantry Bay catchment
4.6 4.7 0.1 (2.6%)
Total flow change -0.4 (-1.5%)
Climate change The NSW OEH publish information regarding the expected effects of future climate change on rainfall and sea levels. The document Metropolitan Sydney Climate change snapshot (OEH, November 2014) is the most recent information available and identifies predicted changes to rainfall seasonality and average rainfall.
The findings of the document are that summer rainfall changes are predicted to be between a seven per cent decrease and a 28 per cent increase in the far future (from 2060 to 2079).
The publication does not provide details regarding changes to flood-producing rainfall events other than to confirm that changes to rainfall intensity are expected.
In 2007, CSIRO carried out climate change modelling for the NSW Government to assess the impacts of climate change on rainfall intensities. The results showed a trend for increased rainfall intensities for the 1 in 40-year ARI one-day rainfall event across NSW. The projected increase in rainfall totals in the Sydney Metropolitan Area is indicated in Table 16.5.
Table 16.5 CSIRO indicative change in rainfall one-day totals (CSIRO, 2007)
Location 40 Year 1 day rainfall total projected change by 2030
40 Year 1 day rainfall total projected change by 2070
Sydney Metropolitan Catchment
-3% to +12% -7% to +10%
New South Wales average -2% to +15% -1% to +15%
The CSIRO modelling suggests catchments, which contribute to stormwater runoff carried by drainage infrastructure, may experience up to a 10 per cent increase in rainfall intensities as a result of climate change. However, it is important to note that results are only available for a single ARI and storm duration.
As previously mentioned, DRAINS modelling indicates that the existing design standard of the underground stormwater drainage system, within the study area, is between the 5-year and 10-year ARI, and in some locations lower. The level of service may be reduced as a result of an increase in rainfall intensity of up to 10 per cent. The potential impact of future climate change on

356 Northern Beaches Hospital Road Connectivity and Network Enhancements – Environmental Impact Statement Roads and Maritime Services
flood producing rainfall was not taken into account when assessing measures for managing stormwater runoff from the Stage 2 Project, though the capacity of the proposed network is generally improved over the existing case. The effects of climate change are not expected to be worse as a result of the Stage 2 Project.
Note that the values in Table 16.5 are considered indicative only. OEH is currently working with the University of New South Wales on climate projections for impacts to flooding and it is expected that these figures will be revised.
As the Stage 2 Project site is located on a ridgeline which lies more than 100 metre above mean sea level, projected rises in sea level linked to future climate change would not impact flooding behaviour along the road corridor.
Environmental management measures 16.6Mitigation and management measures would be implemented for the Stage 2 Project to avoid, minimise or manage potential risks identified in Section 16. These mitigation and management measures have been identified in Table 16.6 and incorporated in the Environmental Management measures in Section 21.

Northern Beaches Hospital Road Connectivity and Network Enhancements Project –Environmental Impact Statement Roads and Maritime Services
357
Table 16.6 Stage 2 Project safeguards and mitigation measures
Impact Environmental management measures Responsibility Timing
Erosion, sediment and water quality impacts
· A Soil and Water Management Plan will be prepared for each construction stage of the Concept Proposal in accordance with the principles and guidelines set out Soils and Construction – Managing Urban Stormwater series, comprising Volume 1 (Landcom, 2004) and Volume 2D – Main Roads (DECC, 2008), including: - Consideration of soil erodibility - Management strategies to be used to minimise surface and groundwater impacts, including
identification of water treatment measures, discharge points and erosion and sediment control measures
- Sedimentation basin construction and management - Measures to monitor and manage spoil, fill and materials stockpile sites - Dewatering procedure - Water quality monitoring and checklists
Contractor Construction
Erosion, sediment and water quality impacts
Where space allows, construction work should consider the potential for locating sediment retention basins along the southern side of Warringah Road, where widening of the existing westbound carriageway will require land clearing and excavation work, if possible. These basins would reduce the volume of sediment and turbidity levels in runoff potentially discharging to Catchments 4, 5 and 6.
Contractor Construction
Water quality impacts during construction
· An emergency spill response procedure will be prepared to minimise the impact of spills including details on the requirements for managing, cleaning up and reporting.
Contractor Construction
· Spill kits and adequate quantities of suitable material to counteract spillage would be kept readily available.
Contractor Construction
· Any potential hazardous or contaminant materials (for example, fuels, curing compounds, and oils) would not be stored within 50 metres of any waterways or drainage lines, flood prone areas, or on slopes steeper than 1:10. Storage areas would be impervious and adequately bunded.
Contractor Construction
· The refuelling of plant and maintenance of machinery would be carried out in impervious bunded areas. Refuelling would be attended at all times.
Contractor Construction

358 Northern Beaches Hospital Road Connectivity and Network Enhancements – Environmental Impact Statement Roads and Maritime Services
Impact Environmental management measures Responsibility Timing
· Vehicle wash-downs and/or concrete truck washouts would be located within a designated bunded area with an impervious surface or located off-site.
Contractor Construction
· Machinery would be checked daily to ensure that there are no oil, fuel, or other liquid leaks. Contractor Construction
Operational accidental spills
· Detailed design would consider reasonable and feasible measures to optimise pollution mitigation and would include as a minimum: - Spill containment requirements focusing on drainage lines discharging to identified Red-
crowned Toadlet habitat - Opportunities to include spill containment provisions in conjunction with the proposed
separate below ground detention storages in the vicinity of the Aquatic Drive and Wakehurst Parkway intersection
- Consideration of wall wash down and other maintenance requirement.
Contractor Pre-Construction