Northeastern Regional Assessment of Strategic Electrification · Northeastern Regional Assessment...
99
Northeastern Regional Assessment of Strategic Electrification July 2017
Transcript of Northeastern Regional Assessment of Strategic Electrification · Northeastern Regional Assessment...

Northeastern Regional Assessment of Strategic Electrification
July 2017

Northeastern Regional Assessment of Strategic Electrification | ii
Table of Contents
Executive Summary ........................................................................................................................................1
Technology and Market Assessment ...............................................................................................................4
Buildings .............................................................................................................................................. 6
Industry ............................................................................................................................................ 17
Transportation .................................................................................................................................. 23
Policy and Program Options for Expanding Markets ...................................................................................... 29
Overview of Strategic Electrification Policies in the Northeast ........................................................ 29
Regulatory Context ........................................................................................................................... 32
Targets and Mandates ...................................................................................................................... 35
Pricing-Based Policies ....................................................................................................................... 38
Facilitating Emerging Financing and Business Models ..................................................................... 41
Quality Assurance and Evaluation, Measurement, and Verification ................................................ 44
Marketing, Outreach, and Education ............................................................................................... 46
Electrification Scenario Analyses .................................................................................................................. 48
Reference Case ................................................................................................................................. 48
“Max Electric” Scenario .................................................................................................................... 50
“Plausibly Optimistic” Scenario ........................................................................................................ 52
Sensitivity Analysis ............................................................................................................................ 54
Grid and Consumer Impacts ......................................................................................................................... 57
Electrification and the Grid ............................................................................................................... 58
Impacts on Consumers ..................................................................................................................... 64
Next Steps ................................................................................................................................................... 66
Near-Term Actions: Develop and Grow Electrification Programs .................................................... 66
Policy Questions to Study and Resolve ............................................................................................. 67
Research and Data Needs ................................................................................................................. 69
Appendix A: Policy and Program Reference .................................................................................................. 72
Targets and Mandates ...................................................................................................................... 72
Pricing-Based Policies ....................................................................................................................... 76
Facilitating Emerging Financing and Business Models ..................................................................... 82
Quality Assurance and Evaluation, Measurement, and Verification ................................................ 86
Marketing, Outreach, and Education ............................................................................................... 88

Northeastern Regional Assessment of Strategic Electrification | iii
Policy Discussion: Transportation ..................................................................................................... 90
Appendix B: Highlights of the Literature ....................................................................................................... 92
U.S. Deep Decarbonization Pathways Project .................................................................................. 92
New York Renewable Heating and Cooling Policy Framework ........................................................ 92
NRECA/RAP Beneficial Electrification ............................................................................................... 93
Vermont 2016 Comprehensive Energy Plan ..................................................................................... 93
Northeast EnergyVision 2030 ........................................................................................................... 94
Zero Emission Vehicle Multi-State Action Plan................................................................................. 94
Acknowledgements
This report reflects the invaluable contributions of multiple individuals.
First and foremost, we recognize Meredith Hatfield, Mariella Puerto and the Barr Foundation for providing NEEP
a grant to undertake this important effort and develop this report.
We recognize the report’s primary authors; Synapse Energy Economics’ Asa S. Hopkins, PhD, Ariel Horowitz,
PhD, Pat Knight, Kenji Takahashi and Tyler Comings and Meister Consulting Group’s Philip Kreycik, Neil Veilleux,
and Jeremy Koo.
Several NEEP staff served key roles in the development of the report including Dave Lis as project manager
(assumed role from Brian Buckley), Sue Coakley as project Director, and Dave Hewitt as special project advisor.
Claire Miziolek provided additional review and input during drafting. Travis Dodge, a graduate student from
Clark University working with NEEP on the project, provided support throughout the development process.
Formatting and edits were provided by NEEP’s Lisa Cascio, Public Relations Manager; and Chris Tanner, Senior
Digital Marketing Associate.
NEEP would like to thank the Strategic Electrification advisory committee members (listed below) for their
invaluable feedback and input. The advisory committee served as a sounding board for NEEP and its consultants
throughout the process of report development, however statements within this report should not be attributed
to specific individuals or organizations on the advisory committee. While the advisory committee is largely
supportive of the report’s contents, listing of the committee members does not necessarily indicate their
concurrence or support for the entire report content or for the analytic methods, assumptions or conclusions
which are the sole responsibility of the authors.

Northeastern Regional Assessment of Strategic Electrification | iv
Advisory Committee Member Organization
Emily Lewis Acadia Center
J.R. Tolbert Advanced Energy Economy
Meredith Hatfield Barr Foundation
Amy Longsworth Boston Green Ribbon Commission
Peter Fox-Penner Boston University
Ryan Hopping Boston University
Jeff Schlegel Consultant
Tracy Babbidge Connecticut Department of Energy and Environmental Protection
Michael Stoddard Efficiency Maine
Kurt Roth Fraunhofer Center for Sustainable Energy Systems
Greggory Wade ISO New England
Eric Johnson ISO New England
Rebecca Tepper Massachusetts Attorney General’s Office
Christopher Walkley Massachusetts Department of Energy Resources
Larry Chretien Mass Energy Consumers Alliance
Eric Dubin Mitsubishi
Rick Nortz Mitsubishi
Jenifer Bosco National Consumer Law Center
Janet Besser Northeast Clean Energy Council
Jamie Dickerson Northeast Clean Energy Council
Arthur Marin NESCAUM
Michael Fitzgerald New Hampshire Department of Environmental Services
Paul Torcellini National Renewable Energy Laboratory
Jon Gordon New York State Energy Research and Development Authority
Janet Joseph New York State Energy Research and Development Authority
Michael Voltz PSEG
Ken Colburn Regulatory Assistance Project
David Farnsworth Regulatory Assistance Project

Northeastern Regional Assessment of Strategic Electrification | v
Danny Musher Rhode Island Office of Energy Resources
Becca Trietch Rhode Island Office of Energy Resources
Barry Coflan Schneider Electric
David Cash University of Massachusetts Boston
Richard Donnelly Vermont Energy Investment Corporation
Sarah Hofmann Vermont Public Utility Commission
About NEEP
NEEP was founded more than 20 years ago as a non-profit to accelerate energy efficiency in the Northeast and
Mid-Atlantic states. Today, it is one of six Regional Energy Efficiency Organizations (REEOs) funded, in part by the
U.S. Department of Energy to support state efficiency policies and programs. Our long-term shared goal is to
assist the region to reduce carbon emissions 80% by 2050. For more about our 2017 strategies and projects, see
this 2-page overview or these project briefs. You can also watch this brief video regarding our history.
Disclaimer: NEEP verified the data used for this white paper to the best of our ability. This paper reflects the
opinion and judgments of the NEEP staff and does not necessarily reflect those of NEEP Board members, NEEP
Sponsors, or project participants and funders.
©Northeast Energy Efficiency Partnerships, Inc. 2017

Northeastern Regional Assessment of Strategic Electrification | 1
Executive Summary
New York and the New England states have adopted aggressive greenhouse gas (GHG) emission
reduction goals. Deep decarbonization will be required to achieve these goals, and the region has made
substantial progress. Emissions from energy use in these seven states in 2015 was 19 percent less than
2001 emissions. However, there’s still a long way to go: the region’s collective objectives will require
emission reductions of about 80 percent below 2001 levels.
To date, state and market actions that reduce GHG
emissions have focused on the electric supply sector
and on increasing energy efficiency. But even
enhanced energy efficiency and carbon-free electricity
can reduce regional emissions by only about 40
percent by 2050—half the amount required. In other
words, 2050 emissions would still be triple the target
level. The remaining emissions result from direct fuel
use in buildings, transportation, and industry.
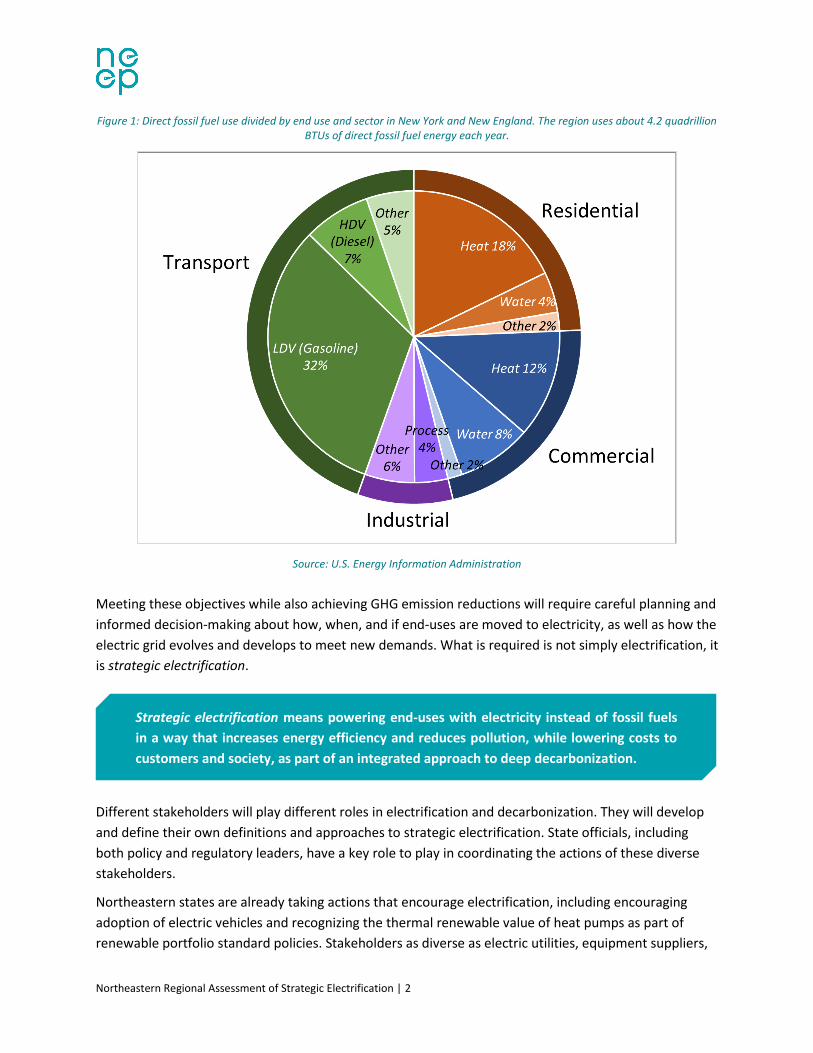
Consumers in New York and New England use about
4.2 quadrillion British thermal units (BTU) of fossil fuels
annually for direct end-uses. A small number of end-
uses account for 85 percent of this direct fossil fuel
use: space and water heating in residential and
commercial buildings; industrial process heat and
steam; and on-road vehicles.
Reducing emissions 80 percent will require adding a
third strategy: Move end-uses to electricity, and to
other lower carbon fuels where electrification is not practical. Electric technologies with the potential to
displace, and eventually replace, direct fossil fuel use are available now in the market, although at
varying levels of maturity.
This report examines electrification in detail. We show how electrification can work with efficiency and
clean electric supply to drive deep decarbonization.
Importantly, emissions reduction goes hand in hand with other goals that factor into decision-making.
State governments and other stakeholders are also pursuing objectives such as economic development,
new business opportunities, energy security, resiliency to natural or other disasters, consumer savings,
and reduction of trade deficits from the import of fossil fuels produced elsewhere.
1 Sourced from the Center for Climate and Energy Solutions, “Greenhouse Gas Emission Targets” at www.c2es.org/us-states-regions/policy-maps/emissions-targets. Note that state targets are not for energy only, and include emissions from waste, chemicals, agriculture, etc. This report addresses only energy-related emissions, and assumes the same targets would apply to energy emissions alone.
Table 1. Individual state decarbonization targets1
Connecticut 80% below 2001 levels by
2050
Maine 75-80% below 2003 levels
in the long term
Massachusetts 80% below 1990 levels by
2050
New Hampshire 80% below 1990 levels by
2050
New York 80% below 1990 levels by
2050
Rhode Island 85% below 1990 levels by
2050
Vermont 75% below 1990 levels by
2050
Northeastern Regional Assessment of Strategic Electrification | 2
Strategic electrification means powering end-uses with electricity instead of fossil fuels
in a way that increases energy efficiency and reduces pollution, while lowering costs to
customers and society, as part of an integrated approach to deep decarbonization.
Figure 1: Direct fossil fuel use divided by end use and sector in New York and New England. The region uses about 4.2 quadrillion BTUs of direct fossil fuel energy each year.
Source: U.S. Energy Information Administration
Meeting these objectives while also achieving GHG emission reductions will require careful planning and
informed decision-making about how, when, and if end-uses are moved to electricity, as well as how the
electric grid evolves and develops to meet new demands. What is required is not simply electrification, it
is strategic electrification.
Different stakeholders will play different roles in electrification and decarbonization. They will develop
and define their own definitions and approaches to strategic electrification. State officials, including
both policy and regulatory leaders, have a key role to play in coordinating the actions of these diverse
stakeholders.
Northeastern states are already taking actions that encourage electrification, including encouraging
adoption of electric vehicles and recognizing the thermal renewable value of heat pumps as part of
renewable portfolio standard policies. Stakeholders as diverse as electric utilities, equipment suppliers,

Northeastern Regional Assessment of Strategic Electrification | 3
environmental and clean energy advocates, and auto manufacturers are actively engaged in exploring
pieces of this transformation.
Figure 2. Strategic electrification in the context of decarbonization
The purpose of this report is to inform the development of regional activities, including a regional action
plan. It provides a resource to stakeholders across the region as they develop electrification strategies
that allows them to base their planning on qualitative and quantitative analysis. Section 0 assesses the
current state of technology and markets for the potentially electrifying end-uses that correspond to the
vast majority of regional fossil fuel use. Section 0 examines the policy landscape: what states are already
doing, and what options are in front of them to foster these developing technologies. Section 0 presents
the results of scenario analysis, showing the emissions reductions possible with and without
electrification and identifying the pace of market deployment of new electric technologies necessary to
reduce emissions 80 percent from 2001 levels by 2050. These scenarios show substantial increases in
electric demand: Section 0 discusses the most significant impacts of that increase on the electric grid
and on electric consumers. The report concludes in Section 0 with a discussion of near-term actions and
policy questions for stakeholder discussion in the next five years.

Northeastern Regional Assessment of Strategic Electrification | 4
Technology and Market Assessment
This section describes the end-use technologies that are considered in this study. For each technology or
end-use application, this includes a description of the technology and its current level of deployment in
the marketplace or sector. It also describes the impact that market barriers have historically had on
deployment of these technologies. See the box below for a description of barriers that typically impact
new technology deployment and market development.
Building on this assessment, each subsection includes a qualitative description of the potential for each
technology to scale over time. This assessment informs the scenario analysis found in Section 4.
The end-uses addressed in this report are space and water heat in residential and commercial buildings;
process heat and steam;2 and on-road vehicles. Together, these end-uses account for 85 percent of the
direct fossil fuel use in New York and New England. Figure 1 illustrates the breakdown across all direct
regional fossil fuel use, showing the dominance of these end-uses. (Indirect fossil fuel use resulting from
the use of electricity is not reflected here, and is not the subject of these analyses.)
2 This assessment addresses process heat and steam only in applications outside of combined heat and power (CHP) and the paper industry. The “process” wedge of Figure 1 includes only assessed end-uses.

Northeastern Regional Assessment of Strategic Electrification | 5
3 In the Northeast, overall awareness of heat pumps is quite low, according to a recent study by MacWilliams Sanders Communication and Meister Consultants Group. Consumers that do know about heat pumps frequently remember poorly performing models in the 1970’s and 80’s, or consider high costs and reliability issues of electric resistance heat. While awareness of electric vehicles is more common, some consumers remain concerned about range and performance.
4 Customers may be unwilling to learn new energy management habits that heat pumps require, and may be unwilling to change their expectations for refueling infrastructure in the case of EVs.
Overview of Typical Market Barriers for Strategic Electrification
Economic barriers. Economic barriers broadly fall into two main categories: (1) high upfront costs of replacement technologies relative to conventional technologies, and (2) slow accrual of savings due to low fossil fuel prices. Taken together these barriers create an inadequate return on investment for displacing conventional systems with electric options.
Social/institutional barriers. Social barriers primarily relate to customers’ lack of awareness3 and inertia.4 Institutional barriers act more at the organizational and societal levels, at which adoption can be limited or even disincentivized depending on economic arrangements, institutional priorities, or utility business models. A classic institutional barrier is the split incentive problem faced by landlords and tenants, whereby the benefits of an energy saving initiative accrue to a different party than the one that has control over the investment that generates those savings. Another example is least-cost procurement requirements that governments may impose on themselves.
Technical/infrastructure barriers. Technical and infrastructure barriers limit the suitability of electric technologies for deployment in wide ranges of applications. Examples include insufficient electric vehicle charging infrastructure, limited cost-effective options for heavy duty electric vehicles, limitations to the installation of ground-source heat pumps (GSHPs) in some urban areas, and limitations to the ability of air-source heat pumps (ASHPs) to reliably fulfill whole-home heating needs in cold regions.
Policy/regulatory barriers. Regulatory barriers limit the ways funds can be applied and programs can be designed. The most important example is the way in which utility energy efficiency programs are set up. Regulatory barriers inhibit the formation of effective policy and are discussed in depth in Section 3.2.
Each of these barriers plays out differently across the technologies and across the sectors. Specific barriers and policies designed to address them are described in greater detail in Section 3.

Northeastern Regional Assessment of Strategic Electrification | 6
Buildings
Across the region, energy consumption in buildings for thermal energy and HVAC applications account
for roughly one third of all energy consumption and energy-related GHG emissions.5 In particular, the
Northeast is highly dependent on fossil fuels for space heating applications, with natural gas and
delivered petroleum fuels (i.e. oil and propane) accounting for the vast majority of thermal energy
consumption.6 Achieving deep decarbonization goals across the region will require reducing thermal
energy emissions in buildings through a combination of thermal load reduction (i.e. energy efficiency
and weatherization) and replacement of fossil fuel equipment with heat pumps and/or other renewable
heating and cooling technologies.
Strategic electrification with regards to the buildings sector focuses on the displacement and
replacement of fossil fuel equipment used for space heating/cooling and domestic hot water with heat
pump technologies that operate at significantly higher efficiencies than existing electric technologies in
all climate zones of the Northeast. Notably, building space cooling and some space heating systems are
already electrified, as are other HVAC applications (e.g. ventilation). Current heat pumps can provide
higher efficiency cooling than other existing technologies and have seen robust support from utilities for
summer peak load reduction.7 Other HVAC applications have similarly been targeted by some utility
efficiency programs (e.g. through commercial/industrial custom measure programs), though are largely
not the focus of this report.
This section provides a market and technology assessment of electric replacement technologies in the
buildings sector, divided into three subsections by application: (i) residential space heating and cooling;
(ii) commercial space heating and cooling;8 and (iii) water heating.
Residential Space Heating and Cooling
Residential space heating is dominated by fossil fuels, with gas and delivered fuels serving as the primary
heating fuel for over 80 percent of one- to four-family homes across the region, as shown in Figure 3.
Gas penetration is highest in densely populated areas, serving over half of homes in New York,
Massachusetts, and Rhode Island, though gas access across the region is steadily increasing. Delivered
fuels (i.e. oil and propane) account for the majority or plurality of homes in the more rural northern
forest states. Wood heating is also common in many households in these states, with many homes using
5 Estimates vary depending on the state as well as on the scope of building-related energy consumption included in estimates: for example, Rhode Island estimates approximately 35 percent of energy-related GHG emissions are related to thermal energy (RI Division of Planning, 2015. Energy 2035: Rhode Island State Energy Plan), while New York estimates that 32 percent of energy-related GHG emissions are related to building HVAC systems (which include thermal energy) (NYSERDA (2017) RH&C Policy Framework) and Massachusetts estimates 36 percent of energy-related GHG emissions are related to non-electricity building energy consumption (MA DEP 2016, 2014 GHG inventory).
6 U.S. EIA Residential Energy Consumption Survey 7 Most utilities and utility efficiency programs in CT, MA, NY, and RI (the warmer Northeastern states) provide rebates for high-
efficiency cooling at the residential sector: Mass Save, EnergizeCT, National Grid (RI/NY), ConEd, and others offer residential rebates for heat pumps, primarily based on their ability to reduce cooling energy consumption and demand.
8 Space heating and cooling technologies and markets for the industrial sector are similar to those in the commercial sector and are included in this subsection. Industrial process heating applications (e.g. steam, direct heat) are discussed in Section 2.2.

Northeastern Regional Assessment of Strategic Electrification | 7
a mix of delivered fuels and wood heating (e.g. central oil heating with pellet stove for supplemental
heating).
Additionally, while over 70 percent of homes in the United States have forced-air distribution (including
electric heat pumps, the majority of which are central heat pumps using forced-air distribution) only
about 54 percent of homes in the Northeast have forced-air distribution systems.9
Figure 3: Primary heating fuels in one- to four-family homes in the Northeast and by state
Source: American Community Survey 2015, 5-year estimates
Residential space cooling is provided by a mix of central and window AC units. Due to relatively mild
summers, approximately half of homes use window AC units and a large number of homes across the
region lack AC entirely (nearly one quarter of homes in New England).10
Potential electrification technologies in the residential sector include air-source heat pumps and ground-
source heat pumps.
Air-source heat pumps (ASHPs), which use an electric-powered vapor compression cycle to transfer heat in and out of buildings, using ambient thermal energy in the air as a reservoir. A wide range of ASHP systems are available, ranging from single-head ductless to multi-head ductless and ducted to central ducted systems. As discussed further below, the variety of applications provide flexibility for replacing or displacing heating systems across the diverse housing stock of the Northeast.
9 U.S. EIA Residential Energy Consumption Survey (RECS) 2015 – Table HC6.7 (includes NJ/PA) 10 RECS 2015 – Table HC7.7 (includes NJ/PA)

Northeastern Regional Assessment of Strategic Electrification | 8
Ground-source heat pumps (GSHPs), use a vapor compression cycle similar to ASHPs but use the ground (or groundwater) as a heat reservoir, which can offer higher efficiencies at low or high outdoor air temperatures due to the more consistent temperature of the earth year-round. GSHP can also provide domestic hot water through desuperheaters.
The status of these technologies and the market penetration and growth are described in Table 2 and
Table 3 respectively:
Table 2: Technology status for residential sector building electrification technologies
Air-source heat pumps Ground-source heat pumps
Until recently, ASHPs had not achieved optimal cold climate performance. In recent years, the technology has advanced and new models perform at high efficiency at 5°F. They can extract useful heat from ambient air down to -15°F. For more information, see NEEP’s ccASHP specification.11
While most ASHPs installed in the United States are “air-to-air” systems, “air-to-water” systems designed for integration into hydronic distribution systems are popular in Asian and European markets. These systems will perform most efficiently at low hydronic supply water temperatures (e.g. 120°F), which may limit retrofit applications in existing buildings.12
GSHPs are an established technology with a variety of different options for the ground loop (e.g. closed loop, open loop, direct exchange) and wells (e.g. horizontal, vertical, standing column). Ground loops can also be placed within nearby bodies of water at significantly lower cost due to lack of drilling.
11 http://www.neep.org/initiatives/high-efficiency-products/emerging-technologies/ashp/cold-climate-air-source-heat-pump 12 https://blog.heatspring.com/low-ambient-air-water-heat-pumps/
http://www.greenbuildingadvisor.com/articles/dept/musings/air-water-heat-pumps

Northeastern Regional Assessment of Strategic Electrification | 9
Table 3: Market status for residential sector building electrification technologies
Air-source heat pumps Ground-source heat pumps
ASHP systems that have been installed across the region are primarily 1-2 single-head systems for supplemental heating/cooling, while (near) whole-home ASHP adoption has been significantly more limited. ccASHP growth has been rapid across the region, with approximately 70,000 units installed in the Northeast in 2015.13 However, overall market penetration remains low due to a range of market barriers. ASHP deployment per capita is highest in Maine, likely due to the very high share of heating oil in homes. While approximately 3 percent of homes in the Northeast use heat pumps,14 it is estimated that the majority of these homes are using non-cold climate systems.
Air-to-water heat pump systems have near-zero penetration in the Northeast. As a result, they have higher costs and a lower contractor base, which will present barriers to their rapid adoption in the near future.
The GSHP market is nascent, with a relatively small number of installations at the residential level accounting for <1 percent of homes.15 Annual installations across the Northeast are low compared to ASHP due in part to significantly higher upfront costs and lower rebate availability. GSHP installations have often occurred in larger homes given the high capital cost.
Increases in market growth are not expected following the exclusion of GSHP from the extended federal residential investment tax credit at end of 2016.16
Potential for market scale
Heat pump technologies are somewhat limited by turnover of existing heating systems. The annual
replacement rate of space heating systems is estimated at <5 percent per year across the approximately
10.5 million one- to four-family homes in the Northeast.17 While the share of heat pumps in new
construction is higher than in retrofits (roughly 8 percent in the Northeast),18 new construction across
the region is limited, with growth in one- to four-family housing stock of <0.4 percent per year.19
Notably, a majority of ASHP systems installed in the Northeast are not whole-home heating
replacement, but instead are installed to provide supplemental heating and/or cooling (i.e. 1 or 2 single-
head systems). Thus many of these systems are being installed to displace fuel consumption from
existing fossil fuel systems and are being installed somewhat independently of normal replacement
13 http://www.neep.org/sites/default/files/NEEP_ASHP_2016MTStrategy_Report_FINAL.pdf 14 RECS 2015– HC6.7 15 Market data regarding the penetration of GSHP across the region is generally poor, with limited data on annual and
cumulative installations: NYSERDA’s 2017 RH&C study estimated that <1 percent of NY’s HVAC load was served by GSHP. 16 http://programs.dsireusa.org/system/program/detail/1235 17 ACS 2015 5-year estimate 18 Northeast Regional Census Estimate (2015) https://www.census.gov/construction/chars/pdf/c25ann2015.pdf 19 US Dept of Commerce (2015). 2015 Characteristics of New Housing:
https://www.census.gov/construction/chars/pdf/c25ann2015.pdf

Northeastern Regional Assessment of Strategic Electrification | 10
cycle. With the more recent growth in ccASHP installations, it is unclear what customers who have
installed heat pumps for supplemental heating will use to replace primary heating systems (given
limitations in heat pump ability to serve whole-home heating load in the majority of residential buildings
without significant weatherization work and/or improvements in cold climate performance).
In addition to slow turnover, heat pumps face other barriers to adoption. Upfront cost is still a
significant barrier. While heat pumps can offer energy savings against oil, propane, and electric
resistance, timelines for achieving payback can be lengthy depending on the cost of the fuels
displaced.20 Moreover, heat pumps are not cost-competitive against natural gas in retrofit applications
due to the relatively low cost of gas and high cost of electricity across the region. For new construction,
the economics of heat pumps can be favorable even against natural gas. Performance is another barrier.
While ASHP cold climate performance has improved, there is still a significant reduction in heating
capacity below 0°F (and these systems shut down below -15°F). Therefore, most systems are not able to
effectively serve whole-home heating loads in much of the Northeast without a backup system, with the
exception of “tight” homes. There are also concerns about GSHP performance in residential
installations, given the need for super high-efficiency performance to offset the significantly higher
upfront cost of GSHP. A 2016 field study of 37 homes in Minnesota found that while median heating and
cooling efficiencies were comparable to expectations, there was wide variability in performance.21 Home
suitability is another barrier, particularly for GSHP. The need for drilling/excavation limits uptake in
retrofit applications, particularly in urban areas where available land area can be limited and permitting
processes can be more challenging.
Future developments hold great promise in the residential heating and cooling sector. On the ASHP
side, cold climate performance and efficiency have improved markedly in recent years, and
manufacturers expect to continue working towards improved efficiencies and heating output at low
temperatures. This will enable ASHPs to more effectively serve whole-home heating loads in a larger
share of buildings without relying on backups. The growth of ductless systems will also provide more
flexibility in non-forced air homes, and newer multi-head ductless systems provide a greater range of
options for displacing a larger share of home heating and cooling loads. Central ducted systems may also
play a larger role in the future (either to supplement or replace existing systems) due to the fact that
most homes in the Northeast use forced air distribution.22 Overall, we should see substantial market
growth as customer awareness of the suitability of ASHP for a wider range of applications and the
improving performance of cold climate systems increases.
On the GSHP side, growing the market will help achieve economies of scale. While new GSHP
technologies and designs (e.g. co-axial or twister loops, use of underground thermal energy storage,
integration of solar thermal) are being tested, these alternatives are not yet cost-effective and have not
20 NYSERDA (2017) RH&C Policy Framework; Gronli et al. (2017) Feasibility of Renewable Thermal Technologies in Connecticut 21 http://mn.gov/commerce-stat/pdfs/card-residential-gound-source-heat-pump-study.pdf 22 Cadmus DMSHP Report (2016)

Northeastern Regional Assessment of Strategic Electrification | 11
seen broader uptake across the industry.23 With support from state policymakers (e.g. the New York
State Energy Research and Development Authority), industry may focus on driving cost reductions
through the value chain primarily related to non-equipment costs—potentially in looking at drilling and
other non-equipment costs.24 GSHP market growth will likely be higher in regions that are experiencing a
higher rate of new construction, due to the fact that the capital cost is lower in new construction than in
the retrofit market.
For the most difficult applications to electrify, fossil-fuel alternatives to heat pumps are available,
though these technologies also face barriers. Wood pellet boilers or furnaces are central systems that
can fully replace conventional boilers and furnaces (as opposed to more common wood stoves across
the region). Uptake of these systems has been limited by high upfront costs and high fuel costs that limit
cost-competitiveness against other fuels. Moreover, pellet fuels are less available in states like
Connecticut and Rhode Island which have limited or no in-state production. Solar thermal (air heating)
can provide supplemental space heating, though is less commercially viable at the residential level and
faces challenges related to diminishing capacity during periods of highest demand. Biodiesel can be
blended into heating oil on a near 1:1 replacement to reduce emissions. There are some challenges
associated with increasing biodiesel blends in heating oil. These include equipment limitations on higher
blends (B5+) and challenges with the higher gel point of biodiesel relative to heating oil, which can clog
filters, pumps, tanks, and other equipment and limit applicability in colder Northeastern states.25
Commercial Space Heating and Cooling
Commercial space heating is similarly dominated by fossil fuels, with large commercial buildings
primarily gas heated and small commercial buildings more reliant on delivered fuels and electricity.
Commercial buildings (esp. larger buildings) often have multiple systems serving heating and cooling
loads (e.g. water source heat pump plus boiler and cooling tower). Space cooling is common across most
commercial buildings for occupant comfort.
23 GSHP industry engagement interviews and workshops completed through the NYSERDA RH&C Cost and Cost Reductions Advisory Committee (2016).
24 NYSERDA (2017) RH&C Policy Framework. 25 http://www.energy.ri.gov/documents/Efficiency/Rhode%20Island%20Renewable%20Thermal%20Market%20
Development%20Strategy%20January%202017.pdf

Northeastern Regional Assessment of Strategic Electrification | 12
Table 4: Prevalence of each fuel among commercial buildings in the Mid-Atlantic and New England regions
% of total buildings % of commercial square footage
Natural Gas 50% 56%
Fuel Oil 19% 13%
Electricity 19% 15%
Other (propane, wood, district heating, etc.)
12% 17%
Numbers may not sum to 100 percent due to rounding. Source: U.S. EIA, 2012 Commercial Buildings Energy Survey
Potential electrification technologies in the commercial sector are similar to the technologies in the
residential sector, though variable refrigerant flow (VRF) technologies are also an option for larger
commercial buildings. Table 5 describes the market status for each of the technologies listed below.
ASHP technologies used in the residential sector can be a good fit for small commercial buildings, which often have similarly-sized conditioned spaces to residential buildings. Given the similarities in market and technology status, discussion in this section will focus on large commercial ASHP applications, for which large-scale variable refrigerant flow technologies are more suitable.
Variable refrigerant flow describes a similar technology to ASHP (using refrigerant and vapor compression to extract and reject heat from surrounding air), though sized for larger commercial heating and cooling loads. VRF systems run at varying speeds to provide zoned heating and cooling to different parts of a commercial building.
GSHP technologies used in the commercial sector are similar to those in the residential sector, but on a larger scale and requiring more wells for the increased heating and cooling load.

Northeastern Regional Assessment of Strategic Electrification | 13
Table 5: Market status for commercial sector building electrification technologies
Air-source heat pumps Variable refrigerant flow systems Ground-source heat pumps
Limited uptake, but Vermont and Maine programs are leading to the installation of ductless minisplits by small businesses.
VRF is an emerging technology in the Northeast. Some VRF systems can enable different zones to heat and cool simultaneously. Similar to ASHP, recent advances have aimed to improve cold climate performance.
The U.S. VRF market is similarly nascent, with the technology introduced to the market in 2003.26 VRF technology is commonplace in Asian markets, accounting for approximately 50 percent of small/medium commercial buildings and nearly 30 percent of large commercial buildings in Japan.27
GSHP market is small for commercial buildings, at ~1-2 percent of market. Installation costs are notably lower on a per-ton basis relative to residential due to economies of scale (e.g. installation and drilling labor, technology costs).28 Unlike residential systems, commercial scale GSHP systems can still receive a 10 percent business investment tax credit.29
Potential for market scale
Similar to the residential sector, heat pump adoption is limited by slow replacement of technologies,
with an annual replacement rate of <5 percent. While supplemental applications for ASHP may be
possible in small commercial buildings to increase adoption outside of normal replacement cycles (as
seen by limited uptake of ductless minisplits through Efficiency Vermont and Efficiency Maine small
business programs), large commercial heating and cooling systems will require full replacement with
VRF or GSHP systems.
The barriers to heat pump adoption in the commercial sector overlap with the barriers in the residential
sector. Slow system turnover, lack of cost competitiveness, performance, and site suitability are primary
concerns. In addition, there are some non-technology barriers including split incentives and lack of
awareness. Split incentive challenges are greater in the commercial sector due to a higher share of
rented buildings compared to the residential sector (>50 percent of square footage and ~44 percent of
buildings are at least partially rented).30 And the decision-makers who purchase energy systems for
commercial buildings may be less directly involved with the operation of the heating and cooling
systems beyond providing the necessary comfort to occupants.
26 Mitsubishi Electric. (2016). Advanced Heating Technology: Applying VRF in Cold Climates (White Paper). 27 http://www.asiagreenbuildings.com/7809/development-market-penetration-vrf-systems-asia/ 28 NYSERDA (2017) RH&C Policy Framework 29 http://programs.dsireusa.org/system/program/detail/658 30 Commercial Buildings Energy Consumption Survey (2012) https://www.eia.gov/consumption/commercial/data/2012/

Northeastern Regional Assessment of Strategic Electrification | 14
Future developments may gradually overcome these barriers. As noted above in the discussion of
residential heating and cooling, the steady improvement of technology will help expand the number of
sites suitable for electrification of heating. The discussion of improved cold climate performance is
equally relevant to the commercial sector, and the growth of economies of scale in these nascent
industries will benefit ASHP and GSHP purchasers in all building sectors. Notably, some higher education
institutions are beginning to invest more in geothermal to achieve campus energy goals, and NYSERDA
in particular is developing a program to drive GSHP adoption in higher education. While most GSHP
systems are installed in individual buildings, GSHP can also be installed at a district scale, providing
thermal energy to multiple campus buildings using the same loop field. For instance, Ball State
University is in the process of drilling 3,600 wells to replace boilers in 47 buildings.31 This can yield many
benefits and cost efficiencies when properly designed. Higher education institutions and developers of
office parks may be good candidates for this type of district installation, particularly in new construction.
Public buildings subject to “Lead by Example”-type policies may also help drive accelerated deployment
of commercial-scale heat pumps, which could have a significant impact given that 20-25 percent of
commercial building square footage is government-owned.32
There will be buildings that are difficult to electrify in the commercial sector. The non-electric fossil-fuel
alternatives that were discussed in the context of residential buildings are also available in the
commercial sector. In particular, biomass thermal boilers using wood pellets or chips are more common
at the commercial level, with a relatively higher number of wood pellet/chip installations in schools in
Northern forest states. Likewise, solar thermal (air heating) can provide space heating and is more viable
at the commercial scale than the residential scale. Finally, biodiesel blending into heating oil is an
option, as discussed above.
Water Heating
Water heating is similarly dominated by fossil fuels. Most buildings with access to gas heating using gas
for both space heating and hot water heating. There is a significantly greater share of electric resistance
water heating, particularly in homes served by delivered fuels, due to the relatively low upfront cost of
electric water heaters.
31 http://cms.bsu.edu/about/geothermal 32 Commercial Buildings Energy Consumption Survey (2012) https://www.eia.gov/consumption/commercial/data/2012/
Northeastern Regional Assessment of Strategic Electrification | 15
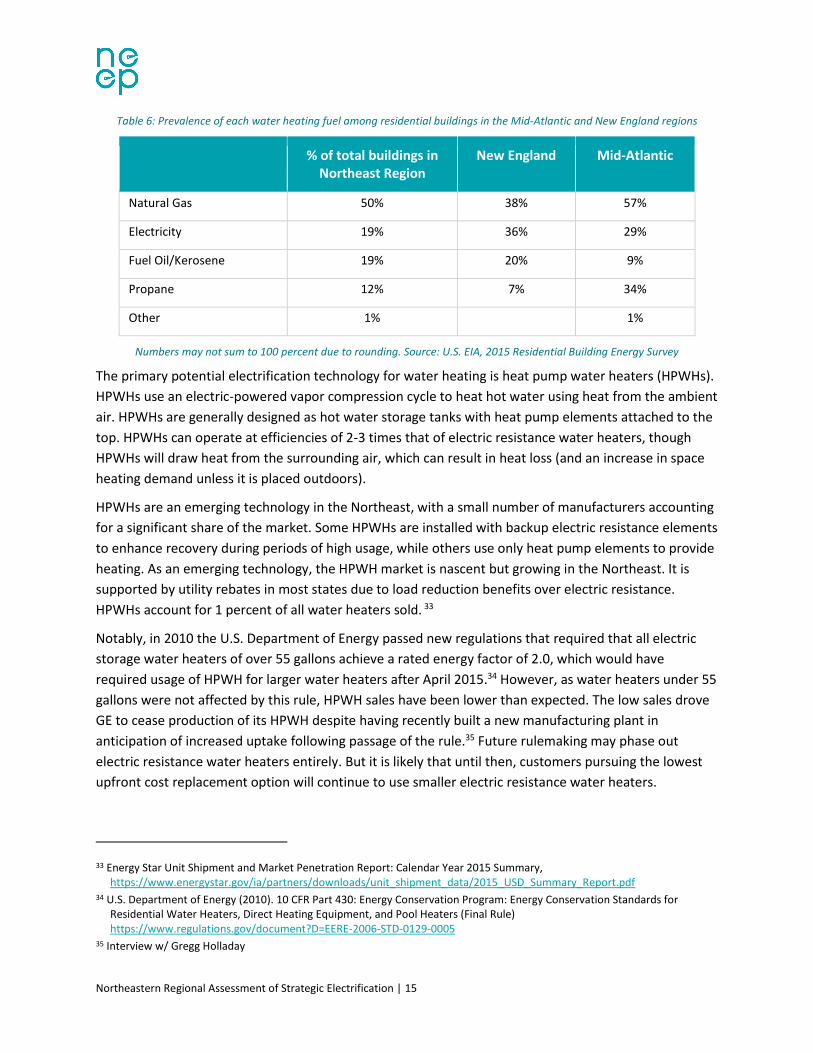
Table 6: Prevalence of each water heating fuel among residential buildings in the Mid-Atlantic and New England regions
% of total buildings in Northeast Region
New England Mid-Atlantic
Natural Gas 50% 38% 57%
Electricity 19% 36% 29%
Fuel Oil/Kerosene 19% 20% 9%
Propane 12% 7% 34%
Other 1% 1%
Numbers may not sum to 100 percent due to rounding. Source: U.S. EIA, 2015 Residential Building Energy Survey
The primary potential electrification technology for water heating is heat pump water heaters (HPWHs).
HPWHs use an electric-powered vapor compression cycle to heat hot water using heat from the ambient
air. HPWHs are generally designed as hot water storage tanks with heat pump elements attached to the
top. HPWHs can operate at efficiencies of 2-3 times that of electric resistance water heaters, though
HPWHs will draw heat from the surrounding air, which can result in heat loss (and an increase in space
heating demand unless it is placed outdoors).
HPWHs are an emerging technology in the Northeast, with a small number of manufacturers accounting
for a significant share of the market. Some HPWHs are installed with backup electric resistance elements
to enhance recovery during periods of high usage, while others use only heat pump elements to provide
heating. As an emerging technology, the HPWH market is nascent but growing in the Northeast. It is
supported by utility rebates in most states due to load reduction benefits over electric resistance.
HPWHs account for 1 percent of all water heaters sold. 33
Notably, in 2010 the U.S. Department of Energy passed new regulations that required that all electric
storage water heaters of over 55 gallons achieve a rated energy factor of 2.0, which would have
required usage of HPWH for larger water heaters after April 2015.34 However, as water heaters under 55
gallons were not affected by this rule, HPWH sales have been lower than expected. The low sales drove
GE to cease production of its HPWH despite having recently built a new manufacturing plant in
anticipation of increased uptake following passage of the rule.35 Future rulemaking may phase out
electric resistance water heaters entirely. But it is likely that until then, customers pursuing the lowest
upfront cost replacement option will continue to use smaller electric resistance water heaters.
33 Energy Star Unit Shipment and Market Penetration Report: Calendar Year 2015 Summary, https://www.energystar.gov/ia/partners/downloads/unit_shipment_data/2015_USD_Summary_Report.pdf
34 U.S. Department of Energy (2010). 10 CFR Part 430: Energy Conservation Program: Energy Conservation Standards for Residential Water Heaters, Direct Heating Equipment, and Pool Heaters (Final Rule) https://www.regulations.gov/document?D=EERE-2006-STD-0129-0005
35 Interview w/ Gregg Holladay
Northeastern Regional Assessment of Strategic Electrification | 16
Potential for market scale
Just as in the case of building heating systems, HPWH technologies are somewhat limited by turnover of
existing water heating systems. Among the approximately 10.5 million one- to four-family homes in the
Northeast, the annual replacement rate of domestic hot water systems is less than 10 percent.
Additional barriers to adoption include upfront cost, lack of building suitability, and lack of planning for
replacement prior to equipment failure. While HPWHs can offer significant energy savings against
electric resistance and delivered fuel water heaters, they are not cost-competitive against gas in the
Northeast due to high electricity prices and low gas prices. Not all buildings are suitable for HPWHs.
HPWHs must be placed in a large, high-ceiling room to ensure sufficient air-flow to maintain
performance and efficiency.36 Sufficient ambient air temperature is also necessary to maintain
efficiency, and HPWHs should ideally be placed in unconditioned basements (as placement in
conditioned spaces will cause greater space heating loss).37 Larger-scale HPWHs are not yet available on
the market, and placing a large number of HPWHs in one space can significantly affect space heating.
HPWHs are also noisier than other water heaters. Finally, over 80 percent of water heater replacements
in the United States are due to emergency replacement (e.g. failure or in need of servicing).38 Customers
in need of an emergency replacement typically lack the time to conduct research about energy savings
and available rebates, and thus customers shopping for a new water heater often lack awareness of
HPWHs as a cost-effective alternative to electric resistance water heaters.
A number of future developments could positively affect the potential for HPWHs to contribute
significantly to strategic electrification. Rebate programs are beginning to be applied upstream rather
than as a mail-in program, which can have a tremendous impact on the number of installations.39
Modifications to HPWH rebate structures (including upstream rebates to distributors that require them
to have HPWHs in stock), as well as greater emphasis on marketing HPWHs as cost-effective energy
efficiency measures to electric water heating customers could result in significantly greater uptake
across the region. Manufacturers are also aiming to improve the efficiency and recovery rate of HPWHs
to make them more cost-competitive against natural gas. Some recent models of HPWHs are rated with
energy factors of over 3.0; models with even higher coefficients of performance (COP) are available in
Japan.
There will remain some water heating applications that are not suitable for HPWHs. Fossil-fuel
alternatives are available for providing water heating, both as standalone technologies and as
attachments to heat pump and other primary heating systems. Solar hot water (SHW) systems are a
well-established technology that can provide 60-80 percent of a home’s domestic hot water load
depending on placement and insolation. SHW systems require a backup system when solar insolation
36 https://www1.eere.energy.gov/buildings/publications/pdfs/building_america/measure_guide_hpwh.pdf 37 Ibid. 38 https://www.energystar.gov/sites/default/files/asset/document/1_Francois%20LeBrasseur_Early%20and%20Often
_FINAL.pdf 39 EnergizeCT changed its HPWH rebate program from a mail-in rebate program to an upstream rebate applied at point of sale
in 2014. This resulted in an over 600% increase in installations from 2013 to 2014. https://www.energystar.gov/sites/default/files/asset/document/3_Jennifer%20Parsons_Early%20and%20Often_FINAL.pdf

Northeastern Regional Assessment of Strategic Electrification | 17
drops in winter months. The freeze protection requirements for systems in the Northeast result in
higher upfront and maintenance costs for systems. Additionally, desuperheaters can be added to GSHP
systems to use waste heat from the compression cycle to heat domestic hot water through a secondary
heat exchanger. Desuperheaters provide auxiliary heat to an existing hot water system and typically
cannot produce enough heat alone during non-cooling seasons. For buildings using biomass heating,
indirect fired water heaters can be added to biomass heating systems to provide domestic hot water in
addition to space heating. Finally, just as in the space heating sector, biodiesel can be blended into
heating oil.
Industry
Electrification Opportunities in Industry
The industrial sector includes a diverse range of business models and technologies. Traditional heavy
industry, such as manufacturing of glass, steel, and concrete, fall into this category along with relatively
small-scale, value-added processes such as preparation of specialty foodstuffs. The assessment
conducted in this report explores electrification opportunities in four particular industries:
manufacturing of food; chemicals; non-metallic minerals (glass and cement); and primary metals (iron
and steel, aluminum, and other metals). These industries were chosen based on two criteria. First, they
represent large portions of industrial fuel consumption in the Northeast (Table 7). Second, fuel use in
these industries is independent of byproducts of the industries themselves. Much direct use of fossil
fuels in industry is difficult to electrify because the fuel is burned along with an industrial byproduct. For
example, the paper industry burns large amounts of a waste product called “black liquor” that is
produced during papermaking. However, natural gas is often blended into the combustion mix to
improve the properties of the fuel or to ensure an easily-controllable level of combustion. Electrifying
this use of natural gas and similar “co-firing” uses of fossil fuels would require either fundamental
changes to the industrial processes in question or creation of a new (and potentially costly) waste
stream. As such, these industries were judged to have low potential for electrification.

Northeastern Regional Assessment of Strategic Electrification | 18
Table 7. Fuel use by industry in the Northeast Census Division
Industry Percent of Fossil Fuel Usea
Selected for Further Analysis?
Primary Metals 26% Yes
Paper 15% No; fuel is co-fired with process byproduct
Chemicals 14% Yes
Petroleum and Coal Products 11% No; fuel is co-fired with process byproduct
Nonmetallic Mineral Productsb 9% Yes
Food 9% Yes
All Othersc 14% No; impractical due to diversity of processes
a Fossil fuels defined as oil, natural gas, and coal; data from the 2010 Manufacturing Energy Consumption Survey (MECS), Table 3.2
b This industry includes both concrete and glass production
c “All Others” comprises an additional 15 industries as classified by NAICS codes
The direct uses of fossil fuels in industry are as diverse as the industries themselves. The Energy
Information Administration (EIA) measures 11 separate “end-uses” of fuel in the industrial sector,40
ranging from onsite transportation of raw, semi-finished, and finished materials to combined heat-and-
power generation. The dominant end-use in terms of fuel consumption can also vary widely by industry.
In general, end-uses can be separated into “process” and “non-process” applications. “Process”
applications are those uses of fuel which directly power the core activity of the industry itself. For
example, melting silica (sand) to produce glass is one of the key steps of the glassmaking process. “Non-
process” uses are those which support the core activity but are not in and of themselves part of it. The
truck that transports sand from a receiving dock to a glassmaking furnace is employed in a non-process
use and the diesel with which that truck is fueled would be considered part of non-process fuel use. The
industrial component of this assessment considers only process-related uses of fuel, because
electrification of non-process uses (including transportation and space heating and cooling) is similar in
the industrial sector to corresponding shifts in the commercial and residential sectors.
This assessment concentrates on two particular process uses: direct use of fuels to generate dry heat,
and use of fuels in boilers to generate steam (which can be considered “wet heat”). Many non-heat-
related process uses are essentially impossible to electrify41—and, moreover, constitute a very minor
component of industrial fuel use. Process heating and steam generation are, quite simply, the dominant
forms of industrial fuel usage. Nationally, these end-uses account for 86 percent of industrial
40 2010 MECS, Table 5.2. 41 For example, fossil fuels and their derivatives (including methane from natural gas and alcohol distilled from petroleum) are
used as a direct feedstock in chemical synthesis processes. For these uses, biofuels may be a suitable replacement.

Northeastern Regional Assessment of Strategic Electrification | 19
consumption of fossil fuels.42 The percentage is somewhat less in the Northeast, where combined-heat-
and-power is more common. Nonetheless, no other end-use approaches the importance of process
heating and steam generation. Conversion of only one-fifth of the fuel used for heat and steam to
electricity would be equivalent to electrifying the entirety of every other industrial use of fossil fuel. As
such, while it may be possible to electrify certain other process uses, the most strategic electrification
opportunities focus on heat and steam.
Electrification of Process Heating
Direct process heating accounts for the majority of fuel use in both the non-metallic mineral and
primary metal industries. Process heating represents at least 78 percent of fuel use in the former and 80
to 90 percent of fuel use in the latter.43 In sum, process heating in these industries accounts for
approximately 50 TBTU/year of the 54 TBTU/year total fuel consumption by the mineral and metal
industries. This equates to around 14 percent of total industrial use of natural gas, coal, and oil in the
Northeast, resulting in annual emissions of over 3.4 million metric tons of carbon dioxide (CO2).
Much of this fuel usage can be electrified by focusing on commercially available technologies in two key
applications: glassmaking and production of iron, steel, and other metal products. Based on the mass
and value of product produced in each industry, these particular applications are likely the dominant
fuel users within their respective industries in the Northeast.44 For both applications, the bulk of the
region’s fuel use and industrial activity is centered in New York. New York State alone represents over
half of the glass, iron, and steel value produced in the Northeast region.
For both glassmaking and steel production, the primary electrification technology is electric furnaces. In
both applications, heat is applied to a raw material to transform it into a semi-finished process. In
glassmaking, furnaces are used to melt raw silica feedstocks and anneal (or harden) the newly formed
glass. In steelmaking, furnaces are used to both melt iron and to chemically convert it into steel.
Different electric furnace types are required for each application. Electric steelmaking (and processing of
other metals) relies on arc furnaces, which run electric current through the metal stock that is to be
melted (Figure 4). The electric current also allows the necessary chemical reactions to occur that
transform iron into steel. Electric arc furnace technology is mature and has gained wide market share in
the United States. Nationally, electric arc furnaces have represented over half of all steel production on
a per-ton basis since the early 2000s and have accounted for over 60 percent of all steel production
since 2009.45 In the Northeast, electricity represents approximately a fifth of the total energy usage in
iron and steel production.46 However, because electric arc furnaces are more thermally efficient than
traditional fossil-fired blast furnaces, this value suggests that electric technologies have become a major
part of the iron and steel industry in the Northeast. Little further development is required to advance
42 2010 MECS, Table 5.2. 43 2010 MECS, Table 5.2. Range due to fuel use for which end use was not reported. 44 U.S. Census Bureau, 2012 Commodity Flow Survey. 45 http://usa.arcelormittal.com/sustainability/our-business/the-steel-industry/industry-statistics 46 2010 MECS, Table 3.2.

Northeastern Regional Assessment of Strategic Electrification | 20
this technology. Instead, increasing adoption depends mostly on considerations related to turnover and
the economics of the industry, as discussed below.
Figure 4. Schematic of an electric arc furnace.
Fully electric glassmaking furnaces use a different, and more familiar technology: resistance heating,
similar to a household toaster oven. In this technology, electric current is run through a heating element
made of a material that conducts electricity poorly, thereby converting most of the electric power to
heat. For glassmaking (unlike for household applications), the heating element must be made of a
specialized material called a “refractory” material that can withstand very high temperatures (up to the
1700°C temperatures used in processing of heat-resistant glass47). This requirement adds some cost.
Development of higher-performance, lower-cost refractories is an important area of future
improvement for fully-electric glassmaking, However, glassmaking can also be partially electrified:
electricity can be used to control the flow of molten glass, improving heat distribution in the glass melt
and reducing the need for fossil-fired heat. Both of these technologies are commercially mature but
have not gained significant market share. While electricity accounts for over 20 percent of process
heating energy usage in production of blown glass, this subset of glassmaking consumes little fuel
compared to production of plate glass and glass containers. Electricity accounts for only approximately
10 percent of process heating energy usage in the production of these bulk commodities.48
Electrification of Process Steam Generation
Like the minerals and metals industries, the chemical and food industries rely on substantial inputs of
heat, which is mainly produced by combusting fossil fuels. In the production of chemicals and food,
however, most process heat is delivered along with moisture, in the form of steam. High-quality steam
(that is, steam at a high temperature and with a sufficient ratio of water vapor to air) is generally
produced in fossil-fired boilers or as one output of on-site combined heat-and-power generation. Steam
47 http://www.lehigh.edu/imi/teched/GlassProcess/Lectures/Lecture03_Hubert_industglassmeltfurnaces.pdf 48 2010 MECS, Tables 3.2 and 5.2
In electric arc furnace-
based steelmaking,
electric current travels
through solid iron,
melting and
transforming it into steel
without burning fuel.

Northeastern Regional Assessment of Strategic Electrification | 21
generation in the chemical and food industries in the Northeast accounts for approximately 78 TBTU of
fuel consumption, or about 21 percent of industrial fossil fuel use in the region. This consumption of
fossil fuels results in annual emissions of approximately 4.6 million metric tons of CO2.
Steam is primarily used as a medium to transfer heat, either through direct contact or through
contacting systems called “heat exchangers.” Compared to direct process heating, steam is a favorable
medium for heat transfer because factors such as the temperature of the steam, the flow rate of the
steam, and the shape of the area of contact between the steam and the process components to be
heated are all easy to control. Steam is therefore used in many situations that are sensitive to both too-
low and too-high temperatures. For example, steam can be used to cook or pasteurize processed food
products. Steam can also be easily moved from one location to another, increasing the spatial flexibility
of application of steam heat as compared to direct process heating.
Some uses of steam can be electrified by conversion to direct electric heating, however the favorable
properties of steam mean that most electrification of steam generation must be through replacement of
fossil heat as applied to water with heat produced using electricity. Full electrification of steam
generation depends on completely replacing fossil-fired boilers with electric technologies. The simplest
and most common of these technologies is electric boilers based on resistive heating. Depending on the
requirements of the specific process (for example, steam temperature or purity), several other electric
heating technologies may be suitable. These include electrode and induction boilers as well as
microwave heating. Electrode boilers operate on a similar principle to arc furnaces: current is run
directly through the water itself (with added salt), meaning that water serves as the heating element of
the boiler. Induction boilers use a rapidly rotating magnetic field to generate heat directly within a metal
vessel containing the water to be boiled. Microwave heating in industry is identical in concept to home
microwave use, and it can be applied to water or to a process component directly.
These technologies are, in general, commercially mature. However, boiler design and performance
would be expected to undergo some amount of improvement with greater scale-up. However, no major
advances are required to prepare them for commercialization. While electric boilers respond more
rapidly than fossil-fired boilers, they have several important limitations. Most notably from a technical
standpoint, electric boilers are relatively limited in size and maximum steam pressure output as
compared to the largest traditional boilers. Incremental improvements in design and capabilities of
electric boilers would widen the scope of specific industrial processes for which these boilers are
suitable.
In many applications, partial electrification of steam generation may be a simpler path to reducing (if
not eliminating) use of fossil fuels. Electric resistance heating can be used as a pre-heating method to
reduce the amount of energy input required from a traditional fossil boiler. Similarly, a process known as
“mechanical vapor recompression” can take partially spent steam and recondition it through
compression with an electrically driven compressor system. Compression of steam increases its
temperature, and as such re-compressed steam can be recycled into other processes without having to
fully condense the water vapor and re-boil it. Mechanical vapor recompression can offer considerable
cost savings because re-compressing steam that has already been generated requires much less energy

Northeastern Regional Assessment of Strategic Electrification | 22
than generating steam from water.49 However, while this technology can reduce input of fossil fuels, it
cannot in and of itself eliminate fossil fuel usage in steam generation.
In total, electricity accounts for very little of the steam generation-related energy usage in the food and
chemical industries in the Northeast. Indeed, electricity accounts for only 1 to 3 percent of process
heating energy consumption nationally.50 This suggests that, unlike direct process heat, electric steam
generation has simply not found an area in which it can achieve wide adoption given current levels of
performance and cost.
Scale of Potential Adoption
From a purely technical standpoint, it is likely feasible that all or nearly all of fossil fuel use for process
heat and steam generation in the Northeast can be electrified over the near- and mid-term futures.
Achieving high levels of electrification would sharply reduce overall energy usage for this sector,
because electric heating is in general more efficient than combustion-based heating. Electric heating
technologies are generally more rapidly-responding than fossil-fired technologies, enabling greater
flexibility in operations. Industrial electrification also opens up opportunities for large amounts of
demand response (as discussed further below). Improvement of load factor and participation in demand
response programs can act to defray increased electric bills for industrial facilities that pursue
electrification.
However, there are barriers that impede the potential scale and speed of additional adoption. The
largest of these is the amount of investment that has been sunk into the existing process infrastructure.
Industrial process equipment is not governed by the same stock turnover dynamics as consumer-facing
products. Instead, industrial facilities are configured around a specific process, with the anticipated lives
of investments often stretching to decades. Rather than wholesale replacement, process equipment is
maintained and replaced on an ongoing, piecemeal basis. As such, electrification of industrial processes
requires a significant one-time level of capital expenditure on the part of individual businesses to
replace incumbent technologies. Because there are far fewer industrial facilities than there are houses
or passenger vehicles, progress along these lines would be expected to be slow and inconsistent as
compared to the other sectors, barring specific policy measures to promote industrial electrification.
The economics of electrified process heating and steam production—and the perceptions thereof—also
play a major role in the potential for further electrification in industry. On a per-energy basis, electricity
is simply more expensive than fossil fuels in the Northeast. For example, natural gas delivered to
industrial customers in the Northeast costs approximately $6.78/MMBTU51 on average across the states
in the region. Diesel is more expensive, at $12.49/MMBTU52 and coal is cheaper at only $4.97/MMBTU.53
By contrast, the average retail cost of electricity for industrial customers in New England is 12.09 cents
49 http://www.swensontechnology.com/mechanical-vapor-recompression-evaporators/ 50 2010 MECS, Table 5.2. 51 https://www.eia.gov/dnav/ng/ng_pri_sum_a_EPG0_PIN_DMcf_m.htm 52 https://www.eia.gov/dnav/pet/pet_pri_refoth_a_EPD2_PTG_dpgal_a.htm 53 https://www.eia.gov/coal/annual/xls/table34.xls

Northeastern Regional Assessment of Strategic Electrification | 23
per kWh (which translates to $41.25/MMBTU—about six times as expensive as natural gas) while
industrial electricity in New York averages 6.04 cents per kWh (or $20.60/MMBTU— still about three
times as expensive as natural gas).54
Electric heat technologies are, in general, more efficient than fossil-fired technologies, meaning that
fewer MMBTU of electricity can satisfy the same amount of industrial activity. As such, the actual
ongoing and total lifetime costs of electrification versus fossil consumption must be calculated on a
case-by-case basis. In many cases, electrification results in lower overall costs despite the higher cost on
a per-energy basis. However, the concept of switching from gas or oil to electricity may create a form of
“sticker shock” that discourages further investigation.
Given the advantages of electrified process heating and steam production, it may be the case that new
facilities can easily and preferentially be electrified as one component to a path towards deep
electrification. However, industrial energy usage in the Northeast is forecast to increase only modestly,
as the region’s economy depends more on knowledge and service industries than manufacturing, and
what manufacturing does exist is often value-added as opposed to bulk-scale. As such, electrification of
existing facilities will be necessary to achieve a large market share of electrification, barring changes in
trade policy or other fundamental aspects of the economic climate.
For specific applications that require extremely high temperatures or very large throughput or batch
sizes, partial electrification through pre-heating and/or vapor re-compression is the most promising
alternative to complete electrification. Switching from fossil fuels to biofuels for existing combustion-
based processes may be feasible. However, the different combustion properties of biofuels (including
higher ash and water contents) present similar limitations on this strategy as exist for electrification in
the first place. Many industrial processes also have sizable opportunities for increased efficiency through
insulation and other process improvements.
Transportation
Electrification Opportunities in Transportation
The transportation sector covers movement of goods and people from place to place. This sector
includes a huge range of activities, from children riding bicycles to school to transport of thousands of
tons of freight by ship or rail. For any given trip, there are likely several modes of travel available—which
may include travel by foot, bicycle, or motor vehicle on a road, travel by rail, or travel over air or water
in an airplane or ship. Over 90 percent of fuel used in transportation is petroleum-based.55 This reliance
on fossil fuel leads the sector to generate 27 percent of GHG emissions nationwide—approximately as
much as the emissions produced from generation of electricity.
54 2016 annual average retail prices, U.S. EIA, Electricity Data Browser, https://www.eia.gov/electricity/data/browser 55 US EPA. Sources of Greenhouse Gas Emission. Available at: https://www.epa.gov/ghgemissions/sources-greenhouse-gas-
emissions

Northeastern Regional Assessment of Strategic Electrification | 24
In the Northeast, electrification of motor vehicle-based transportation is the most promising
opportunity for strategic electrification. Air and water transit represent a negligible portion of freight
movement in the Northeast – less than one-twentieth of one percent of the freight mass transported in
the Northeast uses air- and water-based modes.56 While passenger air travel is common, it is also
difficult to electrify from a technical standpoint. Further development towards electric passenger jets
may lead to an increase in electrification opportunities for this mode, but such improvements will not be
commercially viable in the near term.
Some electrification opportunity does exist in fuel- and mode-switching towards electrified rail or buses.
The Northeast already has a rail network and mass transit systems that are extensive compared to much
of the nation. This network is not completely electrified. However, major alterations to this system are
cost-intensive and have little impact on ridership57—often because portions of this system are already at
capacity. Moreover, rail-related fuel use accounts for only a small portion of transportation sector
consumption in the Northeast. As such, further electrification and expansion of the rail network may be
better suited as a longer-term strategy. This assessment therefore focuses on electrification of light-,
medium-, and heavy-duty vehicles directly.
Electrification of Cars and Light Trucks
Traditionally, cars and light trucks (such as pickups, vans, and sport utility vehicles) have been powered
by internal combustion engines (ICE) and fueled with gasoline. Approximately 1,300 TBTU per year of
gasoline is burned by these vehicles in the Northeast. Combustion of gasoline by cars and light trucks is
the single largest form of fuel use in the residential, commercial, industrial, and transportation sectors. It
accounts for nearly 30 percent of fossil fuel use across all sectors apart from generation of electricity. As
such, electrification of passenger transportation is one of the greatest opportunities for emission
reductions in the Northeast.
While some amount of passenger transportation can be electrified by mode switching, as described
above, the main path for strategic electrification of cars and light trucks is replacement of conventional
ICE vehicles with electric vehicles (EVs). EVs replace the engine and gasoline used in ICE vehicles with a
battery and electric motor. Progress towards electrification of cars and light trucks has been gradual,
both in terms of adoption and in terms of the technology itself. Hybrid electric vehicles (HEVs) were the
first step along this path. HEVs operate using a gasoline (or diesel)-powered engine coupled with an
electric motor.58 These vehicles have significantly higher fuel efficiency (in miles per gallon) than
traditional light-duty vehicles. In the early to mid-2000’s, sales of hybrids rose sharply in response to
high gasoline prices and support from federal and state subsidies. HEVs are self-charging, using the
combustion engine to re-charge the onboard battery. Plug-in hybrid electric vehicles (PHEVs) were a
subsequent development. PHEVs also run on gasoline and electricity but can be plugged in to charge
when they are not running. Finally, battery electric vehicles (BEVs) running purely on electricity have
56 Oak Ridge National Laboratory, Freight Analysis Framework (FAF) 57 http://www.necfuture.com/tier1_eis/deis/

Northeastern Regional Assessment of Strategic Electrification | 25
been introduced commercially in recent years. This study focuses on BEVs as the primary path towards
electrification.
In most aspects, EVs are a drop-in replacement for ICEs. While charging infrastructure is necessary to
support EVs, only a portion of that infrastructure needs to be located in public space. Apart from this
consideration, adoption of EVs does not require any change to road infrastructure, parking
infrastructure, or the practice of driving itself. However, EVs can only store a certain amount of energy
onboard the vehicle itself (similarly to ICEs). Therefore, wide adoption of EVs would require some
amount of build-out of the charging infrastructure necessary to replenish the battery. Most EV owners
have a charger installed at their homes, allowing them to charge their vehicles overnight. However,
there is strong interest from EV owners in additional availability of public charging stations. It remains to
be seen what level of public charging infrastructure is necessary to facilitate wide adoption of EVs.
Although they are currently commercially viable, EVs represent a tiny proportion of the total car and
light truck stock, comprising about 0.1 percent of the stock in the Northeast. There are a number of
battery-related performance improvements that can be expected of EVs in the near term that may
hasten adoption. Charge speed is one such advance. ICEs can fully replenish their stores of energy (that
is, gasoline stored in the vehicle’s gas tank) in a matter of minutes at a gas station, but most currently
commercialized EVs require over an hour to charge fully. This is becoming less of a concern as batteries
have improved in efficiency, allowing for longer driving ranges. For instance, the new Chevrolet Bolt can
drive 238 miles on one charge.59
Battery costs are also expected to continue to decline, while cycle life is expected to improve. Both of
these advances would reduce the cost of EVs. In addition, the amount of energy a battery can store per
unit weight is expected to increase. This would increase EVs’ maximum range between charges and
mitigate concerns related to “range anxiety”—the fear associated with taking a drive for a longer
distance than an EV’s battery can support.
Finally, one potential path for wide adoption of EVs would be to combine electric vehicle technology
with “ridesharing” concepts, in which individual ownership of vehicles declines in favor of models selling
“mobility as a service” (MaaS). The rise of technology companies selling mobility as a service, such as
Uber and Lyft, have demonstrated the appeal of this model when available at a suitable price point.
Despite their higher capital costs, EVs may help maintain or improve the current price point of these
services. This is because MaaS models increase the utilization rate of vehicles as compared to personal
car ownership and operation; most individually owned vehicles sit idle for the majority of business and
overnight hours. The increased utilization of ridesharing vehicles increases the relative impact of
operational costs as compared to the up-front costs of purchasing a vehicle. Since EVs are mechanically
simpler than ICEs and the “fuel” for EVs is less costly than gasoline, EVs may gain ground as a more
favorable option for MaaS providers.
59 “10 Electric Vehicles With the Best Range in 2017” at http://www.cheatsheet.com/automobiles/electric-vehicles-with-the-longest-driving-range.html/?a=viewall

Northeastern Regional Assessment of Strategic Electrification | 26
An ambitious future vision for this model is the use of autonomous driving technology to create
autonomous EVs.60 However, because this technology has only recently entered the pilot stage, it is
difficult to predict if and when it may achieve wide adoption. Moreover, a model based on the use of
driverless cars requires realignment of the regulatory framework governing passenger transportation,
customer behavior in this sector, and the landscape of the passenger vehicle market. Disruptive shifts
often occur rapidly and unpredictably, making it difficult to evaluate the strategic value of this model.
However, if all of these factors align, autonomous EVs may prompt a paradigm shift in passenger
transportation, thereby enabling a dramatic reduction in transportation-related use of fuel.
Electrification of Medium- and Heavy-Duty Vehicles
Medium- and heavy-duty vehicles (MDVs and HDVs) are vehicles capable of carrying more weight than a
passenger car or van. Instead, these vehicles are used to transport freight, largely for commercial and
industrial purposes (however, passenger buses also fall into this class of vehicles). Most MDVs and HDVs
are fueled with diesel, rather than motor gasoline. Diesel is a heavier grade of fuel oil than gasoline, and
diesel engines use a different—and more efficient—combustion process than ICEs. Diesel consumption
for transportation in the Northeast accounts for approximately 325 TBTU of energy use per year, or
approximately 16 percent of transportation-related fuel use.
The technologies available for electrification of freight and other uses of MDVs and HDVs are essentially
the same as those available for electrification of smaller vehicles: mode switching to electrified rail and
replacement of vehicles with electric-drive alternatives. Rail is currently an important form of both
freight and mass transit, and electrified rail is a mature technology in wide use throughout the
developed world. However, as discussed above, significantly increasing the buildout of electrified rail is
incredibly costly and has less potential reach than replacement of diesel vehicles with electric versions.
Electric trucks, buses, and other MDV/HDVs are at a much less mature state of development than
electric light-duty passenger vehicles. This relatively slow pace of development is due to a technological
challenge that complicates electrification of heavier vehicles as compared to passenger vehicles—
namely, the difficulty inherent in moving large weights. Moving more weight requires more energy and
storing that extra energy requires a larger battery. However, batteries themselves are heavy. As the
battery’s size is increased, more of the battery’s energy is devoted simply to moving itself, leading to
diminishing returns. As the energy density of batteries (the amount of energy stored per unit weight)
increases, this challenge may be mitigated.
Because of these challenges, electric trucks and buses have only recently begun to gain a foothold, often
in small pilot-type programs. For example, the Massachusetts Bay Transit Authority has increasing
reliance on diesel-electric hybrid buses61 and the New York Metro Transit Authority has committed to
piloting 10 all-electric buses in the near future.62 Electric trucks for freight purposes are also being
60 https://www.rethinkx.com/s/RethinkX-Report_051517.pdf 61 http://www.mbta.com/about_the_mbta/environment/default.asp?id=26033 62 http://www.metro-magazine.com/bus/news/722207/n-y-mta-to-pilot-electric-bus-program-in-december-2017
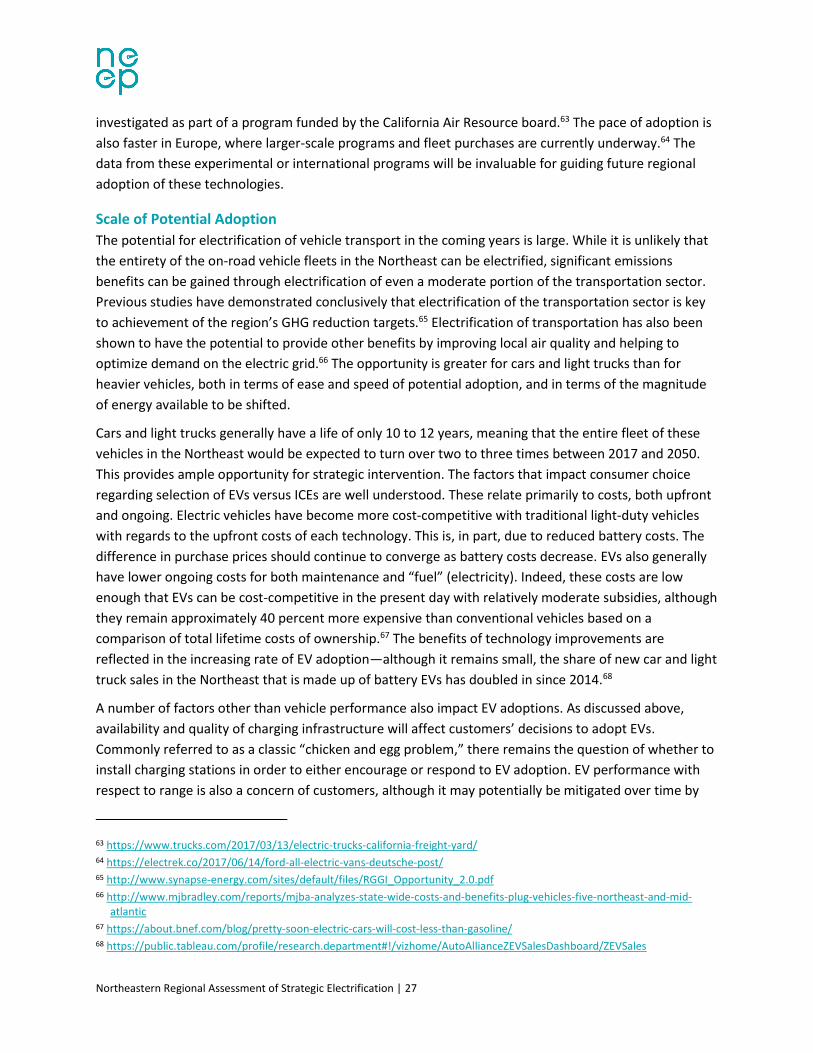
Northeastern Regional Assessment of Strategic Electrification | 27
investigated as part of a program funded by the California Air Resource board.63 The pace of adoption is
also faster in Europe, where larger-scale programs and fleet purchases are currently underway.64 The
data from these experimental or international programs will be invaluable for guiding future regional
adoption of these technologies.
Scale of Potential Adoption
The potential for electrification of vehicle transport in the coming years is large. While it is unlikely that
the entirety of the on-road vehicle fleets in the Northeast can be electrified, significant emissions
benefits can be gained through electrification of even a moderate portion of the transportation sector.
Previous studies have demonstrated conclusively that electrification of the transportation sector is key
to achievement of the region’s GHG reduction targets.65 Electrification of transportation has also been
shown to have the potential to provide other benefits by improving local air quality and helping to
optimize demand on the electric grid.66 The opportunity is greater for cars and light trucks than for
heavier vehicles, both in terms of ease and speed of potential adoption, and in terms of the magnitude
of energy available to be shifted.
Cars and light trucks generally have a life of only 10 to 12 years, meaning that the entire fleet of these
vehicles in the Northeast would be expected to turn over two to three times between 2017 and 2050.
This provides ample opportunity for strategic intervention. The factors that impact consumer choice
regarding selection of EVs versus ICEs are well understood. These relate primarily to costs, both upfront
and ongoing. Electric vehicles have become more cost-competitive with traditional light-duty vehicles
with regards to the upfront costs of each technology. This is, in part, due to reduced battery costs. The
difference in purchase prices should continue to converge as battery costs decrease. EVs also generally
have lower ongoing costs for both maintenance and “fuel” (electricity). Indeed, these costs are low
enough that EVs can be cost-competitive in the present day with relatively moderate subsidies, although
they remain approximately 40 percent more expensive than conventional vehicles based on a
comparison of total lifetime costs of ownership.67 The benefits of technology improvements are
reflected in the increasing rate of EV adoption—although it remains small, the share of new car and light
truck sales in the Northeast that is made up of battery EVs has doubled in since 2014.68
A number of factors other than vehicle performance also impact EV adoptions. As discussed above,
availability and quality of charging infrastructure will affect customers’ decisions to adopt EVs.
Commonly referred to as a classic “chicken and egg problem,” there remains the question of whether to
install charging stations in order to either encourage or respond to EV adoption. EV performance with
respect to range is also a concern of customers, although it may potentially be mitigated over time by
63 https://www.trucks.com/2017/03/13/electric-trucks-california-freight-yard/ 64 https://electrek.co/2017/06/14/ford-all-electric-vans-deutsche-post/ 65 http://www.synapse-energy.com/sites/default/files/RGGI_Opportunity_2.0.pdf 66 http://www.mjbradley.com/reports/mjba-analyzes-state-wide-costs-and-benefits-plug-vehicles-five-northeast-and-mid-
atlantic 67 https://about.bnef.com/blog/pretty-soon-electric-cars-will-cost-less-than-gasoline/ 68 https://public.tableau.com/profile/research.department#!/vizhome/AutoAllianceZEVSalesDashboard/ZEVSales

Northeastern Regional Assessment of Strategic Electrification | 28
technological improvements. Finally, the value proposition of EVs is deeply impacted by regulatory
measures such as incentives, tax treatment of EVs, and design of electric rates for EV charging.
All of these factors will likely be impacted in the future by resistance to change from stakeholders who
benefit from the current oil-based transportation framework. These include extraction companies
themselves, but also business owners whose livelihoods depend on gasoline sales (such as gas station
owners) and providing repairs to mechanically complex ICEs (such as mechanics). While EVs will still
require fueling and maintenance, it is possible that these services would be provided by a different set
of actors than the current incumbents. The dynamic of incumbent resistance to market shifts is not
uncommon, especially in cases of technology-driven market change. Policymakers may be able to ease
this tension by providing support for gas station owners and other stakeholders to position themselves
as participants in and beneficiaries from a new, electrified transportation system.
The dynamics of electrification of the MDV and HDV fleets are very different from that of the smaller
vehicle fleet. MDVs and HDVs have expected lives of over 20 years, meaning that stock turnover is much
slower than turnover of smaller vehicles. This limits the opportunity to achieve wide adoption of electric
technologies in the coming years. Only 15 percent of the freight miles traveled are for trips under 100
miles, where range anxiety is expected to be less of a barrier to adoption of electric medium- and heavy-
duty vehicles.69
The composition of freight transported over short
distances is notably different than that transported over
long distances. Notably, fossil fuels themselves account for
approximately a quarter of weight-normalized, short-trip
freight miles within the Northeast.70 This suggests that
there will be synergistic benefits to electrifying short-
distance freight along with other urbanized uses, as the
freight miles required to transport gasoline, heating oil,
and other fuels will be expected to decline. Electrifying
freight trips that are part of a dense trip network also is
expected to provide local air quality (and therefore health)
benefits.
Many MDVs and HDVs are part of a single-owner fleet,
making purchasing decisions more similar to those in the
industrial sector than to consumer-facing sectors such as cars or residential heating. This means that
adoption of electric trucks and buses would be expected to be less smooth than adoption of light-duty
EVs—fleet adoptions will be expected to occur discretely rather than as a gradual transition. In addition,
fleet conversion to electric technologies should only be expected when the electric alternative offers a
clear value proposition and when the technology itself has been de-risked. Proving the benefits of a new
69 ORNL FAF 70 ORNL FAF
Table 8. Percent of medium/heavy-duty freight miles in trips <100 mi. by state of origin
Connecticut 9%
Maine 13%
Massachusetts 20%
New Hampshire 28%
New York 15%
Rhode Island 41%
Vermont 21%
Region 15%

Northeastern Regional Assessment of Strategic Electrification | 29
technology requires several years of real usage data from pilot programs and early adoption. This period
has only recently gotten underway for electric trucks and buses. Ultimately, therefore, complete
electrification of the MDV and HDV fleets must be considered a longer-term and more ambitious goal
than electrification of cars and light trucks.
Transportation of freight or people for distances of several hundred miles or more will likely remain
difficult to electrify using battery-based technology for the foreseeable future. Biofuels (especially
biodiesel) offer some opportunity to switch away from fossil fuels for this class of trips. Increased use of
electric rail is another long-term possibility. However, increasing the fuel efficiency of trucks is an active
area of research and development. As such, the biggest opportunities for reductions in fossil fuel use in
these applications may simply be improvements in vehicle efficiency.
Policy and Program Options for Expanding Markets
Overview of Strategic Electrification Policies in the Northeast
In order to deploy strategic electrification at the scale necessary to contribute significantly to the
region’s ambitious climate change goals, policymakers will first need to set a regional vision. They will
then need to critically assess and remove regulatory barriers that inhibit efficient market development.
And finally, they will need to aggressively implement a wide range of market development policies and
programs focused on implementing the vision. This report will not describe how regional leaders should
set that strategic vision, but it will set the stage for further conversation as NEEP convenes regional
stakeholders on this topic. Vision must be harmonized with the regulatory structures in the region
before rapid progress can begin. Section 3.2 describes the regulatory barriers in detail, especially as they
relate to existing energy efficiency programs.
States across the northeast have developed a range of policies and programs to support strategic
electrification. As illustrated in Figure 5, below, these include initiatives that enable market deployment
for thermal electric (e.g. heat pumps) and electric vehicle (e.g. battery electric) technologies. There are
ample opportunities to expand investment in these policies and programs and many of these policies
are worthy of replication throughout the region, yet deployment of the target technologies remains
limited relative to the scale that will be needed to achieve electrification at a scale needed to achieve
climate change goals. A discussion of what will be required to electrify the region at scale can be found
in Section 4.
Sections 3.3 to 3.7 below summarize policies that can enable strategic electrification in the Northeast,
focusing in particular on policies and programs that can be applied to the thermal building sector and
transportation sectors. We have organized policies and programs across the categories summarized in
Table 9. Appendix A dives more deeply into each of these policy categories and provides further
example.

Northeastern Regional Assessment of Strategic Electrification | 30
Table 9: Five categories of policies and programs
Policy Type Definition
Targets and mandates Aspirational and/or binding goals to achieve certain levels of deployment, performance, or emissions reductions
Pricing-based policies Efforts to improve the cost-effectiveness of electric technologies, including incentives, new rate structures, and pricing of externalities
Facilitating emerging financing and business models
Efforts to remove barriers to or outright encourage the development of new business models that will broaden the ways in which electric technologies can be adopted (e.g. third-party ownership, standardization of financial contracts, pay-per-use/transportation as a service)
Quality assurance and EM&V
Efforts to ensure that technologies meet minimum performance standards regarding installation and performance, in particular energy performance and cost effectiveness in the case of utility EM&V programs
Marketing, outreach, and education
Initiatives to drive the adoption and successful usage of electric technologies through increased awareness, confidence, and commitment from consumers
This chapter begins with a description of the challenges imposed by the regulatory paradigm for utility
energy efficiency efforts across all of the northeastern states. We then define each policy type and
describe its benefits in encouraging electrification.
These policies have been successfully deployed in the transportation and heating sectors in Northeast
states at varying levels of impact. However, electrification of manufacturing processes faces a very
different business and policy context from transportation and heating, and remains a nascent field.
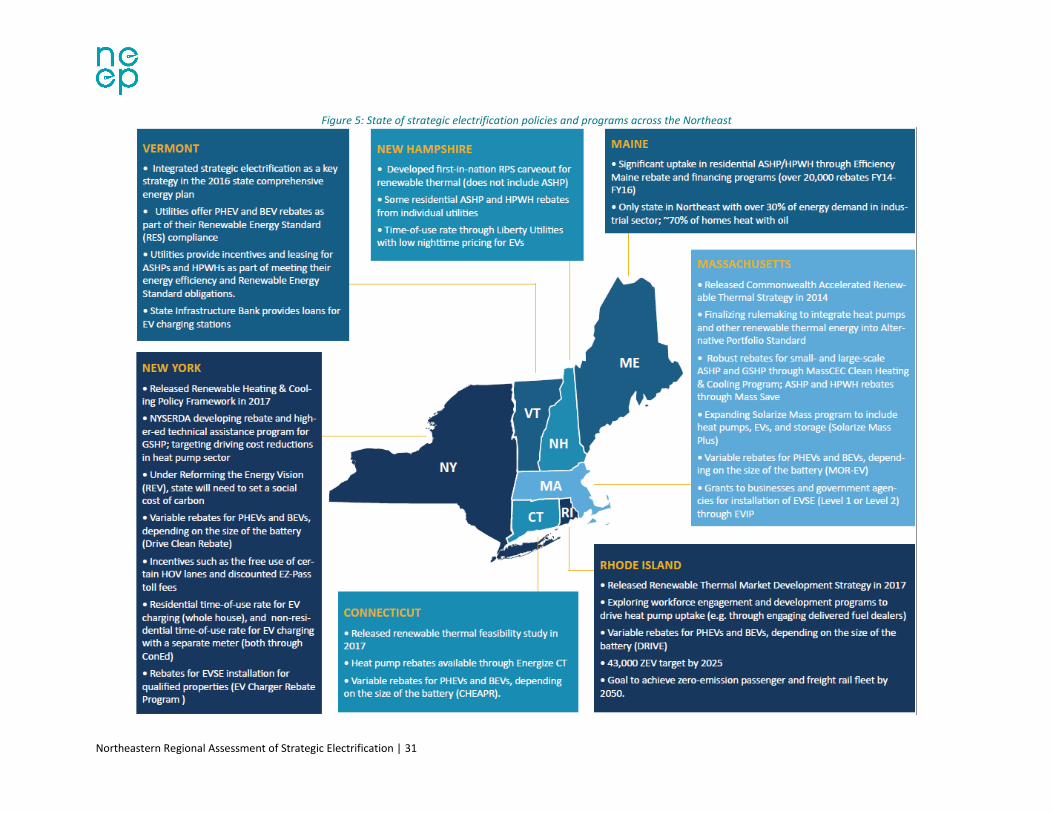
Northeastern Regional Assessment of Strategic Electrification | 31
Figure 5: State of strategic electrification policies and programs across the Northeast

Northeastern Regional Assessment of Strategic Electrification | 32
Regulatory Context
Strategic Electrification and Energy Efficiency Regulations
Northeastern states have established aggressive GHG emission reduction goals. States also have
implemented robust and well-funded energy efficiency programs, which are generally designed to
implement cost-effective energy efficiency measures. Energy efficiency programs are typically
considered to support states in achieving their GHG reduction programs: By increasing efficiency—and
reducing load—states can take concrete steps to reducing GHG emissions in the electric and natural gas
sectors.
However, most energy efficiency programs are not currently structured to enable strategic
electrification and thus may produce sub-optimal results in achieving economy-wide GHG reduction
goals. By transitioning thermal and transportation sectors away from fossil fuels like gasoline, diesel,
fuel oil, or natural gas—and toward an increasingly clean and renewable electric grid—strategic
electrification promises to reduce GHG emissions from the broader thermal and transportation sectors.
At the same time, it will increase electric consumption. This approach will almost certainly place
strategic electrification in conflict with many states’ existing energy efficiency regulatory frameworks.
While programmatic pathways for electrification are not yet established, we have identified four main
regulatory and policy challenges related to implementing strategic electrification via energy efficiency
programs. Each is briefly described below.
Fuel switching rules. Many state public utility commissions have put in place strict fuel switching rules, which govern what types of customers (using what types of fuels) are eligible for participation in energy efficiency programs. Put simply, fuel switching is the practice of changing from one fuel to another to serve the same application. Common examples of fuel switching include transitioning from fuel oil to natural gas to provide space heating or hot water for customers.71
As it relates to strategic electrification, there are significant opportunities to transition propane
or oil heating customers to electric heat pumps, or to transition transportation energy from
gasoline to electricity. Many states’ efficiency funds have historically not been used to provide
fuel neutral choice to customers.72 In other words, energy efficiency program administrators
have largely been unable to provide incentives to encourage customers to switch fuels.73
Instead, program administrators can generally only offer incentives on the new higher efficiency
equipment using the same fuel.74
71 http://ma-eeac.org/wordpress/wp-content/uploads/CI-Workshop-3-Briefing-Document.pdf 72 http://ma-eeac.org/wordpress/wp-content/uploads/Residential-Strategic-Electrification-and-HPs-1.pdf 73 An exception is natural gas companies’ marketing campaigns to promote fuel switching to natural gas mainly from
unregulated fuels outside of the energy efficiency program framework, along with historical efforts to switch off electric resistance heating to gas or delivered fuels.
74 It is worth noting, however, that energy efficiency rules governing fuel switching practices vary by state and sector. Thus, this is not a universally held requirement of energy efficiency programs.

Northeastern Regional Assessment of Strategic Electrification | 33
A related issue is the structure of program performance metrics, which are fuel-specific. For
example, promoting fuel switching to electric heat pumps will increase electricity consumption
and make it harder for electric efficiency program administrators to achieve their annual
electricity savings goals measured in electric energy saved.
Accordingly, many energy efficiency programs are not optimized to enable strategic
electrification and drive heat pump or electric vehicles conversions. This may be beginning to
change, as some states have been exploring policies that can enable increased deployment of
low carbon, high efficiency electric heating technologies.75 Nonetheless, recent interviews with
state policymakers reveal that significant uncertainty exists in many states regarding the
potential for changing fuel switching rules to enable strategic electrification.
Cost-effectiveness requirements. Every state requires energy efficiency programs to be cost-effective. These procurement rules typically deem efficiency and conservation measures to be prudent (as in the case of Rhode Island) “when measures are lower cost than acquisition of additional supply, including supply for periods of high demand.”76 Program administrators must show that energy efficiency measures are cost-effective through a variety of tests, which are laid out in the state’s technical resource manual. Variations between states in what (and how) costs and benefits are calculated can determine whether an electrification measure is deemed cost-effective. And as a result, they may or may not be deemed an acceptable measure under the energy efficiency program. Notably, cost effectiveness can be—but is not always—determined by factors such as installed cost, estimate energy saved, application evaluated (e.g. heating or cooling), counterfactual fuel used, estimated social benefit, and estimated GHG benefits, among others.
Going forward, states may wish to re-evaluate cost-effectiveness requirements for heat pumps
and other strategic electrification technologies in order to align the technology evaluation with
broader economic, grid, social, and GHG concerns. The ability of states to do so will also depend
upon the political feasibility of changing laws or regulations. The recently published National
Standard Practice Manual for energy efficiency screening provides guidance on how to develop
a jurisdiction’s primary cost-effectiveness test to meet the applicable policy goals of the
jurisdiction.77 If GHG emission reduction through electrification is a policy goal, then it can be
reflected appropriately in screening test design.
Financial and performance incentives for utilities. A key consideration for greater deployment of strategic electrification is understanding how the concept fits into a utility’s broader business and financial requirements. In theory, strategic electrification will increase an electric utility’s energy sales, which could provide a financial benefit to the utility company. However, many utilities in the Northeast region have been decoupled, meaning that a utility’s profits have been disassociated from the sales of the
75 Massachusetts, for example, does not expressly prohibit fuel switching in its residential program and offers robust incentives for heat pumps that can serve heating and cooling loads.
76 Rhode Island Code § 39-1- 27.7 77 Available from https://nationalefficiencyscreening.org/national-standard-practice-manual/.

Northeastern Regional Assessment of Strategic Electrification | 34
energy commodity. Accordingly, there would be no financial benefit to a utility by increasing electric load via deployment of heat pumps or EVs.
On the other hand, heat pumps and EVs can in some cases provide grid utilization and peak load
shaving benefits to utilities, which may help to defer or reduce maintenance, infrastructure, or
operating costs. States like New York are exploring new regulatory and business models,
through the Reforming the Energy Vision (REV) process, to incentivize electric utilities to
develop new business models that support strategic electrification. Utility ownership of
electrification infrastructure (such as EV charging equipment or even heat pumps) could provide
a business model for electrification support. As discussed in Section 0, there are important
questions related to the costs and benefits of utility ownership of strategic electrification assets
that should be addressed.
In most cases, it is anticipated that strategic electrification will represent a threat to natural gas
utilities under their traditional business model. It would most likely result in a reduction of
customers and sales, an increase in rates to customers (as gas utilities spread fixed costs over a
smaller customer base), and, in the worst case, stranded natural gas assets. In addition, in some
states, natural gas utilities are encouraged to increase the number of gas customers each year
(in order to support attainment of near-term GHG reduction goals along with customer savings
from lower-cost fuel). This has been achieved through the design of states’ revenue decoupling
rules, which permits utilities to set a “revenue per customer” recovery rate.78 Under this
structure, utilities can recover a set amount of revenue per customer for distribution service. By
increasing the number of customers between rate case years, the utility can also increase its
total profit. In the case of falling sales per customer, however, this structure would result in
rising rates, and a damaged competitive position. Resolving—or at least considering—these
regulatory and policy issues will be important in coming years if states wish to implement
electrification strategies.
Incentives for efficient fossil fuel appliances. Several state efficiency programs provide incentives for high efficiency gas or oil heating appliances. These incentives are justified as a means to encourage customers to reduce energy consumption and increase energy efficiency when replacing existing fossil fuel heating equipment.
While such incentives improve the ability of program administrators to achieve energy efficiency
targets, they also lock customers into another 15 to 30 years of heating with fossil fuel powered
appliances. In addition, the use of fossil fuel incentives contributes to the challenging customer
economics that the heat pump industry currently faces in the marketplace today.
As policymakers consider the deep GHG reduction targets that they face in the next 30 years
(i.e. 80 percent by 2050), it will be worthwhile to assess whether they can indeed achieve those
goals if end-users continue using (even the highest efficiency) oil or natural gas heating and
cooling equipment. As discussed in Section 0, it may be necessary to transition customers away
78 The per-customer revenue recovery structure drives a difference between natural gas utilities (where customer growth through utility actions is a possibility) and electric utilities (where near-universal service has been obtained).
Northeastern Regional Assessment of Strategic Electrification | 35
from fossil fuel fired heating and cooling equipment entirely and instead deploy renewable
heating and cooling technologies to service thermal loads.
Looking ahead, it will be important for policymakers to examine these issues in greater detail. While
integrating strategic electrification priorities into the existing energy efficiency programs is not the only
way for policymakers to achieve strategic electrification and GHG reduction goals, it has the potential to
be an important one. The existing energy efficiency programs may be the most direct and
straightforward route to achieving strategic electrification goals. Because energy efficiency programs
have a well-established funding mechanism, have been operational for years, and have broad political
support, they represent an important and powerful pathway for deploying strategic electrification
technologies.
Keeping in mind the context of the current regulatory barriers to broader strategic electrification, the
rest of this chapter lays out additional policy and program options policymakers must consider when
implementing a strategic plan to foster beneficial electrification in their jurisdictions.
Targets and Mandates
If strategic electrification is to contribute meaningfully to climate change goals in the Northeast, there
must be a significant increase in heat pump and electric vehicle deployment. Mandates and targets can
greatly accelerate the uptake of these technologies. Clearly defined mandates often underlie long-term
investment decisions for the public sector and the private sector, facilitating transitions of this scale.
Targets describe aspirational and/or binding goals to achieve certain levels of technology deployment,
performance, energy savings, or emissions reduction. Targets can provide signals to investors regarding the
types of policies and programs that will be implemented, as well as outline the types of support policies (e.g.
incentives and market development efforts) that may be provided.

Northeastern Regional Assessment of Strategic Electrification | 36
Targets and mandates are commonplace across all Northeastern states and have been instrumental in
driving progress towards interim GHG reduction goals. Achieving strategic electrification objectives may
require establishment of more ambitious targets and mandates to accelerate deployment of electric
replacement technologies. It is also important to evaluate and determine which metrics make most
sense for targets and mandates to effectively promote strategic electrification (e.g., Btu thermal savings,
number of heat pump deployment, emission savings, or other new metrics such as emissions efficiency
in terms of emissions per kWh which is known as “emiciency”).79
As some markets for electric replacement technologies remain emergent, there may be constraints on
the scope of mandates that can realistically be implemented. However, coupled with appropriate
support, mandates can be effective tools for driving adoption and awareness of electric replacement
technologies. This section discusses options and considerations for both public and private sector
mandates for the building and transportation sectors.80
79 The term “emiciency” was introduced in “Environmentally Beneficial Electrification: The Dawn of ‘Emissions Efficiency’” by Keith Dennis, Ken Colburn, and Jim Lazar. http://www.sciencedirect.com/science/article/pii/S1040619016301075
80 Mandates and targets for the industrial sector are less likely to be successful, given the greater diversity of industrial end-uses and the state of replacement technologies.
Mandates are regulatory policies that place obligations on the public and private sectors (e.g. building
owners and developers, public agencies, utilities) to install or procure specific technologies and/or
achieve certain levels of performance or efficiency.1 Mandates discussed in this section will be divided
into three categories:
Utility mandates place obligations on investor-owned utilities to meet certain increasing levels of renewable energy deployment. Utility mandates (in the form of renewable portfolio standards) exist for renewable electricity generation across all Northeastern states and have been a primary mechanism for increasing the share of renewables in the grid mix. Several states are exploring – and implementing – utility mandates that encompass thermal energy production.
Private sector mandates place obligations on building owners and developers (for buildings) and on vehicle manufacturers (for transportation) to meet certain levels of performance. In the buildings sector, mandates are typically accomplished through building energy codes and efficiency standards, while in transportation these mandates typically target fuel economy and zero-emissions vehicle (ZEV) sales targets.
Public sector mandates place obligations on state and other public agencies to meet certain requirements related to building energy performance, renewable electricity purchasing, and fleet and building technology procurement. Such “Lead by Example” programs are common across the Northeast.

Northeastern Regional Assessment of Strategic Electrification | 37
Benefits of Mandates and Targets
Establishing targets and mandates for strategic electrification can address several market barriers to and
help policymakers realize several policy goals. Key benefits include:
Overcome decision-making inertia. Barriers can be addressed by restricting options available to private and public actors to meet the mandate.
Increase investor confidence. The long-term nature of goals and mandates provides stability and certainty to investors and private actors, enabling them to effectively plan around growth in required technologies (enabling steady growth in supply chain and necessary infrastructure). Certainty also enables firms and individuals to invest with confidence in the skills necessary to install and maintain new technologies.
Providing (near) certainty about the outcome. If mandates are designed well, sufficiently supported, and coupled with the right enforcement mechanism, they stand a good chance of achieving the amount of technology deployment that they require.
Utility mandates for heat pumps
New Hampshire, Massachusetts, and Vermont have included specific carve-outs in their respective Renewable Portfolio Standard (RPS), Alternative Portfolio Standard (APS), and Renewable Energy Standard (RES). In New Hampshire, GSHPs, solar hot water, and biomass produce Thermal Renewable Energy Certificates called Class I Thermal RECs or (T-RECs). Electric utilities must purchase renewable thermal generation equal to 1.3 percent of their electricity sales in 2016 steadily increasing to 2 percent by 2023. The program assumes that 3.412 MMBTUs of thermal output is equivalent to one MWh and one T-REC.
Massachusetts’s APS, which is separate from its RPS, requires that 5 percent of Massachusetts electrical load be met by alternative energy by 2020. Eligible technologies include solar hot water, ASHPs, GSHPs, biomass, and select renewable natural gas products, among many others. The APS also includes flywheels, CHP, and steam-based technologies. One Alternative Energy Credit (AEC) is produced for every useful MWh or 3,412,000 BTUs produced by the facility. Large systems require metering and smaller systems receive AECs based on expected thermal energy output.
Tier III of the Vermont Renewable Energy Standard requires electric utilities to reduce fossil use by their customers by an increasing amount each year. Utilities have started programs, in association with Efficiency Vermont, to meet that requirement in large part through the adoption of heat pumps. Some utilities are also exploring support for electric vehicles (including transit buses) as well as line extensions to bring off-grid diesel-generator loads onto the grid.
Several other states – including, Arizona, Indiana, Maryland, Nevada, North Carolina, Pennsylvania, Texas, Utah, and Wisconsin – all have provisions for some renewable thermal technologies in their RPS’s.81
81 http://www.cesa.org/assets/Uploads/Renewable-Thermal-in-State-RPS-April-2015.pdf
Northeastern Regional Assessment of Strategic Electrification | 38
Pricing-Based Policies
Electrification at scale will likely require policy action to improve the cost-effectiveness of electric
replacement technology. Policymakers can influence cost-effectiveness through a variety of
mechanisms, including the provision of incentives, development of new electric rate structures, or
pricing of externalities (e.g. carbon pricing).82 Each is briefly described below.
Incentive programs. Incentive programs have been widely used by state and federal policymakers to encourage consumer adoption of heat pumps and electric vehicles. They may take a wide variety of forms, including expenditure-based payments based on total system cost, capacity-based incentives based on installed system size, flat rate incentives that are applied uniformly to a certain class of technologies, upfront incentives based on expected performance, or performance-based incentives based on the amount of generation or savings produced by the system.83 Incentive design depends upon policymaker’s goals and political constraints, and it will usually take into account the installed cost of the technology, cost of the counterfactual technology, impact on public budgets, and expected social or environmental impacts (e.g. economic development or GHG reduction potential). Funding for incentives can come from a range of sources, including ratepayer funds and state or Regional Greenhouse Gas Initiative (RGGI) funds. As noted in Section 0, incentives funded by ratepayers have specific constraints that present challenges to electrification.
Rate structures. Utility electric rate design offers policymakers potential to improve the cost-effectiveness of electrification technologies, achieve public policy goals, and increase utilization and efficiency of the grid. Under traditional rate structures, many customers (especially residential customers) pay the same price for each unit of electricity service regardless of the season or time of day when it is consumed. Time variant pricing (TVP) rate structures enable utilities and policymakers to reflect changing costs and benefits over time. 84 TVP structures include real-time pricing, time-of-use pricing, variable peak pricing, critical peak pricing, and seasonal pricing. The structure and uptake of alternative rate structures may depend on a range of factors, including utility investments in advanced metering technology, sophistication of data collection and billing systems, utility staffing operations, marketing, and participation expectations (or requirements) of consumers.
82 Though not treated in this report, policymakers can also improve economics by working with industry to drive down installed costs. This has been the approach, for example, of the U.S. Department of Energy’s SunShot Initiative, which seeks to reduce soft costs by providing network and technical assistance, data analysis, business innovation and training to industry leaders and municipal governments. (For more, see: https://energy.gov/eere/sunshot/soft-costs.) In addition, NYSERDA is launching a cost reduction initiative to improve the competitiveness of renewable heating and cooling technologies including air source heat pumps, ground source heat pumps and solar thermal. NYSERDA estimates that targeted policies and programs can reduce installed costs by 5% to 30% by 2021. (For more, see: https://www.nyserda.ny.gov/Researchers-and-Policymakers/Renewable-Heating-and-Cooling.)
83 http://iea-retd.org/wp-content/uploads/2015/02/RES-H-NEXT.pdf 84 See, for example, Lazar and Gonzalez, Smart Rate Design for a Smart Future from the Regulatory Assistance Project. Available
at: http://www.raponline.org/document/download/id/7680.

Northeastern Regional Assessment of Strategic Electrification | 39
Carbon pricing. Carbon pricing policies are designed to internalize social and environmental externalities associated with GHG emissions. A wide range of carbon pricing schemes have been proposed and/or implemented across the globe. These can be categorized along a broad spectrum, with carbon tax programs (e.g. British Columbia carbon tax) on one end and emission trading schemes (e.g. the EU Emission Trading Scheme) on the other end. Within the Northeast and Mid-Atlantic states, RGGI has been in force since 2009 and regulates fossil fuel powered electric generating plants across nine states. RGGI requires fossil fuel-fired electric power generators with a capacity of 25 MW or greater to purchase pollution permits (called allowances) equal to each ton of CO2 emitted.85 Notably, RGGI does not regulate emissions from the broader transportation, heating and cooling, or other sectors across the economy; however, if policy enables and encourages fuel switching—and the thermal and transportation sectors are increasingly electrified—RGGI will have greater ability to internalize carbon externalities across the energy economy. RGGI provides funding for a number of electrification technology incentives.
It is worth noting that in the best cases incentive, rate, or carbon pricing policies provide investors with
transparency, longevity, and certainty (TLC), which reduces risk and stimulates private investment. As
discussed in greater detail in Section 0, by implementing transparent policy processes that afford a
reasonably certain rate of return over a long timeframe, it is possible to reduce the cost of capital and
attract private capital.86 This capital will be necessary to scale up strategic electrification across the
Northeast.
Maintaining or expanding incentive schemes will require identifying sources of funding and establishing
political and stakeholder buy-in. Additionally, strategic electrification will create new challenges for
utilities and regulators. Decades-old goals and rate structures should be reoriented to encourage
electricity conservation and accommodating increases in electricity sales related to strategic
electrification. The complex, collaborative discussions necessary to achieve these goals must be
effectively managed to ensure social and environmental benefits are realized while maintaining long-
term fiscal health of utilities.
While policymakers have begun discussions about electric rate design in the context of meeting long-
term GHG reduction targets, they have had limited consideration of natural gas and oil. The success of
long-term strategic electrification and emissions reductions will require changes in regulatory and policy
approaches to fossil fuel emissions that generally are not impacted by carbon pricing.
Benefits of Pricing-Based Policies
Pricing-based policy options can address several market barriers to strategic electrification and help
policymakers realize several policy goals. Chief among these are:
85 Acadia Center. (2014). Regional Greenhouse Gas Initiative: A Successful Carbon Pricing Program. Retrieved from https://webcache.googleusercontent.com/search?q=cache:LjmD3Fkn1p0J:https://acadiacenter.org/wp-content/uploads/2014/11/RGGI_SuccessfulCarbonPricingProgram_102214.pdf+&cd=1&hl=en&ct=clnk&gl=us
86 For more on TLC and investment, interested readers should see https://institutional.deutscheam.com/content/_media/1196_Paying_for_Renewable_Energy_TLC_at_the_Right_Price.pdf

Northeastern Regional Assessment of Strategic Electrification | 40
Addressing high upfront costs and leveling the playing field. Established conventional heating systems and vehicles benefit from many decades of mass production and economies of scale. Pricing can be used as a tool to mitigate some of these inherent disadvantages for electric replacement technologies.
Internalizing externalities. Efficient economic decisions happen when the true costs and benefits are weighed against each other. Pricing externalities appropriately provides an opportunity to make more efficient and less polluting technologies more economically competitive.
Increasing utilization and efficiency of grid. Sending clear price signals can increase the utilization of the grid during under-utilized times on a daily and seasonal scale, achieving more balanced usage and improving cost-effective usage of grid assets. These signals will incent the use of specific technologies at specific times, helping grid customers make decisions aligned with policy priorities.
Leveraging private investment. To the extent that pricing signals create incentives for the private sector
to act, the resulting private investment may in time generate new markets and economies of scale that
will eventually improve cost competitiveness of electric replacement technologies. Policymakers
interested in leveraging the most value for their investments will seek to establish incentives that
provide the stability and transparency needed for investors and supply chain stakeholders (e.g.
performance-based incentives, feed-in tariffs).
Efficient Electric Heat Rate87
Great Lakes Energy (GLE), a utility cooperative, offers an “Efficient Electric Heat Rate” to homeowners who install qualifying ASHPs or GSHPs. GLE provides electricity to over 125,000 members in 26 counties across Michigan and has done so for 75 years. Homeowners can receive a $0.03 credit for each kWh consumed by their ASHP or GSHP. A separate subtractive meter is installed by the utility, free of charge, to monitor usage of the heat pump. One bill is then provided to the cooperative member that accounts for the Efficient Heat Rate credit and their total electric consumption. Systems must meet specified efficiencies to receive the credit. GSHPs are eligible to receive the credit all year round while ASHPs are eligible only for November through May. Rebates for installing these technologies are available directly from GLE and also from the Michigan Energy Cooperative Association.
87 http://www.gtlakes.com/electric-heat-rate/

Northeastern Regional Assessment of Strategic Electrification | 41
Connecticut Clean Fuel Program
The Connecticut Department of Transportation (CTDOT) offers funds to municipalities and public agencies that purchase alternative or clean fuel vehicles through its Clean Fuel Program.88 Awardees in the program are provided the cost difference between clean fuel vehicles and typical ICE vehicles. In addition to electric, compressed natural gas, propane, and hybrid vehicles, diesel retrofit, and other emission control technologies are eligible for funding. The 2013 recipients of the program received between $14,000 and $200,000 as reimbursement for these incremental costs.
Facilitating Emerging Financing and Business Models
Innovative financing and pay-per-use89 business models are emerging in the heat pump and EV sectors,
which may transform the way end-users access transportation and thermal energy services. The
financing and business models discussed here include third-party ownership (TPO) models, wherein a
developer or utility owns and manages the thermal or transportation asset and provides end-users
access to the thermal or mobility services with little to no upfront investment. In the best cases, these
models can also increase access to private sector capital.
It is worth noting that TPO models are not necessarily new in the conventional HVAC or automobile
sectors. For example, auto manufacturers commonly offer leases to car and truck buyers, and energy
service companies (ESCOs) have for many years provided commercial and institutional customers
turnkey products that enable end-users to outsource ownership, operation, and maintenance of HVAC
systems.
However, the business and financing models described here have only recently emerged in the heat
pump and EV markets, and there are several actions that policymakers could consider to facilitate
strategic electrification across the states. Notably, by providing the right policy and regulatory support,
policymakers can enable development of innovative financing and business models. This will reduce
market barriers and increase private sector investment in strategic electrification.
Financing and business models discussed in this report include:
Utility or TPO and leasing models for heat pumps. Several recent policy and market studies have pointed to the potential of utility or TPO models to scale up heat pump and renewable thermal markets.90 In TPO models, developers or utilities own and operate heat pump or other electric thermal assets. They provide turnkey solutions for end-users including building energy assessment, design and planning, financing, construction and installation, and operations and monitoring. In turn, customers will make a regular
88 http://www.ct.gov/dot/cwp/view.asp?A=1373&Q=527130 89 Under a pay-per-use business model, the use of a product or service is metered or otherwise measured and customers are
charged for their time or use of the service. 90 http://iea-retd.org/wp-content/uploads/2015/02/RES-H-NEXT.pdf, Cliburn 2012, NYSERDA (2017) RH&C Policy Framework

Northeastern Regional Assessment of Strategic Electrification | 42
lease payment—or pay an agreed upon energy rate—for thermal energy provided to the building. The model enables building hosts to integrate renewable thermal technologies like heat pumps into their building for little or no money down and reduces the risk and complexity related to system operation and maintenance. If the necessary supporting policies are in place, TPO models can mitigate decision-making and upfront cost barriers and also provide customers with immediate cost-savings (e.g. cash-flow positive in Year 1).91
Standardization of financial contracts. Strategic electrification building technologies like GSHPs and ASHPs lack standardized contracts, metering and performance protocols, and other financing requirements. This makes it time-consuming and expensive for investors to perform due diligence. A lack of investor familiarity with renewable heating and cooling (RH&C) deals, combined with lack of standardization and performance data, translates to a lower pool of bankable projects and a higher perception of risk among investors. Accordingly, as NYSERDA has identified, “the risk-adjusted cost of capital for heat pump projects (i.e., capital that accounts for the risk-return profile) is high and/or capital is not sufficiently available to provide ready liquidity for RH&C projects.”92 Policymakers and state green banks can help facilitate development of standardized documentation, which in turn enables aggregation of electrification assets and increases access to low-cost capital.
Mobility-as-a-service model. In recent years, several new mobility solutions have emerged, piquing policymakers’ interest in the concept of “mobility-as-a-service” (MaaS) to replace the current paradigm of nearly ubiquitous car ownership. Much of the enthusiasm stems from the possibility that digital technology enables users to conveniently select the mode of travel that is best suited for the exact time and need.93 Given today’s increasingly congested roads and goals to reduce transportation emissions, MaaS has shown appeal because of its potential to change the economic calculus behind citizens’ everyday travel decisions. Instead of making a large upfront investment in a vehicle, individuals can fill their transportation needs in a pay-as-you-go manner from a menu of options. This changes the marginal cost calculations that people make about individual trips, which may impact the amount of travel demand and the modes that are used to fill that demand.94 MaaS and shared mobility can contribute to transportation electrification by centralizing decisions about vehicle procurement and
91 http://iea-retd.org/wp-content/uploads/2015/02/RES-H-NEXT.pdf (Cliburn, 2012) 92 NYSERDA (2017) RH&C Policy Framework 93 For instance, people who need a larger car to move furniture can pick up their nearest Zipcar truck, obviating the need to
own a large car for those rare occasions. People who don’t want to worry about parking can instantly hail a ride from a transportation network company like Uber or Lyft. People who want to take advantage of nice weather and get some exercise can hop on the nearest bike-share. While many of these options existed conventionally (e.g. taxis, borrowing someone’s car or bike), they have become much more convenient with the advent of mobile apps and the growth of the service areas of these transportation options where rapid service can be summoned.
94 While MaaS has the potential to reduce congestion and emissions, urban planners and policymakers remain split and uncertain as to the likely future effects of the convergence of autonomous vehicles, electric vehicles, and shared mobility. If autonomous vehicles are unregulated and adopted en masse via private ownership, it is possible that this would induce significant additional travel demand and counteract the benefits of MaaS. Robin Chase, founder of Zipcar, provides a useful thought exercise here: https://www.citylab.com/transportation/2014/04/will-world-driverless-cars-be-heaven-or-hell/8784/

Northeastern Regional Assessment of Strategic Electrification | 43
increasing the return on investment of electric vehicles as will be described below. In the section below, this report will use MaaS and shared mobility interchangeably.
Benefits of Facilitating Emerging Financing and Business Models
Innovative financing and business models can address several market barriers to strategic electrification
and help policymakers realize climate and energy goals. Key benefits include:
Overcome high upfront costs and facilitate access to private sector investors. By providing end-users access to heating and cooling services for no or little money down, the TPO models enable end-users to overcome barriers associated with high first costs. In addition, to take the TPO model to scale, utilities or developers will need to develop protocols necessary to mitigate development risk—or allocate it to the party best suited to manage it. If done properly, third-party owners can mitigate investment risks associated with strategic electrification projects and bring large amounts of private sector investment to the regional market.
Simplify decision-making. Many strategic electrification projects are complex, especially in the commercial sector. They require building or fleet owners to think through design and installation, finance, and maintenance requirements. By entering into a TPO contract and outsourcing those requirements to the system developer/owner, local residents and businesses can reduce complexity associated with development and simplify their own decision-making process.95
Drive forward professional marketing. Utilities or developers offering TPO models are motivated to market and install systems. In many cases, developers will have obtained upstream financing and, to provide investors their required rate of return, developers will need to install a certain number of systems within a specified period. As a result, developers typically implement professional marketing campaigns to reach new customers and drive development of markets.96
Green Mountain Power Heat Pump Lease Program
Vermont’s Green Mountain Power offers a 15-year lease of cold climate ductless minisplit heat pump systems to its customers. This program allows customers to use a heat pump without a down payment and without taking out a loan. Monthly lease costs for single-head systems range from $49 to $81. GMP is responsible for installation and maintenance. GMP works with a selected set of local heat pump installers to install Daikin, Fujitsu, and Mitsubishi ASHPs. $600 rebates from Efficiency Vermont can be used to pay the monthly bills, so the customer may be able to use a heat pump for up to a year before paying for anything other than its electric use.
95 http://iea-retd.org/wp-content/uploads/2015/02/RES-H-NEXT.pdf 96 http://iea-retd.org/wp-content/uploads/2015/02/RES-H-NEXT.pdf

Northeastern Regional Assessment of Strategic Electrification | 44
Quality Assurance and Evaluation, Measurement, and Verification
Ensuring that consumers have positive, high-quality experiences with electric replacement technologies
is particularly important because the market for these technologies is still at an early stage relative to
deployment potential. The public is still forming impressions of these technologies. Consumers need to
feel confident enough in a new technology to justify making a change from their status quo purchasing
decisions. If technology suppliers overpromise and the technology underperforms, consumers will
quickly become disillusioned with new technology. This will hamper long-term efforts to grow the
market.
Several different types of stakeholders are keenly interested in the results of both QA and EM&V,
including customers, utilities, policymakers, and investors. Customers need to make informed decisions,
utilities and policymakers need to know about installed performance in order to make decisions on
spending ratepayer energy conservation funds, and investors and ESCO offerors need to know about
performance both for the potential value of direct investment in the companies and for setting
expectations for savings and building performance.
Benefits
QA and EM&V programs directly address several social and technological
barriers to greater deployment, in the following ways:
Providing consumer confidence in technology performance
Unlocking business models and incentive options (e.g. TPO models require effective metering.)
Improving installer knowledge base and installation quality, which in turn can improve customer confidence
Driving improvements in technology performance and efficiency by making performance information transparent and thereby incenting manufacturers and installers to provide more efficient and better-installed systems
QA programs can work together with training to ensure a sufficient
skilled workforce to install and maintain new technologies in rapidly
growing markets.
Quality Assurance (QA)
programs are efforts to
ensure that technologies
sold meet minimum
performance standards
regarding installation and
performance.
Evaluation, Measurement,
and Verification (EM&V)
efforts assess the energy
performance of
technologies and energy
efficiency activities, and are
commonly applied by state
regulators to evaluate the
success of utility energy
efficiency programs.

Northeastern Regional Assessment of Strategic Electrification | 45
Cadmus ASHP study: new questions for policymakers pursuing strategic electrification
A 2016 report by Cadmus Group, commissioned by the electric and gas Program Administrators of
Massachusetts and Rhode Island, evaluated the field performance of ductless mini-split heat pumps (DMSHP)
installed in 152 Massachusetts and Rhode Island homes that received incentives through the Mass Save COOL
SMART and RI High Efficiency Heating and Cooling Rebate Program. Entitled “Ductless Mini-Split Heat Pump
Impact Evaluation,” it was the largest field performance EM&V study conducted to date for cold climate ASHPs.
The study’s key findings included:
Performance. When properly installed and operated by homeowners who were well-educated on system
operation (i.e. top quartile of customers by total usage), DMSHPs generally performed at the level of efficiency
and estimated usage expected by utilities.
Installation quality. The study demonstrated the significant potential for poor installations to compromise the
performance of DMSHPs, finding that systems installed by the largest installer of DMSHPs in Massachusetts
underperformed systems installed by all other installers by an average of 1.0 COP in Winter 2016.
Customer behavior and intent. The study found various customer behaviors that reduced performance of
installed systems—e.g. obstructing or failing to clear snow from outdoor units, misunderstanding proper use of
remote controls, inefficient system operation, and failing to clean filters. Most customers were found to have
used their systems less than expected by the utility program administrators for heating, particularly customers
who had purchased their systems only for cooling (as well as many customers who had purchased systems for
both heating and cooling).
Cost-effectiveness. The study confirmed that DMSHPs are most cost-effective when replacing electric
resistance heat, propane, and oil (in that order) with no payback against natural gas—in line with the findings
of other field studies.*
The study provided valuable information for utility program administrators and raised important questions for
policymakers considering the prospects of strategic electrification (which, as discussed in other parts of this
report, may conflict with goals of existing utility efficiency programs).** While the performance of properly-
installed single-head cold climate DMSHPs with educated homeowners is promising, a key question for
policymakers evaluating the suitability of ccASHPs to achieve strategic residential electrification goals remains:
How well do cold-climate ASHP systems perform when deployed to serve as a whole-home heating system
or as the primary source of heating with a backup system in place?
The study reviewed systems that in many cases were installed primarily for cooling and did not include cold
climate multi-head ASHPs, which were not available at the time of participant installation but in 2015
accounted for 30 percent of rebates issued through the MassCEC Clean Heating and Cooling rebate.
Future studies might consider evaluating:
Newer multi-head cold climate systems (or multiple single-head systems from latest generation of cold climate systems) sized for near-whole home heating load;
Systems installed with newer controls to integrate the ASHP system with the backup heating system (where applicable);
A study cohort recruited from homeowners who have installed ASHPs through a heating-focused program (e.g. MassCEC CH&C Program, Efficiency Vermont, Efficiency Maine).
* 2015 Building America study by Steven Winter Associates, NEEP 2014 meta study
** Notably, Mass Save reduced its DMSHP incentive from $250/$500 per system (based on efficiency) to $100/$300 per indoor unit in Q1 of 2017.
Northeastern Regional Assessment of Strategic Electrification | 46
Marketing, Outreach, and Education
Property owners and vehicle owners who could be interested in the benefits of electric replacement
technologies are often not aware of the availability and suitability of these technologies. For many
property owners, their heating and/or cooling system may not be at the forefront of their mind since it
is essentially invisible to them when it is working properly. Decisions about replacing one’s heating
system or one’s vehicle are decisions that happen so rarely that an average property owner has no real
motivation to become an expert in the available options. Therefore, directing attention to these often
low-priority topics is challenging. As a result, vehicles and heating system components are often
replaced in emergency situations, which do not lend themselves to adopting new electric replacement
technologies.97
This section describes marketing, outreach, and education programs. We define these as initiatives that
drive adoption and successful usage of electric replacement technologies through increased awareness,
increased confidence, and strengthened resolve and commitment from consumers/property owners.
Marketing, outreach, and education programs create intentions to adopt replacement technologies, but
they must be paired with policies and programs that facilitate the realization of those intentions.
Examples include programs that reduce upfront costs (as described in Section 0) and programs that
ensure quality of the technologies (as described in Section 0). Marketing, outreach, and education
campaigns aim to influence the three types of beliefs that most significantly contribute to changing
mindsets– behavioral/outcome beliefs, normative beliefs, and control beliefs:98
Factual campaigns and/or experiential campaigns like ride and drive events can help people understand the impact of adopting the new electric technology (e.g. cost, emissions, impact on daily life).
Social norms campaigns can influence people’s normative beliefs, i.e. their sense of “should,” and their sense of the beliefs of their peers. The more visible the adoption of a behavior is (e.g. solar PV, electric vehicles), the more likely norms can develop in certain populations. These sorts of campaigns could include advertisements that show regular people driving EVs or installing ASHPs.
Educational campaigns about financing and grant opportunities can influence people’s control beliefs by allowing them to believe that an EV or an ASHP is an investment that is financially within reach for them.99
97 In residential buildings, heating systems nearing end of life are often not replaced until burnout. During such emergency replacements, customers tend to be more likely to replace the system with a similar system using similar fuel. Given that some electric replacement technologies for heating and cooling may be less well-suited for emergency replacement (e.g. GSHP require drilling, ASHP often requires backup system in place), customers will need to be aware of and interested in electric replacement prior to a system failure—or otherwise plan ahead for system replacement before failure.
98 C.f. Icek Azjen’s Theory of Planned Behavior, https://people.umass.edu/aizen/pdf/tpb.intervention.pdf 99 Education about green leases can address another control belief in rented properties. Tenants and landlords may not believe
they can benefit from the installation of heat pumps due to split incentive barriers (i.e. where a landlord pays for investments but a tenant benefits from lower bills).
Northeastern Regional Assessment of Strategic Electrification | 47
A successful marketing program could contain elements that influence all three types of beliefs to create
strong motivation in consumers to adopt electric replacement technologies.
In this section, we will be addressing the following types of campaigns in the building sector and in the
transportation sector, which may be targeted at several distinct audiences:
Conventional advertising and informational campaigns
Community-based initiatives
Training for consumers and for the supply chain
Benefits
Investing in marketing, outreach, and education initiatives can address important barriers that slow the
deployment of electric replacement technologies.
Social/institutional barriers, including lack of awareness, customer confidence, and customer inertia. These barriers are addressed by most types of marketing campaigns.
Economic barriers, including the difficulty customers have in justifying high upfront costs through long-term savings. These barriers have recently been addressed by marketing and education coupled with the coordination of bulk purchasing to obtain better pricing for all participants.
If successful, these efforts can initiate a reinforcing feedback loop as more customers notice that their
peers have benefited from adopting the electric replacement technologies and are therefore more likely
to take the risk themselves. For instance, researchers at Yale have found that solar installations by
neighbors increase the likelihood of additional solar installations.100 This feedback cycle is likely most
pronounced for technologies that are highly visible (e.g. solar and EVs), and likely less relevant for heat
pumps. Nonetheless, marketing and outreach efforts are a necessary first step to generate increased
interest in the technologies and increased visibility.
Marketing, outreach, and education can also reinforce the impact of the other policy and program
typologies described in this section in the following ways.
Mandates: Customers affected by building mandates or fleet mandates need education to understand the range of technologies that can enable them to most cost-effectively meet mandate requirements.
Pricing: Customers need education to be aware of available incentives, rate structures, and financing options that can enable them to cost-effectively adopt electric replacement technologies
QA and EM&V: Customers need to be made aware of field performance data and the available QA/QC programs to gain confidence in technology performance and overcome
100 http://pubsonline.informs.org/doi/abs/10.1287/mksc.1120.0727

Northeastern Regional Assessment of Strategic Electrification | 48
skepticism. Furthermore, customers need to understand the significant changes in behavior that will be needed to effectively utilize replacement technologies (e.g. vehicle fueling, heat pump operation).
Solar Benefits Colorado (electric vehicles and PV)
Solar Benefits Colorado was a joint initiative of Boulder County, Adams County, and the City and County of Denver.101 Working with dealerships and PV installers, the campaign organizers negotiated bulk purchase prices resulting in a 26 percent discount on 2015 Nissan LEAFs and a flat rate of $3.50/W for residential PV systems. The program resulted in more than a three-fold increase in sales for 2015 in Boulder County compared to 2014, and only 28 percent of the participants who purchased indicated that they had already been considering purchasing an EV.
Electrification Scenario Analyses
Synapse used its Multi-Sector Emission Model (M-SEM) to model several electrification scenarios. These
scenarios build from stock turnover and fuel shift analyses informed by the preceding technology and
market analyses. They illuminate the pace of market transformation required to reduce emission
substantially by 2050, and highlight the value of decarbonization options other than electrification in
sectors or end-uses where electrification is not practical.
M-SEM is a state-specific model used for tracking historical energy use and emissions and for projecting
future energy use and emission based on a set of policy changes.102 This dynamic spreadsheet model
includes information on the electric, transportation, building, and industrial sectors.
Reference Case
Figure 6 through Figure 8 present the reference case for this analysis. This case corresponds to the
reference case of the 2017 Annual Energy Outlook (AEO) from the EIA. The figures show that electric
demand, non-electric fuel use, and GHG emissions are all not expected to change significantly between
now and 2050. Note that EIA does not thoroughly model state renewable portfolio or clean electricity
standards, so emission reductions from those state policies are not fully reflected in this base case.
101 http://www.swenergy.org/data/sites/1/media/documents/publications/documents/Colorado_EV_Group_Purchase_Programs_Mar-2016.pdf
102 More information on M-SEM is available at http://www.synapse-energy.com/MSEM.

Northeastern Regional Assessment of Strategic Electrification | 49
Figure 6: Regional electric sales in the reference case
Figure 7: Non-electric fuel use by sector in the reference case
Figure 8: Greenhouse gas emissions in the reference case
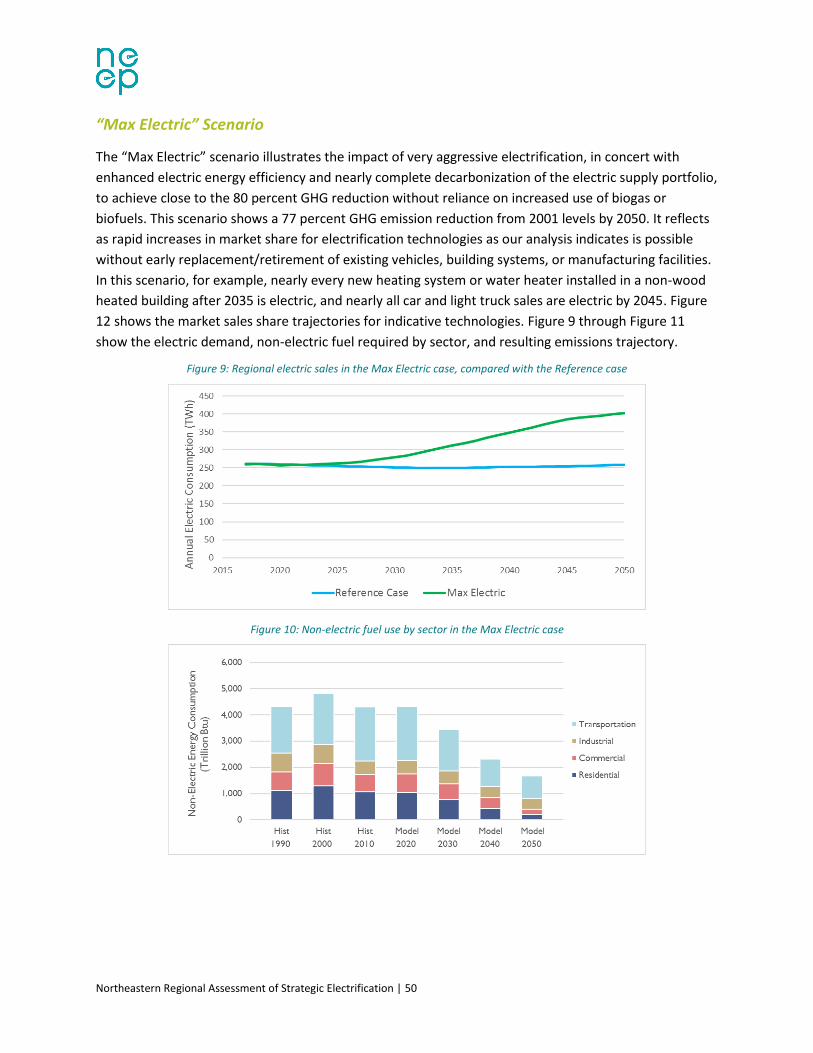
Northeastern Regional Assessment of Strategic Electrification | 50
“Max Electric” Scenario
The “Max Electric” scenario illustrates the impact of very aggressive electrification, in concert with
enhanced electric energy efficiency and nearly complete decarbonization of the electric supply portfolio,
to achieve close to the 80 percent GHG reduction without reliance on increased use of biogas or
biofuels. This scenario shows a 77 percent GHG emission reduction from 2001 levels by 2050. It reflects
as rapid increases in market share for electrification technologies as our analysis indicates is possible
without early replacement/retirement of existing vehicles, building systems, or manufacturing facilities.
In this scenario, for example, nearly every new heating system or water heater installed in a non-wood
heated building after 2035 is electric, and nearly all car and light truck sales are electric by 2045. Figure
12 shows the market sales share trajectories for indicative technologies. Figure 9 through Figure 11
show the electric demand, non-electric fuel required by sector, and resulting emissions trajectory.
Figure 9: Regional electric sales in the Max Electric case, compared with the Reference case
Figure 10: Non-electric fuel use by sector in the Max Electric case
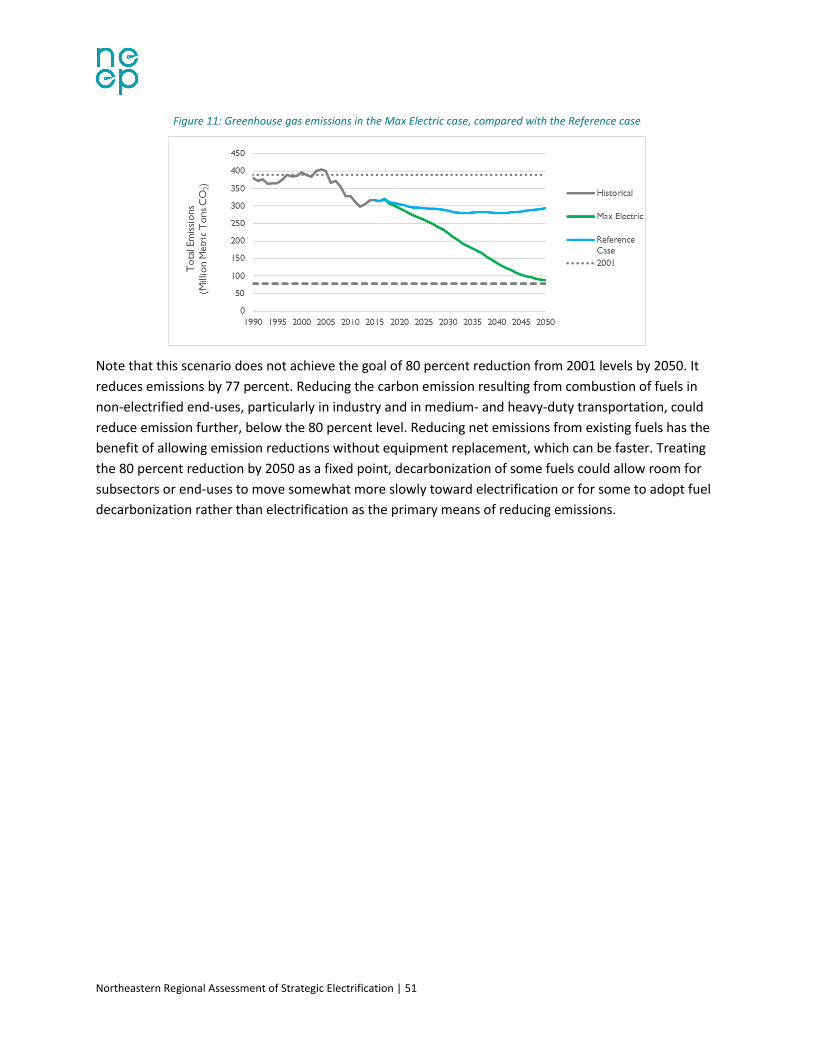
Northeastern Regional Assessment of Strategic Electrification | 51
Figure 11: Greenhouse gas emissions in the Max Electric case, compared with the Reference case
Note that this scenario does not achieve the goal of 80 percent reduction from 2001 levels by 2050. It
reduces emissions by 77 percent. Reducing the carbon emission resulting from combustion of fuels in
non-electrified end-uses, particularly in industry and in medium- and heavy-duty transportation, could
reduce emission further, below the 80 percent level. Reducing net emissions from existing fuels has the
benefit of allowing emission reductions without equipment replacement, which can be faster. Treating
the 80 percent reduction by 2050 as a fixed point, decarbonization of some fuels could allow room for
subsectors or end-uses to move somewhat more slowly toward electrification or for some to adopt fuel
decarbonization rather than electrification as the primary means of reducing emissions.

Northeastern Regional Assessment of Strategic Electrification | 52
Table 10: Comparing the Max Electric and Plausibly Optimistic scenarios with the Reference case based on the 2017 Annual Energy Outlook.
Max Electric Plausibly Optimistic Reference (AEO 2017)
2050 GHG reduction from 2001 levels
77% 69% 24%
2050 electric consumption
402 TWh 339 TWh 259 TWh
Electric energy efficiency ~2% annual savings via long-lived measures
~2% annual savings via long-lived measures
~1.1% annual savings via long-lived measures
Clean electricity 95% in 2050 95% in 2050 61% in 2050
Residential heat pumps Delivered fuels: 96% sales share in 2035
Natural gas: 95% sales share in 2035
Delivered fuels: 89% sales share in 2035
Natural gas: 68% sales share in 2035
6% total installed share in 2050
Commercial heat pumps Delivered fuels: 89% sales share in 2035
Natural gas: 78% sales share in 2035
Delivered fuels: 80% sales share in 2035
Natural gas: 66% sales share in 2035
4% total installed share in 2050
Cars and light trucks 81% sales share in 2035 70% sales share in 2035 3% sales share in 2035
Medium- and heavy-duty road vehicles
50% of miles electric in 2035
25% of miles electric in 2035
0.3% of miles electric in 2035
Process heat and steam 16% fossil energy displaced in 2035
13% fossil energy displaced in 2035
None
“Plausibly Optimistic” Scenario
We estimate that emissions reduction from electrification without low-carbon fuels to the level of 68
percent below 2001 levels can be brought down to 80 percent reduction if low-carbon fuels are
available and used at plausible (although still aggressive) volumes. We developed this scenario to reflect
the role that low-carbon fuels might play in concert with electrification.
Low-carbon fuels could include biodiesel and renewable diesel (and their cousins for heating fuel, such
as bioheat), biogas, and renewable natural gas. Some of these fuels can be made from hydrogen
produced through electrolysis, and could in effect act as storage for excess electric energy generated at
times of particularly strong wind or sun. If such fuels end up not being available, then a scenario closer
to the “Max Electric” scenario may be necessary to reach the 80x50 economy-wide emissions reduction
target.
To achieve a modeled 69 percent reduction from 2001 levels by 2050, markets for electric vehicles,
residential and commercial heat pumps, and heat pump water heaters must develop quickly. Figure 12

Northeastern Regional Assessment of Strategic Electrification | 53
shows the sales share for residential heat pumps and electric cars and light trucks, along with the even
faster increases required in the Max Electric scenario. Heat pumps displace oil and propane faster than
they displace natural gas in both scenarios.
Figure 12: Sales shares for residential heat pumps and electric cars and trucks under the Max Electric and Plausibly Optimistic scenarios.
Figure 13 through Figure 15 show the electric demand, non-electric fuel required by sector, and
resulting emissions trajectory in the policy scenario. This is the scenario we use for grid and consumer
impact analysis in Section 5, and throughout the remainder of the report.
Figure 13: Regional electric sales in the Plausibly Optimistic case, compared with the Reference case

Northeastern Regional Assessment of Strategic Electrification | 54
Figure 14: Non-electric fuel use by sector in the Plausibly Optimistic case
Figure 15: Greenhouse gas emissions in the Plausibly Optimistic case, compared with the Reference case
This scenario represents just one pathway to 70 percent reduction by 2050: faster transformation of the
vehicle market could be paired with slower change in heating, or vice versa. Regardless, the pace of
change and adoption of electric technologies is vastly faster than in current markets.
Sensitivity Analysis
We developed three sensitivity cases based on the policy scenario to illustrate the effect and
contribution of three separate components of this scenario: electric energy efficiency; a nearly carbon-
free electricity portfolio; and heat pump adoption in buildings otherwise served by natural gas.
Low-Energy-Efficiency Sensitivity
Given the significant increases in electric energy use associated with strategic electrification, electric
energy efficiency can play a fundamental role in mitigating grid impacts and reducing energy costs and
the need for additional supply resources. To illustrate this impact, this sensitivity case shows the electric
demand if strategic electrification is accompanied only by the amount of energy efficiency included in
the AEO base case (approximately 1.1 percent savings through long-lived energy efficiency measures

Northeastern Regional Assessment of Strategic Electrification | 55
each year, which is close to the current regional average), rather than the enhanced amount included in
the Plausibly Optimistic scenario (approximately 2 percent savings through long-lived energy efficiency
measures each year). Electrification appliances (heat pumps, EVs, etc.) are assumed to be efficient in
both cases; this case illustrates the value of energy efficiency in all other end-uses. Figure 16 shows the
regional electric sales in the policy scenario and this lower-EE scenario. Without simultaneous energy
efficiency, electric sales would be 11 percent higher in 2030 and 21 percent higher in 2050. While we
have not modeled peak demand, it is likely to show an even stronger effect, since energy efficiency
programs can be targeted to cost-effective peak demand reduction.
Figure 16: Impact on regional electric consumption from enhanced energy efficiency in concert with electrification
20 Percent Fossil Fuel Electricity
Electrification leads to the greatest emissions reductions when the supply portfolio is decarbonized.
Current state policies have not fully established supply decarbonization by 2050; the Massachusetts
Clean Energy Standard, which would require 80 percent carbon-free electricity by 2050, and the
Vermont Renewable Energy Standard of 75 percent by 2032 are the closest. This sensitivity analysis
compares the Plausibly Optimistic scenario (which has 4 percent fossil fuel generation in 2050) with a
case that meets 20 percent of electric supply from fossil fuels (that is, 80 percent carbon-free).
Figure 17: Percent of regional electricity from zero-emission sources in the Reference case, the Plausibly Optimistic case, and the 20% Fossil Electricity sensitivity
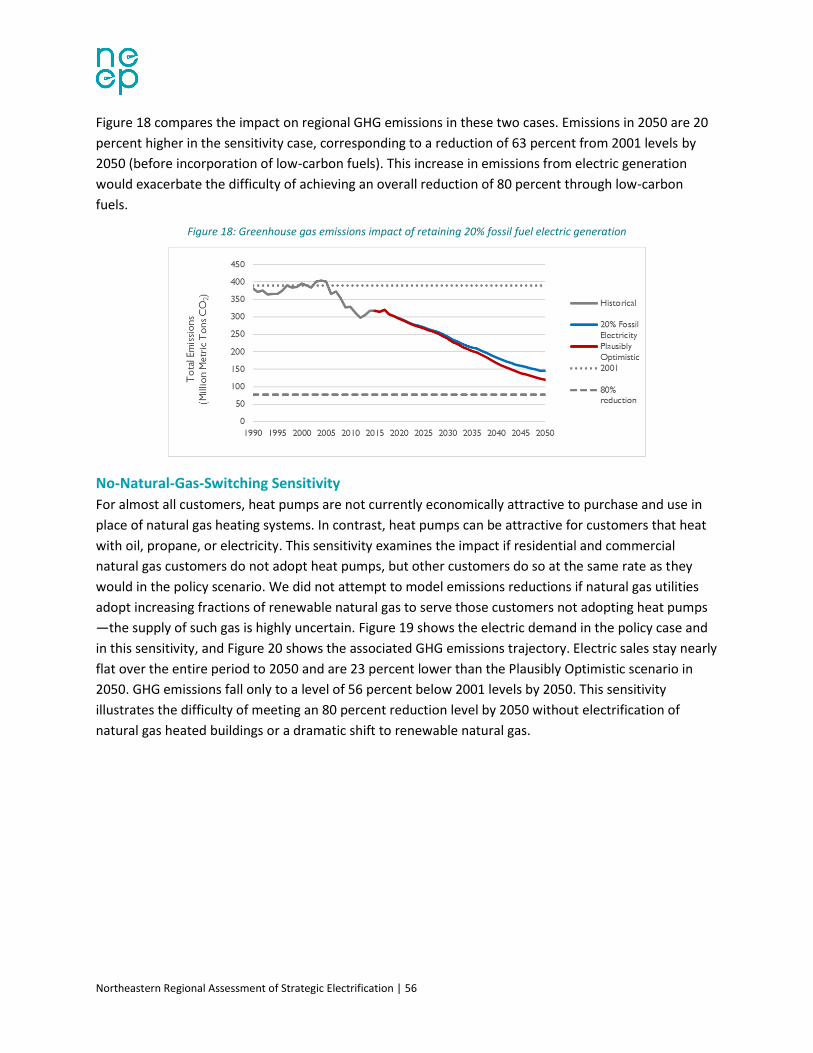
Northeastern Regional Assessment of Strategic Electrification | 56
Figure 18 compares the impact on regional GHG emissions in these two cases. Emissions in 2050 are 20
percent higher in the sensitivity case, corresponding to a reduction of 63 percent from 2001 levels by
2050 (before incorporation of low-carbon fuels). This increase in emissions from electric generation
would exacerbate the difficulty of achieving an overall reduction of 80 percent through low-carbon
fuels.
Figure 18: Greenhouse gas emissions impact of retaining 20% fossil fuel electric generation
No-Natural-Gas-Switching Sensitivity
For almost all customers, heat pumps are not currently economically attractive to purchase and use in
place of natural gas heating systems. In contrast, heat pumps can be attractive for customers that heat
with oil, propane, or electricity. This sensitivity examines the impact if residential and commercial
natural gas customers do not adopt heat pumps, but other customers do so at the same rate as they
would in the policy scenario. We did not attempt to model emissions reductions if natural gas utilities
adopt increasing fractions of renewable natural gas to serve those customers not adopting heat pumps
—the supply of such gas is highly uncertain. Figure 19 shows the electric demand in the policy case and
in this sensitivity, and Figure 20 shows the associated GHG emissions trajectory. Electric sales stay nearly
flat over the entire period to 2050 and are 23 percent lower than the Plausibly Optimistic scenario in
2050. GHG emissions fall only to a level of 56 percent below 2001 levels by 2050. This sensitivity
illustrates the difficulty of meeting an 80 percent reduction level by 2050 without electrification of
natural gas heated buildings or a dramatic shift to renewable natural gas.

Northeastern Regional Assessment of Strategic Electrification | 57
Figure 19: Regional electric sales in the Plausibly Optimistic case and the no-natural-gas-switching sensitivity case
Figure 20: GHG emissions in the Plausibly Optimistic case and the no-natural-gas-switching sensitivity case
Grid and Consumer Impacts
The shifts in energy consumption indicated by the policy scenario developed and modeled in the
previous section include significant increases in electric energy demand. This section dives deeper on
the impacts of electrification on shared energy infrastructure: the electric and natural gas transmission
and distribution grids. The first subsection addresses power supply needs and the hardware and
operation of the grid (at both transmission and distribution levels). The second shifts to look at both
electric and natural gas grid issues from a consumer perspective. Consumers will also be the
beneficiaries of the electrified end-uses (heat and transportation), but those impacts have been
reflected in earlier discussions.
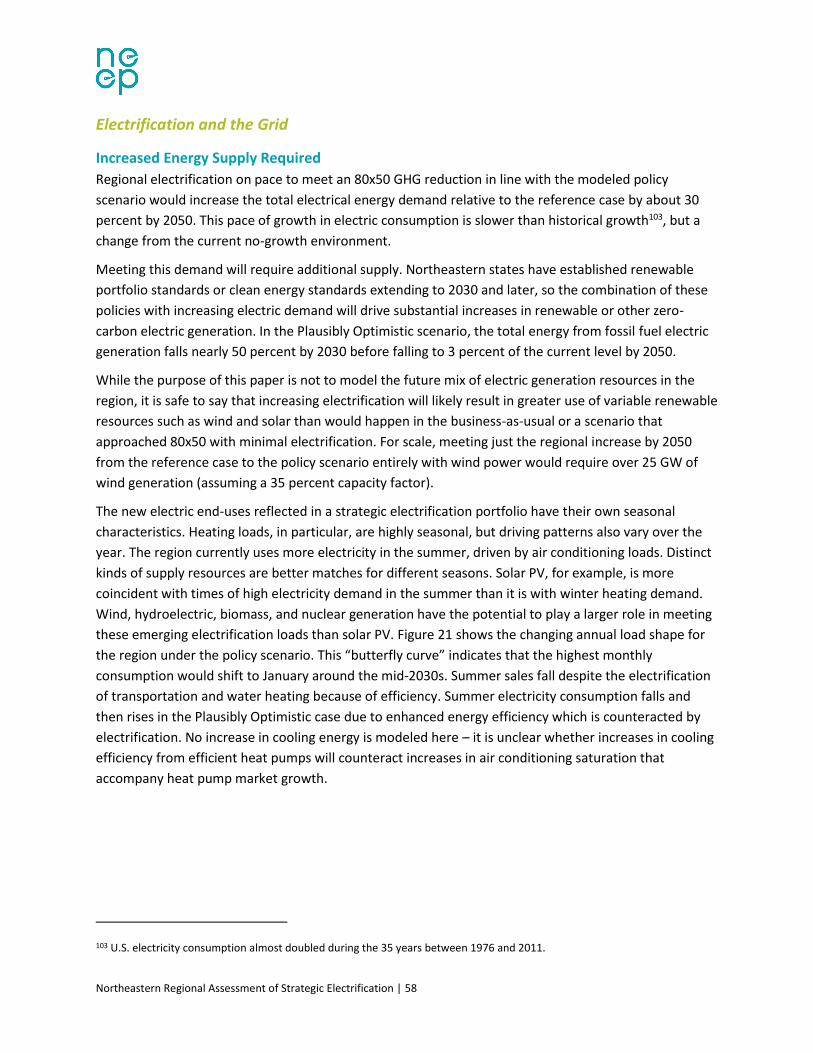
Northeastern Regional Assessment of Strategic Electrification | 58
Electrification and the Grid
Increased Energy Supply Required
Regional electrification on pace to meet an 80x50 GHG reduction in line with the modeled policy
scenario would increase the total electrical energy demand relative to the reference case by about 30
percent by 2050. This pace of growth in electric consumption is slower than historical growth103, but a
change from the current no-growth environment.
Meeting this demand will require additional supply. Northeastern states have established renewable
portfolio standards or clean energy standards extending to 2030 and later, so the combination of these
policies with increasing electric demand will drive substantial increases in renewable or other zero-
carbon electric generation. In the Plausibly Optimistic scenario, the total energy from fossil fuel electric
generation falls nearly 50 percent by 2030 before falling to 3 percent of the current level by 2050.
While the purpose of this paper is not to model the future mix of electric generation resources in the
region, it is safe to say that increasing electrification will likely result in greater use of variable renewable
resources such as wind and solar than would happen in the business-as-usual or a scenario that
approached 80x50 with minimal electrification. For scale, meeting just the regional increase by 2050
from the reference case to the policy scenario entirely with wind power would require over 25 GW of
wind generation (assuming a 35 percent capacity factor).
The new electric end-uses reflected in a strategic electrification portfolio have their own seasonal
characteristics. Heating loads, in particular, are highly seasonal, but driving patterns also vary over the
year. The region currently uses more electricity in the summer, driven by air conditioning loads. Distinct
kinds of supply resources are better matches for different seasons. Solar PV, for example, is more
coincident with times of high electricity demand in the summer than it is with winter heating demand.
Wind, hydroelectric, biomass, and nuclear generation have the potential to play a larger role in meeting
these emerging electrification loads than solar PV. Figure 21 shows the changing annual load shape for
the region under the policy scenario. This “butterfly curve” indicates that the highest monthly
consumption would shift to January around the mid-2030s. Summer sales fall despite the electrification
of transportation and water heating because of efficiency. Summer electricity consumption falls and
then rises in the Plausibly Optimistic case due to enhanced energy efficiency which is counteracted by
electrification. No increase in cooling energy is modeled here – it is unclear whether increases in cooling
efficiency from efficient heat pumps will counteract increases in air conditioning saturation that
accompany heat pump market growth.
103 U.S. electricity consumption almost doubled during the 35 years between 1976 and 2011.
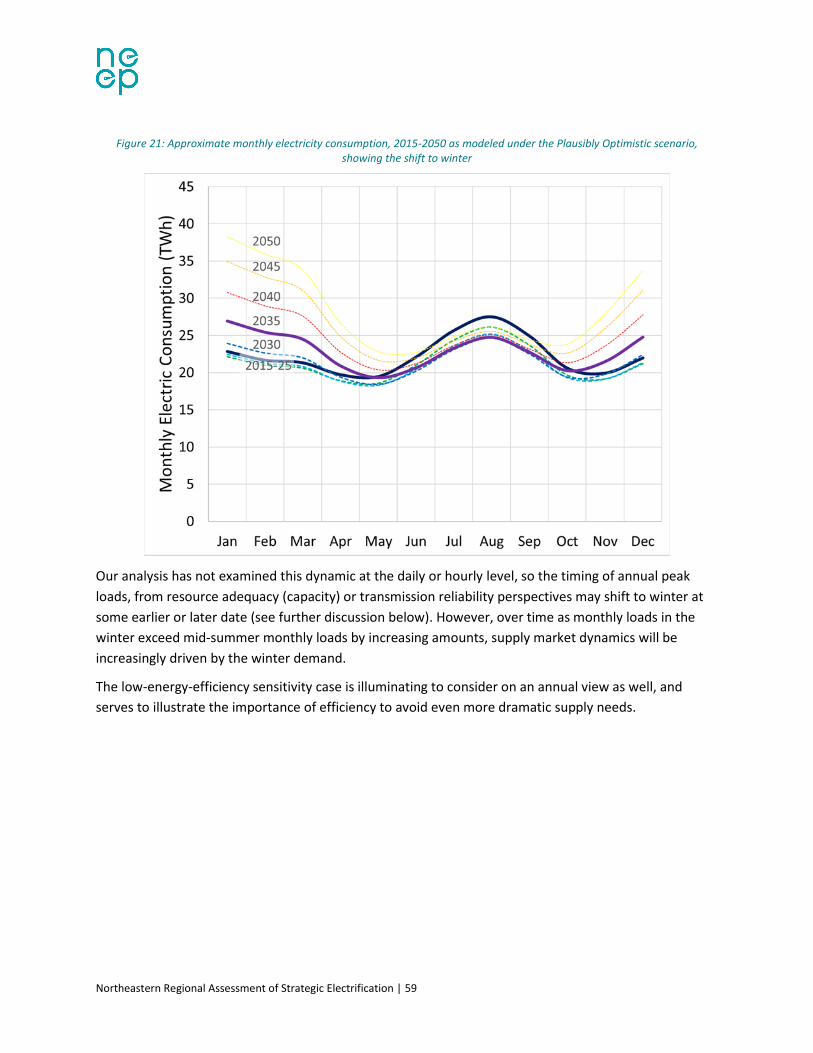
Northeastern Regional Assessment of Strategic Electrification | 59
Figure 21: Approximate monthly electricity consumption, 2015-2050 as modeled under the Plausibly Optimistic scenario, showing the shift to winter
Our analysis has not examined this dynamic at the daily or hourly level, so the timing of annual peak
loads, from resource adequacy (capacity) or transmission reliability perspectives may shift to winter at
some earlier or later date (see further discussion below). However, over time as monthly loads in the
winter exceed mid-summer monthly loads by increasing amounts, supply market dynamics will be
increasingly driven by the winter demand.
The low-energy-efficiency sensitivity case is illuminating to consider on an annual view as well, and
serves to illustrate the importance of efficiency to avoid even more dramatic supply needs.

Northeastern Regional Assessment of Strategic Electrification | 60
Figure 22: Approximate monthly electricity consumption, 2015-2050 as modeled under the low-energy-efficiency sensitivity case, showing the increased shift to winter without summer peak relief
Impact on Transmission and Distribution Systems
Transmission and distribution systems will be impacted by strategic electrification in multiple ways.
These include:
transmission expansion as necessary to reach the sources of supply to meet the growing demand for renewable and zero-carbon resources;
peak impacts on a distribution circuit-by-circuit basis, the bulk transmission system, and all levels in between; and
harnessing newly electrified end-uses as grid resources.
This subsection addresses the first two of these points; the following subsection dives more deeply into
the implications of controllable loads as distributed energy resources (DERs).
It is likely that new transmission investment will be required to both reach the sources of renewable
electricity and integrate variable resources while maintaining reliability. The combined effects of
portfolio standards and electrification will likely stress the ability of NY ISO and ISO New England to
maintain historical practices with respect to grid operations, wholesale markets, and transmission
planning.

Northeastern Regional Assessment of Strategic Electrification | 61
New electric end-uses can draw significant power from the grid. For example, home EV charging systems
can draw nearly 50 percent more power than even the most energy-intensive home appliances. If a
household is heating with a heat pump on cold evening, starts to charge a car upon arrival home from
work, and draws on the hot water heater, the peak demand from the home could more than double
what the same home might draw today.
Solar PV has tended to be adopted in neighborhood clusters; if the same thing happens to heat pumps
and electric vehicles the local distribution circuits serving these residential neighborhoods could see
significant new stresses well before the bulk system shifts to winter peaking. At the same time, if the
water heaters are controlled to pre-heat before the evening demand peak, EVs are programmed not to
charge until after bedtime (or even can feed power into the home at peak and recharge later), and the
homes are well-enough insulated to pre-heat and reduce their demand through the early evening peak
(or stagger demand between homes), this distribution grid stress might be mitigated. Part of electrifying
strategically should be figuring out how to cost-effectively enable the second vision rather than the first.
Neighborhood-level approaches may be promising.
The Electric Power Research Institute, Southern California Edison, and Meritage Homes conducted an
analysis of neighborhood-level impacts from zero-net-energy homes in California.104 These homes had
heat pumps for space and water heating, as well as solar PV; given the California climate, the grid
impacts were dominated by the PV. A similar study, in real buildings or models, could examine the
effects of electrification with and without distributed generation around the year in a northeastern
climate.
At the transmission level, new winter peaks will at some point create the need for upgrades. To the
extent that electrification proceeds unevenly across the region (e.g. is centered in urban areas) it will
change the dynamics on the transmission system and could create or exacerbate constraints. At the
same time, tight clustering is less likely at the geographic scales that shape transmission system
dynamics, and a system built to handle summer peaks (that currently significantly exceed winter peaks)
may not require significant investment driven by winter peaks for many years. ISO-level long-term
forecasting has generally lagged behind the pace of introduction of new technologies and programs
(energy efficiency, distributed PV);105 forecasts used for transmission planning will need to take coming
electrification into account early to ensure that there is time for careful planning and analysis of options
to handle any changes.
As a purely illustrative example, we estimated the winter peak impacts from heat pumps, without
accounting for other end-uses or efficiency beyond that already built into NYISO and ISO New England
peak forecasts. Figure 23 shows the ISO winter and summer peak projections (trended beyond the 10-
year windows the ISOs project), with heating loads added to the winter peak. More efficient heat
104 Grid Integration of Zero Net Energy Communities. EPRI, Palo Alto, CA: 2016. 3002009242. 105 See, for example, “New England Electricity Demand: How Low Can You Go?” at http://www.synapse-energy.com/about-
us/blog/new-england-electricity-demand-how-low-can-you-go
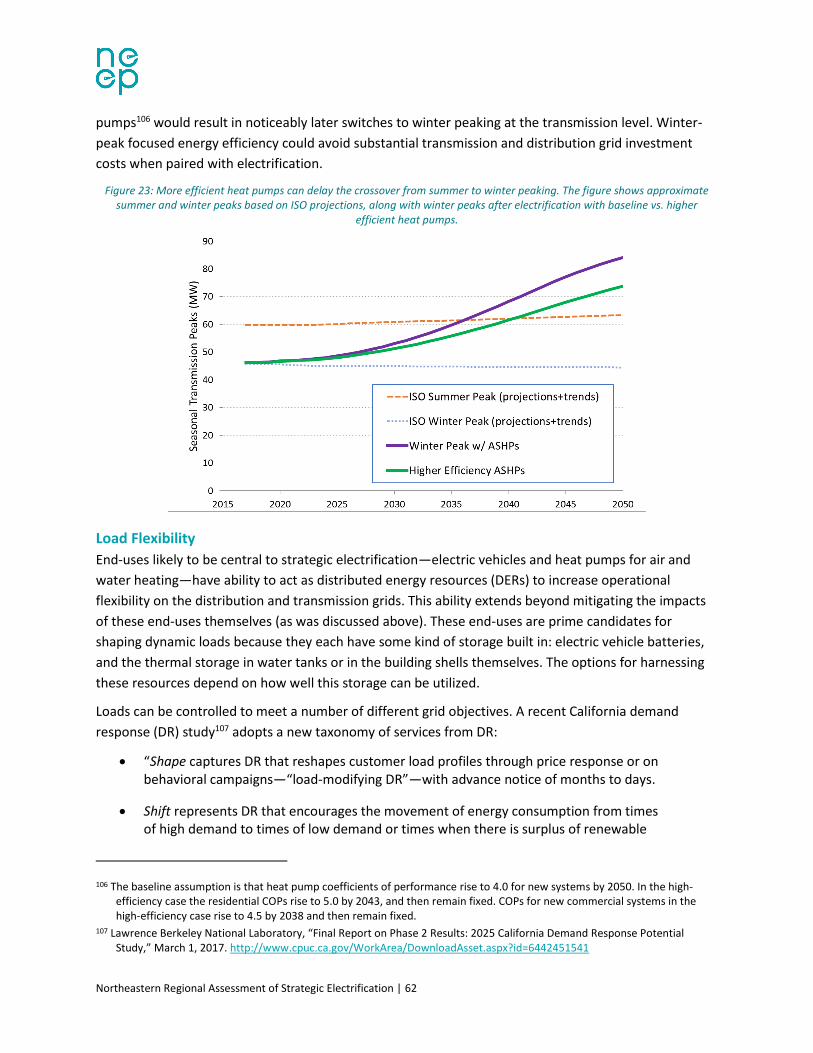
Northeastern Regional Assessment of Strategic Electrification | 62
pumps106 would result in noticeably later switches to winter peaking at the transmission level. Winter-
peak focused energy efficiency could avoid substantial transmission and distribution grid investment
costs when paired with electrification.
Figure 23: More efficient heat pumps can delay the crossover from summer to winter peaking. The figure shows approximate summer and winter peaks based on ISO projections, along with winter peaks after electrification with baseline vs. higher
efficient heat pumps.
Load Flexibility
End-uses likely to be central to strategic electrification—electric vehicles and heat pumps for air and
water heating—have ability to act as distributed energy resources (DERs) to increase operational
flexibility on the distribution and transmission grids. This ability extends beyond mitigating the impacts
of these end-uses themselves (as was discussed above). These end-uses are prime candidates for
shaping dynamic loads because they each have some kind of storage built in: electric vehicle batteries,
and the thermal storage in water tanks or in the building shells themselves. The options for harnessing
these resources depend on how well this storage can be utilized.
Loads can be controlled to meet a number of different grid objectives. A recent California demand
response (DR) study107 adopts a new taxonomy of services from DR:
“Shape captures DR that reshapes customer load profiles through price response or on behavioral campaigns—“load-modifying DR”—with advance notice of months to days.
Shift represents DR that encourages the movement of energy consumption from times of high demand to times of low demand or times when there is surplus of renewable
106 The baseline assumption is that heat pump coefficients of performance rise to 4.0 for new systems by 2050. In the high-efficiency case the residential COPs rise to 5.0 by 2043, and then remain fixed. COPs for new commercial systems in the high-efficiency case rise to 4.5 by 2038 and then remain fixed.
107 Lawrence Berkeley National Laboratory, “Final Report on Phase 2 Results: 2025 California Demand Response Potential Study,” March 1, 2017. http://www.cpuc.ca.gov/WorkArea/DownloadAsset.aspx?id=6442451541

Northeastern Regional Assessment of Strategic Electrification | 63
generation. Shift could smooth net load ramps associated with daily patterns of solar energy generation.
Shed describes loads that can be curtailed to provide peak capacity and support the system in emergency or contingency events—at the statewide level, in local areas of high load, and on the distribution system, with a range in dispatch advance notice times.
Shimmy involves using loads to dynamically adjust demand on the system to alleviate short-run ramps and disturbances at timescales ranging from seconds up to an hour.”
Table 11 summarizes how the three primary end-use technologies examined here match up against
these different kinds of services.
Table 11: The kinds of services for which strategic electrification end-uses are well-suited
Shape Shift Shed Shimmy
Electric vehicles X X X X
HP water heat X X X
HP space heat X X
Electric vehicles and associated charging equipment can today be controlled to respond to price signals
or to curtail charging during peak periods. Rate structures can encourage charging off-peak. There are
active programs108 to use EVs and appropriately designed charging equipment to pull power from the
vehicles and supply it to the host site or to grid. These are called “vehicle to home” (V2H) or “vehicle to
grid” (V2G) services.
Electric resistance water heaters have been used by utilities for decades to shift loads and shave peaks—
millions of them are used for these purposes across the country. More recently water heaters have been
growing as a source of regulation service. However, a strategic approach to electrification in our region
today would not choose resistance heaters, particularly given northeastern electric rates. (Northeastern
states have long history of promoting fuel switching away from resistance heat.) A 2016 Brattle Group
report109 refers to water heaters as “hidden batteries” and compares the economics and emission
impacts of controlled and uncontrolled resistance and heat pump water heaters. While the benefits of
control are smaller for HPWHs, the emissions impacts favor them. Fast-response (“shimmy”) services,
like regulation service, are more challenging for a compressor-based HP water heater than for an easily
108 Frederiksberg Forsyning in Denmark purchased a fleet of cars from Nissan and is using Enel charging stations. The software to control the vehicles was developed at the University of Delaware and is being licensed by Nuvve in Europe. See: Karen Roberts, “UD-Developed V2G Technology Launches in Denmark,” UDaily, August 29, 2016, http://www.udel.edu/udaily/2016/august/vehicle-to-grid-denmark/.
109 “The Hidden Battery: Opportunities in Electric Water Heating” available at http://www.electric.coop/wp-content/uploads/2016/07/The-Hidden-Battery-01-25-2016.pdf

Northeastern Regional Assessment of Strategic Electrification | 64
switched resistive heater, but thermal storage (“shape” or “shift”) and peak shaving (“shift” or “shed”)
applications should be technically implementable with HPWHs.
Heat pumps used for space heating can be controlled while maintaining customer acceptance if the
buildings they serve are well-enough insulated to allow pre-heating and maintain comfort through a
period of full or partial curtailment. Alternatively, customers must accept a lower thermostat setting,
controlled by the utility. Flexibility during the periods of coldest winter is likely to be smaller than
controllability during summer heat, due to greater temperature differentials between interior and
exterior and the more immediate effects on human health.
These technologies are capable of deployment as DERs, but the market and regulatory structures to
control that deployment are not yet well established. Wholesale markets reward some products (like
capacity), while distribution utilities may value other characteristics (such as distribution constraint
management), and a single DER can provide both. The New York REV proceeding is driving that state
forward to create distribution-level markets; other states may choose other paths. States may confront
challenges in planning and regulation when a single resource (such as a controlled EV) may participate in
both state-regulated distribution service markets and federally regulated transmission service markets.
Impacts on Consumers
Strategic electrification will change how large pieces of shared infrastructure—the electric and natural
gas transmission and distribution systems—are used. End-uses will not universally electrify overnight;
some consumers will adopt these technologies earlier than others. The actions of some consumers will
therefore have an impact on the costs, benefits, and services received from these shared systems by
other consumers. This section addresses three possible such impacts: possible increases in electric
system utilization; decreases in the utilization of the natural gas distribution system (ultimately
culminating in stranded cost risks); and cost impacts associated with utility activities to “prime the
pump” on emerging technologies.
System utilization reflects the relationship between average load and the cost of the distribution system
(which in turn is driven by its need to handle a certain peak load). Because the cost of distribution is
fixed in the short term and allocated among customers based on their usage, increasing utilization
should reduce electric rates because fixed costs are spread over more sales. This dynamic occurs as long
as increasing load and utilization does not cause any substantial new distribution investment.
Strategic electrification has the potential to increase electric volumetric sales (kWh) more quickly than
peaks (kW), if new loads are managed well. In the early years of the transition, even unmanaged loads
would likely have this effect. This is because distribution and (particularly) transmission systems are built
to handle peaks that are not likely to be exacerbated by heat pumps or electric vehicles until
penetration of those technologies increase beyond the early adopter stage. This means there is a period
in the near term to develop load management tools (whether in technology or in rates) and contain
peak growth, keep the utilization rising, and put downward pressure on electric rates. Empowering
consumers to participate in load management—and compensating them for the value provided by their

Northeastern Regional Assessment of Strategic Electrification | 65
DERs—will help customers manage the eventual costs from grid upgrades when electrification proceeds
to the level that extensive grid upgrades are required.
A similar story could play out in reverse for natural gas utilities. If electrification reduces natural gas
sales for space and water heating in residential and commercial sectors, the effective utilization of the
gas distribution system will fall. Heat pumps that meet only part of a building’s heating load—for
example heating only when outside temperatures are above zero degrees—help to illustrate this
problem: the building draws gas at its same peak level on the coldest days, requiring the same
distribution capacity, but volumetric sales over the year fall significantly. (Note that this example also
illustrates the value of natural gas peak capacity to mitigate electric system peaks from heat pumps, in
the near- to medium-term.) A falling gas system utilization would increase rate pressure. To the extent
that rates rise, it improves the customer economics for others to adopt electric space and water heating
options and further exacerbates the challenge.
Whether energy users’ overall energy bills will fall depends on various factors such as electric and
natural gas rates, unregulated fuel prices, efficiency of fossil fuel-based heating equipment and electric
heat pumps, and whether promoting heat pumps is supported through a system benefit charge (SBC). A
recent study conducted for Rhode Island Office of Energy Resources (OER) examined this dynamic.110
The study assessed renewable thermal markets in the state and analyzed various impacts including rate
and bill impacts from future scenarios where new state policies and programs promote renewable
thermal technologies (e.g., heat pumps, solar hot water, wood pellet) through SBC-based funding.111 In a
5 percent penetration scenario where 5 percent of thermal needs are met with renewable technologies,
the study found that the combined energy bill impacts for non-participants is very small: $3 per year or
0.1 percent increase for residential customers, and $25 per year or 0.15 percent increase for commercial
customers.
The customers remaining connected to the natural gas system as this cycle progresses are those who
were not early adopters of new electric technologies. These are more likely to be low- to moderate-
income consumers and renters. This raises important equity issues that will need careful planning. At
the extreme end of a shift of building and water heat to electricity, natural gas distribution systems may
become stranded costs.
The third shared impact is driven by nearer-term investments: To the extent that utilities invest in
enabling infrastructure to drive new markets ahead of the ability for those markets to deliver the
revenue required to pay for that infrastructure, all utility customers are covering those costs. This issue
is most prominent today for EV charging infrastructure. The EV charging market is not yet large enough
to make most EV charging stations profitable, yet without public and workplace charging the market
110 Meister Consultants Group and Synapse Energy Economics (2017) Rhode Island Renewable Thermal Market Development Strategy, prepared for Rhode Island Office of Energy Resources, January 2017. Available at http://www.synapse-energy.com/sites/default/files/RI-Renewable-Thermal-15-119.pdf.
111 To be more specific, the study assessed cost-effectiveness, emission impacts, job impacts, and rate and bill impacts from state’s new renewable thermal policies and programs. The study assumed air source heat pumps would account for the majority of the renewable thermal technology portfolio.
Northeastern Regional Assessment of Strategic Electrification | 66
may not grow at all. These investments that prime the pump may pay off in terms of advancing public
policy and accelerating market development to the point that revenues are sufficient, but those payoffs
are downstream. Regulators, utilities, and advocates will need to work carefully to strike appropriate
balances between the utility’s interest in investing in rate-based infrastructure, public policy objectives,
shared costs, and the need to foster competitive markets.
Next Steps
We have divided next steps into three classes: First, we identify policy and program actions to grow and
mature the markets for electrification technologies over the next five to ten years. Second, we have
distilled a set of difficult policy questions, the answers to which will be required once the electrification
technology markets mature. Finally, there are research and data needs to inform planning.
Near-Term Actions: Develop and Grow Electrification Programs
Markets for electrification technologies robust and active enough to start the region toward the policy
scenario (and 80 percent reduction in emissions when accounting for low-carbon fuels) will require
substantial market development from the current level of niche and nascent markets. For example, the
residential cold climate heat pump market should grow by 15 percent or more per year between now
and 2025 to be on pace. Developing markets at the required pace over the next five years would require
concerted and active policy and program intervention. The region would need to build on and expand
the programs in place today and take advantage of opportunities as they arise (such as the funding from
the Volkswagen emissions settlement). Promising steps in this direction include:
expanding the use of explicit targets, goals, and mandates for electrification to create market certainty;
launching or supporting marketing campaigns to increase customer awareness of electric options;
supporting and expanding state, city, and/or utility incentives for EVs, heat pumps, and heat pump water heaters;
expanding electric vehicle charging infrastructure, particularly in multi-family housing, workplaces, and fast charging for longer-distance travel;
developing and scaling new financing models for cost-effective electric technologies;
requiring planning from utilities and state authorities on how strategic electrification will impact the different components of the energy system; and
continuing data collection, analysis, and testing to characterize the performance of heat pumps, heat pump water heaters, and electric vehicles.

Northeastern Regional Assessment of Strategic Electrification | 67
Policy Questions to Study and Resolve
The roles of electric distribution utilities
Strategic electrification will mean increased reliance on the electric grid. It will drive many changes in
how that grid is used, resulting in the need for substantially different grid investment and operations.
The regulated monopoly "wires" utility will therefore be a key player in this transformation. The
question facing policymakers, regulators, utility executives, and the citizens of our states is what role or
roles we expect our utilities to play, and how their business model should be adapted to reflect that
role.
Utilities, particularly investor-owned utilities, generally act as economically rational firms. While not
universal across the region, our utilities generally operate under a decoupling regime that makes their
shareholders indifferent to increases or decreases in electric sales. Their profits are directly related to
the size of their rate base of capital investments. They are also commonly rewarded with shareholder
incentives for the performance of energy efficiency programs. In this paradigm, strategic electrification
before new capital investments are required has only incidental benefits for the utility (for example, it
reduces pressure to raise rates and buys headroom for other programs).
Electric utilities throughout the region design and implement energy efficiency programs, and
shareholders are rewarded for the performance of those programs. One possible course for strategic
electrification would be to set up similar reward structures for electrification metrics (such as the
number of EV or heat pumps deployed, the fossil fuels avoided through their operation, or the capacity
of electrification load under utility control or subject to advanced rates), or to modify efficiency program
metrics to reflect GHG or total energy reductions. Some of these metrics exist already, as part of state
renewable portfolio standards (e.g. in Massachusetts, New Hampshire, and Vermont), but no
shareholder compensation is tied to their achievement and (in restructured states) energy suppliers, not
distribution utilities, are the regulated entities.
Metering and rate designs
A low volumetric electric energy rate would improve the customer economics of electrification. This
presents a challenge in particular because of our region's generally high electric rates (the seven states
in this region are all in the top nine average electric rates in the country, not including Hawaii or
Alaska).112 While aggregate system costs reflected in rates may be able to fall somewhat if volumetric
sales outpace peak growth, putting downward pressure on rates, electrification technologies would add
significant sales at times when wholesale energy prices have traditionally been low and the distribution
grid not stressed—economically efficient rate designs would charge lower rates during these times.
Rate designs that have this feature may be based around demand charges or time-of-use rates
(including peak time rebate or critical peak price rates focused on times of particular grid stress or other
high cost drivers), or some combination. It is important in the near term to avoid implementing rate
112 U.S. EIA data for calendar year 2016
Northeastern Regional Assessment of Strategic Electrification | 68
designs that would have the effect of discouraging strategic electrification. Instead, utilities and
regulators should consider rates as part of their toolkit for promoting EVs and heat pumps.
While some northeastern electric customers have meters capable of implementing time-varying or
demand rates, most do not. The beneficial aspects of enabling electrification could impact the cost-
benefit calculation for advanced meter deployment. Special tariffs or rate riders could also compensate
customers for utility control or curtailment of newly electrified end-uses.
Several northeastern states have ongoing proceedings regarding grid modernization (New York, Rhode
Island, New Hampshire, Massachusetts). In those and future similar contexts, regulators, utilities, and
other stakeholders should consider policy objectives for deep decarbonization and strategic
electrification when considering capital plans and rate designs.
Electric customers in the Northeast pay some of the highest system benefit charges (SBCs) to fund
energy efficiency and renewable energy programs. These programs are cost-effective ways to procure
least-cost energy resources. While the total bill impact of these charges is modest, their rate design
(generally as an uncapped adder to energy and demand charges) does not advance strategic
electrification. Options to consider here include capping the SBC contributions expected from customers
with efficient heat pumps and electric vehicles, crediting such customers with an approximate rebate of
SBC contributions, or identifying ways to exempt those end-uses from the SBC through estimated time
of use or end-use disaggregation from load analysis. If end-uses can be disaggregated from meter or grid
sensor data, those end-uses could receive other rate-related incentives as well.
Future of gas
As the scenario modeling presented in Section 4 shows, achieving an 80x50 GHG reduction target with
electrification will require significant reductions in fossil natural gas use, especially in buildings. Today,
some cities are considering using energy codes or other tools to require net zero buildings or no
connections for new buildings to natural gas pipelines. Some end-uses, such as CHP, flexible electric
generators, and manufacturing processes, are likely to be the most difficult to switch fuels or
decarbonize. These are the places where the value of pipeline gas is greatest compared with other
alternatives.
If pipeline gas were to decline as modeled in the electrification scenarios, the business model of current
natural gas distribution utilities would be under severe threat. Their distribution systems require
investment and are their source of earnings under the current regulatory paradigm. If these systems
carry much less gas, rates to recover the costs of those systems could rise significantly. This would only
reinforce the economics of customers choosing electrification, triggering further gas use reductions.
Gas networks can also carry non-fossil gas, such as cleaned-up biogas generated by anaerobic digestion
or landfills, or synthetic gas produced from electricity (power-to-gas or P2G). However, these potential
“green gas” options do not exist in our region at a scale commensurate with current demand. Further,
they would rely on significant technological advances and cost reductions, requiring market and R&D
activities likely outside the power of states and cities in our region to fund. Further study is required to
characterize the renewable gas potential and assess its cost. The results of such analysis could inform

Northeastern Regional Assessment of Strategic Electrification | 69
decisions about the balance between electrification and renewable pipeline gas. This balance would
inform near-term decisions regarding the appropriate pace of expansion in natural gas distribution or
transmission infrastructure.
If policymakers do not address the implications of the possible decline of natural gas utilities, yet take
actions driving toward an 80x50 future, there is a risk of a disorderly or chaotic collapse of natural gas
service. However, if policies and plans are established today that take into account and identify long-
term trajectories an orderly transition that strands fewer assets, protects both the early and late
adopters of electric technologies, and provides certainty and value for utility shareholders may be
possible. We encourage regulators and policymakers to dig deeper into the implications of these choices
over the next five years, and to be willing to make the decisions that may be necessary, even in the face
of concerns about “picking winners and losers.”
Funding source for incentives at scale
The markets for electric vehicles, heat pumps, and other strategic electrification end-uses need to grow
quickly in order to meet states’ deep decarbonization goals. While these markets are growing as a result
of the natural performance and economics of these technologies, it is unlikely that they will grow fast
enough to stay on a trajectory to 80x50 without significant policy intervention. If that intervention takes
the form of incentive or rebate payments, large sources of revenue will be needed to fund them at the
required scale of markets. Policymakers and regulators should consider and develop funding options
over the next five years. These could include: charges on regulated fuels (akin to the systems benefit
charges that fund energy efficiency programs); utility capital recovered through rates outside of a
specific charge; tax revenue; auction revenue from carbon cap and trade systems; or some combination
of these or other options. Policymakers should consider the impact of the revenue source on the relative
prices of fuels, if it has one. (Raising revenue via flat volumetric charges on electricity would make
electrification less economic, for example.) Coordinated action across legislatures and utility
commissions will likely be required.
Research and Data Needs
Market data
In the development of this report, it became clear that there are no definitive sources of market data for
key electrification technologies, particularly for heat pumps. Markets likely differ across the seven
Northeastern states, and even regionally within states. But data regarding the penetration of heat
pumps, their cold climate performance, and the fuels they are displacing is spotty at best. We
recommend that states, cities, and utility program implementers partner to develop better information
on these markets over the next several years. This will allow the development of policies and programs
best targeted to the state of each market. Incentive programs can be a way to collect this data, but they
only capture market information from program participants. Also, they can be an expensive way to
gather information while increasing administrative burden for program participants. Different markets
may require data collection at different points in the supply chain—at the dealer level for some
technologies and the distributor for others, for example.

Northeastern Regional Assessment of Strategic Electrification | 70
Pilots on controlling resources
Harnessing electrification end-uses to integrate renewable energy and defer other grid costs in the near-
to mid-term, and minimizing grid system costs resulting from strategic electrification in the medium- to
long-term, will require the ability to control electric vehicle charging, heat pumps, and heat pump water
heaters. In the next five years, efforts should focus on understanding the ability, and limitations, of
these end-uses to provide a diverse array of grid services. At the same time, customers need to be able
to get the services that led them to purchase the equipment in the first place: mobility with comfortable
range, home comfort, hot water on demand. Grid services can’t supersede customer acceptance.
Distribution and transmission utilities, NYISO, and ISO New England need to gain an understanding of
these technologies and, eventually, the ability to deploy them. Near-term efforts should focus on pilots
designed to test the technology for control. These are diverse end-uses, installed or operated in diverse
circumstances, made by numerous manufacturers. Standards and protocols are likely to emerge as the
best ways for different kinds of grid operators to manage these devices, and regional utilities, suppliers,
and innovators have an opportunity to shape and select these standards to make sure that they will
work for our region.
Electrification hosting capacity analysis on distribution circuits
As the M-SEM modeling shows, electrification will likely create new peaks on a system level. This level of
electrification could be expected in the winter starting in about 2025 on a regional level if the region is
on track to an 80x50 reduction. Pockets of electrification on the distribution grid, akin to the pockets of
distributed PV deployment seen today, are likely to develop even earlier. To our knowledge, regional
utilities have not yet begun to analyze and model the impacts of this electrification on the need for and
design of circuit hardware. Heating demand is highly correlated between customers, so clusters of heat
pumps could stress the “hosting capacity" of existing circuits to handle a winter peak, but electric
vehicle and water heating loads are flexible and could provide tools to mitigate some of that stress.
Pockets of electrification are also more likely to have PV and distributed storage. Detailed modeling of
the hosting capacity for electrification could indicate the penetration levels at which grid costs may
increase, while simultaneously illuminating ways to avoid or reduce those costs.
EPRI studied a comparable situation in partnership with Southern California Edison, studying a
neighborhood of new construction zero net energy homes (some of which had electric storage) at the
transformer level.113 These were homes with heat pumps for space heating and cooling and water
heating, as imagined here. However, heating demand makes the Northeast different enough from this
pilot that targeted analysis—in modeling or in real buildings—in our climate is warranted. The results of
such modeling would inform utility distribution planning for strategic electrification, clarify capital needs
and associated costs, and inform development of strategies to minimize long-term societal cost.
113 Grid Integration of Zero Net Energy Communities. EPRI, Palo Alto, CA: 2016. 3002009242.
Northeastern Regional Assessment of Strategic Electrification | 71
Power supply and transmission analysis
The amount and seasonal load shape of energy required on a strategic electrification pathway is quite
different from the loads of New York or New England today. Solar PV is the region’s fastest growing
renewable resource, although both onshore and offshore wind continue to grow and new connections
and imports from other regions (including Canada) are under discussion. Electrification as part of deep
decarbonization must be accompanied by near-removal of GHG emissions from the electric supply mix,
while shifting energy demand to the winter. To our knowledge, no one has yet modeled the region’s
electric sector in detail under such a scenario. The costs of different no- or low-carbon generation
technologies are difficult to predict, and wholesale market design is subject to change over time (and
may need to change to reflect a preponderance of zero-marginal-cost generators). Despite these
difficulties, such an analysis could be useful to indicate the scale of energy storage (for daily or seasonal
application), controllable or flexible loads, and dispatchable generation required under different
scenarios. Given the seasonal storage potential of large hydropower, such an analysis may best be
conducted for a region including the northeastern United States and the eastern Canadian provinces.
Northeastern Regional Assessment of Strategic Electrification | 72
Appendix A: Policy and Program Reference
This appendix revisits each of the five classes of policy or programmatic actions that are introduced in
Section 3. For each class, it presents a discussion of policy or program design options in buildings and in
transportation.
Targets and Mandates
Policy Discussion: Buildings
Utility Mandates. All northeastern states have traditionally used utility mandates to increase the share
of renewable electricity on the grid. In recent years, New Hampshire, Massachusetts, and Vermont have
promulgated regulations to integrate renewable heating and cooling technologies into their Renewable
Portfolio Standard (RPS), Alternative Portfolio Standard (APS), and Renewable Energy Standard,
respectively.114 However, these utility obligations typically do not specify thermal electrification as the
only compliance option.
As discussed in Section 0, GSHPs are an eligible technology within the New Hampshire RPS carve-out. In
Massachusetts, both ASHP and GSHP are eligible technologies in the APS. Vermont utilities are pursuing
electrification of heating and transportation as pathways to reducing customer fossil fuel use as
required by the Vermont RES. Policymakers in other northeastern states (e.g. New York) are also
exploring potential for integrating heat pumps and other renewable thermal technologies into their RPS
programs. Notably, expanding utility obligations to integrate heat pump technologies is also prompting
new requirements to meter and standardize the technology to ensure that production is guaranteed
(see Section 0).
Statewide Building and Energy Codes. Building codes and energy codes place obligations on building
developers and owners to meet certain levels of building energy performance. Northeastern states
update state building energy codes on a regular basis (i.e. to meet most recent IECC codes). However, to
date, there has not been little action focused on requiring—or strongly encouraging—use of heat pump
technologies to meet energy and carbon requirements.115
Voluntary “stretch” codes are also used in several northeastern states. These allow individual
municipalities or jurisdictions to require more stringent energy performance than the state. Local
policymakers could integrate heat pumps into their stretch code as an approved renewable energy
technology, as suggested by NEEP’s model stretch code guidelines.116 Some states like New York are also
exploring development of voluntary zero net energy (ZNE) building codes to encourage development of
high-performance buildings. ZNE likely means that new buildings will not be connected to the gas
114 Note, the RPS or APS is a mandate on utilities to procure a certain percentage of energy from renewable energy sources. These mandates are accompanied by incentives – in the form of renewable energy credit (RECs) or alternative energy credits (AECs) – which provide an incentive payment to generators for every MWh of energy produced.
115 Washington state provides one notable exception in their requirement for the largest zone of an electric resistance heated home to have a ductless minisplit. http://www.energy.wsu.edu/Documents/ga_2015WSEC_R_2ndP.pdf
116 http://www.neep.org/sites/default/files/resources/Model%20Residential%20Stretch%20Code.pdf

Northeastern Regional Assessment of Strategic Electrification | 73
distribution network. Discussions of how municipalities could achieve ZNE development are underway in
leading Northeast cities such as New York City, Boston, and Cambridge, often led by local non-profits
and government agencies.117 States are also beginning to take action and enter the conversation.
California, for example, has moved beyond voluntary codes and has established goals to achieve zero
net energy in all new construction in residential buildings (including multifamily) by 2020 and in
commercial buildings by 2030. Both these goals are supported through building code requirements and
standards.118 In pursuit of the former goal, the state has engaged a range of stakeholders to drive
voluntary action and broaden awareness among builders prior to full code enforcement. California is
also exploring potential for DER-ready codes.
Public Sector Targets and Mandates. Building-focused mandates and targets place obligations on public
agencies to achieve certain levels of building performance in existing or new buildings. These goals often
originate from executive orders or state legislations and require performance beyond typical standards
governing the building sector as a whole. Most states have “Leading by Example” programs that target
building energy use, GHG reduction, or renewable electricity consumption in publicly owned buildings
(see table below).119 A combination of building performance (e.g. EUI reduction), construction (e.g. ZNE
in new construction/major renovation), and energy and technology purchasing requirements (e.g.
renewable electricity purchasing requirements, heat pump requirements in retrofits) can help to drive
public buildings towards strategic electrification.
Table 12: Example building sector mandates and targets for state buildings
117 http://www.abettercity.org/docs-new/Net%20Zero%20Energy%20Event%20Recap%20May%202017.pdf; https://www.nyserda.ny.gov/net-zero
118 CPUC/CEC New Residential Zero Net Energy Action Plan 2015-2020 119 http://programs.dsireusa.org/system/program/detail/2390; http://www.mass.gov/anf/property-mgmt-and-
construction/facilities-mgmt-and-maintenance/energy-and-sustainability/leading-by-exmple-clean-engy-and-effic-bldgs-eo484.html; http://www.maine.gov/tools/whatsnew/index.php?topic=Gov_Executive_Orders&id=323510&v=article2011; http://www.gencourt.state.nh.us/rsa/html/XII/155-A/155-A-13.htm; http://www.governor.ny.gov/news/no-88-directing-state-agencies-and-authorities-improve-energy-efficiency-state-buildings; http://www.energy.ri.gov/leadbyexample/; http://bgs.vermont.gov/sites/bgs/files/files/energy-environment/2016-State-Agency-Energy-Plan.pdf

Northeastern Regional Assessment of Strategic Electrification | 74
State Mandate Summary of key requirements
CT 2011: Public Act No.11-80 Energy reduction targets in state facilities
MA 2007: Executive Order 484 (“Leading by Example: Clean Energy and Efficient Buildings”)
Reductions in GHG, energy use intensity, and water usage; increases in renewable energy procurement; MassLEED Plus requirement for new construction and major renovation
ME 2011: Executive Order 27 (“An Order Regarding the Use of Green Building Standards in State Buildings’)
Construction or renovation of state buildings must incorporate green building standards aimed at energy efficiency and environmental sustainability.
NH 2010: SB 409 (DES “act requiring buildings or structures constructed or renovated using state funding to adhere to certain energy efficiency and building standards”)
New and remodeled state-owned buildings or constructed using state funding must meet energy and sustainable design standards. Also considering EV mandate.
NY 2012: Executive Order 88 (“Directing State Agencies and Authorities to Improve the Energy Efficiency of State Buildings”, aka BuildSmart NY)
Reduction in EUI; benchmarking, auditing, and submetering requirements for buildings of certain sizes
RI 2015: Executive Order 15-17 (“State Agencies to Lead by Example in Energy Efficiency and Clean Energy”)
Reduction in total energy consumption; 100 percent renewable electricity consumption in state buildings by 2025;
VT 2016: Title 3 V.S.A. 2291 (mandates State Agency Energy Plan)
Reduce building energy use by 15 percent
Policy Discussion: Transportation
Electric vehicle and Electric Vehicle Supply Equipment (EVSE) targets and mandates have been widely
applied in the Northeast to overcome economic, social, institutional, and infrastructure barriers to
deployment. Most of the mandates to date have revolved around vehicle purchases, but there are also a
few examples of mandates in the form of EV-ready provisions in building codes (e.g. Vermont’s State
Building Code and Stretch Code)120 and mandates for the installation of charging infrastructure.
Vehicle Purchase Mandates and Targets. Mandates have historically been applied to private sector
vehicle purchases (e.g. CAFE standards) as well as public sector fleets. However, these mandates haven’t
typically specified electrification as the only compliance option. The federal government in particular has
a long history of mandates with the goal of cleaner transportation in government fleets (e.g. the
Alternative Motor Fuels Act of 1988, the Clean Air Act Amendments, EPAct 1992 and 2005, EO 13423,
120 https://www.zevstates.us/vermont-ev-readiness-building-codes/
Northeastern Regional Assessment of Strategic Electrification | 75
EISA 2007, and more).121 States have also taken the lead in imposing stricter air quality standards for
vehicles, led by California and the states that have adopted California’s stricter standards (the “Section
177 States”).122 Six of the seven Northeast states are Section 177 states.
More recently the conversation has turned from clean vehicles generally to mandates and targets that
support the electrification of vehicles. The primary example is the 2013 agreement between the
governors of eight states to commit to coordinated action to implement zero-emission vehicle
programs. Five of the eight signatory states are in the Northeast region (New York, Connecticut, Rhode
Island, Massachusetts, and Vermont, California, Maryland, and Oregon). A collective target has been set
to deploy 3.3 million ZEVs across these states by 2025 and to develop a “fueling infrastructure that will
adequately support this number of vehicles.” To support this goal, each state has agreed to set purchase
targets for its own governmental and quasi-governmental fleets.
EV-Ready Mandates in Building Codes and Local Ordinances. Proactive actions by state code officials
and local jurisdictions can help with the deployment of strategically located charging stations. These EV-
ready actions can refer to any actions that make it easier and less expensive to later install any type of
EV charging, level 1 through DC-fast charging. This entails requiring that a certain percentage of parking
associated with new development is pre-wired for charging stations to reduce the cost of EVSE
deployment. Conduit will already be installed on these lots, thus limiting the need for cutting into
asphalt or concrete for additional wiring.123
In the Northeast, Vermont has set variable thresholds for the number of EV-ready parking spaces
required for large-scale residential and commercial developments.124 For example, multifamily housing
with more than 10 units is required to make 4 percent of parking spaces EV-ready.
In California, the City of Freemont and the City of Oakland have each passed “EV Ready” ordinances.125
San Francisco has introduced legislation to require new residential and commercial buildings to have 10
percent of spaces be “turnkey ready” for charger installation, 10 percent more to be “EV flexible” (ready
for charging, pending some upgrades), and the remaining 80 percent will at least have conduit run to
them.126
EVSE Installation Mandates. A draft EU regulation has suggested that all apartment buildings and any
new or renovated home may be required to install an electric car charger by 2019.127 By applying this
121 https://energy.gov/sites/prod/files/2017/01/f34/fs_fleet_mandate_timeline.pdf 122 For more about the process by which California is authorized to obtain waivers and set its own standards and how Section
177 allows other states to adopt California standards, see the EPA’s resource here: https://www.epa.gov/state-and-local-transportation/vehicle-emissions-california-waivers-and-authorizations
123http://www.transportationandclimate.org/sites/default/files/EV-Ready_Codes_for_the_Built_Environment_0.pdf 124
http://publicservice.vermont.gov/sites/dps/files/documents/Energy_Efficiency/code_update/2015%20CBES%20Proposed%20Stretch_2015-2-3.pdf
125 http://www.codepublishing.com/CA/Fremont/html/Fremont15/Fremont1548.html; http://www2.oaklandnet.com/oakca1/groups/pwa/documents/report/oak063669.pdf
126 http://insideevs.com/san-francisco-ev-parking-rules/ 127http://e360.yale.edu/digest/european_union_require_new_homes_electric_car_charging_stations

Northeastern Regional Assessment of Strategic Electrification | 76
regulation to new homes and renovations, this draft mandate partially avoids the higher costs
associated with retroactively installing EVSE in a building that was not originally built EV-ready. This
mandate will be a helpful step in realizing the goals of EU countries to phase out diesel and ICE vehicles,
but insufficient to produce the rapid deployment of EVSE given that it does not apply to existing
buildings other than apartments.
Table 13: Example transportation mandates and targets for state vehicle fleets
State Mandate Summary of key requirements
MA Chapter 169, Section 1 of “An Act Relative to Green Communities”
Goal of 50 percent of vehicles owned and operated by the Commonwealth to be alternative fuel vehicles or hybrids
RI 2015: Executive Order 15-17 (“State Agencies to Lead by Example in Energy Efficiency and Clean Energy”)
Achieve least 25 percent ZEVs for light-duty fleet purchases by 2025
VT 2016: Title 3 V.S.A. 2291 (mandates State Agency Energy Plan)
Increase electric powered fleet miles to reduce gasoline use by 1/3 by 2032.
Pricing-Based Policies
Policy Discussion: Buildings
As discussed in Section 0, heat pumps have high upfront costs in comparison to traditional fossil-fuel
based thermal systems. When combined with low fossil fuel prices (e.g. natural gas), it is challenging to
achieve cost-effectiveness on a life cycle cost basis. Moreover, because heat pumps are capital
intensive, they are often considered out of reach by many customers, especially in the residential sector,
where end-users may lack access to financing (see Section 0). While these challenges are pertinent to all
heat pump technologies, they are particularly acute for ground source heat pump installations, which
can cost more than $40,000 for a residential installation.
To address these market challenges, policymakers can consider the following pricing policies.
Rebates and Other Upfront Incentives for Heat Pumps. As detailed in NEEP’s Northeast/Mid-Atlantic
Air-Source Heat Pump Market Strategies 2016 Update, rebates are available for ductless and ducted
ASHPs in the residential sector in nearly every Northeastern state.128 The past few years have seen
substantial growth in deployment across states with more robust programs (e.g. Efficiency Maine,
Massachusetts Clean Heating & Cooling Program), for both ASHPs and HPWHs.129 GSHPs receive rebates
128 http://www.neep.org/sites/default/files/NEEP_ASHP_2016MTStrategy_Report_FINAL.pdf pg. 42-44 129 Massachusetts Clean Energy Center. (2016, August). Air-Source Heat Pump Program – Residential Projects. Available online
at http://files.masscec.com/get-clean-energy/residential/air-source-heat-pumps/ResidentialASHPProjectDatabase2016.xlsx; Efficiency Maine. (2016). FY2016 Annual Report. Available online at http://www.efficiencymaine.com/docs/FY2016-Annual-Report.pdf; Merson, H. (2017, June). Moving ASHP Market through Novel Program Interventions. Presented at the NEEP 2017 Regional Cold Climate Air Source Heat Pump Market Transformation Workshop. Available online at:

Northeastern Regional Assessment of Strategic Electrification | 77
in fewer states, and such rebates tend to offset a smaller percentage of installed costs. GSHPs were also,
until the end of 2016, able to receive the 30 percent federal investment tax credit, which has been
eliminated in the residential sector and reduced to 10 percent in the commercial sector.
Rebates for heat pumps are most commonly available in the residential sector with more limited
program offerings in the commercial and industrial sectors. Some states like Massachusetts have begun
expanding these rebates to include the commercial sector.130 Additionally, utility rebates have
predominately been driven by the energy and peak load reduction benefits offered by heat pumps (e.g.
cooling efficiency for heat pumps, replacement of electric resistance water heaters by more efficient
HPWHs). Rebates that emphasize heating benefits and are driven by emissions reduction have been
slower to emerge—and may be challenging to justify under existing rate design as discussed in
Section 0.
While growth of ASHP markets continues to increase, it is unclear if rebate programs in their current
form can support the rate of deployment necessary to achieve long-term climate goals. Most rebate
programs today incentivize deployment of one or two single-head systems, which offset only a portion
(e.g. less than 60 percent) of the heating load. Additionally, many ASHP systems installed to date serve
only air conditioning loads. Others lack the controls needed to harmonize ASHP production with existing
heating systems.131 Looking ahead, it will be important for policymakers to explore the potential for
adjusting incentive programs (including financing and TPO models) to increase deployment of whole-
home GSHP systems, encourage end-users to install whole-home ASHP solutions including ducted ASHPs
(i.e. offsetting 90 percent or more of the heating load), and/or ensure ASHP systems are installed with
the proper controls and optimize heat pump production with backup (typically combustion-based)
heating systems.132
Performance-based incentives for heat pumps. As discussed above, upfront incentives like rebates have
historically supported heat pump market growth. In the future, it may become increasingly important to
implement performance-based incentives schemes that provide incentives based on the thermal energy
produced, especially as policymakers place a higher priority on ensuring that energy production is
maximized. Performance-based incentives provide customers with guaranteed payments over a fixed
http://www.neep.org/sites/default/files/NEEPccASHPWorkshop062717VEICHMersonFINAL.pdf; Energy Efficiency Board. (2016, March). 2015 Programs and Operations Report. Prepared for the Connecticut General Assembly. Available online at https://www.energizect.com/sites/default/files/Final-ALR-2015-Full-030316.pdf
130 Massachusetts Clean Energy Center. (2017, May). Commercial-Scale Air-Source Heat Pump Program: Program Manual. Available online at http://files.masscec.com/ASHPProgramManualCommercialScale.pdf; Efficiency Maine. (2017). Ductless Heat Pumps for Businesses. Retrieved from http://www.efficiencymaine.com/at-work/commercial-heat-pump-program/.
131 Korn, D., et. al. (2016). Ductless Mini-Split Heat Pump Impact Evaluation. Prepared for the Electric and Gas Program
Administrators of Massachusetts and Rhode Island. Available online at: http://ma-eeac.org/wordpress/wp-content/uploads/Ductless-Mini-Split-Heat-Pump-Impact-Evaluation.pdf; Northeast Energy Efficiency Partnerships. (2017). Northeast/Mid-Atlantic Air-Source Heat Pump Market Strategies Report 2016 Update. Available online at: http://www.neep.org/sites/default/files/NEEP_ASHP_2016MTStrategy_Report_FINAL.pdf
132 On this last point, Maine is currently running a pilot program to assess impacts of integrating thermostat controls into heat pump systems, which are expected to improve operational performance of heat pumps with back up (fossil fuel) heating systems.

Northeastern Regional Assessment of Strategic Electrification | 78
period of time, which can be more bankable than uncertain renewable energy certificate (REC) prices
and energy savings.133
Performance-based incentives do not yet exist for building thermal technologies in the United States,
though performance-based incentives for solar PV have become increasingly common (e.g. California
Solar Incentive, Rhode Island RE Growth Program) and energy efficiency (e.g. NJ Clean Energy Program
Pay for Performance incentive program). They are the preferred mechanism for supporting renewables
deployment in European countries. United Kingdom’s Renewable Heat Incentive has been successful in
supporting deployment of nearly 25,000 new residential installations (since mid-2014) and over 5,000
non-residential installations (since 2011) of renewable thermal technologies.
Portfolio standard integration. State policymakers have been actively exploring the integration of
renewable heating and cooling technologies into state electric renewable portfolio standards. In such
programs, investor-owned utilities are required to support the deployment of RH&C systems through
obligations to purchase RH&C attributes (“T-RECs”). The approach pursued thus far has primarily been
to establish carve-outs in existing portfolio standards, though separate compliance mechanisms could
be created.
New Hampshire and Massachusetts have already taken initial steps in this direction. In New Hampshire,
policymakers created the first thermal RPS carve-out (see Section 0), which provides a renewable energy
credit (i.e. a performance-based incentive) worth approximately $25 per MWh-thermal of energy
produced by geothermal heat pumps (and by other renewable thermal technologies).134 In addition,
Massachusetts is currently promulgating regulations to integrate RH&C technologies—including ASHPs
and GSHPs—into the Alternative Portfolio Standard.
A key challenge for New Hampshire, Massachusetts, and other states considering performance-based
incentives for RH&C systems is how to meter, monitor, and track energy production. These issues are
discussed in greater detail in Section 0.
Efficient Electric Heating Rate Structures. Policymakers and industry advocates note that special electric
rates could incentivize heat pump deployment in the Northeast. NYSERDA, for example, notes that
revised rate design has “potential to transform” the market, if rates were updated to reflect the grid and
carbon value of heat pumps.135 Similarly, advocates argue that the geothermal heat pumps significantly
improve grid utilization and provide summer peak shaving benefits to the New York grid. Accordingly,
advocates argue that special geothermal rates should be established to reflect the benefits that GSHPs
offer the grid.136
133 NYSERDA (2017) RH&C Policy Framework 134 Other eligible renewable thermal technologies include solar water heat, solar space heat, biomass heat, and biodiesel. In
2017, the alternative compliance payment is set at $25.46 per MWh for the Class I Thermal carve-out. 135 NYSERDA (2017) RH&C Policy Framework. 136 New York Geothermal Organization (NY-GEO). (2017). What Value Does Geothermal Heating Bring to the Clean Energy
Standard? Presented at the Geothermal Technical Conference, New York Department of Public Service. Retrieved from http://www3.dps.ny.gov/W/PSCWeb.nsf/All/56C58A580D2CF2E185257FD4006B90CE?OpenDocument.

Northeastern Regional Assessment of Strategic Electrification | 79
To date, however, there are no known electric rate structures that have been designed in the Northeast
to incentivize heat pump deployment. As discussed in Section 0, several barriers currently inhibit this
practice. For example, under current regulations, most utilities are not permitted to encourage fuel
switching (i.e. from oil to electric).137 Thus, providing special electric rates to encourage end-users to
transition from oil heat to GSHPs or ASHPs (i.e. electric heating) would violate existing regulations. It is
also worth noting that additional near- and long-term analyses should be conducted to evaluate the grid
impacts of a large-scale transition to heat pump technologies. In the near term, for example, seasonal
rates for heat pumps could help to reduce grid operating costs, but over the long term, as summer and
winter peaks shift, the rate structure will likely need to transition to real-time pricing to provide an
ongoing value to the grid.
Nonetheless, several utilities across the United States have developed special electric heating rates that
specifically target ASHPs and GSHPs. As described in the box below, Great Lakes Energy Cooperative
offers an Efficient Electric Heat rate to homeowners whose primary heating system is a high efficiency
GSHP or ASHP. It is anticipated that states and utilities across the Northeast will explore potential for
special rates for high efficiency, low carbon electric heating technologies in the future.
It is also anticipated that electrification of heating loads, whether ASHP, GSHP, or HPWH, will lead to
additional opportunities to provide value to the grid via demand response (DR). Particularly since there
is thermal mass in buildings and since water heating systems with tanks have a reservoir of stored heat,
electric heating loads have significant potential for long duration DR as well as short-term and very
short-term DR. These can provide valuable ancillary services to the grid such as ramping and frequency
regulation, which also enable large-scale integration of renewables onto the grid.138 The value that DR
can provide can be compensated if DR programs are developed more broadly and heat pump customers
are enrolled.
Policy Discussion: Transportation
Electric vehicles typically have higher upfront costs than comparable conventional ICE vehicles across all
vehicle size classes. These higher costs result from the fact that there are limited economies of scale
relative to more established ICE vehicles and from the fact that battery costs currently outweigh the
savings received from the ICE components not included in battery electric vehicles. Until this changes,
electric vehicle purchasers will need to justify the higher upfront cost with savings that may accrue over
time depending on the volatility of gasoline prices.
Fleet purchasers and citizen purchasers alike struggle to justify electric vehicle procurement unless the
vehicle is to be driven many miles per year. While fleet managers may perform total cost of ownership
studies to guide their decisions, citizens rarely do so. In addition to upfront cost, residents are more
likely to weigh a myriad of other factors such as using a familiar technology, purchasing a car that fits
137 It is worth noting that policymakers in the Northeast have expressed interest in encouraging fuel-switching, specifically from oil to gas. To date, however, Connecticut is the only state that has made it official state policy. See http://www.synapse-energy.com/sites/default/files/New-Englands-Shrinking-Need-for-Natural-Gas-16-109.pdf
138 http://labhomes.pnnl.gov/documents/PNNL_23527_Eval_Demand_Response_Performance_Electric_Water_Heaters.pdf

Northeastern Regional Assessment of Strategic Electrification | 80
their image, seeking specific attributes of vehicles, brand loyalty, and many other factors. Furthermore,
the challenge of justifying a higher upfront expenditure can be particularly difficult for low- and
moderate-income consumers.
Nonetheless, particularly for cost-conscious consumers, policies that reduce the upfront investment
required can either generate an attractive return on investment or generate a compelling case that
dominates other non-monetary factors.
As discussed above, policymakers can influence cost-effectiveness through incentives, electric rate
structures, pricing of externalities of conventional fuels (e.g. gas taxes and carbon pricing), or market
efforts to bring down the upfront costs of electric vehicles. The most common approaches have been
rebates and tax credits.
Tax credits. Tax credits can either be applied to income tax or sales tax and can be implemented at the federal level or the state level. While income tax credits are powerful drivers of adoption of electric vehicles,139 these credits have two limitations: (1) they are delayed from time of sale, and (2) for low-income consumers it may take multiple years before the full value of the tax credit is fully monetized if their annual tax burden is lower than the value of the credit.
Rebates and grants. Rebates function in a similar way to reduce the upfront cost of EV purchases, except that they are available independent of tax filings, and they are generally available to vehicle purchasers immediately after filing paperwork. Rebates are often structured such that the value is proportional to the size of the battery and/or the range of the vehicle. Rebate programs in the Northeast include: Connecticut’s CHEAPR program, Massachusetts’s MOR-EV program, Vermont’s Drive Electric Vermont, Rhode Island’s DRIVE rebate, and New York’s Drive Clean program. Generally speaking, grants have been applied more commonly to EVSE, as with the programs in Massachusetts (EVIP) and New Hampshire.
To support low-income populations, Massachusetts’ Department of Energy Resources and Zero
Emissions Vehicle Commission have encouraged policymakers to consider the interests of low-
to moderate-income residents in eligibility criteria and rebate value in the case of electric
vehicle rebates.140 In California, income caps have been integrated into EV rebate eligibility and
rebate levels are increased for low- and moderate-income consumers.141
Rate structures. Accessing low cost electricity is a good way to reduce the total cost of ownership of electric vehicles and to enhance their return on investment. Off-peak electricity costs are often significantly cheaper than other times, and electric customers with access to time of use (TOU) rates can tap into these lower costs typically by charging their vehicles at night. TOU rates are more common for business customers,
139 Georgia experienced significant deployment of EVs when its income tax credit was in place. Subsequent to the tax credit’s repeal, sales plummeted: http://epd.georgia.gov/air/alternative-fuels-and-tax-credits; http://www.utilitydive.com/news/georgia-electric-vehicle-sales-shrink-80-in-wake-of-tax-credit-repeal/434092/
140 http://www.mass.gov/eea/docs/doer/aacee-report.pdf 141 https://cleanvehiclerebate.org/eng/income-eligibility

Northeastern Regional Assessment of Strategic Electrification | 81
but some utilities have been implementing TOU rates to allow electric vehicle owners to opt into a different rate structure. In New Hampshire, Liberty Utilities provides a TOU rate for residential customers. Con Edison in New York also offers a voluntary TOU rate for both residential and business customers with on- and off-peak rates that vary by time of year. All Vermont utilities that have advanced metering infrastructure also offer some sort of TOU rate for residential customers.
Gas taxes. Gas taxes can serve a dual purpose of generating state and federal revenue while also providing a mechanism to price the externalities associated with criteria air pollutants, adverse public health impacts, road maintenance costs, congestion, and GHG pollution. These taxes have often been set too low to fully account for these externalities. However, increasing a state gas tax requires significant political will to implement. Gas taxes are often not indexed to inflation and have therefore had diminishing effects over time, along with a diminishing ability to provide funding for states. Massachusetts recently failed to index its own gas tax to inflation.
As CAFE standards increase and as the transportation sector is electrified, states anticipate
shrinking gas tax receipts. Some states have experimented with alternative revenue collection
mechanisms such as Oregon’s Vehicle-Miles-Traveled (VMT) fee applied to the distance driven,
though no state has yet implemented a full replacement to the gas tax. Policy mechanisms that
are alternatives to the gas tax may change the pricing of externalities and provide different
outcomes. For instance, a VMT fee reduces consumers’ motivations to use fuel efficient cars and
drive efficiently, but increases their motivation to reduce miles driven (and thus could reduce
congestion costs and road maintenance costs).
The other primary mechanisms for pricing externalities into fuel consumption include cap and
trade systems and carbon taxes. Notably, in 2015, California added transportation fuels to the
sectors regulated by the California Cap and Trade Program by requiring fuel suppliers to reduce
their emissions or purchase pollution permits.142 Discussions and proposals on carbon taxes
have taken place at the federal and state level. Legislatures in five states have proposed either
carbon fees or taxes, four of which are in the Northeast (Massachusetts, Rhode Island,
Connecticut, Vermont and Washington).143
Miscellaneous incentives. Beyond the above incentives, several other strategies have been applied to make electric vehicles more financially appealing. States offer discounted and/or free electric vehicle registrations. Some cities offer free parking at parking meters (e.g. New Haven). In some cases, ZEVs are eligible for discounted tolls (New York), or made eligible to use HOV/HOT lanes for free.144
As with any pricing-based policy to influence consumer decisions, policymakers should consider the
salience of the fee, tax, or incentive to set their expectations for its effectiveness. Highly salient perks
142 https://www.arb.ca.gov/cc/capandtrade/guidance/facts_fuels_under_the_cap.pdf 143 https://www.washingtonpost.com/news/energy-environment/wp/2017/05/12/defying-trump-these-state-leaders-are-
trying-to-impose-their-own-carbon-taxes/ 144 Each of these incentives is described in Plug-in America’s policy map: https://pluginamerica.org/why-go-plug-in/state-
federal-incentives/?location=me

Northeastern Regional Assessment of Strategic Electrification | 82
like free parking may motivate potential EV owners more than the financial value would predict since
parking can be a stressful experience for drivers in congested and crowded cities. Likewise, increased
registration fees, while small relative to the total cost of car ownership, could have higher effect
dissuading sales than predicted. There is an extensive literature on the salience of various types of
payments that is beyond the scope of this report to explore.
Facilitating Emerging Financing and Business Models
Policy Discussion: Buildings
Only a few TPO models for RH&C technologies like heat pumps have been deployed in the United States.
These include a pilot residential ASHP leasing program implemented by Green Mountain Power as well
as thermal TPO contracts for GSHP offered by private sector developers like Aztech Geo. There are a
handful of other organizations assessing opportunities to develop thermal power purchase agreements
or leases for heat pumps across the region, including the Renewable Thermal Alliance, the Connecticut
Green Bank, and NYSERDA.
Scaling up TPO business models will likely require increased support from policymakers. Below, we
describe key opportunities for policymakers to facilitate market development.
Stable and reliable incentives and/or cost reductions. Fostering development of TPO financing requires supportive policies and incentives. Notably, while TPO models offer end-users several benefits (described earlier), it also usually increases lifecycle costs to the end-user. This is because investors must recoup costs associated with program administration and also achieve their own return on investment. Accordingly, markets where TPO models have been successfully deployed for heat pumps or other RH&C technologies typically have robust incentives and other supporting policies to offset development costs. For example, California, Hawaii, Maryland, North Carolina, and Washington DC are all jurisdictions that provide incentives to spur TPO for residential and commercial solar water heating.145 Similarly, the Green Mountain Power heat pump leasing program benefits from supportive public policies, including a supportive regulatory structure and Efficiency Vermont rebates. Over time, TPO models may be able to achieve economies of scale that reduce costs and enable the market to exist without incentives; however, financial incentives will likely be necessary in coming years to help launch the TPO market.
Development of reliable metering and verification protocols. The heat pump and RH&C industry has not established standardized metering, measurement, and verification protocols. Measurement and verification is important to ensure that systems can reliably provide thermal energy to end-users and will be critical to reducing performance risk and increasing investor confidence. Notably, standardized metering and verification protocols will be particularly important to enable development of TPO structures, which provide cash flows to investors based on payments from customers
145 U.S. EPA, 2012 and http://iea-retd.org/wp-content/uploads/2015/02/RES-H-NEXT.pdf
Northeastern Regional Assessment of Strategic Electrification | 83
for metered heating and cooling.146 Currently, ASTM is developing a U.S. Heat Metering Standard for solar, geothermal and other alternative energy sources. Similarly, the Renewable Thermal Alliance (RTA) is conducting ongoing research on heat metering protocols in an effort to jumpstart development of the TPO financing market.147
Standardization of contracts and aggregation of financial assets. Industry lacks standardized TPO contracts and financing requirements for heat pumps, making it time-consuming and expensive for investors to perform due diligence. This lack of familiarity with TPO deals for heat pumps—combined with lack of standardization and performance data—translates to a higher perception of risk among investors and thus a high cost of capital. By facilitating a process to standardize contracts, policymakers can foster development of common terms and features across the variety of contractual relationships necessary to finance RH&C projects. In addition, an initiative focused on standardizing, and ultimately aggregating, heat pump financial assets could be deployed in tandem with credit enhancement programs from state green banks. Over time, it is anticipated that initiatives to standardize contracts will educate investors on the investment potential for heat pumps, reduce financing costs, increase the availability of capital, and stimulate the market. 148
Explore potential for utility ownership of heat pump assets. Most states in the Northeast have been restructured, meaning that utilities are prohibited from owning generation assets (except in very limited circumstances), including heat pumps. However, there is potential for regulators to permit utilities to own, manage, and ratebase heat pump assets as part of an overall electrification strategy. Enabling utilities to ratebase RH&C assets, especially GSHPs, could afford significant benefits to states seeking to scale up the heat pump market. Utilities have access to low-cost capital and deep experience owning and managing energy infrastructure. Utilities also have strong existing relationships with customers and could drive robust to marketing, outreach, and customer education programs. Thus, enabling utilities to ratebase heat pump assets could bring in significant capital and development resources to the heat pump market.
On the other hand, utilities also benefit from a regulated distribution monopoly. If regulators were to
permit utilities to ratebase heat pumps, it could inhibit development of a diverse and competitive
marketplace, inhibiting other players from effectively competing—or even entering—the marketplace.
Nonetheless, there is significant opportunity for regulators, policymakers, and industry leaders to assess
the benefits and drawbacks associated with utility ownership of heat pumps and other RH&C assets.
146 NYSERDA (2017) RH&C Policy Framework. 147 See https://www.astm.org/COMMITTEE/E44.htm and http://cbey.yale.edu/programs-research/renewable-thermal-alliance 148 Notably, the process of standardizing contracts has long been used in the finance industry, from futures contracts to
mortgage loans. It has recently been applied to renewable energy markets in the U.S., such as solar. Standardization would also enable future aggregation of projects into a pool of finance assets that could be financed or refinanced at a lower cost of finance than individual projects. For more, see New York RH&C Policy Framework (https://www.nyserda.ny.gov/Researchers-and-Policymakers/Renewable-Heating-and-Cooling)
Northeastern Regional Assessment of Strategic Electrification | 84
Policy Discussion: Transportation
Financing Electric Vehicles
Compared to the challenge of financing heat pumps, the barrier of financing in the transportation sector
is low, particularly for private consumers. This is because car dealers already provide low-cost financing
for many vehicle purchasers and these financing arrangements are used by purchasers of conventional
and electric vehicles, alike. However, financing presents challenges in specific situations:
Access to affordable financing for low-income consumers and consumers with limited credit scores remains a challenge, particularly coupled with the higher upfront cost of EVs relative to conventional vehicles.
Public fleets may also have trouble taking advantage of lease financing because of local and state procurement rules. Commitment of funds is often done on an annual basis for the outright purchases of fleet vehicles. For certain jurisdictions, the commitment of funds to support continued multi-year lease payments may require additional authorization. Access to leasing arrangements is particularly important for municipal fleets because as tax-exempt entities, they cannot monetize the federal tax credit to bring down the cost of procuring ZEVs or PHEVs.
Charging stations must fit within the overall net present value analysis of procuring EVs. Many EV
purchasers will want to install charging at home. Level 1 charging can be installed quite cost-effectively,
and may meet many EV owners’ needs, but higher rates of charging will necessitate greater upfront
investments. Lease financing is available for EVSE.
Emerging business models—Mobility-as-a-Service and Shared Mobility
As described above, the private sector is rapidly innovating in the mobility space, resulting in a
comprehensive set of new mobility options, particularly for residents of urban and suburban areas.
Policymakers must carefully consider how to regulate these new technologies to facilitate their benefits
and control the costs they impose on society. The conversation about regulation of new mobility options
goes far beyond the question of energy and emissions, and questions about topics such as safety,
liability, data privacy, and the impact on urban economies are all currently being discussed by a broad
spectrum of regulators and policymakers.
A discussion of these regulatory questions is outside the scope of this report. However, energy
regulators should engage with policymakers grappling with these other questions at a local level as local
battles regarding the fate of autonomous vehicles, on-demand transit, and other shared mobility
solutions will have profound implications for the rate and scale of electrification of transport in the
region.
Most importantly, policymakers should note that shared mobility coupled with sophisticated
optimization can greatly spur the electrification of transportation. Shared mobility provides a way to
justify the higher upfront cost of EVs through increased mileage loads on a smaller vehicle stock. To the
Northeastern Regional Assessment of Strategic Electrification | 85
extent that each vehicle in a shared mobility network is driven more miles, the return on investment will
make sense in a larger number of applications.
However, the challenge of shared mobility and electrification is that transportation network companies
(TNCs) and other offerors of transportation services that use EVs will need to carefully manage the state
of charge of their vehicles and be able to dispatch vehicles with states of charge that will meet the
demands of the next trip. This will require a recharging scheme that reduces the need for deadhead
miles and that reduces downtime of vehicle assets, both of which will add to the cost of shared mobility.
Policymaker actions will influence the ability of TNCs to implement sufficient charging plans.
Policymakers must decide important questions that will determine the growth and success of electric
shared mobility. Whether EV charging stations must be open to the public if they are to receive rebates,
how and where these stations can be permitted, and how utilities should be allowed or encouraged to
participate in the creation of these networks are just a start to the number of important questions
policymakers must address.
Policies must help shared mobility to meet travel needs at a cost lower than conventional car ownership
and with a level of service equivalent to conventional car ownership. If not, the opportunity to electrify
transportation may be slowed or limited, since the financial case for electrification is bolstered by the
increased utilization per vehicle characteristic of the shared mobility model.
Policymakers preparing for the long-term facilitation of business models conducive to electrification
should closely follow current collaborations and conflicts between TNCs and cities. As noted above,
shared mobility can be conducive to electrification and to highly efficient vehicles generally, but it is far
from obvious that shared mobility fleets will electrify in the absence of policy pressure.
There are preliminary indications that shared mobility companies are exploring electrification. In
particular, there have been several attempted pilot projects related to leasing EVs to TNC drivers. The
recent attempted deployment of leased EVs by Lyft in California underscores the importance of
coordination between environmental policymakers and business regulators, as limitations on the way
vehicles must be owned prevented that pilot from succeeding.149 Another pilot project in Portland, OR
promises to deploy electric vehicles to Uber drivers through Uber’s Xchange Leasing program, although
some parties have concerns about the specific lease deal being offered.150 In London, Uber is also
investigating the potential to build out its own EVSE infrastructure for its drivers, opening the possibility
for new business models that could expand electrification of the TNCs, albeit business models that will
require significant attention by policymakers.
More generally, regulations around the usage and testing of autonomous vehicles may impact the future
of electrification in unpredictable ways. Speculating on possible outcomes is beyond the scope of this
report, but to the extent that autonomous vehicles could bring down the cost of using MaaS offerings by
149 http://fortune.com/2016/04/20/california-uber-lyft-rental-limits/ 150https://www.citylab.com/transportation/2017/04/uber-electric-vehicles-leasing-program-portland-oregon/522759/
Northeastern Regional Assessment of Strategic Electrification | 86
obviating the need for a driver in the long term, shared mobility could gain market share from
conventional vehicle ownership.
New business models associated with new technologies and software have enormous potential to shift
personal mobility paradigms in the coming decades. Policymakers will need to closely monitor
developments and coordinate across policy disciplines to ensure that these paradigm shifts fully
contribute to beneficial transportation electrification.
Quality Assurance and Evaluation, Measurement, and Verification
Policy Discussion: Buildings
EM&V
Utilities are mandated to perform EM&V through their utility efficiency programs, and the main area of
interest is whether heat pumps are meeting their promised efficiencies in real world operation. Despite
the efforts utilities have begun to invest in EM&V, metering of heat pumps remains challenging to
policymakers due to lack of standardization and high cost of metering in residential systems. New
Hampshire and Massachusetts are leading efforts to monitor heat pump performance because of their
needs to measure the contribution of these devices to their RPS and APS programs.
Field studies have often found that heat pump systems perform at lower efficiencies than claimed,
delivering fewer energy savings and GHG reductions than expected. The largest field study of cold
climate ASHPs in New England homes to date was completed on behalf of utility program administrators
in Massachusetts and Rhode Island at the end of 2016.
Additionally, the Minnesota Department of Commerce released the largest recent field study of GSHP
systems in cold climate regions in November 2016, which suggested that while GSHP systems are
operating at approximately expected efficiencies (generally in line with the Energize CT GSHP Impact
Evaluation study from 2014, which found heating COPs of 3.22 in monitored sites),151 there is a wide
spread in heating and cooling performance that suggests a sizeable number of homeowners have poorly
installed systems that do not provide expected savings.152
While these studies provide significant new findings for policymakers, utilities, and other stakeholders to
assess, they also highlight the need for more in-depth and timely evaluation of heat pump performance
as improved practices are adopted. Improved metering standards will also be necessary to drive TPO
models and greater portfolio standard integration, as described in Section 0.
151https://www.energizect.com/sites/default/files/CT%20GSHP%20Impact%20Eval%20and%20Market%20Assessment%20%28R7%29%20-%20final%20report.pdf
152 https://www.cards.commerce.state.mn.us/CARDS/security/search.do?method=showPoup&documentId=%7b6469EDF0-FD81-42FE-8CA5-1CB4D2F5D30C%7d&documentTitle=364807&documentType=6

Northeastern Regional Assessment of Strategic Electrification | 87
Quality Assurance
Policymakers should be keenly interested in quality assurance programs because the ASHP market is still
young in the Northeast and consumers are forming their first impressions of the technology. The biggest
policy action in this area is the development of technology and installer certification schemes. These
certifications can drive improvements in technologies (e.g. NEEP cold climate ASHP standard)153 and in
installation quality. Notably while industry and third-party certifications exist (e.g. IGSHPA, NATE), they
have typically not been used as requirements for state and utility incentive programs. For ASHP,
manufacturers have filled in the gap, though trainings have focused on installation and servicing rather
than integration with existing heating systems.
State licensing and/or harmonized regional standards that build on these voluntary certification
schemes could help improve installation quality across the region.
Policy Discussion: Transportation
While utility EM&V programs do not apply to the electrification of transportation, quality assurance can
still play a large role in building consumer confidence. Claims made by EV manufacturers about their
efficiency and their range are important because consumers need to feel confident that they are buying
a car that meets their driving needs without necessitating long recharging delays. Quality assurance is
mainly done at the federal level, as with all vehicles.
For light-duty vehicles, quality assurance programs include:
EPA ratings of fuel economy via laboratory testing of various drive cycles (city, highway, high speed, cold temperature, and air conditioning). EPA testing criteria for electric vehicles are slightly modified from the criteria for conventional vehicles.154
Studies of the real-world range of EVs. In particular, the federal government has performed studies of the impact of extreme cold or heat on the range of EVs. Batteries do not perform as well at cold temperatures and total energy demand is greatly increased to maintain a comfortable cabin temperature for vehicle occupants.
Safety. EVs must meet the Federal Motor Vehicle Safety Standards, with the same safety testing as conventional vehicles. NFPA has also developed guidelines and training for emergency responders and EV technicians.155
For medium- and heavy-duty vehicles, quality assurance is done differently, but also at the federal level.
The main consideration here is that it is imperative that vehicles that have been upfitted with hybrid
153 NEEP has managed the development of the Cold Climate Air-Source Heat Pump (ccASHP) Specification in coordination with regional policymakers, utilities, and industry stakeholders. The ccASHP Spec aims to provide a more effective measure of cold climate performance beyond traditional performance metrics (i.e. HSPF), which does not effectively account for temperatures below 17°F or the variable-speed compressors and lack of integrated electric resistance elements in ccASHPs. The NEEP specification forms the basis for eligible technology requirements for the MassCEC Clean Heating & Cooling Program and Efficiency Vermont cold climate heat pump rebate.
154 http://www.fueleconomy.gov/feg/how_tested.shtml 155 http://www.afdc.energy.gov/vehicles/electric_maintenance.html

Northeastern Regional Assessment of Strategic Electrification | 88
electric drivetrains are upfitted in a manner that does not compromise the emissions calibration of the
original OEM engine and does not violate the Clean Air Act. EPA and the California Air Resources Board
(CARB) are the two entities that provide certificates of conformity for vehicle upfits that alter the
original engine design. The OEMs also maintain credentialing systems such as Ford’s QVM program and
GM’s SVM program that list authorized upfitters and ensure that the vehicle upfit is performed by a
qualified party that meets standards of workmanship, service, and quality. Ford launched an eQVM
program in Spring 2017 to authorize specific companies to do plug-in hybrid upfits and hybrid electric
upfits on its vehicles and chassis. Policymakers designing programs that relate to medium- and heavy-
duty vehicle electrification should ensure that they work only with vendors that can produce valid
certificates of conformity and that work well with the major OEMs.
Marketing, Outreach, and Education
Policy Discussion: Buildings
There is a long history of marketing of more energy efficient technologies and energy conscious
behaviors in buildings that proponents of strategic electrification can learn from. For instance, Northeast
states have already applied a wide range of outreach programs, ranging from utility-led programs for
weatherization and energy efficiency upgrades (e.g. Mass Save, Efficiency Maine, Energize CT) to
community-based outreach programs for renewables and energy efficiency (e.g. Solarize Mass and
Solarize Rhode Island, HeatSmart Tompkins). The field of community-based social marketing offers
numerous case studies, guidelines for program design, and tests of the effectiveness of such
programs.156
The two main audiences for outreach and education in the building sector are end-customers and the
supply chain. Customers include residents, businesses, governments, and non-profits, and can be
tenants or building owners. The supply chain includes architects, engineers, facilities planners, and the
contractors that perform installations.
Two of the major challenges in educating consumers are (1) that the technology has only recently
become more suitable for cold climates, and (2) that consumers may associate ASHPs more with cooling
due to the way they have been advertised in existing state and utility efficiency outreach programs.
Policymakers designing outreach programs should keep these challenges in mind when designing
messaging.
Conventional advertising and informational campaigns (target: end-customers)
Consumer studies have found that top customer concerns around heat pumps often include
performance and reliability, cost and economics, where to purchase/install them, and how to access
156 A useful primer can be found at the Fostering Sustainable Behavior website hosted by Doug McKenzie-Mohr, http://www.cbsm.com.

Northeastern Regional Assessment of Strategic Electrification | 89
reliable information.157 To address these concerns, it is common for marketing and outreach campaigns
for energy efficiency to incorporate wide-reaching communications techniques. For instance, MassSave
has used billboards, bill stuffers, training contractors’ sales teams to do one-on-one customer
engagement, and other outreach mechanisms.158 These techniques can easily be applied to heat pump
promotion campaigns.
Heat pump marketing has been hampered by the inability to encourage heat pump adoption as part of
home efficiency measures, as described in Section 0. As noted, addressing this limitation may require
changes in fuel-switching regulations to enable utilities to encourage fuel-switching. Nonetheless, some
utility efficiency programs in Northeast have begun piloting incentive programs to encourage deeper
home energy improvements (e.g. Zero Energy Now from Efficiency Vermont and Green Mountain
Power, and NYSERDA net zero incentives through Low-rise Residential New Construction Program).
These enable heat pumps to capture a greater percentage of the building heating load, potentially
improving the cost effectiveness of ASHPs.
Community-based initiatives (target: end customers)
Outreach programs sometimes go beyond marketing and encourage coordinated action to achieve
better pricing. Solarize provides a basic model for bulk procurement of PV systems that has been piloted
for other technologies including heat pumps and electric vehicles. These programs use grassroots
community-based outreach to reduce marketing costs, deadlines and limited time opportunities to spur
customer action, and messaging from trusted non-profits to reduce the fear of adopting new
technologies. Furthermore, they capitalize on the motivation of participants to find additional
participants (in order to secure better bulk pricing) and thereby create a highly visible campaign. These
efforts enable vendors to offer better pricing due to the reduced customer acquisition costs and
increased economies of scale.
Solarize campaigns have been successfully implemented in all northeastern states, with government-
supported statewide programs in Massachusetts, New York, Connecticut, and Rhode Island. This model
was also successfully demonstrated for bundled weatherization and heat pump deployment through
HeatSmart Tompkins, and it is anticipated that Massachusetts and New York will launch state-sponsored
programs to support community campaigns for renewable heating and cooling technologies (including
heat pumps). Other organizations are supporting similar programs (e.g. Carbon Neutral Cities Alliance
renewable thermal campaigns). Policymakers should study these initiatives as they unfold to
incorporate lessons learned for the next round of initiatives.
Training (target: both consumers and building practitioners)
Proper installation and usage of heat pumps is critical to their successful deployment and to positive
consumer experiences reinforcing market growth. This requires training for both building practitioners
and end-consumers.
157 http://www.emeramaine.com/media/41789/emera-maine-heat-pump-pilot-final-report-nov-2014.pdf 158 http://www.mass.gov/eea/docs/doer/renewables/thermal/carts-report.pdf

Northeastern Regional Assessment of Strategic Electrification | 90
Building practitioners, from architects and engineers to residential contractors, need to know about the
most recent improvements in the technology so they can recommend the right heat pump application
to building owners. Education programs can also equip contractors with the technical knowledge base in
installation and O&M procedures to ensure that systems are properly installed and serviced.
Furthermore, customers across all sectors often rely on contractors and vendors to recommend
technology improvements,159 and ensuring that contractors and building practitioners are aware of and
can recommend electric replacement technologies (and accompanying incentives) will be necessary for
driving customers to adopt and plan for these technologies.
Additionally, customers need to know how to optimally use their ASHPs. As described in the summary of
the Cadmus study in Section 0, proper usage is critical to obtaining the energy saving benefits of ASHPs.
Education campaigns should account for the following observations when establishing training programs
for end-use customers:
Homeowners who were motivated to purchase ASHPs for their cooling capabilities may not be aware that their heat pumps are an efficient way to provide supplemental heat in the winter, and thus may not use them appropriately in the winter.
Homeowners may be accustomed to setting back thermal setpoints in their homes when not occupied. However, heat pumps operate most efficiently at steady output so the resulting savings may be less than expected.
Homeowners may not appropriately adjust the setpoints of their existing home heating systems after installing supplemental ASHPs, and thereby not receive the value of full operation of the heat pump.
Policy Discussion: Transportation
EVs are becoming more well-known, though similarly to buildings, awareness of recent advancements in
technology is lower and a few common misconceptions persist. A 2015 study found that 55 percent of
respondents who were not considering plug-in vehicles thought they were too expensive,160 despite the
fact that mass-market EVs are now available at costs in the range of many other compact cars,
particularly after accounting for tax credits, incentives, and lower operating costs. The study also found
that 27 percent cited poor performance, despite the fact that EVs can accelerate and perform as well as
many other cars.
Conventional advertising and informational campaigns targeted at end-customers
Policymakers should design marketing, outreach, and education campaigns for EVs to achieve two
related objectives: first to address misconceptions and second to develop a business case, particularly
for fleet adoption of the vehicles. For the former, state agencies are using tools such as Ride & Drives
and public events to showcase EVs and their performance. In particular, the ZEV states have committed
159 http://www.emeramaine.com/media/41789/emera-maine-heat-pump-pilot-final-report-nov-2014.pdf 160 http://www.afdc.energy.gov/uploads/publication/consumer_views_pev_benchmark.pdf

Northeastern Regional Assessment of Strategic Electrification | 91
to “promote the availability and effective marketing of all plug-in electric vehicle models in our states”
through the Multi-state ZEV Action Plan.161 These ZEV states are engaging dealers in EV promotion and
coordinating outreach programs with U.S. Department of Energy (DOE) Clean Cities and non-profit
organizations. For the latter, states have been promoting tools such as AFLEET and hosting stakeholder
meetings and workshops.
Community bulk purchasing programs targeted at private citizens
Just like Solarize and RH&C bulk purchasing campaigns in the building sector, there are opportunities for
community outreach campaigns to bring down costs of EVs and reduce customer inertia. These
programs enlist volunteer non-profits to perform outreach and marketing, reducing the cost of
marketing for the dealership and allowing the dealership to pass on those savings. The structure is often
similar to Solarize programs in that it offers a limited time window when the price is particularly good,
creating a deadline that spurs action. An example of such a campaign is provided in Section 0, which
describes the pioneering Solar Benefits Colorado project. Since that campaign concluded, similar efforts
(minus the PV component) have emerged across the United States, including campaigns in Utah, Kansas
City, and eastern Massachusetts. These campaigns are often timed to occur when dealers are looking to
meet sales quotas in order to optimize the discount achieved.
Bulk procurement initiatives targeted at public fleets
In order to achieve a high number of electric vehicles purchased at once, the federal government
through the DOE has been engaging states and regional councils in aggregated procurement efforts to
reduce upfront costs. Through the Aggregated Alternative Technologies Alliance, the DOE has funded
projects that use cooperative procurement strategies to achieve bulk pricing on electric vehicles for
fleets. One of these projects, Fleets for the Future,162 is currently executing cooperative purchases of
light-duty EVs, EVSE, and other alternative fuel vehicles across the vehicle spectrum, using regional
councils as the procurement leads. The EV Smart Fleets Program is developing a project to get better
pricing on light-duty EVs on state contracts.
Results from these campaigns are not yet available. However, policymakers wishing to replicate this sort
of engagement effort should note that it will likely require volumes of several hundred light-duty EVs
before bulk pricing can be achieved from the OEMs.
161 http://www.nescaum.org/documents/multi-state-zev-action-plan.pdf/ 162 http://www.fleetsforthefuture.org/

Northeastern Regional Assessment of Strategic Electrification | 92
Appendix B: Highlights of the Literature
U.S. Deep Decarbonization Pathways Project163
This project has produced two reports, one on technological pathways to deep decarbonization,164 and one on
policy implications of deep decarbonization.165 The pathways report describes the technological options and
required pace of deployment to reduce emissions 80 percent below 1990 levels by 2050. It further shows that it
is technically feasible to achieve that goal using existing commercial or near-commercial technologies while
maintaining the same level of energy services and economic growth. Each of the scenarios examined includes a
more-than-doubling of electricity’s share of total energy, and electricity supplies 90 percent or more of building
energy use by 2050. The report estimates an increase in total cost of the energy system equivalent to less than 1
percent of GDP. The follow-on policy report examines the physical and economic requirements of the steps
along the way to implementation of a deep decarbonization path, allowing policy discussions to be grounded in
the concrete actions the policies must achieve. It suggests a set of policy design guidelines such as:
anticipating investment needs,
incorporating carbon constraints in current purchasing and infrastructure decisions,
creating stable drivers for the long-term transition,
developing structures for cross-sectoral coordination and integrated planning,
enabling customer adoption, and
minimizing distributional effects.
The report also highlights the role of regulated network operators, such as electric and natural gas distribution
utilities, in the transformed energy economy.
These reports are the U.S. version of a global project, the Deep Decarbonization Pathways Project,166 which has
facilitated country-level analysis for 16 countries and synthesized the results.
New York Renewable Heating and Cooling Policy Framework 167
Thermal energy in the residential and commercial buildings in New York State accounts for a sizeable portion of
statewide energy consumption and GHG emissions. In support of New York’s GHG emissions reduction goals—
targeting 40 percent GHG emissions reduction by 2030 and 80 percent by 2050—NYSERDA has begun a process
of developing an integrated, long-term policy approach to addressing emissions from the heating and cooling
163 http://usddpp.org/ 164 http://usddpp.org/downloads/2014-technical-report.pdf 165 http://usddpp.org/downloads/2015-report-on-policy-implications.pdf 166 http://deepdecarbonization.org/ 167 NYSERDA (2017). Renewable Heating and Cooling Policy Framework: Options to Advance Industry Growth and Markets in New York,
available at https://www.nyserda.ny.gov/Researchers-and-Policymakers/Renewable-Heating-and-Cooling
Northeastern Regional Assessment of Strategic Electrification | 93
sector. As the first comprehensive product of this process, NYSERDA issued a new report called “Renewable
Heating and Cooling Policy Framework” in February 2017. This report analyzed various aspects of renewable
heating and cooling technologies with a focus on cold-climate ASHPs, GSHPs, and solar hot water. The report
first characterized the state’s RH&C market and then analyzed technical and economic potential of RH&C
technologies from customer’s point of view with different cost and incentive assumptions. The report also
evaluated and recommended a set of policies and market strategies to remove barriers to and support the
growth of the RH&C market with a focus on (a) reducing technology costs and lowering barriers; (b)
implementing RH&C mandates; and (c) providing additional incentives.
NRECA/RAP Beneficial Electrification168
Keith Dennis from National Rural Electric Cooperative Association (NRECA) and Ken Colburn and Jim Lazar from
the Regulatory Assistance Project (RAP) recently published a paper in the Electricity Journal. They argued that
the use of a new metric “emissions efficiency” measured in emissions per kWh is vital for effectively capturing
cost-effective GHG emissions reduction opportunities from environmentally beneficial electrification, which is
electrification of energy end-uses that have been powered by fossil fuels). To pursue environmentally beneficial
electrification, the authors discuss that emissions efficiency or “emiciency” may be an equally or more important
metric than “energy efficiency” because traditional “energy efficiency” ignores variability in emissions rates in
the power system that differ by hour and also ignores emissions impacts from fuel switching. The authors used
the Clean Power Plan as an example, arguing that it may also discourage electrification because it only focuses
on emission changes in the power sector. As a result, the Clean Power Plan could miss out on cost-effective
opportunities to create net emissions reductions from chimneys, flues, and vehicle tailpipes. Lastly the authors
provide several recommendations to support implementation of environmentally beneficial electrification as
part of an overall “no regrets” strategy.
Vermont 2016 Comprehensive Energy Plan169
Vermont’s most recent Comprehensive Energy Plan (CEP) identifies strategic electrification as a key part of the
state's approach to its goals of reducing energy use per capital by more than one third by 2050 and meeting 25
percent of the state's total energy use from renewable energy by 2025 and 90 percent by 2050. Building on
analysis the state conducted170 in the lead-up to the CEP process, the plan shows how the three broad strategies
laid out in this regional assessment (energy efficiency, zero-carbon electric supply, and electrifying light-duty
transportation and building heat) can combine to meet the state's objectives. The CEP also addresses the grid
and electric supply requirements resulting from electrification, and it supports use of sustainable wood in
advanced wood heating systems along with bioheat and renewable natural gas.
168 Keith Dennis, Ken Colburn, Jim Lazar (2016) “Environmentally Beneficial Electrification: The Dawn of ‘Emissions Efficiency’”, The Electricity Journal 29 (2016) 52-58, available at http://www.sciencedirect.com/science/article/pii/S1040619016301075
169 http://publicservice.vermont.gov/publications-resources/publications/energy_plan/2016_plan 170 “Total Energy Study” available at http://publicservice.vermont.gov/publications-resources/publications/total_energy_study
Northeastern Regional Assessment of Strategic Electrification | 94
Northeast EnergyVision 2030171
EnergyVision 2030 conducted by Acadia Center analyzes how states in the Northeast can advance clean energy
markets and resources in the building, electricity, and transportation sectors to attain state and regional
emission goals. EnergyVision 2030 used the Long-range Energy Alternative Planning (LEAP) model and analyzed
a few different energy scenarios. The primary scenario projects expanded penetrations or levels of electric
vehicles, space and hot water heat pumps, renewable generation, demand response, energy storage and energy
efficiency in order to reduce emissions by 45 percent by 2030 to put the region on the path to meet 80 percent
reduction by 2050. Another scenario called an Expanded Scenario models additional enhancements in clean
energy market penetration levels to reach a 50 percent emissions reduction by 2030. EnergyVision 2030 also
discusses how the region and states can modernize their grid rules and regulations and expand demand
optimization (e.g., through advanced metering infrastructure, greater two-way flow of electricity, demand
response, and storage) so that they can increase the penetration of clean local energy resources like energy
efficiency and distributed renewable generation.
Zero Emission Vehicle Multi-State Action Plan172
Eight states signed the Zero Emission Vehicle (ZEV) memorandum of understanding173 in 2014. A key part of that
MOU was the development of this multi-state action plan.174 Each signatory state also has its own state-specific
action plan. Five of the eight signatory states (California, Connecticut, Maryland, Massachusetts, New York,
Oregon, Rhode Island, and Vermont) are northeastern states reflected in this regional assessment, and six are
NEEP member states. The multi-state action plan identifies activities that each state can take. It also describes
collective actions to develop the market for electric and fuel cell vehicles, along with the associated
infrastructure. As such, it provides a model for implementation of policies and actions across the categories of
policy identified in Section 3 of this report. It establishes a goal (3.3 million ZEVs across the eight states by 2025,
or about 10 percent of the light-duty vehicle stock) and addresses marketing, incentives, supporting
infrastructure and signage, regulatory barriers, rate structures, and government leadership by example in both
vehicles and charging infrastructure.
171 Acadia Center (2017). EnergyVision 2030: Transition to a Low-Emissions Energy System in the Northeast, available at http://2030.acadiacenter.org/full-reports/
172 http://www.zevstates.us/ 173 http://www.nescaum.org/documents/zev-mou-8-governors-signed-20131024.pdf/ 174 http://www.nescaum.org/topics/zero-emission-vehicles/multi-state-zev-action-plan