Northeast Landscape Planning Committee Meeting #7 – Ecological Policy Framework (cont’d)...
15
Northeast Landscape Planning Committee Meeting #7 – Ecological Policy Framework (cont’d) Resource review • Landcover data • Watershed data • FIA data
-
Upload
jenny-fanning -
Category
Documents
-
view
213 -
download
0
Transcript of Northeast Landscape Planning Committee Meeting #7 – Ecological Policy Framework (cont’d)...
Northeast Landscape Planning CommitteeMeeting #7 – Ecological Policy Framework
(cont’d)
Resource review• Landcover data• Watershed data• FIA data

Land Cover DatasetsMFRC Landscape Program
Historical AssessmentsBig Woods Landscape Plan (MN DNR)Doug MacCleary (US FS Assistant Director) article
Pre-settlement Inventories 19741988
State of Minnesota Land Cover Inventories – LMIC 1969
1988
GAP 1992
National Land Cover Data (NLCD) 1992200120062011?


Presettlement
GAP 1992 (compared to Presettlement)
Cover Type Acres % of TotalAcres
Change % Change Acres % of TotalAcres
Change % ChangeUpland Forest 4,428,714 60.1 - -
3,928,833 53.4 -499,881 -11.3Upland Shrub 0 0.0 - - 427,374 5.8 427,374 n/aUpland Grass 688,738 9.4 - - 292,368 4.0 -396,371 -57.6Lowland Vegetation 1,805,454 24.5 - - 1,878,267 25.5 72,813 4.0Agriculture 0 0.0 - - 106,289 1.4 106,289 n/aDeveloped 0 0.0 - - 115,799 1.6 115,799 n/aBarren 0 0.0 - - 37,402 0.5 37,402 n/aOpen Water 425,582 5.8 - - 576,353 7.8 150,771 35.4Unclassified 15,156 0.2 - - 960 0.0 -14,196 -93.7Totals 7,363,644 100.0 - - 7,363,644 100.0 - -
NLCD 2001 (compared to GAP 1992)
NLCD 2006 (compared to NLCD 2001)
Cover Type Acres % of TotalAcres
Change % Change Acres % of TotalAcres
Change % ChangeUpland Forest 3,480,330 47.3 -448,503 -11.4
3,439,594 46.7 -40,736 -1.2Upland Shrub 472,971 6.4 45,598 10.7 473,577 6.4 605 0.1Upland Grass 166,443 2.3 -125,925 -43.1 186,589 2.5 20,146 12.1Lowland Vegetation 2,424,108 32.9 545,841 29.1 2,440,580 33.1 16,472 0.7Agriculture 14,534 0.2 -91,755 -86.3 14,843 0.2 309 2.1Developed 182,030 2.5 66,231 57.2 183,665 2.5 1,635 0.9Barren 40,963 0.6 3,561 9.5 46,510 0.6 5,548 13.5Open Water 581,902 7.9 5,549 1.0 577,923 7.8 -3,979 -0.7Unclassified 363 0.0 -597 -62.2 363 0.0 0 0.0Totals 7,363,644 100.0 - - 7,363,644 100.0 - -
Land Use/Cover in the Northeast Landscape: presettlement, 1992, 2001, 2006

Lake Superior Basin Lake Superior North Lake Superior SouthCloquet River St. Louis River
Rainy River Basin Rainy River – Rainy Lake Rainy River – Headwaters Littlefork River Vermilion River
St. Croix Basin Kettle River Nemadji River
Upper Mississippi River Basin Mississippi River - Grand Rapids
WatershedsNortheast Landscape Region


Lake Superior – North
Rainy River – Rainy Lake
Rainy River - Headwaters
Nemadji River
Kettle River
Vermillion River
Little Fork River
St. Louis River Cloquet
River Lake Superior – South
Land Use/Cover Barren CropsDeveloped Forest
Grassland
Open Water Shrub
Wetlands
Cloquet River 0.1 0.1 2.0 78.9 2.3 6.0 8.1 2.5Kettle River 0.0 2.2 4.0 62.8 13.6 2.6 4.2 10.6Lake Superior - North 0.0 0.0 1.9 83.5 0.4 6.0 7.5 0.6Lake Superior - South 0.3 0.2 5.8 76.9 2.8 1.0 11.7 1.2Little Fork River 0.8 0.5 1.7 80.8 2.2 2.5 5.6 5.9Nemadji River 0.0 1.0 2.9 72.3 10.2 1.7 7.4 4.5Rainy River - Headwaters 0.2 0.0 1.1 78.0 0.4 14.2 5.1 1.1Rainy River - Rainy Lake 0.0 0.3 0.9 73.7 1.2 16.6 2.1 5.2St. Louis River 1.4 0.3 4.2 75.3 4.3 3.4 6.0 5.1Vermillion River 0.3 0.1 1.4 74.5 0.7 13.1 6.4 3.4
Land Use/Cover by Watershed
Percent of Watershed
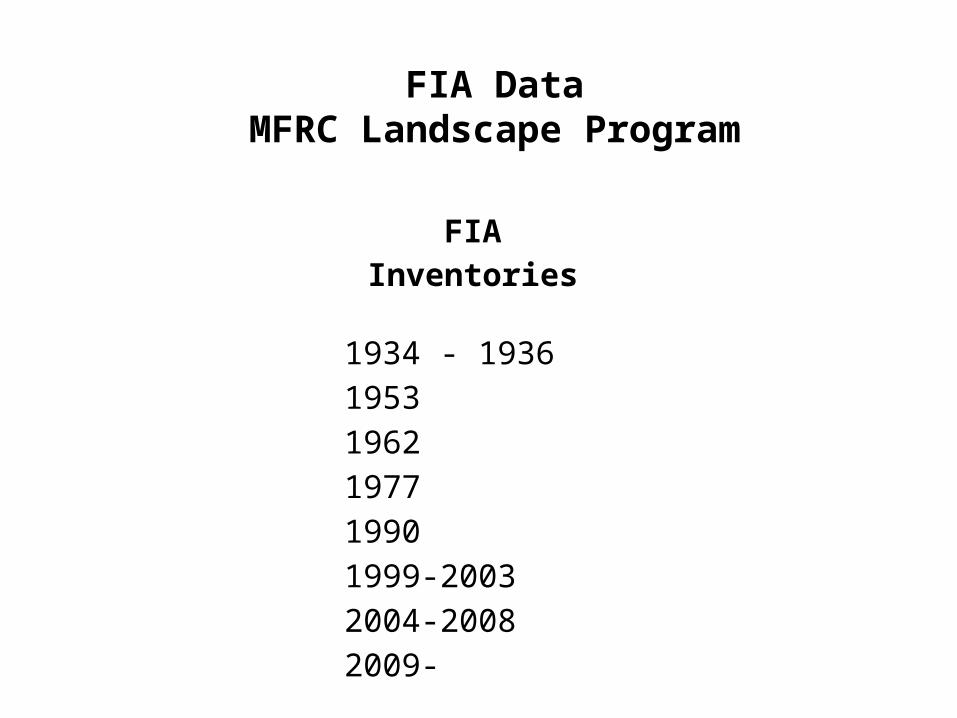
FIA Inventories
1934 - 193619531962197719901999-20032004-20082009-
FIA DataMFRC Landscape Program

Land useNE
Landscape Carlton Cook Lake St. Louis 2010Total 7,348,736 566,346 1,034,774 1,437,514 4,310,101All forestland 5,682,348 356,218 897,612 1,248,413 3,180,105
Timberland 4,580,364 346,902 603,256 913,953 2,716,252Other forestland 213,804 3,095 15,354 53,851 141,504Reserved productive forestland 859,075 6,221 271,737 266,080 315,037Reserved other forestland 29,105 - 7,265 14,529 7,312
Nonforest 1,070,704 199,703 31,252 64,837 774,912Non-Census water 68,121 3,515 10,104 13,860 40,642Census water 527,563 6,909 95,807 110,404 314,443 2003Total 7,368,179 540,513 1,038,194 1,437,904 4,351,568All forestland 5,484,718 307,385 865,261 1,191,648 3,120,425
Timberland 4,431,726 300,103 595,851 889,266 2,646,506Other forestland 178,769 7,282 10,471 51,514 109,503Reserved productive forestland 840,726 - 248,448 239,365 352,913Reserved other forestland 33,497 - 10,491 11,503 11,503
Nonforest 1,219,749 227,625 43,500 94,520 854,104Non-Census water 128,865 1,284 31,033 26,558 69,989Census water 534,848 4,219 98,402 125,179 307,049 Change (2003 to 2010 in %)Total -0.3 4.8 -0.3 0.0 -1.0All forestland 3.6 15.9 3.7 4.8 1.9
Timberland 3.4 15.6 1.2 2.8 2.6Other forestland 19.6 -57.5 46.6 4.5 29.2Reserved productive forestland 2.2 9.4 11.2 -10.7Reserved other forestland -13.1 -30.8 26.3 -36.4
Nonforest -12.2 -12.3 -28.2 -31.4 -9.3Non-Census water -47.1 173.8 -67.4 -47.8 -41.9Census water -1.4 63.8 -2.6 -11.8 2.4
FIA estimates of land use in the Northeast Landscape

Note: Methods of estimating area in these categories have changed over time. As a result, estimates of area may have changed while actual areas did not. For example, estimated total land area in the Northeast Landscape varied from 7,118,303 acres (1977) to 7,368,179 (2003) but the the Northeast Landscape did not change in extent.
Forest land - Land with at least 10 percent cover (or equivalent stocking) by live trees of any size, including land that formerly had such tree cover and that will be naturally or artificially regenerated. To qualify, the area must be at least 1.0 acre in size and 120.0 feet wide. Forest land includes transition zones, such as areas between forest and nonforest lands that have at least 10 percent cover (or equivalent stocking) with live trees and forest areas adjacent to urban and built-up lands. Roadside, streamside, and shelterbelt strips of trees must have a width of at least 120 feet and continuous length of at least 363 feet to qualify as forest land. Unimproved roads and trails, streams, and clearings in forest areas are classified as forest if they are <120 feet wide or an acre in size. Tree-covered areas in agricultural production settings, such as fruit orchards, or tree-covered areas in urban settings, such as city parks, are not considered forest land.
Nonforest land - Any land within the sample that does not meet the definition of accessible forest land or any of the other types of basic land covers. To qualify, the area must be at least 1.0 acre in size and 120.0 feet wide, with some exceptions that are described in the document "Forest inventory and analysis national core field guide, volume 1: field data collection procedures for Phase 2 plots, version 4.0." (http://www.fia.fs.fed.us/library/field-guides-methods-proc/.) Evidence of "possible" or future development or conversion is not considered. A nonforest land condition will remain in the sample and will be examined at the next occasion to see if it has become forest land.
Noncensus water - Lakes, reservoirs, ponds, and similar bodies of water 1.0 acre to 4.5 acre in size. Rivers, streams, canals, etc., 30.0 feet to 200 feet wide (1990 U.S. Census definition - U.S. Census Bureau 1994). This definition was used in the 1990 census and applied when the data became available. Earlier inventories defined noncensus water differently.
Census water - Lakes, reservoirs, ponds, and similar bodies of water 4.5 acre in size and larger; and rivers, streams, canals, etc., more than 200 feet wide (1990 U.S. Census definition; U.S. Census Bureau 1994).
Definitions, etc.

Forestland (acres) % of NE Landscape Forestland
OwnerNE
Landscape Carlton Cook Lake St. LouisNE
Landscape Carlton Cook LakeSt.
Louis 2010
County/Municipal
1,157,898
39,263 9,686
192,290
916,660 20.4 0.7 0.2 3.4 16.1
National Forest
2,035,530
643,380
648,508
743,642 35.8 11.3 11.4 13.1
Other federal
145,001 3,240
9,035
25,581
107,145 2.6 0.1 0.2 0.5 1.9
Private
1,617,028
232,029
138,378
230,245
1,016,376 28.5 4.1 2.4 4.1 17.9
State
726,891
81,686
97,132
151,790
396,282 12.8 1.4 1.7 2.7 7.0
All owners
5,682,349
356,219
897,612
1,248,414
3,180,104 100.0 6.3 15.8 22.0 56.0 2003
County/Municipal
987,080
37,689 1,377
168,155
779,860 18.0 0.7 0.03 3.1 14.2
National Forest
1,870,525
579,460
595,390
695,674 34.1 10.6 10.9 12.7
Other federal
173,597 2,989
32,559
10,666
127,382 3.2 0.1 0.6 0.2 2.3
Private
1,585,367
192,901
124,694
218,027
1,049,745 28.9 3.5 2.3 4.0 19.1
State
868,149
73,806
127,169
199,409
467,764 15.8 1.3 2.3 3.6 8.5
All owners
5,484,718
307,385
865,260
1,191,647
3,120,426 100.0 5.6 15.8 21.7 56.9
Ownership of forestland in the Northeast Landscape

All forestland (acres) % of Total
Covertypes (DNR)NE Landscape Carlton Cook Lake St. Louis
NE Land-scape Carlton Cook Lake St. Louis
Total 5,682,349 356,219 897,612 1,248,414 3,180,104 100 100 100 100 100Jack pine 237,005 - 42,187 67,906 126,912 4 5 5 4Red pine 217,421 10,771 29,582 51,704 125,364 4 3 3 4 4Eastern white pine 121,578 2,296 19,389 22,377 77,516 2 1 2 2 2Balsam fir 325,800 1,620 76,719 118,446 129,015 6 0 9 9 4White spruce 63,690 425 26,059 20,916 16,289 1 0 3 2 1Black spruce 785,880 19,586 74,374 221,889 470,031 14 5 8 18 15Tamarack 265,257 21,634 4,102 16,989 222,532 5 6 0 1 7N white-cedar 222,790 2,908 63,738 53,233 102,911 4 1 7 4 3Oak 16,702 11,847 - - 4,855 0 3 0N hardwoods 366,589 48,602 51,879 105,014 161,095 6 14 6 8 5Lowland hardwoods 279,381 47,728 22,154 47,764 161,735 5 13 2 4 5Cottonwood/Willow 52,299 - - 2,994 49,305 1 0 2Aspen 1,836,974 148,389 250,384 276,284 1,161,917 32 42 28 22 37Birch 651,845 23,884 174,729 196,850 256,383 11 7 19 16 8Balsam poplar 88,614 5,609 7,145 18,688 57,172 2 2 1 1 2Non stocked 36,667 7,082 10,877 1,224 17,484 1 2 1 0 1Other 113,856 3,838 44,294 26,135 39,589 2 1 5 2 1
Forest cover types in the Northeast Landscape 2010
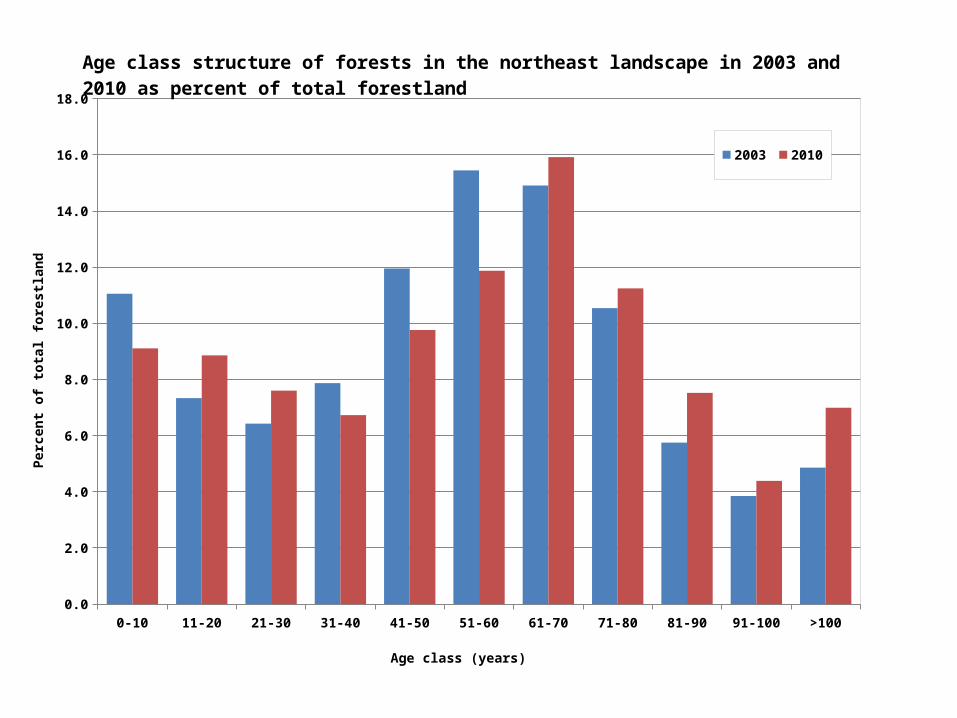
0-10 11-20 21-30 31-40 41-50 51-60 61-70 71-80 81-90 91-100 >1000.0
2.0
4.0
6.0
8.0
10.0
12.0
14.0
16.0
18.0
2003 2010
Age class (years)
Perc
ent o
f tot
al fo
rest
land
Age class structure of forests in the northeast landscape in 2003 and 2010 as percent of total forestland