
Northamptonshire COVID-19 Weekly Surveillance Report
19
Data up to 27 June 2021 • 474 Northamptonshire residents have tested positive for COVID-19 in the last week – 50% higher than last week’s number • Mixing between households remains the greatest cause of transmission • The largest number of positive tests in the last week was found in 20 to 29 year olds, followed by 10 to 19 year olds • Locally the highest weekly rates are in East Northamptonshire (76.2 per 100,000) and South Northamptonshire (65.6 per 100,000) • All residents are being urged to take free twice weekly rapid lateral flow tests to reduce onward transmission • COVID-19 vaccinations are now available to everyone aged 18 years and over – both doses are required to give the protection required from the dominant Delta COVID-19 variant Northamptonshire COVID-19 Weekly Surveillance Report
Transcript of Northamptonshire COVID-19 Weekly Surveillance Report

Data up to 27 June 2021
• 474 Northamptonshire residents have tested positive for COVID-19 in the last week – 50% higher than last week’s number• Mixing between households remains the greatest cause of transmission• The largest number of positive tests in the last week was found in 20 to 29 year olds, followed by 10 to 19 year olds• Locally the highest weekly rates are in East Northamptonshire (76.2 per 100,000) and South Northamptonshire (65.6 per
100,000) • All residents are being urged to take free twice weekly rapid lateral flow tests to reduce onward transmission• COVID-19 vaccinations are now available to everyone aged 18 years and over – both doses are required to give the protection
required from the dominant Delta COVID-19 variant
Northamptonshire COVID-19 Weekly Surveillance Report

Four Step RoadmapStep 18-29
March
Step 1Changes
on 29 March
Step 2Not before
12 April
Step 317 May
*Review of social distancing
Step 4Not before
19 July
Children back to school/college
Rule of 6 or 2 households meet outdoors
Opening of non-essential shopshairdressers, gyms, zoos, holiday campsites and personal care services
Most legal restrictions on meeting others outdoors will be lifted, although gatherings of over 30 people will remain illegal. Indoors, the ‘Rule of 6’ or 2 households will applyIf you are meeting friends and family, you can make a personal choice on whether to keep your distance from them, but you should still be cautious
Government hopes to be in a position to remove all legal limits on social contact
Outdoor recreation/exercise with one person outside your household
Outdoor activity facilities open and formally organised outdoor sports
Funerals up to 30 mourners.Weddings, receptions and commemorative events 15
Most businesses in all but the highest risk sectors will be able to reopen
Government hopes to reopen remaining premises, including nightclubs, and ease the restrictions on large events and performances that apply in Step 3
Care home residents – one regular visitor
End of ‘stay at home’ rule but work from home if canand no holidays
Hospitality venues servepeople outdoors
Up to 30 people will be able to attend weddings, receptions and wakes, as well as funerals
2
Only when the government is sure it is safe to move to Step 4 will the final decision be made - and not before 19 July.
The decision will be based on four tests:
• The vaccine deployment programme continues successfully
• Evidence shows vaccines are sufficiently effective in reducing hospitalisations and deaths in those vaccinated
• Infection rates do not risk a surge in hospitalisations which would put unsustainable pressure on the NHS
• Assessment of the risks is not fundamentally changed by new Variants of Concern

Everything We Do Can Stop The Spread• Both doses of the COVID-19 vaccine are important for the best possible protection against COVID-19. Now that the
COVID-19 vaccination programme has been extended to everyone aged 18 and over, further opportunities are being offered for people to get the jab at a time and place convenient for them. Adults can ‘grab a jab’ without the need to book an appointment at two locations in Northamptonshire this week. A new pharmacy-led COVID-19 vaccination site has opened at the Raven Hotel in Corby. The site went live on Thursday 1 July and will further improve local access to the vaccine for people in the town. Drop-in vaccination sessions are available on Sunday 4 July at The Raven Hotel in Corby. In addition, the Vaccination Centre at Moulton Park is offering drop-in sessions every evening, seven days a week.
• Meeting up for the football? Meeting groups friends or family? Playing in sports matches or participating in activities with others? Take regular lateral flow device tests. They are FREE so get yours today, find your nearest pick up point at https://maps.test-and-trace.nhs.uk/ or order online for next day delivery Order coronavirus (COVID-19) rapid lateral flow tests - GOV.UK (www.gov.uk). Each time we leave the house and mix with others, we risk coming into contact with the virus. Around 1 in 3 people with coronavirus do not show symptoms, and can spread the virus to others without knowing. Testing regularly helps to reduce this risk, particularly before meeting people from outside your household.
• Cases are rising – Remember the basics – Hands, Face, Space, Fresh Air. There has been a 50% increase in cases in Northamptonshire in the last week. Please remember to keep up good levels of hand hygiene washing hands thoroughly and regularly. Wear face coverings in crowded areas, shops and on public transport. Keep your distance from those you do not live with. And if you have to meet indoors, open your windows and doors.
3

Its Coming Home……Let’s make sure that football is the only thing coming home this weekIts great that we can meet with friends to watch and enjoy the football, but remember to follow the guidance so that you and your friends can stick together as a team for the whole tournament. Cases were highest in males aged 20-29 last week.
What can you do to reduce the risk of contracting or spreading the virus?
• Take up both vaccinations when you are called to do so
• Take twice weekly tests to check you are not carrying the virus without symptoms Order rapid lateral flow tests - GOV.UK (www.gov.uk)
• Wash your hands thoroughly and regularly throughout every day
• Meet outdoors where possible and ventilate indoor areas
• Avoid close face to face indoor contact, shouting and singing
• Meet up within the guidance, 6 indoors, 30 outdoors
4

COVID-19 TestingI have symptoms = PCR Test
• To find out more information about local PCR testing sites visit: Northamptonshire COVID-19 Testing Update.
• Tests can be booked online at NHS COVID-19 or by calling 119. Home test kits can also be ordered subject to availability.
• It is vital that when you leave the house to be tested you must go straight to the testing centre and return home
immediately to self- isolate until you get your results.
• Find out if you can claim financial support during self-isolation here.
• For the full self-isolation guidance see here.
• A self-isolation support pack for residents in North and West Northamptonshire can be found here.
I don’t have symptoms = Free Rapid COVID-19 Test
• Everyone in Northamptonshire can access free, regular, rapid coronavirus testing. Test kits are available for home use or at test centres, some workplaces and schools. You can order home test kits on gov.uk and get home deliveries, or you can pick up test kits at pharmacies and other local sites. The test is called a Lateral Flow Test and involves a swab of the mouth and nose and provides a result within 30 minutes.
• The aim of testing people who do not have COVID-19 symptoms is to identify those who may be infectious without having symptoms in order to reduce spread of the virus. If positive, the test means you are infectious and must start self-isolating at home immediately and complete 10 days of self-isolation, along with any household contacts.
• The test does not tell you if you are COVID-free, so all COVID-secure measures must be exercised even if you get a negative result. You must continue to follow COVID guidelines and remember to wash your hands, wear a face covering where required and maintain a 2m distance from others regardless of the result.
5

This graph shows the total number of people who have tested positive for COVID-19 in Northamptonshire each week since 5th April 2021.
Case rates were on a steady decline throughout the whole of April. A brief rise in cases was seen in early May, after which weekly case volumes decreased and then plateaued. Sadly, there has been a rise in cases in the last few weeks.
This week’s case total represents an increase of 50% when compared to the previous week.
Please note that the latest week’s figures may increase, as data for the most recent days is subject to reporting delays.
A total of 51,002 positive cases have been identified in Northamptonshire to date. Of this number, 474 were identified in the last week, 21st to 27th June 2021.
Total and Weekly Summary
6
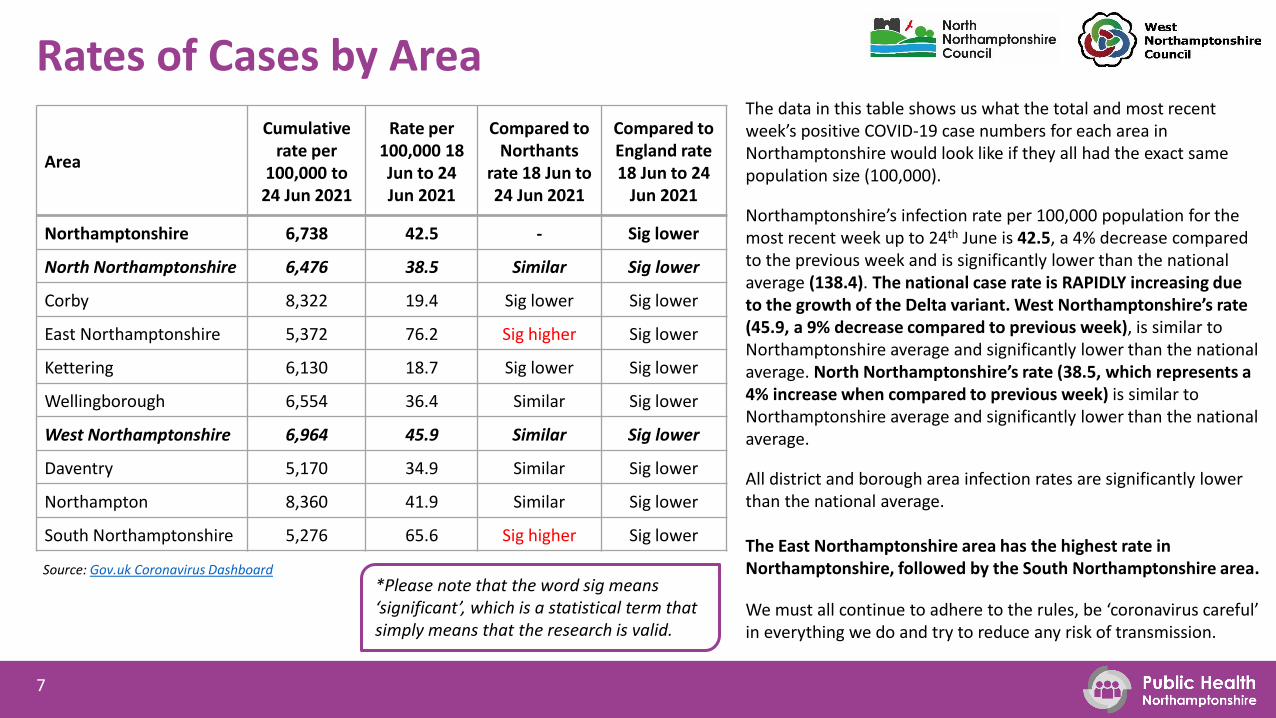
*Please note that the word sig means ‘significant’, which is a statistical term that simply means that the research is valid.
Source: Gov.uk Coronavirus Dashboard
Rates of Cases by AreaThe data in this table shows us what the total and most recent week’s positive COVID-19 case numbers for each area in Northamptonshire would look like if they all had the exact same population size (100,000).
Northamptonshire’s infection rate per 100,000 population for the most recent week up to 24th June is 42.5, a 4% decrease compared to the previous week and is significantly lower than the national average (138.4). The national case rate is RAPIDLY increasing due to the growth of the Delta variant. West Northamptonshire’s rate (45.9, a 9% decrease compared to previous week), is similar to Northamptonshire average and significantly lower than the national average. North Northamptonshire’s rate (38.5, which represents a 4% increase when compared to previous week) is similar to Northamptonshire average and significantly lower than the national average.
All district and borough area infection rates are significantly lower than the national average.
The East Northamptonshire area has the highest rate in Northamptonshire, followed by the South Northamptonshire area.
We must all continue to adhere to the rules, be ‘coronavirus careful’ in everything we do and try to reduce any risk of transmission.
7
Area
Cumulative rate per
100,000 to 24 Jun 2021
Rate per 100,000 18 Jun to 24 Jun 2021
Compared to Northants
rate 18 Jun to 24 Jun 2021
Compared to England rate 18 Jun to 24
Jun 2021
Northamptonshire 6,738 42.5 - Sig lower
North Northamptonshire 6,476 38.5 Similar Sig lower
Corby 8,322 19.4 Sig lower Sig lower
East Northamptonshire 5,372 76.2 Sig higher Sig lower
Kettering 6,130 18.7 Sig lower Sig lower
Wellingborough 6,554 36.4 Similar Sig lower
West Northamptonshire 6,964 45.9 Similar Sig lower
Daventry 5,170 34.9 Similar Sig lower
Northampton 8,360 41.9 Similar Sig lower
South Northamptonshire 5,276 65.6 Sig higher Sig lower

This graph includes all testing data up to 24th June. This chart shows that Northamptonshire’s rate of cases has been below the England average since mid-May and the gap between the Northamptonshire and England rates has widened in the last month. Northamptonshire’s rate in the latest week is similar to the previous week, however, the national average case rate increased by 46% when compared to the previous week.
All district and borough areas currently have weekly total rates below the England average.
Case rates for the East Northamptonshire and South Northamptonshire areas have increased in the last week, however, the case rate for the South Northamptonshire area has reduced slightly in the last couple of days. All other district and borough areas have seen either a decreasing or plateauing trend in case rates in the last week, although Northampton’s rate has shown a slight uptick in recent days.
East Northamptonshire area’s rate is currently the highest of the seven district and borough areas and has been on an increasing trend since mid-June. South Northamptonshire area’s rate is the second highest.
• These are 7-day rolling total numbers of cases as a rate per 100,000 population – this is done to even out the fluctuations we see in testing volumes on weekdays vs weekends.
Source: Gov.uk Coronavirus Dashboard.
Rate of Weekly Lab Confirmed Cases
8

This table shows the total number of people who have tested positive for COVID-19 up to 27th June 2021 in Northamptonshire by area.
Northamptonshire has seen an increase in total weekly cases since the end of May. This week’s data shows a further increase of 50% when compared to the previous week.
In the most recent week both North Northamptonshireand West Northamptonshire and all district and borough areas saw increases in overall case totals.
Please note that extreme caution must be applied when viewing week on week changes. To see the overall changes in areas in context please see slides 15, 16 and 17.
Total Cases by Area
9
AreaTotal cases to 27 Jun
2021
Cases in week 21 Jun to 27
Jun 2021
Change from
previous week
Northamptonshire 51,002 474 Increase
North Northamptonshire 22,659 206 Increase
Corby 6,033 30 Increase
East Northamptonshire 5,111 84 Increase
Kettering 6,266 43 Increase
Wellingborough 5,249 49 Increase
West Northamptonshire 28,343 268 Increase
Daventry 4,489 66 Increase
Northampton 18,833 125 Increase
South Northamptonshire 5,021 77 Increase

Percent Changes: Recent 7-Day Case Rates This chart shows percentage changes in case rates over the last three months up to 26th June, 2021. Percentage changes are calculated by comparing cases to the previous non-overlapping 7-day period. It shows that Northamptonshire saw a steady decrease in case rates in April 2021, after which there was a short-lived increase in case rates early May that included cases of an Indian COVID-19 variant of concern (also called the Delta variant) first discovered in early April. There was a further rapid increase in early June, however, in the last week we saw a short-lived decrease in case rates which unfortunately have started to increase in recent days.
* Data for the last 5 days are not displayed as they will be incomplete.
Source: Gov.uk Coronavirus Dashboard
10

• Please refer to the gov.uk coronavirus dashboard heat map for more information on cases in specific age groups.
This graph shows the number of positive test results for COVID-19 in Northamptonshire over the last 28 days by gender and by ten-year age band.
Overall, more men than women tested positive for COVID-19 in the last 28 days.
The age group with the most positive cases was 20 to 29 year olds, closely followed by 10 to 19 year olds. In males, the 10 year age bracket with the most cases was 20 to 29 year olds, whereas for females it was 10 to 19 year olds.
Over the last 4-week period the number of cases amongst people aged 60+ has plateaued.
Recent Cases by Age and Gender
11

This chart shows the trend in numbers of beds at Northampton and Kettering General Hospitals occupied by COVID-19 patients since 1st August 2020.
It shows that the number of beds occupied due to COVID-19 remained relatively steady over the late summer through to mid-October, at which point numbers of patients in hospital began to increase sharply.
The number of patients in hospital due to COVID-19 has plateaued in the last couple of months following a decreasing trend since mid-January.
The latest data shows a total of 3 COVID-19 patients occupied hospital beds in Northamptonshire on 29th
June 2021, which represents no change when compared to the previous week.
Hospital Beds Occupied by Confirmed COVID-19 Patients
12

This table shows total number of deaths of people who had a positive test result for COVID-19 and died within 28 days of the first positive test, reported up to 27th June 2021 for Northamptonshire by area.
In the most recent week, there were no deaths recorded in Northamptonshire. East Northamptonshire and South Northamptonshire areas have seen no deaths since mid-March, Daventry, Kettering and Wellingborough areas have seen no deaths since mid-April, and Northampton has no record of deaths since 24th April.
Due to the impact of the COVID-19 vaccination in the elderly and most vulnerable people together with the positive impact lockdown has had on community transmission, reduced deaths have been recorded in Northamptonshire in the last nine weeks.
PHE research shows that both doses of vaccinations are effective against the Indian (Delta) variant of concern in reducing infection complications and deaths.
Source: Gov.uk Coronavirus Dashboard
Deaths Within 28 Days of Positive Test
• People who died more than 28 days after their first positive test are not included, whether or not COVID-19 was the cause of death.• Compared to previous reports, the change in the cumulative total is due to PHE using a new methodology to calculate total deaths within 28 days being allocated to the Local Authority• The latest week’s figures are likely to increase further as data for the most recent days are subject to reporting delays.
13
AreaTotal deaths
to 27 Jun 2021
Deaths in week 21 Jun to 27 Jun
2021
Change from previous
week
Northamptonshire 1,405 0 Decrease
North Northamptonshire 660 0 Decrease
Corby 126 0 Decrease
East Northamptonshire 191 0 No change
Kettering 195 0 No change
Wellingborough 148 0 No change
West Northamptonshire 745 0 No change
Daventry 139 0 No change
Northampton 486 0 No change
South Northamptonshire 120 0 No change

This chart shows the trend in seven-day average cases recorded in education settings in the last 28 days for both staff and pupils.
In early June, weekly average cases were low, which was likely a result of school half term. However, in mid-June there was a rapid increase in the average case volume mostly among pupils, dropping off slightly at the beginning of week. In recent days, we see a further increase in case volumes amongst pupils and staff members.
These figures may increase further due to reporting delays.
The table shows the proportion of education settings having recorded at least one case over a four-week period. The proportion of schools with recent cases has increased since mid-May.
On 30th June 2021, 1 education setting was closed.
Education Status
Date range% of Education settings
recorded at least 1 case in the 4 week period
% of Education settings recorded no cases in the 4
week period
2 Jun to 30 Jun 2021 13% 87%
26 May to 23 Jun 2021 10% 90%
19 May to 16 Jun 2021 9% 91%
12 May to 9 Jun 2021 7% 93%
14
• The latest week’s figures are likely to increase further as data for the most recent days are subject to reporting delays.

The chart shows the local communities within Northamptonshire where COVID-19 infections over the last 28 days are highest.
Knowing the areas with the highest case numbers in the last 28 days help us to prioritise and focus our support locally.
Cases by Community – Last 28 Days
15

These graphics show what positive COVID-19 case numbers over the last 28 days would look like if each local community had the exact same size population (100,000).
The map illustrates the 28-day infection rate per 100,000 population across Northamptonshire.
Case Rates by Community – Last 28 Days per 100,000 population
16
• Please note that the numbers shown on this page represent the best possible estimate we can make from a wider range of numbers, because there is always a margin of error when calculating cases per 100,000 population – particularly where actual case numbers are small.

• Please note that the numbers shown on this page represent the best possible estimate we can make from a wider range of numbers, because there is always a margin of error when calculating cases per 100,000 population – particularly where actual case numbers are small.
If each community had the exact same size population (100,000) in Northamptonshire, this graphic shows how COVID-19 case numbers in the last 14 days would have changed in each community compared to the previous 14 days.
We have seen increases in case rates in all of our areas in Northamptonshire.
The 15 areas with the greatest increases in case rates are listed next to the map.
Areas with increases in rates of infection show us where we need to prioritise and focus our support locally.
Change in Case Rates by Community –Fortnightly per 100,000 population
17
Rank Name
1 Ringstead, Woodford & Stanwick (EN)
2 Oundle, Warmington & Titchmarsh (EN)
3 Cogenhoe, Hackleton & Denton (SN)
4 Irthlingborough (EN)
5 Finedon, Isham & Harrowden (Wboro)
6 Harpole, Kislingbury & Bugbrooke (SN)
7 Eastfield (Nton)
8 Boothville & Spinney Hill (Nton)
9 Daventry Central (Dav)
10 Woodforth Halse, Byfield & Staverton (Dav)
11 Kettering Avondale Grange (Kett)
12 King's Cliffe, Woodnewton & Easton (EN)
13 Towcester East & Paulerspury (SN)
14 Rothwell (Kett)
15 Stornton & Sixfields (Nton)

• Please note that this summary covers all situations classified as ‘active’. An active situation has had at least 1 positive case within the previous 28 days.• Outbreaks in Care home and Hospital/Healthcare settings will remain active for 14 days, if no activity noticed there are pended for next 14 days before closure.• Outbreaks in Workplace, Education, Childcare & other settings will remain active for 7 days, if no activity noticed there are pended for next 7 days before closure. • Compared to the previous week there has been an increase in the number of outbreaks linked to particular settings but it is important to note that the majority
of cases are due to community transmission.
In the last 28 days Corby Daventry East Northants Kettering Northampton South Northants Wellingborough Northants total Case total
Outbreaks 0 1 2 0 2 0 0 5 82
Care home/service 0 0 0 0 1 0 0 1 2
Childcare 0 0 0 0 0 0 0 0 0
Workplace 0 1 0 0 0 0 0 1 8
Education 0 0 2 0 1 0 0 3 72
Hospital/healthcare 0 0 0 0 0 0 0 0 0
Other 0 0 0 0 0 0 0 0 0
Two or more cases linked by place and time to that setting. Totals are 28 day counts for care homes and hospitals, and 14 day counts for all other locations.
Summary of Outbreaks to 28/06/2021
18
Source: PHE, Test & Trace, School Cell, Line lists from EHO's & Community IPC care home Cell

19
COVID-19: Keep Up to Date
• Listen: To BBC Radio Northampton’s interviews with Director of Public Health Lucy Wightman twice weekly: Tuesday at 08.10am and 4.10pm on Thursdays.
• Read: Northamptonshire’s Director of Public Health, Lucy Wightman’s weekly column in the Northampton Chronicle and Echo online and in the newspaper for the very latest insights and advice.
• Study: Our weekly surveillance reports on the North Northamptonshire and West Northamptonshire websites.
• Follow us: on
• www.twitter.com/NorthantsPH• www.facebook.com/@PublicHealthNorthants• Instagram @publichealthnorthamptonshire
• Tiktok @publichealthnorthants
19


