North West Leicestershire · Castle Donington (Ward) Demographics – Population Age structure...
14
Castle Donington (Ward) Demographics – Population Age structure Ethnic group Marital status Country of birth Religion Housing – Average House Price Number of Houses Housing tenure Housing Type Council tax band Page 1 of 14
Transcript of North West Leicestershire · Castle Donington (Ward) Demographics – Population Age structure...

Castle Donington (Ward)
Demographics –
Population Age structure Ethnic group Marital status Country of birth Religion
Housing –
Average House Price Number of Houses Housing tenure Housing Type Council tax band
Page 1 of 14

Crime –
Burglary, Assault Criminal damage, Theft (vehicle) Fires attended
Other –
Occupation groups Economically active / inactive General Health Qualifications and students Indices of deprivation
Sources -
Page 2 of 14
Demographics –
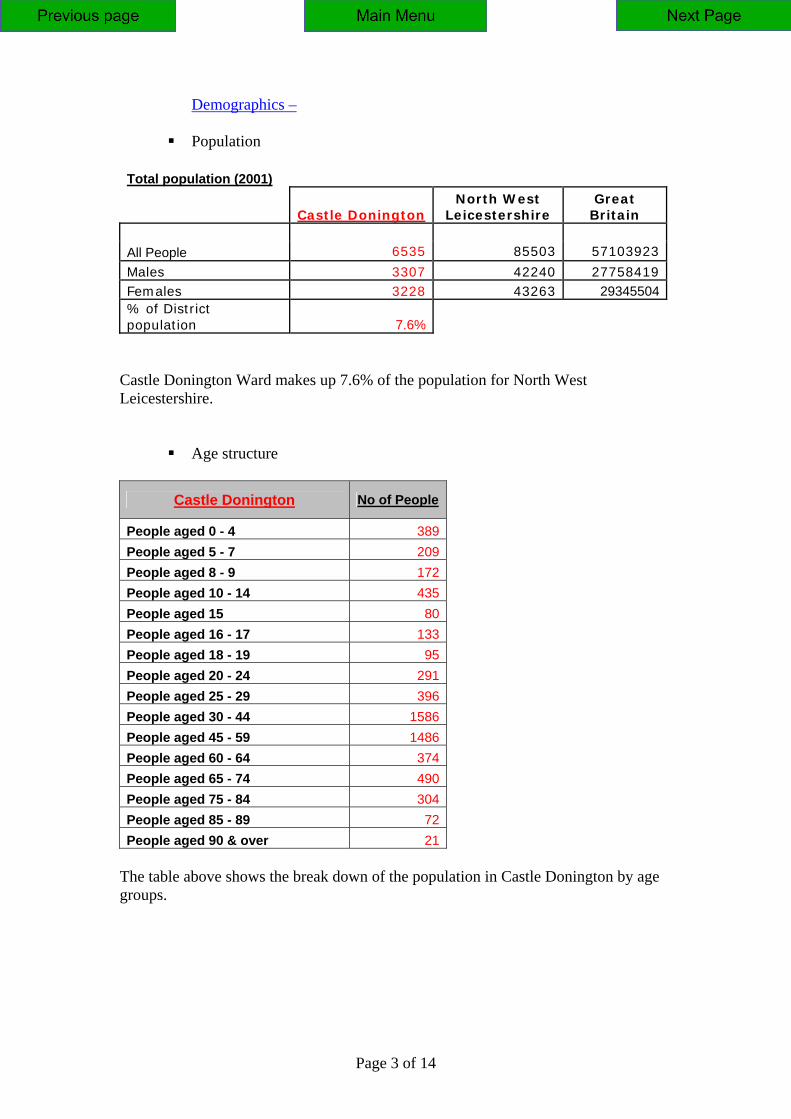
Population Total population (2001)
Castle Donington North West
Leicestershire Great Britain
All People 6535 85503 57103923
Males 3307 42240 27758419 Females 3228 43263 29345504% of District population 7.6%
Castle Donington Ward makes up 7.6% of the population for North West Leicestershire.
Age structure
Castle Donington No of People
People aged 0 - 4 389People aged 5 - 7 209People aged 8 - 9 172People aged 10 - 14 435People aged 15 80People aged 16 - 17 133People aged 18 - 19 95People aged 20 - 24 291People aged 25 - 29 396People aged 30 - 44 1586People aged 45 - 59 1486People aged 60 - 64 374People aged 65 - 74 490People aged 75 - 84 304People aged 85 - 89 72People aged 90 & over 21
The table above shows the break down of the population in Castle Donington by age groups.
Page 3 of 14

Age structure – The graph below looks at the age structure as a % and compares Castle Donington with that of North West Leicestershire.
5.95
3.2
2.63
6.66
1.22 2.
04
1.45
4.45
6.06
24.2
8
22.7
5
5.72
7.5
4.65
1.1
0.32
5.89
3.6
2.59
6.42
1.24 2.
29
1.95
4.77 5.
99
23.0
2
21.2
1
5.06
8.39
5.84
1.22
0.51
0
5
10
15
20
25
30
0 - 4 5 - 7 8 - 9 10 - 14 15 16 - 17 18 - 19 20 - 24 25 - 29 30 - 44 45 - 59 60 - 64 65 - 74 75 - 84 85 - 89 90 &over
Castle DoningtonNortn West Leicestershire
The graph shows which age groups are most predominant.
Ethnic Group The table below looks at the Ethnicity of the Ward compared to the region
Ethnic Group % Castle
Donington% North West Leicestershire % All People All White 98.64 98.77White: British 96.45 97.36White: Irish 1.18 0.54White: Other White 1.01 0.87All Mixed 0.63 0.5Mixed: White and Black Caribbean 0.15 0.19Mixed: White and Black African 0.09 0.05Mixed: White and Asian 0.14 0.15Mixed: Other Mixed 0.24 0.11All Asian 0.38 0.4Asian or Asian British: Indian 0.32 0.34Asian or Asian British: Pakistani 0 0.02Asian or Asian British: Bangladeshi 0 0Asian or Asian British: Other Asian 0.06 0.04All Black 0.05 0.54Black or Black British: Caribbean 0.05 0.5Black or Black British: African 0 0.03Black or Black British: Other Black 0 0.01All Chinese or other ethnic group 0.31 0.23Chinese or other ethnic group: Chinese 0.24 0.13Chinese or other ethnic group: Other ethnic group 0.06 0.1
Page 4 of 14

98.64
0.63
0.38
0.05
0.31
97.5
98
98.5
99
99.5
100
100.5
1
All Chinese or other ethnicgroup
All Black
All Asian
All Mixed
All White
The graph above looks the ethnic break down in population of the Ward, with white being most predominant at 98.54%.
Marital Status - %
Castle Donington% North West Leicestershire % England % Single (never married) 24.41 24.66 30.23Married 48.49 48.32 43.5Re-married 9.18 8.76 7.35Separated (but still legally married) 2.36 2.21 2.4Divorced 8.35 7.72 8.21Widowed 7.2 8.32 8.31
48.49% of people aged over 16 in Castle Donington are married compared to 43.5% nationally.
Country of birth - % Castle Donington % People born in England 92.22People born in Scotland 2.57People born in Wales 0.99People born in Northern Ireland 0.57People born in Republic of Ireland 0.93People born in other EU Countries 0.77People born elsewhere 1.94
Page 5 of 14

Religion
Castle Donington % England % Christian 76.72 71.74Buddhist 0.09 0.28Hindu 0 1.11Jewish 0.06 0.52Muslim 0.21 3.1Sikh 0.18 0.67Other religions 0.26 0.29No religion 16.5 14.59Religion not stated 5.97 7.69
The table looks at what religion people in Castle Donington are, if at all. As with England, the highest percent of people are Christian – 76.72%, with the next highest percent being people with no religion. Housing –
Average House Price Number of Houses
Castle Donington
Average House Price £147,547 Number of Households 2908
Housing tenure
Castle Donington Owner occupied 2076Housing Association / Council landlord 388 Private 226Other 79
75%
14%
8%3%
Owner occupied
Housing Association / Councillandlord
Private
Other
Page 6 of 14

Housing type
127541%
98932%
35912%
41814%
321% Detached
Semi-detached
Terraced
Flat / Apartment
Mobile or Temporary Structure
The graph above shows the type of housing in Castle Donington, the most common type is detached housing followed semi detached.
Council tax band Castle Donington % Council Tax Band; Band A 13.11Council Tax Band; Band B 35Council Tax Band; Band C 21.52Council Tax Band; Band D 14.52Council Tax Band; Band E 9.61Council Tax Band; Band F 4.02Council Tax Band; Band G 2.09Council Tax Band; Band H 0.14Council Tax Band; Band X 0
The table above shows the percentage of housing in Castle Donington broken into council bands; this gives a good indication as to the types and values of properties within the ward. (Council bands are divided by valuations done 10 year ago and do not reflect on actual values of properties)
Page 7 of 14
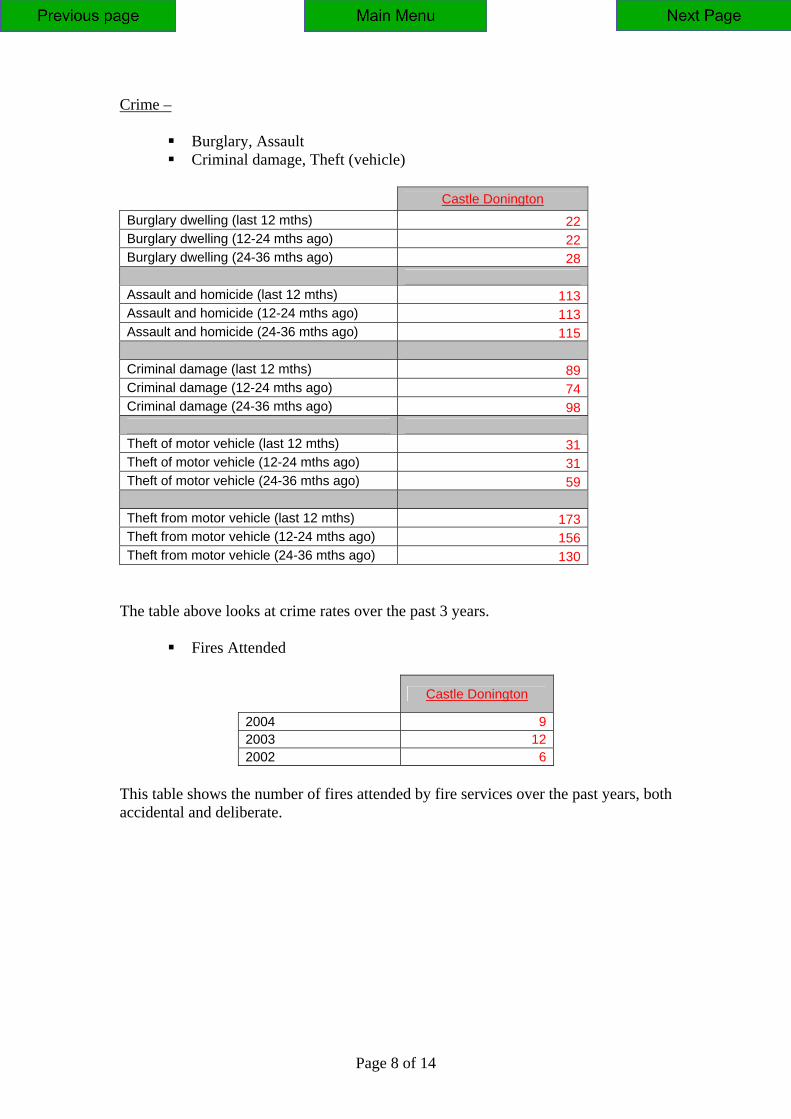
Crime – Burglary, Assault Criminal damage, Theft (vehicle)
Castle Donington Burglary dwelling (last 12 mths) 22 Burglary dwelling (12-24 mths ago) 22 Burglary dwelling (24-36 mths ago) 28 Assault and homicide (last 12 mths) 113 Assault and homicide (12-24 mths ago) 113 Assault and homicide (24-36 mths ago) 115 Criminal damage (last 12 mths) 89 Criminal damage (12-24 mths ago) 74 Criminal damage (24-36 mths ago) 98 Theft of motor vehicle (last 12 mths) 31 Theft of motor vehicle (12-24 mths ago) 31 Theft of motor vehicle (24-36 mths ago) 59 Theft from motor vehicle (last 12 mths) 173 Theft from motor vehicle (12-24 mths ago) 156 Theft from motor vehicle (24-36 mths ago) 130
The table above looks at crime rates over the past 3 years.
Fires Attended
Castle Donington
2004 92003 122002 6
This table shows the number of fires attended by fire services over the past years, both accidental and deliberate.
Page 8 of 14

Other –
Economically active / inactive
Castle Donington Castle Donington
North West Leicestershire
(numbers) (%) (%) Economically active 3405 81.5 80.4 In employment 3289 78.7 77.4 Employees 2901 69.4 68.1 Self employed 388 9.3 9.3 Unemployed 116 3.4 3.8
Castle Donington Castle Donington
North West Leicestershire
(numbers) (%) (%) Economically inactive 774 18.5 19.6 Retired 122 2.9 2.4 Student 99 2.4 3 Other 553 13.2 14.2
Occupation groups - %
Castle Donington % North West Leicestershire % Managers and senior officials 18.2 16.16Professional occupations 9 9.49Associate professional and technical occupations 14.1 11.54Administrative and secretarial occupations 13.5 11.19Skilled trades occupations 10.8 12.82Personal service occupations 6.3 6.61Sales and customer service occupations 6.9 6.56Process; plant and machine operatives 10.3 12.09Elementary occupations 10.9 13.55
Page 9 of 14

0
2
4
6
8
10
12
14
16
18
20
Managers andsenior officials
Professionaloccupations
Associateprofessionaland technicaloccupations
Administrativeand secretarial
occupations
Skilled tradesoccupations
Personalservice
occupations
Sales andcustomerservice
occupations
Process; plantand machineoperatives
Elementaryoccupations
Castle Donington %North West Leicestershire %
The table and graph show the occupations of residents in Castle Donington compared to that of the district.
Qualifications and students
Castle
Donington North West
Leicestershire All people aged 16-74 (count) 4851 62158No qualifications 28.2 33.2Highest qualification attained level 1 17.75 17.98Highest qualification attained level 2 19.42 17.9Highest qualification attained level 3 7.32 6.68Highest qualification attained level 4 / 5 19.07 16.22Other qualifications / level unknown 8.25 8.02Number of full-time students and schoolchildren: Aged 16-17 (count) 105 1461Number of full-time students and schoolchildren: Aged 18-74 (count) 86 1271
The highest percent of people in Castle Donington have no qualifications.
• General Health
Castle Donington Castle Donington
% North West
Leicestershire
All People (Persons) 6533 100.0 85503 / 100%
Good Health (Persons) 4520 69.2 57600 / 67%
Fairly Good Health (Persons) 1506 23.1 20372 / 24%
Not Good Health (Persons) 507 7.8 7531 / 9%
Page 10 of 14

Indices of deprivation
Indices of Deprivation 2004 Key Findings in North West Leicestershire
(http://www.leicestershire.gov.uk/indices_of_deprivation_2004_north_west_leicestershire.pdf)
Page 11 of 14

ODPM Indices of Deprivation 2004 – North West Leicestershire Report produced by Leicestershire County Council Research & Information Team
- 28 -
APPENDIX 1 The table below shows each Super Output Area in the district, the ward in which it is located along with the ranking within England (where a ranking of 1 = most deprived in England, 32,482 = least deprived in England). For ease of use, any area ranked within the 20% most deprived in England (ranked between 1 and 6,496) has been shaded.
SOA Ward IMD Income Employment Health Education BarriersLiving
Env Crime IDAC IDAOP E01025913 Appleby 22,723 29,027 23,421 20,115 24,718 10,428 25,927 5,752 30,782 25,210 E01025914 Ashby Castle 28,673 31,966 29,158 25,048 29,528 5,033 31,110 24,842 31,740 29,342 E01025915 Ashby Castle 27,232 27,863 28,959 25,170 27,198 20,146 21,862 8,298 30,339 21,174 E01025916 Ashby Holywell 26,246 27,995 27,071 21,431 21,455 26,514 24,056 8,162 30,500 20,083 E01025917 Ashby Holywell 25,321 25,497 27,327 24,207 20,602 13,228 25,072 12,364 25,801 18,161 E01025918 Ashby Holywell 14,667 10,300 11,504 11,084 15,787 21,061 29,721 17,352 9,722 13,036 E01025919 Ashby Ivanhoe 18,616 17,781 16,285 13,500 15,888 17,728 26,760 16,398 20,145 14,775 E01025920 Ashby Ivanhoe 14,957 11,925 13,967 12,272 11,251 29,540 22,123 12,343 10,735 17,944 E01025921 Ashby Ivanhoe 25,319 26,275 25,087 19,467 21,716 19,504 29,433 10,371 26,849 23,985 E01025922 Bardon 24,435 26,977 26,737 24,753 16,293 12,460 27,177 10,818 29,637 17,321 E01025923 Breedon 20,487 23,703 25,947 21,684 23,623 9,308 24,741 3,209 25,092 19,108 E01025924 Breedon 22,630 23,361 21,533 22,670 25,407 10,628 14,103 17,226 24,273 20,404 E01025925 Castle Donington 17,501 17,497 15,707 18,484 18,973 12,749 14,416 13,781 21,554 12,488 E01025926 Castle Donington 23,476 23,129 24,041 23,807 19,000 22,665 24,910 7,053 22,689 24,580 E01025927 Castle Donington 12,290 12,951 11,214 12,989 8,135 18,760 25,848 5,957 11,689 22,368 E01025928 Castle Donington 28,751 29,566 25,727 23,415 23,191 27,953 29,612 12,818 28,009 27,441 E01025929 Coalville 14,927 18,151 15,750 12,606 7,879 28,136 14,232 8,597 21,070 18,123 E01025930 Coalville 8,683 12,801 9,324 10,188 5,022 29,861 9,517 1,650 16,497 9,549 E01025931 Coalville 11,319 13,955 12,171 13,013 5,787 27,629 11,628 4,790 15,272 15,231 E01025932 Greenhill 4,037 4,105 4,748 6,291 263 22,797 20,466 6,093 3,533 12,464 E01025933 Greenhill 13,750 13,841 13,936 15,126 5,342 17,187 26,997 12,035 14,286 17,589 E01025934 Greenhill 3,594 2,633 2,535 5,822 4,672 7,283 21,379 4,668 1,564 15,734 E01025935 Greenhill 23,407 27,301 18,074 22,635 20,750 29,337 30,807 5,350 23,701 30,986 E01025936 Greenhill 16,828 13,285 17,090 16,758 9,776 26,480 21,239 15,357 11,934 14,067 E01025937 Hugglescote 21,247 23,253 17,303 16,268 14,153 29,907 20,007 16,181 25,842 18,627 E01025938 Hugglescote 18,206 17,725 20,287 14,286 10,051 13,249 29,959 16,989 18,790 11,264 E01025939 Hugglescote 14,148 14,691 16,351 15,046 5,682 13,169 16,250 18,438 15,887 13,023
Continued on next page
cbryant
Highlight
cbryant
Highlight
Sources
Office of National Statistics Office of deputy prime minister Department of health Department of work and pensions Communities and Local government Land registry Home office Community health profile NOMIS DFES statistics Department for education and skills LSORA Local government performance North West Leicestershire Leicestershire county council
Page 13 of 14

Page 14 of 14