NORTH-SOUTH TRADE AGREEMENTS AND THE QUALITY OF ... · prehensive rules, which go way beyond tari...
55
Fakultät/ Zentrum/ Projekt XY Institut/ Fachgebiet YZ 27-2018 wiso.uni-hohenheim.de Research Area INEPA Hohenheim Discussion Papers in Business, Economics and Social Sciences NORTH-SOUTH TRADE AGREEMENTS AND THE QUALITY OF INSTITUTIONS: PANEL DATA EVIDENCE Sophie Therese Schneider University of Hohenheim
Transcript of NORTH-SOUTH TRADE AGREEMENTS AND THE QUALITY OF ... · prehensive rules, which go way beyond tari...

Fakultät/ Zentrum/ Projekt XYInstitut/ Fachgebiet YZ
27-2018
wiso.uni-hohenheim.de
Research Area INEPA
Hohenheim Discussion Papers in Business, Economics and Social Sciences
NORTH-SOUTH TRADE AGREEMENTS AND THE QUALITY OF INSTITUTIONS: PANEL DATA EVIDENCE
Sophie Therese SchneiderUniversity of Hohenheim

Discussion Paper 27-2018
North-South Trade Agreements and the Quality of Institutions: Panel Data Evidence
Sophie Therese Schneider
Research Area “INEPA – Inequality and Economic Policy Analysis”
Download this Discussion Paper from our homepage:
https://wiso.uni-hohenheim.de/papers
ISSN 2364-2084
Die Hohenheim Discussion Papers in Business, Economics and Social Sciences dienen der
schnellen Verbreitung von Forschungsarbeiten der Fakultät Wirtschafts- und Sozialwissenschaften. Die Beiträge liegen in alleiniger Verantwortung der Autoren und stellen nicht notwendigerweise die
Meinung der Fakultät Wirtschafts- und Sozialwissenschaften dar.
Hohenheim Discussion Papers in Business, Economics and Social Sciences are intended to make results of the Faculty of Business, Economics and Social Sciences research available to the public in
order to encourage scientific discussion and suggestions for revisions. The authors are solely responsible for the contents which do not necessarily represent the opinion of the Faculty of Business,
Economics and Social Sciences.
North-South Trade Agreements and the Quality of
Institutions: Panel Data Evidence∗
Sophie Therese Schneider†
University of Hohenheim
November 20, 2018
Abstract
Since 1990, not only the number of signed preferential trade agreements
(PTAs) has increased, but also their depth. That means, PTAs include com-
prehensive rules, which go way beyond tariff reductions, such as property
rights, competition or investment provisions. This paper argues that espe-
cially in North-South agreements there is a diffusion of institutional quality
from developed to developing countries. First, a PTA may affect institutions
because it can serve as a network for political exchange and second, the reg-
ulations and commitments stipulated in it may affect local institutions in the
South. I empirically investigate if there are positive effects of being a member
in a PTA on the quality of institutions in developing countries by accounting
for the number and the depth of PTAs using the Design of Trade Agreements
(DESTA) database, established by Dur, Baccini and Elsig (2014). I create a
large panel data set covering 32 years to account for endogeneity of several
controls. The results support the hypothesis that deep PTAs lead to an im-
proved quality of institutions in the South. The results differ with respect to
the type of agreement and region.
Keywords: Deep trade agreements, institutions, panel data
JEL Classification Codes: F13, F14, C23, C26
∗I would like to thank my supervisor Benjamin Jung, Matthias Busse, Julian Hinz, KonstantinWacker, Yannick Lucotte, Davud Rostam-Afschar, Henning Muhlen and Jonas Frank for help-ful suggestions and discussions and the participants of the Gottingen Workshop ”InternationaleWirtschaftsbeziehungen”,the ETSG 2016 in Helsinki, the 3rd Witten Conference on InstitutionalChange in Witten, the THE Workshop 2017 at the University of Hohenheim and the Brown BagSeminar at the University of Hohenheim for useful comments.
†University of Hohenheim (520E), Institute of Economics, Schloss Hohenheim 1C, 70599Stuttgart, Germany. Email: [email protected]

1 Introduction
Since the early 1990s, a surge in the number of preferential trade agreements (PTAs)1,
signed per year, can be observed. While there were 161 PTAs signed until 1990, the
cumulative number of trade agreements increased to 621 agreements in 2015. Figure
1 shows the cumulative number of PTAs which have been signed since 1948 until
2015 by stance of development of the trading partners involved, i.e. between de-
veloped countries, North-North (N-N), between developing countries, South-South
(S-S), and between developed and developing countries, North-South (N-S). The
overall number has risen but especially N-S trade agreements (long-dashed line),
and S-S trade agreements (short-dashed line) show the largest increases.
Figure 1: Number of signed trade agreements by region
0
100
200
300
400
Cum
ulat
ive
num
ber o
f PTA
s
1945 1955 1965 1975 1985 1995 2005 2015
Years
NorthNorth NorthSouthSouthSouth
Source: Author's calculations based on DESTA database.
What is the motive to enter a PTA? In the first place, regional integration happens
due to economic reasons. Gaining market access is the traditional motive, as for
example stated by Hillman and Moser (1996). In accordance to this, since the es-
tablishment of the General Agreement on Tariffs and Trade (GATT), which later
became the World Trade Organization (WTO), tariffs have been decreasing on a
multilateral level so that even developing countries enjoy tariff-free market access to
important markets. Zero most-favored-nation (MFN) tariffs have lead to increased
trade by developing countries (United Nations, 2013). On average, developed coun-
tries have lower levels than developing countries. But the latest WTO round of
1In this paper, PTAs are referred to all types of preferential trade agreements, including regionaltrade agreements.
1

negotiations, the Doha Round, which has started in 2001, has come to a halt, while
regional integration continues to accelerate (Limao, 2016).
It seems that market access plays a more important role in symmetric agreements,
that is in N-N and S-S relations. This can also be seen in the actual debate be-
tween the US and the EU and the US-President’s threat to increase tariffs on EU
products to gain more favorable trade terms. Freund (2004) argues that countries
with similar cost structures are likely to require reciprocal trade liberalization to be
self-enforcing. This is less the case in N-S trade agreements. She finds empirical
evidence that reciprocity is important in symmetric trade agreements while there
is only modified reciprocity in N-S trade agreements. North countries, in general,
gain more market access compared to developing countries.2 At the same time, de-
veloping countries already have good market access generated by the ”Everything
but Arms” (EBA) provision by the EU or the Generalized System of Preferences
(GSP), where developing and least developed countries are provided additional tariff
concessions, which do not fall within the scope of the most favored nation (MFN)
principle. So this cannot explain the ongoing increase in signature rates of PTAs.
Besides the increase in the number of trade agreements, it can be observed that the
newly signed PTAs tend to include a broader set of provisions, which go beyond at-
the-border rules, like the reduction of tariffs, export subsidies or taxes and beyond
WTO rules. There are ”WTO+” rules, which expand or deepen existing WTO
rules and countries define beyond-market-access commitments in areas, which do not
directly affect trade flows, such as intellectual property rights, competition policy,
anti-corruption and human rights, public administration, innovation policies, data
protection and statistics and industrial cooperation (World Trade Organization,
2016, p. 129).
These commitments are behind-the-border rules and affect domestic policies. The
more provisions are defined, which go beyond at the border rules, the deeper are
the agreements. In other words, the depth of an agreement indicates the extend
of the commitments, which the member states have bargained on. The more rules
are specified in different areas of an agreement and the more those rules regulate
the cooperation between the member states, the deeper is this agreement. Figure 2
shows the development of the mean depth of all signed trade agreements where data
on depth is available. This measure is calculated on the basis of an additive index
created by Dur, Baccini, and Elsig (2014), adding up the key provisions, which
can be included in a PTA. One point is added if a PTA is more than a partial
2A ten percent reduction of a tariff in a developing country leads to a tariff reduction in thedeveloped country of only 2 percent (Freund, 2004).
2

Figure 2: Depth of trade agreements over time
0
1
2
3
4
5
6
7
Dep
th in
dex
(two-
year
ave
rage
s)
1950 1960 1970 1980 1990 2000 2010
Years
Mean depth index of all agreements where depth index is available. For the whole period in total 618agreements are included.Source: Author's calculation using DESTA database.
scope agreement or if it includes substantive provisions in one of the six areas: (1)
services, (2) investments, (3) standards, (4) public procurement, (5) competition
and (6) intellectual property rights. The index can range from 0 (when a PTA is
only a partial scope agreement and does not include any provisions in one of the
above areas) to 7 (for PTAs, which are more than a partial scope agreement and
includes substantive provisions in all areas). A substantive provision is a definite
regulation in one of the areas, while for example the desire to start trading in the
services area is not treated as a substantive provision. So, while there has been a
sideways movement to a higher number of PTAs there is a parallel movement to an
increase in depth starting only slightly earlier in the mid 1980s.
The increased depth of PTAs provides additional motives for the formation of PTAs.
One motive for developing countries, is that trade agreements have become an instru-
ment to promote development. They intend to implement domestic reforms, which
go beyond trade liberalization and import higher policy standards to foster growth.
Schiff and Winters (1998) argue that developing countries might use PTAs to lock
in policies because there is a higher credibility of enforcement in those agreements.
Developing countries may chose a partner, who helps them to credibly promote
policy agendas, accompanied by financial and knowledge transfers. Compared to
multilateral agreements, PTAs offer less coordination effort and a targeted choice of
a partner. Levy (2009) investigates the function of a PTA to increase a country’s
commitment to better governance by having a particular look at the United States-
Peru Free Trade Agreement. Peru has gone through a period of very poor political
3

and economic management and thus has an urgent motive to achieve credibility in
pursuing better policies and reforms. He finds that Peru was preferably interested
in locking in policies instead of gaining market access, since it already had virtu-
ally free market access to the US. Interviews with Peruvian officials, academics and
businessmen showed clearly that the agreement was expected to have a significant
improvement on the rule of law and a better investment environment. This case
study suggests that countries from the South sign PTAs with the North to promote
the international attractiveness as well as domestic and foreign investment.
Also countries from the North aim at promoting the development process in coun-
tries from the South (Limao, 2016, p.50). They intend to improve institutions and
governance in developing countries because the legal system in those countries is
poor and often there are no secured property and human rights, missing democratic
structures and courts, while political leaders are corrupt. Many RTAs contain reg-
ulations on pro-competitive practices, transparency, stronger anti-corruption and
intellectual property rights, movement of capital and labor and investment. The
North American Free Trade Agreement (NAFTA), for example, represents a very
broad and far-reaching agreement with a depth index of 7. Besides chapters on trade
in goods and technical barriers to trade, it contains chapters on investment, services,
administrative and institutional provisions and intellectual property. Article 1110
of the investment chapter, for instance, interdicts expropriation of any investment
of any party and regulates exceptions and compensations. The Cotonou Agreement
on the other hand remains more general and only has a depth index of 1. It focuses
on the aim to gradually remove all trade barriers, cooperate politically and promote
dialog and poverty reduction without a concrete schedule. Article 17(2), for exam-
ple, states that the agreement commits to the promotion of democratic processes
through dialogue and consultation and to promote institutional reform. Still, this
shows that PTAs now also serve as a promoter of institutions and political change.
The intention of this paper is to analyze whether trade agreements between North
and South do affect the quality of institutions in the South. First, I argue that
the membership in a PTA, without considering the depth, may improve institutions
in the South because PTAs can serve as a platform where politicians can discuss
policies and and interchange political experience and skills. Often political leaders
in a developing country lack experience and skills when they come into position
(Afegbua & Adejuwon, 2012). Especially African countries lack competent leaders
(Adeyemi, 2017). One reason might be that patrimonialism is persistent (Acemoglu
& Robinson, 2010) and new political leaders lack a previous political career. The
exchange of knowledge is especially intensive in the period when the agreement is
4

negotiated, so already before it is actually signed and an effect should be seen in the
period afterwards. Second, the deeper the agreement, the higher the improvement
in institutional quality. That means, rules as, for example, defined in the investment
chapter of NAFTA, might positively affect the institutional quality in the South.
These rules compensate for missing institutions in the developing country, which are
standard in the North.
In the literature, institutions play a prominent role in explaining economic perfor-
mance and growth (Acemoglu, Johnson, & Robinson, 2001, 2005; La Porta, Lopez-
De-Silanes, Shleifer, & Vishny, 1997; Rodrik, 2007) or trade pattern (Anderson
& Marcouiller, 2002; Berkowitz, Moenius, & Pistor, 2006; de Groot, Henry L. F.,
Linders, Rietveld, & Subramanian, 2004; Nunn, 2007). Thus it is important to de-
termine the factors of good institutions. The research on drivers of institutional
change is growing. There are studies focusing on political factors of institutional
change, such as free media (Brunetti & Weder, 2003; Norris, 2008) or foreign aid
(Ear, 2007; Knack, 2004; Tavares, 2003) and on economic factors like trade (Busse,
Borrmann, Fischer, & Groning, 2007; Islam & Montenegro, 2002; Levchenko, 2013)
or FDI (Larrain & Tavares, 2004; Pinto & Zhu, 2016). Most of those studies use
cross-sectional data. The paper most closely related to the present analysis is Busse
et al. (2007). They also investigate the effect of trade agreements on institutions
but focus on the effects of NAFTA on Mexico and of the EU accession on the ac-
cessing countries, while I work with a comprehensive country sample. Furthermore
they model the agreements as a single dummy variable, while the depth of the trade
agreements plays a central role in my analysis.
For the analysis, I utilize the data set on ”the design of trade agreements” (DESTA)
by Dur et al. (2014) for measures relating to PTAs and the International Country
Risk Guide (ICRG) to measure institutional quality. I create a data set including
PTAs between North and South and concentrate on the effects on the institutional
quality in the developing country. The use of a comprehensive data set allows for
more general conclusions. Furthermore, I work with a panel data set covering a
period of 32 years. The time dimension is useful in an econometric sense to correct
for endogeneity and the long period of time includes more changes in the institutional
quality, which only slowly develop. For the main explanatory variables I include the
number of signed PTAs and the depth for each developing country and period.
I find that depth is an important driver, which positively affects institutional qual-
ity. However, the results differ with respect to the type of agreement and regions
included.
As the literature on institutions suggests, institutions play an important role for
5

development and thus the analysis of factors of change in institutions may provide
important insides for politicians of developing countries or developed countries who
promote development abroad or for international organizations.
The rest of the paper proceeds as follows. The next chapter summarizes the related
literature on the factors of change in institutional quality and outlines related work
on learning and the diffusion of knowledge and political reform. The third chap-
ter presents the estimation framework, the data used for the estimation, and the
discussion of results. The final chapter concludes.
2 Related Literature
The related empirical literature on the factors of change in institutions sheds light on
important control variables to be included in the empirical analysis. Furthermore,
the literature on learning provides an intuition why PTAs are a suitable instrument
to transfer knowledge and experience.
An important part of the related literature reveals the critical factors of institutional
quality, which need to be included in the empirical analysis. It can be seen that
most of the related empirical literature uses cross-sectional data. Factors of change
can broadly be divided into political, social, geographic and economic factors. One
strand of the cross-sectional literature relate the initial conditions of a country to
its subsequent level of institutional quality. These studies explain why institutions
in some countries are well-developed, while in other countries institutions are weak.
Acemoglu et al. (2001), for example, use settler mortality rates and other controls
(latitude, climate, religion and natural resources) to explain the level of current in-
stitutional quality. European colonialism is also linked to differences in institutional
quality by referring to the associated legal system. La Porta et al. (1997), Straub
(2000) and Chong and Zanforlin (2000) analyze the effects of different legal origins
on the quality of institutions and find that inferior institutions are developed in
countries with a French legal origin, where the government is much more interven-
tionist and investor protection is weakest. La Porta, Lopez-De-Silanes, Shleifer, and
Vishny (1999) also show that ethnic heterogeneity is related to poor institutions.
However, these factors do not explain how institutions change over time and thus are
inappropriate for the empirical analysis over time. Important drivers of institutional
quality, which include a time dimension are mainly political and economic ones. The
freedom of the press as, for example, revealed by Norris (2008) and Brunetti and
Weder (2003), is an important political driver. Foreign aid is also analyzed as a
factor of change in a number of papers but its effect is inconclusive. While Tavares
6

(2003) results indicate that foreign aid has a positive effect on corruption, meaning
a reduction of corruption, Knack (2001), Ear (2007) and Djankov, Montalvo, and
Reynal-Querol (2008) find a negative effect of aid on different measures of institu-
tions, including corruption. With respect to economic determinants, empirical work
focuses on openness and FDI, which are often related to corruption. The effects
of FDI on institutions do not show clear results. Larrain and Tavares (2004) and
Okada and Samreth (2012) study the effects of FDI on corruption and show that
FDI reduces corruption, while Pinto and Zhu (2016) also account for the develop-
ment level of host countries, which reveals that FDI increases corruption in least
developed countries while there are no effects resulting from FDI in all remaining
countries. Ades and Di Tella (1999) and Wei (2000) show that more open economies
tend to have lower corruption levels due to higher competition. Busse et al. (2007);
Giavazzi and Tabellini (2005); Islam and Montenegro (2002); Rigobon and Rodrik
(2005) find a positive and significant effect of openness on different measures of in-
stitutions. But Knack and Azfar (2003) show that the results for openness are very
sensitive to the choice and number of countries. For data sets including more coun-
tries than those used by other authors the effect of openness is no longer present. In
all studies, income and population size represent essential further control variables
for institutional quality, which change over time. Busse et al. (2007), Gassebner,
Gaston, and Lamla (2011) and Quazi and Alam (2015) add to the literature by in-
cluding the time dimension in their empirical work. These panel studies add human
capital and political freedom as further controls, which change over time.
Another part of the related literature focuses on the diffusion of knowledge and poli-
cies between economies and provides intuition for the link between trade agreements
and institutional reform. First, it is stated, for example, by Islam and Montenegro
(2002) that policies can diffuse from one country to another, especially when coun-
tries trade with each other. They argue that the risk that arises from trading with
unknown partners increases the incentive to improve domestic institutions as domes-
tic and foreign firms demand for reform. Then, open economies learn from trading
partners where successful and effective institutions are implemented. Second, Sim-
mons, Dobbin, and Garrett (2006) explain this process of learning by the theory of
Bayesian updating and outline the factors, which play a role for successful trans-
mission of knowledge or reform. They explain that learning from other economies
is based on the successful outcome of policies abroad, which is then transferred to
the domestic country. The success of this transmission depends on the availabil-
ity of information on the outcome and the expertise and experience to evaluate
the information. The diffusion of policies is more effective, the closer countries are
7

linked to each other so that a better communication is possible. By signing trade
agreements, countries intensify their relationship and facilitate communication for
a better exchange of knowledge.
Empirical evidence for the diffusion of reforms is provided by Gassebner et al. (2011),
who study whether implemented economic reforms in one country affect the reforms
in other countries. They find empirical support for reform spillovers and further-
more, find that trade itself is not promoting diffusion of political reform while cul-
tural and geographic proximity are important drivers. The positive effect of spacial
proximity for learning is supported by the results of Mancusi (2008) who analyzes
the effect of knowledge spillovers on innovation on a sectoral level. She finds evi-
dence that knowledge spillovers are fostered due to technical and spacial proximity
between source and recipient. These results show that spatial proximity promotes
the ability of spillovers and supports the argument that trade agreements promote
these effects. PTAs can serve as a communication network where information and
knowledge is exchanged. When countries negotiate on a PTA, spatial proximity is
reduced and knowledge exchange is possible.
3 Empirical Analysis
3.1 Data
The purpose of this study is to analyze the impact of trade agreements between
North and South on the quality of institutions in the South over the period of 1984
until 2015. To account for the effects of the sole membership in a PTA I introduce the
number of PTAs, signed by a country from the South.3 To capture the effects of the
depth of PTAs, I use the additive index from DESTA, which measures the amount
and extent of commitments included in a PTA. As noted above, there are important
other determinants of the quality of institutions, which I include as further controls.
For the choice of controls, I refer to the related literature on the determinants of
institutional change with a focus on those determinants, which change over time.
These controls include income, population, education, freedom of the press and the
presence of conflicts.
3In the Appendix, I include a list of all North and South countries, as well as a description ofall variables and sources.
8

3.1.1 Dependent Variable
The measure for the quality of institutions comes from the International Country
Risk Guide (ICRG) database. There are further available measures for institutions,
like the World Governance Indicators (WGIs) by the World Bank or the Economic
Freedom of the World (EFW) Index by the Fraser Institute. But the ICRG data set
is the most comprehensive data set covering 141 countries and starting in the year
1984. It includes the largest number of observations without gaps.
Table 1: Political Risk Components
Component Points (max.)
Government Stability 12
Socioeconomic Conditions 12
Investment Profile 12
Internal Conflict 12
External Conflict 12
Corruption 6
Military in Politics 6
Religious Tensions 6
Law and Order 6
Ethnic Tensions 6
Democratic Accountability 6
Bureaucracy Quality 4
Total 100
The ICRG data set measures the risk of a country in three categories, political,
financial and economic risk. Each category consists of components, which are added
together to an index for each category and finally to an overall risk rating for each
country. To achieve consistency of the rating between countries and over time, a
number of basic questions are predefined to create the index. All categories consist of
several components, which have a minimum value of zero, indicating the highest risk
and the maximum value indicating the lowest potential risk. The maximum values,
varying from 4 to 12, represent the importance with respect to the overall risk,
measured for each category. Table 1 lists the 12 components of the Political Risk
rating and its maximum points, adding up to a total score of 100 points. While
”Bureaucracy Quality” for example is assessed least important with 4 maximum
points, ”Government Stability”, ”Socioeconomic Conditions”, ”Investment Profile”,
9

”External Conflict” and ”Internal Conflict” are considered most important with a
maximum of 12 points, when assessing the overall risk.
In this analysis the Political Risk component ”Investment Profile” is used to measure
the institutional quality. It accounts for institutional aspects, which are particularly
important with regard to trade or foreign direct investment and consequently are
expected to be affected by trade agreements and their contents. It measures the
general risk to investment and is composed of three sub-components. One compo-
nent is ”Contract Viability/Expropriation”, which quantifies the potential risk that
any contracts are modified or completely canceled or the risk that foreign owned
assets are expropriated. This reflects an important risk for exporting firms, having
contracts with foreign firms or for investors, investing in foreign countries. An-
other component measures ”Profits Repatriation”. This component assesses how
well profits can be transferred out of the host country and thus also evaluates the
bureaucratic efficiency, the banking system and exchange controls, all of which are
aspects, trading firms and foreign investors have to deal with. The third component,
measures ”Payment Delays”, which is also affected by a poor banking system and an
inefficient bureaucratic system. In addition, this component assesses other factors,
which influence delays in payments, like foreign exchange position and formal and
informal government policies or motivations. The overall component sums up over
the sub-components and has a maximum score of 12 points.
3.1.2 Data on Trade Agreements
For measures related to trade agreements, i.e. for the number of PTAs signed and
their depth, the DESTA database Dur et al. (2014) is used. The data set not
only provides a comprehensive list of trade agreements, but also includes detailed
information on various characteristics of each agreement, especially on the scope
of the specified provisions, (i.e. the depth of an agreement). In the most recently
available data set, a total number of 810 trade agreements are listed in DESTA
over a period between 1948 and 2015. Detailed information on the depth of trade
agreements and other information like the type of agreement in terms of integration
level, membership (i.e. bilateral, plurilateral, plurilateral-bilateral, etc.), number
of member states, regional dummies, and information on the language is available
for 618 PTAs. Furthermore, for each PTA, all member states are listed, which is
required to get country-level data. To create a variable that counts the number of
signed PTAs for each country and year, the data was transformed accordingly. In
a next step, for each country the cumulative sum of signed agreements in each year
was calculated. There are some countries, who have already signed PTAs before the
10

first period, which is covered in this analysis. So not all countries start with zero
PTAs.
Figure 3: Number of PTAs signed on average by a country from differentregions between 1948 until 2015
0
10
20
30
40
50
60
70
80
Mea
n nu
mbe
r of s
igne
d PT
As
North SSA South
Source: Authors calculations using DESTA database
Mean number of PTAssigned since 1948
Mean number of PTAssigned in 1990 and later
Mean number of N-S PTAssigned since 1948
Figure 3 shows the number of PTAs, countries with a different status of development
or from different regions (North, South or SSA) have signed on average (1) over the
whole period included in the DESTA data set, which means since 1948 (dark blue
bar), (2) since 1990, the period when the overall signature rates of trade agreements
increases (light blue bar), and (3) all PTAs, signed only between North and South
(N-S) since 1948 (mid blue bar). South includes all countries from the South exclud-
ing countries from Sub-Sahara Africa (SSA). SSA plays a specific role as it performs
poorly in economic and political development compared to other developing coun-
tries. Its role is discussed in more detail in chapter 3.3. It can be observed that, on
average, countries from the North sign most PTAs compared to countries from the
South and that Sub-Sahara African countries on average sign less PTAs than other
developing countries. Furthermore, the figure shows that for North and South most
of the PTAs were signed since 1990. Only for SSA this trend is not identifiable.
For a developing country (excluding SSA), about half of the signed PTAs is with a
country from the North. This reveals that N-S PTAs depict a substantial part of
PTAs for the South.
11

For the depth of a PTA, the additive depth index from DESTA is used.4 The
index consists of seven subordinate variables, which take values of either zero or
one. The first variable takes the value one, if the agreement is more than a partial
scope, i.e. if the agreement is a full free trade agreement and zero otherwise. The
other six variables indicate whether the agreements contain substantive provisions
in the areas (1) services, (2) investments, (3) standards, (4) public procurement, (5)
competition and (6) intellectual property rights by a value of one or zero if this is
not the case. So if an agreement includes substantive provisions in all areas and
foresees the elimination of all tariffs, the value for the depth index adds up to seven.
Since there are many countries, which have signed several PTAs per year, the mean
of the depth index is calculated for each year.
Figure 4: Mean Depth by region over all PTAs included in DESTA (since1948) and over all PTAs signed since 1990
0
1
2
3
4
5
6
7
Dep
th In
dex
(DES
TA)
North SSA South
Source: Authors calculations using DESTA database
Mean Depth of PTAssigned since 1948
Mean Depth of PTAssinged in 1990 and later
Mean Depth of N-S PTAssinged since 1948
Figure 4 shows, again for North, South and SSA, the mean depth of signed PTAs
since 1948 (dark blue bar), since 1990 (light blue bar) and of N-S PTAs since 1948
(mid blue bar). It reflects that, on average, PTAs signed after 1990 are deeper
compared to all PTAs signed since 1948. But this is only the case for North and
4DESTA also provides a second measure of depth, using a latent trait analysis, which wasconducted for binary data. As in the following analysis binary data is not used, the additive indexis applied as a measure of depth
12

South but not for countries in SSA. Furthermore, N-S PTAs are, on average, deeper
compared to other PTAs. Especially, when looking a countries from the South,
agreements signed with the North are distinctly deeper, with an average index of
almost 4, than the average depth index of all agreements signed since 1948, which
takes a value slightly above 2. This suggests that potential effects of deep trade
agreements are expected to be present especially in N-S PTAs.
3.1.3 Further controls
Further explanatory variables are the number of armed conflicts, freedom of the
press, income, population, inflation and education. These controls are relevant in
this context and have been investigated in related empirical studies.
Conflicts are expected to affect institutions negatively. To measure conflicts, the
UCDP Monadic Conflict Onset and Incidence data set from the Uppsala Conflict
Data Program (UCDP) and the Study of Civil War at the International Peace Re-
search Institute in Oslo (PRIO) is used. This data set is a country-year version of
the UCDP/PRIO Armed Conflict data set v.4-2014, which is structured for a quan-
titative analysis. For this analysis, I use a variable, which measures the incidence of
at least one active intrastate conflict as a dummy for each country-year. Intra-state
conflicts refer to all conflicts between a government and a non-governmental party
without intervention from other countries, which result in no less then 25 battle-
related deaths per year.
Data on the press freedom is taken from Freedom House. It measures the degree of
press freedom in three categories, i.e. no press freedom (taking the value 0), partly
free (taking the value 1) or completely free (taking the value 2). I expect that a
higher press freedom positively affects the level of institutional quality as it can
reveal bad institutions and inform the public about missing rules or the violation of
rules and how institutions can be improved.
For income, education and population, I use data from the World Bank. Income
is measured as the log of GDP per capita in current US dollars. Data is available
for the period between 1960 and 2015 for 217 countries (World Bank, 2016). For
income, I expect a positive effect on institutions as with a higher available income,
people demand better institutions, and at the same time, more financial resources
are available to build them up.
Population is measured by the size of a country, which I measure as the total num-
ber of people in million for each country. The effects on institutional quality are
ambiguous. On the one hand, in a larger country it might be more likely to push
through reforms and necessary rules, as it has a critical financial mass. On the other
13

hand, a larger population increases transaction costs and ethnic conflicts might be
more intensive, which constitutes a burden on the ability to promote institutions.
Years of schooling are used as a proxy for education. I expect a positive effect on
the quality of institutions, since a well-educated population has a higher interest in
political participation and reform and will demand good institutions.
3.2 Estimation Framework
The final data set includes 123 countries, 101 Southern and 22 Northern countries,
over 8 periods starting from 1984 until 2015. To analyze long term effects and to
reduce business cycle effects, 4-year averages are used. For the estimation framework,
I stick closely to the related empirical literature analyzing the effects on institutions.
I estimate the effect of the number of PTAs and the depth of PTAs on the quality of
institutions in a linear dynamic panel model using the following baseline equation:
INSTit = β1INSTi,t−1 + β2PTAsi,t−1 + β3Depthi,t−1 + β4PTAsi,t−1 ∗Depthi,t−1+ γ′Xit + δt + µi + εit (1)
The dependent variable, INSTit, measures the quality of institutions of country i
in period t. A lagged dependent variable, INSTi,t−1, is included to capture the
persistence of institutional quality since only small adjustments are possible in one
period and a process of adaption is needed to implement better institutions. That
is, if the quality of institutions is low in the former period, a country will not be
able to improve institutions to a high level immediately in the next period.
The main explanatory variables are PTAsit, indicating the cumulative number of
trade agreements, which a country has signed until period t and Depthit, measuring
the mean depth of all agreements signed until period t. Furthermore, an interaction
term of the two variables PTAsit×Depthit is included to test if the effect of one of
the variables differs if the value of the other one changes. It could be, for example,
that the more trade agreements a country has signed, the larger or smaller the effect
of depth might be. Similarly, the deeper trade agreements are, the greater might
be the effects of the number of signed PTAs. Xit includes a number of time-varying
control variables, which are commonly used in the literature as determinants of insti-
tutional change. µi represents individual specific effects (here country fixed effects)
and δt denotes time dummies for all periods. Finally εit is the idiosyncratic error
term, capturing all other omitted factors.
Estimating this equation using pooled ordinary least squares (OLS) will lead to bi-
14

ased results as the lagged dependent variable correlates with the individual specific
effect, which is part of the error term, i.e. E(µi|Yit−1) 6= 0 which is referred to as the
”dynamic panel bias” or ”Nickell-bias” (Nickell, 1981). This makes OLS inconsistent
and leads to an upward bias in the coefficients. Furthermore, results are biased due
to other endogenous variables.
Most explanatory variables are likely to be endogenous. There are two potential
sources of endogeneity. First, endogeneity may arise from omitted variables bias.
The inclusion of country fixed effects deals with this source of endogeneity. Sec-
ond, endogeneity arises due to simultaneity. The number of PTAs is potentially
endogenous with respect to β1 and β2 because of reverse causality arising from the
quality of institutions, which are not only affected by the number of PTAs but,
which might affect the number of PTAs itself. North countries might want to sign
more PTAs with countries, which have a higher level of institutional quality. This
problem of reverse causality might also occur with respect to the depth of PTAs
since the level of institutional quality in the South might affect how deep a PTA is.
If institutions are poor in the Southern country, a trading partner from the North
may seek to compensate for missing institutions by forming a deeper PTA to protect
domestic firms. The other control variables, namely income, freedom of the press
and conflicts are also expected to be endogenous due to simultaneity. Obviously,
if institutions are poor and there are no rules defined which secure (physical and
intellectual) property, this also produces a risk to the freedom of the press and may
also result in conflicts.
Acemoglu et al. (2005) argue that institutions are a source of economic growth. In
endogenous growth models it is the amount of resources allocated to innovation,
which explains differences in income. Innovation activities highly depend on prop-
erty rights. If property rights for the technology of the innovation are not secured,
there are no incentives for innovation.5 And if there are secure property rights,
this depends on the implemented institutions. So institutions also affect income.
Empirical evidence for a causal relationship of institutions on growth is provided,
for example by Dollar and Kraay (2003), Glaeser, La Porta, Lopez-De-Silanes, and
Shleifer (2004) and Levine (2005).
Education and population are assumed to be exogenous. Education is not expected
to be endogenous because the current level of institutions may only affect the educa-
tional system of future periods and then primarily the part of pupils, newly entering
school but less those who are already enrolled in school and it should not have any
5See also North (1990) for a detailed discussion of the importance of institutions for economicdevelopment.
15

effect on the current educational system.6
The difference generalized method-of-moments (GMM) estimator, proposed by Holtz-
Eakin, Newey, and Rosen (1988) and Arellano and Bond (1991) as well as the system
GMM, developed by Arellano and Bover (1995) and Blundell and Bond (1998) ad-
dress the above noted problems. The estimator is constructed for linear dynamic
panel equations with a small number of periods and a large number of individuals,
a dynamic dependent variable, which is influenced by its past values, further en-
dogenous explanatory variables, fixed individual effects and heteroscedasticity and
autocorrelation within individuals but not across them (Arellano & Bover, 1995;
Blundell & Bond, 1998). Furthermore, it is assumed that the only instruments
available are internal, i.e. they are based on lags of the instrumented variables.
This is an important characteristic as it appears to be very difficult to find suitable
instruments for endogenous variables from outside the model. These instruments
have to be highly correlated with the endogenous variables, but at the same time,
they need to be uncorrelated with the quality of institutions and to vary over time.
The model to be estimated takes the following general form of an autoregressive
panel data model, which is used to explain the estimation framework:
yit = αyi,t−1 + γXi,t−1 + ζXit + µi + εit (2)
The basic idea which is incorporated in the difference GMM is to remove the indi-
vidual fixed effects and thus the potential for omitted variable bias by taking first
differences as in equation (3). By this transformation, the lagged dependent vari-
able ∆yi,t−1 = yi,t−1 − yi,t−2 is still related to the error term ∆εit = εit − εi,t−1 via
the terms yi,t−1 and εi,t−1 and thus needs to be instrumented. But now ∆yi,t−2 and
yi,t−2 become valid instruments, which are related to the lagged dependent variable
but not to the error term as long as the errors are not serially correlated. Other
explanatory variables also remain endogenous and need to be instrumented by their
lags. After instrumenting, the transformed equation can be estimated using GMM.
∆yit = α∆yi,t−1 + γ∆Xi,t−1 + ζ∆Xit + ∆µi + ∆εit (3)
This estimation is performed by creating a system of equations of moment conditions
as in equation (4), which indicates that all instruments are uncorrelated with the
errors. With z being a vector of j instruments, there is a system of equations equal
to the number of instruments.
6For example, the German schooling system had a reform, where pupils could earn the diploma”Abitur” after 12 years instead of 13 years. But this affected only pupils newly entering high schooland it took at least another 8 years until the first students graduated (Huebner & Marcus, 2017).
16

E(ε|z) = 0 (4)
If there are more instruments, i.e. more equations than parameters to be estimated,
in general, there is no solution. The system is over-identified and usually all mo-
ment conditions cannot be satisfied. The GMM estimator now estimates equation
(3) by minimizing the vector EN(zε) of N observations, that is, forcing the em-
pirical moments as close to zero as possible. For this minimization problem, the
one-step GMM estimator defines a weighting matrix, which weighs each moment
condition. That means, in the optimal case, large weights are provided to moments
with small variances, while instruments with large variances are deemphasized by
smaller weights. Through this procedure, the information from instruments with
relatively small variances is not lost. In infinite samples the GMM estimator is con-
sistent and efficient.7 So when N increases the weighting matrix converges to the
optimal matrix. But as the sample size is limited, the instruments are expected to
correlate at least slightly with the endogenous part of the regressors. So in a finite
sample it is crucial not to include too many instruments.
Estimating GMM using a second step can lead to a gain in precision. The two step
GMM estimator uses the estimated residuals from the first step to create a covari-
ance matrix of estimated residuals and then does the GMM estimation again. In
difference GMM, two step GMM generally leads to lower bias and lower standard
errors compared to one step GMM. But in small samples, the two step estimator
can produce severely downward biased standard errors, which indicate a decep-
tive precision. This is due to the second step, where the efficient weight matrix
is constructed using parameter estimates without accounting for their variability.
Windmeijer (2005) derives a small-sample correction term, which corrects for the
extra variation in a small sample.
Blundell and Bond (1998) find that in small samples, which include a persistent
and short time-series the results of the difference GMM contain a small sample bias
and lose precision. As already suggested by Arellano and Bover (1995), one rea-
son is that lagged levels incorporate little information about future changes if the
dependent variable is close to a random walk and thus lagged levels are poor instru-
ments for differenced endogenous regressors. They are the first to propose the use
of lagged differenced instruments for the levels equation. Blundell and Bond (1998)
show that additional moment conditions for the levels equation, which create a sys-
tem of equations, contain information even when data is persistent and instruments
for the first-difference transformed equation are poor. They formalize necessary
7See Hansen (1982).
17

assumptions to instrument endogenous variables in the levels equation. The ad-
ditional moment conditions indicate that changes in any instrumenting variable z
are orthogonal to the individual specific effects µi: E(∆zit|µi) = 0. As long as the
εit are not serially correlated ∆zi,t−1 = zi,t−1 − zi,t−2 can be used as an instrument
for the endogenous variable zi,t−1, which does not correlate with the idiosyncratic
error εit in the levels equation. As the levels equation still includes fixed effects,
the assumption that the change in the instrumenting variable ∆zi is orthogonal to
the fixed effects, µi, is not obvious. But Blundell and Bond (1998) show that under
certain conditions this assumption is satisfied. They show that the initial conditions
process of the data, generating the dependent variable, is crucial. In the long run,
based on µi, the initial value of a dependent variable y in a simple auto-regressive
model, where the coefficient of the lagged dependent variable is smaller than 1, yi1
converges to µi/(1 − α) with εit indicating the deviation from this long-run level:
yi1 = µi/(1 − α) + εit. Then, the necessary assumption is fulfilled if the deviation
from the long-run level is not correlated with the level itself. In other words, the
assumption holds if the original series have a constant correlation over time with the
individual specific effects, also referred to as the ”mean stationarity” assumption.
However, the performance is reduced if the coefficient of the lagged dependent vari-
able approaches unity. When the constant correlation assumption is violated, taking
first differences does not completely remove the unobserved individual-specific ef-
fect and lagged differenced instruments for the levels equation will not be exogenous
anymore. As a result, the system GMM will not be valid anymore. In general, the
Sargan or Hansen test statistic provide information on the validity of used instru-
ments. Details on the appropriate range, which suggest the validity of instruments
are given in the following chapter, where the results are discussed.
Using system GMM, the two-step estimator is, in general, more efficient than one-
step, when Windmeijer (2005) corrected standard errors are applied. Then the stan-
dard covariance matrix is robust to panel-specific autocorrelation and heteroscedas-
ticity. Taking the efficiency gains of the system GMM into account, the two-step
system GMM is used for the analysis. In the two-step GMM estimates, the Wind-
meijer (2005) finite sample correction for standard errors is employed. To test ap-
propriate lags as instruments for each endogenous variable, first stage regressions
were implemented for all endogenous variables and lags. All results are presented in
the following section.
18

3.3 Results
A useful check for the GMM estimation are the estimation results from OLS and
within transformation, which can be interpreted as a bound for the true estimate
of the lagged dependent variable (Bond, 2002). While the OLS estimate is upward
biased, the estimate resulting from the within transformation is downward biased
as it does not remove the dynamic panel bias completely. As the within transforma-
tion subtracts the mean of each variable over all periods, the transformed terms still
include parts of the lagged dependent variable, which are correlated with the error
term. The true parameter estimates should lie within the range of the coefficients
of OLS and the within transformation.
Table 2: Comparison of system GMM results with OLS and FE
(1) (2) (3)OLS FE sysGMM
INST (t-1) 0.492∗∗∗ 0.293∗∗∗ 0.433∗∗∗
(0.038) (0.035) (0.062)
Ln(Population) 0.053 -0.426 0.099(0.034) (0.438) (0.082)
Ln(GDPpc) 0.367∗∗∗ 0.874∗∗∗ 0.525∗∗∗
(0.053) (0.294) (0.140)
Press Freedom 0.216∗∗∗ 0.009 0.156(0.070) (0.164) (0.197)
Conflicts -0.257∗ -0.193 -0.490(0.149) (0.328) (0.438)
Education -0.006 -0.004 -0.010(0.004) (0.007) (0.007)
Obs. 493 493 493Countries 87 87No. Instruments 77Lags t-3, t-4, t-5AB(2) p-value 0.021AB(3) p-value 0.944Hansen p-value 0.227
(i) Robust standard errors in parentheses
(ii) Significance at the 10, 5, and 1 percent level is denoted
by ∗, ∗∗ and ∗∗∗, respectively.
(iii) All models include year fixed effects.
19

In a first step, the quality of institutions is regressed on the lagged dependent vari-
able and the main controls, which earlier empirical studies proved to be significant
determinants of institutions, namely, the natural logarithm of population, the nat-
ural logarithm of GDP per capita (income), press freedom, conflicts and education.
I implement three different estimations using the OLS estimator (OLS), the within
estimator (FE) and the system GMM estimator (sysGMM). The results are reported
in table 2.
The estimate of the lagged dependent variable, 0.433, lies within the bound of the
OLS and FE (0.492 and 0.293, respectively) and is significant at the one percent
level. So system GMM can be applied as a consistent and efficient estimator.
While first order serial correlation in differenced residuals is expected, as ∆εi,t =
εi,t−εi,t−1 and ∆εi,t−1 = εi,t−1−εi,t−2 both contain εi,t−1, the p-value of the Arellano-
Bond test of second order serial correlation in differences, AB(2) p-value, of 0.021
shows that there is also second order serial correlation. That is, ∆εi,t correlates
with ∆εi,t−2, which indicates first-order correlation in levels as these terms show the
relationship between εi,t−1 and εi,t−2. This makes the first lag inappropriate as an
instrument since the first lag is now endogenous.
Table 3 presents the first estimations of system GMM, where PTAs and depth of
PTAs is included. The Hansen p-value, which is reported in every column, is used
to assess the applied set of instruments. It indicates if the applied instruments are
valid. If a model is over-identified, which means that too many instruments are
included, the test will show unreliably high p-values. Such high values reveal a very
good instrument set by mistake, since the test is weakened by too many instruments.
One has to be cautious if the p-value becomes too large, while on the other hand too
small values would indicate that instruments are invalid. Roodman (2009) suggests,
one should be cautious about values below 0.1 and values well above 0.25. Although
this does not constitute a strict threshold, it provides a range of reference.
Table 3 presents the results when the number of PTAs of the previous period (PTAs
(t-1)) and depth of PTAs signed in the previous period (Depth (t-1)) are included
separately in model (1) and (2) and together in the third model and, finally, when
both variables are interacted in the forth model. In the first regression, lag 4 is used
for instrumenting, which leads to a p-value of 0.173 and a suitable set of instruments.
If lag 3 is used for this estimation, the Hansen p-value becomes (0.095), which gives
rise for invalid instruments. In models (2) to (4) lag three is used for instrumenting.
In all regressions of table 3 instruments are uncollapsed.8 Even when the instruments
8In section 3.3.3 the estimates of the main significant variables, for which conclusions are drawn,are presented when also using different lag structures as instruments and when all instruments arecollapsed, to test whether the results are robust to different sets of instruments.
20

Table 3: Two-step system GMM regression results
(1) (2) (3) (4)
INST (t-1) 0.364∗∗∗ 0.420∗∗∗ 0.369∗∗∗ 0.363∗∗∗
(0.082) (0.095) (0.084) (0.067)
Ln(Population) 0.138∗ 0.151∗ 0.116 0.107(0.082) (0.082) (0.078) (0.071)
Ln(GDPpc) 0.583∗∗∗ 0.561∗∗∗ 0.656∗∗∗ 0.614∗∗∗
(0.221) (0.201) (0.153) (0.165)
Press Freedom 0.424∗ -0.040 0.217 0.108(0.245) (0.200) (0.245) (0.229)
Conflicts -0.735 -0.647 -0.329 -0.232(0.596) (0.564) (0.515) (0.447)
Education -0.014 -0.007 -0.013 -0.007(0.009) (0.008) (0.008) (0.007)
PTAs (t-1) -0.024 -0.023 0.080(0.026) (0.024) (0.091)
Depth (t-1) 0.151∗∗∗ 0.118∗∗ 0.175∗∗∗
(0.044) (0.046) (0.059)
PTAs(t-1)×Depth(t-1) -0.032(0.028)
Obs. N 493 493 493 493Countries 87 87 87 87# Instruments 49 59 69 79Lags t-4 t-3 t-3 t-3AB(2) p-value 0.027 0.010 0.010 0.005AB(3) p-value 0.990 0.915 0.948 0.882Hansen p-value 0.173 0.225 0.204 0.216
Notes:
(i) Windmeijer-corrected cluster-robust standard errors in parentheses.
(ii) Significance at the 10, 5, and 1 percent level is denoted by∗, ∗∗ and ∗∗∗, respectively.
(iii) All models include country and year fixed effects
21

are collapsed, the significance levels of the variables in any regression reported in
table 3 remain basically the same. In model (2) Depth remains highly significant,
when instruments are collapsed. When Depth(t-1) is included together with PTAs in
column (3) the significance level of Depth(t-1) is reduced and in column (4), where
the interaction term is included, Depth(t-1) becomes insignificant.9 The Hansen
p-values reported in table 3 are within the range, which is not too close to 0.1
but still not too large, that is well above 0.25. The overall results show that the
depth of PTAs matters for institutions. That means higher levels of depth can lead
to better institutions, while the number of PTAs itself does not have any effect
on institutions. PTAs(t-1) is never significant, which indicates that changes in
the number of signed trade agreements do not significantly explain changes in the
institutional quality. That means, simply signing trade agreements does not help to
promote institutions.10
The other coefficients have the expected signs except for Education, which is neg-
ative and significant at the 5 percent level. PressFreedom is positive and signif-
icant only at the 10 percent level. All else equal, a one within standard deviation
(0.318) in the press freedom would lead to a 0.103 point increase in institutional
quality. Conflicts, is negative but also only significant at the 10 percent level. A
highly significant effect at the one percent level is shown by income, ln(GDPpc),
which positively affects the institutions. The effect is more than three times larger
compared to PressFreedom. A one within standard deviation (0.536) increase in
ln(GDPpc) would lead to a 0.332 increase in the institutional quality.
In the following regressions (columns (2) to (4)), when Depth(t-1) is included,
PressFreedom is no longer significant. Depth might absorb some of the variation
of the two variables. When Depth(t-1) is included without PTAs(t-1) in column
(2), it shows a positive effect on institutions, which is highly significant at the one
percent level. An increase of a one within standard deviation (1.411) of Depth(t-1)
would lead to a 0.213 point increase in the level of institutional quality. When the
number of trade agreements and depth are both included, PTAs(t-1) still does not
show any effect on the quality of institutions and, although the significance level
9The results where, for each model, instruments are collapsed is reported in the Appendix (tableA.4).
10I also checked for different ranges of the number of signed PTAs. That means, one canargue that the first 5 or 10 PTAs may affect institutions but there might be a threshold wherean additional PTA might not have any significant effect anymore. In other words, signing anadditional 11th or 21st PTAs may not have the same effect as signing the first, 5th or 10th PTA. Itest for this by interacting the number of PTAs with dummy variables for having signed PTAs ofthe following ranges: one PTA, between 2 and 5 PTAs, between 6 and 10 PTAs, between 11 and20 and between 21 and 30 PTAs. The results do not show any significant effect. So there is noevidence that there is a threshold for the number signed PTAs.
22

and the effect is reduced, the effect of depth is still positive and significant at the 5
percent level. The reduction in significance levels for depth and also for population,
which is not significant anymore, can be a result of the reduction in the degrees
of freedom due to additional regressors. In the final column, an interaction term
of PTAs and Depth is included additionally to analyze whether changes in PTAs
(Depth) influence the effect of Depth (PTAs) on institutions. The results do not
indicate a joint effect of depth and the number of trade agreements. The effect for
depth now becomes larger again and highly significant. Except for ln(GDPpc), all
other controls remain insignificant.
3.3.1 Check for heterogeneity of countries
So far, the regressions include all developing countries. But looking at different
country groups, it can be seen that SSA performs very poorly with respect to several
factors of development and institutions compared to other developing countries.
Figure 5: Investment profile and GDP per capita by region (2001-04)
North
SSA
South
0
5,000
10,000
15,000
20,000
25,000
30,000
GD
P pe
r cap
ita 2
001-
04
North
SSA
South
0
2
4
6
8
10
12
Inve
stm
ent P
rofil
e 20
01-0
4
Source: Authors' calculations using ICRG and World Bank data.
Figure 5 shows the means of institutional quality and GDP per capita for the years
2001 to 2004 for SSA, compared to all other developing countries (South) without
SSA and developed countries (North). It shows the poor performance of SSA with
respect to institutions and income. Among the group of all developing countries,
23
SSA lags behind, which constitutes a persistent situation, which does not change
in other periods covered in the sample. Furthermore, the same pattern can be
observed for all other dimensions of institutions of the ICRG data, like law and
order, corruption or government stability. With respect to GDP per capita, this
deficit is even more severe.
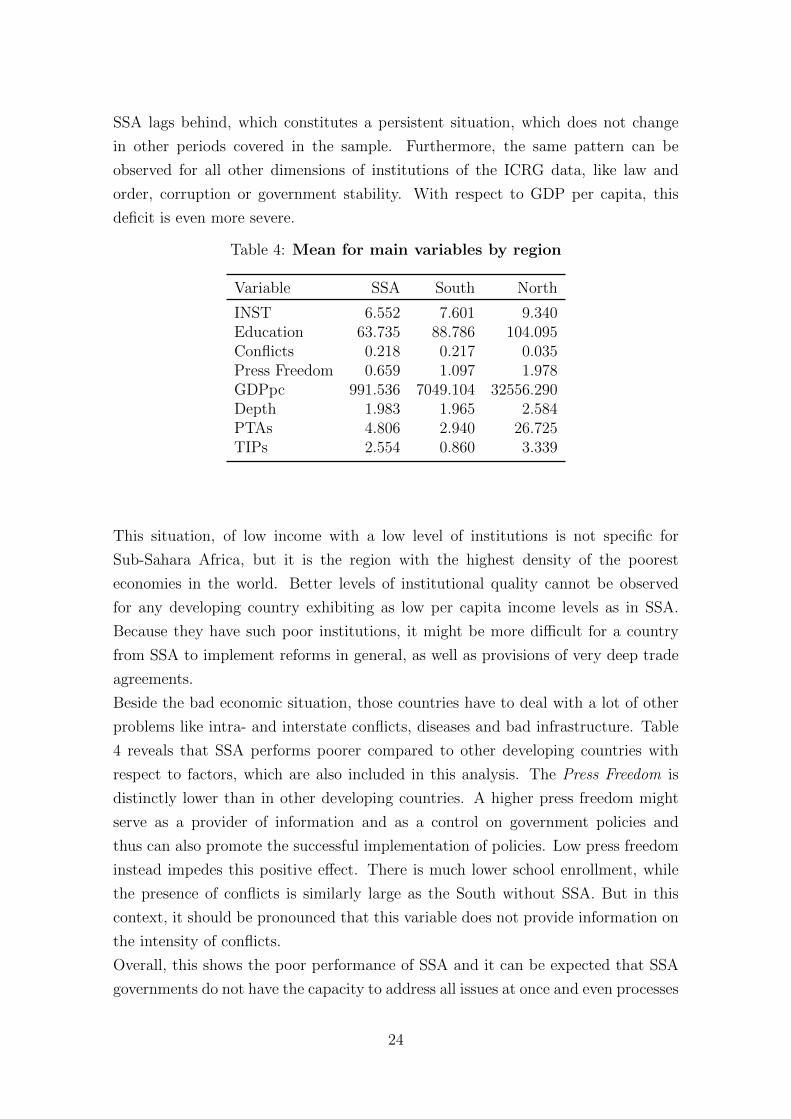
Table 4: Mean for main variables by region
Variable SSA South North
INST 6.552 7.601 9.340Education 63.735 88.786 104.095Conflicts 0.218 0.217 0.035Press Freedom 0.659 1.097 1.978GDPpc 991.536 7049.104 32556.290Depth 1.983 1.965 2.584PTAs 4.806 2.940 26.725TIPs 2.554 0.860 3.339
This situation, of low income with a low level of institutions is not specific for
Sub-Sahara Africa, but it is the region with the highest density of the poorest
economies in the world. Better levels of institutional quality cannot be observed
for any developing country exhibiting as low per capita income levels as in SSA.
Because they have such poor institutions, it might be more difficult for a country
from SSA to implement reforms in general, as well as provisions of very deep trade
agreements.
Beside the bad economic situation, those countries have to deal with a lot of other
problems like intra- and interstate conflicts, diseases and bad infrastructure. Table
4 reveals that SSA performs poorer compared to other developing countries with
respect to factors, which are also included in this analysis. The Press Freedom is
distinctly lower than in other developing countries. A higher press freedom might
serve as a provider of information and as a control on government policies and
thus can also promote the successful implementation of policies. Low press freedom
instead impedes this positive effect. There is much lower school enrollment, while
the presence of conflicts is similarly large as the South without SSA. But in this
context, it should be pronounced that this variable does not provide information on
the intensity of conflicts.
Overall, this shows the poor performance of SSA and it can be expected that SSA
governments do not have the capacity to address all issues at once and even processes
24

in general might be less efficient. Furthermore, a country needs to have some basic
rules implemented before other rules, which are included in a PTA, can be imple-
mented. Moreover SSA countries tend to sign a larger number of PTAs compared to
other developing countries. Until the final period of this data set, the mean number
of agreements signed by SSA countries lies above the average of other developing
countries. Up to period 5 the mean is even more than twice as large. Over the
whole period observed, on average a SSA country signs almost 5 trade agreements
while other developing countries on average sign three PTAs. So SSA seems to sign
relatively more PTAs, whereby this even might increase the burden on the national
institutions to implement the agreements properly. Following these considerations, I
expect, that the effects of Depth (t-1) and PTAs(t-1) are different for SSA countries.
Table 5: Effects of PTAs and Depth for different country groupings
(1)
PTAs w/o SSA (t-1) -0.041(0.037)
Depth w/o SSA (t-1) 0.181∗∗∗
(0.051)
PTAs SSA (t-1) 0.258∗∗
(0.111)
Depth SSA (t-1) -0.310(0.295)
Obs. N 595Countries 90# Instruments 32Lags t-3, t-4AB(2) p-value 0.001AB(3) p-value 0.749Hansen p-value 0.157
Notes:
(i) Windmeijer-corrected cluster-robust standard errors in parentheses.
(ii) All models include country and year fixed effects.
(iii) Instruments are collapsed.
(iv) Significance at the 10, 5, and 1 percent level is denoted
by ∗, ∗∗ and ∗∗∗, respectively.
Table 5 reports the results of a regression, where PTAs(t-1) and Depth(t-1) are now
interacted with dummies, indicating SSA countries (PTAs SSA (t-1), Depth SSA
25

(t-1)) and all other developing countries without SSA (PTAs w/o SSA (t-1), Depth
w/o SSA (t-1)), respectively. All other control variables (except for Education) are
included but not shown.11 Education is not significant in any regression where Depth
(t-1) and PTAs (t-1) are included. To have more observations education is excluded.
Due to the additionally included interaction terms, which need to be instrumented,
all instruments are collapsed to avoid a too high instruments count, which would
lead to too large p-values for the Hansen test statistic.
For developing countries without SSA, it can be seen that the positive effect of depth
becomes larger compared to the effect of all developing countries including SSA and
it is significant at the one percent level. A one within standard deviation increase
in the depth index now leads to an increase in the institution index by 0.254 points.
The effect of the number of signed PTAs for this group remains insignificant. For
SSA, the effect of depth is not significant, while the effect of the number of signed
PTAs now becomes positive and significant at the 5 percent level. This supports the
argument that even if those countries sign deep PTAs, they are not able to implement
them effectively. On the other hand, for all other developing countries without
SSA the positive effect of deep trade agreements becomes even larger compared to
regressions when SSA is included. While for SSA simply signing trade agreements
has an effect, this supports the argument that simply joining networks with trading
partners has a positive effect in these countries. Finally, it should be noted that
the different effects, when SSA is excluded, do not only result from an overall lower
institutional quality related to SSA but other factors related to SSA must play a
role. I also check, whether the effects of PTAs(t-1) and Depth(t-1) for all developing
countries differ with regard to different levels of institutional quality. For this, I
perform regressions, where PTAs(t-1) and Depth(t-1) are interacted with a dummy
for having an institutional quality index larger (smaller) than 5, 7 or 8 but this
interaction term never becomes significant.
3.3.2 Check for heterogeneity of agreements
At this point all types of PTAs are included, which have the potential to liberalize
trade in any form. This includes partial scope agreements as well as full free trade
agreements.
Besides the number of PTAs, signatures of (bilateral) investment treaties have in-
creased, especially in the course of the 1990s. The main motive to sign investment
treaties is to protect foreign investment. This is why developed countries were the
initiators of those agreements. They are typically exporting capital into developing
11For detailed results including all control variables see in the Appendix (table A.5).
26

countries where the legal system usually is less developed and standards are lower
compared to the laws, that investors are used to rely on in their domestic country.
By the means of an investment treaty, countries can set additional legal standards,
which are missing in the host country. This protects the domestic investors, while,
for the developing country, this will promote investment inflows, which are beneficial
for development. Consequently, investment treaties might play an important role in
developing the legal institutions in a developing country and it should be analyzed
at this point if treaties, including essential provisions with regard to investment,
are the driving factor in promoting institutions or, if the effect does not differ from
other PTAs.
To address this question, a new variable, TIPs(t−1), is included. For each country
and year, it sums up all signed treaties with investment provisions (TIPs). This
means, that these agreements include a chapter with substantive provisions in in-
vestment. Now the variable Depth (t-1) changes to Depth w/o IP (t-1) as this depth
index now does not include investment provisions (IPs). Depth w/o IP (t-1) now
only varies from 0 to 6 instead of a range from 0 to 7. For each of the provisions,
which are covered in the six areas intellectual property rights (IPRS), procurement,
standards, services or competition a value of one is added. So, if an agreement
includes provisions in all areas a depth index of 6 is assigned. PTAs w/o IP (t-1)
similarly now only includes PTAs without any provisions in investment.
The results are presented in table 6. Now only the third lag is used as an instru-
ment and the instruments are collapsed to avoid too large Hansen p-values. The
first column shows that, when TIPs are considered separately, the number of trade
agreements signed without investment provisions becomes negative and significant.
A one standard deviation increase in PTAs w/o IP (t-1) leads to a 1.038 point
reduction in the quality of institutions. This value is relatively large compared to
the effects from previous regressions. An explanation for this negative effect can be
that the effort, dedicated to the signature of PTAs, might reduce the efficiency of
government policies with regard to other areas such as investment. Furthermore,
the significant, positive effect of depth now disappears. This means that the provi-
sions in areas, like intellectual property rights or standards do not affect institutions,
while trade agreements containing investment provisions seem to play a crucial role.
The effect is positive and significant at the 5 percent level. Now also PressFreedom
has a positive and significant effect. All else equal, an increase in one within stan-
dard deviation of the PressFreedom (0.318)results in an increase of 0.516 points
in institutions. The effect of TIPs (t-1) is only slightly smaller with a 0.458 points
increase due to a one within standard deviation increase (1.483), but larger than
27

Table 6: Effects for agreements with and without investment provisions(IPs)
(1) (2)
INST (t-1) -0.440∗∗∗ 0.435∗∗∗
(0.117) (0.113)
Ln(Population) -0.022 0.034(0.139) (0.146)
Ln(GDPpc) 0.586∗∗∗ 0.748∗∗∗
(0.204) (0.233)
Press Freedom 1.622∗∗∗ 1.448∗∗∗
(0.557) (0.592)
Conflicts 2.575 2.615(1.665) (1.632)
PTAs w/o IP (t-1) -0.206∗∗∗ -0.072(0.067) (0.224)
Depth w/o IP (t-1) 0.035 0.048(0.127) (0.134)
PTAs w/o IP × Depth w/o IP (t-1) -0.043(0.072)
TIPs (t-1) 0.309∗∗ 0.333∗∗∗
(0.124) (0.115)
Obs. N 595 595Countries 90 90# Instruments 22 24Lags t-3 t-3AB(2) p-value 0.082 0.056AB(3) p-value 0.514 0.557Hansen p-value 0.136 0.224
Notes:
(i) Windmeijer-corrected cluster-robust standard errors in parentheses.
(ii) All models include country and year fixed effects.
(iii) Instruments are collapsed.
(iv) Significance at the 10, 5, and 1 percent level is denoted by ∗, ∗∗ and ∗∗∗, respectively.
28

the effect of ln(GDPpc), where an increase of one within standard deviation (0.536)
leads to an increase of 0.314 in the institutional quality. Conflicts and Population
do not show a significant effect on institutions.
Column (2) shows that PTAs and depth are independent. The included interaction
term of PTAs w/o IP (t-1) and Depth w/o IP (t-1) is not significant.
The same regression as in column (1) is done with PTAs w/o IP (t-1), Depth w/o IP
(t-1) and TIPs (t-1) being interacted with dummies for SSA and all other developing
countries without SSA. The respective results are presented in table 7.
Table 7: Effects for agreements with and without investment provisionsfor SSA and without SSA
(1)
PTAs w/o IP (t-1)× no SSA -0.195∗∗∗
(0.064)
Depth w/o IP (t-1)× no SSA 0.145(0.112)
TIPs (t-1)× no SSA 0.316∗∗∗
(0.113)
PTAs w/o IP (t-1)× SSA 0.297(0.379)
Depth w/o IP (t-1)× SSA 0.142(0.437)
TIPs (t-1)× SSA -0.131(0.374)
Obs. N 595Countries 90# Instruments 28Lags t-3AB(2) p-value 0.019AB(3) p-value 0.702Hansen p-value 0.402
Notes:
(i) Windmeijer-corrected cluster-robust standard errors in parentheses.
(ii) All models include country and year fixed effects.
(iii) Instruments are collapsed.
(iv) Significance at the 10, 5, and 1 percent level is denoted by∗, ∗∗ and ∗∗∗, respectively.
A problem, which arises here, is that the inclusion of another control variable,
29

TIPs(t − 1), and additional interaction terms lead to an increase in the instru-
ment count. To reduce the number of instruments, only the third lag is used and
the instruments are collapsed. Again, all other control variables are included with
the exception of Education.12
For countries from SSA, distinguishing between different types of agreements, leads
to insignificant effects. Signing PTAs with or without investment provisions does not
show an effect on institutions. The depth of PTAs without investment provisions, as
in previous regressions, where investment chapters are included, is not significant.
But for all other developing countries without SSA the positive effect of TIPs in-
creases slightly. Now a one standard deviation increase in TIPs(t− 1) (1.719) leads
to an increase in institutions by 0.543 points. The negative effect of PTAs without
investment provisions also becomes larger. A one within standard deviation increase
amounts to a 1.144 point reduction in the institutions index. This is an important
result, which suggests that the negative effect of signing a large number of PTAs is
more severe than the positive effect, which results from the number of TIPs. So the
overall effects, when differentiated between the type of trade agreement, again show
different results when SSA is excluded.
3.3.3 Check for robustness of instruments
As discussed in chapter 3.2, using system GMM raises the risk of instrument pro-
liferation, which causes the Hansen test to show implausibly high p-values close to
one and thus fails to indicate that the model is over-fitted due to a high number of
instruments, resulting in too small standard errors. Consequently, using different
lag structures can affect the results.
To show how the results develop for Depth (t-1) and TIPs (t-1) using different
numbers of lags as instruments, figure 6 shows the parameter estimates for both
variables (graphs on the left) and when interacted with a dummy for the South
without SSA Depth w/o SSA (t-1) and TIPs w/o SSA(t-1), respectively on the
right) using different lag lengths as instruments.
The estimates for Depth (t-1) and Depth w/o SSA (t-1) are based on the results
presented in table 3 column (3) and table 5. The estimates for TIPs (t-1) and
TIPs w/o SSA(t-1) are based on the regressions shown in the first column of table 6
and in table 7, respectively. The solid lines indicate the parameter estimates, while
the dashed lines indicate 95 percent confidence intervals (CIs). The estimate for
Depth (t-1) is obtained from the same model as reported in table 2, column (3). At
12A table with the respective results with all included explanatory variables is included in theAppendix (table A.6).
30

Figure 6: Robustness of estimates to different lags as instruments
-0.2-0.10.00.10.20.30.40.5
Para
met
er e
stim
ate
for
Dep
th (t
-1) a
t 95
% C
Is
1 2 3 4 5 6 7 8
Lag depth of instruments (collapsed)
-0.2-0.10.00.10.20.30.40.5
Para
met
er e
stim
ate
for
Dep
th w
/o S
SA (t
-1) a
t 95
% C
Is
1 2 3 4 5 6 7 8
Lag depth of instruments (collapsed)
-0.2-0.10.00.10.20.30.40.5
Para
met
er e
stim
ate
for
TIPs
(t-1
) at 9
5 %
CIs
1 2 3 4 5 6 7 8
Lag depth of instruments (collapsed)
-0.2-0.10.00.10.20.30.40.5
Para
met
er e
stim
ate
for
TIPs
w/o
SSA
(t-1
) at 9
5 %
CIs
1 2 3 4 5 6 7 8
Lag depth of instruments (collapsed)
the very left point of the solid line Depth (t-1) is instrumented with the difference
lagged by three periods, now with collapsed instruments. Moving from here to the
right along the solid line, an additional lagged difference is included in the set of
instruments, up to a total of differences, lagged by 8 periods. The estimate for Depth
(t-1) varies more, relative to uncollapsed instruments. But when instruments are
uncollapsed, including more than one lag leads to an increase instruments, leading
to a suspiciously large Hansen p-value. The parameter estimates become smaller
the more lags are included. It varies from 0.140 when only lag 3 is used, leading to
a number of 21 instruments, to 0.065 when lags 3 to 8 are used, which leads to 45
instruments in total. Moreover, the estimates are not significant anymore when lags
6 and longer are included.
The estimate Depth w/o SSA (t-1), shown in table 4, depicts the point on the solid
line at lag depth 4 in the top right graph, where differences lagged by period 3 and
4 are included in the instrument set. At lag depth 8 all periods from 3 to 8 are used
as instruments. The estimates of Depth w/o SSA (t-1) vary only little and remain
relatively stable. It ranges from 0.186, when only lag 3 is used, to 0.126, when all
lags are used, starting in period 3 and leading to a total number of 36 instruments.
The effect remains highly significant at the 1 percent level, independent of the lag
length.
31

The estimates of TIPs (t-1) and TIPs w/o SSA(t-1), presented in table 5 colum (1)
and in table 6, depict the starting point of the solid line at lag length 3. So the
estimation results, which I report above, are already very conservative with respect
to the set of instruments since the minimum number of instruments is included.
Increasing the lag length from 3 to 5 periods, the estimates for TIPs (t-1) and
TIPs w/o SSA(t-1) reduce by more than 0.1 points, but then remain stable and
significant, independent from the lag length used for the instrument set.
4 Conclusion
The phenomenon of the increase in signature rates of trade agreements since the
1990s, has experienced a lot of attention in the academic research. A substantial
part of the agreements is between developing and developed countries i.e. between
North and South (N-S). Almost simultaneously, the content of trade agreements has
changed. PTAs have become deeper. They distinctly exceed regulations from the
WTO. PTAs more and more specify political cooperation and include ”behind-the-
border” rules in different areas such as investment, intellectual property, competition
policy or the rule of law. It can be observed that N-S PTAs on average are deeper
compared to other types of PTAs, i.e. North-North and South-South PTAs. This
development is one result of missing or poor institutions in developing countries
trading with developed countries, where firms can do business in a good institutional
environment.
This paper provides evidence on whether trade agreements can serve as a driver of
institutional quality in developing countries by accounting for the number of signed
PTAs as well as the depth of PTAs. I build the anaylsis on the comprehensive
DESTA database, including a very broad set of trade agreements and a measure
for the content of PTAs. I am specifically looking at the effects on the quality of
institutions with regard to investment, since these institutions play an important role
for trading firms and firms investing abroad. Rules affecting this type of institutions
are expected to be essential in trade agreements. I use a long panel to account for
the changes over time and to address endogeneity issues.
The results confirm that deep trade agreements have a positive effect on institu-
tions. But at the same time, the effects differ with regard to different regions. SSA
appears to play a specific role. Compared to other developing countries, in SSA
the economic and political performance is distinctly poorer. The results show that
signing deep PTAs does not have any effect on institutions in SSA. Focusing on de-
veloping countries excluding SSA, the positive effect of depth becomes even larger,
32

compared to the effect when SSA is included, it is highly significant and robust to
different lag structures of instruments.
When looking at different types of trade agreements, investment treaties, i.e. those
agreements, including substantive investment provisions (TIPs), show to be the
important drivers of change in institutional quality. However, signing PTAs in
general has no effect. The positive effect of TIPs on institutions even exceeds the
overall effect of the deep PTAs. This effect, again, is not present for SSA, where the
signing of neither TIPs nor deep PTAs does have an effect on institutional quality.
These results reveal positive aspects of the increase in the number of signed N-
S trade agreements, especially those including investment provisions. It can be a
chance for developing countries to improve domestic institutions, which again has
a positive effect on the overall development of the country. However, it should be
emphasized, that the analysis focuses on specific institutions related to trade and
investment abroad. Besides, this paper has also highlights once more, the specific
role of SSA as a region of developing countries, which performs poorer relative to
other developing countries with regard to political and economic variables.
33

References
Acemoglu, D., Johnson, S., & Robinson, J. A. (2001). The colonial origins of com-
parative development: An empirical investigation. The American Economic
Review , 91 (5), 1369–1401.
Acemoglu, D., Johnson, S., & Robinson, J. A. (2005). Chapter 6 institutions as
a fundamental cause of long-run growth. Handbook of Economic Growth, 1 ,
385–472.
Acemoglu, D., & Robinson, J. A. (2010). Why is africa poor? Economic History of
Developing Regions , 25 (1), 21–50.
Ades, A., & Di Tella, R. (1999). Competition and corruption. American Ecconomic
Review , 89 (4), 982–993.
Adeyemi, S. (2017). Africa doesn’t need charity, it
needs good leadership. Retrieved 30.08.2018, from
https://www.weforum.org/agenda/2017/05/africa-doesn-t-need
-charity-it-needs-good-leadership/
Afegbua, S. I., & Adejuwon, K. D. (2012). The challenges of leadership and govern-
ment in africa. International Journal of Academic Research in Business and
Social Sciences , 2 (9), 141–157.
Allansson, M., Melander, E., & Themner, L. (2017). Organized violence, 1989-2016.
Journal of Peace Research, 54 (4).
Anderson, J. E., & Marcouiller, D. (2002). Insecurity and the pattern of trade:
An empirical investigation. The Review of Economics and Statistics , 84 (2),
342–352.
Arellano, M., & Bond, S. (1991). Some tests of specification for panel data: Monte
carlo evidence and an application toemployment equations. The Review of
Economic Studies , 58 (2), 277–297.
Arellano, M., & Bover, O. (1995). Another look at the instrumental variable esti-
mation of error-components models. Journal of Econometrics , 68 (1), 29–51.
Berkowitz, D., Moenius, J., & Pistor, K. (2006). Trade, law, and product complexity.
The Review of Economics and Statistics , 88 (2), 363–373.
Blundell, R., & Bond, S. (1998). Initial conditions and moment restrictions in
dynamic panel data models. Journal of Econometrics , 87 (1), 115–143.
Bond, S. (2002). Dynamic panel data models: A guide to micro data methods and
practice. Portugueses Economic Journal , 1 (2), 141–162.
Brunetti, A., & Weder, B. (2003). A free press is bad news for corruption. Journal
of Public Economics , 87 , 1801–1824.
Busse, M., Borrmann, A., Fischer, S., & Groning, S. (2007). Institutions, governance
34

and trade: An empirical investigation of the linkages in view of the proposed
acp/eu economic partnership agreements. Hamburg: Hamburg Institute of
International Economics (HWWI).
Chong, A., & Zanforlin, L. (2000). Law tradition and institutional quality: some
epirical evidence. Journal of International Development , 12 (8), 1057–1068.
de Groot, Henry L. F., Linders, G., Rietveld, P., & Subramanian, U. (2004). The
institutional determinants of bilateral trade patterns. Kyklos , 57 (1), 103–123.
Djankov, S., Montalvo, J. G., & Reynal-Querol, M. (2008). The curse of aid. Journal
of Economic Growth, 13 (3), 169–194.
Dollar, D., & Kraay, A. (2003). Institutions, trade, and growth. Journal of Monetary
Economics , 50 (1), 133–162.
Dur, A., Baccini, L., & Elsig, M. (2014). The design of international trade agree-
ments: Introducing a new dataset. Review of International Organizations ,
9 (3), 353–375.
Ear, S. (2007). Does aid dependence worsen governance? International Public
Management Journal , 10 (3), 259–286.
Freedom House. (2016). Freedom in the world. Retrieved from
https://freedomhouse.org/content/freedom-world-data-and-resources
Freund, C. (2004). Reciprocity in free trade agreements. Central Bank of Chile
Working Papers(279).
Gassebner, M., Gaston, N., & Lamla, M. J. (2011). The inverse domino effect:
Are economic reforms contagious? International Economic Review , 52 (1),
183–200.
Giavazzi, F., & Tabellini, G. (2005). Economic and political liberalizations. Journal
of Monetary Economics(52), 1297–1300.
Glaeser, E. L., La Porta, R., Lopez-De-Silanes, F., & Shleifer, A. (2004). Do
institutions cause growth? Journal of Economic Growth(9), 271–303.
Gleditsch, N. P., Wallensteen, P., Eriksson, M., Sollenberg, M., & Strand, H. (2002).
Armed conflict 1946-2001: A new dataset. Journal of Peace Research, 39 (5).
Hansen, L. P. (1982). Large sample properties of generalized method of moments
estimators. Econometrica, 50 (4), 1029–1054.
Hillman, A. L., & Moser, P. (1996). Trade liberalization as politically optimal ex-
change of market access. In M. Canzoneri, W. J. Ethier, & V. Grilli (Eds.), The
new transatlantic economy (Vol. 1996, pp. 295–312). Cambridge: Cambridge
Univ. Press.
Holtz-Eakin, D., Newey, W., & Rosen, H. (1988). Estimating vector autoregressions
35

with panel data. Econometrica, 56 (6), 1371–1395.
Huebner, M., & Marcus, J. (2017). Moving up a gear: The impact of compress-
ing instructional time into fewer years of schooling. Economics of Education
Review , 58 (C), 1–14.
Islam, R., & Montenegro, C. E. (2002). What determines the quality of institutions?
World Bank Policy Research Working Paper(5430). doi: 10.1596/1813-9450-
2764
Knack, S. (2001). Aid dependence and the quality of governance: Cross-country em-
pirical tests. Southern Economic Journal , 68 (2), 310. doi: 10.2307/1061596
Knack, S. (2004). Does foreign aid promote democracy? International Studies
Quarterly , 48 , 251–266.
Knack, S., & Azfar, O. (2003). Trade intensity, country size and corruption. Eco-
nomics of Governance, 4 (1), 1–18.
La Porta, R., Lopez-De-Silanes, F., Shleifer, A., & Vishny, R. W. (1997). Legal
determinants of external finance. Journal of Finance(52), 1131–1150.
La Porta, R., Lopez-De-Silanes, F., Shleifer, A., & Vishny, R. W. (1999). The
quality of government. Journal of Law, Economics, and Organization, 15 (1),
222–279.
Larrain, F. B., & Tavares, J. (2004). Does foreign direct investment decrease
corruption? Latin American Journal of Economics(123), 217–230.
Levchenko, A. A. (2013). International trade and institutional change. Journal of
Law, Economics, and Organization, 29 (5), 1145–1181.
Levine, R. (2005). Law, endowments and property rights. Journal of Economic
Perspectives , 19 (3), 61–88.
Levy, P. I. (2009). The united states-peru free trade agreement: What did yout
expect? American Enterprise Institute Working Paper Series on Development
Policy 1 (1).
Limao, N. (2016). Preferential trade agreements. NBER Working Paper Series ,
22138 .
Mancusi, M. L. (2008). International spillovers and absorptive capacity: A cross-
country cross-sector analysis based on patents and citations. Journal of Inter-
national Economics , 76 (2), 155–165.
Nickell, S. (1981). Biases in dynamic models with fixed effects. Econometrica,
49 (6), 1417–1426.
Norris, P. (2008). The role of the free press in promoting democratization, good
governance and human development. Global Forum for Media Development,
Internews Europe, 66–75.
36

Nunn, N. (2007). Relationship-specificity, incomplete contracts, and the pattern of
trade. The Quarterly Journal of Economics , 122 (2), 569–600.
Okada, K., & Samreth, S. (2012). The effect of foreign aid on corruption: A quantile
regression approach. Economics Letters , 115 (2), 240–243.
Pinto, P. M., & Zhu, B. (2016). Fortune or evil? the effect of inward foreign dircet
investment on corruption. International Studies Quarterly , 60 (4), 693–705.
PRS Group. (2016). International country risk
guide: Political risk (table 3b). Retrieved from
https://epub.prsgroup.com/products/icrg/icrg-historical-data
Quazi, R. M., & Alam, A. (2015). Foreign aid and quality of governance in developing
countries: An econometric case study of south asia and east asia. Inetrnational
Business Research, 8 (9), 16–26.
Rigobon, R., & Rodrik, D. (2005). Rule of law, democracy, openness and income:
Estimating the interrelationships. Econmics of Transition(13), 533–564.
Rodrik, D. (2007). One economics, many recipes: Globalization, institutions, and
economic growth. Princeton, NJ: Princeton University Press.
Schiff, M., & Winters, L. A. (1998). Regional integration as diplomacy. World Bank
Economic Review(12), 271–295.
Simmons, B. A., Dobbin, F., & Garrett, G. (2006). Introduction: The interna-
tional diffusion of liberalism. International Organization, 60 (04), 13. doi:
10.1017/S0020818306060267
Straub, S. (2000). Empirical determinants of good institutions: Do we know any-
thing? Inter-American Development Bank Working Paper(423).
Tavares, J. (2003). Does foreign aid corrupt? Economic Letters , 79 (1), 99–106.
United Nations (Ed.). (2013). Key statistics and trends in trade policy. New York
and Geneva.
Wei, S.-J. (2000). How taxing is corruption on international investors? The Review
of Economics and Statistics , 82 (1), 1–11.
Windmeijer, F. (2005). A finite sample correction for the variance of linear efficient
two-step gmm estimators. Journal of Econometrics , 126 (1), 25–51.
World Bank. (2016). World development indicators. Washington DC.. Retrieved
from http://data.worldbank.org/
World Trade Organization. (2016). Rta database. Retrieved from
http://rtais.wto.org/UI/PublicSearchByCr.aspx
37

Appendix
Table A.1: Description of variables and sources
Variable Description Source
INST Investment Profile, componentof the International CountryRisk Guide (ICRG)
ICRG database by PRS Group(2016)
PTAs Cumulative sum of the numberof signed trade agreements foreach country
Design of Trade Agreements(DESTA) database by Dur,Baccini and Elsig (2014)
Depth Average depth of all agreementssigned
Design of Trade Agreements(DESTA) database by Dur,Baccini and Elsig (2014)
TIPs Number of signed Treaties withinvestment provisions
Authors calculations based on:Design of Trade Agreements(DESTA) database by Dur,Baccini and Elsig (2014)
Education Gross enrollment ratio, primaryand secondary, both sexes (inpercent)
The World Bank (2016)
Conflicts Conflicts of intrastate conflict.Coded 1 in all country-yearswith at least one active conflict
The UCDP/PRIO ArmedConflict Dataset: Gleditsch etal. (2002); Allansson et al.(2017)
Population Population (in million) The World Bank (2016)Press Freedom Degree of the freedom of the
press, 0 (not free), 1 (partlyfree), 2 (completely free)
Freedom House (2016)
GDPpc GDP per capita (current USD) The World Bank (2016)
38

Table A.2: List of countries categorized as North or South
Northern countries Australia, Austria, Belgium, Canada, Denmark, Finland,France, Germany, Greece, Ireland, Italy, Japan,Luxembourg, Netherlands, New Zealand, Norway,Portugal, Spain, sweden, Switzerland, United Kingdom,United States
Southern countries Albania, Algeria, Angola, Bahamas, Bahrain, Bangladesh,Botswana, Brunei Darussalam, Bulgaria, Burkina Faso,Cameroon, Chile, China, Colombia, Democratic Republicof Congo, Republic of Congo, Costa Rica, Cote d’Ivoire,Croatia, Cyprus, Czech Republic, Dominican Republic,Ecuador, Egypt, El Salvador, Estonia, Ethiopia, Gabon,Gambia, Ghana, Guatemala, Guinea, Guinea-Bissau,Guyana, Haiti, Honduras, Hungary, Iceland, India,Indonesia, Israel, Jamaica, Jordan, Kenya, Rep. of Korea,Kuwait, Latvia, Lebanon, Liberia, Lithuania, Madagascar,Malawi, Malaysia, Mali, Malta, Mexico, Moldova,Mongolia, Morocco, Mozambique, Myanmar, Namibia,Nicaragua, Niger, Nigeria, Oman, Pakistan, Panama,Papua New Guinea, Peru, Philippines, Poland, Qatar,Romania, Russian Federation, Saudi Arabia, Senegal,Serbia, Sierra Leone, Singapore, Slovak Republic, Slovenia,Somalia, South Africa, Sri Lanka, Sudan, Suriname, SyrianArab Republic, Taiwan, Province of China, Tanzania,Thailand, Togo, Trinidad and Tobago, Tunisia, Turkey,Uganda, Ukraine, United Arab Emirates, Vietnam,Zambia, Zimbabwe
39

Table A.3: Summary statistics
Variable Obs. Mean Std. Dev. Min Max
INST overall 761 7.09 2.27 0.50 12.00between 1.56 2.44 10.55within 1.66 1.66 10.29
PTAs overall 792 3.18 3.33 0.00 33.50between 2.49 0.03 15.03within 2.23 -11.85 21.65
Depth overall 792 1.80 1.61 0.00 7.00between 0.75 0.00 4.61within 1.43 -2.81 6.51
TIPs overall 792 1.30 1.56 0.00 10.75between 1.20 0.00 3.84within 0.99 -1.94 8.81
Education overall 652 80.45 20.95 14.60 113.28between 19.56 17.20 103.63within 9.43 46.28 113.45
Conflicts overall 768 0.20 0.37 0.00 1.00between 0.31 0.00 1.00within 0.20 -0.58 1.05
Ln (Population) overall 783 16.01 1.66 12.33 21.03between 1.66 12.55 20.93within 0.21 15.13 17.06
Press Freedom overall 714 0.85 0.73 0.00 2.00between 0.65 0.00 2.00within 0.35 -0.55 1.85
Ln (GDPpc) overall 747 7.58 1.47 4.19 11.41between 1.36 5.28 10.39within 0.54 6.17 9.46
40

Table A.4: Two-step system GMM regression results (baseline with collapsedinstruments)
(1) (2) (3) (4)inv prof inv prof inv prof inv prof
INST (t-1) 0.314∗ 0.383∗∗∗ 0.341∗∗∗ 0.280∗∗
(0.169) (0.096) (0.108) (0.128)
Ln(Population) 0.206 0.079 -0.033 -0.012(0.177) (0.080) (0.091) (0.104)
Ln(GDPpc) 0.716∗∗ 0.442∗∗ 0.460∗∗ 0.381(0.318) (0.200) (0.232) (0.268)
Press Freedom 0.245 0.320 0.592 0.955(0.873) (0.410) (0.490) (0.659)
Conflicts -1.104 0.135 0.413 0.955(2.226) (0.886) (1.017) (1.182)
Education -0.017 -0.003 -0.005 -0.008(0.012) (0.009) (0.012) (0.013)
PTAs (t-1) -0.007 -0.028 -0.203(0.060) (0.039) (0.128)
Depth (t-1) 0.200∗∗∗ 0.140∗ 0.074(0.068) (0.071) (0.085)
PTAs(t-1)×depth(t-1) 0.057(0.035)
Obs. N 493 493 474 474Countries 87 87 86 86# Instruments 19 19 21 23Lags t-4 t-3 t-3 t-3AB(2) p-value 0.098 0.008 0.019 0.096AB(3) p-value 0.872 0.885 0.596 0.395Hansen p-value 0.196 0.266 0.026 0.134
Notes:
(i) Windmeijer-corrected cluster-robust standard errors in parentheses.
(ii) All models include country and year fixed effects.
(iii) Instruments are collapsed.
(iv) Significance at the 10, 5, and 1 percent level is denoted by∗, ∗∗ and ∗∗∗, respectively.
41

Table A.5: Effects for Sub-Sahara Africa (SSA) and all other Southern countrieswithout SSA (w/o SSA)
(1)
INST (t-1) 0.371∗∗∗
(0.084)
ln(Population) 0.096(0.119)
ln(GDPpc) 0.667∗∗∗
(0.235)
Press Freedom 0.372(0.303)
Conflicts 0.106(1.005)
PTAs w/o SSA (t-1) -0.041(0.037)
Depth w/o SSA (t-1) 0.181∗∗∗
(0.051)
PTA SSA (t-1) 0.258∗∗
(0.111)
Depth SSA (t-1) -0.310(0.295)
Obs. N 595Countries 90# Instruments 32Lags t-3, t-4AB(2) p-value 0.001AB(3) p-value 0.749Hansen p-value 0.157
Notes:
(i) Windmeijer-corrected cluster-robust standard errors in parentheses.
(ii) All models include country and year fixed effects.
(iii) Instruments are collapsed.
(iv) Significance at the 10, 5, and 1 percent level is denoted by∗, ∗∗ and ∗∗∗, respectively.
42

Table A.6: Effects for agreements with and without investment provisions withoutSSA and for SSA
(1)
INST (t-1) 0.423∗∗∗
(0.098)
ln(Population) -0.038(0.133)
ln(GDPpc) 0.578∗
(0.301)
Press Freedom 1.199∗∗
(0.470)
Conflicts 2.577(1.553)
PTAs w/o IP (t-1)×no SSA -0.195∗∗∗
(0.064)
Depth w/o IP (t-1)×no SSA 0.145(0.112)
TIPs (t-1)×no SSA 0.316∗∗∗
(0.113)
PTAs w/o IP (t-1)×SSA 0.297(0.379)
Depths w/o IP (t-1)×SSA -0.142(0.437)
TIPs (t-1)×SSA -0.131(0.374)
Obs. N 595Countries 90# Instruments 28Lags t-3AB(2) p-value 0.002AB(3) p-value 0.667Hansen p-value 0.189
Notes:
(i) Windmeijer-corrected cluster-robust standard errors in parentheses.
(ii) All models include country and year fixed effects.
(iii) Instruments are collapsed.
(iv) Significance at the 10, 5, and 1 percent level is denoted by∗, ∗∗ and ∗∗∗, respectively.
43

Hohenheim Discussion Papers in Business, Economics and Social Sciences The Faculty of Business, Economics and Social Sciences continues since 2015 the established “FZID Discussion Paper Series” of the “Centre for Research on Innovation and Services (FZID)” under the name “Hohenheim Discussion Papers in Business, Economics and Social Sciences”. Institutes 510 Institute of Financial Management 520 Institute of Economics 530 Institute of Health Care & Public Management 540 Institute of Communication Science 550 Institute of Law and Social Sciences 560 Institute of Economic and Business Education 570 Institute of Marketing & Management 580 Institute of Interorganizational Management & Performance Research Areas (since 2017) INEPA “Inequality and Economic Policy Analysis” TKID “Transformation der Kommunikation – Integration und Desintegration” NegoTrans “Negotiation Research – Transformation, Technology, Media and Costs” INEF “Innovation, Entrepreneurship and Finance” Download Hohenheim Discussion Papers in Business, Economics and Social Sciences from our homepage: https://wiso.uni-hohenheim.de/papers No. Author Title Inst 01-2015 Thomas Beissinger,
Philipp Baudy THE IMPACT OF TEMPORARY AGENCY WORK ON TRADE UNION WAGE SETTING: A Theoretical Analysis
520
02-2015 Fabian Wahl
PARTICIPATIVE POLITICAL INSTITUTIONS AND CITY DEVELOPMENT 800-1800
520
03-2015 Tommaso Proietti, Martyna Marczak, Gianluigi Mazzi
EUROMIND-D: A DENSITY ESTIMATE OF MONTHLY GROSS DOMESTIC PRODUCT FOR THE EURO AREA
520
04-2015 Thomas Beissinger, Nathalie Chusseau, Joël Hellier
OFFSHORING AND LABOUR MARKET REFORMS: MODELLING THE GERMAN EXPERIENCE
520
05-2015 Matthias Mueller, Kristina Bogner, Tobias Buchmann, Muhamed Kudic
SIMULATING KNOWLEDGE DIFFUSION IN FOUR STRUCTURALLY DISTINCT NETWORKS – AN AGENT-BASED SIMULATION MODEL
520
06-2015 Martyna Marczak, Thomas Beissinger
BIDIRECTIONAL RELATIONSHIP BETWEEN INVESTOR SENTIMENT AND EXCESS RETURNS: NEW EVIDENCE FROM THE WAVELET PERSPECTIVE
520
07-2015 Peng Nie, Galit Nimrod, Alfonso Sousa-Poza
INTERNET USE AND SUBJECTIVE WELL-BEING IN CHINA
530

No. Author Title Inst 08-2015 Fabian Wahl
THE LONG SHADOW OF HISTORY ROMAN LEGACY AND ECONOMIC DEVELOPMENT – EVIDENCE FROM THE GERMAN LIMES
520
09-2015 Peng Nie, Alfonso Sousa-Poza
COMMUTE TIME AND SUBJECTIVE WELL-BEING IN URBAN CHINA
530
10-2015 Kristina Bogner
THE EFFECT OF PROJECT FUNDING ON INNOVATIVE PERFORMANCE AN AGENT-BASED SIMULATION MODEL
520
11-2015 Bogang Jun, Tai-Yoo Kim
A NEO-SCHUMPETERIAN PERSPECTIVE ON THE ANALYTICAL MACROECONOMIC FRAMEWORK: THE EXPANDED REPRODUCTION SYSTEM
520
12-2015 Volker Grossmann Aderonke Osikominu Marius Osterfeld
ARE SOCIOCULTURAL FACTORS IMPORTANT FOR STUDYING A SCIENCE UNIVERSITY MAJOR?
520
13-2015 Martyna Marczak Tommaso Proietti Stefano Grassi
A DATA–CLEANING AUGMENTED KALMAN FILTER FOR ROBUST ESTIMATION OF STATE SPACE MODELS
520
14-2015 Carolina Castagnetti Luisa Rosti Marina Töpfer
THE REVERSAL OF THE GENDER PAY GAP AMONG PUBLIC-CONTEST SELECTED YOUNG EMPLOYEES
520
15-2015 Alexander Opitz DEMOCRATIC PROSPECTS IN IMPERIAL RUSSIA: THE REVOLUTION OF 1905 AND THE POLITICAL STOCK MARKET
520
01-2016 Michael Ahlheim,
Jan Neidhardt NON-TRADING BEHAVIOUR IN CHOICE EXPERIMENTS
520
02-2016 Bogang Jun, Alexander Gerybadze, Tai-Yoo Kim
THE LEGACY OF FRIEDRICH LIST: THE EXPANSIVE REPRODUCTION SYSTEM AND THE KOREAN HISTORY OF INDUSTRIALIZATION
520
03-2016 Peng Nie, Alfonso Sousa-Poza
FOOD INSECURITY AMONG OLDER EUROPEANS: EVIDENCE FROM THE SURVEY OF HEALTH, AGEING, AND RETIREMENT IN EUROPE
530
04-2016 Peter Spahn POPULATION GROWTH, SAVING, INTEREST RATES AND STAGNATION. DISCUSSING THE EGGERTSSON-MEHROTRA-MODEL
520
05-2016 Vincent Dekker, Kristina Strohmaier, Nicole Bosch
A DATA-DRIVEN PROCEDURE TO DETERMINE THE BUNCHING WINDOW – AN APPLICATION TO THE NETHERLANDS
520
06-2016 Philipp Baudy, Dario Cords
DEREGULATION OF TEMPORARY AGENCY EMPLOYMENT IN A UNIONIZED ECONOMY: DOES THIS REALLY LEAD TO A SUBSTITUTION OF REGULAR EMPLOYMENT?
520

No. Author Title Inst 07-2016 Robin Jessen,
Davud Rostam-Afschar, Sebastian Schmitz
HOW IMPORTANT IS PRECAUTIONARY LABOR SUPPLY?
520
08-2016 Peng Nie, Alfonso Sousa-Poza, Jianhong Xue
FUEL FOR LIFE: DOMESTIC COOKING FUELS AND WOMEN’S HEALTH IN RURAL CHINA
530
09-2016 Bogang Jun, Seung Kyu-Yi, Tobias Buchmann, Matthias Müller
THE CO-EVOLUTION OF INNOVATION NETWORKS: COLLABORATION BETWEEN WEST AND EAST GERMANY FROM 1972 TO 2014
520
10-2016 Vladan Ivanovic, Vadim Kufenko, Boris Begovic Nenad Stanisic, Vincent Geloso
CONTINUITY UNDER A DIFFERENT NAME. THE OUTCOME OF PRIVATISATION IN SERBIA
520
11-2016 David E. Bloom Michael Kuhn Klaus Prettner
THE CONTRIBUTION OF FEMALE HEALTH TO ECONOMIC DEVELOPMENT
520
12-2016 Franz X. Hof Klaus Prettner
THE QUEST FOR STATUS AND R&D-BASED GROWTH
520
13-2016 Jung-In Yeon Andreas Pyka Tai-Yoo Kim
STRUCTURAL SHIFT AND INCREASING VARIETY IN KOREA, 1960–2010: EMPIRICAL EVIDENCE OF THE ECONOMIC DEVELOPMENT MODEL BY THE CREATION OF NEW SECTORS
520
14-2016 Benjamin Fuchs THE EFFECT OF TEENAGE EMPLOYMENT ON CHARACTER SKILLS, EXPECTATIONS AND OCCUPATIONAL CHOICE STRATEGIES
520
15-2016 Seung-Kyu Yi Bogang Jun
HAS THE GERMAN REUNIFICATION STRENGTHENED GERMANY’S NATIONAL INNOVATION SYSTEM? TRIPLE HELIX DYNAMICS OF GERMANY’S INNOVATION SYSTEM
520
16-2016 Gregor Pfeifer Fabian Wahl Martyna Marczak
ILLUMINATING THE WORLD CUP EFFECT: NIGHT LIGHTS EVIDENCE FROM SOUTH AFRICA
520
17-2016 Malte Klein Andreas Sauer
CELEBRATING 30 YEARS OF INNOVATION SYSTEM RESEARCH: WHAT YOU NEED TO KNOW ABOUT INNOVATION SYSTEMS
570
18-2016 Klaus Prettner THE IMPLICATIONS OF AUTOMATION FOR ECONOMIC GROWTH AND THE LABOR SHARE
520
19-2016 Klaus Prettner Andreas Schaefer
HIGHER EDUCATION AND THE FALL AND RISE OF INEQUALITY
520
20-2016 Vadim Kufenko Klaus Prettner
YOU CAN’T ALWAYS GET WHAT YOU WANT? ESTIMATOR CHOICE AND THE SPEED OF CONVERGENCE
520
No. Author Title Inst 01-2017 Annarita Baldanzi
Alberto Bucci Klaus Prettner
CHILDRENS HEALTH, HUMAN CAPITAL ACCUMULATION, AND R&D-BASED ECONOMIC GROWTH
INEPA
02-2017 Julius Tennert Marie Lambert Hans-Peter Burghof
MORAL HAZARD IN VC-FINANCE: MORE EXPENSIVE THAN YOU THOUGHT
INEF
03-2017 Michael Ahlheim Oliver Frör Nguyen Minh Duc Antonia Rehl Ute Siepmann Pham Van Dinh
LABOUR AS A UTILITY MEASURE RECONSIDERED
520
04-2017 Bohdan Kukharskyy Sebastian Seiffert
GUN VIOLENCE IN THE U.S.: CORRELATES AND CAUSES
520
05-2017 Ana Abeliansky Klaus Prettner
AUTOMATION AND DEMOGRAPHIC CHANGE 520
06-2017 Vincent Geloso Vadim Kufenko
INEQUALITY AND GUARD LABOR, OR PROHIBITION AND GUARD LABOR?
INEPA
07-2017 Emanuel Gasteiger Klaus Prettner
ON THE POSSIBILITY OF AUTOMATION-INDUCED STAGNATION
520
08-2017 Klaus Prettner Holger Strulik
THE LOST RACE AGAINST THE MACHINE: AUTOMATION, EDUCATION, AND INEQUALITY IN AN R&D-BASED GROWTH MODEL
INEPA
09-2017 David E. Bloom Simiao Chen Michael Kuhn Mark E. McGovern Les Oxley Klaus Prettner
THE ECONOMIC BURDEN OF CHRONIC DISEASES: ESTIMATES AND PROJECTIONS FOR CHINA, JAPAN, AND SOUTH KOREA
520
10-2017 Sebastian Till Braun Nadja Dwenger
THE LOCAL ENVIRONMENT SHAPES REFUGEE INTEGRATION: EVIDENCE FROM POST-WAR GERMANY
INEPA
11-2017 Vadim Kufenko Klaus Prettner Vincent Geloso
DIVERGENCE, CONVERGENCE, AND THE HISTORY-AUGMENTED SOLOW MODEL
INEPA
12-2017 Frank M. Fossen Ray Rees Davud Rostam-Afschar Viktor Steiner
HOW DO ENTREPRENEURIAL PORTFOLIOS RESPOND TO INCOME TAXATION?
520
13-2017 Steffen Otterbach Michael Rogan
SPATIAL DIFFERENCES IN STUNTING AND HOUSEHOLD AGRICULTURAL PRODUCTION IN SOUTH AFRICA: (RE-) EXAMINING THE LINKS USING NATIONAL PANEL SURVEY DATA
INEPA
14-2017 Carolina Castagnetti Luisa Rosti Marina Töpfer
THE CONVERGENCE OF THE GENDER PAY GAP – AN ALTERNATIVE ESTIMATION APPROACH
INEPA

No. Author Title Inst 15-2017 Andreas Hecht ON THE DETERMINANTS OF SPECULATION – A
CASE FOR EXTENDED DISCLOSURES IN CORPORATE RISK MANAGEMENT
510
16-2017 Mareike Schoop D. Marc Kilgour (Editors)
PROCEEDINGS OF THE 17TH INTERNATIONAL CONFERENCE ON GROUP DECISION AND NEGOTIATION
NegoTrans
17-2017 Mareike Schoop D. Marc Kilgour (Editors)
DOCTORAL CONSORTIUM OF THE 17TH INTERNATIONAL CONFERENCE ON GROUP DECISION AND NEGOTIATION
NegoTrans
18-2017 Sibylle Lehmann-Hasemeyer Fabian Wahl
SAVING BANKS AND THE INDUSTRIAL REVOLUTION IN PRUSSIA SUPPORTING REGIONAL DEVELOPMENT WITH PUBLIC FINANCIAL INSTITUTIONS
520
19-2017 Stephanie Glaser A REVIEW OF SPATIAL ECONOMETRIC MODELS FOR COUNT DATA
520
20-2017 Dario Cords ENDOGENOUS TECHNOLOGY, MATCHING, AND LABOUR UNIONS: DOES LOW-SKILLED IMMIGRATION AFFECT THE TECHNOLOGICAL ALIGNMENT OF THE HOST COUNTRY?
INEPA
21-2017 Micha Kaiser Jan M. Bauer
PRESCHOOL CHILD CARE AND CHILD WELL-BEING IN GERMANY: DOES THE MIGRANT EXPERIENCE DIFFER?
INEPA
22-2017 Thilo R. Huning Fabian Wahl
LORD OF THE LEMONS: ORIGIN AND DYNAMICS OF STATE CAPACITY
520
23-2017 Matthias Busse Ceren Erdogan Henning Mühlen
STRUCTURAL TRANSFORMATION AND ITS RELEVANCE FOR ECONOMIC GROWTH IN SUB-SHARAN AFRICA
INEPA
24-2017 Sibylle Lehmann-Hasemeyer Alexander Opitz
THE VALUE OF POLITICAL CONNECTIONS IN THE FIRST GERMAN DEMOCRACY – EVIDENCE FROM THE BERLIN STOCK EXCHANGE
520
25-2017 Samuel Mburu Micha Kaiser Alfonso Sousa-Poza
LIFESTOCK ASSET DYNAMICS AMONG PASTORALISTS IN NORTHERN KENYA
INEPA
26-2017
Marina Töpfer DETAILED RIF DECOMPOSITION WITH SELECTION – THE GENDER PAY GAP IN ITALY
INEPA
27-2017 Robin Jessen Maria Metzing Davud Rostam-Afschar
OPTIMAL TAXATION UNDER DIFFERENT CONCEPTS OF JUSTNESS
INEPA
28-2017 Alexander Kressner Katja Schimmelpfeng
CLUSTERING SURGICAL PROCEDURES FOR MASTER SURGICAL SCHEDULING
580
29-2017 Clemens Lankisch Klaus Prettner Alexia Prskawetz
ROBOTS AND THE SKILL PREMIUM: AN AUTOMATION-BASED EXPLANATION OF WAGE INEQUALITY
INEPA

No. Author Title Inst 30-2017 Ann-Sophie Adelhelm
Melanie Bathelt Mirjam Bathelt Bettina Bürkin Sascha Klein Sabrina Straub Lea Wagner Fabienne Walz
ARBEITSWELT: DIGITAL – BELASTUNG: REAL? DER ERLEBTE WANDEL DER ARBEITSWELT INNERHALB DER IT-BRANCHE AUS SICHT DER ARBEITNEHMER
550
31-2017 Annarita Baldanzi Klaus Prettner Paul Tscheuschner
LONGEVITY-INDUCED VERICAL INNOVATION AND THE TRADEOFF BETWEEN LIFE AND GROWTH
520
32-2017 Vincent Dekker Kristina Strohmaier
THE EFFECT OF TRANSFER PRICING REGULATIONS ON INTRA-INDUSTRY TRADE
520
01-2018 Michael D. Howard
Johannes Kolb
FOUNDER CEOS AND NEW VENTURE MEDIA COVERAGE
INEF
02-2018 Peter Spahn UNCONVENTIONAL VIEWS ON INFLATION CONTRAOL: FORWARD GUIDANCE, THE NEO-FISHERIAN APPROACH, AND THE FISCAL THEORY OF THE PRICE LEVEL
520
03-2018 Aderonke Osikominu Gregor Pfeifer
PERCEIVED WAGES AND THE GENDER GAP IN STEM FIELDS
INEPA
04-2018 Theresa Grafeneder-Weissteiner Klaus Prettner Jens Südekum
THREE PILLARS OF URBANIZATION: MIGRATION, AGING, AND GROWTH
INEPA
05-2018 Vadim Kufenko Vincent Geloso Klaus Prettner
DOES SIZE MATTER? IMPLICATIONS OF HOUSEHOLD SIZE FOR ECONOMIC GROWTH AND CONVERGENCE
INEPA
06-2018 Michael Trost THE WHOLE IS GREATER THAN THE SUM OF ITS PARTS – PRICING PRESSURE INDICES FOR MERGERS OF VERTICALLY INTEGRATED FIRMS
520
07-2018 Karsten Schweikert TESTING FOR COINTEGRATION WITH TRESHOLD ADJUSTMENT IN THE PRESENCE OF STRUCTURAL BREAKS
520
08-2018 Evanthia Fasoula Karsten Schweikert
PRICE REGULATIONS AND PRICE ADJUSTMENT DYNAMICS: EVIDENCE FROM THE AUSTRIAN RETAIL FUEL MARKET
520
09-2018 Michael Ahlheim Jan Neidhardt Ute Siepmann Xiaomin Yu
WECHAT – USING SOCIAL MEDIA FOR THE ASSESSMENT OF TOURIST PREFERENCES FOR ENVIRONMENTAL IMPROVEMENTS IN CHINA
520

No. Author Title Inst 10-2018 Alexander Gerybadze
Simone Wiesenauer
THE INTERNATIONAL SALES ACCELERATOR: A PROJECT MANAGEMENT TOOL FOR IMPROVING SALES PERFORMANCE IN FOREIGN TARGET MARKETS
570
11-2018 Klaus Prettner Niels Geiger Johannes Schwarzer
DIE WIRTSCHAFTLICHEN FOLGEN DER AUTOMATISIERUNG
INEPA
12-2018 Martyna Marczak Thomas Beissinger
COMPETITIVENESS AT THE COUNTRY-SECTOR LEVEL: NEW MEASURES BASED ON GLOBAL VALUE CHAINS
520
13-2018 Niels Geiger Klaus Prettner Johannes Schwarzer
AUTOMATISIERUNG, WACHSTUM UND UNGLEICHHEIT
INEPA
14-2018 Klaus Prettner Sebastian Seiffert
THE SIZE OF THE MIDDLE CLASS AND EDUCATIONAL OUTCOMES: THEORY AND EVIDENCE FROM THE INDIAN SUBCONTINENT
INEPA
15-2018 Marina Töpfer THE EFFECT OF WOMEN DIRECTORS ON INNOVATION ACTIVITY AND PERFORMANCE OF CORPORATE FIRMS - EVIDENCE FROM CHINA –
INEF
16-2018 Timo Walter TRADE AND WELFARE EFFECTS OF A POTENTIAL FREE TRADE AGREEMENT BETWEEN JAPAN AND THE UNITED STATES
INEPA
17-2018 Jonas Frank THE EFFECTS OF ECONOMIC SANCTIONS ON TRADE: NEW EVIDENCE FROM A PANEL PPML GRAVITY APPROACH
INEPA
18-2018 Jonas Frank THE EFFECT OF CULTURE ON TRADE OVER TIME – NEW EVIDENCE FROM THE GLOBE DATA SET
520
19-2018 Dario Cords Klaus Prettner
TECHNOLOGICAL UNEMPLOYMENT REVISITED: AUTOMATION IN A SEARCH AND MATCHING FRAMEWORK
INEPA
20-2018 Sibylle Lehmann-Hasemeyer Andreas Neumayer
THE PERSISTENCE OF OWNERSHIP INEQUALITY – INVESTORS ON THE GERMAN STOCK EXCHANGES, 1869-1945
INEPA
21-2018 Nadja Dwenger Lukas Treber
SHAMING FOR TAX ENFORCEMENT: EVIDENCE FROM A NEW POLICY
520
22-2018 Octavio Escobar Henning Mühlen
THE ROLE OF FDI IN STRUCTURAL CHANGE: EVIDENCE FROM MEXICO
520
23-2018 Davud Rostam-Afschar Kristina Strohmaier
DOES REGULATION TRADE-OFF QUALITY AGAINST INEQUALITY? THE CASE OF GERMAN ARCHITECTS AND CONSTRUCTION ENGINEERS
INEPA

No. Author Title Inst 24-2018 Peng Nie
Lanlin Ding Alfonso Sousa-Poza
OBESITY INEQUALITY AND THE CHANGING SHAPE OF THE BODYWEIGHT DISTRIBUTION IN CHINA
INEPA
25-2018 Michael Ahlheim Maike Becker Yeniley Allegue Losada Heike Trastl
WASTED! RESOURCE RECOVERY AND WASTE MANAGEMENT IN CUBA
520
26-2018 Peter Spahn WAS WAR FALSCH AM MERKANTILISMUS?
520
27-2018 Sophie Therese Schneider NORTH_SOUTH TRADE AGREEMENTS AND THE QUALITY OF INSTITUTIONS: PANEL DATA EVIDENCE
INEPA

IMPRINT
University of HohenheimDean’s Office of the Faculty of Business, Economics and Social SciencesPalace Hohenheim 1 B70593 Stuttgart | GermanyFon +49 (0)711 459 22488Fax +49 (0)711 459 [email protected]