NORTH SEA STUDY OCCASIONAL PAPER No. 103 SEA STUDY OCCASIONAL PAPER No. 103 Financial Liability for...
154
NORTH SEA STUDY OCCASIONAL PAPER No. 103 Financial Liability for Decommissioning in the UKCS: the Comparative Effects of LOCs, Surety Bonds, and Trust Funds Professor Alexander G. Kemp and Linda Stephen October 2006 Price £25.00 DEPARTMENT OF ECONOMICS
Transcript of NORTH SEA STUDY OCCASIONAL PAPER No. 103 SEA STUDY OCCASIONAL PAPER No. 103 Financial Liability for...

NORTH SEA STUDY OCCASIONAL PAPER No. 103
Financial Liability for Decommissioning in the UKCS: the Comparative Effects of LOCs, Surety Bonds, and Trust
Funds
Professor Alexander G. Kemp and Linda Stephen
October 2006 Price £25.00
DEPARTMENT OF ECONOMICS

i
ISSN 0143-022X
NORTH SEA ECONOMICS Research in North Sea Economics has been conducted in the Economics Department since 1973. The present and likely future effects of oil and gas developments on the Scottish economy formed the subject of a long term study undertaken for the Scottish Office. The final report of this study, The Economic Impact of North Sea Oil on Scotland, was published by HMSO in 1978. In more recent years further work has been done on the impact of oil on local economies and on the barriers to entry and characteristics of the supply companies in the offshore oil industry. The second and longer lasting theme of research has been an analysis of licensing and fiscal regimes applied to petroleum exploitation. Work in this field was initially financed by a major firm of accountants, by British Petroleum, and subsequently by the Shell Grants Committee. Much of this work has involved analysis of fiscal systems in other oil producing countries including Australia, Canada, the United States, Indonesia, Egypt, Nigeria and Malaysia. Because of the continuing interest in the UK fiscal system many papers have been produced on the effects of this regime. From 1985 to 1987 the Economic and Social Science Research Council financed research on the relationship between oil companies and Governments in the UK, Norway, Denmark and The Netherlands. A main part of this work involved the construction of Monte Carlo simulation models which have been employed to measure the extents to which fiscal systems share in exploration and development risks. Over the last few years the research has examined the many evolving economic issues generally relating to petroleum investment and related fiscal and regulatory matters. Subjects researched include the economics of incremental investments in mature oil fields, economic aspects of the CRINE initiative, economics of gas developments and contracts in the new market situation, economic and tax aspects of tariffing, economics of infrastructure cost sharing, the effects of comparative petroleum fiscal systems on incentives to develop fields and undertake new exploration, the oil price responsiveness of the UK petroleum tax system, and the economics of decommissioning, mothballing and re-use of facilities. This work has been financed by a group of oil companies and Scottish Enterprise, Energy For 2006 the programme examines the following subjects:
a) Infrastructure Availability in Long-Term (post 2020) and Terms of Access after 2003 PRT Change and New Code Of Practice
b) Effects of Any Upstream Tax Changes on UKCS c) Economic Analysis of Exploration Success since c. 2000 d) Prospects for Activity Levels in the UKCS to 2030 (update) e) Prospects for UK Gas/Supply and Demand (update) f) Economic Aspects of CO2 Capture, Sequestration and EOR g) Economics of Heavy Oil
The authors are solely responsible for the work undertaken and views expressed. The sponsors are not committed to any of the opinions emanating from the studies.

ii
Papers are available from: The Secretary (NSO Papers) Department of Economics University of Aberdeen Business School Edward Wright Building Dunbar Street Aberdeen A24 3QY Tel No: (01224) 273427 Fax No: (01224) 272181 Email: [email protected] Recent papers published are: OP 95 Economic Aspects of Incremental Projects in the UKCS
By A G Kemp and Linda Stephen (June 2004), pp. 60 £20.00
OP 96 The Prospects for UK Gas Supply and Demand By A G Kemp and Linda Stephen (September 2004), pp.38
£20.00
OP 97 Economic Aspects of Prospective Decommissioning Activity In the UKCS to 2030 By A G Kemp and Linda Stephen (December 2004), pp.61
£20.00
OP 98 Prospects for Activity Levels in the UKCS to 2030: the 2005 Perspective By A G Kemp and Linda Stephen (May 2005), pp. 52
£20.00
OP 99 A Longitudinal Study of Fallow Dynamics in the UKCS By A G Kemp and Sola Kasim, (September 2005), pp. 42
£20.00
OP 100 Options for Exploiting Gas from West of Scotland By A G Kemp and Linda Stephen, (December 2005), pp. 70
£20.00
OP 101 Prospects for Activity Levels in the UKCS to 2035 after the 2006 Budget By A G Kemp and Linda Stephen, (April 2006) pp. 61
£30.00
OP 102 Developing a Supply Curve for CO2 Capture, Sequestration and EOR in the UKCS: an Optimised Least-Cost Analytical Framework By A G Kemp and Sola Kasim, (May 2006) pp. 39
£20.00
OP 103 Financial Liability for Decommissioning in the UKCS: the Comparative Effects of LOCs, Surety Bonds and Trust Funds By A G Kemp and Linda Stephen, (October 2006) pp. 150
£25.00

Financial Liability for Decommissioning in the UKCS: the Comparative Effects of LOCs, Surety Bonds, and Trust
Funds
Professor Alexander G. Kemp and Linda Stephen
Contents Page 1. Introduction............................................................................................... 1 2. Data, Methodology, and Modelling Assumptions.................................... 6 3. Results..................................................................................................... 10 a) Without Financial Security Scheme............................................. 10 b) LOC Scheme ................................................................................ 15 c) Surety Bond.................................................................................. 33 d) Trust Funds (Five) ........................................................................ 48 4. Small Operators, Front-End Field Risks, and LOCs ............................ 115 5. Summary and Conclusions ................................................................... 125

1
Financial Liability for Decommissioning in the UKCS: the Comparative Effects of LOCs, Surety Bonds, and Trust
Funds 1. Introduction
The subject of the decommissioning of oil and gas fields in the UKCS has many
facets. One of the main economic ones relates to the financial liability for the
activity. In the UK there is clear joint and several liability among co-licensees.
Further, the Government can request, and in some circumstances require, a
licensee to provide financial security for the prospective decommissioning
costs. Asset transactions involving mature fields have become increasingly
common with some companies specialising in maximising economic recovery
from mature fields. In such cases while the decommissioning obligation may be
transferred from the initial licensee to the new one the Government may insist
that liability stays with the original one if there are doubts about the financial
competence of the new licensee to fulfil the work obligation.
Requests by the Government to provide financial security are conventionally
triggered when the remaining net present value (RNPV) from a field falls below
a threshold value in relation to the (gross) decommissioning costs. A trigger
value of 150% of decommissioning costs is common. Nowadays very small
field developments are not uncommon. In such circumstances the DTI can also
request financial security for decommissioning to be provided at the time of the
field development. This is to protect the Government against a major reservoir
failure which could take effect at the date of early production.
While a considerable number of schemes can in principle deal with the problem
in the UK Letters of Credit (LOCs) are the only instrument currently employed.
These involve the payment of a fee to the bank providing the guarantee. The

2
fee is tax deductible for corporation tax (CT), Supplementary Charge (SC) and
Petroleum Revenue Tax (PRT), but the LOCs have to be disclosed in the
company’s accounts and they impact on its borrowing capacity and costs.
Other methods of providing security for decommissioning include Surety Bonds
and Decommissioning Trusts. Surety Bonds are used in the Gulf of Mexico by
the Minerals Management Service (MMS). The Bond issuer is generally
essentially an unsecured creditor who requires an indemnity from the licensee.
Although assets of the licensee are not routinely required as collateral, the
indemnity permits the bond issuer to call for collateral when he feels this is
necessary. The bond provider will regularly monitor the situation of the
licensee, checking whether he is making proper provision for decommissioning
and what other assets he has available. There will be a limit of the value of a
bond which a surety company would issue to a licensee. Unlike LOCs Surety
Bonds do not need to be disclosed by the licensee and so they do not affect his
credit rating. In the Gulf of Mexico the MMS decides what level of surety is
required by a licensee. The bond issuer generally agrees to have the work
undertaken if the licensee is unable to fulfil his decommissioning work
obligation. This is in contrast to the situation with the LOC scheme. In the
present study to facilitate ready comparison with the typical LOC the bond was
assumed to be required when field RNPV reached 150% of gross
decommissioning costs.
Decommissioning Trust Funds or variants on them such as escrow accounts
have become increasingly common over the last 15 years or so in different parts
of the world. They involve the deposit of Funds by licensees into an alienated
Fund (or escrow account) such that the contributions plus any net income
earned by the Fund accrue to meet the decommissioning costs. It is again
assumed for purposes of ready comparison with the other schemes that

3
contributions commence when RNPV reaches 150% of gross decommissioning
costs. The application of this simple formula sometimes meant that there was a
shortfall in the Fund in relation to the decommissioning costs. In such cases the
amount of the shortfall was relieved against tax (CT, SC, and PRT) as
appropriate under current tax rules when the expenditures were incurred. These
rules currently do not permit contributions to a Trust Fund to be tax deductible.
This is a severe impediment to the use of this scheme. In other countries where
they exist tax deductibility for the contributions exists. An example of a
licensing system comparable to the UK is Namibia. In several other
jurisdictions where Production Sharing Contracts are the norm contributions to
Funds or escrow accounts are cost recoverable and tax deductible. Notable
examples are Angola, Azerbaijan and Sakhalin.
In this study the cases where contributions to Trust Funds are (a) non-deductible
and (b) deductible are both examined to highlight the large differences which
emerge. In the UK discretionary trusts would be the relevant vehicles which
would be employed to implement the Decommissioning Trust concept. Under
current tax rules the income from monies invested in such trusts would be taxed
at 40%. Further, there would be a liability to Inheritance Tax after 10 years (at
6%) and when Funds were withdrawn to pay for the decommissioning work (at
20%). The application of Inheritance Tax in this manner would be so punitive
as to inhibit the application of the whole scheme. It is also unattractive to
investors if the contributions are not tax deductible.
In the study the modelling of the effects of the schemes has been undertaken to
reflect current market conditions. Thus for the LOC the fee has been set at
1.5% of the decommissioning cost after taking into account the potential
contribution from the net cash flows while the field is still producing. Thus the
base for the LOC cost would increase as the field approached the cessation of

4
production point as the field revenues decreased. The increase in the borrowing
costs from the LOC scheme was assumed to be the base interest rate currently at
4.75%. The base to which this applied was taken to be the same as for the fee
for the LOC.
For the Surety Bond the costs were assumed to be 3.5% of the decommissioning
cost again taking into account the contributions from remaining field net cash
flows, with the cost payment thus increasing as the field net cash flows
declined.
With the Trust Fund the assumption was that the contributions would follow the
production curve after payments were triggered. Thus the contributions would
decline from the trigger point onwards. For modelling purposes the size of the
contributions was assumed to take into account the (net) income earned on the
sums invested in the Fund. Discretionary Funds of this type are permitted to
invest in a prudent selection of equities and bonds. Given the volatility of
financial markets over the years it was decided to model two cases. Under the
first the return on the monies invested was a modest 4.75% in MOD terms and
under the second it was 10% again in MOD terms.
Under current practice the DTI exercises discretion regarding which licensees it
requests financial security from. This involves much judgement regarding the
risks involved form the Government’s viewpoint. The present study avoids
these major judgements and concentrates on examining the comparative costs
and effects of the schemes as applied to all fields in the UKCS from 2006
onwards. The analysis highlights the comparative costs and effects of the
schemes as seen from the viewpoint of investors and the Treasury as custodian
of the taxpayer’s interests. The costs involved are inevitably higher when

5
applied to all fields, but they can be scaled down to reflect the application of the
schemes on a selective basis.
The study highlights not only the direct costs to investors and the Treasury but
also the effects of lost production and field expenditures from changes in
behaviour brought about by the introduction of the schemes. Lost production
can emanate from two sources namely, (1) earlier cessation of production from
developed fields from payment of the fees and perhaps Trust Fund
contributions, and (2) marginal field developments deterred as a consequence of
the payments. With respect to the Trust Fund it is not at all clear whether
behaviour would change as a consequence of making payments into a Fund.
While net cash flows are reduced when contributions are being made they are
improved later when the decommissioning work has to be undertaken.
Accordingly cases where behaviour is changed and unchanged are both
considered.
The possible changes in behaviour with respect to cessation of production relate
to the perceived need of the investor to avoid continuing production while
making a net operating loss. Thus there could be an incentive following the
introduction of the schemes with the associated payments to accelerate cessation
of production. Similarly, if a field or incremental project is very marginal there
can be an incentive not to develop the project at all. These possibilities are
examined in detail in the study.
The Government clearly needs to optimise its risks with respect to the
decommissioning liability problem. The present study in effect shows the costs
to investors and the Treasury resulting from the Government deciding to
procure assurances against all the risks. This provides a base from which

6
judgements can be made about the possible effects of the Government accepting
different degrees of risk.
This issue comes up when mature assets are sold but the provisions of Section
29 of the Petroleum Act 1998 have not been withdrawn and/or threats of
liability under Section 34 of the same Act remain. The sellers would clearly
desire to be released from Section 29 and have the Section 34 powers removed,
and these issues could affect their attitude to asset transactions which otherwise
from a national viewpoint could be very desirable. The question of how
financial security is best handled then arises. The present study gives insights
into the pros and cons of different options.
2. Data, Methodology, and Modelling Assumptions
Three large databases incorporating basic field-related data for all of the UKCS
has been built up over many years in the Department of Economics, University
of Aberdeen. Data on all investment expenditures, operating costs, production,
and decommissioning costs are incorporated in these databases. The UKOOA
field database (late 2005 vintage) contains sanctioned fields (316), incremental
projects (112), probable fields (19) and possible fields (23) that have been
validated by the operators of the fields concerned. The fields in question relate
to all those developed since the 1960’s, including those which have
development approval but are not yet producing. Also included are future fields
which have not yet received development approval but are seriously being
considered for development by the operators concerned. The second database
consists of technical reserve fields (215) which are updated annually. It
includes some fields which were formerly in the “possible” field category but
have been subsequently downgraded by the operators. The third database
models potential new discoveries.

7
The exploration effort was based on a combination of the average effort since
1997 and prospective oil/gas price behaviour.
Three oil/gas price scenarios were used as follows:
Oil Price (real) $/bbl
Gas Price (real) Pence/therm
High 40 36 Medium 30 28 Low 25 24
The number of exploration wells, shown below, associated with each price
scenario was assumed to decline linearly over time.
2006 2030 High 50 38 Medium 38 27 Low 31 20
The exploration success rates were based on a combination of the experience
since 1997 and the size of effort. It has been assumed that with the higher the
effort more discoveries are made but the lower becomes the success rate as
more risky prospects become targeted. The success rate for the whole of the
UKCS with a medium effort is 23%, with a high effort 19% and with a low
effort 24%. These are in line with historic experience. It is also assumed that
technological progress will maintain these success rates in the period to 2030.
The aggregate historic data on (i) exploration effort and (ii) discoveries were
disaggregated according to the main regions, namely SNS, CNS, MF, NNS,
WoS and IS. Regional trends were established for the relative exploration
effort, discoveries and success rates in each of these regions and the data was
also split according to reserve type (oil, gas and condensate). Armed with this
information Monte Carlo simulation was undertaken to project discoveries in all
six regions in the period to 2030.

8
In the Monte Carlo modelling it was assumed that the size distribution of
discoveries would be lognormal following historic evidence. The SD was set at
50% of the mean value. The mean size of field decline through the period was
again based on historic evidence. Monte Carlo modelling was also used to
calculate the field development costs. For each region the average development
cost (per boe) of fields sanctioned in 1990’s plus the probable and possible
fields was calculated. The SD was assumed to be 20% of the mean.
The annual numbers of field developments going ahead were assumed to be
constrained by the capacity (physical and financial) of the industry. Over the
longer term the ceilings on the total numbers of potential field developments
(excluding incremental investments) were assumed to be as follows for the
different scenarios:
High 22 Medium 20 Low 17
The constraint took the form of curtailing the number of fields in the technical
reserves category going ahead in any one year. The Monte Carlo technique was
used to project through time the particular fields in this category which could be
developed.
The total numbers of field developments were also constrained by an economic
hurdle. Costs of capital of 10% and 15% in real, post-tax terms were employed
and minimum NPVs of £10 million required to reflect the risk: reward
relationship and the competitive position of the UKCS in relation to the other
opportunities around the world.

9
Regarding incremental projects those currently being examined should mostly
be executed in the next 3 years if they pass the economic hurdle.
It is very likely that further incremental projects will be examined in
medium/longer term. To obtain an understanding of the eventual potential,
further hypothetical incremental projects were modelled. They are based on
trends in volumes and costs for incremental projects over the past few years.
The execution of the additional incremental projects depends on the
prolongation of the lives of the infrastructure and possibly other incentives.
There are no guarantees that these extra projects will be undertaken.
The results of the modelling were tested against the official published data for
the whole of the UKCS. The results of the present study for the historical
period were found to be consistent with those from the official data.
The modelling was undertaken initially on the assumption that no financial
security arrangements were in place and that the decommissioning obligations
were fulfilled. On this basis the economic modelling calculated the cessation of
production (COP) dates and thus economic recovery from the fields. New
investments in incremental projects and fields were triggered in accordance with
the economic criteria discussed above.
The modelling subsequently repeated these exercises in turn with the
application of the different schemes for providing security for the
decommissioning liability. The results then highlighted any differences in
hydrocarbons recovered taking into account differences in COP and in new
developments. The different behavioural adjustments which could be made by
investors are also highlighted.

10
The decommissioning costs in this study are as estimated by the operators for
the sanctioned fields, incremental projects, probable and possible fields. For the
technical reserves, future incremental projects, and new discoveries the authors’
estimates, based on averages from the costs given by the operators, have been
used.
The costs include the decommissioning of field facilities and well-capping etc.,
and the removal of infield pipelines, but they exclude the decommissioning of
trunk pipelines and terminals. Drill cuttings are assumed to remain in situ.
3. Results a) Without Financial Security Scheme
Charts 1, 2 and 3 show the number of potential fields in production under
the 3 price scenarios. There will also be incremental projects but these
are not shown.
Chart 1
Potential Number of Fields in Production $30/bbl and 28p/therm
NPV : £10m @10% Real Post-tax Discount Rate
0
50
100
150
200
250
300
350
2006 2008 2010 2012 2014 2016 2018 2020 2022 2024 2026 2028 2030 2032 2034
No. of Fields
Sanctioned Incremental Future Incremental Probable FieldsPossible Fields Technical Reserves New Exploration

11
With the medium price the number of fields in production will peak at
289 in 2010 but the number of sanctioned fields will peak in 2007 at 276
fields. The sanctioned fields dominate the total until 2017. The
increasing number of fields reaching COP is a key feature.
Chart 2
With the high price the number of fields in production will peak at 317 in
2014 but the number of sanctioned fields will peak in 2007 at 282 fields.
The sanctioned fields dominate the total until 2016.
Potential Number of Fields in Production $40/bbl and 36p/therm
NPV : £10m @10% Real Post-tax Discount Rate
0
50
100
150
200
250
300
350
2006 2008 2010 2012 2014 2016 2018 2020 2022 2024 2026 2028 2030 2032 2034
No. of Fields
Sanctioned Incremental Future Incremental Probable FieldsPossible Fields Technical Reserves New Exploration

12
Chart 3
With the low price the number of fields in production will peak at 282 in
2008 but the number of sanctioned fields will peak in 2007 at 272 fields.
The sanctioned fields dominate the total until 2020.
The cumulative decommissioning costs to 2035 are shown.
Potential Number of Fields in Production $25/bbl and 24p/therm
NPV : £10m @10% Real Post-tax Discount Rate
0
50
100
150
200
250
300
350
2006 2008 2010 2012 2014 2016 2018 2020 2022 2024 2026 2028 2030 2032 2034
No. of Fields
Sanctioned Incremental Future Incremental Probable FieldsPossible Fields Technical Reserves New Exploration

13
Cumulative Decommissioning Costs 2006-2035 £ billion (rounded, 2006 prices) $25, 24p $30, 28p $40, 36p
Sanctioned + Incremental 11.09 11.11 11.15 Probable Fields 0.07 0.14 0.14 Possible Fields 0.11 0.12 0.13 Technical Reserves 0.89 1.67 1.93
New Discoveries 0.96 1.41 1.85 Total 13.12 14.45 15.20
The potential decommissioning costs for the 3 price scenarios are shown
in Charts 4, 5 and 6. The negative costs for incremental and future
incremental projects represent the ability of the incremental projects to
delay the COP dates for fields.
Chart 4
Chart 5
Potential Decommissioning Costs $30/bbl and 28p/therm
NPV : £10m @10% Real Post-tax Discount Rate
-1000
-500
0
500
1000
1500
2004 2006 2008 2010 2012 2014 2016 2018 2020 2022 2024 2026 2028 2030 2032 2034
£m 2006
Sanctioned Incremental Future Incremental Probable FieldsPossible Fields Technical Reserves New Exploration

14
Chart 5
Chart 6
Potential Decommissioning Costs $40/bbl and 36p/therm
NPV : £10m @10% Real Post-tax Discount Rate
-500
0
500
1000
1500
2000
2004 2006 2008 2010 2012 2014 2016 2018 2020 2022 2024 2026 2028 2030 2032 2034
£m 2006
Sanctioned Incremental Future Incremental Probable FieldsPossible Fields Technical Reserves New Exploration
Potential Decommissioning Costs $25/bbl and 24p/therm
NPV : £10m @10% Real Post-tax Discount Rate
-600 -400
-200 0
200400
600800
1000
12001400
2004 2006 2008 2010 2012 2014 2016 2018 2020 2022 2024 2026 2028 2030 2032 2034
£m 2006
Sanctioned Incremental Future Incremental Probable FieldsPossible Fields Technical Reserves New Exploration

15
It is clear from examination of the charts above that the oil/gas price
affects both the timing of decommissioning and the total
decommissioning cost to 2035. With higher oil/gas prices more fields
pass the economic hurdle rate and there are more discoveries from new
exploration. With lower prices decommissioning occurs earlier as the
economic limits of fields are reached earlier.
b) LOC Scheme
As noted above it is assumed that the LOC is instituted when remaining
NPV (RNPV) falls to 150% of the gross decommissioning costs and that
the requirement for LOCs continues until field decommissioning occurs.
The LOC scheme starts in 2006. The modelling reflects behavioural
changes namely (a) that accelerate decommissioning to avoid negative
cash flows, and (b) that investment in very marginal projects may be
deterred because of the LOC costs.
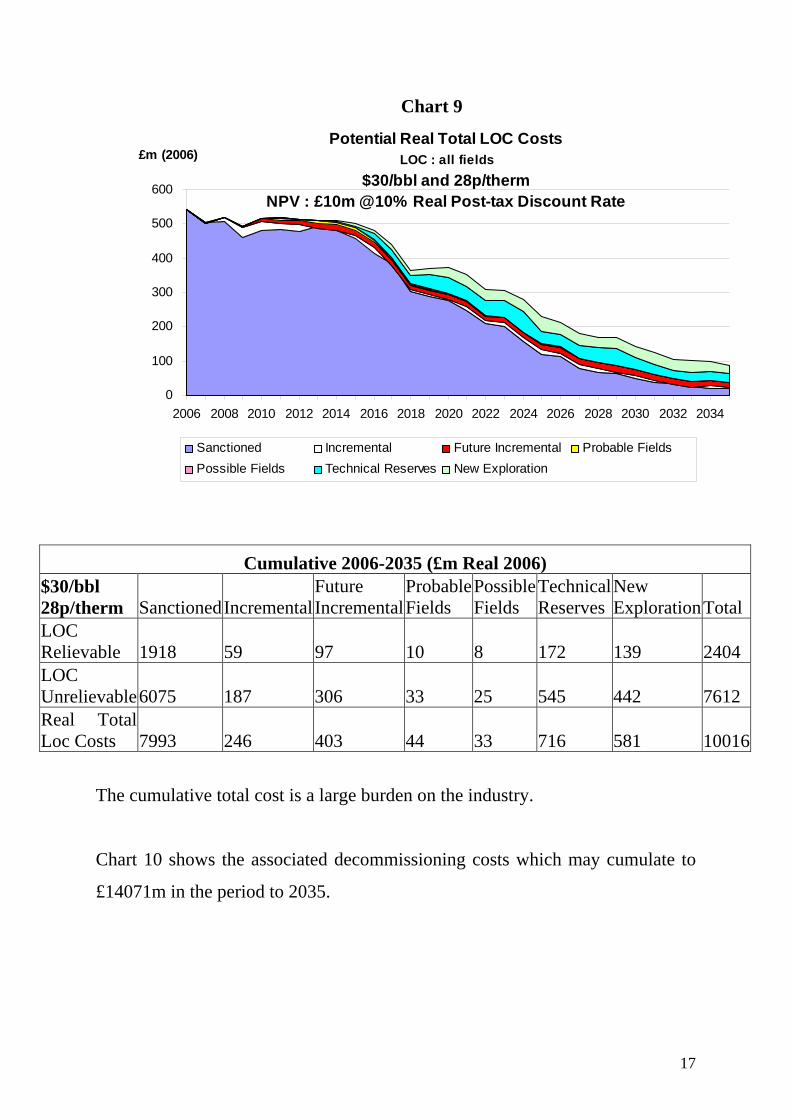
Chart 7 shows the LOC cost which obtains tax relief, Chart 8 shows the
LOC costs (increase in cost of capital) which are not relievable for tax
purposes1 and Chart 9 shows the total LOC cost under the medium price
assumption.
1 The increase in the cost of capital emanates from the reduction in debt capacity resulting from the
LOC. To some extent this can be tax deductible. In the case of the UKCS loan interest is allowed against CT but not against the SC nor PRT. The net reduction in debt capacity was taken to be 4.75% (the current base rate).

16
Chart 7
Chart 8
Potential Real LOC Relievable CostsLOC : all fields
$30/bbl and 28p/therm NPV : £10m @10% Real Post-tax Discount Rate
0
20
40
60
80
100
120
140
2006 2008 2010 2012 2014 2016 2018 2020 2022 2024 2026 2028 2030 2032 2034
£m (2006)
Sanctioned Incremental Future Incremental Probable FieldsPossible Fields Technical Reserves New Exploration
Potential Real LOC Unrelievable CostsLOC : all fields
$30/bbl and 28p/therm NPV : £10m @10% Real Post-tax Discount Rate
050
100150200250300350400450500
2006 2008 2010 2012 2014 2016 2018 2020 2022 2024 2026 2028 2030 2032 2034
£m (2006)
Sanctioned Incremental Future Incremental Probable FieldsPossible Fields Technical Reserves New Exploration
17
Chart 9
Cumulative 2006-2035 (£m Real 2006) $30/bbl 28p/therm Sanctioned Incremental
Future Incremental
Probable Fields
Possible Fields
Technical Reserves
New ExplorationTotal
LOC Relievable 1918 59 97 10 8 172 139 2404 LOC Unrelievable 6075 187 306 33 25 545 442 7612 Real Total Loc Costs 7993 246 403 44 33 716 581 10016
The cumulative total cost is a large burden on the industry.
Chart 10 shows the associated decommissioning costs which may cumulate to
£14071m in the period to 2035.
Potential Real Total LOC CostsLOC : all fields
$30/bbl and 28p/therm NPV : £10m @10% Real Post-tax Discount Rate
0
100
200
300
400
500
600
2006 2008 2010 2012 2014 2016 2018 2020 2022 2024 2026 2028 2030 2032 2034
£m (2006)
Sanctioned Incremental Future Incremental Probable FieldsPossible Fields Technical Reserves New Exploration

18
Chart 10
Chart 11 shows the total decommissioning relief under the medium price
which may cumulate, with the LOC relief, to £9387m in the period to
2035.
Chart 11
Potential Real Decommissioning CostsLOC : all fields
$30/bbl and 28p/therm NPV : £10m @10% Real Post-tax Discount Rate
-600
-400
-200
0
200
400
600
800
1000
2006 2008 2010 2012 2014 2016 2018 2020 2022 2024 2026 2028 2030 2032 2034
£m (2006)
Sanctioned Incremental Future Incremental Probable FieldsPossible Fields Technical Reserves New Exploration
Potential Real Decommissioning Relief (including LOC relief)LOC : all fields
$30/bbl and 28p/therm NPV : £10m @10% Real Post-tax Discount Rate
-400
-200
0
200
400
600
800
2006 2008 2010 2012 2014 2016 2018 2020 2022 2024 2026 2028 2030 2032 2034
£m (2006)
Sanctioned Incremental Future Incremental Probable FieldsPossible Fields Technical Reserves New Exploration

19
Chart 12 shows the relief given for LOC costs under the medium price
and this may cumulate to £1543m in the period to 2035.
Chart 12
Chart 13 shows the total LOC cost minus LOC tax relief under the
medium price. This may cumulate to £8473m in the period to 2035.
Potential Real LOC ReliefLOC : all fields
$30/bbl and 28p/therm NPV : £10m @10% Real Post-tax Discount Rate
0102030405060708090
100
2006 2008 2010 2012 2014 2016 2018 2020 2022 2024 2026 2028 2030 2032 2034
£m (2006)
Sanctioned Incremental Future Incremental Probable FieldsPossible Fields Technical Reserves New Exploration

20
Chart 13
Chart
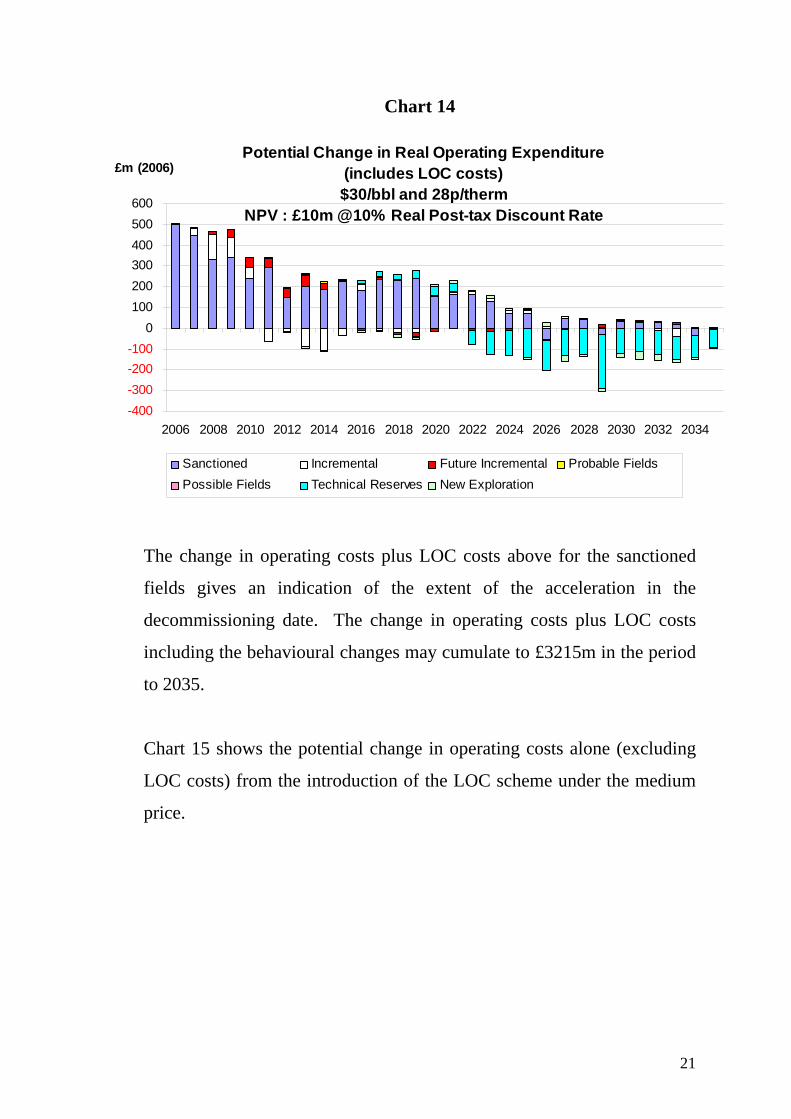
The introduction of an LOC scheme may accelerate the decommissioning
date and/or it may make some projects or field developments
uneconomic. Chart 14 shows the change in operating costs which may
occur once all fields are involved in a LOC scheme. The results
incorporate the increase in the total LOC costs (direct plus indirect).
Potential Real Total LOC Costs minus LOC ReliefLOC : all fields
$30/bbl and 28p/therm NPV : £10m @10% Real Post-tax Discount Rate
050
100150200250300350400450500
2006 2008 2010 2012 2014 2016 2018 2020 2022 2024 2026 2028 2030 2032 2034
£m (2006)
Sanctioned Incremental Future Incremental Probable FieldsPossible Fields Technical Reserves New Exploration
21
Chart 14
The change in operating costs plus LOC costs above for the sanctioned
fields gives an indication of the extent of the acceleration in the
decommissioning date. The change in operating costs plus LOC costs
including the behavioural changes may cumulate to £3215m in the period
to 2035.
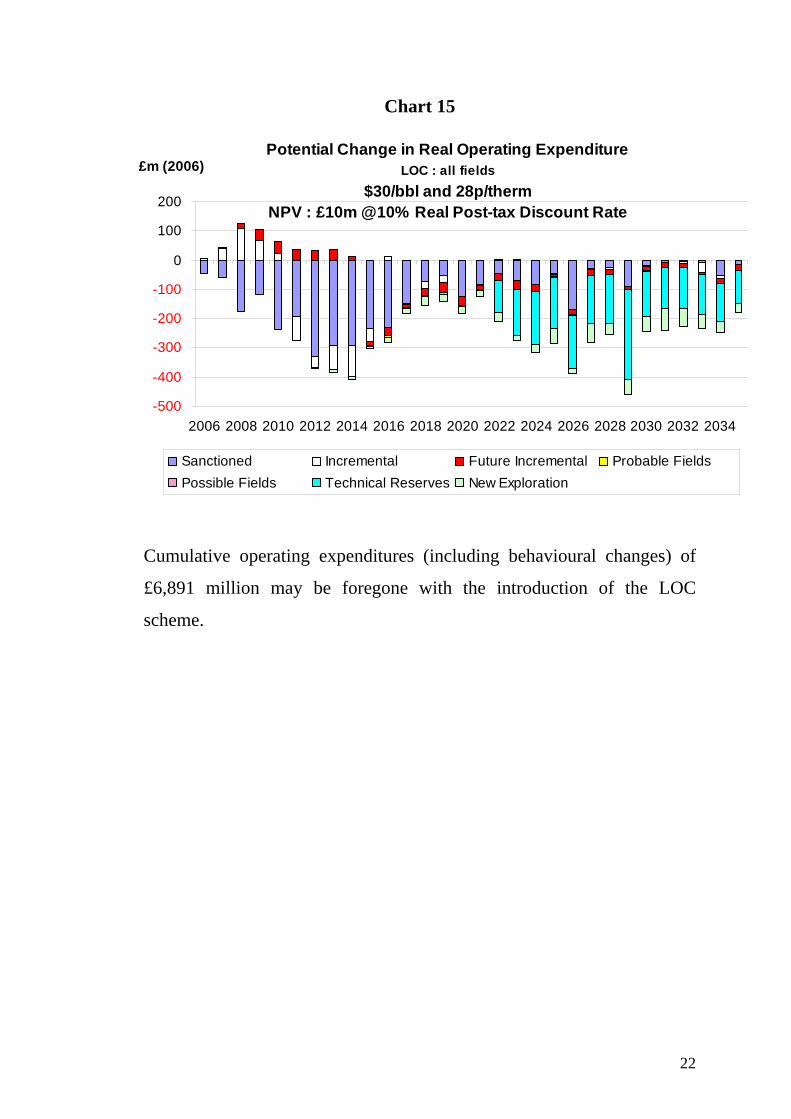
Chart 15 shows the potential change in operating costs alone (excluding
LOC costs) from the introduction of the LOC scheme under the medium
price.
Potential Change in Real Operating Expenditure (includes LOC costs)$30/bbl and 28p/therm
NPV : £10m @10% Real Post-tax Discount Rate
-400 -300 -200 -100
0100200300400500600
2006 2008 2010 2012 2014 2016 2018 2020 2022 2024 2026 2028 2030 2032 2034
£m (2006)
Sanctioned Incremental Future Incremental Probable FieldsPossible Fields Technical Reserves New Exploration
22
Chart 15
Cumulative operating expenditures (including behavioural changes) of
£6,891 million may be foregone with the introduction of the LOC
scheme.
Potential Change in Real Operating Expenditure LOC : all fields
$30/bbl and 28p/therm NPV : £10m @10% Real Post-tax Discount Rate
-500
-400
-300
-200
-100
0
100
200
2006 2008 2010 2012 2014 2016 2018 2020 2022 2024 2026 2028 2030 2032 2034
£m (2006)
Sanctioned Incremental Future Incremental Probable FieldsPossible Fields Technical Reserves New Exploration

23
Chart 16 shows the corresponding potential production which may be
foregone. This could cumulate to 698Mboe by 2035.
Chart 16
Potential Change in ProductionLOC : all fields
$30/bbl and 28p/therm NPV : £10m @10% Real Post-tax Discount Rate
-200
-150
-100
-50
0
50
2006 2008 2010 2012 2014 2016 2018 2020 2022 2024 2026 2028 2030 2032 2034
mboe/d
Sanctioned Incremental Future Incremental Probable FieldsPossible Fields Technical Reserves New Exploration

24
Chart 17 shows the corresponding development expenditure foregone
which may cumulate to £3507m.
Chart 17
It should be stressed that by far the greater part of the reduction in
expenditures and production occurs after 2020 and this is due to the
failure of the marginal projects to pass the economic hurdle. Thus over
500 mboe is lost in this manner and £3.6 billion of investment.
Part of the LOC cost is relievable for tax purposes and the changed
patterns of development and decommissioning which ensue from the
introduction of an LOC scheme will affect the tax revenue received by
the Inland Revenue. Chart 18 shows the change in tax revenues which
would be expected with the introduction of the LOC scheme from the
changes in the development and decommissioning dates.
Potential Change in Real Development ExpenditureLOC : all fields
$30/bbl and 28p/therm NPV : £10m @10% Real Post-tax Discount Rate
-650 -600 -550 -500 -450 -400 -350 -300 -250 -200 -150 -100 -50
050
2006 2008 2010 2012 2014 2016 2018 2020 2022 2024 2026 2028 2030 2032 2034
£m (2006)
Sanctioned Incremental Future Incremental Probable FieldsPossible Fields Technical Reserves New Exploration

25
Chart 18
This may cumulate to a reduction in tax revenue of £3978m in the period
to 2035. With LOC relief the cumulative total reduction in tax revenues
is £5521m.
The results under the $40, 36 pence scenario are now discussed. Chart 19
shows the LOC cost which obtain tax relief, Chart 20 shows the LOC cost
which are not relievable for tax purposes, and Chart 21 shows the total
LOC cost.
Potential Change in Real Tax RevenueWithout LOC Relief
$30/bbl and 28p/therm NPV : £10m @10% Real Post-tax Discount Rate
-600 -500 -400 -300 -200 -100
0100200300400
2006 2008 2010 2012 2014 2016 2018 2020 2022 2024 2026 2028 2030 2032 2034
£m (2006)
Sanctioned Incremental Future Incremental Probable FieldsPossible Fields Technical Reserves New Exploration

26
Chart 19
Chart 20
Potential Real LOC Relievable CostsLOC : all fields
$40/bbl and 36p/therm NPV : £10m @10% Real Post-tax Discount Rate
0
20
40
60
80
100
120
140
2006 2008 2010 2012 2014 2016 2018 2020 2022 2024 2026 2028 2030 2032 2034
£m (2006)
Sanctioned Incremental Future Incremental Probable FieldsPossible Fields Technical Reserves New Exploration
Potential Real LOC Unrelievable CostsLOC : all fields
$40/bbl and 36p/therm NPV : £10m @10% Real Post-tax Discount Rate
0
50
100
150
200
250
300
350
400
450
2006 2008 2010 2012 2014 2016 2018 2020 2022 2024 2026 2028 2030 2032 2034
£m (2006)
Sanctioned Incremental Future Incremental Probable FieldsPossible Fields Technical Reserves New Exploration

27
Chart 21
Cumulative 2006-2035 (£m Real 2006) $40/bbl 36p/therm Sanctioned Incremental
Future Incremental
Probable Fields
Possible Fields
Technical Reserves
New ExplorationTotal
LOC Relievable 1884 84 147 11 8 228 201 2563
LOC Unrelievable 5967 267 464 35 26 721 635 8116 Real Total Loc Costs 7851 352 611 46 34 949 836 10679
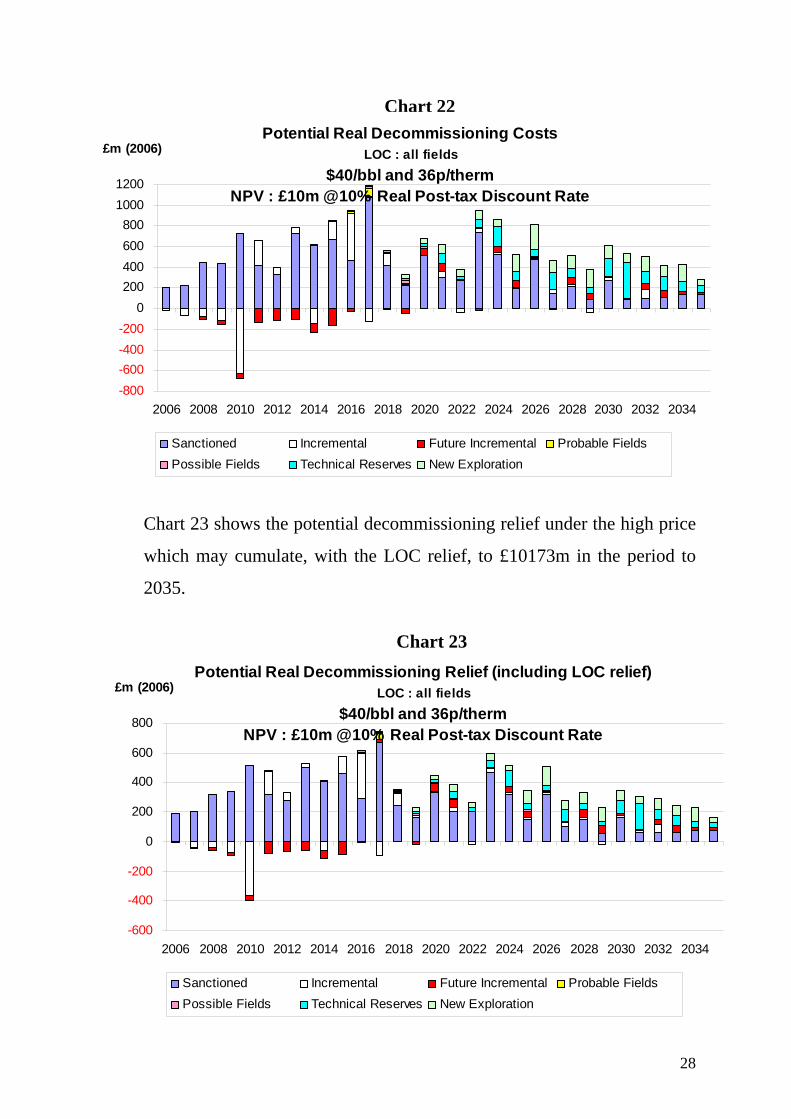
Chart 22 shows the associated decommissioning costs which may
cumulate to £15214m in the period to 2035.
Potential Real Total LOC CostsLOC : all fields
$40/bbl and 36p/therm NPV : £10m @10% Real Post-tax Discount Rate
0
100
200
300
400
500
600
2006 2008 2010 2012 2014 2016 2018 2020 2022 2024 2026 2028 2030 2032 2034
£m (2006)
Sanctioned Incremental Future Incremental Probable FieldsPossible Fields Technical Reserves New Exploration
28
Chart 22
Chart 23 shows the potential decommissioning relief under the high price
which may cumulate, with the LOC relief, to £10173m in the period to
2035.
Chart 23
Potential Real Decommissioning CostsLOC : all fields
$40/bbl and 36p/therm NPV : £10m @10% Real Post-tax Discount Rate
-800 -600 -400 -200
0200400600800
10001200
2006 2008 2010 2012 2014 2016 2018 2020 2022 2024 2026 2028 2030 2032 2034
£m (2006)
Sanctioned Incremental Future Incremental Probable FieldsPossible Fields Technical Reserves New Exploration
Potential Real Decommissioning Relief (including LOC relief)LOC : all fields
$40/bbl and 36p/therm NPV : £10m @10% Real Post-tax Discount Rate
-600
-400
-200
0
200
400
600
800
2006 2008 2010 2012 2014 2016 2018 2020 2022 2024 2026 2028 2030 2032 2034
£m (2006)
Sanctioned Incremental Future Incremental Probable FieldsPossible Fields Technical Reserves New Exploration

29
Chart 24 shows the relief given for LOC costs under the high price. This
may cumulate to £1635m in the period to 2035.
Chart 24
Chart 25 shows the total LOC cost minus LOC tax relief under the high
price. This may cumulate to £9044m in the period to 2035.
Potential Real LOC ReliefLOC : all fields
$40/bbl and 36p/therm NPV : £10m @10% Real Post-tax Discount Rate
0102030405060708090
100
2006 2008 2010 2012 2014 2016 2018 2020 2022 2024 2026 2028 2030 2032 2034
£m (2006)
Sanctioned Incremental Future Incremental Probable FieldsPossible Fields Technical Reserves New Exploration

30
Chart 25
Chart 26 shows the change in operating costs which may occur under the
high price with an LOC scheme (including the LOC costs and
behavioural changes). This may cumulate to £7775m in the period to
2035.
Chart 26
Potential Real Total LOC Costs minus LOC ReliefLOC : all fields
$40/bbl and 36p/therm NPV : £10m @10% Real Post-tax Discount Rate
050
100150200250300350400450500
2006 2008 2010 2012 2014 2016 2018 2020 2022 2024 2026 2028 2030 2032 2034
£m (2006)
Sanctioned Incremental Future Incremental Probable FieldsPossible Fields Technical Reserves New Exploration
Potential Change in Real Operating Expenditure (includes LOC costs)$40/bbl and 36p/therm
NPV : £10m @10% Real Post-tax Discount Rate
-100
0
100
200
300
400
500
2006 2008 2010 2012 2014 2016 2018 2020 2022 2024 2026 2028 2030 2032 2034
£m (2006)
Sanctioned Incremental Future Incremental Probable FieldsPossible Fields Technical Reserves New Exploration

31
Chart 27 shows the potential change in operating costs alone (excluding
LOC costs) with the introduction of the LOC scheme under the high
price. Cumulatively to 2035, £2904m in operating expenditure may be
foregone with the introduction of the LOC scheme.
Chart 27
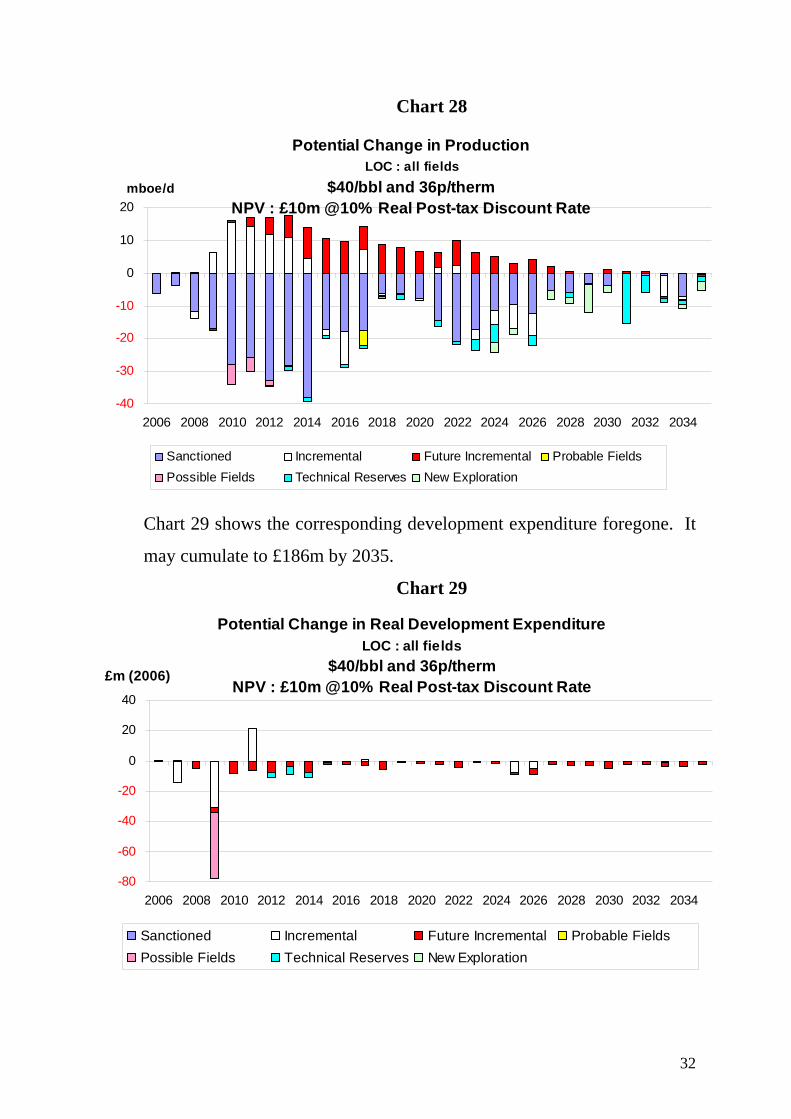
Chart 28 shows the corresponding potential production which may be
foregone. This could cumulate to 119Mboe.
Potential Change in Real Operating Expenditure LOC : all fields
$40/bbl and 36p/therm NPV : £10m @10% Real Post-tax Discount Rate
-400
-300
-200
-100
0
100
200
300
2006 2008 2010 2012 2014 2016 2018 2020 2022 2024 2026 2028 2030 2032 2034
£m (2006)
Sanctioned Incremental Future Incremental Probable FieldsPossible Fields Technical Reserves New Exploration
32
Chart 28
Chart 29 shows the corresponding development expenditure foregone. It
may cumulate to £186m by 2035.
Chart 29
Potential Change in Real Development ExpenditureLOC : all fields
$40/bbl and 36p/therm NPV : £10m @10% Real Post-tax Discount Rate
-80
-60
-40
-20
0
20
40
2006 2008 2010 2012 2014 2016 2018 2020 2022 2024 2026 2028 2030 2032 2034
£m (2006)
Sanctioned Incremental Future Incremental Probable FieldsPossible Fields Technical Reserves New Exploration
Potential Change in ProductionLOC : all fields
$40/bbl and 36p/therm NPV : £10m @10% Real Post-tax Discount Rate
-40
-30
-20
-10
0
10
20
2006 2008 2010 2012 2014 2016 2018 2020 2022 2024 2026 2028 2030 2032 2034
mboe/d
Sanctioned Incremental Future Incremental Probable FieldsPossible Fields Technical Reserves New Exploration

33
There is much less investment and production lost from the failure of
projects to pass the investment hurdle under the $40, 36 pence case
because there are far fewer marginal projects.
Chart 30 shows the change in tax revenues following the introduction of
the LOC scheme. This may cumulate to a reduction in tax revenues of
£1830m in the period to 2035. With LOC relief the cumulative total
reduction in tax revenue is £3466m.
Chart 30
c) Surety Bond
It is assumed that the Bond, like the LOC, is instituted when remaining
NPV (RNPV) falls to 150% of the gross decommissioning costs and that
the Bond continues until field decommissioning. It is also assumed that
the annual cost is 3.5% based on gross decommissioning cost (MOD)
Potential Change in Real Tax RevenueWithout LOC Relief
$40/bbl and 36p/therm NPV : £10m @10% Real Post-tax Discount Rate
-800
-600
-400
-200
0
200
400
2006 2008 2010 2012 2014 2016 2018 2020 2022 2024 2026 2028 2030 2032 2034
£m (2006)
Sanctioned Incremental Future Incremental Probable FieldsPossible Fields Technical Reserves New Exploration
34
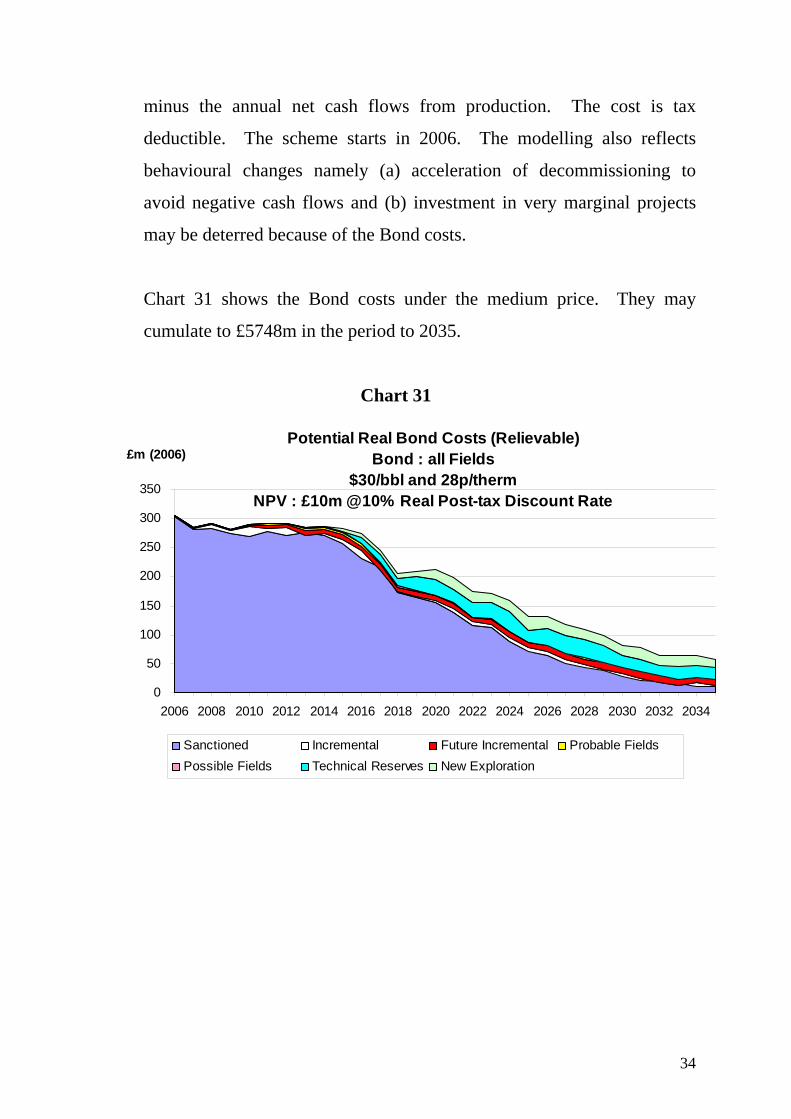
minus the annual net cash flows from production. The cost is tax
deductible. The scheme starts in 2006. The modelling also reflects
behavioural changes namely (a) acceleration of decommissioning to
avoid negative cash flows and (b) investment in very marginal projects
may be deterred because of the Bond costs.
Chart 31 shows the Bond costs under the medium price. They may
cumulate to £5748m in the period to 2035.
Chart 31
Potential Real Bond Costs (Relievable) Bond : all Fields
$30/bbl and 28p/therm NPV : £10m @10% Real Post-tax Discount Rate
0
50
100
150
200
250
300
350
2006 2008 2010 2012 2014 2016 2018 2020 2022 2024 2026 2028 2030 2032 2034
£m (2006)
Sanctioned Incremental Future Incremental Probable FieldsPossible Fields Technical Reserves New Exploration

35
Chart 32 shows the associated decommissioning costs which may
cumulate to £14242m in the period to 2035.
Chart 32
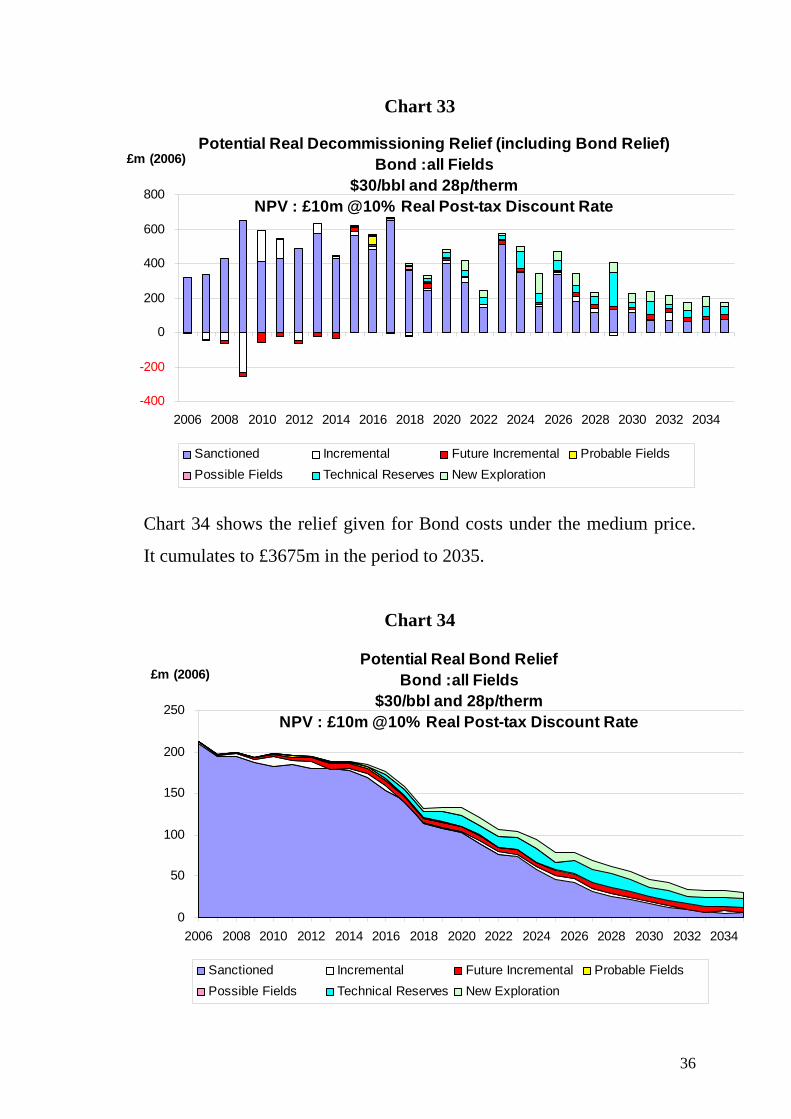
Chart 33 shows the potential decommissioning relief under the medium
price which may cumulate, with the Bond relief, to £11640m in the
period to 2035.
Potential Real Decommissioning Costs Bond :all Fields
$30/bbl and 28p/therm NPV : £10m @10% Real Post-tax Discount Rate
-600
-400
-200
0
200
400
600
800
1000
2006 2008 2010 2012 2014 2016 2018 2020 2022 2024 2026 2028 2030 2032 2034
£m (2006)
Sanctioned Incremental Future Incremental Probable FieldsPossible Fields Technical Reserves New Exploration
36
Chart 33
Chart 34 shows the relief given for Bond costs under the medium price.
It cumulates to £3675m in the period to 2035.
Chart 34
Potential Real Decommissioning Relief (including Bond Relief) Bond :all Fields
$30/bbl and 28p/therm NPV : £10m @10% Real Post-tax Discount Rate
-400
-200
0
200
400
600
800
2006 2008 2010 2012 2014 2016 2018 2020 2022 2024 2026 2028 2030 2032 2034
£m (2006)
Sanctioned Incremental Future Incremental Probable FieldsPossible Fields Technical Reserves New Exploration
Potential Real Bond Relief Bond :all Fields
$30/bbl and 28p/therm NPV : £10m @10% Real Post-tax Discount Rate
0
50
100
150
200
250
2006 2008 2010 2012 2014 2016 2018 2020 2022 2024 2026 2028 2030 2032 2034
£m (2006)
Sanctioned Incremental Future Incremental Probable FieldsPossible Fields Technical Reserves New Exploration

37
Chart 35 shows the total Bond cost minus Bond tax relief under the
medium price. This cumulates to £2073m in the period to 2035.
Chart 35
Chart 36 shows the change in operating costs which may occur once all
fields are involved in a Bond scheme. The effect includes the
behavioural changes of the investor and the Bond costs. They may
cumulate to £2543m in the period to 2035.
Potential Real Bond Costs minus Bond relief Bond :all Fields
$30/bbl and 28p/therm NPV : £10m @10% Real Post-tax Discount Rate
0102030405060708090
100
2006 2008 2010 2012 2014 2016 2018 2020 2022 2024 2026 2028 2030 2032 2034
£m (2006)
Sanctioned Incremental Future Incremental Probable FieldsPossible Fields Technical Reserves New Exploration

38
Chart 36
Chart 37 shows the potential change in operating costs alone (i.e. the
behavioural effects). Cumulatively to 2035, £3205m in operating
expenditure may be foregone with the introduction of the Bond scheme.
Chart 37
Potential Change in Real Operating Expenditure (includes Bond costs)$30/bbl and 28p/therm
NPV : £10m @10% Real Post-tax Discount Rate
-150 -100
-50 0
50100150200250300
2006 2008 2010 2012 2014 2016 2018 2020 2022 2024 2026 2028 2030 2032 2034
£m (2006)
Sanctioned Incremental Future Incremental Probable FieldsPossible Fields Technical Reserves New Exploration
Potential Change in Real Operating Expenditure Bond : all Fields
$30/bbl and 28p/therm NPV : £10m @10% Real Post-tax Discount Rate
-400 -350 -300 -250 -200 -150 -100
-50 0
50100
2006 2008 2010 2012 2014 2016 2018 2020 2022 2024 2026 2028 2030 2032 2034
£m (2006)
Sanctioned Incremental Future Incremental Probable FieldsPossible Fields Technical Reserves New Exploration
39
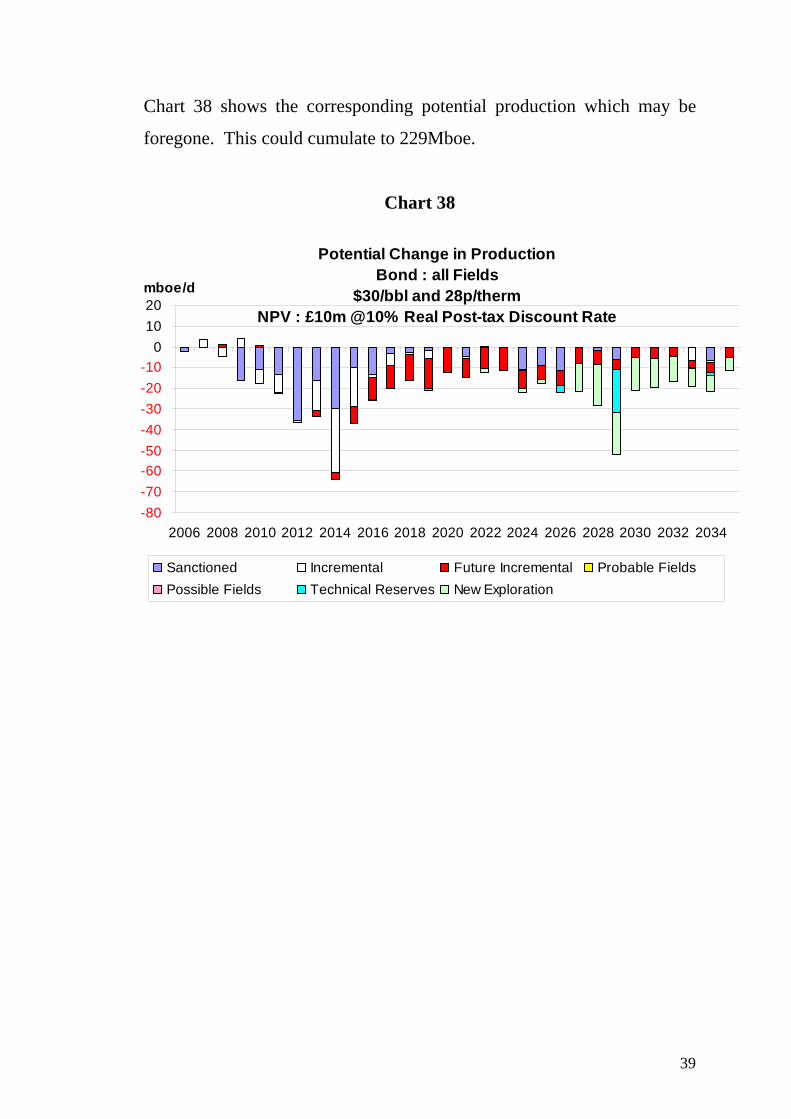
Chart 38 shows the corresponding potential production which may be
foregone. This could cumulate to 229Mboe.
Chart 38
Potential Change in Production Bond : all Fields
$30/bbl and 28p/therm NPV : £10m @10% Real Post-tax Discount Rate
-80 -70 -60 -50 -40 -30 -20 -10
01020
2006 2008 2010 2012 2014 2016 2018 2020 2022 2024 2026 2028 2030 2032 2034
mboe/d
Sanctioned Incremental Future Incremental Probable FieldsPossible Fields Technical Reserves New Exploration

40
Chart 39 shows the corresponding development expenditure foregone. It
may cumulate to £471m.
Chart 39
The reductions in investment and operating expenditure and in production
in the later part of the period are primarily due to the failure of projects to
pass the economic hurdle following the introduction of the Bond.
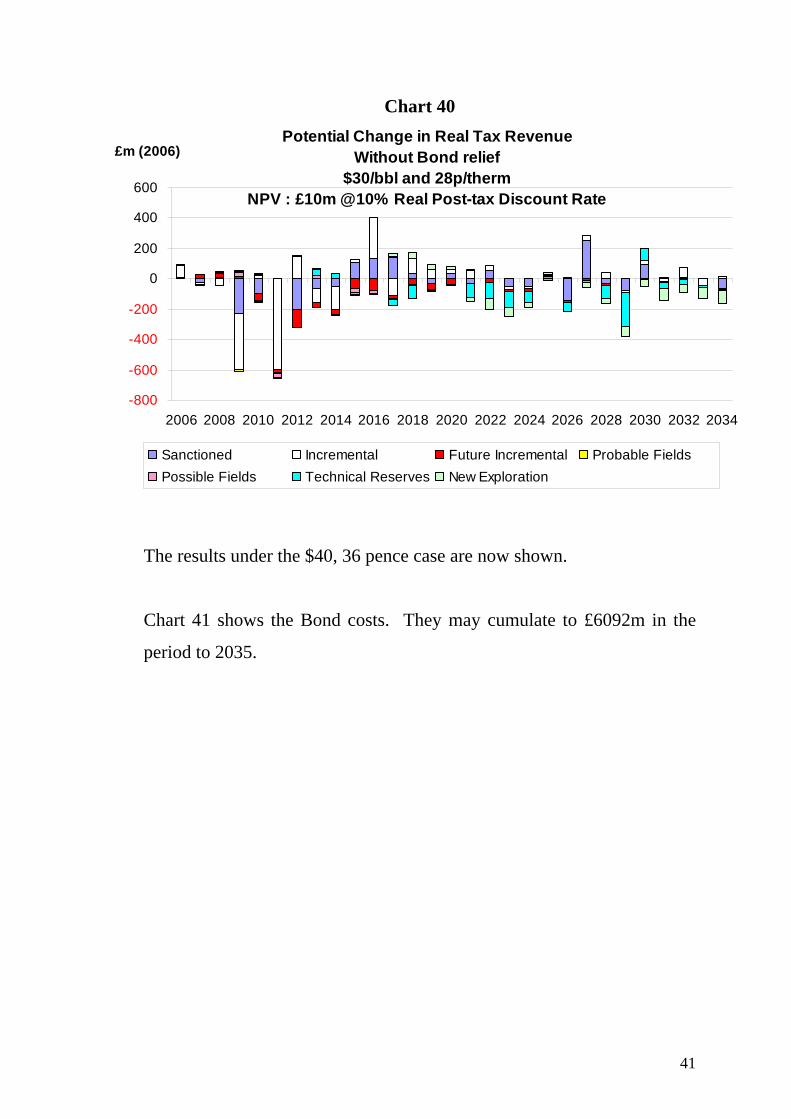
Chart 40 shows the change in tax revenue which would be expected with
the introduction of the Bond scheme from the changes in the development
and decommissioning dates. This may cumulate to a reduction in tax
revenues of £2706m in the period to 2035. Including Bond relief the
cumulative total reduction in tax revenue is £6381m.
Potential Change in Real Development Expenditure Bond : all Fields
$30/bbl and 28p/therm NPV : £10m @10% Real Post-tax Discount Rate
-100
-80
-60
-40
-20
0
20
40
60
2006 2008 2010 2012 2014 2016 2018 2020 2022 2024 2026 2028 2030 2032 2034
£m (2006)
Sanctioned Incremental Future Incremental Probable FieldsPossible Fields Technical Reserves New Exploration
41
Chart 40
The results under the $40, 36 pence case are now shown.
Chart 41 shows the Bond costs. They may cumulate to £6092m in the
period to 2035.
Potential Change in Real Tax Revenue Without Bond relief
$30/bbl and 28p/therm NPV : £10m @10% Real Post-tax Discount Rate
-800
-600
-400
-200
0
200
400
600
2006 2008 2010 2012 2014 2016 2018 2020 2022 2024 2026 2028 2030 2032 2034
£m (2006)
Sanctioned Incremental Future Incremental Probable FieldsPossible Fields Technical Reserves New Exploration

42
Chart 41
Chart 42 shows the associated decommissioning costs which may
cumulate to £15079m in the period to 2035.
Chart 42
Potential Real Bond Costs (Relievable) Bond :all Fields
$40/bbl and 36p/therm NPV : £10m @10% Real Post-tax Discount Rate
0
50
100
150
200
250
300
350
2006 2008 2010 2012 2014 2016 2018 2020 2022 2024 2026 2028 2030 2032 2034
£m (2006)
Sanctioned Incremental Future Incremental Probable FieldsPossible Fields Technical Reserves New Exploration
Potential Real Decommissioning Costs Bond :all Fields
$40/bbl and 36p/therm NPV : £10m @10% Real Post-tax Discount Rate
-800 -600 -400 -200
0200400600800
100012001400
2006 2008 2010 2012 2014 2016 2018 2020 2022 2024 2026 2028 2030 2032 2034
£m (2006)
Sanctioned Incremental Future Incremental Probable FieldsPossible Fields Technical Reserves New Exploration

43
Chart 43 shows the potential decommissioning relief under the high price
which may cumulate, with the Bond relief, to £12354m in the period to
2035.
Chart 43
Chart 44 shows the relief given for Bond costs. It may cumulate to
£3886m in the period to 2035.
Potential Real Decommissioning Relief (including Bond Relief) Bond :all Fields
$40/bbl and 36p/therm NPV : £10m @10% Real Post-tax Discount Rate
-400
-200
0
200
400
600
800
1000
2006 2008 2010 2012 2014 2016 2018 2020 2022 2024 2026 2028 2030 2032 2034
£m (2006)
Sanctioned Incremental Future Incremental Probable FieldsPossible Fields Technical Reserves New Exploration

44
Chart 44
Chart 45 shows the total Bond cost minus Bond tax relief under the high
price. This may cumulate to £2205m in the period to 2035.
Chart 45
Potential Real Bond Relief Bond :all Fields
$40/bbl and 36p/therm NPV : £10m @10% Real Post-tax Discount Rate
0
50
100
150
200
250
2006 2008 2010 2012 2014 2016 2018 2020 2022 2024 2026 2028 2030 2032 2034
£m (2006)
Sanctioned Incremental Future Incremental Probable FieldsPossible Fields Technical Reserves New Exploration
Potential Real Bond Costs minus Bond relief Bond :all Fields
$40/bbl and 36p/therm NPV : £10m @10% Real Post-tax Discount Rate
0
20
40
60
80
100
120
2006 2008 2010 2012 2014 2016 2018 2020 2022 2024 2026 2028 2030 2032 2034
£m (2006)
Sanctioned Incremental Future Incremental Probable FieldsPossible Fields Technical Reserves New Exploration

45
Chart 46 shows the change in operating costs including Bond costs and
behavioural changes. The total may cumulate to £5015m in the period to
2035.
Chart 46
Chart 47 shows the potential change in operating costs alone (i.e. the
behavioural changes of the investor). They cumulate to £1077m.
Potential Change in Real Operating Expenditure (includes Bond costs)$40/bbl and 36p/therm
NPV : £10m @10% Real Post-tax Discount Rate
-100 -50
050
100150200250300350
2006 2008 2010 2012 2014 2016 2018 2020 2022 2024 2026 2028 2030 2032 2034
£m (2006)
Sanctioned Incremental Future Incremental Probable FieldsPossible Fields Technical Reserves New Exploration

46
Chart 47
Chart 48 shows the corresponding potential production which may be
foregone. This could cumulate to 23Mboe.
Chart 48
Potential Change in Real Operating Expenditure Bond : all Fields
$40/bbl and 36p/therm NPV : £10m @10% Real Post-tax Discount Rate
-300
-200
-100
0
100
200
300
2006 2008 2010 2012 2014 2016 2018 2020 2022 2024 2026 2028 2030 2032 2034
£m (2006)
Sanctioned Incremental Future Incremental Probable FieldsPossible Fields Technical Reserves New Exploration
Potential Change in Production Bond : all Fields
$40/bbl and 36p/therm NPV : £10m @10% Real Post-tax Discount Rate
-30
-20
-10
0
10
20
30
2006 2008 2010 2012 2014 2016 2018 2020 2022 2024 2026 2028 2030 2032 2034
mboe/d
Sanctioned Incremental Future Incremental Probable FieldsPossible Fields Technical Reserves New Exploration

47
Chart 49 shows the corresponding development expenditure foregone. It
may cumulate to £138m.
Chart 49
The introduction of the Surety Bond has only a modest negative effect on
the investment in and production from new projects. Few are rendered
unviable by the Bond.
Chart 50 shows the change in tax revenues which would be expected with
the introduction of the Bond scheme from the changes in the development
and decommissioning dates. This may cumulate to a reduction in tax
revenues of £1003m by 2035. With Bond relief the cumulative total
reduction in tax revenues is £4889m.
Potential Change in Real Development Expenditure Bond : all Fields
$40/bbl and 36p/therm NPV : £10m @10% Real Post-tax Discount Rate
-10
-5
0
5
10
15
20
25
30
2006 2008 2010 2012 2014 2016 2018 2020 2022 2024 2026 2028 2030 2032 2034
£m (2006)
Sanctioned Incremental Future Incremental Probable FieldsPossible Fields Technical Reserves New Exploration

48
Chart 50
d) Trust Funds
Trust Funds are conceptually different from LOCs and Bond schemes
because while the costs of the latter involve extra costs contributions to a
Fund are advance payments. Several variants of a Trust Fund were
examined in detail involving different assumptions. These were felt
necessary because of the range of possibilities which it was felt useful to
highlight. There were some common assumptions namely that the
scheme would commence in 2006 and that contributions would
commence when RNPV reached 150% of gross decommissioning costs.
The annual contributions follow the decline rate of field revenues. (This
is in contrast to the situation with LOCs and Surety Bonds where the
contributions increase as field revenues decrease). Inheritance Tax is not
applied as this would clearly make the scheme unviable.
Potential Change in Real Tax Revenue Without Bond relief
$40/bbl and 36p/therm NPV : £10m @10% Real Post-tax Discount Rate
-800
-600
-400
-200
0
200
400
600
2006 2008 2010 2012 2014 2016 2018 2020 2022 2024 2026 2028 2030 2032 2034
£m (2006)
Sanctioned Incremental Future Incremental Probable FieldsPossible Fields Technical Reserves New Exploration

49
Fund 1 In this scheme tax relief is given for Fund contributions (CT, SCT and
PRT). Monies paid into the Fund obtain a return of 4.75% which is taxed
at 40%. It is assumed that there will be no change in investor behaviour.
Chart 51 shows the potential decommissioning costs with under the
medium price. The decommissioning cost cumulates to £14014m in the
period to 2035.
Chart 51
Potential Real Decommissioning ExpenditureDecommissioning Fund : with relief for Fund contributions,
interest at base rate minus 40% tax on interest (no change in decommissioning date)
$30/bbl and 28p/therm NPV : £10m @10% Real Post-tax Discount Rate
-200
0
200
400
600
800
1000
1200
2006 2008 2010 2012 2014 2016 2018 2020 2022 2024 2026 2028 2030 2032 2034
£m (2006)
Sanctioned Incremental Future Incremental Probable FieldsPossible Fields Technical Reserves New Exploration

50
Chart 52 shows the potential decommissioning relief under the medium
price. It cumulates to £8801m in the period to 2035.
Chart 52
Chart 53 shows the tax on the Fund interest with the medium price when
the Fund receives gross interest at 4.74%. It cumulates to £1522m in the
period to 2035.
Potential Real Decommissioning ReliefDecommissioning Fund : with relief for Fund contributions,
interest at base rate minus 40% tax on interest (no change in decommissioning date)
$30/bbl and 28p/therm NPV : £10m @10% Real Post-tax Discount Rate
-200
0
200
400
600
800
2006 2008 2010 2012 2014 2016 2018 2020 2022 2024 2026 2028 2030 2032 2034
£m (2006)
Sanctioned Incremental Future Incremental Probable FieldsPossible Fields Technical Reserves New Exploration

51
Chart 53
Chart 54 shows the real Fund payments paid by the operators under the
medium price. They cumulate to £11269m in the period to 2035.
Chart 54
Potential Real Tax on InerestDecommissioning Fund : with relief for Fund contributions,
interest at base rate minus 40% tax on interest (no change in decommissioning date)
$30/bbl and 28p/therm NPV : £10m @10% Real Post-tax Discount Rate
0102030405060708090
100
2006 2008 2010 2012 2014 2016 2018 2020 2022 2024 2026 2028 2030 2032 2034
£m (2006)
Sanctioned Incremental Future Incremental Probable FieldsPossible Fields Technical Reserves New Exploration
Potential Real Fund PaymentsDecommissioning Fund : with relief for Fund contributions,
interest at base rate minus 40% tax on interest (no change in decommissioning date)
$30/bbl and 28p/therm NPV : £10m @10% Real Post-tax Discount Rate
0100200300400500600700800900
1000
2006 2008 2010 2012 2014 2016 2018 2020 2022 2024 2026 2028 2030 2032 2034
£m (2006)
Sanctioned Incremental Future Incremental Probable FieldsPossible Fields Technical Reserves New Exploration

52
Chart 55 shows the potential Fund shortfall for determining contributions
using the formula. When this situation occurs it is assumed that tax relief
will be given on the “shortfall expenditure” when it occurs. This
cumulates to £3648m in the period to 2035.
The shortfalls come about for various reasons. Starting the scheme in
2006 with the application of the formula to all fields means that
inadequate cash flows are available from fields whose decommissioning
is imminent. In other cases in much later years there is often some capital
investment in late field life after the formula has been triggered. The
(lumpy) expenditure results in the cash flows in the years in question
being reduced such that contributions are greatly curtailed. Subsequently
there can be a catch-up in the contributions but interest income in the
Fund has been lost and sometimes the net result is that contributions plus
interest do not meet the full decommissioning costs. A further problem in
a number of cases was the significant time difference between COP and
the actual decommissioning expenditures which distorted the application
of the formula.

53
Chart 55
Chart 56 shows the change in operating costs excluding Fund
contributions under the medium price. It cumulates to £1393m in the
period to 2035.
Chart 56
Potential Real Fund ShortfallDecommissioning Fund : with relief for Fund contributions,
interest at base rate minus 40% tax on interest (no change in decommissioning date)
$30/bbl and 28p/therm NPV : £10m @10% Real Post-tax Discount Rate
-500
-400
-300
-200
-100
0
100
2006 2008 2010 2012 2014 2016 2018 2020 2022 2024 2026 2028 2030 2032 2034
£m (2006)
Sanctioned Incremental Future Incremental Probable FieldsPossible Fields Technical Reserves New Exploration
Potential Change in Real Operating ExpenditureDecommissioning Fund : with relief for Fund contributions,
interest at base rate minus 40% tax on interest (no change in decommissioning date)
$30/bbl and 28p/therm NPV : £10m @10% Real Discount Rate
-120
-100
-80
-60
-40
-20
0
2006 2008 2010 2012 2014 2016 2018 2020 2022 2024 2026 2028 2030 2032 2034
£m (2006)
Sanctioned Incremental Future Incremental Probable FieldsPossible Fields Technical Reserves New Exploration

54
Chart 57 shows the corresponding development expenditure foregone. It
cumulates to £493m.
Chart 57
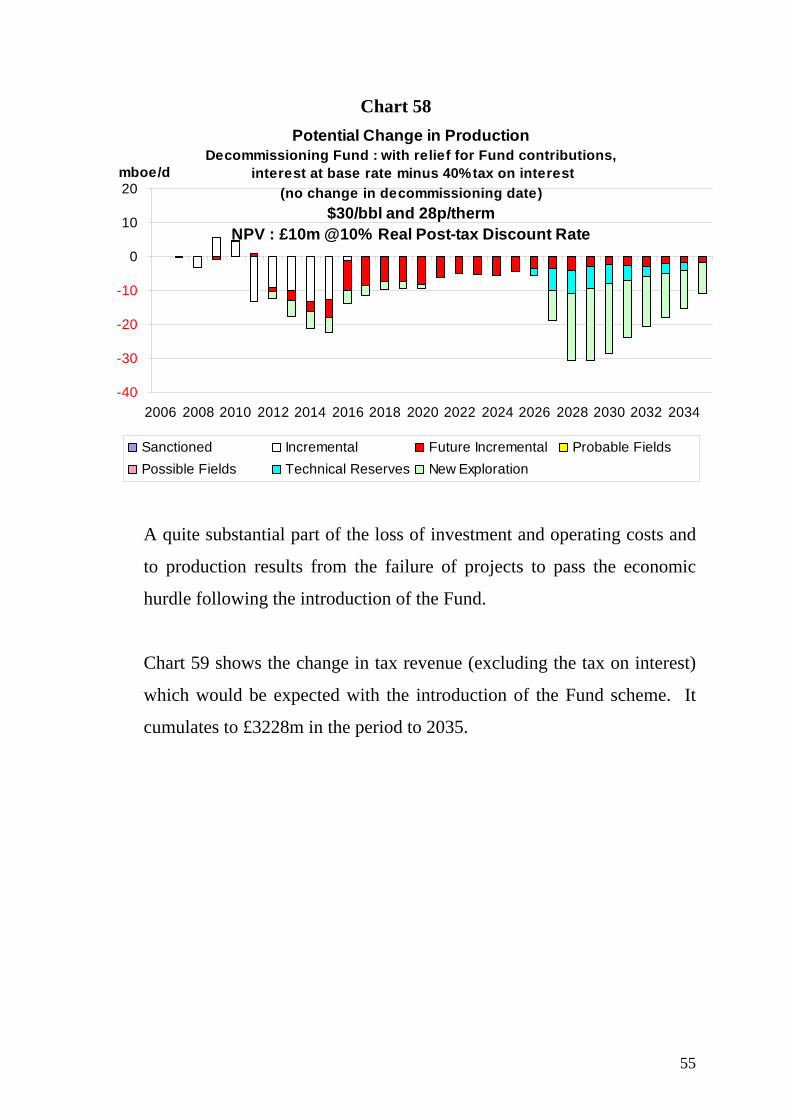
Chart 58 shows the corresponding potential production which may be
foregone. This could cumulate to 133Mboe.
Potential Change in Real Development ExpenditureDecommissioning Fund : with relief for Fund contributions,
interest at base rate minus 40% tax on interest (no change in decommissioning date)
$30/bbl and 28p/therm NPV : £10m @10% Real Discount Rate
-120
-100
-80
-60
-40
-20
0
20
40
2006 2008 2010 2012 2014 2016 2018 2020 2022 2024 2026 2028 2030 2032 2034
£m (2006)
Sanctioned Incremental Future Incremental Probable FieldsPossible Fields Technical Reserves New Exploration
55
Chart 58
A quite substantial part of the loss of investment and operating costs and
to production results from the failure of projects to pass the economic
hurdle following the introduction of the Fund.
Chart 59 shows the change in tax revenue (excluding the tax on interest)
which would be expected with the introduction of the Fund scheme. It
cumulates to £3228m in the period to 2035.
Potential Change in ProductionDecommissioning Fund : with relief for Fund contributions,
interest at base rate minus 40% tax on interest (no change in decommissioning date)
$30/bbl and 28p/therm NPV : £10m @10% Real Post-tax Discount Rate
-40
-30
-20
-10
0
10
20
2006 2008 2010 2012 2014 2016 2018 2020 2022 2024 2026 2028 2030 2032 2034
mboe/d
Sanctioned Incremental Future Incremental Probable FieldsPossible Fields Technical Reserves New Exploration

56
Chart 59
Chart 60 shows the change in tax revenue taking account of the tax on
interest. It cumulates to a reduction of £1706m in the period to 2035.
Chart 60
Potential Change in Real Tax Revenue (excludes tax on interest)
Decommissioning Fund : with relief for Fund contributions, (no change in decommissioning date)
$30/bbl and 28p/thermNPV : £10m @10% Real Post-tax Discount Rate
-1000
-500
0
500
2006 2008 2010 2012 2014 2016 2018 2020 2022 2024 2026 2028 2030 2032 2034
£m (2006)
Sanctioned Incremental Future Incremental Probable FieldsPossible Fields Technical Reserves New Exploration
Potential Change in Real Tax RevenueDecommissioning Fund : with relief for Fund contributions,
interest at base rate minus 40% tax on interest (no change in decommissioning date)
$30/bbl and 28p/therm NPV : £10m @10% Real Post-tax Discount Rate
-800
-600
-400
-200
0
200
400
600
2006 2008 2010 2012 2014 2016 2018 2020 2022 2024 2026 2028 2030 2032 2034
£m (2006)
Sanctioned Incremental Future Incremental Probable FieldsPossible Fields Technical Reserves New Exploration

57
Under the $40, 36 pence price case the decommissioning costs are shown
in Chart 61. They cumulate to £15083m in the period to 2035.
Chart 61
Chart 62 shows the potential decommissioning relief. It cumulates to
£9285m in the period to 2035.
Chart 62
Potential Real Decommissioning ExpenditureDecommissioning Fund : with relief for Fund contributions,
interest at base rate minus 40% tax on interest (no change in decommissioning date)
$40/bbl and 36p/therm NPV : £10m @10% Real Post-tax Discount Rate
-400 -200
0200400600800
10001200140016001800
2006 2008 2010 2012 2014 2016 2018 2020 2022 2024 2026 2028 2030 2032 2034
£m (2006)
Sanctioned Incremental Future Incremental Probable FieldsPossible Fields Technical Reserves New Exploration
Potential Real Decommissioning ReliefDecommissioning Fund : with relief for Fund contributions,
interest at base rate minus 40% tax on interest (no change in decommissioning date)
$40/bbl and 36p/therm NPV : £10m @10% Real Post-tax Discount Rate
-200
0
200
400
600
800
2006 2008 2010 2012 2014 2016 2018 2020 2022 2024 2026 2028 2030 2032 2034
£m (2006)
Sanctioned Incremental Future Incremental Probable FieldsPossible Fields Technical Reserves New Exploration
58
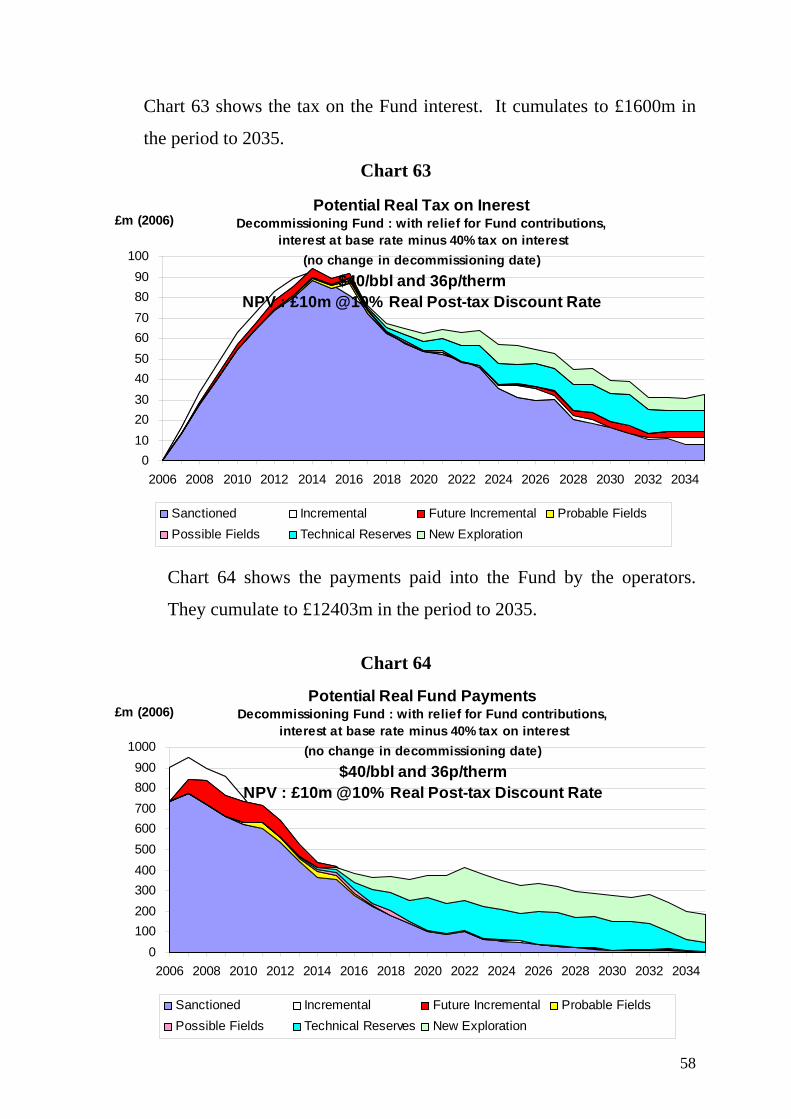
Chart 63 shows the tax on the Fund interest. It cumulates to £1600m in
the period to 2035.
Chart 63
Chart 64 shows the payments paid into the Fund by the operators.
They cumulate to £12403m in the period to 2035.
Chart 64
Potential Real Tax on InerestDecommissioning Fund : with relief for Fund contributions,
interest at base rate minus 40% tax on interest (no change in decommissioning date)
$40/bbl and 36p/therm NPV : £10m @10% Real Post-tax Discount Rate
0102030405060708090
100
2006 2008 2010 2012 2014 2016 2018 2020 2022 2024 2026 2028 2030 2032 2034
£m (2006)
Sanctioned Incremental Future Incremental Probable FieldsPossible Fields Technical Reserves New Exploration
Potential Real Fund PaymentsDecommissioning Fund : with relief for Fund contributions,
interest at base rate minus 40% tax on interest (no change in decommissioning date)
$40/bbl and 36p/therm NPV : £10m @10% Real Post-tax Discount Rate
0100200300400500600700800900
1000
2006 2008 2010 2012 2014 2016 2018 2020 2022 2024 2026 2028 2030 2032 2034
£m (2006)
Sanctioned Incremental Future Incremental Probable FieldsPossible Fields Technical Reserves New Exploration
59
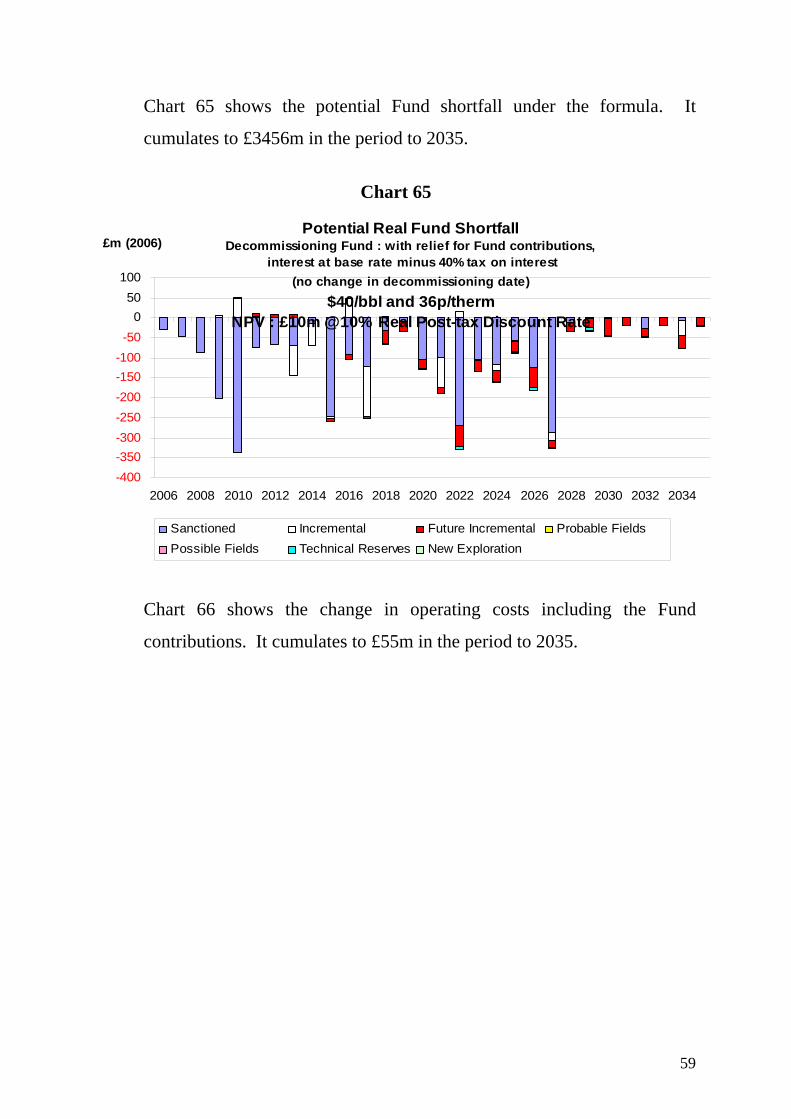
Chart 65 shows the potential Fund shortfall under the formula. It
cumulates to £3456m in the period to 2035.
Chart 65
Chart 66 shows the change in operating costs including the Fund
contributions. It cumulates to £55m in the period to 2035.
Potential Real Fund ShortfallDecommissioning Fund : with relief for Fund contributions,
interest at base rate minus 40% tax on interest (no change in decommissioning date)
$40/bbl and 36p/therm NPV : £10m @10% Real Post-tax Discount Rate
-400 -350 -300 -250 -200 -150 -100 -50
050
100
2006 2008 2010 2012 2014 2016 2018 2020 2022 2024 2026 2028 2030 2032 2034
£m (2006)
Sanctioned Incremental Future Incremental Probable FieldsPossible Fields Technical Reserves New Exploration

60
Chart 66
Chart 67 shows the corresponding change in development because very
marginal fields are rendered uneconomic. It cumulates to £109m.
Chart 67
Potential Change in Real Operating ExpenditureDecommissioning Fund : with relief for Fund contributions,
interest at base rate minus 40% tax on interest (no change in decommissioning date)
$40/bbl and 36p/therm NPV : £10m @10% Real Discount Rate
-10
-8
-6
-4
-2
0
2
4
2006 2008 2010 2012 2014 2016 2018 2020 2022 2024 2026 2028 2030 2032 2034
£m (2006)
Sanctioned Incremental Future Incremental Probable FieldsPossible Fields Technical Reserves New Exploration
Potential Change in Real Development ExpenditureDecommissioning Fund : with relief for Fund contributions,
interest at base rate minus 40% tax on interest (no change in decommissioning date)
$40/bbl and 36p/therm NPV : £10m @10% Real Discount Rate
-80 -70 -60 -50 -40 -30 -20 -10
01020
2006 2008 2010 2012 2014 2016 2018 2020 2022 2024 2026 2028 2030 2032 2034
£m (2006)
Sanctioned Incremental Future Incremental Probable FieldsPossible Fields Technical Reserves New Exploration

61
Chart 68 shows the corresponding potential production which may be
foregone. It cumulates to 23Mboe.
Chart 68
The loss of investment and production from the failure of projects to pass
the economic hurdle following the introduction of the Fund was found to
be very small.
Chart 69 shows the change in tax revenue (excluding the tax on interest)
which would be expected with the introduction of the Fund scheme. This
may cumulate to a reduction in tax revenue of £1918m in the period to
2035. It is noteworthy that the timing of the loss is accelerated by the
scheme.
Potential Change in ProductionDecommissioning Fund : with relief for Fund contributions,
interest at base rate minus 40% tax on interest (no change in decommissioning date)
$40/bbl and 36p/therm NPV : £10m @10% Real Post-tax Discount Rate
-10
-8
-6
-4
-2
0
2
4
2006 2008 2010 2012 2014 2016 2018 2020 2022 2024 2026 2028 2030 2032 2034
mboe/d
Sanctioned Incremental Future Incremental Probable FieldsPossible Fields Technical Reserves New Exploration

62
Chart 69
Chart 70 shows the change in tax revenue taking account of the tax on
interest. It cumulates to a reduction in tax revenue of £318m in the
period to 2035 which is relatively small.
Chart 70
Potential Change in Real Tax Revenue(excludes tax on interest)
Decommissioning Fund : with relief for Fund contributions,(no change in decommissioning date)
$40/bbl and 36p/therm NPV : £10m @10% Real Post-tax Discount Rate
-800
-600
-400
-200
0
200
400
600
2006 2008 2010 2012 2014 2016 2018 2020 2022 2024 2026 2028 2030 2032 2034
£m (2006)
Sanctioned Incremental Future Incremental Probable FieldsPossible Fields Technical Reserves New Exploration
Potential Change in Real Tax RevenueDecommissioning Fund : with relief for Fund contributions,
interest at base rate minus 40% tax on interest (no change in decommissioning date)
$40/bbl and 36p/therm NPV : £10m @10% Real Post-tax Discount Rate
-800
-600
-400
-200
0
200
400
600
2006 2008 2010 2012 2014 2016 2018 2020 2022 2024 2026 2028 2030 2032 2034
£m (2006)
Sanctioned Incremental Future Incremental Probable FieldsPossible Fields Technical Reserves New Exploration

63
Fund 2
In this case the assumptions are the same as for Fund 1 except that the
return attained by the Fund is 10% in MOD terms. Because of the higher
return achieved by the Fund the total contributions are less than in the
Fund 1 case.
Chart 71 shows the potential decommissioning costs with a Fund scheme
paying gross interest of 10% and the medium price. The
decommissioning cost may cumulate to £14014m in the period to 2035.
Chart 71
Chart 72 shows the potential decommissioning relief. It cumulates to
£7511m in the period to 2035.
Potential Real Decommissioning ExpenditureDecommissioning Fund 10% MOD : with relief for Fund contributions,
(no change in decommissioning date)$30/bbl and 28p/therm
NPV : £10m @10% Real Post-tax Discount Rate
-200
0
200
400
600
800
1000
1200
2006 2008 2010 2012 2014 2016 2018 2020 2022 2024 2026 2028 2030 2032 2034
£m (2006)
Sanctioned Incremental Future Incremental Probable FieldsPossible Fields Technical Reserves New Exploration

64
Chart 72
Chart 73 shows the tax on the Fund income. It cumulates to £2643m in
the period to 2035.
Chart 73
Potential Real Decommissioning ReliefDecommissioning Fund 10% MOD : with relief for Fund contributions,
(no change in decommissioning date)$30/bbl and 28p/therm
NPV : £10m @10% Real Post-tax Discount Rate
-200 -100
0100200300400500600700800
2006 2008 2010 2012 2014 2016 2018 2020 2022 2024 2026 2028 2030 2032 2034
£m (2006)
Sanctioned Incremental Future Incremental Probable FieldsPossible Fields Technical Reserves New Exploration
Potential Real Tax on InterestDecommissioning Fund 10% MOD : with relief for Fund contributions,
(no change in decommissioning date)$30/bbl and 28p/therm
NPV : £10m @10% Real Post-tax Discount Rate
0
20
40
60
80
100
120
140
160
2006 2008 2010 2012 2014 2016 2018 2020 2022 2024 2026 2028 2030 2032 2034
£m (2006)
Sanctioned Incremental Future Incremental Probable FieldsPossible Fields Technical Reserves New Exploration

65
Chart 74 shows the real Fund payments paid by the licensees under the
medium price. They cumulate to £9049m in the period to 2035.
Chart 74
Chart 75 shows the potential Fund shortfall under the medium price. It
cumulates to £3788m in the period to 2035.
Potential Real Fund PaymentsDecommissioning Fund 10% MOD : with relief for Fund contributions,
(no change in decommissioning date)$30/bbl and 28p/therm
NPV : £10m @10% Real Post-tax Discount Rate
0
100
200
300
400
500
600
700
800
2006 2008 2010 2012 2014 2016 2018 2020 2022 2024 2026 2028 2030 2032 2034
£m (2006)
Sanctioned Incremental Future Incremental Probable FieldsPossible Fields Technical Reserves New Exploration

66
Chart 75
Chart 76 shows the change in operating costs of the Fund scheme. It
cumulates to £1393m in the period to 2035.
Chart 76
Potential Real Fund ShortfallDecommissioning Fund 10% MOD : with relief for Fund contributions,
(no change in decommissioning date)$30/bbl and 28p/therm
NPV : £10m @10% Real Post-tax Discount Rate
-500
-400
-300
-200
-100
0
100
2006 2008 2010 2012 2014 2016 2018 2020 2022 2024 2026 2028 2030 2032 2034
£m (2006)
Sanctioned Incremental Future Incremental Probable FieldsPossible Fields Technical Reserves New Exploration
Potential Change in Real Operating ExpenditureDecommissioning Fund 10% MOD : with relief for Fund contributions,
(no change in decommissioning date)$30/bbl and 28p/therm
NPV : £10m @10% Real Post-tax Discount Rate
-120
-100
-80
-60
-40
-20
0
2006 2008 2010 2012 2014 2016 2018 2020 2022 2024 2026 2028 2030 2032 2034
£m (2006)
Sanctioned Incremental Future Incremental Probable FieldsPossible Fields Technical Reserves New Exploration

67
Chart 77 shows the corresponding development expenditure foregone. It
cumulates to £493m.
Chart 77
Chart 78 shows the corresponding potential production which may be
foregone. This could cumulate to 133Mboe.
Potential Change in Real Development ExpenditureDecommissioning Fund 10% MOD : with relief for Fund contributions,
(no change in decommissioning date)$30/bbl and 28p/therm
NPV : £10m @10% Real Post-tax Discount Rate
-120
-100
-80
-60
-40
-20
0
20
40
2006 2008 2010 2012 2014 2016 2018 2020 2022 2024 2026 2028 2030 2032 2034
£m (2006)
Sanctioned Incremental Future Incremental Probable FieldsPossible Fields Technical Reserves New Exploration

68
Chart 78
A quite substantial part of the losses in production occur because projects
fail to pass the economic hurdle following the introduction of the Fund.
Chart 79 shows the change in tax revenues (excluding the tax on interest)
which would be expected with the introduction of the Fund scheme. It
cumulates to a reduction of £2022m in the period to 2035.
Potential Change in ProductionDecommissioning Fund 10% MOD : with relief for Fund contributions,
(no change in decommissioning date)$30/bbl and 28p/therm
NPV : £10m @10% Real Post-tax Discount Rate
-35 -30 -25 -20 -15 -10
-5 05
10
2006 2008 2010 2012 2014 2016 2018 2020 2022 2024 2026 2028 2030 2032 2034
mboe/d
Sanctioned Incremental Future Incremental Probable FieldsPossible Fields Technical Reserves New Exploration

69
Chart 79
Chart 80 shows the change in tax revenues taking into account the tax on Fund
income. This cumulates to an increase in tax revenue of £621m in the period to
2035.
Chart 80
Potential Change in Real Tax Revenue (excluding effect of tax on interest)
Decommissioning Fund 10% MOD : with relief for Fund contributions,(no change in decommissioning date)
$30/bbl and 28p/therm NPV : £10m @10% Real Post-tax Discount Rate
-800
-600
-400
-200
0
200
400
600
2006 2008 2010 2012 2014 2016 2018 2020 2022 2024 2026 2028 2030 2032 2034
£m (2006)
Sanctioned Incremental Future Incremental Probable FieldsPossible Fields Technical Reserves New Exploration
Potential Change in Real Tax Revenue Decommissioning Fund 10% MOD : with relief for Fund contributions,
(no change in decommissioning date)$30/bbl and 28p/therm
NPV : £10m @10% Real Post-tax Discount Rate
-800
-600
-400
-200
0
200
400
600
2006 2008 2010 2012 2014 2016 2018 2020 2022 2024 2026 2028 2030 2032 2034
£m (2006)
Sanctioned Incremental Future Incremental Probable FieldsPossible Fields Technical Reserves New Exploration

70
Chart 81 shows the potential decommissioning costs with a Fund scheme
receiving gross income of 10% under the high price. The
decommissioning cost cumulates to £15083m in the period to 2035.
Chart 81
Chart 82 shows the potential decommissioning relief under the high price.
It cumulates to £7950m in the period to 2035.
Potential Real Decommissioning ExpenditureDecommissioning Fund 10% MOD : with relief for Fund contributions,
(no change in decommissioning date)$40/bbl and 36p/therm
NPV : £10m @10% Real Post-tax Discount Rate
-400 -200
0200400600800
10001200140016001800
2006 2008 2010 2012 2014 2016 2018 2020 2022 2024 2026 2028 2030 2032 2034
£m (2006)
Sanctioned Incremental Future Incremental Probable FieldsPossible Fields Technical Reserves New Exploration

71
Chart 82
Chart 83 shows the tax on the Fund interest with the$40, 36p price. It cumulates to £2754m in the period to 2035.
Chart 83
Potential Real Decommissioning ReliefDecommissioning Fund 10% MOD : with relief for Fund contributions,
(no change in decommissioning date)$40/bbl and 36p/therm
NPV : £10m @10% Real Post-tax Discount Rate
-200
-100
0
100
200
300
400
500
600
2006 2008 2010 2012 2014 2016 2018 2020 2022 2024 2026 2028 2030 2032 2034
£m (2006)
Sanctioned Incremental Future Incremental Probable FieldsPossible Fields Technical Reserves New Exploration
Potential Real Tax on InterestDecommissioning Fund 10% MOD : with relief for Fund contributions,
(no change in decommissioning date)$40/bbl and 36p/therm
NPV : £10m @10% Real Post-tax Discount Rate
0
20
40
60
80
100
120
140
160
2006 2008 2010 2012 2014 2016 2018 2020 2022 2024 2026 2028 2030 2032 2034
£m (2006)
Sanctioned Incremental Future Incremental Probable FieldsPossible Fields Technical Reserves New Exploration

72
Chart 84 shows the real Fund payments paid by the operators. They
cumulate to £10030m in the period to 2035.
Chart 84
Chart 85 shows the potential Fund shortfall under the medium price. It
cumulates to £3684m in the period to 2035.
Potential Real Fund PaymentsDecommissioning Fund 10% MOD : with relief for Fund contributions,
(no change in decommissioning date)$40/bbl and 36p/therm
NPV : £10m @10% Real Post-tax Discount Rate
0
100
200
300
400
500
600
700
800
2006 2008 2010 2012 2014 2016 2018 2020 2022 2024 2026 2028 2030 2032 2034
£m (2006)
Sanctioned Incremental Future Incremental Probable FieldsPossible Fields Technical Reserves New Exploration

73
Chart 85
Chart 86 shows the change in operating costs which may occur with a Fund
scheme under the high price. The change in operating costs may cumulate to
£55m in the period to 2035.
Chart 86
Potential Real Fund ShortfallDecommissioning Fund 10% MOD : with relief for Fund contributions,
(no change in decommissioning date)$40/bbl and 36p/therm
NPV : £10m @10% Real Post-tax Discount Rate
-400 -350 -300 -250 -200 -150 -100
-50 0
50100
2006 2008 2010 2012 2014 2016 2018 2020 2022 2024 2026 2028 2030 2032 2034
£m (2006)
Sanctioned Incremental Future Incremental Probable FieldsPossible Fields Technical Reserves New Exploration
Potential Change in Real Operating ExpenditureDecommissioning Fund 10% MOD : with relief for Fund contributions,
(no change in decommissioning date)$40/bbl and 36p/therm
NPV : £10m @10% Real Post-tax Discount Rate
-8
-6
-4
-2
0
2
4
2006 2008 2010 2012 2014 2016 2018 2020 2022 2024 2026 2028 2030 2032 2034
£m (2006)
Sanctioned Incremental Future Incremental Probable FieldsPossible Fields Technical Reserves New Exploration

74
Chart 87 shows the corresponding development expenditure foregone. It
may cumulate to £109m.
Chart 87
Potential Change in Real Development ExpenditureDecommissioning Fund 10% MOD : with relief for Fund contributions,
(no change in decommissioning date)$40/bbl and 36p/therm
NPV : £10m @10% Real Post-tax Discount Rate
-80 -70 -60 -50 -40 -30 -20 -10
01020
2006 2008 2010 2012 2014 2016 2018 2020 2022 2024 2026 2028 2030 2032 2034
£m (2006)
Sanctioned Incremental Future Incremental Probable FieldsPossible Fields Technical Reserves New Exploration

75
Chart 88 shows the corresponding potential production which may be
foregone. This could cumulate to 23Mboe.
Chart 88
Under this scheme there is very little loss of production from the failure
of projects to pass the economic hurdle.
Potential Change in ProductionDecommissioning Fund 10% MOD : with relief for Fund contributions,
(no change in decommissioning date)$40/bbl and 36p/therm
NPV : £10m @10% Real Post-tax Discount Rate
-10
-8
-6
-4
-2
0
2
4
2006 2008 2010 2012 2014 2016 2018 2020 2022 2024 2026 2028 2030 2032 2034
mboe/d
Sanctioned Incremental Future Incremental Probable FieldsPossible Fields Technical Reserves New Exploration

76
Chart 89 shows the change in tax revenues (excluding the tax on interest).
These cumulate to £660m in the period to 2035.
Chart 89
Chart 90 shows the change in tax revenues taking into account the tax on
Fund income. This cumulates to an increase in tax revenue of £2094m in
the period to 2035 when the tax on interest is included.
Potential Change in Real Tax Revenue(excluding effect of tax on interest)
Decommissioning Fund 10% MOD : with relief for Fund contributions,(no change in decommissioning date)
$40/bbl and 36p/therm NPV : £10m @10% Real Post-tax Discount Rate
-600
-400
-200
0
200
400
600
2006 2008 2010 2012 2014 2016 2018 2020 2022 2024 2026 2028 2030 2032 2034
£m (2006)
Sanctioned Incremental Future Incremental Probable FieldsPossible Fields Technical Reserves New Exploration

77
Chart 90
Fund 3
The assumptions for the 3rd Fund scheme are same as for Fund 2, except
that it is assumed that there may be behavioural changes, namely
acceleration of decommissioning to avoid negative cash flows. As with
Funds 1 and 2 investment in very marginal projects may be deterred
because of Fund payments.
Chart 91 shows the potential decommissioning costs under the medium
price. The decommissioning cost may cumulate to £13273m in the
period to 2035.
Potential Change in Real Tax Revenue Decommissioning Fund 10% MOD : with relief for Fund contributions,
(no change in decommissioning date)$40/bbl and 36p/therm
NPV : £10m @10% Real Post-tax Discount Rate
-600
-400
-200
0
200
400
600
800
2006 2008 2010 2012 2014 2016 2018 2020 2022 2024 2026 2028 2030 2032 2034
£m (2006)
Sanctioned Incremental Future Incremental Probable FieldsPossible Fields Technical Reserves New Exploration

78
Chart 91
Chart 92 shows the potential decommissioning relief. It cumulates to
£7404m in the period.
Chart 92
Potential Real Decommissioning ExpenditureDecommissioning Fund 10% MOD: with relief for Fund contributions,
$30/bbl and 28p/therm NPV : £10m @10% Real Post-tax Discount Rate
-400
-200
0
200
400
600
800
1000
1200
2006 2008 2010 2012 2014 2016 2018 2020 2022 2024 2026 2028 2030 2032 2034
£m (2006)
Sanctioned Incremental Future Incremental Probable FieldsPossible Fields Technical Reserves New Exploration
Potential Real Decommissioning ReliefDecommissioning Fund 10% MOD: with relief for Fund contributions,
$30/bbl and 28p/therm NPV : £10m @10% Real Post-tax Discount Rate
-200
0
200
400
600
800
1000
2006 2008 2010 2012 2014 2016 2018 2020 2022 2024 2026 2028 2030 2032 2034
£m (2006)
Sanctioned Incremental Future Incremental Probable FieldsPossible Fields Technical Reserves New Exploration

79
Chart 93 shows the tax on the Fund income change. This tax may
cumulate to £2745m in the period to 2035.
Chart 93
Chart 94 shows the real Fund payments paid by the operators. They may
cumulate to £10593m in the period.
Chart 94
Potential Real Tax on InterestDecommissioning Fund 10% MOD: with relief for Fund contributions,
$30/bbl and 28p/therm NPV : £10m @10% Real Post-tax Discount Rate
0
20
40
60
80
100
120
140
160
2006 2008 2010 2012 2014 2016 2018 2020 2022 2024 2026 2028 2030 2032 2034
£m (2006)
Sanctioned Incremental Future Incremental Probable FieldsPossible Fields Technical Reserves New Exploration
Potential Real Fund PaymentsDecommissioning Fund 10% MOD: with relief for Fund contributions,
$30/bbl and 28p/therm NPV : £10m @10% Real Post-tax Discount Rate
0
200
400
600
800
1000
1200
1400
2006 2008 2010 2012 2014 2016 2018 2020 2022 2024 2026 2028 2030 2032 2034
£m (2006)
Sanctioned Incremental Future Incremental Probable FieldsPossible Fields Technical Reserves New Exploration

80
Chart 95 shows the potential Fund shortfall. It cumulates to £2142m in
the period.
Chart 95
Chart 96 shows the change in operating costs which may occur with a
Fund scheme under the medium price. The change in operating costs
may cumulate to £2810m in the period to 2035.
Potential Real Fund ShortfallDecommissioning Fund 10% MOD: with relief for Fund contributions,
$30/bbl and 28p/therm NPV : £10m @10% Real Post-tax Discount Rate
-600
-500
-400
-300
-200
-100
0
100
200
2006 2008 2010 2012 2014 2016 2018 2020 2022 2024 2026 2028 2030 2032 2034
£m (2006)
Sanctioned Incremental Future Incremental Probable FieldsPossible Fields Technical Reserves New Exploration

81
Chart 96
Chart 97 shows the equivalent development expenditure foregone which
may cumulate to £916m.
Chart 97
Potential Change in Real Operating ExpenditureDecommissioning Fund 10% MOD: with relief for Fund contributions,
$30/bbl and 28p/therm NPV : £10m @10% Real Post-tax Discount Rate
-250
-200
-150
-100
-50
0
50
100
2006 2008 2010 2012 2014 2016 2018 2020 2022 2024 2026 2028 2030 2032 2034
£m (2006)
Sanctioned Incremental Future Incremental Probable FieldsPossible Fields Technical Reserves New Exploration
Potential Change in Real Development ExpenditureDecommissioning Fund 10% MOD: with relief for Fund contributions,
$30/bbl and 28p/therm NPV : £10m @10% Real Post-tax Discount Rate
-140
-120
-100
-80
-60
-40
-20
0
20
40
2006 2008 2010 2012 2014 2016 2018 2020 2022 2024 2026 2028 2030 2032 2034
£m (2006)
Sanctioned Incremental Future Incremental Probable FieldsPossible Fields Technical Reserves New Exploration
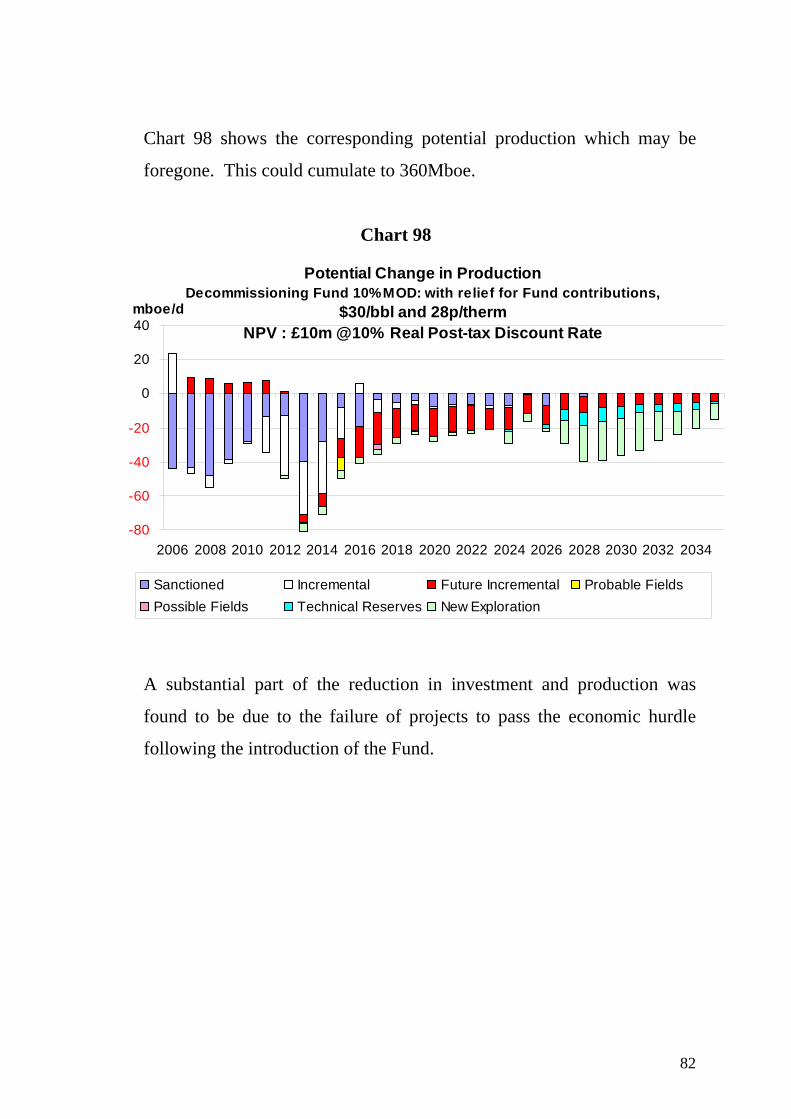
82
Chart 98 shows the corresponding potential production which may be
foregone. This could cumulate to 360Mboe.
Chart 98
A substantial part of the reduction in investment and production was
found to be due to the failure of projects to pass the economic hurdle
following the introduction of the Fund.
Potential Change in ProductionDecommissioning Fund 10% MOD: with relief for Fund contributions,
$30/bbl and 28p/therm NPV : £10m @10% Real Post-tax Discount Rate
-80
-60
-40
-20
0
20
40
2006 2008 2010 2012 2014 2016 2018 2020 2022 2024 2026 2028 2030 2032 2034
mboe/d
Sanctioned Incremental Future Incremental Probable FieldsPossible Fields Technical Reserves New Exploration

83
Chart 99 shows the change in tax revenues (excluding the tax on interest)
following the introduction of the Fund. This may cumulate to a reduction
in tax revenue of £2639m in the period to 2035.
Chart 99
Chart 100 shows the change in tax revenues taking into account of the tax
on interest. This may cumulate to an increase in tax revenues of £106m
in the period.
Potential Change in Real Tax Revenueexcluding effect of tax on interest
Decommissioning Fund 10% MOD: with relief for Fund contributions,$30/bbl and 28p/therm
NPV : £10m @10% Real Post-tax Discount Rate
-800
-600
-400
-200
0
200
400
600
2006 2008 2010 2012 2014 2016 2018 2020 2022 2024 2026 2028 2030 2032 2034
£m (2006)
Sanctioned Incremental Future Incremental Probable FieldsPossible Fields Technical Reserves New Exploration

84
Chart 100
Chart 101 shows the potential decommissioning costs where the Fund
earns income of 10% under the $40, 36 pence case. The
decommissioning costs cumulate to £15047m in the period to 2035.
Chart 101
Potential Change in Real Tax RevenueDecommissioning Fund 10% MOD: with relief for Fund contributions,
$30/bbl and 28p/therm NPV : £10m @10% Real Post-tax Discount Rate
-800
-600
-400
-200
0
200
400
600
2006 2008 2010 2012 2014 2016 2018 2020 2022 2024 2026 2028 2030 2032 2034
£m (2006)
Sanctioned Incremental Future Incremental Probable FieldsPossible Fields Technical Reserves New Exploration
Potential Real Decommissioning ExpenditureDecommissioning Fund 10% MOD: with relief for Fund contributions,
$40/bbl and 36p/therm NPV : £10m @10% Real Post-tax Discount Rate
-400
-200
0
200
400
600
800
1000
1200
1400
2006 2008 2010 2012 2014 2016 2018 2020 2022 2024 2026 2028 2030 2032 2034
£m (2006)
Sanctioned Incremental Future Incremental Probable FieldsPossible Fields Technical Reserves New Exploration

85
Chart 102 shows the decommissioning relief. It cumulates to £8149m
in the period to 2035.
Chart 102
Chart 103 shows the tax on the Fund income. The tax revenues cumulate
to £2949m in the period to 2035.
Chart 103
Potential Real Decommissioning ReliefDecommissioning Fund 10% MOD: with relief for Fund contributions,
$40/bbl and 36p/therm NPV : £10m @10% Real Post-tax Discount Rate
-200 -100
0100200300400500600700800
2006 2008 2010 2012 2014 2016 2018 2020 2022 2024 2026 2028 2030 2032 2034
£m (2006)
Sanctioned Incremental Future Incremental Probable FieldsPossible Fields Technical Reserves New Exploration
Potential Real Tax on InterestDecommissioning Fund 10% MOD: with relief for Fund contributions,
$40/bbl and 36p/therm NPV : £10m @10% Real Post-tax Discount Rate
0
20
40
60
80
100
120
140
160
2006 2008 2010 2012 2014 2016 2018 2020 2022 2024 2026 2028 2030 2032 2034
£m (2006)
Sanctioned Incremental Future Incremental Probable FieldsPossible Fields Technical Reserves New Exploration
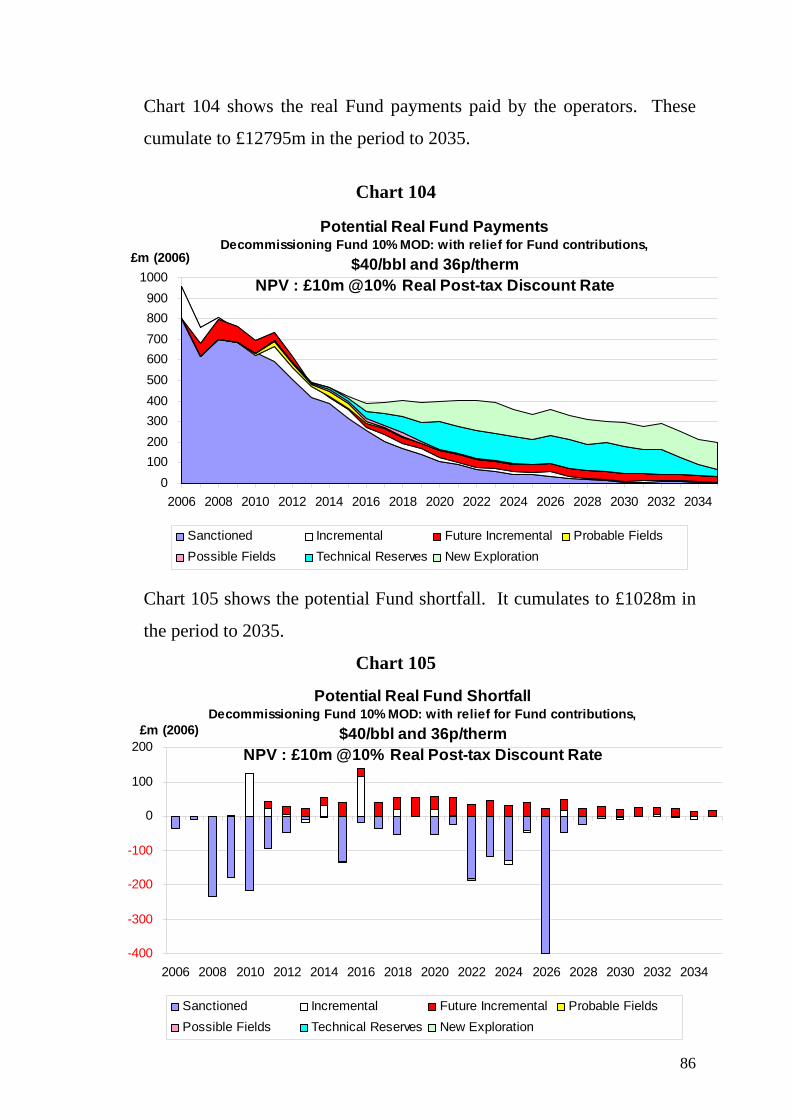
86
Chart 104 shows the real Fund payments paid by the operators. These
cumulate to £12795m in the period to 2035.
Chart 104
Chart 105 shows the potential Fund shortfall. It cumulates to £1028m in
the period to 2035.
Chart 105
Potential Real Fund PaymentsDecommissioning Fund 10% MOD: with relief for Fund contributions,
$40/bbl and 36p/therm NPV : £10m @10% Real Post-tax Discount Rate
0100200300400500600700800900
1000
2006 2008 2010 2012 2014 2016 2018 2020 2022 2024 2026 2028 2030 2032 2034
£m (2006)
Sanctioned Incremental Future Incremental Probable FieldsPossible Fields Technical Reserves New Exploration
Potential Real Fund ShortfallDecommissioning Fund 10% MOD: with relief for Fund contributions,
$40/bbl and 36p/therm NPV : £10m @10% Real Post-tax Discount Rate
-400
-300
-200
-100
0
100
200
2006 2008 2010 2012 2014 2016 2018 2020 2022 2024 2026 2028 2030 2032 2034
£m (2006)
Sanctioned Incremental Future Incremental Probable FieldsPossible Fields Technical Reserves New Exploration

87
Chart 106 shows the change in operating costs. It cumulates to £1757 in
the period to 2035.
Chart 106
Chart 107 shows the change in development expenditures. They
cumulate to £460m.
Chart 107
Potential Change in Real Operating ExpenditureDecommissioning Fund 10% MOD: with relief for Fund contributions,
$40/bbl and 36p/therm NPV : £10m @10% Real Post-tax Discount Rate
-200
-150
-100
-50
0
50
100
2006 2008 2010 2012 2014 2016 2018 2020 2022 2024 2026 2028 2030 2032 2034
£m (2006)
Sanctioned Incremental Future Incremental Probable FieldsPossible Fields Technical Reserves New Exploration
Potential Change in Real Development ExpenditureDecommissioning Fund 10% MOD: with relief for Fund contributions,
$40/bbl and 36p/therm NPV : £10m @10% Real Post-tax Discount Rate
-80
-60
-40
-20
0
20
40
2006 2008 2010 2012 2014 2016 2018 2020 2022 2024 2026 2028 2030 2032 2034
£m (2006)
Sanctioned Incremental Future Incremental Probable FieldsPossible Fields Technical Reserves New Exploration

88
Chart 108 shows the corresponding loss of production. It cumulates to 260Mboe.
Chart 108
It was found that a moderate element of the reduction in production was
due to projects failing to pass the economic hurdle as a consequence of
the introduction of the Fund.
Potential Change in ProductionDecommissioning Fund 10% MOD: with relief for Fund contributions,
$40/bbl and 36p/therm NPV : £10m @10% Real Post-tax Discount Rate
-80
-60
-40
-20
0
20
2006 2008 2010 2012 2014 2016 2018 2020 2022 2024 2026 2028 2030 2032 2034
mboe/d
Sanctioned Incremental Future Incremental Probable FieldsPossible Fields Technical Reserves New Exploration

89
Chart 109 shows the change in tax revenue (excluding the tax on interest)
following the introduction of the Fund scheme. This cumulates to a
reduction in tax revenue of £1239m in the period to 2035.
Chart 109
Potential Change in Real Tax Revenueexcluding effect of tax on interest
Decommissioning Fund 10% MOD: with relief for Fund contributions, $40/bbl and 36p/therm
NPV : £10m @10% Real Post-tax Discount Rate
-800
-600
-400
-200
0
200
400
600
800
2006 2008 2010 2012 2014 2016 2018 2020 2022 2024 2026 2028 2030 2032 2034
£m (2006)
Sanctioned Incremental Future Incremental Probable FieldsPossible Fields Technical Reserves New Exploration

90
Chart 110 shows the change in tax revenue taking account the tax on the
Funds income. The total cumulates to an increase in tax revenue of
£1710m in the period to 2035 when the tax on interest is included.
Chart 110
Fund 4
The 4th Fund scenario assumes Fund income of 4.75% and, as in the 3rd
Fund scenario, the Fund payments may result in acceleration of the
decommissioning date.
Chart 111 shows the potential decommissioning costs with a Fund
scheme paying gross interest of 4.75% under the $30, 28 pence price.
The decommissioning costs cumulate to £13368m in the period to 2035.
Potential Change in Real Tax RevenueDecommissioning Fund 10% MOD: with relief for Fund contributions,
$40/bbl and 36p/therm NPV : £10m @10% Real Post-tax Discount Rate
-800 -600 -400 -200
0200400600800
2006 2008 2010 2012 2014 2016 2018 2020 2022 2024 2026 2028 2030 2032 2034
£m (2006)
Sanctioned Incremental Future Incremental Probable FieldsPossible Fields Technical Reserves New Exploration

91
Chart 111
Chart 112 shows the decommissioning relief. The total cumulates to
£8632m in the period to 2035.
Chart 112
Potential Real Decommissioning ExpenditureDecommissioning Fund : with relief for Fund contributions,
interest at base rate minus 40% tax on interest $30/bbl and 28p/therm
NPV : £10m @10% Real Post-tax Discount Rate
-400
-200
0
200
400
600
800
1000
1200
2006 2008 2010 2012 2014 2016 2018 2020 2022 2024 2026 2028 2030 2032 2034
£m (2006)
Sanctioned Incremental Future Incremental Probable FieldsPossible Fields Technical Reserves New Exploration
Potential Real Decommissioning ReliefDecommissioning Fund : with relief for Fund contributions,
interest at base rate minus 40% tax on interest $30/bbl and 28p/therm
NPV : £10m @10% Real Post-tax Discount Rate
-400
-200
0
200
400
600
800
1000
1200
1400
2006 2008 2010 2012 2014 2016 2018 2020 2022 2024 2026 2028 2030 2032 2034
£m (2006)
Sanctioned Incremental Future Incremental Probable FieldsPossible Fields Technical Reserves New Exploration

92
Chart 113 shows the tax on the Fund income. The total tax on the interest
cumulates to £1550m in the period to 2035.
Chart 113
Chart 114 shows the real Fund contributions paid by the operators under
the medium price. These cumulate to £12625m in the period to 2035.
Chart 114
Potential Real Tax on InterestDecommissioning Fund : with relief for Fund contributions,
interest at base rate minus 40% tax on interest $30/bbl and 28p/therm
NPV : £10m @10% Real Post-tax Discount Rate
0102030405060708090
100
2006 2008 2010 2012 2014 2016 2018 2020 2022 2024 2026 2028 2030 2032 2034
£m (2006)
Sanctioned Incremental Future Incremental Probable FieldsPossible Fields Technical Reserves New Exploration
Potential Real Fund PaymentsDecommissioning Fund : with relief for Fund contributions,
interest at base rate minus 40% tax on interest $30/bbl and 28p/therm
NPV : £10m @10% Real Post-tax Discount Rate
0
200
400
600
800
1000
1200
1400
1600
2006 2008 2010 2012 2014 2016 2018 2020 2022 2024 2026 2028 2030 2032 2034
£m (2006)
Sanctioned Incremental Future Incremental Probable FieldsPossible Fields Technical Reserves New Exploration

93
Chart 115 shows the potential Fund shortfall under the medium price.
The shortfall may cumulate to £2105m in the period to 2035.
Chart 115
Chart 116 shows the change in operating costs. The total may cumulate
to £3169m in the period to 2035.
Potential Real Fund ShortfallDecommissioning Fund : with relief for Fund contributions,
interest at base rate minus 40% tax on interest $30/bbl and 28p/therm
NPV : £10m @10% Real Post-tax Discount Rate
-500 -450 -400 -350 -300 -250 -200 -150 -100 -50
0
2006 2008 2010 2012 2014 2016 2018 2020 2022 2024 2026 2028 2030 2032 2034
£m (2006)
Sanctioned Incremental Future Incremental Probable FieldsPossible Fields Technical Reserves New Exploration

94
Chart 116
Chart 117 shows the corresponding development expenditure. It
cumulates to £911m.
Chart 117
Potential Change in Real Operating ExpenditureDecommissioning Fund : with relief for Fund contributions,
interest at base rate minus 40% tax on interest $30/bbl and 28p/therm
NPV : £10m @10% Real Post-tax Discount Rate
-250
-200
-150
-100
-50
0
50
100
2006 2008 2010 2012 2014 2016 2018 2020 2022 2024 2026 2028 2030 2032 2034
£m (2006)
Sanctioned Incremental Future Incremental Probable FieldsPossible Fields Technical Reserves New Exploration
Potential Change in Real Development ExpenditureDecommissioning Fund : with relief for Fund contributions,
interest at base rate minus 40% tax on interest $30/bbl and 28p/therm
NPV : £10m @10% Real Post-tax Discount Rate
-140 -120 -100 -80 -60 -40 -20
02040
2006 2008 2010 2012 2014 2016 2018 2020 2022 2024 2026 2028 2030 2032 2034
£m (2006)
Sanctioned Incremental Future Incremental Probable FieldsPossible Fields Technical Reserves New Exploration

95
Chart 118 shows the corresponding change in production. It could
cumulate to 358Mboe.
Chart 118
Only a modest part of the loss of production was found to be due to the
failure of projects to pass the economic hurdle following the introduction
of the Fund.
Chart 119 shows the change in tax revenue (excluding the tax on interest.
This cumulates to a reduction of £3303m in the period to 2035.
Potential Change in ProductionDecommissioning Fund : with relief for Fund contributions,
interest at base rate minus 40% tax on interest $30/bbl and 28p/therm
NPV : £10m @10% Real Post-tax Discount Rate
-80
-60
-40
-20
0
20
40
2006 2008 2010 2012 2014 2016 2018 2020 2022 2024 2026 2028 2030 2032 2034
mboe/d
Sanctioned Incremental Future Incremental Probable FieldsPossible Fields Technical Reserves New Exploration

96
Chart 119
Chart 120 shows the change in tax revenue taking into account the tax on
interest. The total cumulates to a decrease in tax revenue of £1753m in
the period.
Chart 120
Potential Change in Real Tax Revenue Decommissioning Fund : with relief for Fund contributions,
$30/bbl and 28p/therm NPV : £10m @10% Real Post-tax Discount Rate
-1000 -800 -600 -400 -200
0200400600
2006 2008 2010 2012 2014 2016 2018 2020 2022 2024 2026 2028 2030 2032 2034
£m(2006)
Sanctioned Incremental Future Incremental Probable FieldsPossible Fields Technical Reserves New Exploration
Potential Change in Real Tax Revenue (excludes effect of tax on interest)
Decommissioning Fund : with relief for Fund contributions, interest at base rate minus 40% tax on interest
$30/bbl and 28p/therm NPV : £10m @10% Real Post-tax Discount Rate
-1000 -800 -600 -400 -200
0200400600
2006 2008 2010 2012 2014 2016 2018 2020 2022 2024 2026 2028 2030 2032 2034
£m (2006)
Sanctioned Incremental Future Incremental Probable FieldsPossible Fields Technical Reserves New Exploration

97
The position under the $40, 36 pence price is now examined. Chart 121
shows the decommissioning costs. The total may cumulate to £15058m
in the period.
Chart 121
Chart 122 shows the decommissioning relief. It cumulates to £9742m in
the period.
Chart 122
Potential Real Decommissioning ExpenditureDecommissioning Fund : with relief for Fund contributions,
interest at base rate minus 40% tax on interest $40/bbl and 36p/therm
NPV : £10m @10% Real Post-tax Discount Rate
-400
-200
0
200
400
600
800
1000
1200
1400
2006 2008 2010 2012 2014 2016 2018 2020 2022 2024 2026 2028 2030 2032 2034
£m (2006)
Sanctioned Incremental Future Incremental Probable FieldsPossible Fields Technical Reserves New Exploration
Potential Real Decommissioning ReliefDecommissioning Fund : with relief for Fund contributions,
interest at base rate minus 40% tax on interest $40/bbl and 36p/therm
NPV : £10m @10% Real Post-tax Discount Rate
-200
0
200
400
600
800
1000
2006 2008 2010 2012 2014 2016 2018 2020 2022 2024 2026 2028 2030 2032 2034
£m (2006)
Sanctioned Incremental Future Incremental Probable FieldsPossible Fields Technical Reserves New Exploration

98
Chart 123 shows the tax on the Fund interest. The total tax on the
interest cumulates to £1654m in the period.
Chart 123
Chart 124 shows the Fund contributions paid. They cumulate to
£15097m in the period.
Chart 124
Potential Real Tax on InterestDecommissioning Fund : with relief for Fund contributions,
interest at base rate minus 40% tax on interest $40/bbl and 36p/therm
NPV : £10m @10% Real Post-tax Discount Rate
0102030405060708090
100
2006 2008 2010 2012 2014 2016 2018 2020 2022 2024 2026 2028 2030 2032 2034
£m (2006)
Sanctioned Incremental Future Incremental Probable FieldsPossible Fields Technical Reserves New Exploration
Potential Real Fund PaymentsDecommissioning Fund : with relief for Fund contributions,
interest at base rate minus 40% tax on interest $40/bbl and 36p/therm
NPV : £10m @10% Real Post-tax Discount Rate
0
200
400
600
800
1000
1200
1400
2006 2008 2010 2012 2014 2016 2018 2020 2022 2024 2026 2028 2030 2032 2034
£m (2006)
Sanctioned Incremental Future Incremental Probable FieldsPossible Fields Technical Reserves New Exploration

99
Chart 125 shows the potential Fund shortfall under the medium price.
The shortfall may cumulate to £1293m in the period to 2035.
Chart 125
Chart 126 shows the change in operating costs. It cumulates to £2356 in
the period to 2035.
Chart 126
Potential Real Fund ShortfallDecommissioning Fund : with relief for Fund contributions,
interest at base rate minus 40% tax on interest $40/bbl and 36p/therm
NPV : £10m @10% Real Post-tax Discount Rate
-350
-300
-250
-200
-150
-100
-50
0
2006 2008 2010 2012 2014 2016 2018 2020 2022 2024 2026 2028 2030 2032 2034
£m (2006)
Sanctioned Incremental Future Incremental Probable FieldsPossible Fields Technical Reserves New Exploration
Potential Change in Real Operating ExpenditureDecommissioning Fund : with relief for Fund contributions,
interest at base rate minus 40% tax on interest $40/bbl and 36p/therm
NPV : £10m @10% Real Post-tax Discount Rate
-200
-150
-100
-50
0
50
100
2006 2008 2010 2012 2014 2016 2018 2020 2022 2024 2026 2028 2030 2032 2034
£m (2006)
Sanctioned Incremental Future Incremental Probable FieldsPossible Fields Technical Reserves New Exploration

100
Chart 127 shows the corresponding change in development expenditure.
It cumulates to £877m.
Chart 127
Chart 128 shows the corresponding lost production. It cumulates to
346Mboe.
Chart 128
Potential Change in Real Development ExpenditureDecommissioning Fund : with relief for Fund contributions,
interest at base rate minus 40% tax on interest $40/bbl and 36p/therm
NPV : £10m @10% Real Post-tax Discount Rate
-160 -140 -120 -100 -80 -60 -40 -20
02040
2006 2008 2010 2012 2014 2016 2018 2020 2022 2024 2026 2028 2030 2032 2034
£m (2006)
Sanctioned Incremental Future Incremental Probable FieldsPossible Fields Technical Reserves New Exploration
Potential Change in ProductionDecommissioning Fund : with relief for Fund contributions,
interest at base rate minus 40% tax on interest $40/bbl and 36p/therm
NPV : £10m @10% Real Post-tax Discount Rate
-80 -70 -60 -50 -40 -30 -20 -10
010
2006 2008 2010 2012 2014 2016 2018 2020 2022 2024 2026 2028 2030 2032 2034
mboe/d
Sanctioned Incremental Future Incremental Probable FieldsPossible Fields Technical Reserves New Exploration

101
It was found that a large share of the reduction in production emanated
from projects failing to pass the economic hurdle following the
introduction of the Fund.
Chart 129 shows the change in tax revenue (excluding the tax on
interest). This cumulates to a total reduction of £2861m in the period to
2035.
Chart 129
Chart 130 shows the change in tax revenue taking into account the tax on
interest. The total cumulates to a decrease in tax revenue of £1207m in
the period to 2035.
Potential Change in Real Tax Revenue(excludes effect of tax on interest)
Decommissioning Fund : with relief for Fund contributions, interest at base rate minus 40% tax on interest
$40/bbl and 36p/therm NPV : £10m @10% Real Post-tax Discount Rate
-800 -600 -400 -200
0200400600800
2006 2008 2010 2012 2014 2016 2018 2020 2022 2024 2026 2028 2030 2032 2034
£m (2006)
Sanctioned Incremental Future Incremental Probable FieldsPossible Fields Technical Reserves New Exploration

102
Chart 130
Fund 5
The 5th Fund scenario is the same as the 4thone except that no tax relief is
given for Fund contributions. Decommissioning tax relief is given, as
under the current system, when the decommissioning costs are actually
incurred.
Chart 131 shows the decommissioning costs under the $30, 28 pence
case. The total decommissioning cost cumulates to £13389m in the
period.
Potential Change in Real Tax RevenueDecommissioning Fund : with relief for Fund contributions,
$40/bbl and 36p/therm NPV : £10m @10% Real Post-tax Discount Rate
-800 -600 -400 -200
0
200400600800
2006 2008 2010 2012 2014 2016 2018 2020 2022 2024 2026 2028 2030 2032 2034
£m(2006)
Sanctioned Incremental Future Incremental Probable FieldsPossible Fields Technical Reserves New Exploration

103
Chart 131
Chart 132 shows the decommissioning relief. It cumulates to £7501m in
the period to 2035.
Chart 132
Potential Real Decommissioning Expenditure Decommissioning Fund : no relief for fund contributions,
interest at base rate minus 40% tax on interest$30/bbl and 28p/therm
NPV : £10m @10% Real Post-tax Discount Rate
-400
-200
0
200
400
600
800
1000
1200
2006 2008 2010 2012 2014 2016 2018 2020 2022 2024 2026 2028 2030 2032 2034
£m (2006)
Sanctioned Incremental Future Incremental Probable FieldsPossible Fields Technical Reserves New Exploration
Potential Real Decommissioning Relief Decommissioning Fund : no relief for fund contributions,
interest at base rate minus 40% tax on interest$30/bbl and 28p/therm
NPV : £10m @10% Real Post-tax Discount Rate
-300
-200
-100
0
100
200
300
400
500
600
2006 2008 2010 2012 2014 2016 2018 2020 2022 2024 2026 2028 2030 2032 2034
£m (2006)
Sanctioned Incremental Future Incremental Probable FieldsPossible Fields Technical Reserves New Exploration

104
Chart 133 shows the tax on the Fund interest. The total cumulates to
£1432m in the period to 2035.
Chart 133
Chart 134 shows the Fund contributions. They may cumulate to
£11614m in the period to 2035.
Chart 134
Potential Real Tax on Interest Decommissioning Fund : no relief for fund contributions,
interest at base rate minus 40% tax on interest$30/bbl and 28p/therm
NPV : £10m @10% Real Post-tax Discount Rate
0
20
40
60
80
100
2006 2008 2010 2012 2014 2016 2018 2020 2022 2024 2026 2028 2030 2032 2034
£m (2006)
Sanctioned Incremental Future Incremental Probable FieldsPossible Fields Technical Reserves New Exploration
Potential Real Fund Payments Decommissioning Fund : no relief for fund contributions,
interest at base rate minus 40% tax on interest$30/bbl and 28p/therm
NPV : £10m @10% Real Post-tax Discount Rate
0
200
400
600
800
1000
1200
1400
1600
2006 2008 2010 2012 2014 2016 2018 2020 2022 2024 2026 2028 2030 2032 2034
£m (2006)
Sanctioned Incremental Future Incremental Probable FieldsPossible Fields Technical Reserves New Exploration

105
Chart 135 shows the potential Fund shortfall under the medium price.
The shortfall may cumulate to £2784m in the period to 2035.
Chart 135
Chart 136 shows the change in operating costs following the introduction
of the Fund. The total reduction cumulates to £5505m in the period.
Chart 136
Potential Real Fund Shortfall Decommissioning Fund : no relief for fund contributions,
interest at base rate minus 40% tax on interest$30/bbl and 28p/therm
NPV : £10m @10% Real Post-tax Discount Rate
-550 -500 -450 -400 -350 -300 -250 -200 -150 -100 -50
0
2006 2008 2010 2012 2014 2016 2018 2020 2022 2024 2026 2028 2030 2032 2034
£m (2006)
Sanctioned Incremental Future Incremental Probable FieldsPossible Fields Technical Reserves New Exploration
Potential Change in Real Operating Expenditure Decommissioning Fund : no relief for fund contributions,
interest at base rate minus 40% tax on interest$30/bbl and 28p/therm
NPV : £10m @10% Real Post-tax Discount Rate
-400
-300
-200
-100
0
100
200
2006 2008 2010 2012 2014 2016 2018 2020 2022 2024 2026 2028 2030 2032 2034
£m (2006)
Sanctioned Incremental Future Incremental Probable FieldsPossible Fields Technical Reserves New Exploration

106
Chart 137 shows the corresponding development expenditure foregone
which may cumulate to £4158m.
Chart 137
Chart 138 shows the corresponding production which may be foregone.
It cumulates to 843Mboe.
Potential Change in Real Development Expenditure Decommissioning Fund : no relief for fund contributions,
interest at base rate minus 40% tax on interest$30/bbl and 28p/therm
NPV : £10m @10% Real Post-tax Discount Rate
-700
-600
-500
-400
-300
-200
-100
0
100
2006 2008 2010 2012 2014 2016 2018 2020 2022 2024 2026 2028 2030 2032 2034
£m (2006)
Sanctioned Incremental Future Incremental Probable FieldsPossible Fields Technical Reserves New Exploration

107
Chart 138
It was found that the great majority of the loss in production emanated
from the failure of the projects to pass the economic hurdle following the
introduction of the Fund.
Chart 139 shows the change in tax revenues (excluding the tax on
interest). This cumulates to a reduction of £3668m in the period.
Potential Change in Production Decommissioning Fund : no relief for fund contributions,
interest at base rate minus 40% tax on interest$30/bbl and 28p/therm
NPV : £10m @10% Real Post-tax Discount Rate
-200
-150
-100
-50
0
50
100
2006 2008 2010 2012 2014 2016 2018 2020 2022 2024 2026 2028 2030 2032 2034
mboe/d
Sanctioned Incremental Future Incremental Probable FieldsPossible Fields Technical Reserves New Exploration

108
Chart 139
Chart 140 shows the change in tax revenue taking account of the tax on
interest. This may cumulate to a decrease in tax revenue of £2236m in
the period to 2035 when the tax on interest is included.
Chart 140
Potential Change in Real Tax Revenue(excludes effect of tax on interest)
Decommissioning Fund : no relief for fund contributions, interest at base rate minus 40% tax on interest
$30/bbl and 28p/therm NPV : £10m @10% Real Post-tax Discount Rate
-500 -400 -300 -200 -100
0100200300
2006 2008 2010 2012 2014 2016 2018 2020 2022 2024 2026 2028 2030 2032 2034
£m (2006)
Sanctioned Incremental Future Incremental Probable FieldsPossible Fields Technical Reserves New Exploration
Potential Change in Real Tax Revenue Decommissioning Fund : no relief for fund contributions,
$30/bbl and 28p/therm NPV : £10m @10% Real Post-tax Discount Rate
-500 -400 -300 -200 -100
0100200300400
2006 2008 2010 2012 2014 2016 2018 2020 2022 2024 2026 2028 2030 2032 2034
£m (2006)
Sanctioned Incremental Future Incremental Probable FieldsPossible Fields Technical Reserves New Exploration
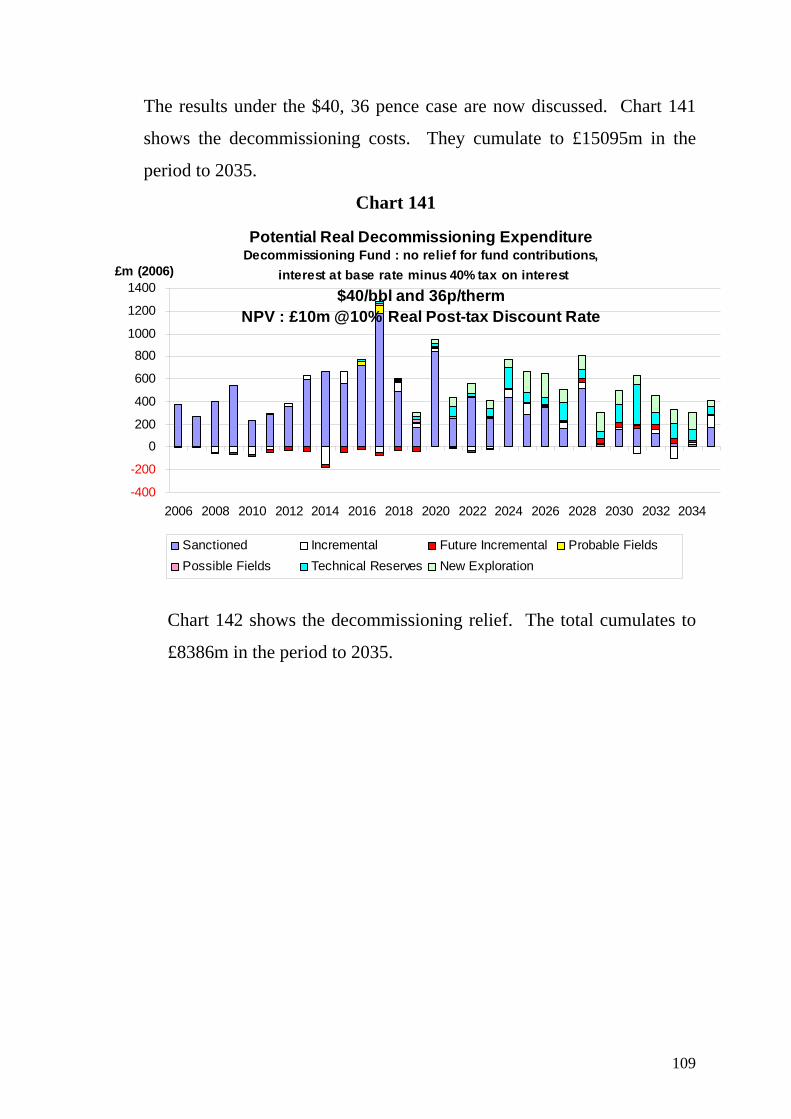
109
The results under the $40, 36 pence case are now discussed. Chart 141
shows the decommissioning costs. They cumulate to £15095m in the
period to 2035.
Chart 141
Chart 142 shows the decommissioning relief. The total cumulates to
£8386m in the period to 2035.
Potential Real Decommissioning Expenditure Decommissioning Fund : no relief for fund contributions,
interest at base rate minus 40% tax on interest$40/bbl and 36p/therm
NPV : £10m @10% Real Post-tax Discount Rate
-400
-200
0
200
400
600
800
1000
1200
1400
2006 2008 2010 2012 2014 2016 2018 2020 2022 2024 2026 2028 2030 2032 2034
£m (2006)
Sanctioned Incremental Future Incremental Probable FieldsPossible Fields Technical Reserves New Exploration

110
Chart 142
Chart 143 shows the tax on the Fund interest. The total cumulates to
£1580m in the period.
Chart 143
Potential Real Decommissioning Relief Decommissioning Fund : no relief for fund contributions,
interest at base rate minus 40% tax on interest$40/bbl and 36p/therm
NPV : £10m @10% Real Post-tax Discount Rate
-100
0
100
200
300
400
500
600
700
800
2006 2008 2010 2012 2014 2016 2018 2020 2022 2024 2026 2028 2030 2032 2034
£m (2006)
Sanctioned Incremental Future Incremental Probable FieldsPossible Fields Technical Reserves New Exploration
Potential Real Tax on Interest Decommissioning Fund : no relief for fund contributions,
interest at base rate minus 40% tax on interest$40/bbl and 36p/therm
NPV : £10m @10% Real Post-tax Discount Rate
0
20
40
60
80
100
2006 2008 2010 2012 2014 2016 2018 2020 2022 2024 2026 2028 2030 2032 2034
£m (2006)
Sanctioned Incremental Future Incremental Probable FieldsPossible Fields Technical Reserves New Exploration

111
Chart 144 shows the Fund contributions. They may cumulate to
£14632m in the period.
Chart 144
Chart 145 shows the Fund shortfall. It cumulates to £1685m in the period
to 2035.
Chart 145
Potential Real Fund Payments Decommissioning Fund : no relief for fund contributions,
interest at base rate minus 40% tax on interest$40/bbl and 36p/therm
NPV : £10m @10% Real Post-tax Discount Rate
0
200
400
600
800
1000
1200
1400
2006 2008 2010 2012 2014 2016 2018 2020 2022 2024 2026 2028 2030 2032 2034
£m (2006)
Sanctioned Incremental Future Incremental Probable FieldsPossible Fields Technical Reserves New Exploration
Potential Real Fund Shortfall Decommissioning Fund : no relief for fund contributions,
interest at base rate minus 40% tax on interest$40/bbl and 36p/therm
NPV : £10m @10% Real Post-tax Discount Rate
-350
-300
-250
-200
-150
-100
-50
0
2006 2008 2010 2012 2014 2016 2018 2020 2022 2024 2026 2028 2030 2032 2034
£m (2006)
Sanctioned Incremental Future Incremental Probable FieldsPossible Fields Technical Reserves New Exploration

112
Chart 146 shows the change in operating costs which may occur with a
Fund scheme under the high price. The change in operating costs may
cumulate to £2334 in the period to 2035.
Chart 146
Chart 147 shows the corresponding change in development expenditure.
It cumulates to £1152m.
Potential Change in Real Operating Expenditure Decommissioning Fund : no relief for fund contributions,
interest at base rate minus 40% tax on interest$40/bbl and 36p/therm
NPV : £10m @10% Real Post-tax Discount Rate
-200
-150
-100
-50
0
50
100
2006 2008 2010 2012 2014 2016 2018 2020 2022 2024 2026 2028 2030 2032 2034
£m (2006)
Sanctioned Incremental Future Incremental Probable FieldsPossible Fields Technical Reserves New Exploration

113
Chart 147
Chart 148 shows the corresponding potential production which may be
foregone. This could cumulate to 407Mboe.
Chart 148
Potential Change in Real Development Expenditure Decommissioning Fund : no relief for fund contributions,
interest at base rate minus 40% tax on interest$40/bbl and 36p/therm
NPV : £10m @10% Real Post-tax Discount Rate
-180 -160 -140 -120 -100 -80 -60 -40 -20
020
2006 2008 2010 2012 2014 2016 2018 2020 2022 2024 2026 2028 2030 2032 2034
£m (2006)
Sanctioned Incremental Future Incremental Probable FieldsPossible Fields Technical Reserves New Exploration
Potential Change in Production Decommissioning Fund : no relief for fund contributions,
interest at base rate minus 40% tax on interest$40/bbl and 36p/therm
NPV : £10m @10% Real Post-tax Discount Rate
-90 -80 -70 -60 -50 -40 -30 -20 -10
010
2006 2008 2010 2012 2014 2016 2018 2020 2022 2024 2026 2028 2030 2032 2034
mboe/d
Sanctioned Incremental Future Incremental Probable FieldsPossible Fields Technical Reserves New Exploration

114
It was found that a substantial part of the loss of production was due to
the failure of projects to pass the economic hurdle following the
introduction of the Fund.
Chart 149 shows the change in tax revenue (excluding the tax on interest)
following the introduction of the Fund scheme. This cumulates to a
reduction in tax revenue of £2864m in the period to 2035 when the tax on
interest is excluded.
Chart 149
Chart 150 shows the change in tax revenues taking into account the tax
on interest. The total cumulate to a decrease in tax revenue of £1284m in
the period.
Potential Change in Real Tax Revenue (excludes effect of tax on interest)
Decommissioning Fund : no relief for fund contributions, interest at base rate minus 40% tax on interest
$40/bbl and 36p/therm NPV : £10m @10% Real Post-tax Discount Rate
-400
-300
-200
-100
0
100
200
300
400
2006 2008 2010 2012 2014 2016 2018 2020 2022 2024 2026 2028 2030 2032 2034
£m (2006)
Sanctioned Incremental Future Incremental Probable FieldsPossible Fields Technical Reserves New Exploration

115
Chart 150
4. Small Operators, Front-End Field Risks, and LOCs
Currently a considerable number of prospective new fields are being developed
by relatively small companies. The fields in question are generally small in
size. There is a risk that if the reservoir substantially under-performs the result
could be an early economic failure and the need to cease production and
decommission the facilities. Given this risk the DTI has in some cases
requested LOCs from the companies to cover this early risk.
In order to see the effects of these a portfolio of 23 new fields operated by
small/medium-sized companies was selected for examination. They covered a
range of field development types. The modelling assumed that a LOC was in
place for a year during the development period prior to first production on the
same terms as that discussed above. The modelling was also undertaken in the
same manner as discussed above.
Potential Change in Real Tax Revenue Decommissioning Fund : no relief for fund contributions,
$40/bbl and 36p/therm NPV : £10m @10% Real Post-tax Discount Rate
-400
-300
-200
-100
0
100
200
300
400
2006 2008 2010 2012 2014 2016 2018 2020 2022 2024 2026 2028 2030 2032 2034
£m (2006)
Sanctioned Incremental Future Incremental Probable FieldsPossible Fields Technical Reserves New Exploration

116
The results under the $30, 20 pence case are now discussed. Charts 151, 152
and 153 show the potential operating costs, development costs and production
associated with these 23 fields under the $30, 28 pence case.
Chart 151
Chart 152
Potential Real Operating Expenditure including LOC CostSmall Operators
$30/bbl and 28p/thermNPV : £10m@10% Real Post-tax Discount Rate
0
20
40
60
80
100
120
2006 2008 2010 2012 2014 2016 2018 2020 2022 2024 2026 2028 2030 2032 2034
£m 2006
Passed Possible Passed Probable Failed Possible Failed Probable
Potential Real Development ExpenditureSmall Operators
$30/bbl and 28p/thermNPV : £10m@10% Real Post-tax Discount Rate
020406080
100120140160180200220240
2006 2007 2008 2009 2010 2011 2012 2013 2014
£m 2006
Passed Possible Passed Probable Failed Possible Failed Probable

117
Chart 153
Six fields fail the hurdle even before the imposition of the LOC cost.
Cumulatively to 2035, the operating costs plus the LOC cost amount to £845m,
the development costs amount to £1011m and the production to 250Mboe.
Chart 154 shows the decommissioning costs of these fields under the medium
price. The decommissioning expenditures may cumulate to £71m in the period
to 2035.
Potential ProductionSmall Operators
$30/bbl and 28p/thermNPV : £10m@10% Real Post-tax Discount Rate
0
10
20
30
40
50
60
70
80
90
100
2006 2008 2010 2012 2014 2016 2018 2020 2022 2024 2026 2028 2030 2032 2034
mboe/d
Passed Possible Passed Probable Failed Possible Failed Probable

118
Chart 154
Chart 155 shows the decommissioning tax relief. It cumulates to £36m in the
period to 2035.
Chart 155
Potential Real Decommissioning ExpenditureSmall Operators
$30/bbl and 28p/thermNPV : £10m@10% Real Post-tax Discount Rate
02468
10121416182022242628
2006 2008 2010 2012 2014 2016 2018 2020 2022 2024 2026 2028 2030 2032 2034
£m 2006
Passed Possible Passed Probable Failed Possible Failed Probable
Potential Real Decommissioning Relief (including LOC relief)Small Operators
$30/bbl and 28p/thermNPV : £10m@10% Real Post-tax Discount Rate
0
2
4
6
8
10
12
14
2006 2008 2010 2012 2014 2016 2018 2020 2022 2024 2026 2028 2030 2032 2034
£m 2006
Passed Possible Passed Probable Failed Possible Failed Probable

119
Chart 156 shows the LOC costs which obtain tax relief, Chart 157 shows the
LOC costs which are not relievable for tax purposes and Chart 158 shows the
total LOC. These cumulate to £1.4m, £4.43m and £5.83m respectively.
Chart 156
Chart 157
Potential Real LOC Relievable CostsSmall Operators
$30/bbl and 28p/thermNPV : £10m@10% Real Post-tax Discount Rate
0.0
0.1
0.2
0.3
0.4
2006 2007 2008 2009 2010 2011
£m 2006
Passed Possible Passed Probable Failed Possible Failed Probable
Potential Real LOC Unrelievable CostsSmall Operators
$30/bbl and 28p/thermNPV : £10m@10% Real Post-tax Discount Rate
0.0
0.2
0.4
0.6
0.8
1.0
1.2
1.4
2006 2007 2008 2009 2010 2011
£m 2006
Passed Possible Passed Probable Failed Possible Failed Probable

120
Chart 158
Chart 159 shows the relief given for LOC costs. This cumulates to £0.7m in the
period to 2035.
Chart 159
Potential Real Total LOC CostsSmall Operators
$30/bbl and 28p/thermNPV : £10m@10% Real Post-tax Discount Rate
0.0
0.2
0.4
0.6
0.8
1.0
1.2
1.4
1.6
1.8
2006 2007 2008 2009 2010 2011
£m 2006
Passed Possible Passed Probable Failed Possible Failed Probable
Potential Real LOC ReliefSmall Operators
$30/bbl and 28p/thermNPV : £10m@10% Real Post-tax Discount Rate
0.000.020.040.060.080.100.120.140.160.180.20
2006 2007 2008 2009 2010 2011
£m 2006
Passed Possible Passed Probable Failed Possible Failed Probable

121
Chart 160 shows the total LOC cost minus LOC tax relief. This cumulates to
£6.53m in the period to 2035.
Chart 160
Under the $40, 36 pence case 2 fields fail the hurdle rate even before the
imposition of the LOC cost. Cumulatively to 2035, the operating costs plus the
LOC costs may amount to £920m, development costs to £1161m and the
production to 269Mboe.
Chart 161 shows the decommissioning cost of these fields. The total
expenditure cumulates to £82m in the period to 2035.
Potential Real Total LOC Costs minus LOC ReliefSmall Operators
$30/bbl and 28p/thermNPV : £10m@10% Real Post-tax Discount Rate
0.000.200.400.600.801.001.201.401.601.802.00
2006 2007 2008 2009 2010 2011
£m 2006
Passed Possible Passed Probable Failed Possible Failed Probable

122
Chart 161
Chart 162 shows the decommissioning relief. The total cumulates to £42m in
the period to 2035.
Chart 162
Potential Real Decommissioning ExpenditureSmall Operators
$40/bbl and 36p/thermNPV : £10m@10% Real Post-tax Discount Rate
0
2
4
6
8
10
12
14
16
18
20
2006 2008 2010 2012 2014 2016 2018 2020 2022 2024 2026 2028 2030 2032 2034
£m 2006
Passed Possible Passed Probable Failed Possible Failed Probable
Potential Real Decommissioning Relief (including LOC relief)Small Operators
$40/bbl and 36p/thermNPV : £10m@10% Real Post-tax Discount Rate
0
2
4
6
8
10
2006 2008 2010 2012 2014 2016 2018 2020 2022 2024 2026 2028 2030 2032 2034
£m 2006
Passed Possible Passed Probable Failed Possible Failed Probable
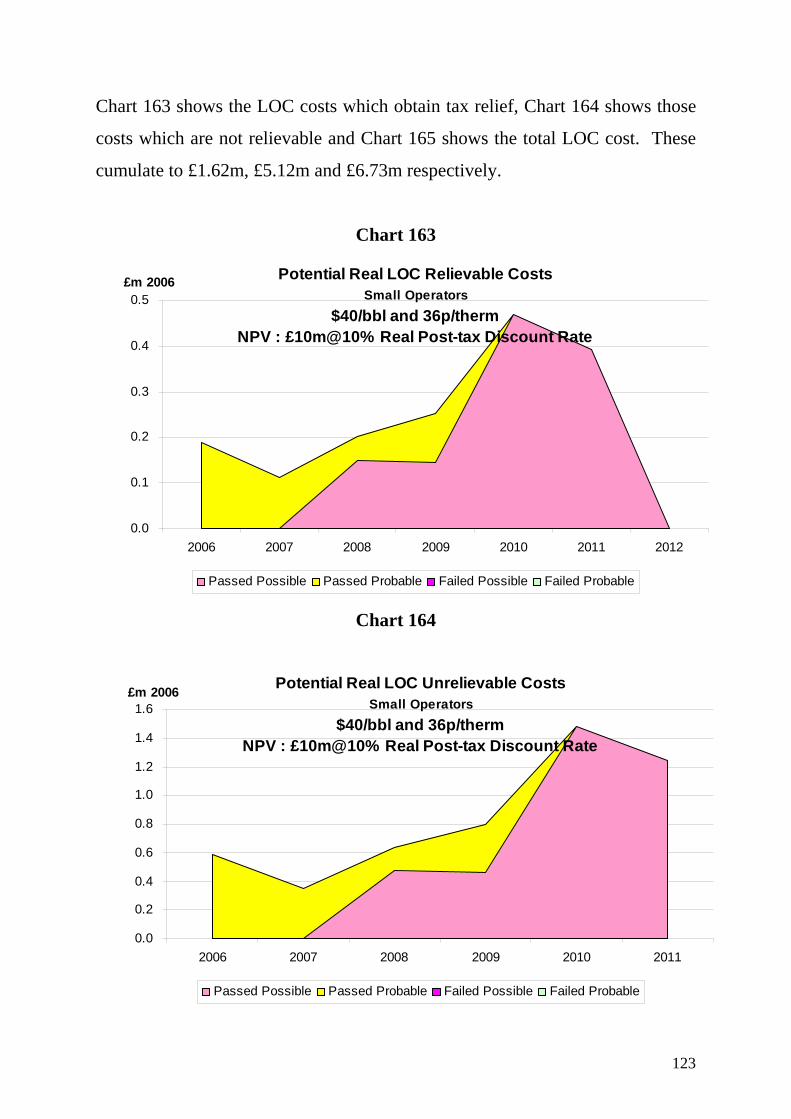
123
Chart 163 shows the LOC costs which obtain tax relief, Chart 164 shows those
costs which are not relievable and Chart 165 shows the total LOC cost. These
cumulate to £1.62m, £5.12m and £6.73m respectively.
Chart 163
Chart 164
Potential Real LOC Relievable CostsSmall Operators
$40/bbl and 36p/thermNPV : £10m@10% Real Post-tax Discount Rate
0.0
0.1
0.2
0.3
0.4
0.5
2006 2007 2008 2009 2010 2011 2012
£m 2006
Passed Possible Passed Probable Failed Possible Failed Probable
Potential Real LOC Unrelievable CostsSmall Operators
$40/bbl and 36p/thermNPV : £10m@10% Real Post-tax Discount Rate
0.0
0.2
0.4
0.6
0.8
1.0
1.2
1.4
1.6
2006 2007 2008 2009 2010 2011
£m 2006
Passed Possible Passed Probable Failed Possible Failed Probable

124
Chart 165
Chart 166 shows the relief given for LOC costs. This cumulates to £0.81m in
the period to 2035.
Chart 166
Potential Real Total LOC CostsSmall Operators
$40/bbl and 36p/thermNPV : £10m@10% Real Post-tax Discount Rate
0.00.20.40.60.81.01.21.41.61.82.0
2006 2007 2008 2009 2010 2011
£m 2006
Passed Possible Passed Probable Failed Possible Failed Probable
Potential Real LOC ReliefSmall Operators
$40/bbl and 36p/thermNPV : £10m@10% Real Post-tax Discount Rate
0.000.020.040.060.080.100.120.140.160.180.200.220.24
2006 2007 2008 2009 2010 2011
£m 2006
Passed Possible Passed Probable Failed Possible Failed Probable

125
Chart 167 shows the total LOC cost minus LOC tax relief. This cumulates to
£7.54m in the period to 2035.
Chart 167
The cost of this limited LOC scheme thus amount to between £6.53m and
£7.54m.
5. Summary and Conclusions This study has examined the comparative effects of different forms of providing
for financial security with respect to decommissioning in the UKCS. The study
employed financial simulation modelling including use of the Monte Carlo
technique to project likely cessation of production (COP) and thus
decommissioning dates for fields and associated incremental projects to 2035.
The modelling included (1) sanctioned fields (316), (2) incremental projects
relating to these fields (112), (3) probable fields (19), (4) possible fields (23),
(5) future incremental projects, (6) technical reserves fields (215), and (7) future
Potential Real Total LOC Costs minus LOC ReliefSmall Operators
$40/bbl and 36p/thermNPV : £10m@10% Real Post-tax Discount Rate
0.000.200.400.600.801.001.201.401.601.802.002.20
2006 2007 2008 2009 2010 2011
£m 2006
Passed Possible Passed Probable Failed Possible Failed Probable

126
discoveries. The numbers of new discoveries depend on the exploration effort
which in turn depends in part on oil/gas price expectations. Given the long-run
nature of the study three scenarios with price assumptions with (1) $30, 28
pence, (2) $40, 36 pence, and (3) $25, 24 pence in real 2006 terms were
developed. The corresponding number of new discoveries in the period 2006-
2030 were (1) 179, (2) 221, and (3) 146.
The investment and COP decisions were made in accordance with expected
returns in the 3 scenarios. A cost of capital of 10% in real, post-tax terms was
employed with a minimum requirement of an NPV of £10 million. The
numbers of new developments in the technical reserves and new discoveries
categories were quite sensitive to the price scenario employed. The maximum
number of decommissionings which could take place by 2035 was found to be
239 under the $40, 36 pence scenario. The total cumulative decommissioning
costs to 2035 were found to be £14.45 billion under the $30, 28 pence case,
£15.2 billion under the $40, 36 pence case, and £13.12 billion under the $25, 28
pence case (all at 2006 prices).
In the UK there is joint and several liability among licences for
decommissioning under the Petroleum Act 1998. Further, the Government can
request, and in some circumstances require, a licensee to provide financial
security for the prospective decommissioning costs. Asset transactions
involving mature fields have become increasingly common with some
companies specialising in maximising economic recovery from mature fields.
In such cases while the decommissioning obligation may be transferred from
the initial licensee to the new one the Government may insist that liability stays
with the original one if there are doubts about the financial competence of the
new licensee to fulfil the work obligation.

127
Requests by the Government to provide financial security are conventionally
triggered when the remaining net present value (RNPV) from a field falls below
a threshold value in relation to the (gross) decommissioning costs. A trigger
value of 150% of decommissioning costs is common. Nowadays very small
field developments are not uncommon. In such circumstances the DTI can also
request financial security for decommissioning to be provided at the time of the
field development. This is to protect the Government against a major reservoir
failure which could take effect at the date of early production.
While a considerable number of schemes can in principle deal with the problem
in the UK Letters of Credit (LOCs) are the only instrument currently employed.
These involve the payment of a fee to the bank providing the guarantee. The
fee is tax deductible for corporation tax (CT), Supplementary Charge (SC) and
Petroleum Revenue Tax (PRT), but the LOCs have to be disclosed in the
company’s accounts and they impact on its borrowing capacity and costs.
Other methods of providing security for decommissioning include Surety Bonds
and Decommissioning Trusts. Surety Bonds are used in the Gulf of Mexico by
the Minerals Management Service (MMS). The Bond issuer is generally
essentially an unsecured creditor who requires an indemnity from the licensee.
Although assets of the licensee are not routinely required as collateral, the
indemnity permits the bond issuer to call for collateral when he feels this is
necessary. The bond provider will regularly monitor the situation of the
licensee, checking whether he is making proper provision for decommissioning
and what other assets he has available. There will be a limit to the value of a
bond which a surety company would issue to a licensee. Unlike LOCs Surety
Bonds do not need to be disclosed by the licensee and so they do not affect his
credit rating. In the Gulf of Mexico the MMS decides what level of surety is
required by a licensee. The bond issuer generally agrees to have the work

128
undertaken if the licensee is unable to fulfil his decommissioning work
obligation. This is in contrast to the situation with the LOC scheme. In the
present study to facilitate ready comparison with the typical LOC the bond was
assumed to be required when field RNPV reached 150% of gross
decommissioning costs.
Decommissioning Trust Funds or variants on them such as escrow accounts
have become increasingly common over the last 15 years or so in different parts
of the world. They involve the deposit of Funds by licensees into an alienated
Fund (or escrow account) such that the contributions plus any net income
earned by the Fund accrue to meet the decommissioning costs. It is again
assumed for purposes of ready comparison with the other schemes that
contributions commence when RNPV reaches 150% of gross decommissioning
costs. The application of this simple formula sometimes meant that there was a
shortfall in the Fund in relation to the decommissioning costs. In such cases the
amount of the shortfall was relieved against tax (CT, SC, and PRT) as
appropriate under current tax rules when the expenditures were incurred. The
rules currently do not permit contributions to a Trust Fund to be tax deductible.
This is a severe impediment to the use of this scheme. In other countries where
they exist tax deductibility for the contributions exists. An example of a
licensing system comparable to the UK is Namibia. In several other
jurisdictions where Production Sharing Contracts are the norm contributions to
Funds or escrow accounts are cost recoverable and tax deductible. Notable
examples are Angola, Azerbaijan and Sakhalin.
In this study the cases where contributions to Trust Funds are (a) non-deductible
and (b) deductible were both examined to highlight the large differences which
emerge. In the UK discretionary trusts would be the relevant vehicles which
would be employed to implement the Decommissioning Trust concept. Under

129
current tax rules the income from monies invested in such trusts would be taxed
at 40%. Further, there would be a liability to Inheritance Tax after 10 years (at
6%) and when Funds were withdrawn to pay for the decommissioning work (at
20%). The application of Inheritance Tax in this manner would be so punitive
as to inhibit the application of the whole scheme. It is also unattractive to
investors if the contributions are not tax deductible.
In the study the modelling of the effects of the schemes was undertaken to
reflect current market conditions. Thus for the LOC the fee was set at 1.5% of
the decommissioning cost after taking into account the potential contribution
from the net cash flows while the field is still producing. Thus the base for the
LOC cost would increase as the field approached the cessation of production
point as the field revenues decreased. The increase in the borrowing costs from
the LOC scheme was assumed to be the base interest rate currently 4.75%. The
base to which this applied was taken to be the same as for the fee for the LOC.
For the Surety Bond the costs were assumed to be 3.5% of the decommissioning
cost again taking into account the contributions from remaining field net cash
flows, with the cost payment thus increasing as the field net cash flows
declined.
With the Trust Fund the assumption was that the contributions would follow the
production curve after payments were triggered. Thus the contributions would
decline from the trigger point onwards. For modelling purposes the size of the
contributions was assumed to take into account the (net) income earned on the
sums invested in the Fund. Discretionary Funds of this type are permitted to
invest in a prudent selection of equities and bonds. Given the volatility of
financial markets over the years it was decided to model two cases. Under the

130
first the return on the monies invested was a modest 4.75% in MOD terms and
under the second it was 10% again in MOD terms.
Under current practice the DTI exercises discretion regarding which licensees it
requests financial security from. This involves much judgement regarding the
risks involved from the Government’s viewpoint. The present study avoids
these major judgements and concentrates on examining the comparative costs
and effects of the schemes as applied to all fields in the UKCS from 2006
onwards. The analysis highlighted the comparative costs and effects of the
schemes as seen from the viewpoint of investors and the Treasury as custodian
of the taxpayer’s interests. The costs involved are inevitably higher when
applied to all fields, but they can be scaled down to reflect the application of the
schemes on a selective basis.
The study highlighted not only the direct costs to investors and the Treasury but
also the effects of lost production and field expenditures from changes in
behaviour brought about by the introduction of the schemes. Lost production
can emanate from two sources namely, (1) earlier cessation of production from
developed fields from payment of the fees and perhaps Trust Fund
contributions, and (2) marginal field developments deterred as a consequence of
the payments. With respect to the Trust Fund it is not at all clear whether
behaviour would change as a consequence of making payments into a Fund.
While net cash flows are reduced when contributions are being made they are
improved later when the decommissioning work is undertaken. Accordingly
cases where behaviour is changed and unchanged were both considered.
The possible changes in behaviour with respect to cessation of production relate
to the perceived need of the investor to avoid continuing production while
making a net operating loss. Thus there could be an incentive following the
131
introduction of the schemes with the associated payments to accelerate cessation
of production. Similarly, if a field or incremental project is very marginal there
can be an incentive not to develop the project at all. These possibilities were
examined in detail in the study.
The Government clearly needs to optimise its risks with respect to the
decommissioning liability problem. The present study in effect shows the costs
to investors and the Treasury resulting from the Government deciding to
procure assurances against all the risks. This provides a base from which
judgements can be made about the effects of the Government accepting
different degrees of risk.
This issue comes up when mature assets are sold but the provisions of Section
29 of the Petroleum Act 1998 have not been withdrawn and/or threats of
liability under Section 34 of the same Act remain. The sellers would clearly
desire to be released from Section 29 and have the Section 34 powers removed,
and these issues could affect their attitude to asset transactions which otherwise
from a national viewpoint could be very desirable. The question of how
financial security is best handled then arises. The present study gives insights
into the pros and cons of different options.
Some key results of the study are now summarised. In Charts 168 and 169 the
comparative cumulative gross costs of the LOC and Surety bond schemes are
shown. Those for the LOC are much higher reflecting the extra cost of capital
costs. Under the $30, 28 pence price they are over £10 billion while those for
the Bond are well below £6 billion.

132
Chart 168
Chart 169
Cumulative (to 2035) Total Real Cost $30/bbl and 28p/therm
NPV : £10m @ 10% Real Post-tax Discount Rate
0
2000
4000
6000
8000
10000
12000
LOC Bond
£m 2006
Sanctioned Incremental Future Incremental Probable FieldsPossible Fields Technical Reserves New Exploration
Cumulative (to 2035) Total Real Cost $40/bbl and 36p/therm
NPV : £10m @ 10% Real Post-tax Discount Rate
0
2000
4000
6000
8000
10000
12000
LOC Bond
£m 2006
Sanctioned Incremental Future Incremental Probable FieldsPossible Fields Technical Reserves New Exploration

133
Charts 170 and 171 show the cumulative tax relief available for the LOC and
Bond schemes. It is seen to be much greater for the Bond (over twice as much
as for the LOC), reflecting the higher allowable costs.
Chart 170
Chart 171
Cumulative (to 2035) Total Real Relief $30/bbl and 28p/therm
NPV : £10m @ 10% Real Post-tax Discount Rate
0500
1000150020002500300035004000
LOC Bond
£m 2006
Sanctioned Incremental Future Incremental Probable FieldsPossible Fields Technical Reserves New Exploration
Cumulative (to 2035) Total Real Relief $40/bbl and 36p/therm
NPV : £10m @ 10% Real Post-tax Discount Rate
0500
1000150020002500300035004000
LOC Bond
£m 2006
Sanctioned Incremental Future Incremental Probable FieldsPossible Fields Technical Reserves New Exploration

134
Charts 172 and 173 show the cumulative changes in production which may
occur with the introduction of the various schemes.
Chart 172
Chart 173
Cumulative (to 2035) Change in Production $30/bbl and 28p/therm
NPV : £10m @ 10% Real Post-tax Discount Rate
-900 -800 -700 -600 -500 -400 -300 -200 -100
0
LOC Bond Fund 1 WithRelief but No
change inBehaviour
Fund 2 WithRelief and
interest 10%but No changein Behaviour
Fund 3 WithRelief andInterest @
10%
Fund 4 WithRelief
Fund 5 NoRelief
Mboe
Sanctioned Incremental Future Incremental Probable Fields
Possible Fields Technical Reserves New Exploration
Cumulative (to 2035) Change in Production $40/bbl and 36p/therm
NPV : £10m @ 10% Real Post-tax Discount Rate
-500 -400 -300 -200 -100
0100
LOC Bond Fund 1 WithRelief but No
change inBehaviour
Fund 2 WithRelief and
interest 10%but No changein Behaviour
Fund 3 WithRelief andInterest @
10%
Fund 4 WithRelief
Fund 5 NoRelief
Mboe
Sanctioned Incremental Future Incremental Probable Fields
Possible Fields Technical Reserves New Exploration Total

135
Under both price scenarios the potential cumulative change in production is
greatest with the Fund scheme where the Fund obtains gross interest of 4.75%,
there is no tax relief for Fund costs and behavioural changes regarding COP
take place. There are significantly less new developments. The cumulative
change in production is lowest with the Fund schemes where there is no change
in behaviour (Fund 1 and Fund 2). It should be emphasised that the return to
the Fund contributions is significant because of the substantial tax savings (50%
and 75%) made.
Charts 174 and 175 show the cumulative potential changes in development
expenditure. Again the greatest change is with the Fund scheme where the
Fund obtains gross interest of 4.75%, there is no relief for Fund payments, and
behavioural changes regarding COP take place. In the cases with income on
Fund investments at 10% and no change in behaviour the change in
development expenditures is very small.
Chart 174
Cumulative (to 2035) Change in Development Expenditure $30/bbl and 28p/therm
NPV : £10m @ 10% Real Post-tax Discount Rate
-5000 -4000 -3000 -2000 -1000
01000
LOC Bond Fund 1 WithRelief but No
change inBehaviour
Fund 2 WithRelief and
interest 10%but No
change inBehaviour
Fund 3 WithRelief andInterest @
10%
Fund 4 WithRelief
Fund 5 NoRelief
£m 2006
Sanctioned Incremental Future Incremental Probable Fields
Possible Fields Technical Reserves New Exploration Total

136
Chart 175
Charts 176 and 177 show the cumulative changes in operating expenditure.
This is clearly with the LOC scheme and lowest with Fund schemes with no
change in behaviour. The cumulative changes in production, development
expenditure and operating expenditure are clearly lowest with these Fund
schemes.
Chart 176
Cumulative (to 2035) Change in Development Expenditure $40/bbl and 36p/therm
NPV : £10m @ 10% Real Post-tax Discount Rate
-1200 -1000 -800 -600 -400 -200
0200
LOC Bond Fund 1 WithRelief but No
change inBehaviour
Fund 2 WithRelief and
interest 10%but No changein Behaviour
Fund 3 WithRelief andInterest @
10%
Fund 4 WithRelief
Fund 5 NoRelief
£m 2006
Sanctioned Incremental Future Incremental Probable Fields
Possible Fields Technical Reserves New Exploration Total
Cumulative (to 2035) Change in Operating Expenditure $30/bbl and 28p/therm
NPV : £10m @ 10% Real Post-tax Discount Rate
-8000 -7000 -6000 -5000 -4000 -3000 -2000 -1000
0
LOC Bond Fund 1 WithRelief but No
change inBehaviour
Fund 2 WithRelief and
interest 10%but No changein Behaviour
Fund 3 WithRelief andInterest @
10%
Fund 4 WithRelief
Fund 5 NoRelief
£m 2006
Sanctioned Incremental Future Incremental Probable Fields
Possible Fields Technical Reserves New Exploration
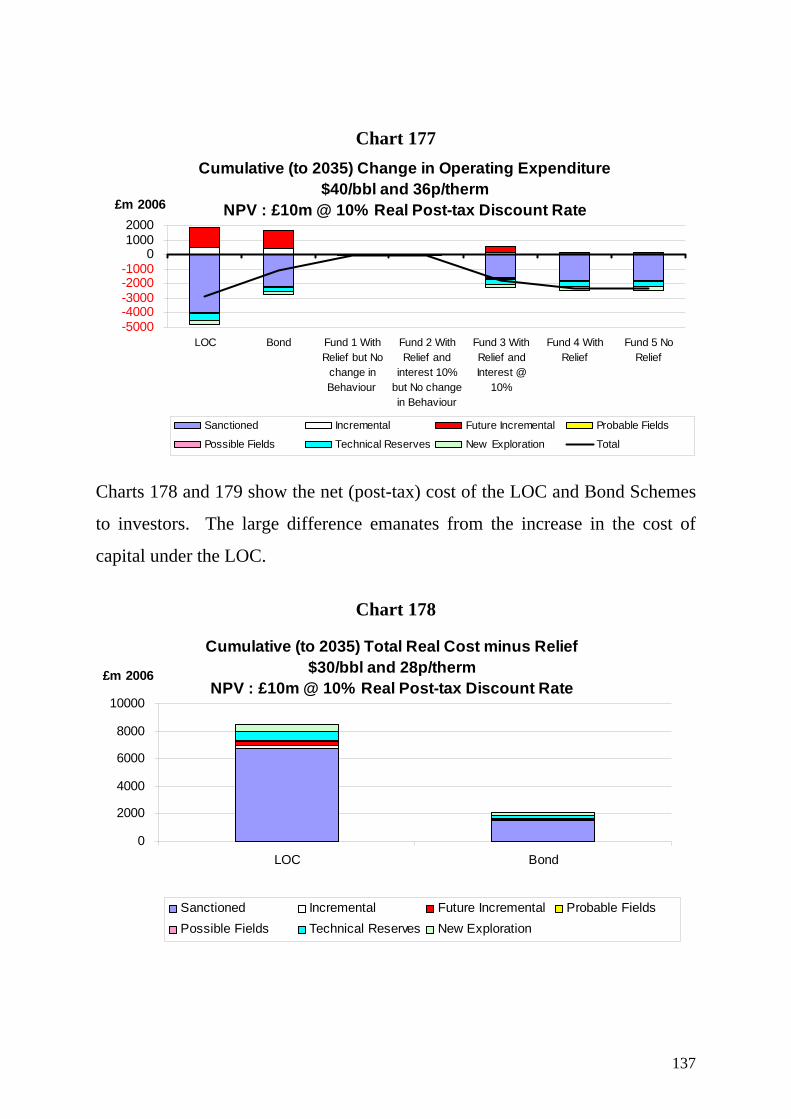
137
Chart 177
Charts 178 and 179 show the net (post-tax) cost of the LOC and Bond Schemes
to investors. The large difference emanates from the increase in the cost of
capital under the LOC.
Chart 178
Cumulative (to 2035) Total Real Cost minus Relief $30/bbl and 28p/therm
NPV : £10m @ 10% Real Post-tax Discount Rate
0
2000
4000
6000
8000
10000
LOC Bond
£m 2006
Sanctioned Incremental Future Incremental Probable FieldsPossible Fields Technical Reserves New Exploration
Cumulative (to 2035) Change in Operating Expenditure $40/bbl and 36p/therm
NPV : £10m @ 10% Real Post-tax Discount Rate
-5000 -4000 -3000 -2000 -1000
010002000
LOC Bond Fund 1 WithRelief but No
change inBehaviour
Fund 2 WithRelief and
interest 10%but No changein Behaviour
Fund 3 WithRelief andInterest @
10%
Fund 4 WithRelief
Fund 5 NoRelief
£m 2006
Sanctioned Incremental Future Incremental Probable Fields
Possible Fields Technical Reserves New Exploration Total

138
Chart 179
Charts 180 and 181 show the cumulative decommissioning costs under the 7
schemes. These are reduced when projects are deterred by the effects of the
schemes. This happens less frequently under the $40, 36 pence price because
fewer projects are marginal.
Chart 180
Cumulative (to 2035) Total Real Cost minus Relief $40/bbl and 36p/therm
NPV : £10m @ 10% Real Post-tax Discount Rate
0
2000
4000
6000
8000
10000
LOC Bond
£m 2006
Sanctioned Incremental Future Incremental Probable FieldsPossible Fields Technical Reserves New Exploration
Cumulative (to 2035) Decommissioning Cost$30/bbl and 28p/therm
NPV : £10m @ 10% Real Post-tax Discount Rate
-2000 0
2000400060008000
10000120001400016000
LOC Bond Fund 1 WithRelief but No
change inBehaviour
Fund 2 WithRelief and
interest 10%but No changein Behaviour
Fund 3 WithRelief andInterest @
10%
Fund 4 WithRelief
Fund 5 NoRelief
£m 2006
Sanctioned Incremental Future Incremental Probable Fields
Possible Fields Technical Reserves New Exploration Total

139
Chart 181
Charts 182 and 183 show the potential cumulative decommissioning relief. It
should be noted that the total amount of relief is a function not only of the
working of the tax system but of the total number of projects which proceed.
As noted above, the various schemes do impact on the number of viable
projects, especially under the $30, 28 pence case when many are very marginal.
The highest total relief is under the Bond scheme and the lowest total relief is
with the Fund scheme where there is no change in behaviour and the Fund
obtains income. It should be noted that the interest on Fund income reduced the
required contributions and thus the aggregate value of the tax relief on these
contributions.
Cumulative (to 2035) Decommissioning Cost$40/bbl and 36p/therm
NPV : £10m @ 10% Real Post-tax Discount Rate
-2000 0
2000400060008000
10000120001400016000
LOC Bond Fund 1 WithRelief but No
change inBehaviour
Fund 2 WithRelief and
interest 10%but No changein Behaviour
Fund 3 WithRelief andInterest @
10%
Fund 4 WithRelief
Fund 5 NoRelief
£m 2006
Sanctioned Incremental Future Incremental Probable Fields
Possible Fields Technical Reserves New Exploration Total

140
Chart 182
Chart 183
Cumulative (to 2035) Decommissioning Relief$30/bbl and 28p/therm
NPV : £10m @ 10% Real Post-tax Discount Rate
-2000 0
2000400060008000
1000012000
LOC Bond Fund 1 WithRelief but No
change inBehaviour
Fund 2 WithRelief and
interest 10%but No changein Behaviour
Fund 3 WithRelief andInterest @
10%
Fund 4 WithRelief
Fund 5 NoRelief
£m 2006
Sanctioned Incremental Future Incremental Probable Fields
Possible Fields Technical Reserves New Exploration Total
Cumulative (to 2035) Decommissioning Relief$40/bbl and 36p/therm
NPV : £10m @ 10% Real Post-tax Discount Rate
-2000 0
2000400060008000
100001200014000
LOC Bond Fund 1 WithRelief but No
change inBehaviour
Fund 2 WithRelief and
interest 10%but No changein Behaviour
Fund 3 WithRelief andInterest @
10%
Fund 4 WithRelief
Fund 5 NoRelief
£m 2006
Sanctioned Incremental Future Incremental Probable Fields
Possible Fields Technical Reserves New Exploration Total

141
Charts 184 and 185 show the cumulative change in tax revenues excluding the
effects of LOC or Bond relief and excluding the tax on Fund interest. The
changes thus reflect a combination of the reliefs and the effects of the schemes
on project developments and COP dates. If projects are deterred tax revenues
are lost and tax reliefs on those projects do not become necessary.
Chart 184
Chart 185
Cumulative (to 2035) Change in Tax Revenue(Tax (+ LOC/Bond relief or - tax on interest) - Base)
$30/bbl and 28p/therm NPV : £10m @ 10% Real Post-tax Discount Rate
-4000 -3000 -2000 -1000
01000
LOC Bond Fund 1 WithRelief but No
change inBehaviour
Fund 2 WithRelief and
interest 10%but No changein Behaviour
Fund 3 WithRelief andInterest @
10%
Fund 4 WithRelief
Fund 5 NoRelief
£m 2006
Sanctioned Incremental Future Incremental Probable Fields
Possible Fields Technical Reserves New Exploration Total
Cumulative (to 2035) Change in Tax Revenue(Tax (+ LOC/Bond relief or - tax on interest) - Base)
$40/bbl and 36p/therm NPV : £10m @ 10% Real Post-tax Discount Rate
-3000 -2000 -1000
01000
LOC Bond Fund 1 WithRelief but No
change inBehaviour
Fund 2 WithRelief and
interest 10%but No
change inBehaviour
Fund 3 WithRelief andInterest @
10%
Fund 4 WithRelief
Fund 5 NoRelief
£m 2006
Sanctioned Incremental Future Incremental Probable Fields
Possible Fields Technical Reserves New Exploration Total
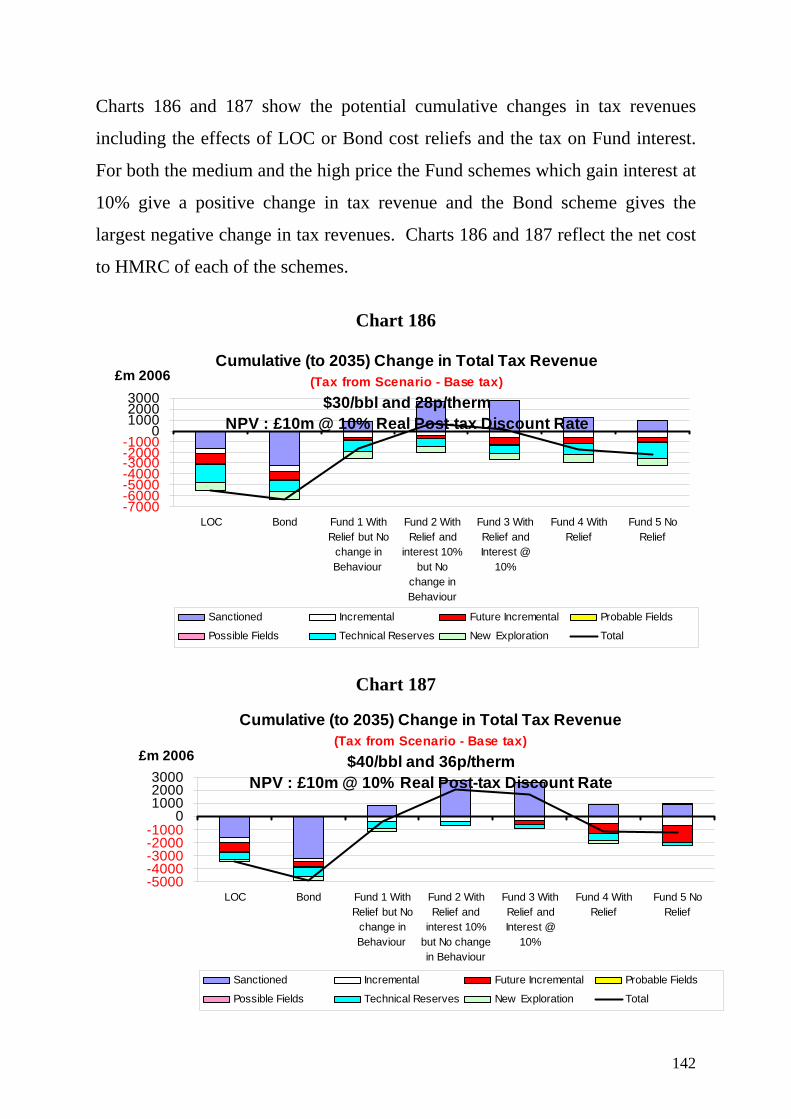
142
Charts 186 and 187 show the potential cumulative changes in tax revenues
including the effects of LOC or Bond cost reliefs and the tax on Fund interest.
For both the medium and the high price the Fund schemes which gain interest at
10% give a positive change in tax revenue and the Bond scheme gives the
largest negative change in tax revenues. Charts 186 and 187 reflect the net cost
to HMRC of each of the schemes.
Chart 186
Chart 187
Cumulative (to 2035) Change in Total Tax Revenue(Tax from Scenario - Base tax)
$30/bbl and 28p/therm NPV : £10m @ 10% Real Post-tax Discount Rate
-7000 -6000 -5000 -4000 -3000 -2000 -1000
0100020003000
LOC Bond Fund 1 WithRelief but No
change inBehaviour
Fund 2 WithRelief and
interest 10%but No
change inBehaviour
Fund 3 WithRelief andInterest @
10%
Fund 4 WithRelief
Fund 5 NoRelief
£m 2006
Sanctioned Incremental Future Incremental Probable Fields
Possible Fields Technical Reserves New Exploration Total
Cumulative (to 2035) Change in Total Tax Revenue(Tax from Scenario - Base tax)
$40/bbl and 36p/therm NPV : £10m @ 10% Real Post-tax Discount Rate
-5000 -4000 -3000 -2000 -1000
0100020003000
LOC Bond Fund 1 WithRelief but No
change inBehaviour
Fund 2 WithRelief and
interest 10%but No changein Behaviour
Fund 3 WithRelief andInterest @
10%
Fund 4 WithRelief
Fund 5 NoRelief
£m 2006
Sanctioned Incremental Future Incremental Probable Fields
Possible Fields Technical Reserves New Exploration Total

143
Charts 188 and 189 show the gross decommissioning costs to the industry
emanating from of each of the schemes. The LOC scheme is by far the costliest
and the Fund schemes with Fund interest at 10% are the least costly.
Chart 188
Chart 189
Cumulative (to 2035) Gross Decommissioning Costs$30/bbl and 28p/therm
NPV : £10m @ 10% Real Post-tax Discount Rate
-4000 0
40008000
12000160002000024000
LOC Bond Fund 1 WithRelief but No
change inBehaviour
Fund 2 WithRelief and
interest 10%but No changein Behaviour
Fund 3 WithRelief andInterest @
10%
Fund 4 WithRelief
Fund 5 NoRelief
£m 2006
Sanctioned Incremental Future Incremental Probable Fields
Possible Fields Technical Reserves New Exploration Total
Cumulative (to 2035) Gross Decommissioning Costs$40/bbl and 36p/therm
NPV : £10m @ 10% Real Post-tax Discount Rate
-4000 0
40008000
12000160002000024000
LOC Bond Fund 1 WithRelief but No
change inBehaviour
Fund 2 WithRelief and
interest 10%but No changein Behaviour
Fund 3 WithRelief andInterest @
10%
Fund 4 WithRelief
Fund 5 NoRelief
£m 2006
Sanctioned Incremental Future Incremental Probable Fields
Possible Fields Technical Reserves New Exploration Total

144
Charts 190 and 191 show the cumulative net decommissioning tax relief from
each of the schemes. They show the decommissioning relief minus the tax on
interest i.e. the comparative cost of decommissioning to HMRC under each of
the schemes. The relief is highest with the Bond scheme and lowest with the
Fund schemes where the Fund earns interest at 10%.
Chart 190
Chart 191
Cumulative (to 2035) Net Decommissioning Relief$30/bbl and 28p/therm
NPV : £10m @ 10% Real Post-tax Discount Rate
-2000 0
2000400060008000
1000012000
LOC Bond Fund 1 WithRelief but No
change inBehaviour
Fund 2 WithRelief and
interest 10%but No changein Behaviour
Fund 3 WithRelief andInterest @
10%
Fund 4 WithRelief
Fund 5 NoRelief
£m 2006
Sanctioned Incremental Future Incremental Probable Fields
Possible Fields Technical Reserves New Exploration Total
Cumulative (to 2035) Net Decommissioning Relief$40/bbl and 36p/therm
NPV : £10m @ 10% Real Post-tax Discount Rate
-2000 0
2000400060008000
100001200014000
LOC Bond Fund 1 WithRelief but No
change inBehaviour
Fund 2 WithRelief and
interest 10%but No changein Behaviour
Fund 3 WithRelief andInterest @
10%
Fund 4 WithRelief
Fund 5 NoRelief
£m 2006
Sanctioned Incremental Future Incremental Probable Fields
Possible Fields Technical Reserves New Exploration Total

145
Charts 192 and 193 show the total net decommissioning cost to licensees after
tax relief. The LOC scheme is clearly the most expensive. The Fund schemes
with tax relief are generally the cheapest.
Chart 192
Chart 193
Cumulative (to 2035) Net Decommissioning Cost to Industry$30/bbl and 28p/therm
NPV : £10m @ 10% Real Post-tax Discount Rate
-2000 0
2000400060008000
10000120001400016000
LOC Bond Fund 1 WithRelief but No
change inBehaviour
Fund 2 WithRelief and
interest 10%but No changein Behaviour
Fund 3 WithRelief andInterest @
10%
Fund 4 WithRelief
Fund 5 NoRelief
£m 2006
Sanctioned Incremental Future Incremental Probable Fields
Possible Fields Technical Reserves New Exploration Total
Cumulative (to 2035) Net Decommissioning Cost to Industry$40/bbl and 36p/therm
NPV : £10m @ 10% Real Post-tax Discount Rate
-2000 0
2000400060008000
10000120001400016000
LOC Bond Fund 1 WithRelief but No
change inBehaviour
Fund 2 WithRelief and
interest 10%but No changein Behaviour
Fund 3 WithRelief andInterest @
10%
Fund 4 WithRelief
Fund 5 NoRelief
£m 2006
Sanctioned Incremental Future Incremental Probable Fields
Possible Fields Technical Reserves New Exploration Total

146
The choice of scheme can be determined in terms of economic efficiency and
cost to the Exchequer. Economic efficiency includes any disincentive or
distorting effects such as loss of production from the results of any of the
schemes. From the viewpoint of the Government the costs of schemes should
include not only the direct costs of tax reliefs but the loss of tax revenues from
production foregone. Any loss of investment also adversely affects the
contracting sector.
The LOC scheme is an “extra” cost and as such it may accelerate the
decommissioning date and/or it may make some projects or field developments
uneconomic (i.e. they do not pass the hurdle rate). Under the medium price,
698 Mboe may fail to be produced, a large proportion may fail to be developed
because the LOC cost makes the development fail the economic hurdle. The
total cumulative negative effect in tax revenues from the uptake of the LOC
scheme and the effects that the scheme has on behaviour may be as much as
£5521m by 2035. Under the high price 119 Mboe may be lost, much of which
results from the LOC cost making the fields in question fail the economic
hurdle. The cumulative reduction in tax revenues from the uptake of the
scheme may amount to £3466m in the period to 2035.
The Surety Bond scheme, like the LOC, is an “extra” cost and as such it may
also, albeit to a lesser extent, accelerate the decommissioning date and/or it may
render some marginal projects or field developments uneconomic by reducing
the NPVs below the hurdle. Under the medium price the net Bond cost may
result in 229 Mboe not being produced, much of which may fail to be developed
because the Bond cost makes the development fail the economic hurdle. The
total cumulative change in tax revenue from the uptake of the Bond scheme and
the effects that the scheme has on behaviour may amount to a reduction of
£6381m. Under the high price the corresponding figures 23Mboe may not be
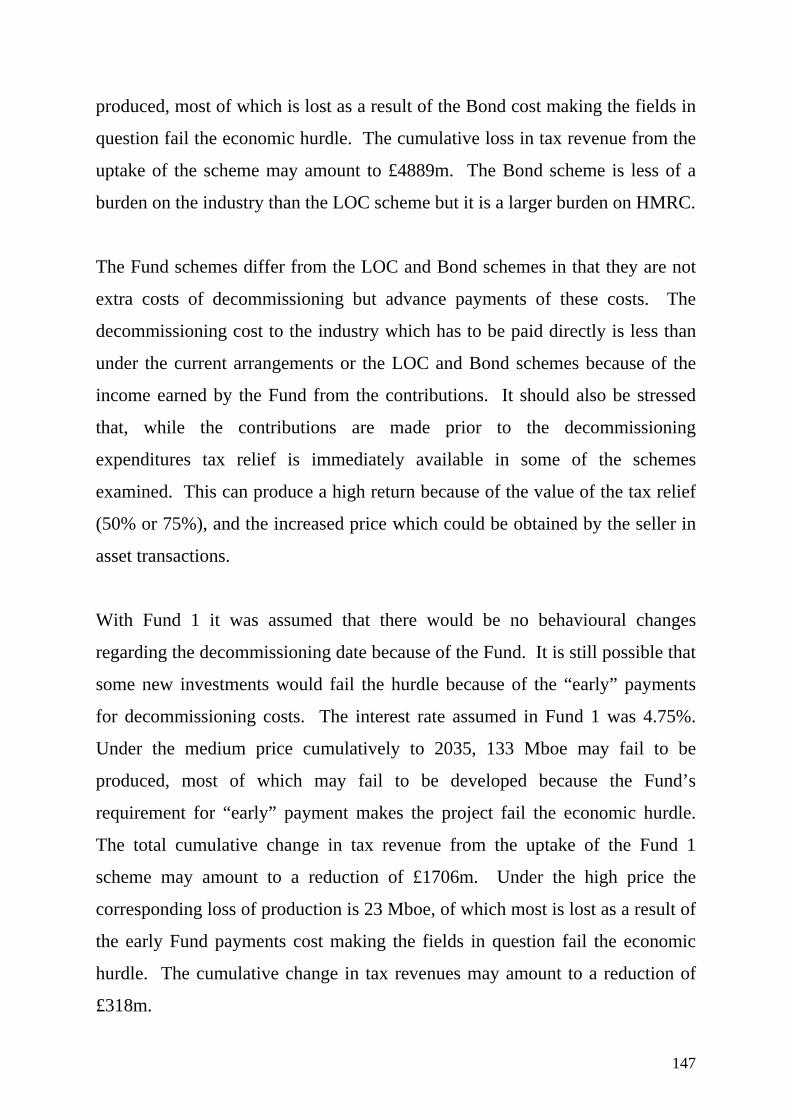
147
produced, most of which is lost as a result of the Bond cost making the fields in
question fail the economic hurdle. The cumulative loss in tax revenue from the
uptake of the scheme may amount to £4889m. The Bond scheme is less of a
burden on the industry than the LOC scheme but it is a larger burden on HMRC.
The Fund schemes differ from the LOC and Bond schemes in that they are not
extra costs of decommissioning but advance payments of these costs. The
decommissioning cost to the industry which has to be paid directly is less than
under the current arrangements or the LOC and Bond schemes because of the
income earned by the Fund from the contributions. It should also be stressed
that, while the contributions are made prior to the decommissioning
expenditures tax relief is immediately available in some of the schemes
examined. This can produce a high return because of the value of the tax relief
(50% or 75%), and the increased price which could be obtained by the seller in
asset transactions.
With Fund 1 it was assumed that there would be no behavioural changes
regarding the decommissioning date because of the Fund. It is still possible that
some new investments would fail the hurdle because of the “early” payments
for decommissioning costs. The interest rate assumed in Fund 1 was 4.75%.
Under the medium price cumulatively to 2035, 133 Mboe may fail to be
produced, most of which may fail to be developed because the Fund’s
requirement for “early” payment makes the project fail the economic hurdle.
The total cumulative change in tax revenue from the uptake of the Fund 1
scheme may amount to a reduction of £1706m. Under the high price the
corresponding loss of production is 23 Mboe, of which most is lost as a result of
the early Fund payments cost making the fields in question fail the economic
hurdle. The cumulative change in tax revenues may amount to a reduction of
£318m.
148
Fund 2 is as Fund 1 except that the Fund achieves income at 10%. While the
decommissioning cost under Funds 1 and 2 are the same there is £1290m less
given in decommissioning relief with Fund 2 compared to Fund 1 because the
income component of Fund 2 is higher, and so the payments into the Fund
which receive tax relief are less. Under the medium price with Fund 2,
cumulatively to 2035, 133 Mboe may fail to be produced, most of which fails to
be developed because the Fund’s requirement for contributions makes the field
fail the economic hurdle. The total cumulative change in tax revenue from the
uptake of the Fund 2 scheme may amount to an increase in tax revenue of
£621m because of the tax on Fund income. Under the high price there is
£1335m less given in decommissioning relief compared to that given for Fund
1. The corresponding figures cumulative change in tax revenues may amount to
an increase of £2094m.
Fund 3 is as Fund 2, with Fund interest at 10%, but the Fund payments may
affect behaviour regarding the timing of decommissioning. Under the medium
price, cumulatively to 2035, 360 Mboe may fail to be produced, much of which
may fail to be developed because the Fund’s requirement for “early” payment
makes the field fail the economic hurdle. The total cumulative change in tax
revenue from the uptake of the scheme may amount to an increase of £106m
because of the tax on Fund interest. Under the high price the corresponding
figures for loss of production are 260 Mboe, a substantial share of which is lost
as a result of the early Fund payments making the fields in question fail the
economic hurdle. The cumulative change in tax revenues may amount to an
increase of £1710m.

149
Fund 4 is as Fund 1, with Fund interest at 4.75%, but the Fund payments may
affect behaviour regarding the timing of decommissioning. Under the medium
price, cumulatively to 2035, 358 Mboe may fail to be produced, much of which
results from “early” payments making the field fail the economic hurdle. The
total cumulative change in tax revenue from the uptake of the scheme may
amount to a decrease in tax revenues of £1753m. Under the high price the
corresponding figures for loss of production are 346 Mboe, much of which is
lost as a result of the early Fund payments making the fields in question fail the
economic hurdle rate and the cumulative change in tax revenues may amount to
a decrease of £1207m.
Fund 5 is as Fund 4, with Fund interest at 4.75%, with the Fund payments
affecting behaviour regarding the timing of decommissioning and no relief
given for Fund contributions. Decommissioning relief is given on the
decommissioning cost when the cost is incurred. The aggregate relief given for
decommissioning costs will be higher than that given for the Fund schemes.
The present value of the total real decommissioning relief will be lower because
it is given later than under the other schemes which gives relief on Fund
contributions. Under the medium price cumulatively to 2035, 843 Mboe may
fail to be produced, most of which fail to be developed because the Fund’s
requirement for “early” payment makes the field fail the economic hurdle. The
total cumulative change in tax revenue from the uptake of the Fund 4 scheme
amounts to a decrease in tax revenues of £2236m. Under the high price the
corresponding figures for loss of production are 407 Mboe, much of which are
lost as a result of the early Fund payments making the fields in question fail the
economic hurdle. The cumulative change in tax revenues amount to a decrease
of £1284m.

150
The choice of schemes has to consider the advantages and disadvantages
discussed above. The LOC scheme is generally more expensive to UK plc than
the other two. The advantages of the Trust Fund scheme include the facilitation
of asset transactions in mature fields. Their attraction does depend in part on
the return achieved on the invested Fund monies, but it is also noteworthy that
from the viewpoint of the licensee the return on the alienated funds is
substantially greater than this because of the relief of the contributions against
tax at 50% or 75% (depending on whether PRT is being paid). An
economically efficient Trust Fund scheme requires tax deductions for the
contributions. Similarly the imposition of Inheritance Tax makes it non-viable.
From Government’s perspective the direct costs are higher in the early years but
the net return from the increased production and tax on interest could well
compensate for this in the long run.
The study has concentrated on the effects of the various schemes applied across
the board. The extent to which the application of the schemes should be
selective and thus the extent to which the Government should accept the
financial liability risks is for separate consideration.