North Dakota’s Forests
86
North Dakota’s Forests 2005 Resource Bulletin NRS-31 Forest Service United States Department of Agriculture Northern Research Station
Transcript of North Dakota’s Forests

North Dakota’s Forests
2005Resource Bulletin
NRS-31
ForestService
United States Department of Agriculture
Northern Research Station

We thank the following people who contributed both to the inventory and
analysis of North Dakota’s forest resources.
Tom Berg
James Blehm
Joseph Boykin
Gary Brand
Bill Burkman
Tom Claeys
Michael Downs
Keb Guralski
Ron Hackett
Tracie Hamilton
Mark Hansen
Bob Harsel
Gary Inhelder
Marcus Jackson
Barb Johnson
Dan Kaisershot
Barb Knight
Larry Kotchman
William Laubscher
Earl Leatherberry
Mike Long
Corey Magdiak
Mark Majewsky
Dennis May
Ron McRoberts
Ryan Medo
Dacia Meneguzzo
Pat Miles
Adam Morris
Keith Moser
Marc Much
Kevin Nimerfro
Cassandra Olson
Charles Paulson
Ron Piva
Greg Pugh
Matthew Riederer
Douglas Rollins
Travis Rymal
Tony Schram
Jason Severe
Earl Sheehan
Willard Smith
Jim Solomakos
Nate Sterns
Brad Totten
Greg White
Lacey Whitehouse
Joseph Zeleznik
Acknowledgments
Cover: Little Missouri River corridor. Photo used with permission from the North Dakota Forest Service.

1
Manuscript received for publicationAugust 2008
Published by:USDA Forest ServiceNorthern Research Station11 Campus Blvd, Suite 200Newtown Square, PA 19073-3294January 2009
For additional copies:USDA Forest ServicePublications Distribution359 Main RoadDelaware, OH 43015-8640Fax: 740-368-0152
Visit our website: www.nrs.fs.fed.us
David E. Haugen, Michael Kangas, Susan J. Crocker, Charles H. Perry,
Christopher W. Woodall, Brett J. Butler, Barry T. Wilson, Dan J. Kaisershot
North Dakota’s Forests2005

We welcome you to read the latest results of our statewide forest inventory, North
Dakota’s Forests 2005. The inventory and report are the product of a cooperative
effort between the North Dakota Forest Service and the Forest Inventory and
Analysis program of the U.S. Forest Service.
North Dakota’s 724,000 acres of forests provide wildlife habitat, recreational
opportunities, and wood products; stabilize river banks; filter water runoff from
adjacent agricultural lands; serve as seed sources for conservation tree production;
and contribute to the botanical diversity of the State.
Private landowners hold 70 percent of the State’s forest land, and State or Federal
agencies own the remaining 30 percent. Both ownership groups play an important
role in the State’s natural resource heritage.
North Dakota’s forests are robust, but threats to these important resources exist.
Invasive species, conversion of forests to other land uses, overmaturity of existing
stands, and suppression of natural disturbances essential in regenerating forests are
issues that will require attention.
Society demands a wide array of goods and services from our forests. North Dakota’s
Forests 2005 provides a common set of statistically accurate estimates that can be
used to make sound forest management decisions. We invite you to read this report
of North Dakota’s Forests 2005 and participate in the discussions about the future of
forests and forestry in our State.
Larry A. Kotchman
North Dakota State Forester
Foreword
2

3
Highlights . . . . . . . . . . . . . . . . . . . . . . . . . . . . . . . . . . . . . . . . . . . . . . . . . . . . . . . . . . . . . . 5
On the Plus Side . . . . . . . . . . . . . . . . . . . . . . . . . . . . . . . . . . . . . . . . . . . . . . . . . . . . . 5
Areas of Concern . . . . . . . . . . . . . . . . . . . . . . . . . . . . . . . . . . . . . . . . . . . . . . . . . . . . . 6
Issues to Watch . . . . . . . . . . . . . . . . . . . . . . . . . . . . . . . . . . . . . . . . . . . . . . . . . . . . . . 6
A Brief Primer on Forest Inventory . . . . . . . . . . . . . . . . . . . . . . . . . . . . . . . . . . . . . . . . . . . 8
Forest Features. . . . . . . . . . . . . . . . . . . . . . . . . . . . . . . . . . . . . . . . . . . . . . . . . . . . . . . . . . 13
North Dakota’s Forest Land Base . . . . . . . . . . . . . . . . . . . . . . . . . . . . . . . . . . . . . . . . 14
North Dakota’s Forests—Where are They?. . . . . . . . . . . . . . . . . . . . . . . . . . . . . . . . . 16
Forest Tree Diversity. . . . . . . . . . . . . . . . . . . . . . . . . . . . . . . . . . . . . . . . . . . . . . . . . . 18
The Size of It All—North Dakota’s Woods . . . . . . . . . . . . . . . . . . . . . . . . . . . . . . . . . 21
How Old?—Forest Stand Age in North Dakota. . . . . . . . . . . . . . . . . . . . . . . . . . . . . 24
How Dense are the Woods? . . . . . . . . . . . . . . . . . . . . . . . . . . . . . . . . . . . . . . . . . . . . 26
Biomass: North Dakota’s Forest Weighing In . . . . . . . . . . . . . . . . . . . . . . . . . . . . . . . 29
Cottonwood—A Special Situation . . . . . . . . . . . . . . . . . . . . . . . . . . . . . . . . . . . . . . . 32
The Aspen Resource. . . . . . . . . . . . . . . . . . . . . . . . . . . . . . . . . . . . . . . . . . . . . . . . . . 34
Whose Woods Are These? Family Forest Owners . . . . . . . . . . . . . . . . . . . . . . . . . . . 36
Whose Woods Are These? Public Forests. . . . . . . . . . . . . . . . . . . . . . . . . . . . . . . . . . 39
Forest Health . . . . . . . . . . . . . . . . . . . . . . . . . . . . . . . . . . . . . . . . . . . . . . . . . . . . . . . . . . . 41
Crowns. . . . . . . . . . . . . . . . . . . . . . . . . . . . . . . . . . . . . . . . . . . . . . . . . . . . . . . . . . . . 42
North Dakota Soils. . . . . . . . . . . . . . . . . . . . . . . . . . . . . . . . . . . . . . . . . . . . . . . . . . . 44
Down Woody Materials . . . . . . . . . . . . . . . . . . . . . . . . . . . . . . . . . . . . . . . . . . . . . . . 48
Contents

4
Ozone. . . . . . . . . . . . . . . . . . . . . . . . . . . . . . . . . . . . . . . . . . . . . . . . . . . . . . . . . . . . . 52
Invasive Plant Species. . . . . . . . . . . . . . . . . . . . . . . . . . . . . . . . . . . . . . . . . . . . . . . . . 54
Emerald Ash Borer . . . . . . . . . . . . . . . . . . . . . . . . . . . . . . . . . . . . . . . . . . . . . . . . . . . 56
Wildlife Habitat—Snags . . . . . . . . . . . . . . . . . . . . . . . . . . . . . . . . . . . . . . . . . . . . . . . 58
Forest Health Summary . . . . . . . . . . . . . . . . . . . . . . . . . . . . . . . . . . . . . . . . . . . . . . . 60
Forest Products . . . . . . . . . . . . . . . . . . . . . . . . . . . . . . . . . . . . . . . . . . . . . . . . . . . . . . . . . 63
Growing-Stock Volume . . . . . . . . . . . . . . . . . . . . . . . . . . . . . . . . . . . . . . . . . . . . . . . 64
Sawtimber Volume . . . . . . . . . . . . . . . . . . . . . . . . . . . . . . . . . . . . . . . . . . . . . . . . . . . 68
Timber Product Output . . . . . . . . . . . . . . . . . . . . . . . . . . . . . . . . . . . . . . . . . . . . . . . 70
Data Sources and Techniques . . . . . . . . . . . . . . . . . . . . . . . . . . . . . . . . . . . . . . . . . . . . . . 73
Forest Inventory. . . . . . . . . . . . . . . . . . . . . . . . . . . . . . . . . . . . . . . . . . . . . . . . . . . . . 74
Sampling Phases. . . . . . . . . . . . . . . . . . . . . . . . . . . . . . . . . . . . . . . . . . . . . . . . . . . . . 75
Timber Product Output Survey . . . . . . . . . . . . . . . . . . . . . . . . . . . . . . . . . . . . . . . . . 77
National Woodland Owner Survey . . . . . . . . . . . . . . . . . . . . . . . . . . . . . . . . . . . . . . 78
Ozone Bioindicator Species . . . . . . . . . . . . . . . . . . . . . . . . . . . . . . . . . . . . . . . . . . . . 78
Literature Cited . . . . . . . . . . . . . . . . . . . . . . . . . . . . . . . . . . . . . . . . . . . . . . . . . . . . . . . . . 79

5
North Dakota forest lands represent 1.6 percent of the State’s total land area,
at 724,000 acres.
There is an average of 478 trees per acre on forest land in the State.
There is an average of 22.3 tons per acre of dry all live-tree biomass on
timberland in the State.
Cubic-foot volume in all live trees on forest land was estimated at 719
million cubic feet in 2005. Over 77 percent of the cubic-foot volume in the
State is on private forest land.
The volume of sawtimber on timberland equaled just over 1.1 billion board
feet in 2005, with close to half of the volume coming from cottonwood.
Fuel loadings of down woody materials are less in North Dakota compared
to areas of high fire hazard in Western States.
No ozone damage was observed on indicator plants in North Dakota during
the inventory period.
North Dakota’s aging cottonwood forests lack cottonwood regeneration with
the 2005 inventory estimating no cottonwood forest in the 0- to 20-year
stand age category.
Only 21 percent of all timberland acres in North Dakota are categorized as
small diameter stands (1- to 5-inch diameter).
The majority of sawtimber (71 percent) is in lower valued tree grades 3, 4,
and 5.
Aspen forests in North Dakota are in a general state of poor health. Lack of
fire disturbance and/or harvesting has resulted in older stands with minimal
natural regeneration.
Highlights
On the Plus Side
Areas of Concern

Eastern bottomland forests have been severely impacted by Dutch elm
disease. This disease has eliminated many of the American elms that once
made up a large portion of this forest type and has shifted the species
composition toward green ash and boxelder.
With over 78 million ash trees growing on forest lands throughout the State,
the emerald ash borer could have a dramatic impact on the North Dakota
forest landscape.
The decline of cottonwood forests along the Missouri River is largely
attributed to the absence of regeneration and the gradual senescence of
mature overstory trees. Encroachment of nonnative species such as Russian-
olive, buckthorn, and brome grass create additional management problems.
In ponderosa pine forests, years of past fire suppression coupled with high
stand density have created conditions that may intensify fire behavior.
With the increased interest in biobased fuels, marginal farm land that was
once in set-aside conservation programs is being put back into crop
production, which might reduce total forest land area in North Dakota in
the future.
6
Issues to Watch

Background
7Ponderosa pine forest. Photo by Cassandra Olson, U.S. Forest Service.

Trees are perennial woody plants that have central stems and distinct crowns. In general,
FIA defines a tree as any perennial woody plant species that can attain a height of 15 feet at
maturity.
FIA defines forest land as land that is at least 10 percent stocked by trees of any size or
formerly having had such tree cover and not currently developed for nonforest use. The
area with trees must be at least 1 acre in size, and wooded strips, such as those along roads,
streams, and agricultural fields, must be at least 120 feet wide and 363 feet long to qualify
as forest land.
From an FIA perspective, there are three types of forest land: timberland, reserved forest
land, and other forest land. In North Dakota, almost 74 percent of the forested acreage is
timberland, 3 percent is reserved forest land, and 23 percent is other forest land.
• Reserved forest land is withdrawn from timber utilization through legislation or
administrative regulation.
• Other forest land is land not capable of producing 20 cubic feet/acre/year at its peak; this
is often due to poor soil conditions.
• Timberland is forest land that is not reserved and meets the minimum productivity
requirements that other forest land does not.
In prior inventories, FIA measured trees only on timberland plots and was unable to report
volume on all forest land. The implementation of the new annual inventory system allows
volume to be reported on all forest land, not just on timberland. As these annual plots are
remeasured in the years ahead, FIA will also be able to report growth, removals, and
mortality on all forest land. In this report, trend reporting is limited to timberland except
for the area of forest land where individual tree measurements are not required.
What is a tree?
What is a forest?
What is the differenceamong timberland,reserved forest land,and other forest land?
A Brief Primer on Forest Inventory
8
BACKGROUND

Volume can be precisely determined by immersing a tree in a pool of water and measuring
the amount of water displaced. The method used by the Northern Research Station to
estimate volume is less precise but more logistically feasible. In this method, several
hundred cut trees were measured taking detailed diameter measurements along their
lengths to accurately determine their volumes (Hahn 1984). Regression lines were then fit
to this data by species group. Using these regression equations, FIA can produce individual
tree volume estimates based on species, diameter, and site index.
The same method was used to determine sawtimber volumes. FIA reports sawtimber
volumes in International 1/4-inch Rule board-foot scale. Factors for converting to Scribner
board-foot scale are also available (Smith 1991).
Building on previous works, the Forest Products Laboratory of the U.S. Forest Service
developed specific gravity estimates for a number of tree species (USDA FS 1999). These
specific gravities were then applied to tree volume estimates to estimate merchantable tree
biomass (the weight of the bole). Determining live-tree biomass is more complicated
because the stump (Raile 1982), the limbs, and the bark (Hahn 1984) must be added in as
well. FIA does not currently report the biomass in roots and foliage.
Forest inventory can report biomass as either green weight or oven-dry weight. Green
weight is the weight of a freshly cut tree; oven-dry weight is the weight of a tree with zero
percent moisture content. On average, one ton of oven-dry biomass is equal to 1.9 tons of
green biomass.
Data from new inventories are often compared with data from earlier inventories to
determine trends in forest resources. However, for comparisons to be valid, procedures used
in the two inventories must be similar. As a result of FIA’s ongoing efforts to improve the
efficiency and reliability of the inventory, several changes in procedures and definitions have
occurred since the last North Dakota inventory in 1994. Although these changes will have
little effect on statewide estimates of timberland, timber volume, and tree biomass, they may
have significant effects on plot classification variables such as forest type and stand-size
class. Some of these changes make it inappropriate to directly compare 2005 data tables
with those published for 1994.
The biggest change between inventories was the change in plot design. For consistency’s
sake, a new national plot design was implemented by all five regional FIA units in 1999.
How do we comparedata from differentinventories?
How much does a treeweigh?
How do we estimate atree’s volume?
9
BACKGROUND

The old North Central plot design used in the 1994 North Dakota inventory consisted of
variable-radius subplots. The new national plot design used in the 2005 inventory used
fixed-radius subplots. Both designs have their strong points, but they often produce
different classifications for individual plot characteristics.
FIA does not attempt to identify which lands are suitable or available for timber
harvesting— especially since suitability and availability are subject to changing laws and
ownership objectives. Just because land is classified as timberland does not necessarily
mean it is suitable or available for timber production. Forest inventory data alone are
inadequate for determining the area of forest land available for timber harvest because laws
and regulations, voluntary guidelines, physical constraints, economics, proximity to people,
and ownership objectives may prevent timberland from being available for timber
production.
10
BACKGROUND
A word of caution onsuitability andavailability

The Features, Health, and Products ofNorth Dakota’s Forests
11Killdeer Mountains. Photo used with permission from the North Dakota Forest Service.

Forest Features
13Ponderosa pine on Logging Camp Ranch. Photo by Cassandra Olson, U.S. Forest Service.

North Dakota is characterized primarily as a prairie state due to the topography, soils, and
climate that promotes perennial grasses and forbs. Forests are found scattered across the
State in woodlots, along streams and river bottoms, within wooded draws of the western
region, and in the hills of the north-central and northeastern regions.
The area of forest land in North Dakota was estimated at 724,000 acres in 2005 (Fig. 1).
Timberland, a subset of forest land, increased between inventories by an estimated 92,000
acres (441,000 acres in 1994 to 533,000 acres in 2005) (Fig. 2).
Although area of forest land is small compared to the entire land area of the State (roughly
1.6 percent), it is an important resource for multiple uses including recreation, wildlife,
water, and forest products. As we move forward with the annual inventory, we should gain
valuable trend data that will help in crafting management decisions in the future.
Background
What we found
What this means
North Dakota’s Forest Land Base
14
FEATURES

15
FEATURES
Figure 2.—Total timberland area
and associated standard error in
North Dakota, 1954 to 2005.
0
100
200
300
400
500
600
700
1954 1980 1994 2005
Inventory Year
Tim
berl
an
d A
rea (
tho
usa
nd
acre
s)
Figure 1.—Total forest land and
timberland area and associated standard
error in North Dakota, 2005.
0
100
200
300
400
500
600
700
800
900
Forest Land Timberland
To
tal A
rea (
tho
usan
d a
cre
s)

The natural forests of North Dakota occur in the water rich areas along streambanks,
lakeshores, and in the draws, gulches, and ravines of the hills. The frequency and intensity
of drought is the primary factor that restricts forest growth within the State. North Dakota
is one of the few states where both eastern and western forest types occur (Warner and
Chase 1956).
North Dakota’s forests can be separated into four geographical watershed units: Devils
Lake/James River, Missouri River, Red River, and Souris River (Fig. 3). An estimated
275,000 acres (38 percent) of forest land are found in the Missouri River watershed (Fig.
4). The Red River watershed and the Souris River watershed have an estimated 208,000
(29 percent) and 196,000 (27 percent) acres of forest land, respectively. The Devils
Lake/James River watershed has only 44,000 acres (6 percent) of the State’s forest land area.
Generally, forests are more abundant in the eastern half of North Dakota and less abundant
to the west as the soil and climate become less favorable for the growth and survival of
eastern forest tree species. Forests are primarily found along the streams and river bottoms
where they are better protected from the drying effects of winds and soil moisture is greater.
The Turtle Mountains, Pembina Hills, and the area around Devils Lake hold some of the
largest tracts of forest land in the State. The Missouri, Red, and Sheyenne Rivers and their
tributaries contain much of the riparian forest lands in the State. Forest land area is
scattered in the Little Missouri watershed and Killdeer Mountains of the western region.
Forests are found in the draws and ravines, in canyons, and on lower north-facing slopes
across the west.
Background
What we found
What this means
North Dakota’s Forests—Where are They?
16
FEATURES

17
FEATURES
Figure 3.—Forest area by major
watershed units, North Dakota, 2005.
Figure 4.—Total forest land by major
watershed unit and associated standard
error in North Dakota, 2005.
0
50
100
150
200
250
300
350
Devils Lake &James River
Souris River Red River Missouri River
Watershed Unit
Fo
rest
La
nd
(th
ou
sa
nd
acre
s)

18
FEATURES
The species composition of a forest stand can indicate the type of wildlife habitat, potential
for forest products, and future silvicultural activities.
North Dakota’s forest lands contain just over 346 million trees (Fig. 5), an average of 478
trees per acre. Deciduous trees occupy 94 percent of North Dakota’s forest area. Elm/ash
forests are the most abundant (Fig. 6) and are composed of green ash, American elm, bur
oak, and cottonwood. The elm/ash forest type is important in terms of acreage and volume.
It covers nearly 28 percent (202,000 acres) of the State’s total forest land area and accounts
for more then 22 percent of all live-tree volume in the State (Fig. 7). Although aspen trees
are found throughout North Dakota, the largest concentration of the aspen forest type is
found in the Turtle Mountains and Pembina Hills regions, occupying 116,000 acres (16
percent) of the State’s forest land area. The bur oak forest type occurs on 77,000 acres of
forest land and is found primarily in and around the Turtle Mountains, Pembina Hills, and
Devils Lake region.
The cottonwood forest type covers just 8 percent of North Dakota’s forest area, but
represents more than 30 percent of the State’s total forest volume. Cottonwood is
commonly found growing in pure stands but also grows in other forest types such as
elm/ash. Conifer-dominated stands cover roughly 5.8 percent of the forest area in North
Dakota and are composed primarily of ponderosa pine and Rocky Mountain juniper. The
Rocky Mountain juniper forest type covers more than 5 percent of North Dakota’s forest
area and occurs in the western part of the State known as the Badlands. This species grows
best in moist draws and ravines and on northern and western slopes.
Although the State’s forest lands hold some potential for wood products, many of the
forested acres are more valuable for protecting watersheds and providing wildlife habitat
and recreational opportunities.
Background
What we found
What this means
Forest Tree Diversity

Figure 6.—Area of forest land in North
Dakota by forest-type group/local group,
2005.
0 50 100 150 200 250
Rocky Mountain juniper
Bur oak
Mixed upland hardwoods
Cottonwood
Elm/ash/cottonwood
Hard maple/basswood
Elm/ash
Aspen
Balsam poplar
Willow
Other hardwoods
Exotic hardwoods
Fo
rest-
typ
e G
rou
p
Area of Forest Land (thousand acres)
0 20 40 60 80 100 120
Rocky Mountain juniper
Boxelder
Green ash
Aspen
Bur oak
Choke cherry
American elm
Hawthorn
American plum
Cottonwood
Sp
ecie
s G
rou
p
Number of Trees (million)
19
FEATURES
Figure 5.—Top 10 species groups in
terms of number of live trees occurring on
North Dakota’s forest land, 2005.

0 20 40 60 80 100 120 140 160 180 200
Bur oak
Elm/ash/cottonwood
Aspen
Elm/ash
Cottonwood
All Live Volume (million cubic feet)
Fo
rest-
typ
e G
rou
p
20
FEATURES
Figure 7.—All live volume on selected
forest-type group/local groups in North
Dakota, 2005.

21
FEATURES
Forests are composed of many tree species representing various sizes. Forest stands are
analyzed by size classes as a means to delineate the structure of a forest. Stand-size class is a
measure of the average diameter of the dominant trees in a stand. There are three stand-size
classes: sawtimber—large trees, softwoods at least 9 inches in diameter at breast height
(d.b.h.) and hardwoods at least 11 inches d.b.h.; poletimber—medium trees 5 inches d.b.h.
to sawtimber size; and sapling/seedling—small trees 1 to 5 inches d.b.h. Tracking change in
the distribution of stand-size class provides information about forest sustainability and
succession, and potential for wood products, wildlife habitat, and recreation opportunities.
Figures 8a and 8b show the distribution of forest land and timberland by stand-size class
in the State. Since the first inventory in 1954, the area of sawtimber in North Dakota has
steadily increased and now covers more than 198,000 acres of timberland (Fig. 9), and the
acreage of poletimber-size stands also increased over the same period of time. Currently,
poletimber-size stands represent more than 214,000 acres. The area of sapling-seedling size
stands has decreased since 1954 and now represents 110,000 acres. Two percent of the
timberland area is considered nonstocked. Forest types with a majority of area in the
sawtimber-size class include the cottonwood and bur oak types (Fig. 10).
The steady increase in sawtimber-size stands indicates maturing forests. The decline in
sapling-seedling-size stands over this time period is an area of concern. This decline is due
in part to the lack of either natural or human-induced disturbance in many of these forest
stands.
Background
What we found
What this means
The Size of It All—North Dakota’s Woods

Figure 8b.—Area of timberland by stand-
size class, North Dakota, 2005.
22
FEATURES
Figure 8a.—Area of forest land by stand-
size class, North Dakota, 2005.
Nonstocked2%
Sawtimber34%
Poletimber37%
Sapling-seedling27%
Nonstocked2%
Sawtimber37%
Poletimber40%
Sapling-seedling21%

Figure 10.—Percentage of select forest
types on timberland by stand-size class,
North Dakota, 2005.
0
10
20
30
40
50
60
70
80
90
100
Aspen
1994
Aspen
2005
Cottonwood 19
94
Cottonwood 20
05
Bur oak
1994
Bur oak
2005
Elm/as
h 1994
Elm/as
h 2005
Forest Type and Inventory Year
Small diameter
Medium diameter
Large diameter
Pe
rce
nt
0
50
100
150
200
250
300
Sawtimber Poletimber Sapling-seedling Nonstocked
Stand-size Class
Tim
be
rla
nd
Are
a (
tho
usa
nd
acre
s) 1954
1980
19942005
23
FEATURES
Figure 9.—Area of timberland by stand-
size class, North Dakota, 1954-2005.

24
FEATURES
North Dakota’s forest stands are represented by numerous age classes. Age is estimated
based on core samples from dominant or codominant trees from the overstory of a stand.
Estimating age is an important tool that provides information about the successional
development of a State’s forest lands. For example, a mixed age class distribution in aspen
forest types provides ruffed grouse with nesting cover, feeding areas, and drumming sites
along with places to roost.
North Dakota’s forests can be categorized into six broad age classes: 0 to 20 years old, 21 to
40 years, 41 to 60 years, 61 to 80 years, 81 to 100 years, and 100+ years (Fig. 11). Stand
age varies by forest types. In 2005, stands dominated by Rocky Mountain juniper, bur oak,
and cottonwood contained a greater proportion of area in the oldest age class (Fig. 12)
whereas stands dominated by aspen generally are younger.
More than three-quarters of the forest stands in North Dakota are 40 years or older. Lack of
regeneration is an issue of concern for many forest types within the State. This is due in
part to the lack of disturbances that are required to create suitable seedbeds and/or promote
root suckering.
Background
What we found
What this means
How Old?—Forest Stand Age in North Dakota

Figure 12.—Distribution of proportion of
area for selected forest types by stand
age class, North Dakota, 2005.
0
10
20
30
40
50
60
70
80
90
100
Pinyon/juniper Bur oak Cottonwood Aspen Elm/ash
Forest Type
Fo
rest
La
nd
(p
erc
en
t)
0-20 years
21-40 years
41-60 years
61-80 years
81-100 years
100+ years
0-20 years
21-40 years
41-60 years
61-80 years
81-100 years
100+ years
25
FEATURES
Figure 11.—Distribution of forest land by
stand age class, North Dakota, 2005.
10%
1%
17%
36%
12%
24%

The extent to which trees occupy forests, woodlots, and riparian areas can indicate the stage
of stand development. Stand density can indicate the need for harvesting trees or other
activities that promote forest growth.
We used three features of stands to derive measures of density: number of growing-stock
trees per acre of timberland, growing-stock volume per acre of timberland, and percentage
of timberland by stocking class. The average number of growing-stock trees per acre of
timberland increased slightly between 1980 and 1994 and decreased between 1994 and
2005 (Fig. 13). Although volume of growing-stock trees on timberland increased between
1994 and 2005 (11 percent), the average volume of growing stock per acre of timberland
decreased between inventories due to the increase in nonstocked timberland. (Fig. 14, 15a).
Stocking, a relative measure of tree density, is used to describe how fully trees occupy
stands. A stand is considered fully stocked when trees occupy the amount of space in a
stand that creates conditions for the best growth and form. Almost half of the timberland is
in the moderately stocked (30 percent of all timberland) or fully stocked (15 percent of all
timberland) categories (Fig. 15b). About one-third of North Dakota’s timberland area is
poorly stocked. Such stands contain insufficient numbers of growing-stock trees per acre.
Nonstocked timberland represents 18 percent of the State’s total and has less then 10
percent stocking of live trees.
These varying stand density estimates indicate the varying stages of stand development and
ranges of ecological niches and processes across North Dakota. For example, on more
favorable growing sites certain trees gain early dominance, thus reducing the number of
competing trees. The remaining trees grow more vigorously than those on poor sites and
add more volume over the same period of growth. In contrast, many forest and woodlots
are nonstocked or poorly stocked across the State. Factors that affect stand development on
these sites include (1) marginal agricultural lands reverting to forests—stocking densities
usually are low on these sites, (2) stocking reduced by livestock grazing, (3) extreme
environmental conditions—low rainfall amounts.
Background
What we found
How Dense are the Woods?
26
FEATURES
What this means

Figure 14.—Average volume of growing
stock per acre of timberland, North
Dakota, 1954-2005.
0
100
200
300
400
500
600
700
800
1954 1980 1994 2005
Inventory Year
Av
era
ge
Gro
win
g-s
tock
Vo
lum
e
pe
r A
cre
(cu
bic
fe
et)
0
10
20
30
40
50
60
70
80
90
100
1980 1994 2005
Inventory Year
Av
era
ge
Nu
mb
er
of
Gro
win
g-s
tock
Tre
es p
er
Acre
27
FEATURES
Figure 13.—Average number of growing-
stock trees per acre of timberland, North
Dakota, 1980-2005.

Figure 15b.—Area of timberland by
stocking class and associated standard
error, North Dakota, 2005.
0
50
100
150
200
250
Nonstocked Poorlystocked
Moderatelystocked
Fully stocked Overstocked
Stocking Class
Tim
be
rla
nd
Are
a (
acre
s)
0
10
20
30
40
50
60
70
80
90
100
1994 2005
Inventory Year
Tim
berl
an
d A
rea (
perc
en
t)
Overstocked
Fully stocked
Moderately stocked
Poorly stocked
Nonstocked
28
FEATURES
Figure 15a.—Area of timberland by
percent stocking class, North Dakota,
1994 and 2005.

29
FEATURES
In this report, tree biomass is defined as the total dry weight of all live aboveground
components of a forest tree including boles, stumps, tops, and limbs. In commercial timber
harvesting, the bole usually is the primary product because it contains wood used as
lumber, pulp, post, and other wood products. Estimates of biomass are becoming
increasingly important for analyses of carbon sequestration, fiber availability for fuel, and
fuel loading/wildfire risk assessments. As new biofuel industries emerge across the country,
residual biomass from forest thinning and harvest operations takes on added environmental
and economical importance.
Live aboveground tree biomass is estimated at 19.8 million dry tons, an average of about 27
dry tons/acre of forest area (Fig. 16). Total aboveground tree biomass on timberland
increased by 2.3 million dry tons between 1994 and 2005. The bole (main stem) of trees
accounts for nearly 7 of every 10 dry tons of aboveground tree biomass in the State (Fig.
17). Stumps, tops, and limbs account for 25 percent of aboveground biomass and small
trees (1-5 inches d.b.h.) account for the remaining 10 percent. More than 77 percent of the
state total for aboveground biomass (trees) is found on privately owned forest lands (Fig.
18). Only county and local government forest lands have a higher per acre tonnage of
biomass than private forests (Fig. 19).
North Dakota is steadily accruing tree biomass as the forests continue to grow and mature.
Although the live-tree biomass of the forests holds substantial amounts of carbon, other
forest pools such as soils, dead trees, roots, and non-tree vegetation also contribute to the
total carbon pool of the forest ecosystem.
Background
What we found
What this means
Biomass: North Dakota’s Forest Weighing In

Figure 17.—Components of live-tree
biomass, North Dakota, 2005.
Figure 16.—Area of aboveground
biomass by dry tons per acre, North
Dakota, 2005.
30
FEATURES
Stumps, tops,and limbs25%
All live trees1-5 inches10%
Boles65%

31
FEATURES
Figure 19.—Per acre aboveground dry
weight of all live-tree biomass on forest
land by owner group, North Dakota, 2005.
0
5
10
15
20
25
30
35
40
45
50
Forest Service Other Federal State County/Local Private
Owner Group
To
ns p
er
acre
Figure 18.—Ownership of forest biomass
(dry tons) for growing-stock and non-
growing-stock trees on forest land, North
Dakota, 2005.
Forest Service5%
Other Federal10%
County/Local3%
Private77%
State 5%

32
FEATURES
Cottonwood trees hold a special place in the history of North Dakota. The giant
cottonwood trees along the Missouri River near Washburn in Smith Grove are living
witnesses to the Lewis and Clark Corps of Discovery Expedition that explored the
Louisiana Purchase some 200 years ago (North Dakota Forest Service 2003). In 1873,
Congress passed the Timber Culture Act, which offered 160 acres to any settler willing to
plant 10 acres of trees (North Dakota Forest Service 1991). Many of the tree plantings
included cottonwoods that are still around today. Cottonwood has always been one of the
primary tree species harvested in the State. The potential loss of area in the cottonwood
forest type is a major concern for North Dakota.
To gauge the future status of cottonwood in North Dakota, we looked at the area of
cottonwood forest type by stand age over time. In 1980, there were an estimated 66,000
acres in the cottonwood forest type; by 2005 that had dropped to 55,000 acres, a decrease
of around 20 percent (Fig. 20). Over this 25-year period, the cottonwood forest type in the
stand age category of 0 to 20 years dropped to zero acres.
We also assessed the number of cottonwood trees by diameter between the 1994 and 2005
survey. Across all forest types in North Dakota, we estimate that the number of cottonwood
saplings in the 1.0- to 2.9-inch diameter range is zero and there are only 445,000 saplings
in the 3.0- to 4.9-inch diameter range. These estimates illustrate the lack of cottonwood
regeneration within the State (Fig. 21).
The lack of young stands of cottonwood across North Dakota, along with the low rate
of regeneration as expressed by the number of saplings across all forest types, illustrates
the shifts in natural disturbance regimes required to perpetuate cottonwood forests.
Cottonwood seeds require a moist bare mineral soil seedbed in which to germinate.
Frequent flooding along streambanks helps prepare suitable seedbeds. Flood control
structures on many of the major rivers across the State have resulted in the loss of
suitable sites for cottonwood regeneration. If these trends persist across North Dakota,
the area and the number of cottonwood trees growing in the State will continue to
decrease.
Background
What we found
What this means
Cottonwood—A Special Situation

Figure 21.—Cottonwood trees per acre,
North Dakota, 2005.
0
20,000
40,000
60,000
Stand Age
Are
a o
f C
ott
on
wo
od
Fo
rest
Ty
pe
1980 52,547 2,962 2,286 0 3,426 5,153
1995 18,022 5,600 19,178 2,293 80 6,545
2005 0 17,852 13,609 11,249 5,236 7,129
0-20 years
21-40 years
41-60 years
61-80 years
81-100 years
100+ years
33
FEATURES
Figure 20.—Area of cottonwood forest
type by stand age and inventory year,
North Dakota, 1980-2005.

34
FEATURES
With the exclusion of fire, much of the aspen in North Dakota has become overmature and
is declining in health and vigor (North Dakota Forest Service 2004a). Second only to the
elm/ash forest type in area with 116,000 acres of forest land, the aspen forest type is an
important resource for wildlife, recreation, esthetics, and forest industry.
In 1980, there were an estimated 154,000 acres in the aspen forest type. By 2005, the area
of aspen had dropped to 116,000 acres, a decrease of around 25 percent (Fig. 22). Over
this 25-year period, the aspen forest type in the stand age category of 0 to 20 years
decreased by more than 35,000 acres, while 60 percent of aspen stands in the State in 2005
were 40 years or older.
All live volume of aspen across all forest types in North Dakota in 2005 was estimated at
just over 100 million cubic feet (Fig. 23), an increase of just over 5.9 million cubic feet or 6
percent between inventories. Taking a look at volume per acre just on aspen stands
between inventories, we note a decrease in aspen volume. In 1995, aspen volume per acre
was estimated at 761 cubic feet per acre. By 2005, aspen volume per acre had dropped to
632 cubic feet per acre.
The aspen forest type in North Dakota is in decline. Stands of aspen are at or near maturity
for this pioneer species. Without disturbances (e.g., fire or harvesting) the aging stands of
aspen will continue to deteriorate, succumbing to weather, insects, and disease.
Background
What we found
What this means
The Aspen Resource
Aspen trees. Photo by U.S. Forest Service,Northern Research Station.

35
FEATURES
Figure 23.—Aspen live volume per acre,
North Dakota, 2005.
Figure 22.—Area of aspen forest type by
stand age and inventory year, North
Dakota, 1980-2005.
0
20
40
60
80
100
120
140
160
180
Are
a o
f A
sp
en
Fo
rest
Ty
pe
(th
ou
sa
nd
acre
s)
Stand Age
1980 154 54 27 63 11 0 0
1995 118 22 25 37 29 4 0
2005 116 19 28 47 22 0 0
Total 0-20 years 21-40 years 41-60 years 61-80 years 81-100 years
100+ years

36
FEATURES
FIA conducts the National Woodland Owner Survey (NWOS) to increase our
understanding of who owns the forest, why they own it, and what their management
objectives are. Data presented here are based on survey responses from 28 randomly
selected families and individuals who own forest land in North Dakota. Although this
sample size is relatively small, the trends for North Dakota are consistent with the trends
for the region as a whole, albeit with large sampling errors. The general trends appear to be
accurate. For additional information on the NWOS, visit: www.fs.fed.us/woodlandowners.
The majority of the forest land in North Dakota, 424,000 acres or 58 percent, is owned by
families and individuals (Fig. 24). An additional 86,000 acres are owned by other private
groups (e.g., corporations, tribes, etc.). Collectively, private owners possess 70 percent of
the State’s forests. An estimated 30,000 families and individuals collectively own 424,000
acres of forest land in North Dakota. They are the dominant forest ownership group in the
State. Although 76 percent of family forest owners have fewer than 10 acres of forest land,
86 percent of family forest land is owned by people with landholdings of 10 acres or more
(Table 1). Although most family forest owners in North Dakota plan to do little or nothing
with their forest land in the next 5 years, approximately 1 in every 3 acres is held by
owners who plan to either transfer their land to heirs or otherwise sell it within the next 5
years (Table 2). Land transfer is related, in part, to the age of the owners. Twenty-one
percent of the family forest land is owned by people 75 years or older, and an additional 38
percent of the family forest land is owned by people between 65 and 75 years old (Table 3).
This large-scale intergenerational shift will change the characteristics of the family forest
owners; influence how owners view, interact, and relate to their land; and, as a result, alter
future forest characteristics.
North Dakota’s family forest landowners are stewards of an important resource that
provides both personal and societal benefits. As stewards, landowners maintain their
woodlots and forests to protect and enhance their personal interests while providing
environmental and other benefits to the public.
Background
What we found
What this means
Whose Woods Are These? Family Forest Owners

37
FEATURES
Table 1.—Area and number of family
owned forests in North Dakota by size of
forest holdings, 2005
Figure 24.—Forest ownership in North
Dakota, 2005.
Business12%
Federal22%
Local2%
Family and Individual58%
State 6%
Acres Sampling error Number Sampling error
Thousands % Thousands %
1-9 61 82 22 69
10-49 106 51 5 39
50-99 45 106 1 58
100-499 151 37 1 30
500+ 61 107 <1 100
Total 424 10 30 52
Size of forest landholdings (acres) Area Ownerships

38
FEATURES
Table 3.—Area and number of family
owned forests in North Dakota by age of
owner, 2005.
Table 2.—Area and number of family
owned forests in North Dakota by
landowners’ 5-year plans for their forest
land, 2005.
Acres Sampling error Number Sampling error
Thousands % Thousands %
No activity 91 58 1 46
Minimal activity 136 41 6 57
Harvest firewood 151 37 9 45
Harvest saw logs or pulpwood 15 287 <1 100
Collect NTFPsb 42 118 1 38
Transfer all or part of land to heirs 151 37 4 59
Buy more forest land 15 287 <1 100
Land use conversion (forest to other) 45 106 <1 67
No current plans 30 151 <1 80
a Categories are not exclusive.b NTFPs = non-timber forest products.
Future plans a Area Ownerships
Acres Sampling error Number Sampling error
Thousands % Thousands %
<45 21 217 4 51
45-54 85 66 10 33
55-64 64 84 <1 28
65-74 148 42 13 34
75+ 85 66 1 28
No Answer 21 217 1 51
Age (years) Area Ownerships

39
FEATURES
Public forests are an important part of North Dakota’s natural resource heritage. Forests
provide access to outdoor education and recreational opportunities, provide wildlife habitat,
and play an important role in protecting watersheds.
Roughly 30 percent (214,400 acres) of forest lands in North Dakota are publicly owned
(Fig. 25). The Federal government, primarily the U.S. Forest Service, is responsible for
managing 72,000 acres or 34 percent while the State of North Dakota manages just over
46,000 acres or 22 percent of the forest land. More than 39 percent of the public lands are
managed by other Federal agencies, which include the Fish and Wildlife Service, National
Park Service, and Bureau of Land Management.
Much of the land available for public outdoor recreation such as hunting, fishing, hiking,
camping, or bird watching is managed by State and Federal agencies. For example, the
North Country Trail, which runs from New York to North Dakota, travels through both
state forest and U.S. Forest Service lands in southeast North Dakota. The North Dakota
Parks and Recreation Department administers 19 state parks and recreation areas across the
State. The North Dakota Forest Service manages lands for multiple benefits including
recreation and forest products. Federal agencies like the U.S. Forest Service, National Park
Service, and Fish and Wildlife Service manage areas available for recreation, many of which
are forested.
Background
What we found
What this means
Whose Woods Are These? Public Forests

0 5 10 15 20 25 30 35 40
Bureau of Land Management
County/Local Government
National Park Service
Other Federal
Fish and Wildlife Service
State Government
US Forest Service
Percentage
Pu
bli
c O
wn
ers
40
FEATURES
Figure 25.—Distribution of public
ownership by percent, North Dakota,
2005.

Forest Health
41
Aerial view of forest tent caterpillar defoliation in the Turtle Mountains. Photo used with permission from the North Dakota Forest Service.
Aspen conk produced by the fungus Phellinus tremulae. Photo used with permission from the North Dakota Forest Service.

The overall condition of the tree crowns indicates the health of a forest stand. For example,
a forest suffering repeated insect infestation will have low crown ratios, high transparency,
low density, and signs of dieback. Because tree crowns form part of the basic structural
architecture of a forest ecosystem, they also influence the composition, process, and vigor
of understory flora and fauna (Schomaker et al. 2007).
Crown indicator variables are collected only on a subset of forest land plots. The following
data are from seven Phase 3 plots or 150 trees. Dieback is measured as the percentage of
branch tips in the crown that are dead. The categories for the dieback indicator are none
(0-5 percent), light (6-20 percent), moderate (21-50 percent), and severe (51-100 percent)
(Fig. 26). Most trees were found to be in the none or light categories. Boxelder (8.3 percent)
and aspen (7.1 percent) had the highest dieback ratios.
The crown ratio of a tree is defined as the portion of the tree height supporting live foliage.
Eastern redcedar has the highest mean crown ratio at 90 percent; quaking aspen has the
lowest mean ratio at just over 35 percent. Crown transparency is a measure of the
proportion of the crown through which the sky is visible. The willow and boxelder species
groups have the highest average crown transparency, approaching 32 percent; the eastern
redcedar has an average crown transparency of only 10 percent.
Means of the crown indicators by species group appear to indicate healthy crown
conditions in North Dakota. Crown ratio and crown transparency appear to be inversely
related: the higher the crown ratio the lower the transparency. Crown ratios are generally
higher for trees on the edge of the forest. With the baseline data collected, we will continue
to monitor crown health and will be able to detect trends as they develop.
Background
What we found
What this means
Crowns
42
HEALTH

43
HEALTH
Figure 26.—Percentage of dieback, mean
crown transparency, and mean
uncompacted crown ratio for selected
species groups, North Dakota, 2005.
0 10 20 30 40 50 60 70 80 90 100
American elm
Boxelder
Bur oak
Eastern redcedar
Green ash
Quaking aspen
Willow
Sp
ecie
s G
rou
p
Percent
DiebackCrown ratioTransparency

Soils are vital to a tree’s survival. In addition to physically supporting the roots, and
therefore the rest of the tree, soils also provide essential water and nutrients to the tree
(North Dakota Forest Service 2004b). Inventory and assessment of the forest soil resource
provides critical baseline information on forest health and productivity.
Field data are available from 2001 to 2004. There are relatively few soil inventory plots in
North Dakota, but it is possible to make some very broad generalizations using data from
other Plains States (South Dakota, Nebraska, and Kansas).
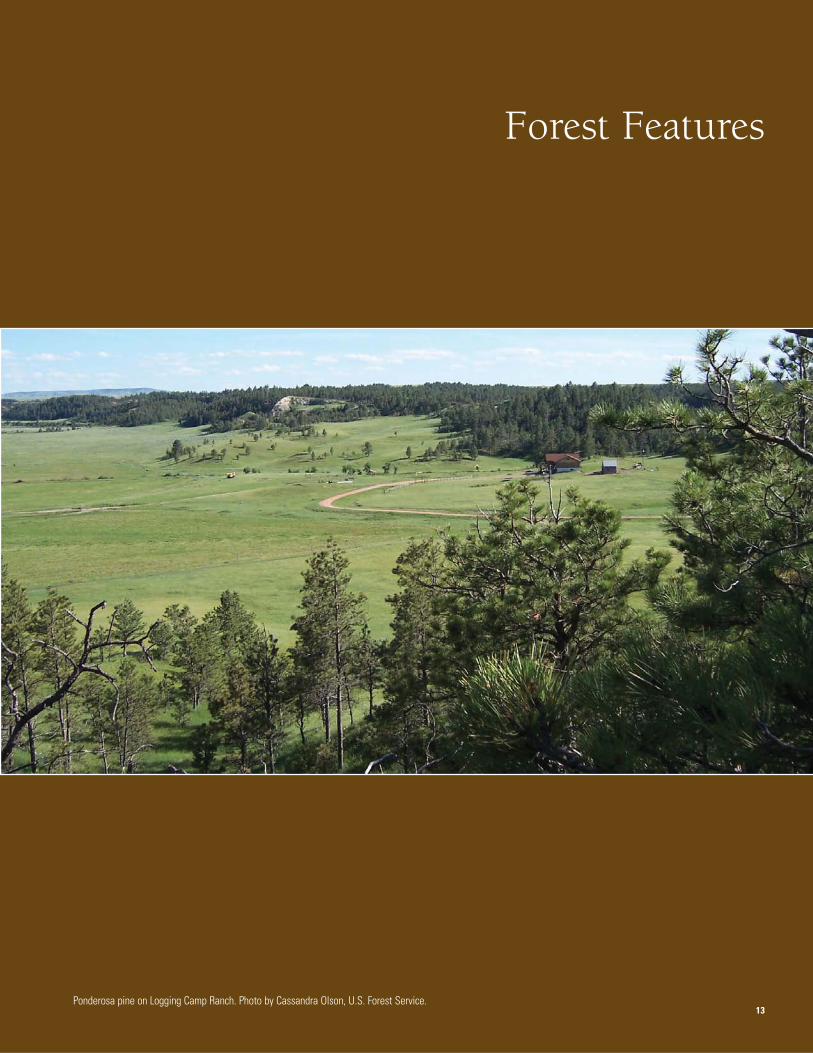
Forest floor accumulations under North Dakota’s forests are at or above the median forest
floor thickness observed in the region (Fig. 27).
Soil carbon content in the forest floor and mineral soil was calculated from laboratory
measurements. The forest floor under North Dakota’s forests stores as much or more
carbon than that in most samples from neighboring states, both within and across forest-
type groups (Fig. 28). The same is true in the 0- to 10-cm layer of mineral soil (Fig. 29).
In the 10- to 20-cm layer, carbon storage is more consistent across the region.
The Soil Quality Index (SQI) is a new measure designed to combine the distinct physical
and chemical properties of the soil into a single, integrative assessment (Amacher et al.
2007). SQI values in North Dakota are generally higher than those observed in
neighboring states (Fig. 30). The high quality of the sampled soils results from several
factors: moderate soil pH, abundant calcium and magnesium, and low levels of
aluminum.
Soil carbon is significant for several reasons. First, carbon is the primary component of
soil organic matter, which has a number of important functions. These include increasing
water holding capacity, retaining some nutrients by cation exchange (e.g., Ca2+, Mg2+,
K+), releasing other nutrients as it decays (e.g., nitrogen, phosphorus, and sulfur), and
capturing potential toxic agents (e.g., mercury) (McBride 1994). Nationally and
internationally, carbon is also inventoried to track the sequestration of certain
greenhouse gases.
Calcium and magnesium are essential elements for plant growth. Calcium is required for
cell wall formation, and magnesium is essential to photosynthesis as the central atom of
the chlorophyll molecule (Marschner 1986). High levels of aluminum reduce root growth
(Marschner 1986).
Background
What we found
What this means
North Dakota Soils
44
HEALTH
45
HEALTH
The soil indicator is in its infancy, but the existing data suggest that the forest soils of
North Dakota are of high quality and storing above average amounts of carbon. This may
indicate an opportunity for the State’s limited forests to play an important role in future
sequestration programs.
Figure 27.—Observations of forest floor
thickness, North Dakota and other Plains
States, 2001-2004.

46
HEALTH
Figure 28.—Observations of forest floor
soil carbon content, North Dakota and
other Plains States, 2001-2004.
Figure 29.—Observations of mineral soil
carbon content, 0 -10 cm, North Dakota
and other Plains States, 2001-2004.

47
HEALTH
Figure 30.—The Soil Quality Index
(Amacher et al. 2007) highlights
differences in the overall chemical and
physical condition of the soil.

Down woody materials, in the form of fallen trees and branches, fill a critical ecological
niche in North Dakota’s forests. Down woody materials provide valuable wildlife habitat in
the form of coarse woody debris, increase the diversity of forest structure, and are an
important determinant of forest fire behavior.
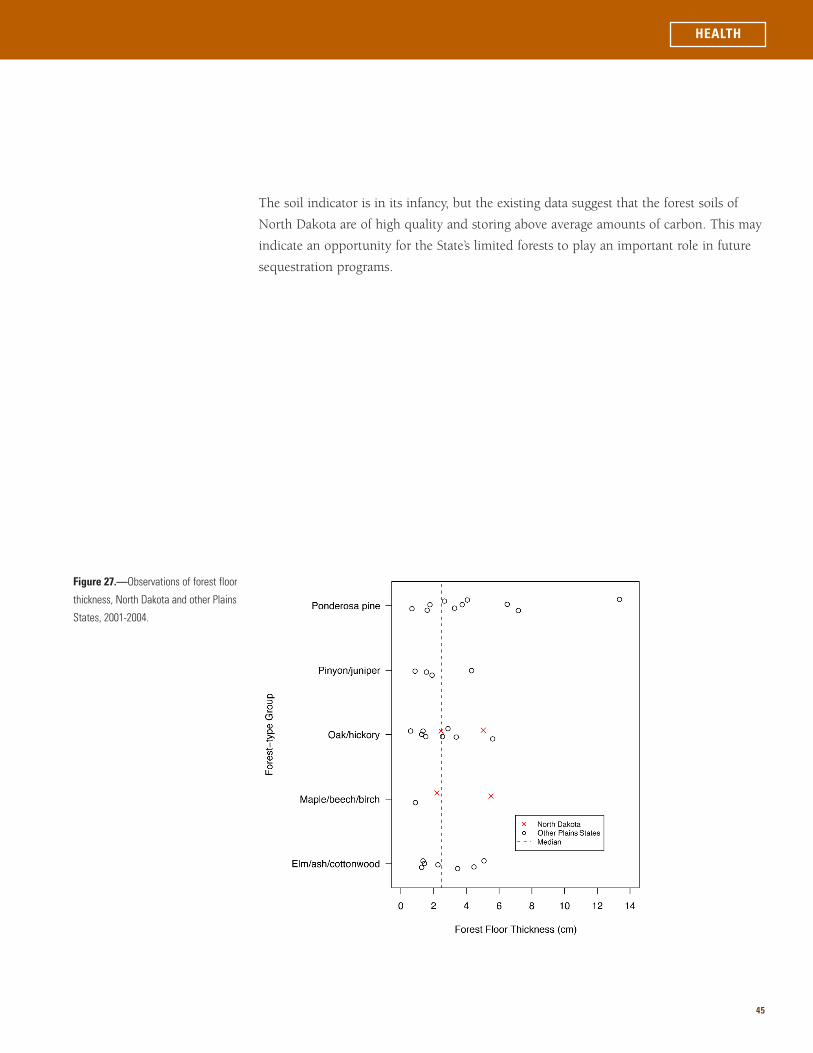
Overall, the fuel loadings of down woody materials (time-lag fuel classes) are relatively low
for most classes in North Dakota (Fig. 31) (for time-lag definitions see Woodall and
Monleon 2008). For comparison, the combined loadings of 1-hr, 10-hr, and 100-hr fuels in
blowdown areas of the Boundary Waters Canoe Area Wilderness in Minnesota exceeded 16
tons/ac (Woodall and Nagel 2007), while North Dakota’s combined loadings were below 3
tons/ac. One exception is the 1,000+-hr fuels that averaged over 8 tons per forest land acre.
However, it should be noted that this 1,000+-hr fuel estimate has a standard error of 3
tons/acre, which indicates that it may not be statistically different from that of neighboring
states. The size class distribution of coarse woody debris appears to be heavily skewed (84
percent) toward pieces less than 8 inches in diameter at the point of intersection with plot
sampling transects (Fig. 32a). In the decay class distribution of coarse woody debris, there
appears to be a fairly uniform distribution of stages of coarse woody decay across the State,
except for decay class 3 logs (48 percent) (Fig. 32b). Decay class 3 coarse woody pieces are
typified by moderately decayed logs that are still structurally sound but missing most of
their bark with extensive sapwood decay. There is no strong trend in coarse woody debris
volumes/acre among classes of live-tree density (basal area/acre) (Fig. 33).
The down woody fuel loadings in North Dakota’s forests are not significantly different from
those found in neighboring states. Therefore, only in times of extreme drought would these
low amounts of fuels pose a hazard across the State. Of all down woody components,
1,000+-hr fuels made up the largest amounts possibly due to windthrow events along the
numerous forest fringes in this Plains State. However, coarse woody debris volumes are still
relatively low and were represented by small, moderately decayed pieces. Overall, because
fuel loadings are not exceedingly high across North Dakota, possible fire dangers are
outweighed by the benefits of down woody material for wildlife habitat and carbon pools.
Background
What we found
What this means
Down Woody Materials
48
HEALTH
49
HEALTH
Figure 31.—Means and associated
standard errors of fuel loadings
(tons/acre, time-lag fuel classes) on forest
land in North Dakota and neighboring
states, 2001-2005.
0
2
4
6
8
10
12
14
1-hr 10-hr 100-hr 1,000+-hr
Fuel-hour classes
Fu
el
Lo
ad
ing
s (
ton
s/a
cre
)
South Dakota
North Dakota
Minnesota

50
HEALTH
1
2
3
4
5
Decay Class
Figure 32 a and b.— Mean proportions
of coarse woody debris total pieces per
acre by transect diameter (inches) and
decay classes on forest land in North
Dakota, 2001-2005.
3.0-7.9
8.0-12.9
13.0-17.9
18.0+
Coarse Woody Debris
(inches)
48%
17%
5%
30%
0%
84%
5%
0%
11%

51
HEALTH
Figure 33.—Means and associated
standard errors of coarse woody debris
volumes (cubic feet/acre) on forest land in
North Dakota, 2001-2005.
0
1,000
2,000
3,000
4,000
5,000
6,000
7,000
8,000
9,000
0.0-30.0 30.1-60.0 60.1-90.0 90.1-120.0 120.1+
Basal Area (sq. ft./acre)
Co
ars
e W
oo
dy
De
bri
s (
cu
bic
fe
et/
acre
)

52
HEALTH
Bioindicator leaf injury surveys were initiated in North Dakota in 2002. North Dakota has
eight permanent biosites scattered across the State; no foliar injury symptoms have been
observed so far.
Ground-level ozone exposure in North Dakota has not been detected by our inventory
measurements:
North Dakota’s ozone levels are some of the lowest in the country (Fig. 34). Plant species
used in the ongoing study to detect ozone damage include skunkbush, mountain
snowberry, common milkweed, and western wormwood. Tree species studied include green
ash, quaking aspen, and ponderosa pine.
North Dakota’s forests appear to be at low risk of suffering ozone damage to ozone-sensitive
species. Still, baseline data are needed to develop trends for potential ozone damage in the
future.
Background
What we found
What this means
Ozone
Number of biosites 8 8 8 8
Biosites with injury (%) 0 0 0 0
Number of plants evaluated 866 695 752 775
Number of plants with injury 0 0 0 0
Mean biosite index 0 0 0 0
Parameter 2002 2003 2004 2005

53
HEALTH
Figure 34.—Mean biosite index map for
North Dakota, 2000-2004.

54
HEALTH
Invasive plants spread into intact ecosystems and cause economic or environmental harm
by developing self-sustaining populations and becoming dominant or disruptive to those
systems (Clyde 2002). Nonnative invasive plant species can compete with and replace
native forest plants, reduce wildlife forage and habitat, and increase forest management
costs through their impact on tree regeneration and growth.
Between the 2001 and 2003 field seasons, we collected data on native and nonnative forest
plant species from our seven ground vegetation plots, a subset of our forest inventory plots.
In 2005, we began collecting data on a select list of nonnative invasive plants on all forest
inventory plots across the State (Fig. 35). The two most prevalent nonnative species were
nonnative bush honeysuckle and common burdock, both species found on 19 percent of
sampled plots. Leafy spurge was the third most common nonnative species found. Other
nonnative species found include common buckthorn, spotted knapweed, Canada thistle,
and bull thistle.
Nonnative plant species are an emerging forest health concern in North Dakota because
they compete with native plant species for resources and threaten ecological diversity by
altering natural plant communities. Nonnative plants can also cause economic problems by
lowering land values for agriculture, forestry, and recreation.
Background
What we found
What this means
Invasive Plant Species

55
HEALTH
Figure 35.—Nonnative invasive plants on
forest lands, North Dakota, 2005.

56
HEALTH
Since its discovery in North America in 2002, the emerald ash borer (EAB) has caused
extensive decline and mortality of ash trees in the central portion of the U.S. and in south-
central Canada (Poland and McCullough 2006). EAB is an exotic wood-boring beetle that is
a pest of all major species of ash, including green, white, black, and blue ash, and all ash
cultivars. Both healthy and stressed ash trees, ranging in size from 1 to 59 inches in
diameter, are susceptible (Cappaert et al. 2005). Trees infested with EAB generally die
within 1 to 3 years (Poland and McCullough 2006).
North Dakota’s forest land contains an estimated 78.1 million ash trees greater than 1 inch
in diameter. Almost all of the State’s ash trees (96 percent) are green ash, with only a minor
component of black ash (4 percent). Overall, green ash represents 22 percent of all of the
live-tree species on forest land. Green ash is the second most abundant tree species in
North Dakota by number of trees and is ranked third by estimate of total volume. The total
volume of ash, both green and black, is 132.2 million cubic feet, or 18 percent of the total
volume on forest land. Ash is found throughout the State, with high densities in the Turtle
Mountain region and in west-central North Dakota, area including the Theodore Roosevelt
National Park and Wilderness, the Fort Berthold Indian Reservation, and the Little Missouri
National Grassland (Fig. 36). Ash is present on 507,700 acres, or 70 percent of North
Dakota’s forest land (Fig. 37). Although it generally makes up less than 25 percent of total
live-tree basal area (BA), in many areas ash represents more than 50 percent of total stand
basal area.
Ash is a major component of North Dakota’s woodland forests. It is also found in
shelterbelts and riparian areas and it is widely planted in North Dakota communities.
Human transportation of infested ash materials increases the risk of EAB introduction to the
State and therefore the potential impacts to statewide forest resources and forest industries.
Because ash is so abundant throughout the State, EAB would have a significant impact on
the structure and composition of North Dakota’s woodland, riparian, and community
forests.
Background
What we found
What this means
Emerald Ash Borer

57
HEALTH
Figure 37.—Presence of ash on forest
land, expressed as a percentage of stand
basal area (ash BA per acre/total live BA
per acre), North Dakota, 2001-2005.
0
50,000
100,000
150,000
200,000
250,000
No ash 0.1 - 25.0 25.1 - 50.0 50.1 - 75.0 75.1 - 100.0
Basal Area (percent)
To
tal
Fo
rest
La
nd
(a
cre
s)
Figure 36.—Density of all live ash trees
on forest land in North Dakota, 2001-
2005.

58
HEALTH
Dead and dying standing trees are important to numerous wildlife species. More than 85
species of North American birds are cavity nesters, and several dozen mammals also use
holes in trees for burrows and rearing of young. Nearly 40 percent of birds found in
midwestern forested areas are cavity nesters. In some areas of the northern plains, such as
North Dakota, it may be even more (North Dakota Outdoors 1994).
The abundance of standing dead or snag trees varies across the different forest types of
North Dakota (Fig. 38). For example, the average number of snags per acre in the aspen
forest type is higher (29.5) than what we find in the bur oak forest type (12.3). Many
factors contribute to the number of snags per stand including stand age, stocking levels,
and disturbances like insects, diseases, and weather. On average, there are an estimated
19.0 snags per acre on forest land in the State. Snags per acre differ by ownership as well
across the State (Fig. 39). Factors mentioned above along with different forest management
strategies will affect the number of snags per acre.
North Dakota’s inventory data indicate a rich abundance of snags across all forest types that
provide important habitat for birds and mammals. In addition to providing nesting habitat
for cavity nesting birds, dead trees are used by great blue herons, cormorants, hawks, and
eagles as secure above-the-ground nest sites. Bats readily use the spaces under loose bark of
dead trees as places to raise young and gain protection from the elements. Chipmunks,
squirrels, raccoons, and weasels all will use holes in trees for raising young, hibernating, or
getting protection from the weather (North Dakota Outdoors 1994).
Background
What we found
What this means
Wildlife Habitat—Snags

59
HEALTH
Figure 39.—Standing dead trees by
ownership, North Dakota, 2005.
0 10 20 30 40 50 60
National Grassland
National Park Service
Bureau of Land Management
Fish and Wildlife Service
Other Federal
State
County and Municipal
Private
Ow
ners
hip
Standing Dead Trees per Acre
Figure 38.—Standing dead trees by
select forest types, North Dakota, 2005.
0 5 10 15 20 25 30 35
Aspen
Cottonwood
Elm/ash
Elm/ash/cottonwood
Rocky Mountain juniper
Bur oak
Mixed upland hardwoods
Standing Dead Trees per Acre
Fo
rest
Ty
pe

60
HEALTH
The following summaries provide information on the general conditions of North Dakota’s
native forests. These narratives depict the factors that have led to the current condition of
these resources; they do not necessarily describe specific causal agents of tree/forest decline.
The information presented in this section was compiled from various sources and methods
including site visits, forest surveys, and personal communication with natural resource
professionals.
The elm/ash/cottonwood forest type is one of the most abundant of all native forest land
and is found along rivers throughout North Dakota. These forests have changed
significantly over the past decades due to damage caused by Dutch elm disease,
overgrazing, altered water flows, and conversion to nonforest.
Since Dutch elm disease was first detected in 1969, the disease has spread throughout
North Dakota. The American elm once was a major component of the State’s riparian forests
and occupied a wide range of sites. However, Dutch elm disease spread aggressively and
decimated the elm population that once made up a large portion of the riparian forests
along the Red, James, Sheyenne, and Pembina Rivers. In addition, the disease continues to
kill elms that grow in the wooded draws of western North Dakota. Although the American
elm has not been eliminated entirely from these forests, the species primarily persists as a
small understory tree, occupies a small proportion of the total stand basal area, and often
dies before reaching maturity. The loss of American elm dominance in these systems has
shifted the species composition toward green ash, boxelder, and other species.
In addition to the impacts of Dutch elm disease, many riparian forests have been converted
to nonforest through agricultural and residential development particularly along the Red
River of eastern North Dakota. Other damaging factors include overgrazing and water flow
changes that can gradually reduce the vigor of existing trees and destroy understory woody
vegetation. Such forest changes and conversions adjacent to watercourses have important
implications for water quality, flood control, wildlife habitat, and recreation opportunities.
The cottonwood forests that occur within the Missouri flood plain from Garrison Dam to
Lake Oahe are in a poor condition that has resulted from progressive mortality of mature
trees and the absence of natural regeneration to replace those that have died. Before flood
mitigation, the Missouri flood plain was periodicly inundated as high spring water flows
deposited sand in low-lying areas. These moist sandbars serve as seedbeds for cottonwood
and are critical for natural regeneration of the species (Burns and Honkala 1990). This
historical disturbance regime of periodic flooding drove the succession, distribution, and
age class structure of cottonwood forests along the flood plain (Ball 1997).
Riparian Forests
Forest Health Summary

61
HEALTH
In the absence of flooding and subsequent sandbar formation, there is limited cottonwood
regeneration to replace the overmature trees that have succumbed to old age and senescence.
As a result, the flood plain that once persisted as a fluctuating mosaic of backwater wetlands,
sandbars, and cottonwood forests now exists as a xeric, fire-prone flood plain bisected by a
channelized river. The cottonwood component of the Missouri flood plain may eventually die
out and give way to other tree species (both native and nonnative) with the exception of a few
isolated sites adjacent to the ever-deepening river channel.
Aspen/birch forests are abundant in the Turtle Mountains region and represent the State’s
largest concentration of forest land. Quaking aspen is the dominant species in these stands,
but paper birch, bur oak, and green ash can also be common on these sites.
A significant portion of this aspen resource can be characterized by low productivity, stem
decay, and large stem mortality that is associated with stand overmaturity. In the absence of
stand-replacing disturbances to encourage vigorous aspen regeneration, aspen stands age
and deteriorate over time as the result of numerous inciting, predisposing, and contributing
factors. These may include frost injury, drought, hail damage, windstorms, and several
forest pests.
Forest pests such as defoliating insects, wood rotting fungi, and canker diseases also
contribute to the deterioration of these aspen stands. The Turtle Mountains are prone to
periodic defoliation episodes caused by the forest tent caterpillar. Defoliation reduces growth,
predisposes trees to other damaging agents, and exacerbates the senescence of aging aspen
stands. Internal decay of live aspen trees is common within mature aspen stands, particularly
those older than 60 years. Stem decay caused by the fungus Phellinus tremulae reduces the
amount of usable wood within a stand in addition to increasing the probability of stem
breakage. The wood volume loss due to this stem decay has been increasing as the aspen
resource continues to age in the Turtle Mountains. Similarly, mortality of large diameter trees
due to Hypoxylon canker contributes to the deterioration of older stands.
The damage caused by these pests should not be perceived as unnatural but rather as a
reflection of a disturbance regime shift. Without disturbance (whether by fire, harvesting,
bulldozing, or other means) to encourage vigorous aspen regeneration, pests and
environmental factors deteriorate the aging aspen and give way to other species. Throughout
its western and eastern range, aspen is a pioneer species that is often succeeded (replaced) by
shade-tolerant conifer species in the absence of disturbance. However, many aspen forests of
the northern prairie regions of North America convert to shrubland where shade-tolerant
conifers do not naturally occur (Harniss 1981, Perala 1990). This successional scenario is
Aspen Forests

apparent within some areas of the Turtle Mountains where beaked hazel dominates the
understory of deteriorating aspen stands and prevents the establishment of other tree
species.
In addition to the senescence of the aspen resource, many areas within the Turtle Mountains
have been converted to pastureland. This conversion may be driven in part by reduced
productivity and vigor of the stands coupled with a lack of harvesting opportunities for
private landowners. As a result, some private landowners are inclined to clear low-
production forests and use the land for agricultural purposes that generate marginal
economic benefits.
Fortunately, forest land owners have had a renewed interest in harvesting aspen in recent
years. Although clearcutting may look unappealing at first, the vigorous regeneration of
aspen that soon follows is important for the long-term perpetuation of this unique forested
resource. The young aspen stands that regenerate following harvest are beneficial to many
wildlife species.
Several animals, insect pests, and pathogens are found in the native ponderosa pine stands
of southwestern North Dakota. Of these, animal damage caused by deer and porcupines is
most apparent. Additionally, shoot death and branch dieback caused by western gall rust,
Diplodia shoot blight and canker, and pine pitch nodule maker are commonly encountered.
Such pests may lead to tree mortality if conditions favor repeated infections/infestations
over several years. Many pines weakened by these pests and other factors die following
colonization by pine engraver beetles or turpentine beetles. Despite the presence of pests,
these isolated pine stands are quite resilient and the level of tree mortality has remained low.
Perhaps the greatest concern in these areas has been wildfire. Years of past fire suppression
coupled with high stand density create conditions that may intensify fire behavior. These
wildfire concerns were realized when a large prairie fire spread into portions of the native
ponderosa pine stands of Slope County, ND, in September 2004. The fire (known as the
Deep Creek Fire) burned through approximately 800 acres of privately owned forest.
Mortality may reach 100 percent in stands that experienced high fire intensity with severe
needle scorching and stem charring, but estimations of tree mortality are uncertain in areas
that had less intense fires. The dense stocking and general low vigor of these stands suggest
that tree mortality could be significant within the following years. Survey plots were created
on these sites to assess delayed tree mortality during the following years.
Ponderosa PineForests
62
HEALTH

Forest Products
63Wood chips. Photo by U.S. Forest Service.

Growing-stock volume is a measure of the amount of wood available for use in the
manufacturing of products such as lumber and paper. The definition of growing-stock
volume is the net volume of a growing-stock tree, 5.0 inches or greater d.b.h., from 1 foot
above the ground to a minimum 4.0-inch top. In other words, growing-stock volume is
wood volume in standing trees that are healthy, sound, reasonably straight, and have
a diameter of at least 5 inches. Estimating volume is important when determining the
potential availability of wood for harvest (economic planning) and is an important
measure when evaluating forest sustainability (forest management planning).
Growing-stock volume has increased steadily in North Dakota since 1980 and currently is
estimated at 366 million cubic feet (Fig. 40). Five species account for 95 percent of all
growing-stock volume in North Dakota: cottonwood, green ash, bur oak, quaking aspen,
and American elm (Fig. 41). Between 1994 and 2005, four of the top five species (all but
quaking aspen) increased in volume. Growing-stock volume currently averages 687 cubic
feet per acre, down by about 9 percent from the 1994 survey (Fig. 42). The decrease is
due in large part to the increase in nonstocked timberland across the State (Fig. 43). Much
of the increase in growing-stock volume can be attributed to the growth of larger trees
(Fig. 44).
Even though the growth of larger trees is the main reason for the increase in growing-stock
volume since 1980, riparian forest restoration and the gain of forested acres in North
Dakota have also contributed to this increase.
Background
What we found
What this means
Growing-Stock Volume
64
PRODUCTS

65
PRODUCTS
Figure 41.—Net volume of growing stock
by select species group, 1994-2005.
0 20,000 40,000 60,000 80,000 100,000 120,000
American elm
Quaking aspen
Bur oak
Green ash
Cottonwood
Growing-stock Volume
(thousand cubic feet)2005
1994
Sp
ecie
s G
rou
p
Figure 40.—Total volume of growing
stock on North Dakota’s timberland,
1954-2005.
0
50
100
150
200
250
300
350
400
450
1954 1980 1994 2005
Inventory Year
Gro
win
g-s
tock
Vo
lum
e
(mil
lio
n c
ub
ic f
ee
t)
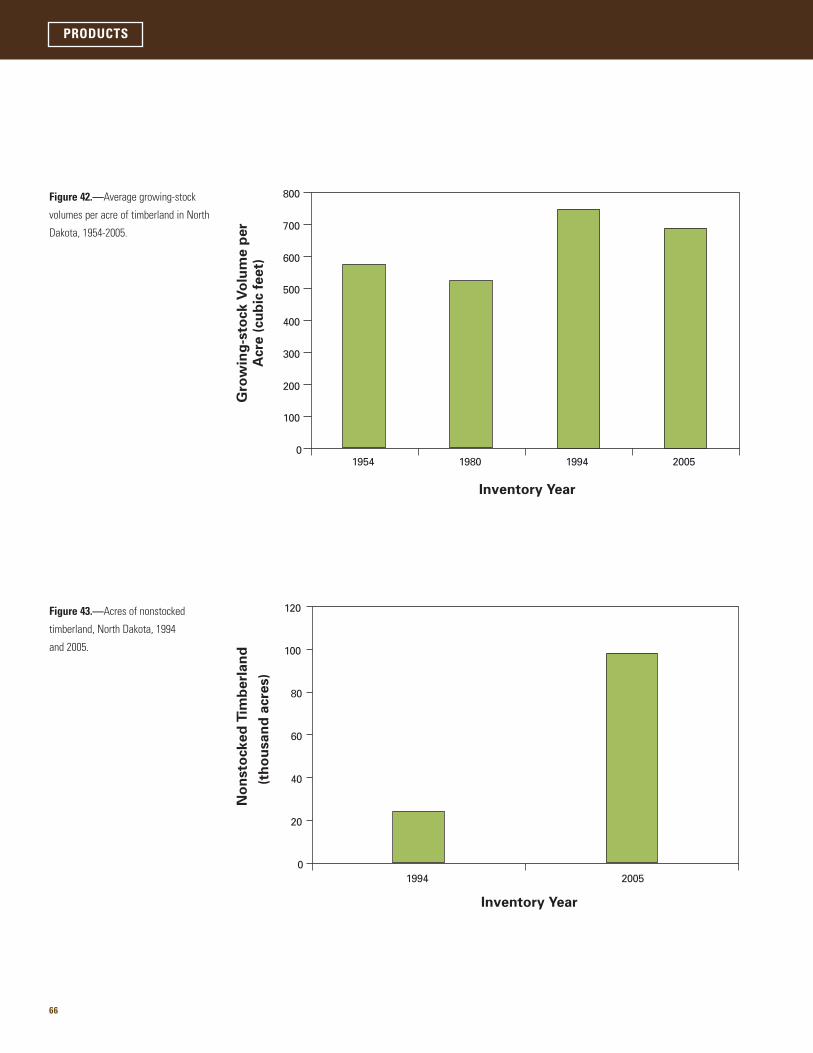
66
PRODUCTS
Figure 43.—Acres of nonstocked
timberland, North Dakota, 1994
and 2005.
0
20
40
60
80
100
120
1994 2005
Inventory Year
No
nsto
ck
ed
Tim
be
rla
nd
(th
ou
sa
nd
acre
s)
Figure 42.—Average growing-stock
volumes per acre of timberland in North
Dakota, 1954-2005.
0
100
200
300
400
500
600
700
800
1954 1980 1994 2005
Inventory Year
Gro
win
g-s
tock
Vo
lum
e p
er
Acre
(cu
bic
fe
et)

67
PRODUCTS
Figure 44.—Distribution of growing-stock
volume by diameter class in North Dakota,
1994-2005.
0
10,000
20,000
30,000
40,000
50,000
60,000
70,000
6 8 10 12 14 16 18 20 22-28 29+
Diameter Class (inches)
Gro
win
g-s
tock
Vo
lum
e (
tho
usa
nd
cu
bic
fe
et)
1994
2005

68
PRODUCTS
Sawtimber is the wood in the saw log portion of a tree (main trunk between the stump and
the merchantable top, measured in board feet). Sawtimber volume is a measurement used
to determine the monetary value of wood volume in a tree or the amount of usable product
that might be manufactured from a given tree(s).
Sawtimber volume between 1954 and 1980 remained relatively unchanged. Between
1980 and 2005, sawtimber volume steadily increased to more than 1.1 billion board feet
(Fig. 45). Average sawtimber volume per acre in 2005 was 2,102 board feet, an increase of
233 board feet since 1994. Virtually all sawtimber volume is in hardwoods (Fig. 46), with
cottonwood, bur oak, and green ash accounting for more than 81 percent of all sawtimber
volume in the State.
Sawtimber volume continues to increase, with cottonwood volume doubling between 1980
and 2005. Sawtimber volume on timberland should be able to supply the forest product
industry in the State for years to come.
Background
What we found
What this means
Sawtimber Volume

69
PRODUCTS
Figure 46.—Percentage of total
sawtimber volume by species/species
group on timberland in North Dakota,
2005.
Figure 45.—Total sawtimber volume on
North Dakota’s timberland, 1954-2005.
0
200
400
600
800
1,000
1,200
1954 1980 1994 2005
Inventory Year
Sa
wti
mb
er
Vo
lum
e
(mil
lio
n b
oa
rd f
ee
t)
Quaking aspen12%
American basswood1%
American elm4%
Softwoods<1%
Other hardwoods2%
Bur oak22%
Cottonwood45%
Green ash14%

70
PRODUCTS
North Dakota’s wood products manufacturing industries employ more than 2,000 workers
with an output of approximately $355 million (U.S. Census Bureau 2005). Most of the
wood product manufacturers in the State are secondary manufacturers, such as cabinet and
mill works. Much of their wood material originates from out-of-state sources. Sawmills are
the primary wood-using industry in North Dakota and utilize local timber. To properly
manage and sustain North Dakota’s forests, it is essential to have information about the
location and species of timber that will supply these mills.
A mill survey was conducted of all known primary wood-using mills in North Dakota in
2003. The study included the size of the industry, the amount of roundwood harvested,
and its uses. Questions about the generation and distribution of wood residues were also
asked. The top three hardwood species harvested in the State were cottonwood, aspen, and
bur oak; the top softwood species harvested was spruce (Fig. 47).
By product, saw logs accounted for 60 percent of all the roundwood produced, with
pulpwood making up the remaining 40 percent. Wood material harvested for industrial
roundwood on North Dakota’s forests was more than 400,000 cubic feet in 2003: 73
percent used for products, 17 percent was logging slash, and 10 percent was logging
residues.
In 2003, 73 percent of the State’s saw log production was exported to mills in Minnesota.
The remaining 27 percent went to mills in North Dakota. Totals from saw log mill receipts
from the 2003 survey illustrate that 100 percent of the wood coming into the mills is grown
in North Dakota.
A comparison of the 1998 and 2003 timber products inventories shows a decrease in
industrial roundwood production of 29 percent, which may be due in part to the closing of
one mill in the State. Even though the total active mills in North Dakota dropped slightly,
production capacity was changed considerably with the loss of this one mill.
Cottonwood is still the most commonly harvested species in the State, partly because the
elm/ash/cottonwood forest-type group covers an estimated 165,000 acres of forest land and
cottonwoods are some of the State’s largest trees. In addition, there is also strong interest
from Minnesota’s timber industry.
Background
What we found
What this means
Timber Product Output

71
PRODUCTS
Figure 47.—Saw log production by select
species/species group, North Dakota,
2003. Other<.3%
Ash0.7%
Bur oak1.2%
Aspen2.8%
Cottonwood95.0%


Data Sources and Techniques
73Field crew member on plot in western North Dakota. Photo by Cassandra Olson, U.S. Forest Service.

Haugen (2003) described the annualized inventory methods for North Dakota. Since the
1994 inventory, several changes in FIA methods have improved the quality of the inventory
and have met increasing demands for timely forest-resource information. The most
significant change between inventories has been the shift from periodic to annual
inventories. Historically, FIA inventoried each state on a cycle that averaged about 12 years.
However, the need for timely and consistent data across large geographical regions along
with national legislative mandates resulted in FIA implementing an annual inventory. This
system was initiated in North Dakota in 2001.
With the NRS-FIA annual inventory system, approximately one-fifth of all field plots are
measured in any single year. After 5 years, the entire inventory is completed. After this
initial 5-year period, NRS-FIA will report and analyze results using a moving 5-year
average. For example, NRS-FIA will be able to generate inventory results for 2001 through
2005 or for 2002 through 2006.
Other significant changes between inventories include implementing new remote-sensing
technology as well as a new field-plot configuration and sample design, and gathering
additional remotely sensed and field data. The use of new remote-sensing technology allows
NRS-FIA to use classifications of Multi-Resolution Land Characterization data and other
remote-sensing products to stratify the total area of North Dakota and to improve estimates.
New algorithms were used in 2001-2005 to assign forest type and stand-size class to each
condition observed on a plot. These algorithms are being used nationwide by FIA to
provide consistency from state to state and will be used to reassign the forest type and
stand-size class of every plot in the 1994 inventory when it is updated. As a result, changes
in forest type and stand-size class will reflect actual changes in the forest and not changes
due to differences between algorithms. The list of recognized forest types, groupings of
these forest types for reporting purposes, models used to assign stocking values to
individual trees, definition of nonstocked (stands with a stocking value of less than 10
percent for all live trees), and names given to the forest types changed with the new
algorithms. As a result, comparisons between the published 2001-2005 results and those
published for the 1994 inventory may be invalid. Contact NRS-FIA for additional
information on the algorithms used in both inventories.
Forest Inventory
74

The 2005 North Dakota inventory was conducted in three phases. In the first phase,
satellite imagery was used to stratify the State and aerial photography was used to select
plots for measurement. The second phase entailed measuring the traditional suite of
mensurational variables; the third phase focused on a suite of variables related to forest
health.
Land that could not be sampled included private tracts where field personnel were unable
to obtain permission to measure a Phase 2 plot and plots that were inaccessible because of a
hazard or danger to field personnel. The methods used in preparing this report were
adjusted to account for such sites.
For the North Dakota inventory, FIA used a classification of satellite imagery for
stratification. The imagery was used to form two initial strata: forest and nonforest. Pixels
within 60 m (2-pixel widths) of a forest/nonforest boundary formed two additional strata:
forest edge and nonforest edge. Forest pixels within 60 m of the boundary on the forest side
were classified as forest edge and pixels within 60 m of the boundary on the nonforest side
were classified as nonforest edge. All strata were divided into public or private ownership
based on information available in the Protected Lands Database (DellaSala et al. 2001). The
estimated population total for a variable is the sum across all strata of the product of each
stratum’s area (from the pixel count) and the variable’s mean per unit area (from plot
measurements) for the stratum.
Phase 2 of the inventory consisted of the measurement of the annual sample of field plots in
North Dakota. Current FIA precision standards for annual inventories require a sampling
intensity of one plot for approximately every 6,000 acres. FIA has divided the entire area of
the United States into nonoverlapping hexagons, each of which contains 5,937 acres
(McRoberts 1999). An array of field plots was established by establishing a plot in each
hexagon. This array of plots is designated the Federal base sample and is considered an
equal probability sample; its measurement in North Dakota is funded by the Federal
government.
Fieldwork for this inventory was expedited through the cooperation and assistance of the
North Dakota Forest Service.
The total Federal base sample was systematically divided into five interpenetrating, non-
overlapping subsamples or panels. Each year the plots in a single panel are measured, and
75
Sampling Phases
Phase 1
Phase 2

panels are selected on a 5-year, rotating basis (McRoberts 1999). For estimation purposes, the
measurement of each panel of plots may be considered an independent random sample of all
land in the State. Field crews measure vegetation on plots currently classified as forest by
trained photointerpreters using aerial photos or digital orthoquads.
NRS-FIA has two categories of field measurements: Phase 2 and Phase 3 field plots. Both
types are distributed systematically geographically and temporally. Phase 3 plots are measured
with the full array of vegetative and health variables as well as the full suite of measures
associated with Phase 2 plots. Phase 3 plots must be measured between June 1 and August 30
to accommodate measurement of nonwoody understory vegetation, ground cover, soils, and
other variables. The complete 5-year annual inventory of North Dakota includes seven
forested Phase 3 plots. On the remaining plots, only variables that can be measured
throughout the entire year are collected. In North Dakota, the complete 5-year annual
inventory includes 164 forested Phase 2 plots.
The national FIA four-subplot cluster configuration (Fig. 48) was first used for data collection
in North Dakota in 2001 and will be used in subsequent years. The national plot
configuration requires mapping all forest conditions on each plot. Due to the small sample
size each year, precision associated with estimates of components of change such as mortality
will be relatively low. Consequently, we report estimates of components of change only after
multiple annual panels have been measured. With completion of the annual inventory in
2010, the full range of change estimates will be available.
The overall plot layout for the new configuration consists of four subplots. The centers of
subplots 2, 3, and 4 are located 120 feet from the center of subplot 1. The azimuths to
subplots 2, 3, and 4 are 0, 120, and 240 degrees, respectively. The center of the new plot is
located at the same point as the center of the previous plot if a previous plot existed at the
location. Trees that are 5 inches and larger in d.b.h. are measured on a 24-foot-radius (1/24-
acre) circular subplot. All trees less than 5 inches d.b.h. are measured on a 6.8-foot-radius
(1/300- acre) circular microplot located 12 feet due east of the center of each of the four
subplots. Forest conditions on each subplot are recorded. Factors that differentiate forest
conditions are changes in forest type, stand-size class, land use, regeneration status, reserved
status, ownership, and density. Each condition that occurs on one of the subplots is identified,
described, and mapped so long as the area of the condition is at least 1 acre. Field-plot
measurements are combined with Phase 1 estimates in the compilation process and table
production. The number of tables presented here is limited, but others can be generated at
http://fiatools.fs.fed.us.
76
Phase 3

Program Manager, Northern Research Station, Forest Inventory and Analysis, 1992 Folwell
Avenue, St Paul, MN 55108 or State Forester, North Dakota Forest Service, Molberg Center,
307 1st Street East, Bottineau, ND 58318-1100.
The timber products inventory study was a cooperative effort between the North Dakota
Forest Service (NDFS) and the Northern Research Station (NRS) (Haugen and Harsel
2005). The NDFS canvassed all primary wood-using mills within the State using mail
questionnaires supplied by the NRS and designed to determine the size and composition of
North Dakota’s primary wood-using industry, its use of roundwood, and its generation and
disposition of wood residues. The NDFS then contacted nonresponding mills through
additional mailings, telephone calls, and personal contacts until a nearly 100 percent
response was achieved. Completed questionnaires were forwarded to NRS for compilation
and analysis.
As part of data processing and analysis, all industrial roundwood volumes reported on the
questionnaires were converted to standard units of measure using regional conversion
factors. Timber removals by source of material and harvest residues generated during
logging were estimated from standard product volumes using factors developed from
previous NRS logging utilization studies. Data on North Dakota’s industrial roundwood
receipts were added to a regional timber removals database and supplemented with data on
out-of state uses of State roundwood to provide a complete assessment of North Dakota’s
timber product output.
77
For additionalinformation, contact:
Timber Products Output Survey
Figure 48.—Current NRS-FIA field-plot
design.

National Woodland Owner Survey
The National Woodland Owner Survey is conducted annually by the USDA Forest Service
to increase our understanding of private woodland owners – the critical link between
society and forests. Each year, questionnaires are mailed to individuals and private groups
who own the woodlands where NRS-FIA has established inventory plots (Butler et al.
2005). Twenty percent of these ownerships (about 50,000 nationwide) are contacted each
year with more detailed questionnaires mailed in years that end in 2 or 7 to coincide with
national census, inventory, and assessment programs. The target accuracies of the data are
plus or minus 10 percent at the state level.
Several bioindicator species have been tested in both laboratory and field settings over
several decades and have proven to be reliable indicators of ground-level ozone stress.
These include white ash, black and pin cherry, dogbane, milkweed, big leaf aster, and
blackberry. In North Dakota, the annual ozone biomonitoring by FIA began in 2002.
Foliar injury can be related to seasonal exposures as well as peak concentrations. Seasonal
exposures measure ozone stress by summing hourly concentrations above a threshold
concentration over several months.
78
Ozone Bioindicator Species

79
Amacher, M.C.; O’Neil, K.P.; Perry, C.H. 2007. Soil vital signs: new Soil Quality Index
(SQI) for assessing forest soil health. Res. Pap. RMRS-RP-65WWW. Fort Collins, CO: U.S.
Department of Agriculture, Forest Service, Rocky Mountain Research Station. 12 p.
Ball, J.J. 1997. Restoration of bottomland forests: challenges and opportunities.
Proceedings of the North Dakota Academy of Science. Vol. 51, supplement 1: 40-43.
Burns, Russell M.; and Honkala, Barbara H., tech. coords. 1990. Silvics of North America:
1. Conifers; 2. Hardwoods. Agric. Handb. 654. Washington, DC: U.S. Department of
Agriculture, Forest Service. Vol. 2. 877 p.
Butler, Brett J.; Leatherberry, Earl C.; Williams, Michael S. 2005. Design, implementation,
and analysis methods for the National Woodland Owner Survey. Gen. Tech. Rep. NE-
336. Newtown Square, PA: U.S. Department of Agriculture, Forest Service, Northeastern
Research Station. 43 p.
Cappaert, D.; McCullough, D.G.; Poland, T.M.; Siegert, N.W. 2005. Emerald ash borer in
North America: a research and regulatory challenge. American Entomologist. 51(3): 152-
165.
Clyde, M.E. 2002. What is an invasive plant and why should we care? Habitats.
University of New Hampshire Cooperative Extension. Vol. 18. (1):1-2
DellaSala, D.A.; Staus, N.L.; Strittholt, J.R.; et. al. 2001. An updated protected areas
database for the United States and Canada. Natural Areas Journal. 21(2): 124-135.
Hahn, J.T. 1984. Tree volume and biomass equations for the Lake States. Res. Pap. NC-
250. St. Paul, MN: U.S. Department of Agriculture, Forest Service, North Central Forest
Experiment Station. 10 p.
Harniss, R.O. 1981. Ecological succession in aspen and its consequences on multiple
use values. DeByle, N.V., ed. Symposium proceedings, Situation management of two
intermountain species: aspen and coyotes. Aspen. Logan, UT: Utah State University: 31-39.
Vol. 1.
Haugen, D.E. 2003. North Dakota forest resources, 2001. Res. Note NC-387. St. Paul,
MN: U.S. Department of Agriculture, Forest Service, North Central Research Station. 7 p.
Haugen, D.E.; Harsel, R.A. 2005. North Dakota timber industry: an assessment of timber
product output and use in 2003. Resour. Bull. NC-252 St. Paul, MN: U.S. Department of
Agriculture, Forest Service, North Central Research Station. 18 p.
Literature Cited

80
Marschner, H. 1986. Mineral nutrition of higher plants. London: Academic Press. 674 p.
McBride, M. 1994. Environmental chemistry of soils. New York: Oxford University Press.
406 p.
McRoberts, R.E. 1999. Joint annual forest inventory and monitoring system, the North
Central perspective. Journal of Forestry. 97(12): 27-31.
North Dakota Forest Service. 1991. Forest resource plan. Bottineau, ND: North Dakota
Forest Service. 47 p.
North Dakota Forest Service. 2003. Lewis and Clark historic cottonwoods for purchase.
Bottineau, ND: North Dakota Forest Service. The Prairie Forester. 17(2): 1.
North Dakota Forest Service. 2004a. Management of declining aspen. Bottineau, ND:
North Dakota Forest Service. The Prairie Forester. 18(3): 4.
North Dakota Forest Service. 2004b. Tree tips: soils 101—physical properties of soil.
Bottineau, ND: North Dakota Forest Service. The Prairie Forester. 18(1): 5.
North Dakota Outdoors. 1994. Bare trees. Bismarck, ND: State Game and Fish
Department. http://www.und.nodak.edu/org/ndwild/ndmag.html.
Perala, D.A. 1990. Quaking aspen. In: Burns, Russell M.; Honkala, Barbara H., tech.
coords.1990. Silvics of North America: 1. Conifers; 2. Hardwoods. Agric .Handb. 654.
Washington, DC: U.S. Department of Agriculture, Forest Service: Vol. 2, 555-561
Poland, Therese M.; McCullough, Deborah G. 2006. Emerald ash borer: invasion of the
urban forest and the threat to North America’s ash resource. Journal of Forestry: April
May: 118-124.
Raile, G.K. 1982. Estimating stump volume. Res. Pap. NC-224. St. Paul, MN: U.S.
Department of Agriculture, Forest Service, North Central Forest Experiment Station. 4 p.
Schomaker, Michael E.; Zanoch, Stanley J.; Bechtold, William A.; Latelle, David J.;
Burkman, William G.; Cox, Susan M. 2007. Crown-condition classification: a guide to
data collection and analysis. Gen. Tech. Rep. SRS-102. Asheville, NC: U.S. Department of
Agriculture, Forest Service, Southern Research Station. 78 p.
Smith, W.B. 1991. Assessing removals for North Central forest inventories. Res. Pap.
NC-299. St. Paul, MN: U.S. Department of Agriculture, Forest Service, North Central Forest
Experiment Station. 48 p.

81
U.S. Department of Agriculture, Forest Service. 1999. Wood handbook – wood as an
engineering material. Gen. Tech. Rep. FPL-113. Madison, WI: U.S. Department of
Agriculture, Forest Service, Forest Products Laboratory. 463 p.
U.S. Department of Commerce. 2005. 2002 Census of manufactures. Geographic area
series-North Dakota. EC02-31A-ND. Washington, DC: U.S. Department of Commerce.
Economics and Statistics Administration. Bureau of the Census.
Warner, J.R.; Chase, C.D. 1956. The timber resource of North Dakota. Sta. Pap. No. 36.
St. Paul, MN: U.S. Department of Agriculture, Forest Service, Lake States Forest Experiment
Station. 39 p.
Woodall, Christopher W.; Monleon, Vicente J. 2008. Sampling protocol, estimation, and
analysis procedures for the down woody materials indicator of the FIA program. Gen.
Tech. Rep. NRS-22. Newtown Square, PA: U.S. Department of Agriculture, Forest Service,
Northern Research Station. 68 p.
Woodall, C.W.; Nagel, L.M. 2007. Downed woody fuel loading dynamics of a large-scale
blowdown in northern Minnesota, U.S.A. Forest Ecology and Management. 247: 194-
199.
Woodall, Christopher; Williams, Michael, 2005. Sampling protocol, estimation, and
analysis procedures for the down woody materials indicator of the FIA program. Gen.
Tech. Rep. NC-256. St. Paul, MN: U.S. Department of Agriculture, Forest Service, North
Central Research Station. 47 p.

82
About the Authors
David E. Haugen is a Forester with the Forest
Inventory and Analysis Program, Northern
Research Station, St. Paul, MN.
Mike Kangas is a Forest Health Specialist with the
North Dakota Forest Service, North Dakota State
University, Fargo, ND.
Susan J. Crocker is an Entomological Specialist
with the Forest Inventory and Analysis Program,
Northern Research Station, St. Paul, MN.
Charles H. Perry is a Research Soil Scientist with
the Forest Inventory and Analysis Program,
Northern Research Station, St. Paul, MN.
Christopher W. Woodall is a Research Forester
with the Forest Inventory and Analysis Program,
Northern Research Station, St. Paul, MN.
Brett J. Butler is a Research Social Scientist with
the Forest Inventory and Analysis Program,
Northern Research Station, Amherst, MA.
Barry T. Wilson is a Research Forester with the
Forest Inventory and Analysis Program, Northern
Research Station, St. Paul, MN.
Dan Kaisershot is a GIS Specialist with the Forest
Inventory and Analysis Program, Northern
Research Station, St. Paul, MN.

Haugen, David E.; Kangas, Michael; Crocker, Susan J.; Perry,Charles H.; Woodall, Christopher W.;
Butler, Brett J.; Wilson, Barry T.; Kaisershot, Dan J. 2009. North Dakota’s forests 2005. Resour.
Bull. NRS-31. Newtown Square, PA: U.S. Department of Agriculture, Forest Service, Northern
Research Station.
82 p.
The first completed annual inventory of North Dakota’s forests reports estimates of more than
724,000 acres of forest land. Information about forest attributes and forest health is presented along
with information on agents of change including changing land use patterns and the introduction of
nonnative plants, insects, and disease.
KEY WORDS: inventory, forest statistics, forest health
The U.S. Department of Agriculture (USDA) prohibits discrimination in all its programs and activities on the basis of
race, color, national origin, gender, religion, age, disability, political beliefs, sexual orientation, and marital or family
status. (Not all prohibited bases apply to all programs.) Persons with disabilities who require alternative means for
communication of program information (Braille, large print, audiotape, etc.) should contact USDA’s TARGET Center at
(202) 720-2600 (voice and TDD).
To file a complaint of discrimination, write USDA, Director, Office of Civil Rights, Room 326-W, Whitten Building, 14th
and Independence Avenue, SW, Washington, DC 20250-9410, or call (202) 720-5964 (voice or TDD). USDA is an equal
opportunity provider and employer.

“Capitalizing on the strengths of existing science capacityin the Northeast and Midwest to attain a more integrated,cohesive, landscape-scale research program”