North Dakota Transportation Handbook Dakota Transportation Handbook December 2012 ... System Size...
26
North Dakota Transportation Handbook December 2012 prepared by NORTH DAKOTA DEPARTMENT OF TRANSPORTATION BISMARCK, NORTH DAKOTA www.dot.nd.gov
Transcript of North Dakota Transportation Handbook Dakota Transportation Handbook December 2012 ... System Size...
North DakotaTransportation
Handbook
December 2012
prepared by
NORTH DAKOTADEPARTMENT OF TRANSPORTATION
BISMARCK, NORTH DAKOTAwww.dot.nd.gov
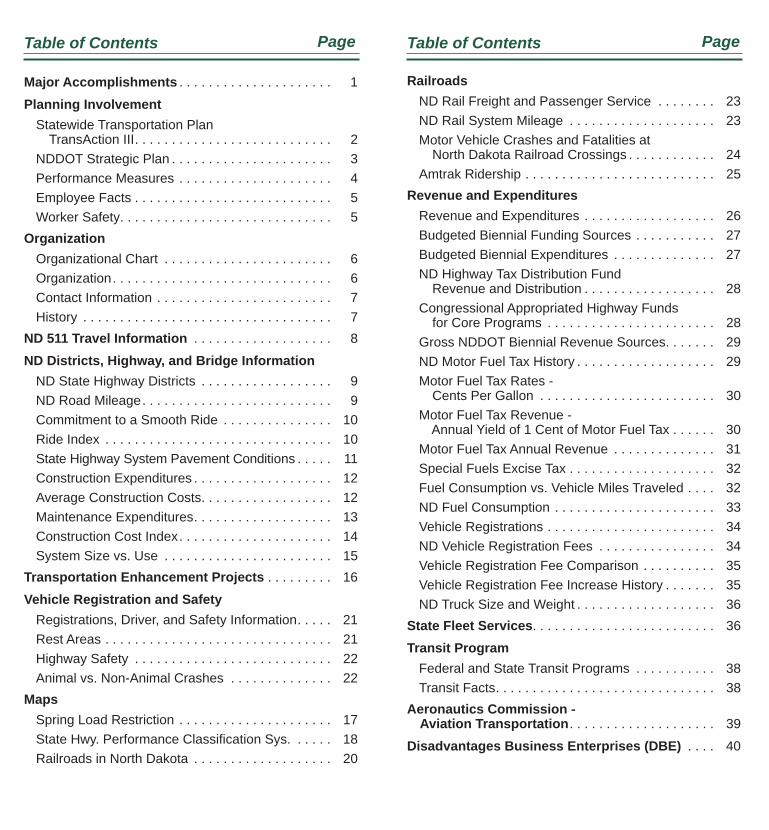
Table of Contents Table of ContentsPage Page
Major Accomplishments . . . . . . . . . . . . . . . . . . . . . 1
Planning InvolvementStatewide Transportation Plan TransAction III . . . . . . . . . . . . . . . . . . . . . . . . . . . 2NDDOT Strategic Plan . . . . . . . . . . . . . . . . . . . . . . 3Performance Measures . . . . . . . . . . . . . . . . . . . . . 4Employee Facts . . . . . . . . . . . . . . . . . . . . . . . . . . . 5Worker Safety . . . . . . . . . . . . . . . . . . . . . . . . . . . . . 5
OrganizationOrganizational Chart . . . . . . . . . . . . . . . . . . . . . . . 6Organization . . . . . . . . . . . . . . . . . . . . . . . . . . . . . . 6Contact Information . . . . . . . . . . . . . . . . . . . . . . . . 7History . . . . . . . . . . . . . . . . . . . . . . . . . . . . . . . . . . 7
ND 511 Travel Information . . . . . . . . . . . . . . . . . . . 8
ND Districts, Highway, and Bridge InformationND State Highway Districts . . . . . . . . . . . . . . . . . . 9ND Road Mileage . . . . . . . . . . . . . . . . . . . . . . . . . . 9Commitment to a Smooth Ride . . . . . . . . . . . . . . . 10Ride Index . . . . . . . . . . . . . . . . . . . . . . . . . . . . . . . 10State Highway System Pavement Conditions . . . . . 11Construction Expenditures . . . . . . . . . . . . . . . . . . . 12Average Construction Costs . . . . . . . . . . . . . . . . . . 12Maintenance Expenditures . . . . . . . . . . . . . . . . . . . 13Construction Cost Index . . . . . . . . . . . . . . . . . . . . . 14System Size vs. Use . . . . . . . . . . . . . . . . . . . . . . . 15
Transportation Enhancement Projects . . . . . . . . . 16
Vehicle Registration and SafetyRegistrations, Driver, and Safety Information . . . . . 21Rest Areas . . . . . . . . . . . . . . . . . . . . . . . . . . . . . . . 21Highway Safety . . . . . . . . . . . . . . . . . . . . . . . . . . . 22Animal vs. Non-Animal Crashes . . . . . . . . . . . . . . 22
MapsSpring Load Restriction . . . . . . . . . . . . . . . . . . . . . 17State Hwy. Performance Classifi cation Sys. . . . . . 18Railroads in North Dakota . . . . . . . . . . . . . . . . . . . 20
RailroadsND Rail Freight and Passenger Service . . . . . . . . 23ND Rail System Mileage . . . . . . . . . . . . . . . . . . . . 23Motor Vehicle Crashes and Fatalities at North Dakota Railroad Crossings . . . . . . . . . . . . 24Amtrak Ridership . . . . . . . . . . . . . . . . . . . . . . . . . . 25
Revenue and ExpendituresRevenue and Expenditures . . . . . . . . . . . . . . . . . . 26Budgeted Biennial Funding Sources . . . . . . . . . . . 27Budgeted Biennial Expenditures . . . . . . . . . . . . . . 27ND Highway Tax Distribution Fund Revenue and Distribution . . . . . . . . . . . . . . . . . . 28Congressional Appropriated Highway Funds for Core Programs . . . . . . . . . . . . . . . . . . . . . . . 28Gross NDDOT Biennial Revenue Sources . . . . . . . 29ND Motor Fuel Tax History . . . . . . . . . . . . . . . . . . . 29Motor Fuel Tax Rates - Cents Per Gallon . . . . . . . . . . . . . . . . . . . . . . . . 30Motor Fuel Tax Revenue - Annual Yield of 1 Cent of Motor Fuel Tax . . . . . . 30Motor Fuel Tax Annual Revenue . . . . . . . . . . . . . . 31Special Fuels Excise Tax . . . . . . . . . . . . . . . . . . . . 32Fuel Consumption vs. Vehicle Miles Traveled . . . . 32ND Fuel Consumption . . . . . . . . . . . . . . . . . . . . . . 33Vehicle Registrations . . . . . . . . . . . . . . . . . . . . . . . 34ND Vehicle Registration Fees . . . . . . . . . . . . . . . . 34Vehicle Registration Fee Comparison . . . . . . . . . . 35Vehicle Registration Fee Increase History . . . . . . . 35ND Truck Size and Weight . . . . . . . . . . . . . . . . . . . 36
State Fleet Services. . . . . . . . . . . . . . . . . . . . . . . . . 36
Transit ProgramFederal and State Transit Programs . . . . . . . . . . . 38Transit Facts . . . . . . . . . . . . . . . . . . . . . . . . . . . . . . 38
Aeronautics Commission - Aviation Transportation . . . . . . . . . . . . . . . . . . . . 39
Disadvantages Business Enterprises (DBE) . . . . 40
1
Welcome to the NDDOT Transportation Handbook
The 2012 Transportation Handbook will provide you a wealth of information about the North Dakota Department of Transportation and how we fulfill our mission of safely moving people and goods.
This booklet provides information about the organization including maintenance activities, construction, driver safety, traffic numbers, budget, motor vehicle, drivers license, transit program, and much more.
This is an exciting time of growth for the state and we are proud of all our department has accomplished. We know our work is not done. There is much more that will be asked of our agency, and we stand ready to respond. Our mission of safely moving people and goods can be seen in the value we place on quality roads and dedication to superior service for our citizens and visitors in the state.
To learn more about the NDDOT, please visit our Web site at www.dot.nd.gov or call us at 1-855-NDROADS (1-855-637-6237).
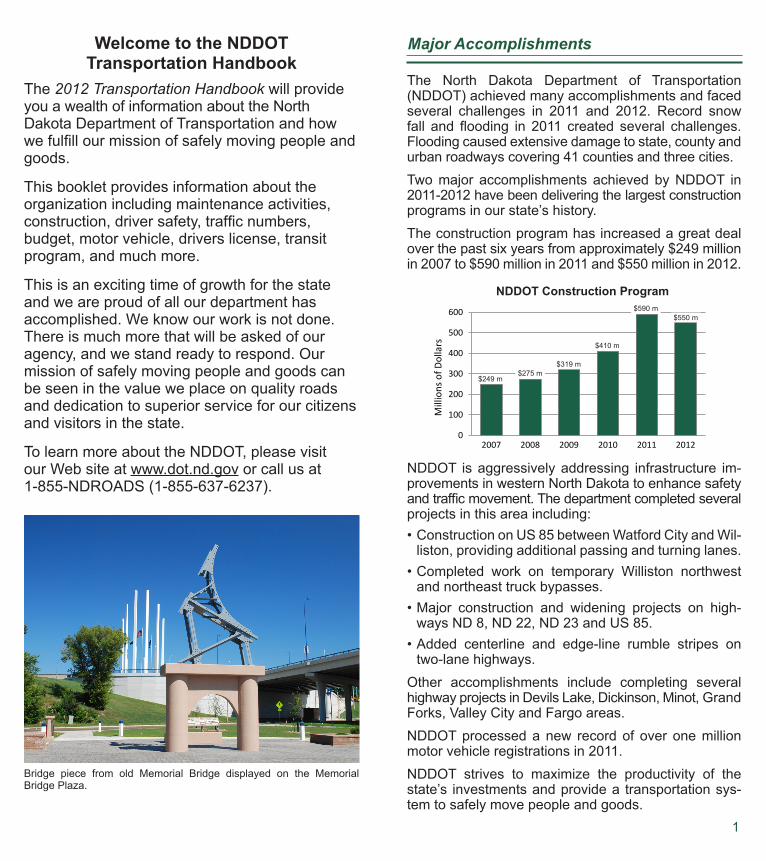
Bridge piece from old Memorial Bridge displayed on the Memorial Bridge Plaza.
Major Accomplishments
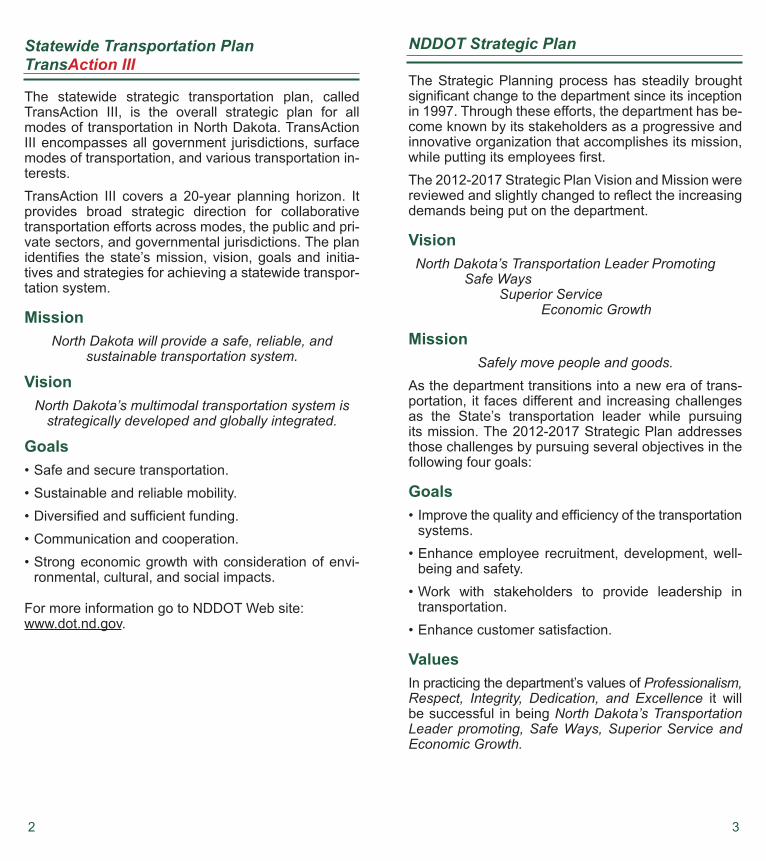
The North Dakota Department of Transportation (NDDOT) achieved many accomplishments and faced several challenges in 2011 and 2012. Record snow fall and flooding in 2011 created several challenges. Flooding caused extensive damage to state, county and urban roadways covering 41 counties and three cities.Two major accomplishments achieved by NDDOT in 2011-2012 have been delivering the largest construction programs in our state’s history. The construction program has increased a great deal over the past six years from approximately $249 million in 2007 to $590 million in 2011 and $550 million in 2012.
NDDOT is aggressively addressing infrastructure im-provements in western North Dakota to enhance safety and traffic movement. The department completed several projects in this area including:• Construction on US 85 between Watford City and Wil-
liston, providing additional passing and turning lanes.• Completed work on temporary Williston northwest
and northeast truck bypasses.• Major construction and widening projects on high-
ways ND 8, ND 22, ND 23 and US 85. • Added centerline and edge-line rumble stripes on
two-lane highways.Other accomplishments include completing several highway projects in Devils Lake, Dickinson, Minot, Grand Forks, Valley City and Fargo areas.NDDOT processed a new record of over one million motor vehicle registrations in 2011. NDDOT strives to maximize the productivity of the state’s investments and provide a transportation sys-tem to safely move people and goods.
0
100
200
300
400
500
600
2007 2008 2009 2010 2011 2012 M
illio
ns o
f Dol
lars
NDDOT Construction Program
$249 m$275 m
$319 m
$410 m
$590 m$550 m
32
Statewide Transportation PlanTransAction III
The statewide strategic transportation plan, called TransAction III, is the overall strategic plan for all modes of transportation in North Dakota. TransAction III encompasses all government jurisdictions, surface modes of transportation, and various transportation in-terests.TransAction III covers a 20-year planning horizon. It provides broad strategic direction for collaborative transportation efforts across modes, the public and pri-vate sectors, and governmental jurisdictions. The plan identifies the state’s mission, vision, goals and initia-tives and strategies for achieving a statewide transpor-tation system.
MissionNorth Dakota will provide a safe, reliable, and
sustainable transportation system.
VisionNorth Dakota’s multimodal transportation system is
strategically developed and globally integrated.
Goals• Safe and secure transportation.• Sustainable and reliable mobility.• Diversified and sufficient funding.• Communication and cooperation.• Strong economic growth with consideration of envi-
ronmental, cultural, and social impacts.
For more information go to NDDOT Web site: www.dot.nd.gov.
NDDOT Strategic Plan
The Strategic Planning process has steadily brought significant change to the department since its inception in 1997. Through these efforts, the department has be-come known by its stakeholders as a progressive and innovative organization that accomplishes its mission, while putting its employees first. The 2012-2017 Strategic Plan Vision and Mission were reviewed and slightly changed to reflect the increasing demands being put on the department.
Vision North Dakota’s Transportation Leader Promoting Safe Ways Superior Service Economic Growth
MissionSafely move people and goods.
As the department transitions into a new era of trans-portation, it faces different and increasing challenges as the State’s transportation leader while pursuing its mission. The 2012-2017 Strategic Plan addresses those challenges by pursuing several objectives in the following four goals:
Goals• Improve the quality and efficiency of the transportation
systems.• Enhance employee recruitment, development, well-
being and safety.• Work with stakeholders to provide leadership in
transportation.• Enhance customer satisfaction.
ValuesIn practicing the department’s values of Professionalism, Respect, Integrity, Dedication, and Excellence it will be successful in being North Dakota’s Transportation Leader promoting, Safe Ways, Superior Service and Economic Growth.
4 5
Performance Measures
In 2004, the North Dakota Department of Transporta-tion (NDDOT) identified performance measure out-come areas tied directly to the Strategic Plan. The 2012 report expands on these measures and helps the department revise its strategies to better enhance the NDDOT products and services.
Customer SatisfactionIn 2012, approximately 79 percent of customers sur-veyed were satisfied or very satisfied with how the de-partment was doing overall. The top four categories that ranged from approximately 84 percent to 90 per-cent in satisfied or very satisfied were road conditions, motor vehicle, drivers license, and communications.Stakeholder awareness of traffic safety issues, specifi-cally texting while driving and driving under the influ-ence, were listed as areas of concern.
Employee SurveyNDDOT conducts an employee survey every two years in order to gauge the health of the organization. The survey was first administered in 2002, the 2012 survey is the sixth survey conducted. Overall satisfaction in 2012 was at 3.44.
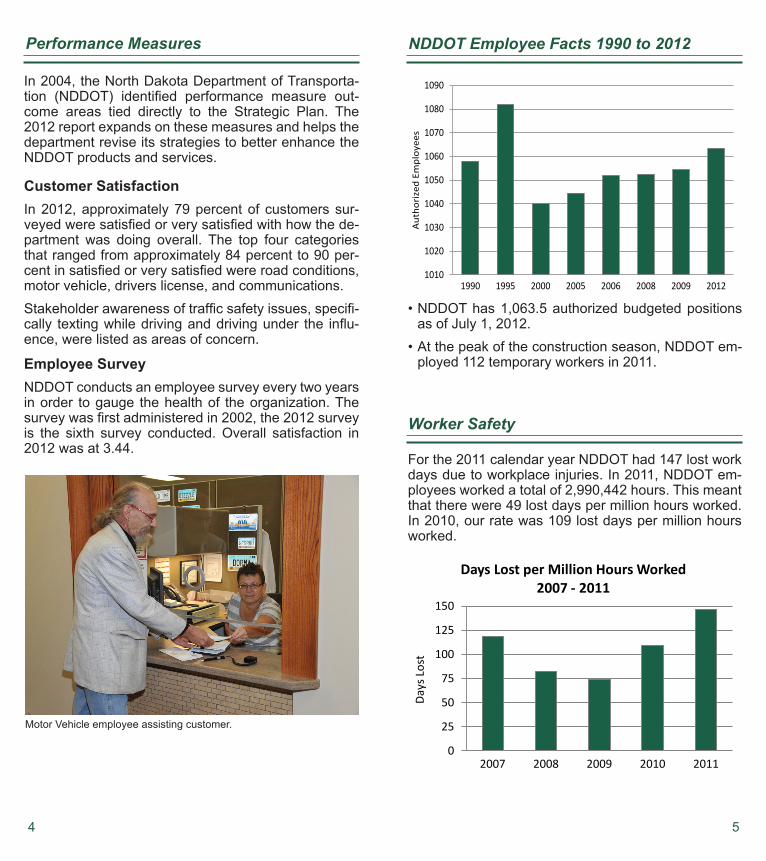
NDDOT Employee Facts 1990 to 2012
Worker Safety
1010
1020
1030
1040
1050
1060
1070
1080
1090
1990 1995 2000 2005 2006 2008 2009 2012
Aut
hori
zed
Empl
oyee
s
• NDDOT has 1,063.5 authorized budgeted positions as of July 1, 2012.
• At the peak of the construction season, NDDOT em-ployed 112 temporary workers in 2011.
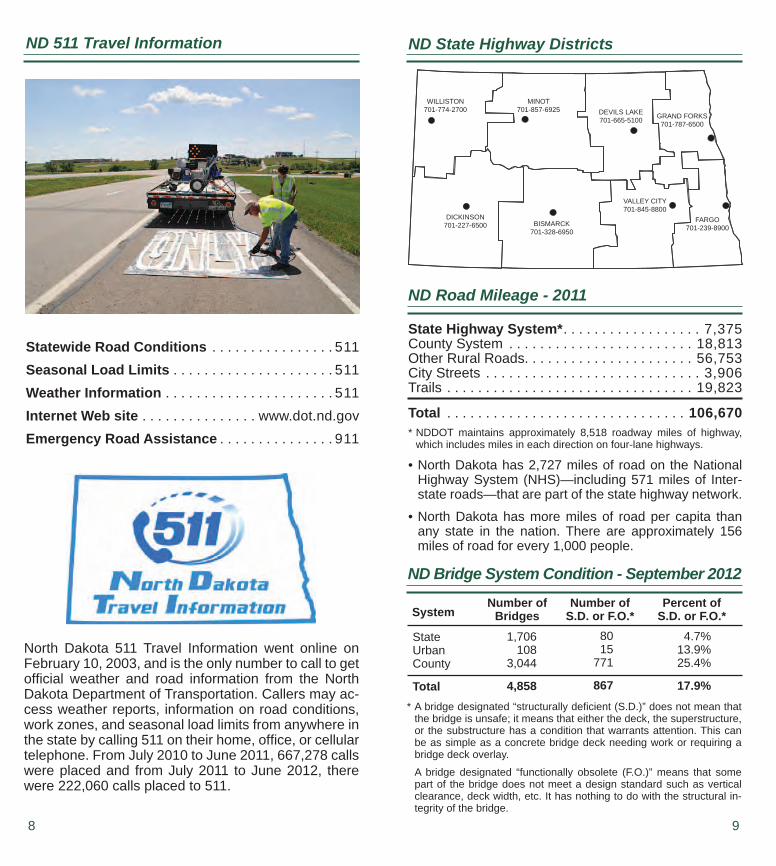
For the 2011 calendar year NDDOT had 147 lost work days due to workplace injuries. In 2011, NDDOT em-ployees worked a total of 2,990,442 hours. This meant that there were 49 lost days per million hours worked. In 2010, our rate was 109 lost days per million hours worked.
0
25
50
75
100
125
150
2007 2008 2009 2010 2011
Days
Los
t
Days Lost per Million Hours Worked 2007 - 2011
Motor Vehicle employee assisting customer.

6 7
Organizational Chart
Organization
DEPUTY DIRECTORFOR DRIVER &
VEHICLE SERVICES
DEPUTY DIRECTORFOR ENGINEERING
NDDOT DIRECTOR
GOVERNOR
DEPUTY DIRECTORFOR BUSINESSSUPPORT
FINANCIALMGMT.
HUMANRESOURCES
INFOR.TECHN.
DRIVERSLICENSE
MOTORVEHICLE
OFFICE OFOPERATIONS
FARGODISTRICT
BISMARCKDISTRICT
MAINT.
VALLEY CITYDISTRICT
CONST.SERVICES
GRANDFORKSDISTRICT
WILLISTONDISTRICT
STATEFLEET
SERVICES
DEVILS LAKEDISTRICT
DICKINSONDISTRICT
OFFICE OFTRANS.
PROGRAMS
OFFICE OFPROJECT
DEVELOPMENT
PLANNING &ASSET MGMT.
DESIGN
LEGAL
LOCALGOV.
BRIDGE
MATERIALS &RESEARCH
CIVILRIGHTS
COMM.
MINOTDISTRICT
GENERALCOUNSEL
AVIATIONSERVICES
ENVIRON. &TRANS.SERVICES
AUDITSERVICES
SAFETYPROGRAM.
•The ND State Highway Department was createdinMarch 1917 and became theNDDepartment ofTransportation(NDDOT)onJanuary1,1990.
•NDDOTisledbyadirectorappointedbythegover-nor.Thedepartmentalsohas threedeputydirectors:businesssupport,engineering,anddriverandvehicleservices.
•TheCentralOffice is inBismarck,witheightdistrictoffices: Bismarck, Devils Lake, Dickinson, Fargo,GrandForks,Minot,ValleyCity,andWilliston.
•NDDOToverseesthedevelopmentofsurfacetrans-portation(highways,bridges,rail,transit,pedestrianandbicyclepaths,andsaferoutestoschools)inthestate.
Contact Information
NDDOTToll-Free. . . . . . . . . . . . . . . . . . 1-855-637-6237MotorVehicleRegistrationandTitling. . .(701)328-2725DriversLicense. . . . . . . . . . . . . . . . . . . .(701)328-2600Mailingaddress: 608E.BoulevardAve. Bismarck,ND58505-0700Website: www.dot.nd.govEmail: [email protected].
History
1889 CreationofaNorthDakotastateofficededicatedtoroads.1911 FirstNDmotorvehiclelicenseplatesissued.1913 Firsthighwaycommissioncreated.1917 CreationofNorthDakotaStateHighwayDepartment.1922 NDhas20milesofgravelroads,1,000+milesofdirttrails.1933 Highwaycommissionabolished.F.A.Vogelbecomesfirst
independenthighwaycommissioner.1935 Firstdriver’slicenseissued.1956 First ND Interstate contracts let (US 10 between Valley
CityandJamestown).1977 NDisfirststateinuniontoletcontractsforfinalInterstate
highway(I-29betweenDraytonandPembina).1990 HighwayDepartmentbecomesDepartmentofTranspor-
tation.2002 NDDOTisleadagencyforcreationoffirststatewidestra-
tegictransportationplanforallmodesoftransportation.2006 TheFourBearsBridgenearNewTownwascompleted.2008 NDDOTcompleted the four-laningofUSHighway2be-
tweenWillistonandMinot.2009 NDDOTlaunchedtheNDteendrivers.comWebsiteaimed
toinformteensaboutsafedrivinghabits.2010 TheDrayton-RobbinBridge,crossingtheRedRivernear
Drayton,wascompleted.2011 Completed the first Super 2 project on US 85 between
WatfordCityandWilliston, featuringpassingand turninglanes.
2012 Completedtemporarybypassesonthenorthwestsideandnortheast side of Williston. Also, completed first round-aboutprojectonastatehighwayonND22nearKilldeer.
8 9
ND 511 Travel Information
Statewide Road Conditions . . . . . . . . . . . . . . . . 511Seasonal Load Limits . . . . . . . . . . . . . . . . . . . . . 511Weather Information . . . . . . . . . . . . . . . . . . . . . . 511Internet Web site . . . . . . . . . . . . . . . www.dot.nd.govEmergency Road Assistance . . . . . . . . . . . . . . . 911
North Dakota 511 Travel Information went online on February 10, 2003, and is the only number to call to get offi cial weather and road information from the North Dakota Department of Transportation. Callers may ac-cess weather reports, information on road conditions, work zones, and seasonal load limits from anywhere in the state by calling 511 on their home, offi ce, or cellular telephone. From July 2010 to June 2011, 667,278 calls were placed and from July 2011 to June 2012, there were 222,060 calls placed to 511.
ND State Highway Districts
ND Road Mileage - 2011
GRAND FORKS701-787-6500
DEVILS LAKE701-665-5100
MINOT701-857-6925
WILLISTON701-774-2700
FARGO701-239-8900
VALLEY CITY701-845-8800
BISMARCK701-328-6950
DICKINSON701-227-6500
State Highway System* . . . . . . . . . . . . . . . . . . 7,375County System . . . . . . . . . . . . . . . . . . . . . . . . 18,813Other Rural Roads. . . . . . . . . . . . . . . . . . . . . . 56,753City Streets . . . . . . . . . . . . . . . . . . . . . . . . . . . . 3,906Trails . . . . . . . . . . . . . . . . . . . . . . . . . . . . . . . . 19,823
Total . . . . . . . . . . . . . . . . . . . . . . . . . . . . . . . 106,670* NDDOT maintains approximately 8,518 roadway miles of highway,
which includes miles in each direction on four-lane highways.
• North Dakota has 2,727 miles of road on the National Highway System (NHS)—including 571 miles of Inter-state roads—that are part of the state highway network.
• North Dakota has more miles of road per capita than any state in the nation. There are approximately 156 miles of road for every 1,000 people.
ND Bridge System Condition - September 2012
StateUrbanCounty
Total
Number ofBridges
Number ofS.D. or F.O.*
Percent ofS.D. or F.O.*
1,706108
3,044
4,858
8015
771
867
4.7%13.9%25.4%
17.9%
System
* A bridge designated “structurally defi cient (S.D.)” does not mean that the bridge is unsafe; it means that either the deck, the superstructure, or the substructure has a condition that warrants attention. This can be as simple as a concrete bridge deck needing work or requiring a bridge deck overlay.
A bridge designated “functionally obsolete (F.O.)” means that some part of the bridge does not meet a design standard such as vertical clearance, deck width, etc. It has nothing to do with the structural in-tegrity of the bridge.
10 11
Commitment to a Smooth Ride
Ride Index - 2011
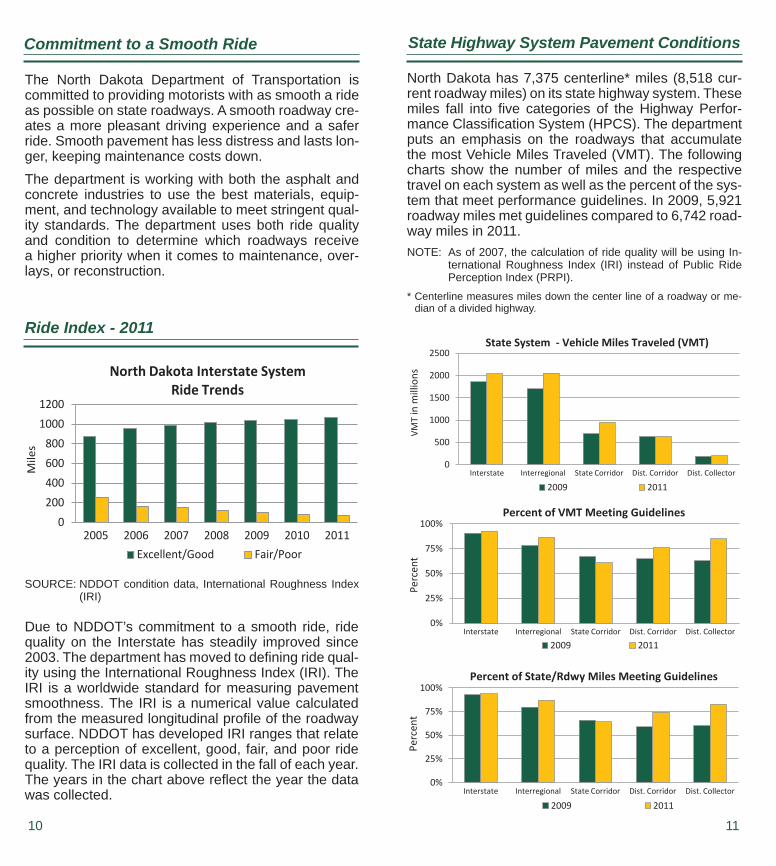
The North Dakota Department of Transportation is committed to providing motorists with as smooth a ride as possible on state roadways. A smooth roadway cre-ates a more pleasant driving experience and a safer ride. Smooth pavement has less distress and lasts lon-ger, keeping maintenance costs down.The department is working with both the asphalt and concrete industries to use the best materials, equip-ment, and technology available to meet stringent qual-ity standards. The department uses both ride quality and condition to determine which roadways receive a higher priority when it comes to maintenance, over-lays, or reconstruction.
Due to NDDOT’s commitment to a smooth ride, ride quality on the Interstate has steadily improved since 2003. The department has moved to defi ning ride qual-ity using the International Roughness Index (IRI). The IRI is a worldwide standard for measuring pavement smoothness. The IRI is a numerical value calculated from the measured longitudinal profi le of the roadway surface. NDDOT has developed IRI ranges that relate to a perception of excellent, good, fair, and poor ride quality. The IRI data is collected in the fall of each year. The years in the chart above refl ect the year the data was collected.
SOURCE: NDDOT condition data, International Roughness Index (IRI)
0 200 400 600 800
1000 1200
2005 2006 2007 2008 2009 2010 2011 Excellent/Good Fair/Poor
North Dakota Interstate System Ride Trends
Mile
s State Highway System Pavement Conditions
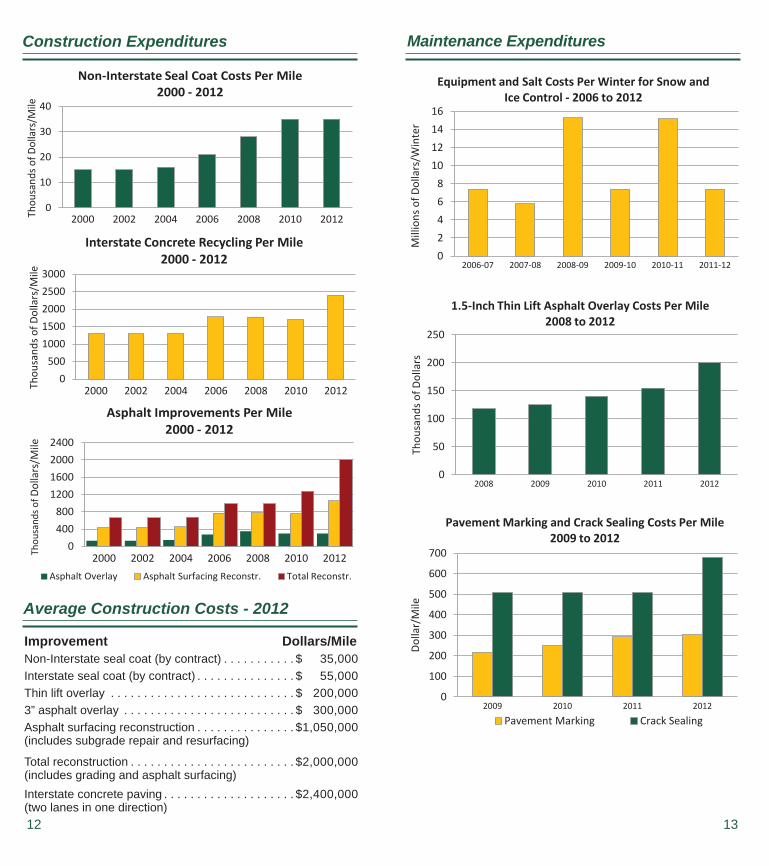
North Dakota has 7,375 centerline* miles (8,518 cur-rent roadway miles) on its state highway system. These miles fall into fi ve categories of the Highway Perfor-mance Classifi cation System (HPCS). The department puts an emphasis on the roadways that accumulate the most Vehicle Miles Traveled (VMT). The following charts show the number of miles and the respective travel on each system as well as the percent of the sys-tem that meet performance guidelines. In 2009, 5,921 roadway miles met guidelines compared to 6,742 road-way miles in 2011.NOTE: As of 2007, the calculation of ride quality will be using In-
ternational Roughness Index (IRI) instead of Public Ride Perception Index (PRPI).
* Centerline measures miles down the center line of a roadway or me-dian of a divided highway.
0
500
1000
1500
2000
2500
Interstate Interregional State Corridor Dist. Corridor Dist. Collector
2009 2011
State System - Vehicle Miles Traveled (VMT)
VMT
in m
illio
ns
0%
25%
50%
75%
100%
Interstate Interregional State Corridor Dist. Corridor Dist. Collector
2009 2011
Percent of VMT Meeting Guidelines
Perc
ent
0%
25%
50%
75%
100%
Interstate Interregional State Corridor Dist. Corridor Dist. Collector
2009 2011
Percent of State/Rdwy Miles Meeting Guidelines
Perc
ent
12 13
Construction Expenditures
0
10
20
30
40
2000 2002 2004 2006 2008 2010 2012 Thou
sand
s of D
olla
rs/M
ile
Non-Interstate Seal Coat Costs Per Mile 2000 - 2012
0 500
1000 1500 2000 2500 3000
2000 2002 2004 2006 2008 2010 2012 Thou
sand
s of D
olla
rs/M
ile
Interstate Concrete Recycling Per Mile 2000 - 2012
0 400 800
1200 1600 2000 2400
2000 2002 2004 2006 2008 2010 2012
Asphalt Improvements Per Mile 2000 - 2012
Asphalt Overlay Asphalt Surfacing Reconstr. Total Reconstr.
Thou
sand
s of D
olla
rs/M
ile
Average Construction Costs - 2012
Improvement Dollars/MileNon-Interstate seal coat (by contract) . . . . . . . . . . . $ 35,000Interstate seal coat (by contract) . . . . . . . . . . . . . . . $ 55,000Thin lift overlay . . . . . . . . . . . . . . . . . . . . . . . . . . . . $ 200,0003” asphalt overlay . . . . . . . . . . . . . . . . . . . . . . . . . . $ 300,000Asphalt surfacing reconstruction . . . . . . . . . . . . . . . $1,050,000(includes subgrade repair and resurfacing)
Total reconstruction . . . . . . . . . . . . . . . . . . . . . . . . . $2,000,000(includes grading and asphalt surfacing)Interstate concrete paving . . . . . . . . . . . . . . . . . . . . $2,400,000(two lanes in one direction)
Maintenance Expenditures
0 2 4 6 8
10 12 14 16
2006-07 2007-08 2008-09 2009-10 2010-11 2011-12
Mill
ions
of D
olla
rs/W
inte
r
Equipment and Salt Costs Per Winter for Snow and Ice Control - 2006 to 2012
0
50
100
150
200
250
2008 2009 2010 2011 2012
Thou
sand
s of D
olla
rs
1.5-Inch Thin Lift Asphalt Overlay Costs Per Mile 2008 to 2012
0
100
200
300
400
500
600
700
2009 2010 2011 2012
Dolla
r/M
ile
Pavement Marking and Crack Sealing Costs Per Mile 2009 to 2012
Pavement Marking Crack Sealing
14 15
Construction Cost Index
85
105
125
145
165
185
205
225
245
2003 2004 2005 2006 2007 2008 2009 2010 2011 2012
Dolla
rs
Dollars
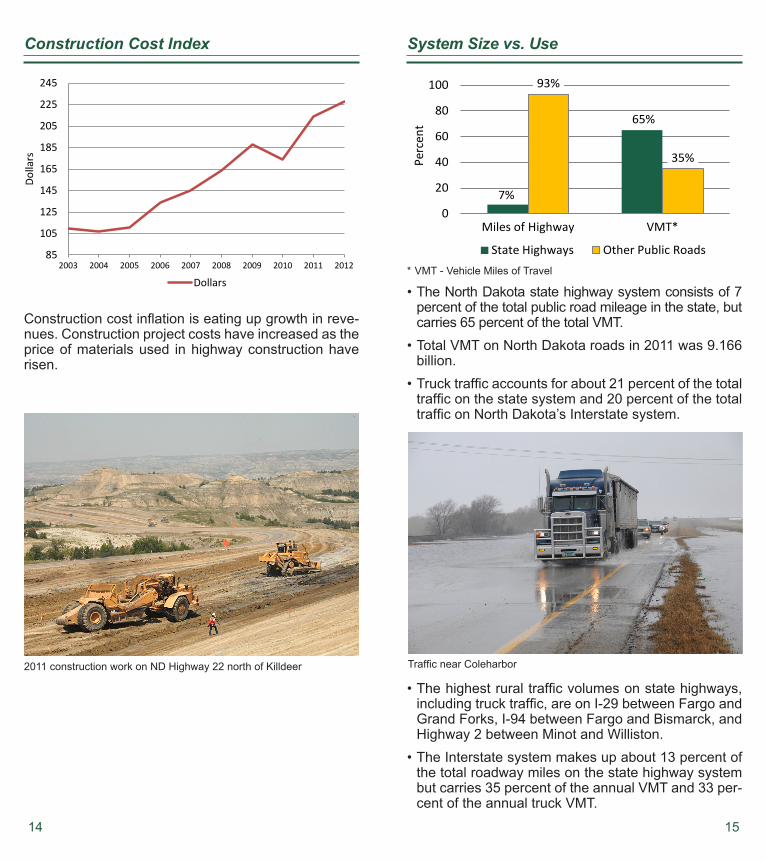
Construction cost inflation is eating up growth in reve-nues. Construction project costs have increased as the price of materials used in highway construction have risen.
System Size vs. Use
• The North Dakota state highway system consists of 7 percent of the total public road mileage in the state, but carries 65 percent of the total VMT.
• Total VMT on North Dakota roads in 2011 was 9.166 billion.
• Truck traffic accounts for about 21 percent of the total traffic on the state system and 20 percent of the total traffic on North Dakota’s Interstate system.
* VMT - Vehicle Miles of Travel
• The highest rural traffic volumes on state highways, including truck traffic, are on I-29 between Fargo and Grand Forks, I-94 between Fargo and Bismarck, and Highway 2 between Minot and Williston.
• The Interstate system makes up about 13 percent of the total roadway miles on the state highway system but carries 35 percent of the annual VMT and 33 per-cent of the annual truck VMT.
7%
65%
93%
35%
0
20
40
60
80
100
Miles of Highway VMT*
Perc
ent
State Highways Other Public Roads
Traffic near Coleharbor2011 construction work on ND Highway 22 north of Killdeer
16 21
Transportation Enhancement Projects
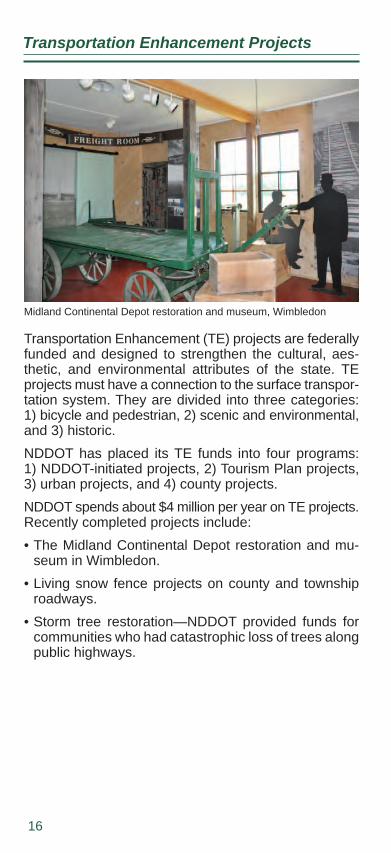
Transportation Enhancement (TE) projects are federally funded and designed to strengthen the cultural, aes-thetic, and environmental attributes of the state. TE projects must have a connection to the surface transpor-tation system. They are divided into three categories: 1) bicycle and pedestrian, 2) scenic and environmental, and 3) historic.NDDOT has placed its TE funds into four programs: 1) NDDOT-initiated projects, 2) Tourism Plan projects, 3) urban projects, and 4) county projects.NDDOT spends about $4 million per year on TE projects. Recently completed projects include:• The Midland Continental Depot restoration and mu-
seum in Wimbledon.• Living snow fence projects on county and township
roadways.• Storm tree restoration—NDDOT provided funds for
communities who had catastrophic loss of trees along public highways.
Midland Continental Depot restoration and museum, Wimbledon
Registrations, Driver, and Safety Information
Rest Areas
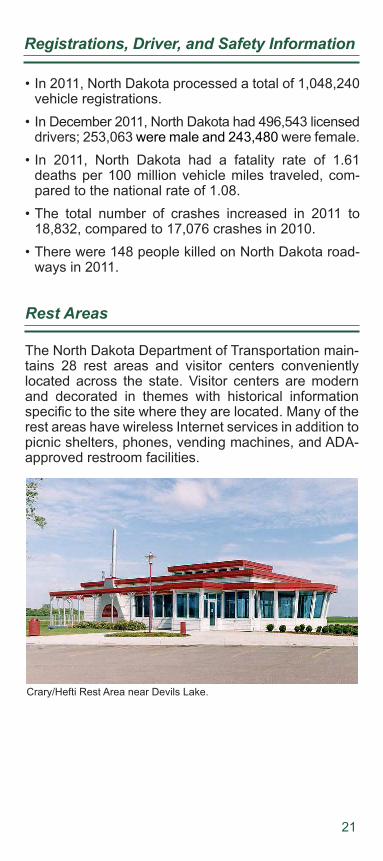
The North Dakota Department of Transportation main-tains 28 rest areas and visitor centers conveniently located across the state. Visitor centers are modern and decorated in themes with historical information specifi c to the site where they are located. Many of the rest areas have wireless Internet services in addition to picnic shelters, phones, vending machines, and ADA-approved restroom facilities.
Devils Lake Rest Area
• In 2011, North Dakota processed a total of 1,048,240 vehicle registrations.
• In December 2011, North Dakota had 496,543 licensed drivers; 253,063 were male and 243,480 were female.
• In 2011, North Dakota had a fatality rate of 1.61 deaths per 100 million vehicle miles traveled, com-pared to the national rate of 1.08.
• The total number of crashes increased in 2011 to 18,832, compared to 17,076 crashes in 2010.
• There were 148 people killed on North Dakota road-ways in 2011.
17
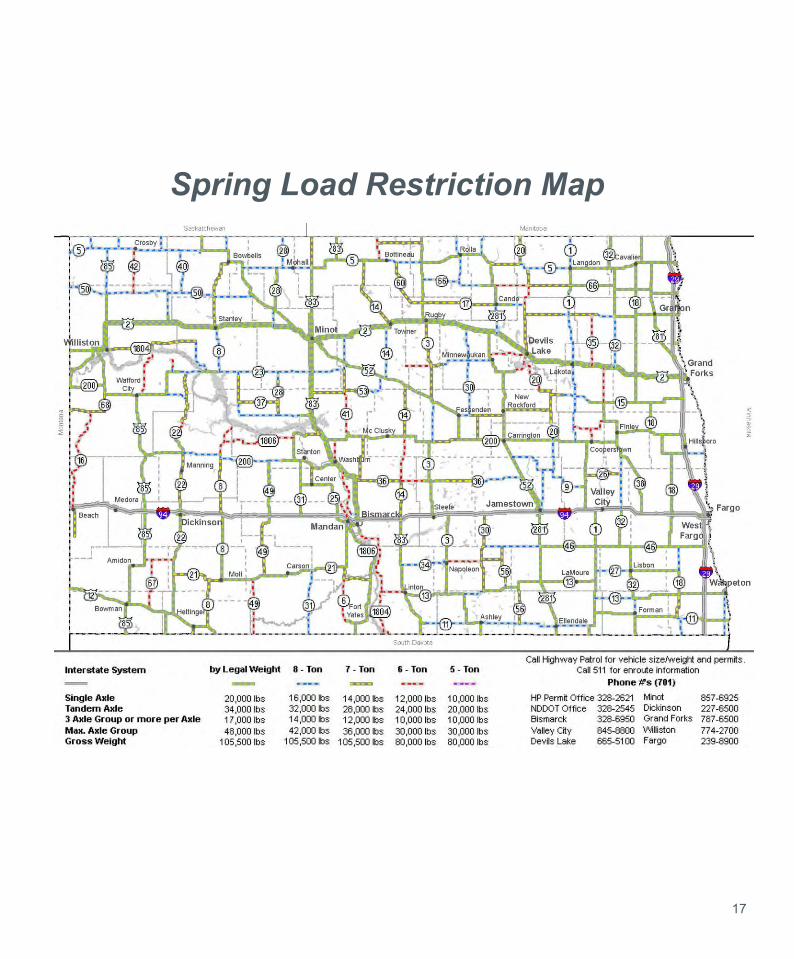
Spring Load Restriction Map
18
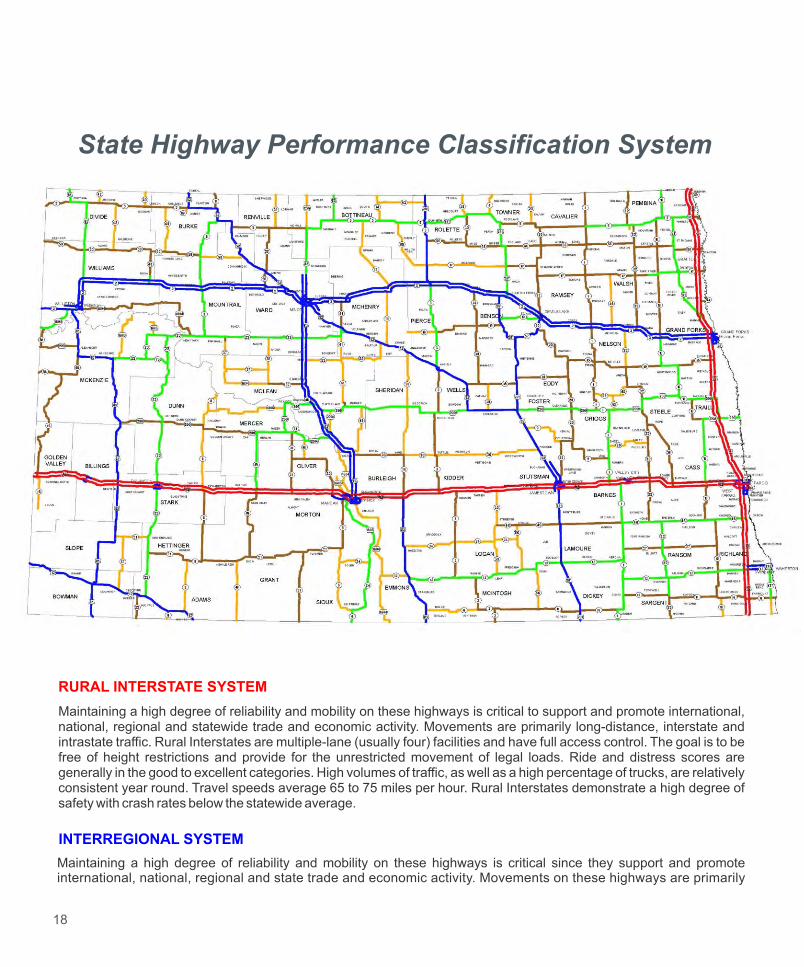
RURAL INTERSTATE SYSTEM
Maintaining a high degree of reliability and mobility on these highways is critical to support and promote international, national, regional and statewide trade and economic activity. Movements are primarily long-distance, interstate and intrastate traffic. Rural Interstates are multiple-lane (usually four) facilities and have full access control. The goal is to be free of height restrictions and provide for the unrestricted movement of legal loads. Ride and distress scores are generally in the good to excellent categories. High volumes of traffic, as well as a high percentage of trucks, are relatively consistent year round. Travel speeds average 65 to 75 miles per hour. Rural Interstates demonstrate a high degree of safety with crash rates below the statewide average.
INTERREGIONAL SYSTEM
State Highway Performance Classification System
Maintaining a high degree of reliability and mobility on these highways is critical since they support and promote international, national, regional and state trade and economic activity. Movements on these highways are primarily
long-distance, interstate and intrastate traffic. Interregional System highways are either two-lane or multiple lane facilities. Segments or specific locations may have partially controlled access. The goal is to be free of height restrictions, provide for the unrestricted movement of legal loads, and have limited passing restrictions. Accommodating truck traffic is a priority. Ride and distress scores are generally in the good to excellent categories. Moderate to high volumes of traffic, as well as a high percentage of trucks, are relatively consistent year round. Daytime travel speeds average 60 to 70 miles per hour. The Interregional System demonstrates a high degree of safety with crash rates below the statewide average.
STATE CORRIDOR
Maintaining a moderately high degree of reliability and mobility on these highways is critical since they support the movement of agricultural commodities, freight, and manufactured products within the state. State Corridors provide connectivity between lower and higher level roadways. Movements on these highways are primarily medium-distance intrastate traffic. State Corridors are typically 2-lane facilities and have segments or locations with partially controlled access. These highways have either paved or aggregate shoulders, some segments may have limited passing zone restrictions, and load limits are restricted by legal weights. Bridges and overhead structures provide for the unrestricted movement of legal loads. Ride and distress scores are generally in the good category. Moderately high volumes of traffic are relatively consistent year round. Daytime travel speeds average 60 to 65 miles per hour. State Corridors demonstrate a moderately high degree of safety with crash rates less than the statewide average.
DISTRICT CORRIDOR
Maintaining a moderate degree of reliability and mobility on these highways is desirable. Movements on these highways are primarily short to medium distance intrastate traffic. District Corridors are two lane facilities. Generally, access control is not purchased. These highways have narrow paved or gravel shoulders, segments with restricted passing zones, and may be restricted to 8- or 7-ton seasonal load limits. Bridge structures provide for the unrestricted movement of legal loads. Ride and distress scores are generally in the fair and good categories. Moderate volumes of traffic are relatively consistent year round. Occasional increases in seasonal traffic volumes and truck movements occur. Daytime travel speeds average 55 to 65 miles per hour. District Corridors are safe highways with crash rates at or near the statewide average.
DISTRICT COLLECTOR
Maintaining reliability and mobility on these highways is a lower priority. These highways are generally short routes that provide connectivity to the higher road level systems. Movements on these highways are primarily short distance, local, farm to market traffic. District Collectors are two lane facilities. Generally, access control is not purchased. These highways generally have no shoulders. Segments with restricted passing zones exist. Seasonal load limits of 7 or 6 tons are normal, although some segments may have year round load restrictions. Bridge structures provide for the movement of typical legal loads. Some structures have load, height, and width restrictions. Ride and distress scores are generally in the fair category. Low volumes of traffic are normal year round. Small increases in truck movements may occur during spring planting and fall harvest periods. Daytime travel speeds average 50 to 55 miles per hour. District Collectors are moderately safe highways with crash rates near the statewide average.
19
State Highway Performance Classification System (cont.)
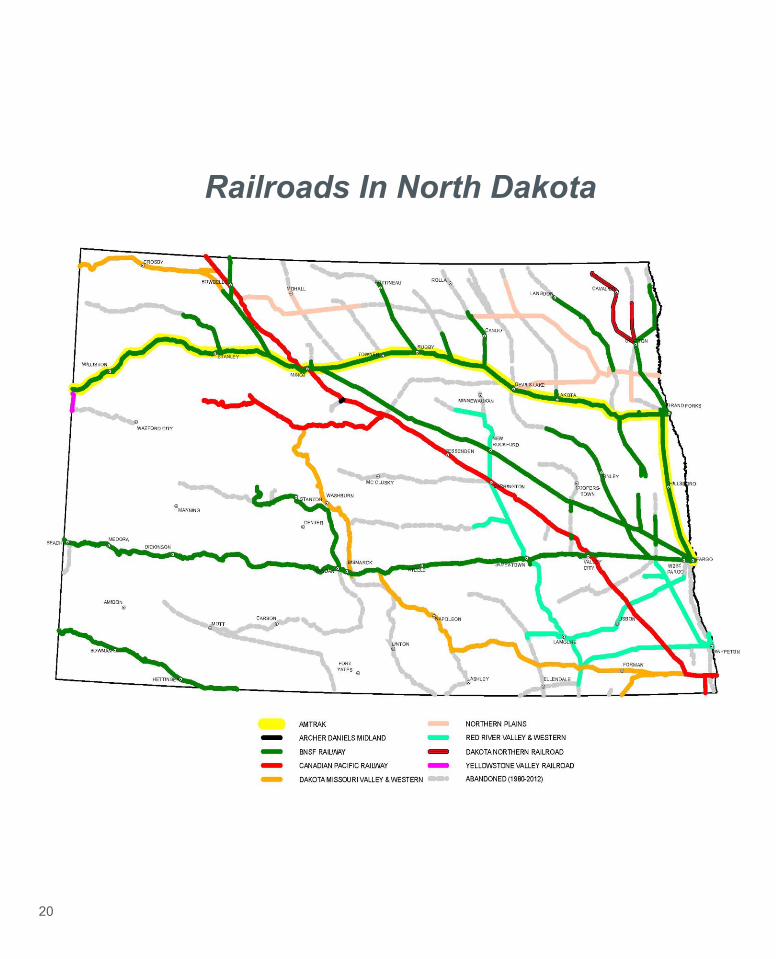
Railroads In North Dakota
20
21
Registrations, Driver, and Safety Information
Rest Areas
The North Dakota Department of Transportation main-tains 28 rest areas and visitor centers conveniently located across the state. Visitor centers are modern and decorated in themes with historical information specific to the site where they are located. Many of the rest areas have wireless Internet services in addition to picnic shelters, phones, vending machines, and ADA-approved restroom facilities.
Crary/Hefti Rest Area near Devils Lake.
• In 2011, North Dakota processed a total of 1,048,240 vehicle registrations.
• In December 2011, North Dakota had 496,543 licensed drivers; 253,063 were male and 243,480 were female.
• In 2011, North Dakota had a fatality rate of 1.61 deaths per 100 million vehicle miles traveled, com-pared to the national rate of 1.08.
• The total number of crashes increased in 2011 to 18,832, compared to 17,076 crashes in 2010.
• There were 148 people killed on North Dakota road-ways in 2011.

22 23
Highway Safety - 1990 to 2011
Animal vs. Non-Animal Crashes -2007-2011
Year 2007 2008 2009 2010 2011
Deer Small Animal Other Large Game Farm Animals
Animal Non-Animal
Total Crashes
4,118 76 33
113
4,340 11,889
16,229
3,656 99 21 91
3,867 12,520
16,387
3,519 92 43
134
3,788 13,885
17,673
2,887 85 38
126
3,136 15,687
18,823
2,949 83 41
100
3,173 13,903
17,076
2011 Fatalities
148 32,310
1.61 1.08
North Dakota National
2011 Fatality Rate*
DEATHS AND DEATH RATES - How Do We Compare?
* Deaths per 100 million VMT (Vehicle Miles of Travel)
In 2011, 148 people died on North Dakota roadways, 43 more than in 2010.•43.1 percent of all North Dakota motor vehicle fatal
crashes involved alcohol, compared to 52.1 percent in 2010.
•69 percent of individuals killed in motor vehicle crash-es were not wearing seat belts, compared to 60 per-cent in 2010.
•36.2 percent of fatal motor vehicle crashes were speed related/driving too fast for conditions, a slight decrease from 2010.
ND Rail Freight and Passenger Service
•NDDOT administers a rail loan program with two revolving loan funds, Local Rail Freight Assistance (LRFA) and Freight Rail Improvement Program (FRIP). These funds are used for loans to support projects that improve the North Dakota rail system.
•The LRFA and FRIP loan funds have provided $36.1 million for 48 projects that have rehabilitated approxi-mately 680 miles of branch line track, constructed nine facility access spurs, and supported three major flooddisasterrecoveryprojects.
•There are 3,460 at-grade public highway rail cross-ings in the state, 16.4 percent of which have active warning devices. NDDOT normally funds 8 to 10 crossing improvements annually, as resources per-mit.
•Since 1980, 1,751 miles of rail line in North Dakota have been abandoned. This loss of rail service has put an additional strain on our state and local road network.¹
•North Dakota ranks 15th among the states in rail tons (35.6 million) originated in the state.²
•North Dakota ranks 35th among the states in rail tons (14.4 million) terminated in the state.³
1 NDDOT Public Service Commission (NDPSC) and NDDOT Rail Plan.2 Association of American Railroads (AAR), from the Surface Transportation
Board’s 2008 Carload Waybill Sample, the most recent available.3 ibid4 Total miles and Trackage Rights miles are from the NDPSC, from annual reports filedbytherailroadsforcalendaryear2010.
ND Rail System Mileage - 20114
RailroadsMain- line
591 121 424 50
297 453
9
16 8
51 - -
87 -
1,714 482 475 50
297 540
9
Branch-line
Trackage Rights
Total Miles Operated
1,107 353
- - - - -
Total 1,460 1,945 162 3,567
BNSF CPR DMVW DNRR NPR RRVW YSVR
0 1 2 3 4 5 6 7 8 9 10
1 1.1 1.2 1.3 1.4 1.5 1.6 1.7 1.8 1.9
2
1990 1993 1996 1999 2002 2005 2008 2011
Billions of Miles N
D Fa
talit
y Ra
te
Fatality Rate VMT
2524
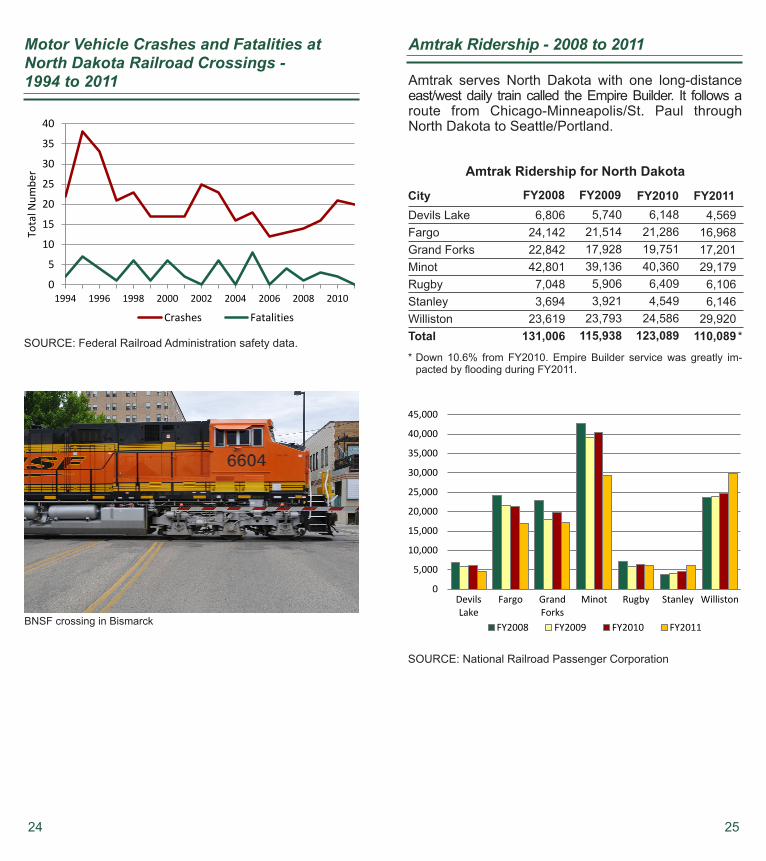
Motor Vehicle Crashes and Fatalities atNorth Dakota Railroad Crossings - 1994 to 2011
0
5
10
15
20
25
30
35
40
1994 1996 1998 2000 2002 2004 2006 2008 2010
Tota
l Num
ber
Crashes Fatalities
SOURCE: Federal Railroad Administration safety data.
Amtrak Ridership - 2008 to 2011
Amtrak serves North Dakota with one long-distance east/west daily train called the Empire Builder. It follows a route from Chicago-Minneapolis/St. Paul through North Dakota to Seattle/Portland.
City FY2008 FY2009 FY2010 FY2011Devils Lake Fargo Grand Forks Minot Rugby Stanley Williston Total
6,806 24,142 22,842 42,801
7,048 3,694
23,619 131,006
5,740 21,514 17,928 39,136
5,906 3,921
23,793 115,938
6,148 21,286 19,751 40,360
6,409 4,549
24,586 123,089
4,569 16,968 17,201 29,179
6,106 6,146
29,920 110,089 *
* Down 10.6% from FY2010. Empire Builder service was greatly im-pacted by flooding during FY2011.
Amtrak Ridership for North Dakota
SOURCE: National Railroad Passenger Corporation
0
5,000
10,000
15,000
20,000
25,000
30,000
35,000
40,000
45,000
Devils Lake
Fargo Grand Forks
Minot Rugby Stanley Williston
FY2008 FY2009 FY2010 FY2011 BNSF crossing in Bismarck

2726
Revenue and Expenditures
•Historically,NorthDakotahasreceivedabout$2ofFed-eralHighway funds forevery$1NorthDakotadriverspaidintotheFederalHighwayTrustFund.
•To fund highway improvement projects, NorthDakotamustmatchfederal-aidhighwayfundsataratioofabout4:1,or80percentfederaland20percentstate.
•Themajorsourcesofrevenuegoingintothestatehigh-waytaxdistributionfundinclude:gasoline,gasoholanddiesel fuel taxes,motor vehicle registration fees, andthespecialfuelsexcisetax.The2011legislativesessionprovideda$5.5millionperbienniumtransfer fromthehighwaytaxdistributionfundtothestatehighwayfundfor the purposeof providing administrative assistancetoothertransferees.Afterthefirst$5.5milliontransfer,theremaininghighwaytaxdistributionfundisallocatedin the followingmanner: 61.3percent to thestate,22percent to thecounties,12.5percent to thecities,2.7percent to townships,and1.5percent topublic trans-portation.
•UnderTEA-21(1998-2003),NorthDakota’sannualav-erage obligational authority approached $160 million.UnderSAFETEA-LU(2005-2011)NDDOT’sannualav-erageobligationauthoritywas$235million.
•From1994through2012,NorthDakotareceivedabout$645.2millioninfederalemergencyrelieffundstorepairroadsdamagedbyflooding.
• In2012, the total taxonagallonofgasoline inNorthDakotawas41.4cents.Ofthat,23centsisstatetaxand18.4centsisfederaltax.
•TheNDDOTmaintenanceprogram is fundedbystatefunds.
•The Federal Highway Administration estimates about30jobsintheprivatesectoraredirectlyassociatedwithevery$1millionthefederalgovernmentspendsintrans-portationprojects.
•A recent study conducted by the Upper Great PlainsTransportation Institute in Fargo revealed that invest-inginourtransportationsystemreturns$4.90forevery$1spent.Thestudyshowsthataninvestmentintrans-portationisaninvestment inNorthDakota’seconomicfuture.
Budgeted Biennial Funding Sources - 2011 to 2013
Budgeted Biennial Expenditures - 2011 to 2013
39%
11% 5%
3% 4%
3%
5% 1%
7%
22%
Total of All Sources: $1,669.3 Million
80%
4% 3% 1%
1% 10% 1%
Total Budget: $1,668.9 Million
FederalRevenue39%FuelTaxes11%MotorVehicleRevenue5%LocalGov’tReimbursements3%FleetRevenue4%
DriversLicense,Fee,Permits3%Misc.HighwayFundRevenue5%ARRAHighwayFunding1%Borrowing7%ExtraordinarySt.Hwy.Maint.,County,TownshipRd.Const.22%
HighwayPrograms80%StateFleetprogram4%AdministrativeProgram3%MotorVehicleProgram1%
DriversLicenseProgram1%MaintenanceProgram10%ARRAHighwayFunding1%
NOTE: NDDOT funding sources, as passed by the 2011 Legis-lature,areslightlymore than therelatedbudget (approxi-mately$400,000).NDDOTcanspenditsbudgetonlytotheextentofavailablerevenues.Intheeventthattherevenuesdonotcomeinaheadoftheprojections,NDDOTwillleavethatamountofthebudgetunexpended.
28 29
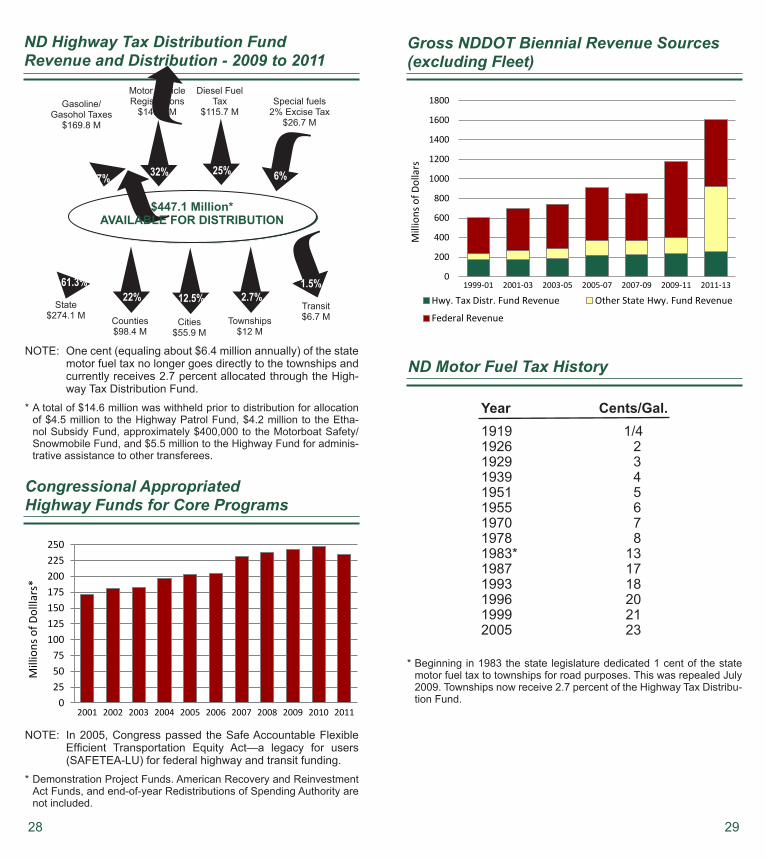
ND Highway Tax Distribution FundRevenue and Distribution - 2009 to 2011
Congressional AppropriatedHighway Funds for Core Programs
Motor Vehicle Registrations
$149.5 M
Diesel Fuel Tax
$115.7 MSpecial fuels
2% Excise Tax $26.7 M
Gasoline/ Gasohol Taxes
$169.8 M
State $274.1 M
Transit $6.7 MCities
$55.9 M
$447.1 Million* AVAILABLE FOR DISTRIBUTION
37% 6%32% 25%
61.3% 1.5%12.5%
NOTE: One cent (equaling about $6.4 million annually) of the state motor fuel tax no longer goes directly to the townships and currently receives 2.7 percent allocated through the High-way Tax Distribution Fund.
* A total of $14.6 million was withheld prior to distribution for allocation of $4.5 million to the Highway Patrol Fund, $4.2 million to the Etha-nol Subsidy Fund, approximately $400,000 to the Motorboat Safety/Snowmobile Fund, and $5.5 million to the Highway Fund for adminis-trative assistance to other transferees.
NOTE: In 2005, Congress passed the Safe Accountable Flexible Efficient Transportation Equity Act—a legacy for users (SAFETEA-LU) for federal highway and transit funding.
* Demonstration Project Funds. American Recovery and Reinvestment Act Funds, and end-of-year Redistributions of Spending Authority are not included.
0 25 50 75
100 125 150 175 200 225 250
2001 2002 2003 2004 2005 2006 2007 2008 2009 2010 2011
Mill
ions
of D
ollla
rs*
Gross NDDOT Biennial Revenue Sources(excluding Fleet)
0
200
400
600
800
1000
1200
1400
1600
1800
1999-01 2001-03 2003-05 2005-07 2007-09 2009-11 2011-13
Mill
ions
of D
olla
rs
Hwy. Tax Distr. Fund Revenue Other State Hwy. Fund Revenue
Federal Revenue
ND Motor Fuel Tax History
* Beginning in 1983 the state legislature dedicated 1 cent of the state motor fuel tax to townships for road purposes. This was repealed July 2009. Townships now receive 2.7 percent of the Highway Tax Distribu-tion Fund.
Year1919 1926 1929 1939 1951 1955 1970 1978 1983* 1987 1993 1996 1999 2005
Cents/Gal.1/4 2 3 4 5 6 7 8 13 17 18 20 21 23
Counties $98.4 M
22%
Townships $12 M
2.7%
3130
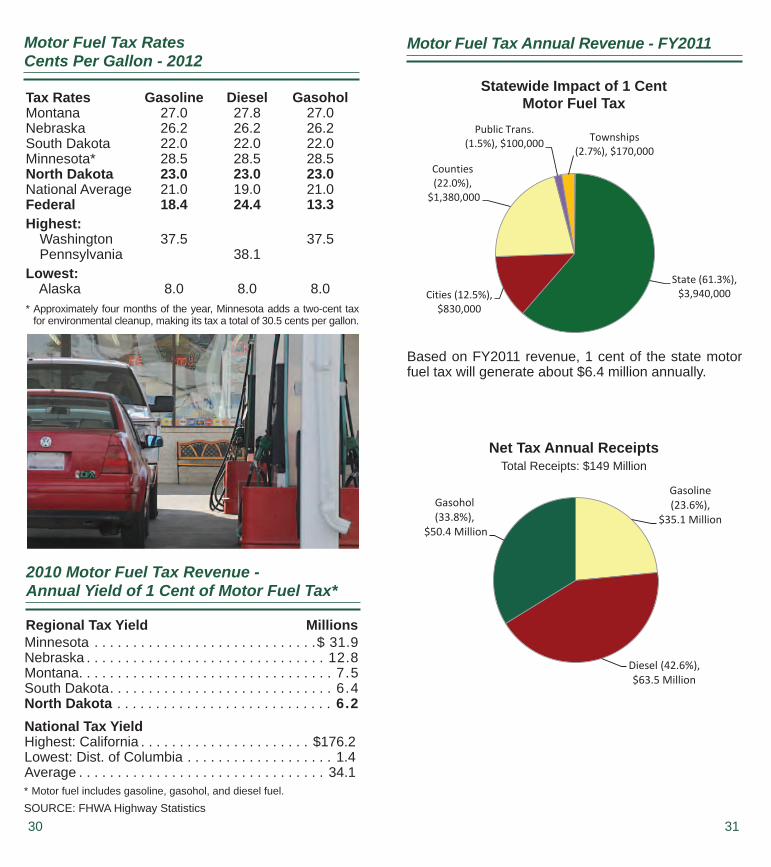
Motor Fuel Tax RatesCents Per Gallon - 2012
Tax RatesMontanaNebraskaSouth DakotaMinnesota*North DakotaNational AverageFederalHighest: Washington PennsylvaniaLowest: Alaska
Gasoline27.026.222.028.523.021.018.4
37.5
8.0
Diesel27.826.222.028.523.019.024.4
38.1
8.0
Gasohol27.026.222.028.523.021.013.3
37.5
8.0* Approximately four months of the year, Minnesota adds a two-cent tax
for environmental cleanup, making its tax a total of 30.5 cents per gallon.
2010 Motor Fuel Tax Revenue -Annual Yield of 1 Cent of Motor Fuel Tax*
Minnesota . . . . . . . . . . . . . . . . . . . . . . . . . . . . .$ 31.9Nebraska . . . . . . . . . . . . . . . . . . . . . . . . . . . . . . . 12.8Montana. . . . . . . . . . . . . . . . . . . . . . . . . . . . . . . . . 7.5South Dakota . . . . . . . . . . . . . . . . . . . . . . . . . . . . . 6.4North Dakota . . . . . . . . . . . . . . . . . . . . . . . . . . . . 6.2National Tax YieldHighest: California . . . . . . . . . . . . . . . . . . . . . . $176.2Lowest: Dist. of Columbia . . . . . . . . . . . . . . . . . . . 1.4Average . . . . . . . . . . . . . . . . . . . . . . . . . . . . . . . . 34.1
Regional Tax Yield Millions
* Motor fuel includes gasoline, gasohol, and diesel fuel.SOURCE: FHWA Highway Statistics
Motor Fuel Tax Annual Revenue - FY2011
State (61.3%), $3,940,000 Cities (12.5%),
$830,000
Counties (22.0%),
$1,380,000
Public Trans. (1.5%), $100,000 Townships
(2.7%), $170,000
Gasoline (23.6%),
$35.1 Million
Diesel (42.6%), $63.5 Million
Gasohol (33.8%),
$50.4 Million
Statewide Impact of 1 CentMotor Fuel Tax
Net Tax Annual ReceiptsTotal Receipts: $149 Million
Based on FY2011 revenue, 1 cent of the state motor fuel tax will generate about $6.4 million annually.
3332
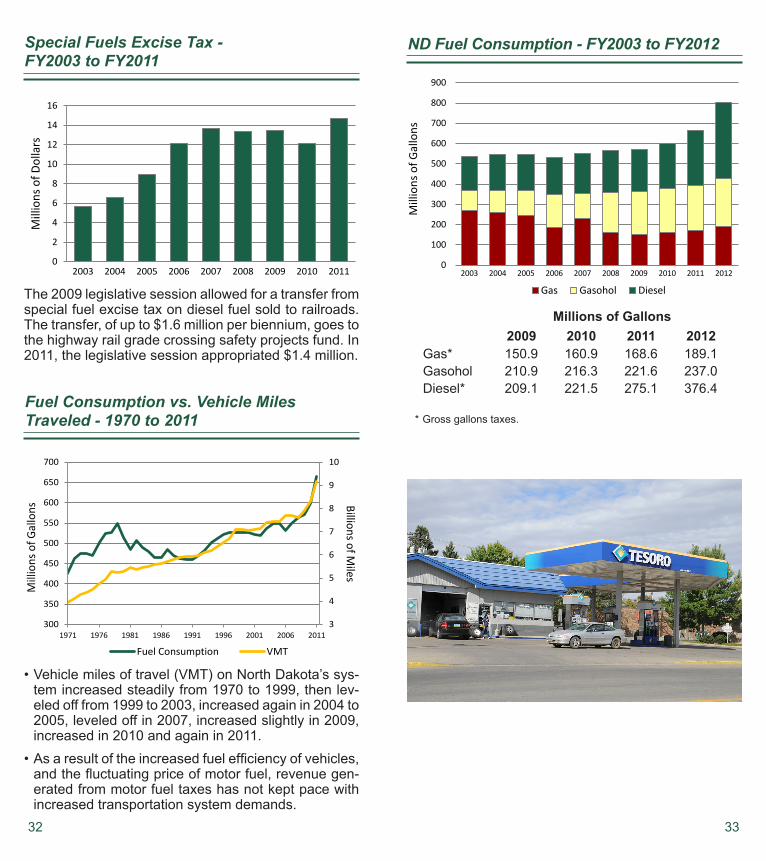
Special Fuels Excise Tax -FY2003 to FY2011
0
2
4
6
8
10
12
14
16
2003 2004 2005 2006 2007 2008 2009 2010 2011
Mill
ions
of D
olla
rs
The 2009 legislative session allowed for a transfer from special fuel excise tax on diesel fuel sold to railroads. The transfer, of up to $1.6 million per biennium, goes to the highway rail grade crossing safety projects fund. In 2011, the legislative session appropriated $1.4 million.
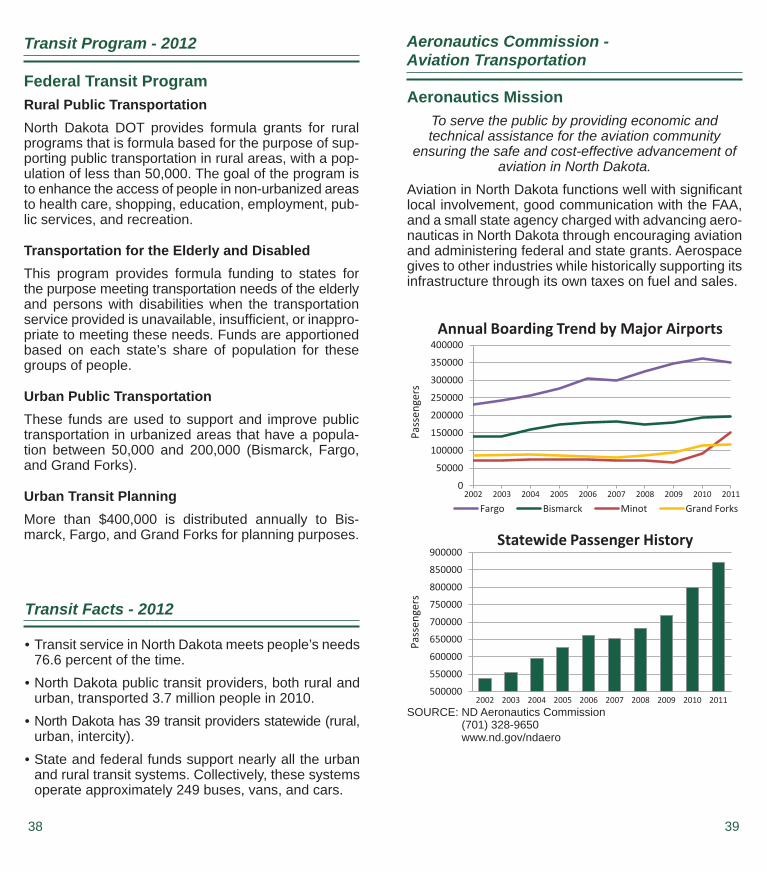
•Vehicle miles of travel (VMT) on North Dakota’s sys-tem increased steadily from 1970 to 1999, then lev-eled off from 1999 to 2003, increased again in 2004 to 2005, leveled off in 2007, increased slightly in 2009, increased in 2010 and again in 2011.
•Asaresultoftheincreasedfuelefficiencyofvehicles,andthefluctuatingpriceofmotorfuel,revenuegen-erated from motor fuel taxes has not kept pace with increased transportation system demands.
3
4
5
6
7
8
9
10
300
350
400
450
500
550
600
650
700
1971 1976 1981 1986 1991 1996 2001 2006 2011
Mill
ions
of G
allo
ns
Billions of Miles
Fuel Consumption VMT
Fuel Consumption vs. Vehicle Miles Traveled - 1970 to 2011
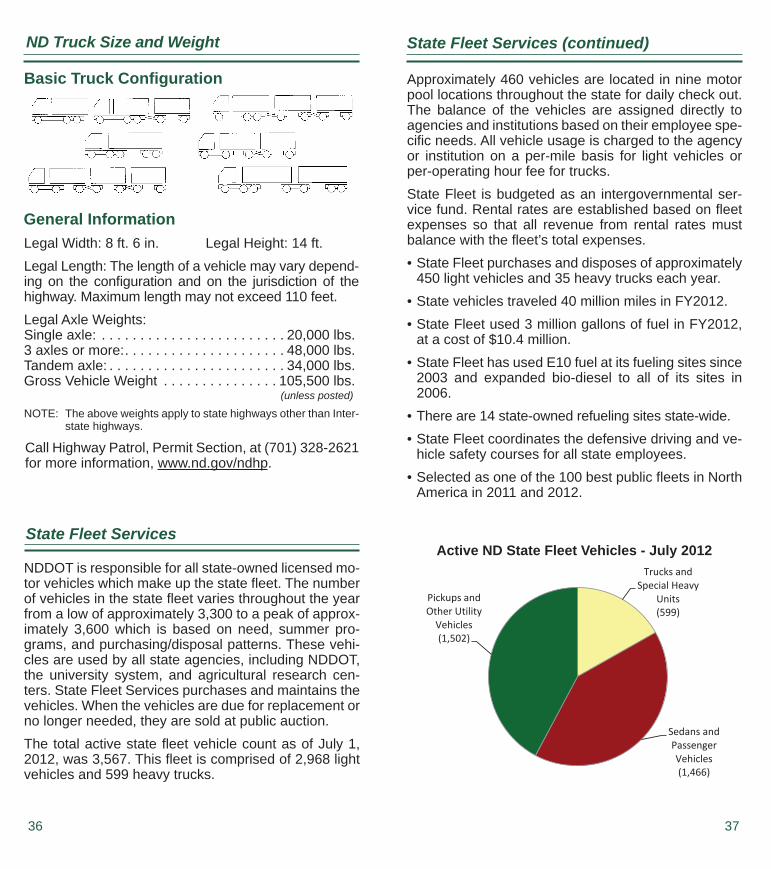
ND Fuel Consumption - FY2003 to FY2012
0
100
200
300
400
500
600
700
800
900
2003 2004 2005 2006 2007 2008 2009 2010 2011 2012
Gas Gasohol Diesel
Mill
ions
of G
allo
ns
2009Gas* Gasohol Diesel*
150.9 210.9 209.1
Millions of Gallons2010160.9 216.3 221.5
2011168.6 221.6 275.1
2012189.1 237.0 376.4
* Gross gallons taxes.

34 35
Vehicle Registrations - 1995 to 2011
0
200
400
600
800
1000
1200
1995 2000 2001 2003 2005 2007 2009 2011 Cars Pickups Trucks Others
Thou
sand
s
2009CarsPickupsTrucksOthers*Total
431,104212,792131,913176,807952,616
2011446,908243,278148,682209,372
1,048,240
* Includes low speed, motorcycles, snowmobile, trailers, off-highway, unconventional.
NOTE: Historically, data did not always track pickups separately from trucks.
ND Vehicle Registration FeesAvailable for use in the Highway TaxDistribution Fund and State Highway Fund
0
10
20
30
40
50
60
70
80
1985 1990 1995 2000 2005 2007 2009 2011
Mill
ions
of D
odlla
rs
Vehicle Registration Fee Comparison
Flat FeeOther FeeTotal
Flat FeeOther FeeTotal
Flat FeeOther FeeTotal
Flat FeeOther FeeTotal
Flat FeeCounty FeeTotal
287-
$287
217-
$217
93-
$93
42-
$42
-447
$447
411-
$411
217-
$217
142-
$142
554-
$55
-506
$506
1,056-
$1,056
300-
$300
1,059-
$1,059
1,457-
$1,457
-
161-
$161
100-
$100
149-
$149
89-
$89
-
268 -
$268
220-
$220
219-
$219
127-
$127
-
MN
MT²
ND
SD
WY³
State Fee¹2009Ford
Taurus3,739 lbs
20093/4 TonPickup
12,000 GVW
2009KW
Tractor80,000 lbs
2002FarmTruck
44,000 lbs
2007FarmTruck
44,000 lbs
4
1 Fees can include vehicle valuation, property, or other taxes and fees.2 Additional fees may be assessed by the county in which the vehicle is registered.3 Registration fees are computed on vehicles registered in Laramie County.4 Fee shown is for a 4-ton truck.5 Registration fees are based on factory price, vehicle weight and annual mileage.
5
5
5
5
5
5
Compiled by: North Dakota Motor Vehicle Division, 2010.
Vehicle Registration Fee Increase History
1977 Passenger vehicle fees were increased $5; pickups and small truck increases ranged from $4 to $7; farm trucks were increased $10; large non-farm truck increases ranged from $14 to $20.
1981 Passenger vehicles and pickups were increased $5; small trucks were increased $10; farm and non-farm truck in-creases ranged from $10 to $25.
1983 Passenger vehicle increases ranged from $1 to $20; pick-up increases ranged from $1 to $11; small truck increases ranged from $2 to $5; farm truck fees were not changed; large truck fee reductions ranged from $17 to $258.
1987 Most vehicle registrations were increased by $6.1999 Most vehicle registrations, except farm trucks, were in-
creased by $1 per vehicle. In addition, a $1 increase went into the Public Transportation Fund.
2001 Most vehicle registrations were increased by $7 per vehicle.2003 Most vehicle registrations were increased by $3 per vehicle.2005 Most vehicle registrations were increased by $10, plus a
$1 increase for the Public Transportation Fund. Pickup fees were aligned with passenger registrations. The fi rst half of the fee increase for pickups occurred in July 2005.
2007 Implemented second half of 2005 pickup fee increase.
36 37
ND Truck Size and Weight
Basic Truck Confi guration
General InformationLegal Width: 8 ft. 6 in. Legal Height: 14 ft.Legal Length: The length of a vehicle may vary depend-ing on the confi guration and on the jurisdiction of the highway. Maximum length may not exceed 110 feet.Legal Axle Weights:Single axle: . . . . . . . . . . . . . . . . . . . . . . . . 20,000 lbs.3 axles or more: . . . . . . . . . . . . . . . . . . . . . 48,000 lbs.Tandem axle: . . . . . . . . . . . . . . . . . . . . . . . 34,000 lbs.Gross Vehicle Weight . . . . . . . . . . . . . . . 105,500 lbs.
(unless posted)
NOTE: The above weights apply to state highways other than Inter-state highways.
Call Highway Patrol, Permit Section, at (701) 328-2621 for more information, www.nd.gov/ndhp.
State Fleet Services
NDDOT is responsible for all state-owned licensed mo-tor vehicles which make up the state fl eet. The number of vehicles in the state fl eet varies throughout the year from a low of approximately 3,300 to a peak of approx-imately 3,600 which is based on need, summer pro-grams, and purchasing/disposal patterns. These vehi-cles are used by all state agencies, including NDDOT, the university system, and agricultural research cen-ters. State Fleet Services purchases and maintains the vehicles. When the vehicles are due for replacement or no longer needed, they are sold at public auction.The total active state fl eet vehicle count as of July 1, 2012, was 3,567. This fl eet is comprised of 2,968 light vehicles and 599 heavy trucks.
State Fleet Services (continued)
Approximately 460 vehicles are located in nine motor pool locations throughout the state for daily check out. The balance of the vehicles are assigned directly to agencies and institutions based on their employee spe-cifi c needs. All vehicle usage is charged to the agency or institution on a per-mile basis for light vehicles or per-operating hour fee for trucks.State Fleet is budgeted as an intergovernmental ser-vice fund. Rental rates are established based on fl eet expenses so that all revenue from rental rates must balance with the fl eet’s total expenses.• State Fleet purchases and disposes of approximately
450 light vehicles and 35 heavy trucks each year.• State vehicles traveled 40 million miles in FY2012.• State Fleet used 3 million gallons of fuel in FY2012,
at a cost of $10.4 million.• State Fleet has used E10 fuel at its fueling sites since
2003 and expanded bio-diesel to all of its sites in 2006.
• There are 14 state-owned refueling sites state-wide.• State Fleet coordinates the defensive driving and ve-
hicle safety courses for all state employees.• Selected as one of the 100 best public fl eets in North
America in 2011 and 2012.
Trucks and Special Heavy
Units (599)
Sedans and Passenger Vehicles (1,466)
Pickups and Other Utility
Vehicles (1,502)
Active ND State Fleet Vehicles - July 2012
3938
Transit Program - 2012
Federal Transit ProgramRural Public TransportationNorth Dakota DOT provides formula grants for rural programs that is formula based for the purpose of sup-porting public transportation in rural areas, with a pop-ulation of less than 50,000. The goal of the program is to enhance the access of people in non-urbanized areas to health care, shopping, education, employment, pub-lic services, and recreation.
Transportation for the Elderly and DisabledThis program provides formula funding to states for the purpose meeting transportation needs of the elderly and persons with disabilities when the transportation service provided is unavailable, insuffi cient, or inappro-priate to meeting these needs. Funds are apportioned based on each state’s share of population for these groups of people.
Urban Public TransportationThese funds are used to support and improve public transportation in urbanized areas that have a popula-tion between 50,000 and 200,000 (Bismarck, Fargo, and Grand Forks).
Urban Transit PlanningMore than $400,000 is distributed annually to Bis-marck, Fargo, and Grand Forks for planning purposes.
Transit Facts - 2012
• Transit service in North Dakota meets people’s needs 76.6 percent of the time.
• North Dakota public transit providers, both rural and urban, transported 3.7 million people in 2010.
• North Dakota has 39 transit providers statewide (rural, urban, intercity).
• State and federal funds support nearly all the urban and rural transit systems. Collectively, these systems operate approximately 249 buses, vans, and cars.
Aeronautics Commission -Aviation Transportation
Aeronautics MissionTo serve the public by providing economic and technical assistance for the aviation community
ensuring the safe and cost-effective advancement of aviation in North Dakota.
Aviation in North Dakota functions well with signifi cant local involvement, good communication with the FAA, and a small state agency charged with advancing aero-nauticas in North Dakota through encouraging aviation and administering federal and state grants. Aerospace gives to other industries while historically supporting its infrastructure through its own taxes on fuel and sales.
0
50000
100000
150000
200000
250000
300000
350000
400000
2002 2003 2004 2005 2006 2007 2008 2009 2010 2011
Pass
enge
rs
Annual Boarding Trend by Major Airports
Fargo Bismarck Minot Grand Forks
500000
550000
600000
650000
700000
750000
800000
850000
900000
2002 2003 2004 2005 2006 2007 2008 2009 2010 2011
Pass
enge
rs
Statewide Passenger History
SOURCE: ND Aeronautics Commission(701) 328-9650www.nd.gov/ndaero
40
Disadvantaged Business Enterprises (DBE)
The Disadvantaged Business Enterprise (DBE) Pro-gram, administered by the Civil Rights Division, encour-ages the development and use of companies owned and controlled by minorities, women, and socially and economically disadvantaged individuals on federally-aided highway construction projects. The companies can be contractors, suppliers, or manufacturers with capabilities in the transportation industry. In order to participate in the program, the companies must be an-nually certifi ed by NDDOT. Under the program, select contracts are assigned percentage goals, based on the total dollar amount of the contract, for participation by certifi ed DBE fi rms. The prime contractor must meet the assigned DBE goal or prove that suffi cient good faith efforts were made in an attempt to meet the goal.Contact the Civil Rights Division at (701) 328-2576.
Number of DBE’s Certifi edFY2011 . . . . . . . . . . . . . . . . . . . . . 85FY2010 . . . . . . . . . . . . . . . . . . . . 71FY2009 . . . . . . . . . . . . . . . . . . . . . 73FY2008 . . . . . . . . . . . . . . . . . . . . 82FY2007 . . . . . . . . . . . . . . . . . . . . . . 76FY2006 . . . . . . . . . . . . . . . . . . . . . 80
DBE Annual Participation GoalFY2011 . . . . . . . . . . . . . . . . . . . . . 7.32%FY2010 . . . . . . . . . . . . . . . . . . . . 7.32%FY2009 . . . . . . . . . . . . . . . . . . . . . 7.00%FY2008 . . . . . . . . . . . . . . . . . . . . 7.38%FY2007 . . . . . . . . . . . . . . . . . . . . . . 7.68%FY2006 . . . . . . . . . . . . . . . . . . . . . 8.12%
201120102009200820072006
$31,860,45332,040,94812,123,45117,110,24118,569,11721,111,370
FYDBE $
Achieved Non-DBE$400,692,288408,683,763322,338,804244,037,380200,913,830263,151,133
201120102009200820072006
$432,552,741440,724,711334,462,255261,147,621219,482,944284,262,503
FY Total % Achieved7.26%7.12%3.67%6.62%8.42%7.43%