North CaroliNa’s Coasts iN Crisis: a visioN for the futurecore.ecu.edu/geology/riggs/Coasts in...
32
NORTH CAROLINA’S COASTS IN CRISIS: A VISION FOR THE FUTURE S. R. Riggs, S. J. Culver, D. V . Ames, D. J. Mallison, D. R. Corbett, and J. P. Walsh Department of Geological Sciences Thomas Harriot College of Arts and Sciences, Institute for Coastal Science and Policy East Carolina University
-
Upload
duongxuyen -
Category
Documents
-
view
214 -
download
0
Transcript of North CaroliNa’s Coasts iN Crisis: a visioN for the futurecore.ecu.edu/geology/riggs/Coasts in...
North CaroliNa’s Coasts iN Crisis: a visioN for the future
s. r. riggs, s. J. Culver, D. v. ames, D. J. Mallison, D. r. Corbett, and J. P. WalshDepartment of Geological sciences
thomas harriot College of arts and sciences, institute for Coastal science and Policyeast Carolina university

froNt Cover PhotoGraPh. The shoreline in this South Nags Head photograph has flanked the sand-bagged houses that are now in the surf zone, and destroyed the adjacent houses and access road. Photograph is by S. Riggs.
a White Paper by
stanley r. riggs, stephen J. Culver, Dorothea v. ames,David J. Mallinson, D. reide Corbett1, and J.P. Walsh1
Members of the North CaroliNa Coastal GeoloGY
CooPerative researCh ProGraM
Department of Geological sciences
harriot College of arts and sciences
east Carolina university
Greenville, NC 27858
and
1institute for Coastal science and Policy
east Carolina university
Greenville, NC 27858
october 2008
North CaroliNa’s Coasts iN Crisis: a visioN for the future

TABLE OF CONTENTS
Executive Summary......................................................................................................................................... 1
The Coastal Dilemma.....................................................................................................................................2
North Carolina’s Coastal System..............................................................................................................3
. Regional.Setting........................................................................................................................................3
. Estuaries.and.Barrier.Islands................................................................................................................4
How The Coastal System Works...............................................................................................................5
. Formation.of.the.Modern.Coastal.System......................................................................................5
. Nature.of.the.Modern.Coastal.System.............................................................................................7
. ....Sediment.Supply.for.Coastal.Barriers.........................................................................................7
. ....Complex.Barrier.Islands—Welding.Pieces.Together..............................................................8
. ....Simple.Barrier.Islands—Inlet.and.Overwash.Dynamics.........................................................8
. History.and.Role.of.Storms................................................................................................................. 10
Why Are North Carolina’s Coasts In Crisis?.........................................................................................11
What Is At Risk?............................................................................................................................................. 13
Human Responses To Changing Coastal Systems........................................................................... 14
. Infrastructure.Construction................................................................................................................ 14
. ....Roads.and.Bridges............................................................................................................................ 14
. ....Constructed.Barrier.Dune.Ridges............................................................................................... 15
. Beach.and.Inlet.Management............................................................................................................ 16
. ....Shoreline.Hardening......................................................................................................................... 16
. ....Sand.Bag.Hardening..........................................................................................................................17
. ....Beach.Nourishment...........................................................................................................................17
. ....Inlet.Openings.and.Closings.......................................................................................................... 18
. Relocation................................................................................................................................................ 20
Adaptation Alternatives..............................................................................................................................21
. A.Vision.for.the.Future..........................................................................................................................21
. Northeastern.North.Carolina:.“A.String.of.Pearls”......................................................................21
. Southeastern.North.Carolina:.“Islands.of.Opportunity”......................................................... 23
A Concluding Thought............................................................................................................................... 24
Acknowledgements..................................................................................................................................... 24
References Cited.......................................................................................................................................... 25
Further Reading............................................................................................................................................ 26

1
The coastal zone of North Carolina that we know today is not permanent. It has evolved throughout its history. These changes, which can be both imperceptibly gradual or sudden and violent, continue today and will do so into the future. Humans are moving into this environment in ever increasing numbers accompanied by towns, industry, tourism, and the supporting infrastructure of services such as roads, bridges, water, power, and waste disposal. The changing coastal system is not fragile. It is the fixed human infrastructure that can easily be destroyed by natural processes. This is the coastal conflict that we must examine closely and then manage. The climate is changing; tropical storms and hurricanes will continue to strike our coast as will nor’easters, and sea level is rising at an increasingly rapid rate. We must accept these changes as inevitable but we seem reluctant to do so. This is why our coasts are in crisis.
The coastal system of North Carolina is incredibly varied, with rivers, swamps, estuaries, marshes, barrier islands, inlets, beaches and offshore shoals and rock. In the south, barrier islands are short, with many inlets, and are close to the mainland. In the north, the barrier islands are long and narrow, with few inlets, and they extend out into the Atlantic Ocean leaving an immense estuarine system of sounds behind them. This spatial variety of our coasts means that coastal management issues vary considerably from place to place.
Tide gauge and historical data demonstrate that relative sea level is currently rising in northeastern North Carolina at a rate of 16 to 18 inches per century. One hundred years ago, the rate was 7 inches per century and 200 years ago it was only 3 inches per century. The rate will likely continue to increase into the future as climate continues to warm. The warming climate might also spawn more frequent and intense hurricanes. When so much of down-east North Carolina is just a foot or two above current sea level, we must take note. The future will likely see accelerated rates of coastal erosion and associated loss of urban infrastructure, agricultural land, wetlands, and segments of barrier islands. In addition, there will likely be increased economic losses due to floods, droughts and storms with a potentially serious impact on the state’s coastal tourism and recreation
economy – unless we accept and plan for environmental change, and adapt.
We know that rising sea level, resulting from melting of the last Ice Age’s glaciers and ice sheets, began to affect the area of our modern coastal zone about 12,000 years ago when rising ocean level flooded into the Roanoke River valley and gave birth to Albemarle Sound. The Neuse and Tar rivers to the south and their tributary, Pamlico Creek, began the transition to estuaries approximately 7,000 years ago. The barrier island system began to form about 3,500 years ago in a position very close to its current location. Since that time, development of barriers has been influenced by opening and closing of inlets and collapse and reformation of portions of the Outer Banks, occasionally exposing southern Pamlico Sound to oceanic influences. In the one hundred years or so before the first Europeans arrived in 1584, the barrier islands took a form similar to that of today.
During the 20th century, human development and engineering have become a dominant force in disrupting natural coastal processes and modifying coastal evolution. Roads and bridges have been built on mobile barrier islands. Barrier dune-ridges were constructed to protect the roads but, in doing so, have curtailed the natural processes of barrier island growth and migration. Jetties have been built to stabilize the location of inlets but, in doing so, have disrupted the natural process of along-shore sediment transport. Resulting coastal erosion has been addressed by expensive beach nourishment programs, but they have not been particularly successful; they must be repeated indefinitely, and suitable sand is hard to find. Sand dredged from navigation channels is often dumped too far offshore for natural beach renourishment to occur. Stabilization structures, such as jetties, groins, bulkheads, and sandbags demonstrably cause erosion problems. Inlets open naturally, and we close them almost immediately before they can do their work of building island width by adding sand to the barrier island system. Wetlands are filled, bulkheads are constructed, and ecosystems disrupted. Storm-water is increasingly hard to manage as we pave more of the land’s surface, compromising water quality in the rivers and sounds.
EXECUTIVE SUMMARY

2
What are our alternatives? We must understand how the natural coastal system works and accept that reality. We must consider building temporary bridges across new inlets instead of closing them. We must consider letting oceanic overwash build barrier island elevation and width, and install temporary roads to allow access. We must consider the challenges of coastal change to be opportunities. We can then determine the best ways to sustain and grow our coastal economy, and new ways to make our living at the coast. We must embrace relocation as a means of adaptation to an ever-changing environment. We should embrace the historic culture and the wild, remoteness of the Outer Banks and parlay that attribute into economic advantage. Ocracoke Village and Ocracoke Island are desirable tourist destinations in large part because of their remoteness. Perhaps the other villages along the Outer Banks can be part of a “string of pearls” of vacation destinations. Perhaps personal cars can be replaced by other means of transport (rented golf carts, trolleys, bicycles) along some portions of the barrier islands. Perhaps fast high-tech ferry systems can transport vacationers to their destinations. Perhaps rural mainland towns can become ferry hubs with motels, restaurants, service stations, parking lots, and other industry in support of this new coastal economy. Perhaps these towns can themselves become the centers of coastal tourism with estuarine cruises, wildlife tours, historic and cultural programs, hunting and fishing tours, natural history aerial field trips, black-water paddle and camping trips, etc. Adaptation strategies can be similarly developed for the southern part of our coast where the barriers can be considered to be “islands of opportunity”.
This vision for a new and economically viable and advantageous coastal North Carolina is preliminary and unrefined. But no matter how this vision evolves, planning for future coastal development must take place within the framework of known natural processes of change. Our coastal economy can then experience a renaissance that has more potential pay-offs than the current approach to coastal management can provide in a changing climatic regime.
THE COASTAL DILEMMA
Change is the only constant within the North Carolina coastal system. It can occur as an almost imperceptibly gradual process in response to shifts in climate and sea level, or suddenly during high-energy events such as winter nor’easters and summer hurricanes. Barrier islands are built by storms and are dependent upon storm events to maintain their short-term health and long-term evolution.
Some of the greatest population growth rates in North Carolina, together with unprecedented urban expansion, are presently occurring within this coastal zone. New four-lane roads and bridges are being constructed, new water supplies are being developed, and pressures upon severely overloaded sewage disposal systems are increasing. This growth, intimately intertwined with a booming tourist industry, has substantial environmental impacts. Maritime forests are cleared, shorelines are hardened with bulkheads, shallow-waters are dredged, wetlands are channelized and filled, dune fields are bulldozed, and the surface is paved for parking lots. All of these activities modify the land surface, alter the drainage, and result in increased contaminants moving into the adjacent coastal waters.
The natural coastal system is not fragile. It is a high-energy, storm-dependent system characterized by environmental extremes. It is the fixed anthropogenic structures superimposed upon this dynamic system that are fragile. No guaranteed permanency exists for any ecosystem, landform, or built structure at the coast. Our attempts to transform our coasts into a stable, engineered system conflict with the dynamic nature of the natural environment. Our coasts are eroding, roads and bridges are threatened, water quality is compromised, and the tourist economy is at risk. This is why North Carolina’s coasts are in crisis.
This White Paper is produced for coastal managers, agencies, business owners, politicians, residents of and visitors to the coast – anyone who has an interest in maintaining the unique character of our coast that draws so many tourists to it every year. The global climate is warming, the intensity of tropical storms might increase, and the rate of sea-level rise is increasing. Can we deal wisely with these issues so that we can adapt to the coming changes rather than be overwhelmed by them?

3
Regional Setting
The North Carolina coastal system (Fig. 1) consists of about 325 miles of ocean shoreline, 23 inlets, over 5,000 miles of estuarine shoreline, and over 3,000 square miles of brackish-water estuaries. It has two distinct zones that are very different in both their geometry and processes (Fig. 1, Table 1). The Southern Coastal Zone is characterized by a relatively steep land slope compared to the gentler slope of the Northern Zone. Rising sea level has flooded the disparate slopes producing different kinds of barrier islands, inlets, and associated estuaries (Fig. 1). The steeper slope of the Southern Zone produces short, stubby barrier islands that hug the mainland shoreline, resulting in narrow back-barrier estuaries connected to the ocean by 18 inlets. The gentler slope of the Northern Zone produces long barrier islands and a broad expanse of drowned-river estuaries, the vast Albemarle-Pamlico estuarine system. The northern barrier islands are broken by five inlets and project seaward to form the famous Cape Hatteras and associated Outer Banks.
fiGure 1. The coastal zone of North Carolina. Imagery from a NASA (MODIS) sensor provided by the Institute for Marine Remote Sensing of the College of Marine Science, University of South Florida.
NORTH CAROLINA’S COASTAL SYSTEM
The coastal system can be further divided into four coastal geomorphic compartments (Fig. 1). These compartments, defined by capes and associated cape shoals, are known as cuspate embayments. Cape shoals are shore-perpendicular, shallow sand bodies that extend seaward for about 10 miles (Diamond Shoals off Cape Hatteras), 15 miles (Lookout Shoals off Cape Lookout), and 30 miles (Frying Pan Shoals off Cape Fear). These vast shoal systems have led many mariners to their demise and the North Carolina coast to the dubious honor of being called the “Graveyard of the Atlantic”.
The orientation of each compartment and continental shelf geometry determine wave and current dynamics, astronomical
taBle 1. Coastal characteristics of the Southern and Northern Coastal Zones of North Carolinaresult from differences in the underlying geologic framework. Figure 1 shows the location of the two zones.
southerN Coastal ZoNe NortherN Coastal ZoNe Cretaceous-Miocene Geologic Framework Pliocene-Quaternary Geologic Framework Dominantly Rock Control Dominantly Sediment Control
Steep Sub-Aerial Slope (ave. = 3 feet/mile) Gentle Sub-Aerial Slope (ave. = 0.02 feet/mile)
Coastal Plain-Draining Rivers (Many) Piedmont-Draining Rivers (4) Black-Water Rivers Brown-Water Rivers Low Sediment Input High Sediment Input Low Fresh-Water Input High Fresh-Water Input
Short Barrier Islands--Many Inlets (18) Long Barrier Islands--Few Inlets (5) Maximum Astronomical Tides/Currents Minimal Astronomical Tides Maximum Salt-Water Exchange Minimal Salt-Water Exchange
Results: Narrow Back-Barrier Estuaries Results: Deeply Embayed Estuaries Regularly Flooded Irregularly Flooded Astronomical Tide Dominated Wind Tide and Wave Dominated
High Brackish Salinities Highly Variable Salinities

4
and storm-tide characteristics, and the nature of the coast’s response to specific storm systems. The Hatteras compartment faces northeast to east and receives the head-on impact of frequent nor’easters. In contrast, the Raleigh Bay compartment is generally southeast-facing and only receives glancing blows from powerful nor’easters. The Onslow Bay compartment faces south to southeast and the Long Bay compartment faces south. These orientations result in offshore winds and waves during nor’easters, but onshore seas from the dominant southwesterly winds during the summer and a high proportion of direct hits from less frequent, but higher energy tropical storms and hurricanes.
Estuaries and Barrier Islands
The drainage basins of North Carolina form a vast and complex network of creeks, streams, and rivers that move surface water off the uplands of the Blue Ridge, Piedmont, and Coastal Plain provinces to the Atlantic Ocean. The estuaries formed when rising sea level flooded up the valleysof these drainage systems, while the higher inter-stream divides formed low upland regions (Riggs and Ames, 2003).
Estuaries act as great mixing basins where the interplay between fresh and saline water, together with the regularity of astronomical tides and irregularity of wind tides, largely determines the coastal plant communities within the estuarine system. These, in turn, determine the type and distribution of shorelines (Riggs and Ames, 2003). As barrier-island inlets open, migrate, and close through time, chemical and physical conditions in the estuaries also change, resulting in major shifts in estuarine ecosystems.
Fronting the estuarine zone is a narrow strip of barrier islands that acts as a dam between the estuaries and ocean (Fig. 1). The sand islands, produced at sea level by the interaction of high-energy ocean storms with the paleo-topography of the gently sloping Coastal Plain, are broken by a series of small openings called “inlets” that allow the mixing of ocean water with riverine water (Fig. 1). Only a small portion of the barrier islands rises above the sea surface; the greater portion lies hidden below sea level. The sub-aerial portion of barrier islands is perched at the top of the shoreface, which slopes steeply to between 25 to 75 feet below sea level, where it flattens out onto the inner continental shelf. The shoreface ramp is the portion of a barrier island that functions as an important energy-absorbing surface for wave, tide, and current energy.
Barrier islands form and persist at the energetic interface between the land, sea, and air in response to four physical criteria: the presence of a gently sloping coastal plain-continental shelf, availability of adequate sediment, sea level, and the occurrence of high energy oceanic storms that build the islands and maintain them through time. Consequently, barrier islands are not only built by storm-dominated processes of inlet and overwash dynamics, but also act as critical energy-absorbing buffers at the land-sea-air interface. During times of rising sea level, storm dynamics constitute the process by which landward barrier island migration occurs.

5
fiGure 2. Four time slices show paleographic reconstructions for the Pamlico Sound region over the last 7,000 years. See text for explanation. Figure is modified from Culver et al. (2007). The outline of the modern shoreline is shown for geographic reference in A-C.
HOW THE COASTAL SYSTEM WORKS
Formation of theModern Coastal System
Our understanding of the evolution of the coastal zone is more complete for northeastern North Carolina (e.g., Riggs et al., 2000; Mallinson et al., 2005, 2008; Culver et al., 2007, 2008). However, the dynamic processes that drive our coastal system, and responses to those processes, are similar from the north to the south of North Carolina. Figure 2 shows the paleogeographic reconstruction of
the southern Pamlico Sound region over the last 7,000 years (Culver et al., 2007). Rising sea level flooded up the drainages incised into the paleo-landscape thus leading to estuarine conditions around 7,000 years ago (Fig. 2A). A generally northeast to southwest-draining tributary of the Tar River drainage, Pamlico Creek, was separated from a similarly oriented tributary drainage to the east by

6
fiGure 3. This map (based upon LiDAR data) reconstructs the ocean shoreline (Suffolk shoreline) that was occupied during the interglacial sea-level high-stand about 125,000 to 80,000 years ago. Sea level was 20 to 25 feet higher than modern sea level and the entire area east of the Suffolk shoreline was flooded. The associated drowned-river estuaries, like those of today, occurred west of the shoreline. The modern shoreline, estuaries and sounds are shown for geographic reference but they did not exist at the time represented by this map. Figure is modified from P. Parham (unpublished).
higher land named the Hatteras Flats Interstream Divide. An ocean shoreline, and possibly barrier islands, would have existed on the southeast side of Hatteras Flats at this time (Fig. 2A). By approximately 4,000 years before present (BP), flooding began to occur across the low, southwestern end of the Hatteras Flats Interstream Divide, in the region that is now Ocracoke Island. The flooding of portions of the Neuse and Tar rivers and Pamlico Creek allowed tidal exchange to occur and normal salinity oceanic waters to extend into the southern part of the Pamlico basin (Fig. 2B). Barrier islands formed along the crest of the Hatteras Flats Interstream Divide as it was increasingly drowned by rising sea level. By 2,500 years BP, the barrier islands probably resembled those of today (Fig. 2C).
The southern portion of the Pamlico Sound estuary underwent a rapid and fundamental environmental change during a warm climatic interval known as the Medieval Warm Period. One or more large storms, or a series of smaller storms, struck the southern Outer Banks around 1,100 years BP causing the collapse of a large segment of the barrier. Sand was eroded from the islands and redeposited as a broad, shallow submarine shoal (Fig. 2D). Microfossil data indicate that Gulf Stream waters were transported into the southern Pamlico basin resulting in normal oceanic salinity. Radiocarbon age estimates indicate that the barrier islands were not re-established for approximately 600 years. Indeed, the earliest map drawn by the first English visitors to North Carolina (1590 AD) shows a series of short barrier islands separated by numerous inlets. The majority of these inlets closed during the 17th and 18th centuries leaving a few long, thin barrier islands separating the once more estuarine Pamlico Sound from the Atlantic Ocean (Fig. 1).
We are presently in an interglacial episode characterized by rising sea level. If global warming continues and substantial portions of the Greenland and/or Antarctic ice sheets were to collapse, the ocean shoreline of North Carolina would move significantly inland of the present coast. This occurred during the last interglacial sea-level highstand, 125,000 to 80,000 years ago, when the ocean was 20 to 25 feet above today’s sea level and it occupied the Suffolk Shoreline some tens of miles west of the present shore (Fig. 3).

7
fiGure 4. Panel A Shows a schematic cross-sectional diagram of a simple inlet/overwash-dominated barrier island. Panel B is a 1998 aerial photograph of a simple barrier island segment just north of Buxton. Panel C shows a schematic cross-sectional diagram of a complex barrier island. Panel D shows a 1982 aerial photograph of Kitty Hawk Woods, a complex barrier island segment.
Nature of the Modern Coastal System
sediment supply for Coastal Barriers
Barrier islands are not created equal. Many barrier island segments are sediment poor while some have adequate supplies to maintain a healthy island system. The North Carolina coast is characterized by two basic types of barrier islands (Fig. 4). Complex barrier segments are sediment-rich and consequently are generally wide and high islands. They consist of multiple beach ridges and swales and extensive dune fields. Simple barrier segments are sediment-poor, low and narrow, are dominated by inlet and overwash dynamics, and tend to be relatively young.
In addition to the sand that is already on any given barrier island, there are four major potential sources of sand that play variable roles in the sediment budget of the North Carolina barrier island system.
1. Inlets (Fig. 5) between barrier segments contain several types of sand deposits within the various channel systems, the flood-tide delta on the estuarine side, and the ebb-tide delta on the oceanic side. 2. Deposits of sand and gravelly sand occur in paleo-riverine channels and paleo-deltaic sediments deposited by the larger trunk rivers on the continental shelf during previous glacial intervals characterized by sea-level lowstands (Mallinson et al., 2005). 3. Tremendous volumes of sand are potentially available in cape-shoal structures (Fig. 1): Diamond Shoals off Cape Hatteras (Boss and Hoffman, 2000), Lookout Shoals off Cape Lookout, and Frying Pan Shoals off Cape Fear (Riggs and Cleary, 1997).

8
Complex Barrier islands – Welding Pieces together
Nags Head Woods, Jockeys Ridge, and Shackleford Banks are characterized by extensive back-barrier dune fields, whereas Buxton Woods, Kitty Hawk Woods, and Bogue Banks are characterized by a series of beach-ridge and swale structures (Fig. 6).
Kitty Hawk Woods are fronted by a dune field that was still active in 1932. The source of the dune sand was overwash occurring east of N.C. Highway 158. Construction of Highway 12 in 1932 and a barrier dune ridge in the late 1930s, in concert with subsequent development, has led to stabilization of the dune field, termination of modern overwash processes, and elimination of the sand source from the beach that fed the dune field (Fig. 7). Coastal development at Kitty Hawk is threatened, as indicated by the reduced distance from the shoreline to NC Highway 12 in the 1932 and 1999 aerial photographs (Fig. 7).
fiGure 5. 1943 aerial photograph of Drum Inlet on Core Banks, NC shows the development of the ebb-tide delta (ETD) on the ocean side and the flood-tide delta (FTD) on the estuarine side of the barrier. Aerial photography from US ACE archivesin Wilmington, NC.
fiGure 6. Panel A is a 1998 aerial photograph of Buxton Woods complex barrier island at Cape Hatteras, NC. Panel B is a 2001 LiDAR geomorphic contour map that shows the elevations of the beach ridges and intervening swales.
4. Locally, sand-rich geologic units are exposed on the shoreface and inner continental shelf (Riggs and Cleary, 1997, 1998; Boss and Hoffman, 2000; Thieler et al., 2006).
simple Barrier islands – inlet and overwash Dynamics
Storm surges are critical processes on low and narrow simple barrier islands (Fig. 4). They may open shallow inlets that build back-barrier flood-tide deltas or they may overtop the barrier depositing overwash fans on top of the barrier and as back-barrier shoals. These processes build both island width and island elevation and are critical for barrier island health and migration as sea level rises.
Recent research from Oregon Inlet to Cape Hatteras (Smith et al., 2006) suggests that between 50 and 70% of this area have had one or more inlets during the past several hundred years. Up to 70% of the sand-poor islands in the Onslow Bay compartment have had one or more inlets during the past several hundred years (Riggs et al., 1995). Inlets are high energy, self-adjusting safety valves in the barrier island sand dam that open during storms to let the increased water volume (from increased river flow due to heavy rainfall or from increased storm surge) to flow either in or out. When storm and river floods abate, inlets close back

9
fiGure 7. This figure compares a 1999 aerial photograph of the complex barrier island in the Kitty Hawk area of North Carolina (Panel A) with a 1932 aerial photograph of the same region (Panel B). The photographs show: 1) the younger overwash-dominated part of the island being welded onto the ocean side of the older ridge and swale part of the barrier, 2) the complete urbanization of the younger overwash portion of the island by 1999, and 3) rapid ocean shoreline recession as indicated by the reduced distance of Highway 12 from the ocean over time. In 1999, a section of Highway 12 is covered by overwash sand. Figure is modified from Riggs and Ames (2003).
fiGure 8. Aerial photographs of Core Banks show how storms build island elevation and width. Panel A is a 1945 aerial photograph of a low, unvegetated island segment consisting of multiple breaches. After an inlet opened in 1962 and built flood-tide delta shoals (Panel B), the inlet closed and developed into marsh that, by 1998, became part of a wider and vegetated island segment (Panel C). Panel D shows storm-deposited overwash fans extending across the island and into the sound in 1962. Sediment deposited on the island built elevation and shoals, which developed into marsh (Panel E), and widened the island. The 1998 estuarine shoreline is superimposed on the historic photographs to demonstrate estuarine shoreline change. The superimposed ocean shoreline is that of 2006.
to an equilibrium point that is dictated by the normal hydrodynamics of the estuarine-oceanic system.
Inlets are essential for barrier island evolution by building extensive shallow sand shoals known as flood-tide deltas (FTDs) within the estuary behind the barrier islands and ebb-tide deltas (ETDs) on the ocean side of an inlet (Fig. 5). The FTD sand shoals form the foundation that the barrier island migrates onto in response to sea-level rise. Once an inlet closes, the FTD develops into marsh and adds width to the island (Fig. 8A-C). FTDs and ETDs store sand and are critical components of the coastal sediment budget. During storm events they bypass sand up and down the ocean shoreline, as well as in and out through the inlet.
10
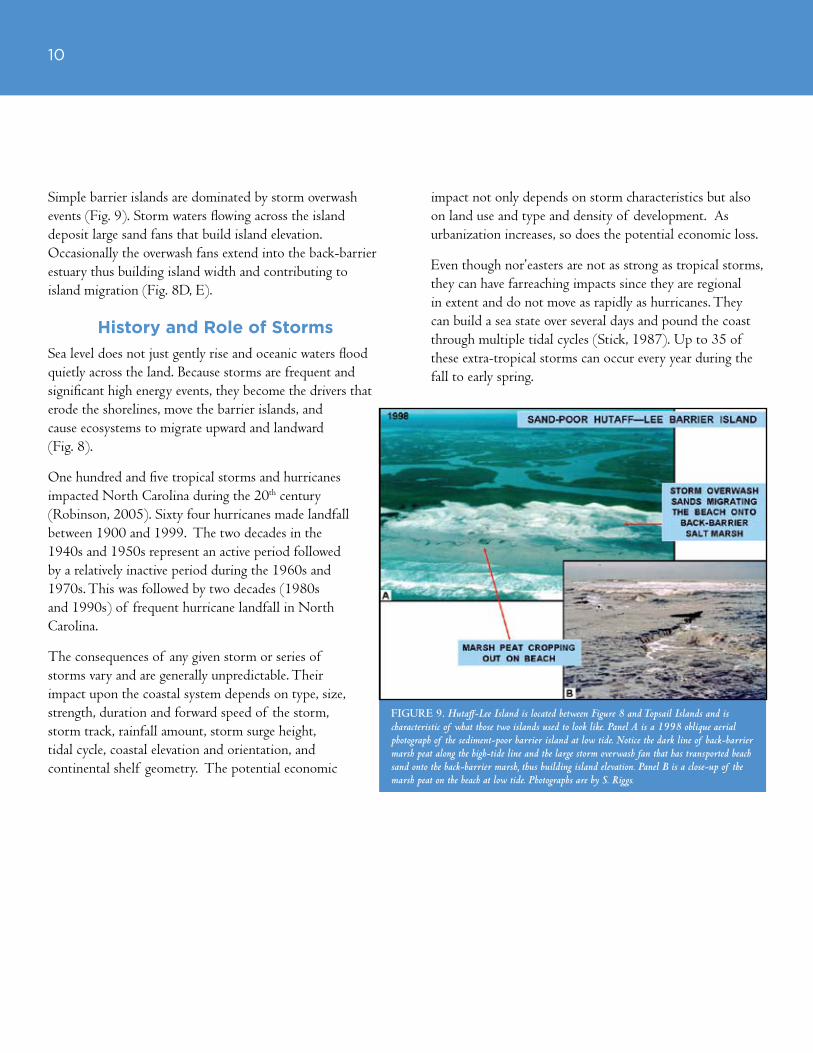
Simple barrier islands are dominated by storm overwash events (Fig. 9). Storm waters flowing across the island deposit large sand fans that build island elevation. Occasionally the overwash fans extend into the back-barrier estuary thus building island width and contributing to island migration (Fig. 8D, E).
History and Role of Storms
Sea level does not just gently rise and oceanic waters flood quietly across the land. Because storms are frequent and significant high energy events, they become the drivers that erode the shorelines, move the barrier islands, and cause ecosystems to migrate upward and landward (Fig. 8).
One hundred and five tropical storms and hurricanes impacted North Carolina during the 20th century (Robinson, 2005). Sixty four hurricanes made landfall between 1900 and 1999. The two decades in the 1940s and 1950s represent an active period followed by a relatively inactive period during the 1960s and 1970s. This was followed by two decades (1980s and 1990s) of frequent hurricane landfall in North Carolina.
The consequences of any given storm or series of storms vary and are generally unpredictable. Their impact upon the coastal system depends on type, size, strength, duration and forward speed of the storm, storm track, rainfall amount, storm surge height, tidal cycle, coastal elevation and orientation, and continental shelf geometry. The potential economic
fiGure 9. Hutaff-Lee Island is located between Figure 8 and Topsail Islands and is characteristic of what those two islands used to look like. Panel A is a 1998 oblique aerial photograph of the sediment-poor barrier island at low tide. Notice the dark line of back-barrier marsh peat along the high-tide line and the large storm overwash fan that has transported beach sand onto the back-barrier marsh, thus building island elevation. Panel B is a close-up of the marsh peat on the beach at low tide. Photographs are by S. Riggs.
impact not only depends on storm characteristics but also on land use and type and density of development. As urbanization increases, so does the potential economic loss.
Even though nor’easters are not as strong as tropical storms, they can have farreaching impacts since they are regional in extent and do not move as rapidly as hurricanes. They can build a sea state over several days and pound the coast through multiple tidal cycles (Stick, 1987). Up to 35 of these extra-tropical storms can occur every year during the fall to early spring.

11
Sea-level change results in a relatively slow and gradual reshaping of the North Carolina coastal system. More rapid change is achieved by hurricanes and nor’easters. Rising sea level floods up the stream valleys and adjacent land slopes, and storm waves erode and move the shorelines further landward.
Long-term tide gauge records (Hicks et al., 1983; Gornitz and Lebedeff, 1987; Douglas et al., 2001) indicate that sea level is rising at about 1.01 feet/100 years in the Charleston area and about 1.06 feet/100 years in the Norfolk area. Short-term data for the period from 1980 to 2000 at Duck, N.C. (Zervas, 2004) indicate that sea level for the Albemarle/Pamlico region is rising slightly faster at about 1.5 feet/100 years.
Extensive studies of salt-marsh peat on Roanoke Island have produced detailed sea-level curves for the past few thousand years (Kemp et al., 2007; Horton et al., 2007). Salt marshes grow vertically by depositing peat to keep up with rising sea level. The rate of sea-level rise recorded in cores of peat can be determined by using multiple research approaches (radiocarbon, lead and cesium isotopes, and various types of microfossils). The resulting data suggest that the rate of relative sea-level rise has increased from 3 inches/100 years between 0 AD and 1800 AD to 7 inches/100 years during the 19th century and to 16 inches/100 years during the 20th century (Table 2).
The increasingly rapid rate of sea-level rise results in flooding of low coastal land and almost ubiquitous recession of North Carolina’s ocean shorelines. The NC Division of Coastal Management (NCDCM, 2004) ocean shoreline erosion data, based upon aerial photograph analysis from
fiGure 10. 2003 aerial photograph of the Avon-Buxton portion of the Cape Hatteras National Seashore displays the location of the 1852 shoreline (yellow line) relative to the shoreline location in 2003. NC Highway 12 (black line) was constructed in 1955 and has since ‘gone-to-sea’. The highway was rebuilt in 1974 (red line), in 1999 (white line), and again in 2003 (green line).
WHY ARE NORTH CAROLINA’SCOASTS IN CRISIS?
taBle 2. The varying rate of relative sea-level rise in northeastern North Carolina for the last 11,000 years (extracted from data in Horton et al., 2007, in press and Kemp et al., 2007).
11,000 - 8,000 yrs ago 30 inches/100 yrs
8,000 - 2,100 yrs ago 6 inches/100 years
2,100 – 200 yrs ago (100 BC – 1800 AD) 3 inches/100 years
200 – 100 yrs ago (1800 AD – 1900 AD) 7 inches/100 years
100 – 0 yrs ago (1900 AD – 2000 AD) 16 inches/100 years
1946 to 1998, calculates the average annual erosion rate of 1.6 feet/year (J. Warren, pers. comm., 2008) with local rates that range upwards to 15 feet/year. Riggs and Ames (2007) analyzed historic surveys and aerial photographs of Core Banks from 1849 to 2003 and demonstrated a net landward recession of the ocean shoreline for the past one and a half centuries. Figure 10 demonstrates island narrowing between Avon and Buxton where the ocean shoreline has receded up to 2,500 feet over 151 years (an average annual erosion rate up to 17 feet/year). Up to 76 % of the island width in 1852 has been lost and NC Highway 12 has been moved westward four times since 1955. The highway is now immediately adjacent to the Pamlico Sound shoreline. Figure 11 demonstrates island recession in the urbanized area of South Nags Head. The ocean shoreline has receded up to 1,000 feet in 149 years at an average annual erosion rate up to 7 feet/year. Sandbagged houses have been flanked by the ocean, the access road has been eroded, and the second and third rows of houses are threatened. Storms often damage the sandbagged houses and expose septic tanks and drain fields (Fig. 12).

12
fiGure 11. Panel A is a 1998 aerial photograph of a portion of South Nags Head on Bodie Island and displays the location of the 1849 shoreline (red line) relative to the shoreline location in 1998 (black line). The location of the shoreline is shown in a recessional sequence for 1940, 1955, and 1962 (white lines). Panel B is an oblique aerial photograph (2008) that shows a housing development built in the 1980s, encased in sand-bags for several decades, and the receding shoreline adjacent to the houses. The red star is the same location on both panels. Panel B photograph is by S. Riggs.
fiGure 12. Photographs of sand-bagged houses in South Nags Head on Bodie Island (Panel A) and Bogue Inlet on Bogue Banks (Panel B) demonstrate the loss of the public beach. Photographs of sand-bagged houses in South Nags Head on Bodie Island (Panels C and D) with exposed and broken septic tanks and drain-fields. After storms these houses are condemned until the septic systems can be temporarily repaired and reburied in sand. Photographs are by S. Riggs.

13
The variety and scale of the natural resources and human infrastructure/activities that are at risk are quite staggering.
Natural Resources: Approximately 325 miles of barrier islands with more than 20 inlets; the second largest estuarine and wetland system in the US; over 5,000 miles of estuarine shoreline; eight major drainage basins and the associated wetland system.
People and Industry: Population of 865,000 residents in 20 coastal counties (population growth rates on the barrier islands of 75-150% since 1980); tourism, agriculture, forestry, and commercial fisheries.
Infrastructure: private, public and commercial buildings in 20 coastal counties; roads and bridges; power systems and sewage treatment plants; water treatment and distribution systems.
U.S. and NC Government Land Holdings and Operations: U.S. Military Bases (3 major bases and many support facilities); U.S. Coast Guard Facilities (numerous); U.S. National Park Service (two National Seashores and two Historical Sites); U.S. Fish and Wildlife Service (13 National Wildlife Refuges); U.S. Forest Service (one National Forest); NC Department of Transportation (two major ports, 16 ferry facilities, many miles of coastal highways and many coastal bridges); NC Division of State Parks (10 State Parks and Historic Sites); NC Division of Wildlife Resources (~300 public boat launch sites and ~2 million acres of game lands).
The Intergovernmental Panel on Climate Change Report (IPCC, 2007) predicts increased rates of global sea-level rise over the next century in direct response to global climate warming. Increased rates of sea-level rise and possibly increased intensity tropical storms will likely impact the North Carolina coastal zone adversely in the following ways.
1. Accelerated rates of coastal erosion and resulting loss of agriculture and forestry lands, estuarine wetlands, and other coastal habitats.
2. Economic losses due to increased salt-water encroachment, higher flood levels, and increased storm damage.
3. Increased loss of urban infrastructure.
4. Collapse of some barrier island segments.
5. Negative impacts on North Carolina’s coastal tourist and recreational fishing economy.
Approximately 25 miles of North Carolina’s Outer Banks are immediately threatened by erosion. Along these island segments it is increasingly difficult and costly for NC DOT to maintain a coastal highway. More than 400 structures on the ocean-front and at inlet shorelines have been preserved only by walls of sand-bags (Figs. 11, 12). In the early 1990s about 12 miles of public ocean beach were being nourished on a regular basis; coastal communities are now trying to develop beach nourishment programs for over 122 miles (Fig. 13).
Is a rate of 16 inches/100 years (Horton et al., 2007; Kemp et al., 2007) for rising sea-level significant for the North Carolina coastal system? Major portions of Currituck, Carteret, Dare, Hyde, Tyrell, and Pamlico counties are only 1 to 2 feet above present sea level.
fiGure 13. Map of North Carolina shows the 122 miles of ocean shoreline (red lines) for which the associated communities are trying to fund beach nourishment programs. These 122 of 325 ocean shoreline miles represent a ten-fold increase since the early 1990s. Also indicated are the locations of eleven hardened structures (yellow boxes) that occur along the North Carolina ocean coast.
WHAT IS AT RISK?

14
During the 20th century, human development and engineering have become a dominant force in modifying barrier island evolution. Among these modifications are the construction of bridges, roads, and barrier dune ridges, beach management (e.g., hardening, sand bags, and nourishment), and inlet management (e.g., closing, hardening, and sand mining/dredging). All of these anthropogenic processes interrupt the natural barrier island dynamics.
Infrastructure Construction
roads and Bridges
During the 20th century, highways and bridges were built to facilitate development of the Outer Banks. NC Highway 12 was paved in 1952 and connected to the 2.44 mile long Oregon Inlet bridge constructed in 1962-63. These structures were built across Cape Hatteras National Seashore and Pea Island National Wildlife Refuge to connect eight isolated villages with the Kitty Hawk to Nags Head urban area to the north.
Oregon Inlet was opened by a hurricane in 1846 north of the current Bodie Island lighthouse. It had migrated 2.5 miles southward by 1989. Construction of a bridge with a fixed navigational span over a migrating inlet required immediate dredging to keep the main channel under the fixed span. The amount of dredging required to hold the channel increased through time. By 1980 the problem became severe enough to require a substantial increase in the volume and frequency of dredging. The dredged sand was dumped offshore in deep water and lost to the inlet-barrier island system. This resulted in increased rates of inlet migration and beach erosion on Pea Island. As the inlet migrated southward, the bridge was becoming severed from Pea Island.
When the inlet approached the old U.S. Coast Guard Station, a variance was received from the NCCRC to stop inlet migration by constructing a rock jetty and to build an extensive rock revetment around the northern end of Pea Island to secure it to the bridge (Fig. 14). The jetty and revetment were built in 1989-1991 and did stop the southward migration of the inlet. In the meantime,
fiGure 14. Photographs of the Oregon Inlet bridge with a rock revetment built in 1989 around the south end of the bridge to secure it to Pea Island (Panel A) and a jetty built in 1989-91 to stabilize the south shore of the migrating inlet (Panel B). The red star shows the location of the former U.S. Coast Guard Station. Photographs are by S. Riggs.
HUMAN RESPONSES TOCHANGING COASTAL SYSTEMS
however, the northern side of the inlet continued to migrate southward, thus narrowing the inlet width and substantially deepening the navigational channel under the fixed bridge span. This, in turn, jeopardized the central bridge piles and rock fill was required to rebury the piles.
With construction of the jetty, it was determined that the down-drift Pea Island beach should be nourished with sand obtained from inlet dredging. Approximately 7.7 million yards3 of inlet sand were pumped onto the beach and placed in shallow, near-shore waters of Pea Island during 23 operations between 1989 and 2005. In addition, about
15
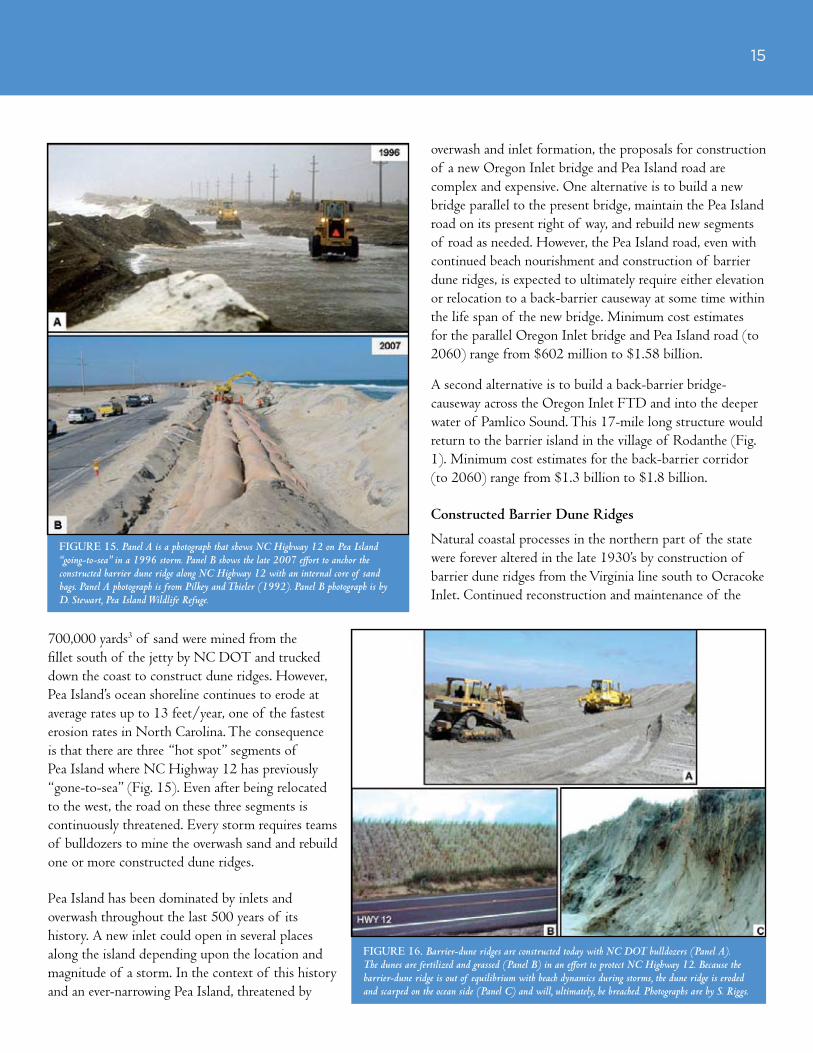
fiGure 15. Panel A is a photograph that shows NC Highway 12 on Pea Island “going-to-sea” in a 1996 storm. Panel B shows the late 2007 effort to anchor the constructed barrier dune ridge along NC Highway 12 with an internal core of sand bags. Panel A photograph is from Pilkey and Thieler (1992). Panel B photograph is by D. Stewart, Pea Island Wildlife Refuge.
fiGure 16. Barrier-dune ridges are constructed today with NC DOT bulldozers (Panel A). The dunes are fertilized and grassed (Panel B) in an effort to protect NC Highway 12. Because the barrier-dune ridge is out of equilibrium with beach dynamics during storms, the dune ridge is eroded and scarped on the ocean side (Panel C) and will, ultimately, be breached. Photographs are by S. Riggs.
700,000 yards3 of sand were mined from the fillet south of the jetty by NC DOT and trucked down the coast to construct dune ridges. However, Pea Island’s ocean shoreline continues to erode at average rates up to 13 feet/year, one of the fastest erosion rates in North Carolina. The consequence is that there are three “hot spot” segments of Pea Island where NC Highway 12 has previously “gone-to-sea” (Fig. 15). Even after being relocated to the west, the road on these three segments is continuously threatened. Every storm requires teams of bulldozers to mine the overwash sand and rebuild one or more constructed dune ridges.
Pea Island has been dominated by inlets and overwash throughout the last 500 years of its history. A new inlet could open in several places along the island depending upon the location and magnitude of a storm. In the context of this history and an ever-narrowing Pea Island, threatened by
overwash and inlet formation, the proposals for construction of a new Oregon Inlet bridge and Pea Island road are complex and expensive. One alternative is to build a new bridge parallel to the present bridge, maintain the Pea Island road on its present right of way, and rebuild new segments of road as needed. However, the Pea Island road, even with continued beach nourishment and construction of barrier dune ridges, is expected to ultimately require either elevation or relocation to a back-barrier causeway at some time within the life span of the new bridge. Minimum cost estimates for the parallel Oregon Inlet bridge and Pea Island road (to 2060) range from $602 million to $1.58 billion.
A second alternative is to build a back-barrier bridge-causeway across the Oregon Inlet FTD and into the deeper water of Pamlico Sound. This 17-mile long structure would return to the barrier island in the village of Rodanthe (Fig. 1). Minimum cost estimates for the back-barrier corridor (to 2060) range from $1.3 billion to $1.8 billion.
Constructed Barrier Dune ridges
Natural coastal processes in the northern part of the state were forever altered in the late 1930’s by construction of barrier dune ridges from the Virginia line south to Ocracoke Inlet. Continued reconstruction and maintenance of the

16
barrier dune ridges for the past six decades have changed the dynamics of all barrier islands, but particularly simple inlet- and overwash-dominated barriers (Fig. 16). The constructed barrier dune ridges have acted as walls that have prevented most overwash associated with average storm events. This has resulted in little sediment delivery to the barrier island’s sound side. Lack of overwash sand has led directly to increased rates of sound-side shoreline erosion (Riggs and Ames, 2003).
The constructed barrier dune ridges, in concert with a natural sand deficiency and net ocean shoreline recession related to sea-level rise, cause the ocean beach profile to steepen, resulting in even higher rates of shoreline recession. The constructed dune ridges, built to protect the islands have, ironically, contributed to their erosion.
Beach and Inlet Management
shoreline hardening
Most North Carolinians have supported the concept of maintaining natural beaches and historically have preferred beach nourishment and relocation as the main measures for combating ocean-front and inlet shoreline erosion. North Carolina law dictates that trading concrete, steel, rock, and debris for the natural sand beach is not an acceptable erosion control measure. Further, hardened structures on beaches and inlets inevitably cause increased erosion and ultimate loss of the beach (Fig. 17).
However, as sea level rises and shorelines recede, there is ever increasing pressure for implementing more permanent shoreline stabilization structures along the North Carolina ocean beaches and inlets. Along the 325 miles of ocean and inlet shoreline in North Carolina, there are eleven
fiGure 17. Construction of rock-revetments and bulkheads along sandy beaches inevitably results in loss of the beach in front of the hardened structures. Panel A is the rock structure at Carolina Beach in 1977 and Panel B is a rubble revetment at Fort Fisher. Both structures were in place before the no hardening rule of 1985. Panels C and D are of the rock revetment built about 1997, with a variance from the NC Coastal Resources Commission, to protect the eroding Fort Fisher. The red X is the same location on panels C and D. All photographs are by S. Riggs.

17
hardened structures (Fig. 13), eight of which pre-date the 1985 no-hardening rule. The three structures constructed since 1985 required variances from the North Carolina state agencies. The rock jetty and rock revetment at Oregon Inlet were constructed to protect the bridge (Fig. 14). The third structure was a rock revetment constructed to protect the earthen-work Fort Fisher (Fig. 17).
The ban on hardened structures is increasingly challenged. Senate Bill S599, proposed in 2007 was an effort to open the door to inlet-stabilization with construction of terminal groins (jetties) along many of North Carolina’s developed inlets. The island communities desiring to stabilize adjacent inlets are those with threatened houses located within the Inlet Hazard Zone of the NC Division of Coastal Management’s Areas of Environmental Concern. The Inlet Hazard Zones are well defined areas that have historically, and often recently, been occupied by active inlets.
sand Bag hardening
Bulkheads composed of sand bags form a hardened shoreline similar to any rock, concrete, or steel bulkhead. As a result,
the beach in front of the bags is lost and erosion is increased on the adjacent beaches (Fig. 18). The North Carolina regulations allow sand bags to be used as a temporary, stop-gap measure providing the owner time to either participate in a community beach nourishment program, move the structure to a new location, or dismantle it.
However, the sand bag regulation has not been enforced and as a result there are many segments of the North Carolina ocean shoreline where houses and their septic tanks are in the surf zone (Fig. 18). Storms often expose and break septic tanks, which are rapidly repaired and reburied. They may continue to leak and contaminate the adjacent beaches and near-shore coastal waters. North Carolina recently (May, 2008) began to enforce the sand bag regulation with the requirement that all exposed sand bags that have been in place beyond the permitted time must be removed.
Beach Nourishment
To locate and define potential sand sources for beach nourishment projects requires extensive exploration programs. Since the best sand is already on the beach and
fiGure 18. Panels A and B show the South Nags Head shoreline hardened with sand bags. Loss of the beach has left houses in the surf zone. Severe lateral erosion has also resulted, thus jeopardizing adjacent access roads and houses. Photographs are by S. Riggs.

18
there are only a few other potential sources, beach nourishment represents a temporary solution.
The ocean floor does not contain vast deposits of suitable sand. The sediment on the shoreface becomes finer grained offshore. The large sand bodies of Diamond Shoals, Lookout Shoals, and Frying Pan Shoals (Fig. 1) are too far from beaches that need nourishment and too difficult to mine to currently be viable as a source for beach sand. Unfortunately, the sand dredged from navigation channels is too often lost to the coastal system by being dumped in spoil piles or too far offshore for natural beach renourishment to occur.
Sand sources on the mainland are locally available. However, these sand deposits are generally more valuable for other uses or are far enough away that transportation costs make mining the sand for beach nourishment economically unviable. The most commonly utilized source of beach nourishment sand in North Carolina is the ebb-tide delta and channel sand in adjacent inlets. Even though this sand is usually high quality and beach-compatible, mining it destabilizes the inlets and results in negative impacts upon long-shore sediment transport and long-term sediment budget for both the barrier islands and their adjacent inlets.
Prior to the storms of the late 1990s, about 12 miles of public beaches in North Carolina ocean coast communities were regularly nourished. Wrightsville Beach started nourishing their beach in 1939, Carolina Beach started in 1955 (Fig. 19), and Kure Beach started in 1997, all with significant federal funding programs. Today, ocean beach communities desire over 122 miles of nourishment projects. Since the early 2000s, the federal government appears to be unwilling to fund any new beach nourishment projects, other than navigation projects, and public referendums have generally failed to produce the necessary support for local funding, except for Bogue Banks and a few other island communities.
A summary of available data (from the Program for the Study of Developed Shorelines) for two coastal towns
fiGure 19. Three photographs clearly demonstrate the short-term survival of beach nourishment projects. The nourishment data show the recent record (1985 to 2004) of beach nourishment operations for Carolina Beach. Panel A shows what is left of a 1985 operation on April 1986. Panel B shows that all of the 1985 nourishment has gone by October 1987 and the rock revetment, built prior to the 1985 “no shoreline hardening rule”, is exposed. Panel C shows the 1988 beach nourishment operation in progress. Beach nourishment during the 1985 to 2004 period averaged one operation of about 1.27 million cubic yards every 2.6 years. The red X marks the same house. Photographs are by Pilkey and Thieler (1992) and the data are from the Program for the Study of Developed Shorelines, Western Carolina University (http://psds.wcu.edu).
follows: Carolina Beach, NC 28 operations 1955-2004 (49 years) Total nourishment sand = about 18.55 million yds3
Average = 1 operation of 662,321 yds3 every 1.75 years
Wrightsville Beach, NC 19 nourishment operations 1955-2002 (47 years) Total nourishment sand = over 10.84 million yds3
Average = 1 operation of about 570,421 yds3
every 2.5 years
The histories of Carolina Beach and Wrightsville Beach nourishment projects demonstrate the generally short-term life expectancy and large volumes of nourishment sand required to “hold the line”. What the data do not record is the dramatic increase in the cost of projects through time.

19
inlet openings and Closings
Hurricane Isabel came ashore in the vicinity of Ocracoke Inlet on September 18, 2003. This small storm produced Isabel Inlet in a low and narrow portion of the barrier adjacent to Hatteras Village (Fig. 20). Two other weak spots (on the northeast end of Ocracoke Island and at the 1962 Buxton Inlet site) came close to forming inlets. Isabel Inlet was subsequently closed within five weeks utilizing sand from the dredged navigation channel for the Hatteras-Ocracoke ferry. This extremely narrow island segment, however, needed a flood-tide delta and its sand deposits to develop island width. This island segment is as vulnerable to inlet formation now as it was prior to Hurricane Isabel. In fact, there are several locations along the North Carolina coast where new inlets could open during a future storm. Using digital elevation data along the Outer
fiGure 21. 1932 (Panel A) and 1999 (Panel B) aerial photographs of the Nags Head area show the growth of Old Nags Head village from the shores of Roanoke Sound to the ocean front. Notice the substantial decrease in the distance from the shoreline to NC Highway 12 from 1932 to 1999. The 19th century ocean-front houses have been moved westward several times in response to shoreline recession. Notice that most of the land and dune fields have been urbanized since 1932. Figure is modified from Riggs and Ames (2003).
fiGure 20. Panel A, a 1998 aerial photograph, shows the vulnerable barrier island segment near Hatteras Village. The 1860 coastline is superimposed (purple lines) to show the extent of island narrowing over 138 years. Panel B is a September 2003 aerial photograph of the newly formed Isabel Inlet through that segment. An inlet at such a location, if allowed to develop, would build sound-side shoals which would widen the island segment, once the inlet closes. Panel C shows marsh peat exposed on the beach after the storm. The marsh peat, which is a few hundred years old, formed on the sound side of the barrier when the ocean shoreline was substantially seaward of its present location. The presence of peat at the location indicated by red stars reduced the likelihood of inlet formation at that site. Panel D shows NC Highway 12 “going-to-sea” following Hurricane Isabel. The location of the north eastern margin of the inlet is indicated by the green stars. Panel C and D photographs are by S. Riggs.

20
fiGure 22. Photographs show the effort to harden the shoreline around the base of the Cape Hatteras Lighthouse starting in 1969 with a groin field (Panel A), and with steel sheet-pile bulkhead, rock revetment, and many sandbags by 1975 (Panel B). Landward relocation finally occurred in 1999 (Panel C). All photographs are by S. Riggs.
Banks, areas of future inlet-opening potential have been mapped. This and other data sets can be explored at http://www.coastal.geology.ecu.edu/NCCOHAZ/.
Relocation
In North Carolina, one of the earliest ocean-front developments, which began after the Civil War in the area of Old Nags Head, was characterized by very deep lots to allow for the systematic relocation of the houses as the shoreline retreated (Fig. 21A). Most of these early houses were moved landward several times during the 20th century. They are now adjacent to NC Highway 12 and cannot be moved further (Fig. 21B). In 1999, the Cape Hatteras Lighthouse was finally relocated 1600 feet inland after many futile efforts from 1969 to 1999 to combat coastal erosion. Relocation (Fig. 22) can be considered for all buildings that
occur in the high-hazard ocean-front and inlet zones.
Within the southeastern portion of the North Carolina coast, the barrier island segments from Onslow Beach southward to Carolina Beach (Fig. 1) are sediment poor, dominated by numerous small and migrating inlets, and are in a general state of shoreline recession. The heavily developed, sediment-poor islands include Topsail, Figure 8, Shell Island, Wrightsville Beach, Carolina Beach, and Kure Beach to Fort Fisher. Communities along the ocean and inlet hazard zones have only been able to partially protect their property from sea-level rise and storm activity; they are dependent upon regular beach nourishment projects or hardened structures. However, as sea level continues to rise and sand supplies are diminished, the economic cost of beach nourishment will increase substantially and dictate the need to begin relocation.

21
A Vision for the Future
Until the middle of the 20th century, the North Carolina barrier islands had several villages with subsistence populations that supported small tourist and fishing industries. However, in the second half of the 20th century, the coastal barriers evolved into an economic engine that has become a critical cornerstone of North Carolina’s economy. Billions of tourism dollars are generated annually. North Carolina has 21 coastal counties with 865,000 residents (10.3% of the state population) and is growing. Several ocean-front counties had 76 to 150% population growth from 1970 to 2000 (http://maps.csc.noaa.gov/hurricanes/pop.jsp). The islands that used to be dominated by small beach cottages are now lined with high-rise hotels, condominiums, and large vacation homes. However, there are limits to growth and type of development on migrating barrier islands. To preserve the barrier island-based, tourist/recreation economy and the natural resources upon which it is based, it is imperative that we start to develop viable, long-term management plans that include adaptation to a dynamic, mobile, and rapidly changing natural system. The possibilities are limited only by our imaginations.
Northeastern North Carolina: “A String of Pearls”
Oregon Inlet Bridge and NC Highway 12 were constructed in the 1950s and 1960s to enhance the economic development of the Outer Banks. These structures were built across Cape Hatteras National Seashore and Pea Island National Wildlife Refuge to connect eight isolated villages to the Kitty Hawk to Nags Head urban area to the north. Over the following five decades, the ocean shoreline receded, overwash and inlet processes essentially terminated, sea-level rose, and many miles of the barrier islands narrowed substantially.
Thus, it is time to rethink our approach to utilizing the island segments that are threatened by rising sea level,
fiGure 23. Map of the Outer Banks showing the possible remaining islands were a Katrina-like hurricane, or several smaller hurricanes, to strike the Outer Banks. Adaptation strategies could lead to several Ocracoke-style destination villages on the remaining Outer Banks. Ferry hubs in some mainland villages could be set up to service them. Fast hydrofoils or hovercraft could comprise the ferry system. A new and substantial coastal economy could be developed.
ADAPTATION ALTERNATIVES
storms, and anthropogenic modifications. If we withdrew from some of the coastal highways and terminated the construction of barrier dune ridges, the islands would begin their natural rebirth as inlet and overwash dynamics would once more rebuild them. The eventual result would likely be a barrier island system with eight Ocracoke-style destination villages (Fig. 23) strung like a string of pearls upon a vast network of inlet and shoal environments that would afford us many new opportunities for economic development. We cannot stop major storms from striking North Carolina. We cannot stop sea-level from rising. We cannot stop the barrier islands’ natural tendency to migrate landwards in response to rising sea level. We are now at a threshold. Large segments of the barrier islands have almost washed away. NC Highway 12 can no longer be relocated on narrow island segments. But we can still maintain a vital coastal economy and preserve the natural resource base. As a starting point for discussion, consider this possible course of action. If we were to withdraw from the Oregon Inlet bridge (except for the ends to be utilized as fishing piers)

22
and from NC Highway 12, except within Bodie Island and the villages of Rodanthe, Waves, Salvo, Avon, Buxton, Frisco, Hatteras, and Ocracoke, we could not only save billions of dollars, but also expect the following responses.
1. Several small inlets and associated inlet flats and ebb- and flood-tide deltas would be formed, thus building back-barrier shoal and marsh systems critical to island integrity.
2. Large areas of island overwash would begin to build island elevation and width.
3. The increased water exchange between Pamlico Sound and the Atlantic Ocean would result in substantial improvement in water quality and productivity of marine and estuarine ecosystems.
4. Significant increase in overwash, inlet, and shoal habitats would vastly expand the natural habitats for several endangered bird and animal species.
5. The increase in overwash and inlet-shoal habitats would also produce an increase in fishing sites, as well as opportunities for other forms of recreation including hiking, camping, kayaking, birding, and off-road recreational vehicle use.
6. New opportunities would present themselves for many new small businesses such as water taxis, mule train and ATV tours, fishing and hunting guides
7. Each of seven villages will have the potential to become an Ocracoke-style destination village (Fig. 23).
8. A world-class eco-tourism economy could be built around the natural and human history and culture of North Carolina’s unique Outer Banks.
9. The villages could be inter-connected by a system of modern ferry and water- taxi systems (jet-powered catamarans and hydrofoils) capable of moving large volumes of visitors rapidly to and between destination villages with minimal disturbance to ecosystems
10. Supply trucks, tourist buses, garbage trucks, SUVs, and personal vehicles of the village residents could be transported using the NC DOT ferry system or hovercraft similar to those used by the U.S. Marine Corps.
fiGure 24. Examples of alternate, non-invasive transportation systems utilized on small island communities throughout the world. Photographs are by S.Riggs.

23
11. Ferry terminals could be located at the small rural mainland villages such as Wanchese, Stumpy Point, Engelhard, Swan Quarter, and Cedar Island (Fig. 23).
12. These towns could maintain short- and long-term car parks, allowing tourists in the destination villages to utilize less invasive types of transport systems (e.g., bikes, golf carts, pedi-cabs, trolleys, mule-trains, etc.) (Fig. 24).
13. Mainland towns would be in a position to develop many local businesses (e.g., motels, restaurants, B and Bs, service stations, etc.) and become centers for new natural resource-oriented business opportunities (e.g., guiding and supplying eco-tours of the Outer Banks and mainland Inner Banks (e.g., black-water paddle and camping trips, estuarine cruising trips, coastal over-flight field trips, historical tours, hunting-fishing-birding tours, etc.).
Southeastern North Carolina:“Islands of Opportunity”
Imagine what could be done with our highly developed beach communities of southeastern North Carolina as sea-level rise and storm dynamics continue into the future. By determining levels of vulnerability through detailed geomorphic mapping, communities can begin to develop adaptation programs that involve sustainable economic development. Below are some concepts that could be included in planning for barrier island adaptation management. Some of these ideas might be characterized as unfeasible but we include them here in the hopes of encouraging discussion of these issues. The alternative is to ignore the reality of sea-level rise and the associated and inevitable coastal erosion and barrier island migration.
1. A regional evaluation of the southeastern barrier island system and the mainland shore could be undertaken to assess long-term usability of each island. Some islands may be suitable for “holding the line” and others less so.
2. Recognizing that not all islands have the same characteristics, some could sustain full development, some could sustain lesser development, the amount dependant on the economic viability of beach nourishment. Some islands and segments of the mainland may be best suited to various kinds of day-use, and others could become nature preserves and wildlife refuges.
3. Bridges become old and unsafe and are extremely expensive to replace. Not replacing some bridges is an option that should be thoroughly researched and discussed. If it is determined that a bridge should not be replaced, a system involving car parks on the mainland and a water-taxi and/or ferry service to the island in question could be developed. Bald Head Island, which utilizes only golf carts and bikes, except for service vehicles, already operates this kind of system.
4. Owners of the high-hazard land along the ocean-front, inlet hazard areas, and locations where inlets are most likely to occur could consider a wide range of alternative uses (for example, bait and tackle shops, concession stands, bath houses, parking, etc.).
5. All houses and commercial structures could be raised and piled high enough off the ground to allow storm-surge overwash and sediment accretion. Less damage will result and the natural process of island building can take place.
6. Portions of shore-parallel roads could be left unpaved and, if necessary, portable metal ramping could be utilized on overwash fans after major storms. Shore-perpendicular roads could be staggered (to minimize flood conduits) and some could be maintained as sand roads.
7. Low supra-tidal zones and marshes on the sound sides of barrier islands could be protected to allow for natural island evolution. A similar strategy could be used for low-lying environments on the mainland coasts. These wetland systems, which are critical for fisheries and water quality, could continue to be utilized for eco-tourism.
24
A CONCLUDING THOUGHT
The documented increasing rate of sea-level rise and the possibility of increased intensity of tropical storms are threats to our coastal economy that we must not ignore. Adaptation to the ever-changing coastal environment is the key. Our vision for the future of coastal North Carolina, based on an understanding of the origin and evolution of the barrier island-estuarine system, is preliminary and unrefined. Future actions such as those outlined above could lead to a renaissance that has more potential pay-offs than our current approach to coastal management can provide in a changing climatic regime.
If we so determine, we can protect the natural resources of the barrier islands, preserve the historical and cultural heritage of coastal and mainland villages, and avert a head-on collision of an increasing population with the natural processes of a migrating shoreline. The climate is changing, sea level is rising. We must adapt to these changes if we hope to maintain a viable coastal economy and to preserve the natural resources upon which that economy is based.
ACKNOWLEDGEMENTS
Much of the work summarized in this report is the product of the North Carolina Coastal Geology Cooperative, a multi-year research program led by East Carolina University, the United States Geological Survey and the North Carolina Geological Survey, with contributions from scientists at the University of Delaware, University of Pennsylvania, and Virginia Institute of Marine Sciences. Funding for the USGS cooperative agreement awards 02ERAG0044, 02ERAG0050, 01ERAG0015, 07ERAG0020 and NSF cooperative agreement award OCE-9807266 is gratefully acknowledged. Additional support came from a University
of North Carolina Research Competitiveness award, as well as the U.S. National Park Service, U.S. Fish and Wildlife Service, Environmental Defense, N.C. Division of Coastal Management, N.C. Division State Parks and Recreation. The work of students and staff of the Department of Geological Sciences at East Carolina University and the ECU Institute for Coastal Science and Policy is gratefully acknowledged as is the review by G. “Rudy” Rudolph. Sources of aerial photographs: USACE-FRF, Duck; USACE-Wilmington; CHNS, Manteo; NC State database; NC DOT; US Geological Survey.

25
REFERENCES CITED
Boss, S.K., and Hoffman, C.W. 2000. Sand Resources of the North Carolina Outer Banks 4th Interim Report: Assessment of Pea Island Study Area. N.C. Department of Transportation and Outer Banks Task Force Report, 29 p.
Culver, S.J., Grand Pre, C.A., Mallinson, D.J., Riggs, S.R., Corbett, D.R., Foley, J., Hale, M., Metger, L., Ricardo, J., Rosenberger, J., Smith, D.G., Smith, C. W., Snyder, S.W., Twamley, D., Farrell, K. and Horton, B.P. 2007. Late Holocene barrier island collapse: Outer Banks, North Carolina, USA. The Sedimentary Record, 5: 4-8.
Culver, S.J., Farrell, K., Mallinson, D.J., Horton, B.P., Willard, D.A., Thieler, E.R., Riggs, S.R., Snyder, S.W., Wehmiller, J.F., Bernhardt, C.E., and Hillier, C. 2008. Micropaleontologic record of late Pliocene and Quaternary paleoenvironments in the northern Albemarle Embayment, North Carolina, U.S.A. Palaeogeography, Palaeoecology, Palaeoclimatology, 264: 54-77.
Douglas, B.C., Kearney, M.S., and Leatherman, S.P. 2001. Sea Level Rise: History and Consequences. Academic Press, San Diego, CA, 232 p.
Gornitz, V., and Lebedeff, S. 1987. Global sea level changes during the past century, In Sea Level Fluctuation and Coastal Evolution, Nummendal, D., Pilkey, O.H., and Howard, J.D., eds., SEPM Special. Publication. 4: 13-16.
Hicks, S.D., Debaugh, H.A., and Hickman, L.E. 1983. Sea level variations for the United States 1855-1980. NOAA, NOS, Silver Spring, MD, Technical Report, 170 p.
Horton, B.P., Thieler, E.R., and Riggs, S.R. 2007. A methodology for analyses of relative sea-level data: a case study from North Carolina. Geological Society of AmericaSoutheastern Regional Meeting, Savannah, GA. Abstracts with Programs, 39: 24.
Horton, B.P., Corbett, D.R., Culver, S.J., Engelhart, S.E., Himmelstoss, Kemp, A.C., Mallinson, D., Riggs, S.R., Thieler, E.R., and Willard, D.A. In press. Holocene sea-level changes along the North Carolina coastline: implications for glacial isostatic adjustment models and current rates of sea-level change. US Geological Survey Circular.
IPCC. 2007. Climate Change 2007. Fourth Assessment Report to the Intergovernmental Panel on Climate Change. Cambridge University Press, Cambridge, England.
Kemp, A., Horton, B., Culver, S., Corbett, R., Thomson, K., Van De Plassche, O. 2007. Evidence for recent acceleration(s) in the rate of sea-level rise from the Albemarle-Pamlico estuarine system, North Carolina. Geological Society of America Annual Meeting, Denver, CO. Abstracts with Programs, 39: 68.
Mallinson, D., Riggs, S., Thieler, E.R., Culver, S.J., Foster, D.S., Corbett, D.R., Farrell, K., and Wehmiller, J.F. 2005. Late Neogene and Quaternary evolution of the northern Albemarle embayment (mid-Atlantic continental margin, U.S.A.) Marine Geology, 217: 97-117.
Mallinson, D., Burdette, K., Mahan, S., Brook, G. 2008. Optically stimulated luminescence age controls on late Pleistocene and Holocene coastal lithosomes: North Carolina, USA. Quaternary Research, 69: 97-109.
NCDCM. 2004. North Carolina 1998 long-term average annual erosion rate update: methods report by Benton, S.B., Bellis, C.J., Knisel, J.M., Overton, M.F., and Fisher, J.S. North Carolina Division of Coastal Management, Raleigh, NC.
Pilkey, O.H., and Thieler, E.R. 1992. Coastal Erosion. Society of Economic Paleontologists and Mineralogists, Tulsa, OK, Slide Set No. 6: 1-24.
Riggs, S.R. and Ames, D.V. 2003. Drowning of North Carolina: Sea-Level Rise and Estuarine Dynamics. NC Sea Grant College Program, Raleigh, NC, Pub. No. UNC-SG-03-04, 152 p.

26
Riggs, S.R., and Ames, D.V. 2007. Effect of Storms on Barrier Island Dynamics, Core Banks, Cape Lookout National Seashore, North Carolina, 1960-2001. U.S. Geological Survey, Scientific Investigations Report 2006-5309, 73 p.
Riggs, S.R., and Cleary, W.J. 1997. Analysis of potential cross-shelf corridors for the shallow water training range (SWTR), Onslow Bay, North Carolina. U.S. Navy, Department of Defense, 66 p.
Riggs, S.R., and Cleary, W.J. 1998. Textural analysis of the Silverdale Formation on the inner continental shelf, Onslow Bay, NC: top priority cross-shelf corridor for the shallow water training range (SWTR). U.S. Navy, Department of Defense, 31 p.
Riggs, S.R., Cleary, W.J., and Snyder, S.W. 1995. Influence of inherited geologic framework upon barrier beach morphology and shoreface dynamics. Marine Geology, 126: 213-234.
Riggs, S.R., Rudolph, G.L., and Ames, D.V. 2000. Erosional scour and geological evolution of Croatan Sound, northeastern North Carolina. North Carolina Department of Transportation, Report no. FHWA/NC/2000-002, 117 p. Robinson, P.J. 2005. North Carolina Weather and Climate. University of North Carolina Press, Chapel Hill, 237 p.
Smith, C.W., Mallinson, D.J., Culver, S.J., Riggs, S.R., and Mahan, S. 2006. Lithologic, geophysical, and paleoenvironmental framework of relict inlet channel-fill and adjacent facies: North Carolina Outer Banks. GSA Annual Meeting, Philadelphia, October 2006.
Stick, D. 1987. The Ash Wednesday Storm. Gresham Publications, Kill Devil Hills, N.C., 100 p.
Thieler, E.R., Foster, D.S., Mallinson, D.M., Himmelstoss, E.A., McNinch, J.E., List, J.H., and Hammar-Klose, E.S. 2006. Quaternary Geophysical Framework of the Northeastern North Carolina Coastal System. U.S. Geological Survey Open-File Report 2006-1178. DVD-ROM. Available online at http:// pubs.usgs.gov/of/2006/1178/.
Zervas, C.E. 2004. North Carolina Bathymetry/Topography Sea Level Rise Project: Determination of Sea Level Trends. NOAA Technical Report NOS CO-OPS 041, May, 31 p.
FURTHER READING
Day, J.W., Christian, R.R., Boesch, D.M., Yanez-Arancibia, A., Morris, J., Twilley, R.R., Naylor, L., Schaffner, L., and Stevenson, C. 2008. Consequences of climate change on the ecogeomorphology of coastal wetlands. Estuaries and Coasts, 31: 477-491.
Gutierrez, B.T., Williams, S.J., and Thieler, E.R. 2007. Potential for Shoreline Changes due to Sea-Level Rise along the U.S. Mid-Atlantic Region. U.S. Geological Survey Open-File Report 2007-1278. Web only, available at http://pubs.usgs.gov/of/2007/1278.
Pilkey, O.H., Neal, W.J., Riggs, S.R., Webb, C.A., Bush, D.M., Pilkey, D.F., Bullock, J., and Cowan, B.A. 1998. The North Carolina Shore and Its Barrier Islands: Restless Ribbons of Sand. Duke University Press, Durham, NC, 319p.
Riggs, S.R. 2001. Shoreline Erosion in North Carolina estuaries. NC Sea Grant College Program, Raleigh, NC, Pub. No. UNC-SG-01-11, 69p.
Williams, S.J., Dodd, K., and Gohn, F.K. 1995. Coasts in Crisis. U.S. Geological Survey Circular 1075, 31p.
A digital version of this document, along with reports on related research funded by a grant from the University of North Carolina system, can be accessed at the North Carolina Coastal Hazards Decision Portal: http://www.coastal.geology.ecu.edu/NCCOHAZ/.

BaCK Cover PhotoGraPh. A NASA Terra satellite image of Hurricane Isabel as it made landfall across North Core Banks, North Carolina on September 18, 2003. Isabel was a category 5 hurricane while at sea, but slowed and diminished in intensity as it approached North Carolina. It came ashore as a category 2 storm with about a 6 to 8 foot storm surge and 100 mph winds. The storm opened Isabel Inlet adjacent to Hatteras Village and came within minutes and/or inches of opening additional inlets between Avon and Buxton and on the northeast end of Ocracoke Island.