North Carolina International Terminal Infrastructure...
68
PREPARED BY SEPTEMBER 2008 North Carolina International Terminal Infrastructure Report PREPARED FOR NORTH CAROLINA STATE PORTS AUTHORITY TB062008004BAO
-
Upload
hoangquynh -
Category
Documents
-
view
216 -
download
2
Transcript of North Carolina International Terminal Infrastructure...

PREPARED BY
SEPTEMBER 2008
North Carolina International TerminalInfrastructure Report
PREPARED FOR
NORTH CAROLINA STATE PORTS AUTHORITY
TB062008004BAO


North Carolina International Terminal I n f r a s t r u c t u r e R e p o r t
Prepared for North Carolina State Ports Authority
Prepared by CH2M HILL
September 2008


TB062008004BAO\082630001 iii Copyright 2008 by CH2M HILL Inc.
Reproduction and distribution in whole or in part beyond the intended scope of the contract without the written consent of CH2M HILL Inc. is prohibited.
Contents
Acronyms & Abbreviations...................................................................................................... vii Executive Summary................................................................................................................... xi 1.0 Introduction ..................................................................................................................1-1 2.0 Terminal Operations, Planning and Design...............................................................2-1
2.1 Introduction.........................................................................................................2-1 2.2 Vessel and Vessel Handling...............................................................................2-1
2.2.1 Design Vessel.........................................................................................2-1 2.2.2 Vessel Mooring.......................................................................................2-2 2.2.3 Alternative Maritime Power Supply.........................................................2-4
2.3 Semi-Automated Operation................................................................................2-4 2.3.1 Ship-to-Shore..........................................................................................2-5 2.3.2 On Dock..................................................................................................2-6 2.3.3 Storage Yard...........................................................................................2-6 2.3.4 Semi-Automated Operation (Rail Yard) ..................................................2-8
3.0 Container Terminal Infrastructure ..............................................................................3-1 3.1 Site Civil .............................................................................................................3-1
3.1.1 General Site Description.........................................................................3-1 3.1.2 Datum .....................................................................................................3-1 3.1.3 Geotechnical/Seismic Considerations ....................................................3-1 3.1.4 Terminal Surfaces...................................................................................3-3 3.1.5 Site Grading............................................................................................3-4 3.1.6 Stormwater Management .......................................................................3-5 3.1.7 Site Utilities.............................................................................................3-5 3.1.8 Site Security............................................................................................3-8
3.2 Structures ...........................................................................................................3-9 3.2.1 Wharf ......................................................................................................3-9 3.2.2 Buildings and Facilities .........................................................................3-11
4.0 Port Access ..................................................................................................................4-1 4.1 Dredging.............................................................................................................4-1
4.1.1 Channel Design and Dredging Plan .......................................................4-2 4.1.2 Navigation Channel ................................................................................4-2 4.1.3 Berths, Approach Channel and Turning Basin .......................................4-6 4.1.4 Estimated Dredging Unit Costs.............................................................4-10
4.2 Roadway Access..............................................................................................4-11 4.3 Rail Access.......................................................................................................4-15
4.3.1 Current Rail Condition ..........................................................................4-15 4.3.2 Required Rail Improvements ................................................................4-16 4.3.3 New Mainline Rail Connection..............................................................4-16 4.3.4 Development Considerations................................................................4-18 4.3.5 Intermodal Yard ....................................................................................4-19 4.3.6 Conclusions and Recommendations ....................................................4-20
5.0 Construction Cost Estimate........................................................................................5-1 5.1 Estimate Classification .......................................................................................5-1 5.2 Estimate Methodology........................................................................................5-1 5.3 Current Estimate ................................................................................................5-1

Infrastructure Report
iv TB062008004BAO\082630001 Copyright 2008 by CH2M HILL Inc.
Reproduction and distribution in whole or in part beyond the intended scope of the contract without the written consent of CH2M HILL Inc. is prohibited.
6.0 Project Timeline ...........................................................................................................6-1 7.0 List of Works Cited ......................................................................................................7-1
7.1 Additional Works Referenced.............................................................................7-1
Tables
3-1 Pavement Zones and Proposed Profiles........................................................................3-4 3-2 Wharf Configuration Parameters....................................................................................3-9 4-1 Summary Of Dredging Volumes And Estimated Costs ..................................................4-1 4-2 Summary of Required Rail Components......................................................................4-17 5-1 Summary of Estimated Construction Costs ...................................................................5-1
Figures
1-1 Satellite View of the Project Site Relative to Wilmington and the Town of Southport ....1-2 1-2 Plan View of the Full Build-Out of the North Carolina International Terminal with
Three 12,000-TEU Vessels at Berth .............................................................................1-3 2-1 Cross-Section of a Representative Vessel Showing 23 Containers on Deck with
22 Below Deck ...............................................................................................................2-3 2-2 Series of Articulated Arms with Vacuum Pads Secured to Vessel Hull at Low Tide......2-4 2-3 Vacuum Pad Secured to Vessel at High Tide ................................................................2-4 2-4 Container Being Lowered Past OCR Cameras on Crane Frame...................................2-5 2-5 Example of OCR System Main Display..........................................................................2-5 2-6 Double-Stack Loaded Container Cassette Buffering .....................................................2-6 2-7 Translifter That Will Be Lowered, Driven Under Cassette, Then Raised .......................2-6 2-8 Double-Stack Loaded Container Cassette Being Towed by a Yard Tractor ..................2-6 2-9 Rendering of the Container Storage Yard Showing the Blocks and the Landside
Loading to Truck Operation............................................................................................2-7 2-10 Example of a Straddle Carrier........................................................................................2-9 3-1 Cross-Section of Stormwater Channel Along Perimeter Site Security Fencing .............3-5 3-2 Cross-Section Showing the Pile-Supported Wharf Structure.......................................3-10 4-1 Wash Probe Results ......................................................................................................4-3 4-2 Representative Geologic Profile for the Cut-Thru ..........................................................4-4 4-3 Representative Geologic Profile for the Current Channel ..............................................4-5 4-4 Channel Alignment of Main Channel, Turning Basin, and Berthing Area.......................4-7 4-5 Main Channel Including Offshore Approach ..................................................................4-8 4-6 Proposed Dredging and Placement Areas.....................................................................4-9 4-7 Proposed Dredging and Placement Areas Typical Dredge Section Turning
Basin Area....................................................................................................................4-10 4-8 Existing and Proposed Access Routes into North Carolina International Terminal......4-12 4-9 4-Lane New and Existing Alignment ............................................................................4-13 4-10 8-Lane Alignment .........................................................................................................4-14 4-11 CSX Sunny Point Junction – Looking West & East......................................................4-15 4-12 USA Leland Yard – South End Looking North & South Gate.......................................4-16 4-13 Primary Energy Rail Structure......................................................................................4-16 6-1 Timeline for Planning, Development and Construction ..................................................6-2

Infrastructure Report
TB062008004BAO\082630001 v Copyright 2008 by CH2M HILL Inc.
Reproduction and distribution in whole or in part beyond the intended scope of the contract without the written consent of CH2M HILL Inc. is prohibited.
Appendices
A Glossary
B Assumptions and Supplemental Data
C Drawings
D Terminal Automation Technical Memorandum
E Port Capacity Calculations
F Yard Capacity Calculations
G Geotechnical Report (MACTEC)
H Heavy Duty Pavement Systems Technical Memorandum
I Dredge Reports
• Dredge Technical Memorandum for the North Carolina International Terminal (CH2M HILL)
• North Carolina International Terminal Phase 2B Geotechnical Report and Cost Analysis (Gahagan and Bryant Associates, Inc.)
J Basis of Estimate

TB062008004BAO\082630001 vii Copyright 2008 by CH2M HILL Inc.
Reproduction and distribution in whole or in part beyond the intended scope of the contract without the written consent of CH2M HILL Inc. is prohibited.
Acronyms & Abbreviations AASHTO American Association of State Highway and Transportation Officials AC asphalt concrete ACI American Concrete Institute ACS access control system ADA Americans with Disabilities Act ADM Archer Daniels Midland AGV automated guided vehicle AMP alternative maritime power ARMG automated rail-mounted gantry crane ASD allowable stress design Authority North Carolina State Ports Authority AWWA American Water Works Association bgs below ground surface BMP best management practice CCTV closed circuit television CIP Capital Improvement Plan CO-HM commercial heavy manufacturing CP concrete paver CTP Comprehensive Transportation Plan CY cubic yards DA drivers assistance DL dead load DTM digital terrain model DWT dead weight tonnage ea each EIS Environmental Impact Statement EM Engineering Manual (U.S. Army Corps of Engineers) EMC Electric Membership Corporation FEU forty-foot equivalent unit FGS forty-foot ground slot fps feet per second ft feet ft3 cubic foot GBA Gahagan & Bryant Associates, Inc. GIS geographic information system gpd gallons per day gpm gallons per minute HCM Highway Capacity Manual HS20 Highway Specification 20 ICW inside crane width IY Intermodal Yard IRR internal rate of return ISO International Organization for Standardization kA kiloampere

Infrastructure Report
viii TB062008004BAO\082630001 Copyright 2008 by CH2M HILL Inc.
Reproduction and distribution in whole or in part beyond the intended scope of the contract without the written consent of CH2M HILL Inc. is prohibited.
kV kilovolt kVA kilovolt-ampere LF linear feet LL live load LOA length over all LOS level of service LT long ton LS lump sum m meter M&R maintenance and repair MLW Mean Low Water MLLW Mean Lower Low Water MOTSU Military Ocean Terminal, Sunny Point mph miles per hour MSL mean sea level mVA megavolt-ampere NAVD North American Vertical Datum NCAC North Carolina Administrative Code NC-CREWS North Carolina Region Evaluation of Wetland Significance NCDOT North Carolina Department of Transportation NFPA National Fire Protection Association NGVD National Geodetic Vertical Datum NOAA National Oceanic and Atmospheric Administration NPX New Panamax NTP Notice to Proceed O&M operation and maintenance OCR optical character recognition ODMDS Ocean Dredged Material Disposal Site PCC Portland concrete cement PF peaking factor PIANC Permanent International Association of Navigation Congresses PIDAS perimeter intrusion, detection, assessment system psf pounds per square foot psig pounds per square inch gauge PVC polyvinyl chloride PTZ pan tilt zoom RCC roller compacted concrete RMS root mean square ROW right-of-way RPZ reduced pressure zone RTG rubber tire gantry SMS security management system SPT standard penetration test TEU twenty–foot equivalent unit TGS twenty-foot ground slot TL trolley load TM technical memorandum

Infrastructure Report
TB062008004BAO\082630001 ix Copyright 2008 by CH2M HILL Inc.
Reproduction and distribution in whole or in part beyond the intended scope of the contract without the written consent of CH2M HILL Inc. is prohibited.
TOS terminal operating system TRB Transportation Research Board of the National Academies TSS total suspended solids TTS marine company headquartered in Bergen, Norway TWIC transportation worker identification credential UNCTAD United Nations Conference on Trade and Development USA rail line owned and operated by the U.S. Army USACE United States Army Corps of Engineers USD U.S. dollars V volt WRDA96 Water Resources Development Act of 1996


TB062008004BAO\082630001 xi Copyright 2008 by CH2M HILL Inc.
Reproduction and distribution in whole or in part beyond the intended scope of the contract without the written consent of CH2M HILL Inc. is prohibited.
Executive Summary The North Carolina State Ports Authority (the Authority) is planning a major investment in a new container terminal located on a 600-plus acre site on the Cape Fear River near Southport, North Carolina. This Infrastructure Report constitutes the concept level planning that was done to support the development of a cost estimate (which is included herein as an appendix) and a Pro Forma Business Plan, which is presented under separate cover.
Planned for potential commissioning in 2017, this new development, the North Carolina International Terminal (the Terminal), will increase the container throughput capacity of the Authority by up to 3 million twenty-foot equivalent units (TEUs) per year. (Three million TEU is a theoretical maximum capacity; the actual throughput will vary depending on market response, prevailing operating conditions, and other factors.) The semi-automatic Terminal is designed to simultaneously accommodate three 12,000-TEU vessels or four 8,000-TEU vessels, which will be serviced by up to 16 gantry shore cranes. At full build-out the container yard will efficiently store and allow for the sorting of 47,680 TEUs of containers, including refrigerated units, at any given time. The Terminal is planned to function under a mix of automated systems and manned equipment and facilities operated by skilled labor.
This intermodal Terminal will interface with both improved existing and new highway and railroad systems. The Terminal will be able to handle over 400 trucks at a time, and over 1,550 trucks per day will be loaded and unloaded. These trucks will transit via some 20 miles of new four-lane highway which will link to US 17. With over 6 miles of on-terminal rail, on the order of 10 trains will be loaded per day and discharged to the CSX rail network and beyond. Typically, after arriving at the Terminal, containers will move by truck to cities and distribution centers within a 150-mile radius of the Terminal, while railroads will move them to points more distant. It is envisaged that in designated areas around the new Terminal, warehouses will be developed, many over one million square feet in size, to handle cargoes and product processing and assembly.
The federal navigation channel which is adjacent to the Terminal site is currently dredged to -42 feet; it will need to be re-aligned and deepened to -52.5 feet to accommodate the project design vessel. Once improved, this channel will reduce transit times because the new Terminal will be some 20 miles closer to the ocean on the Cape Fear River channel than is the Port of Wilmington; the dredging will also increase the size of vessels that can be accommodated.


TB062008004BAO\082630001 1-1 Copyright 2008 by CH2M HILL Inc.
Reproduction and distribution in whole or in part beyond the intended scope of the contract without the written consent of CH2M HILL Inc. is prohibited.
1.0 Introduction The North Carolina State Ports Authority (the Authority) is considering the development of a new container terminal on the Cape Fear River near the town of Southport in Brunswick County, North Carolina, to be called the North Carolina International Terminal (the Terminal) (see Figure 1-1 below and Drawing C-1, Project Site Location, Sheet 1 in Appendix C). The Authority has initiated a phased process for studying and evaluating the economic viability of the Terminal based on a concept-level business analysis which consists of the following steps:
• Review the potential goods traffic and projected growth in the target market (opportunity and competitive assessments)
• Gather information on appropriate and state-of-the-art container port operations and site-specific infrastructure requirements
• Develop conceptual engineering plans
• Develop a cost estimate for construction
• Develop a Pro Forma Business Plan
This Infrastructure Report constitutes the concept level planning that was done to support the cost estimate and the Pro Forma Business Plan. While the cost estimate is included in this report (see Section 5.0, Construction Cost Estimate, and Appendix C), the Pro Forma Business Plan is a stand-alone document to be provided under separate cover.
At the outset of this Terminal project, a number of planning assumptions were discussed with the Authority. As the work progressed, these assumptions were expanded and in some cases were refined to reflect the evolving requirements of the project. These numerous assumptions have been applied throughout this study and can often be categorized as best practices. To a large extent they can be found in a document titled the North Carolina International Terminal Planning Assumptions (CH2M HILL, 2008) dated March 15, 2008; thus the project assumptions are not exhaustively compiled in one location in this document (although some of the key assumptions are summarized in Appendix B, Assumptions and Supplemental Data). The level of detail which has been developed for the Terminal facility is reflective of that which was needed for the initial planning and engineering investigations from which the Pro Forma Business Plan could be developed. The conceptual framework was used to:
• Identify the operational considerations and the infrastructure components
• Estimate the size and/or quantities of elements
• Forecast cargo throughput
• Estimate construction costs to provide input to the Pro Forma Business Plan
It is understood that the results of the economic evaluation and development opportunities may require changes in the concept presented herewith which will refine the operational, economic, environmental, and design elements of the project.
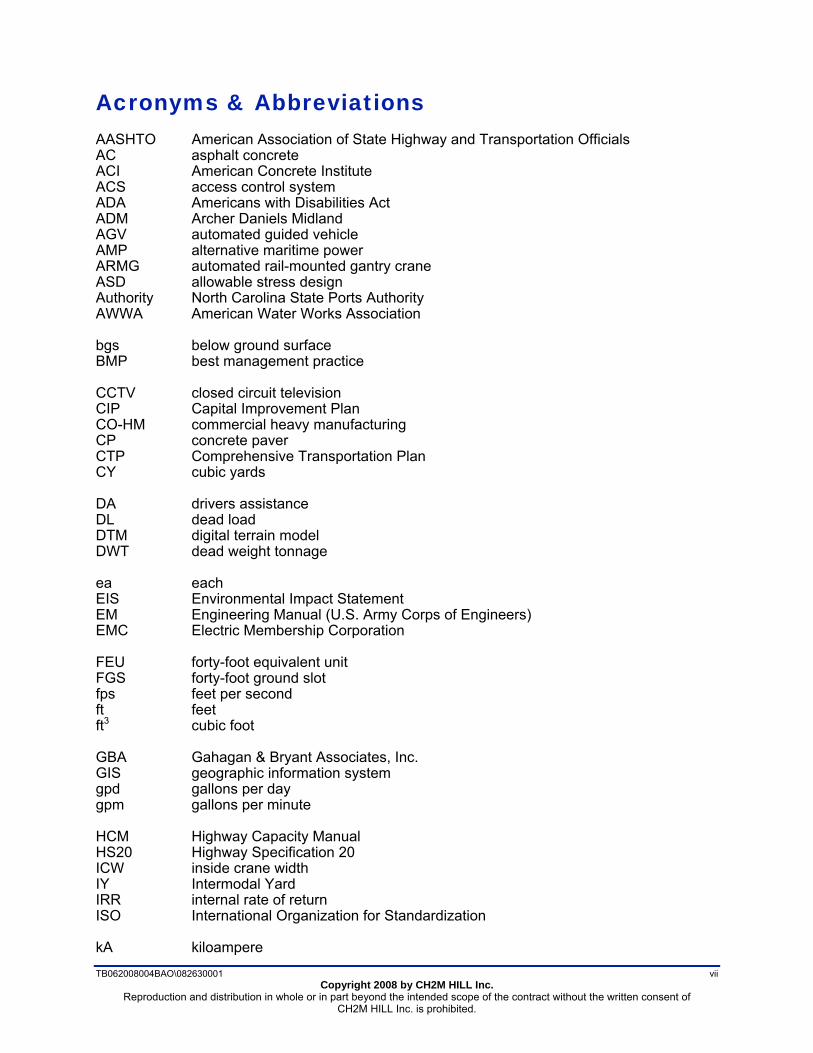
This document identifies the project- and site-specific planning and engineering and assumptions used to develop the concept-level high-density, semi-automated container terminal. A general layout of the terminal was developed to illustrate the size and location of the major facilities and to define the interfaces between the ship, the berth, the storage yard, and the offsite road and rail connections (see Figure 1-2).

Infrastructure Report
1-2 TB062008004BAO\082630001 Copyright 2008 by CH2M HILL Inc.
Reproduction and distribution in whole or in part beyond the intended scope of the contract without the written consent of CH2M HILL Inc. is prohibited.
Figure 1-1 Satellite View of the Project Site Relative to Wilmington and the Town of Southport
Source: Google Earth
Infrastructure Report
TB062008004BAO\082630001 1-3 Copyright 2008 by CH2M HILL Inc.
Reproduction and distribution in whole or in part beyond the intended scope of the contract without the written consent of CH2M HILL Inc. is prohibited.
Figure 1-2 Plan View of the Full Build-Out of the North Carolina International Terminal with Three 12,000-TEU Vessels at Berth

Infrastructure Report
1-4 TB062008004BAO\082630001 Copyright 2008 by CH2M HILL Inc.
Reproduction and distribution in whole or in part beyond the intended scope of the contract without the written consent of CH2M HILL Inc. is prohibited.
The planning horizon of this document is beyond 2030. However, the 2030 timeframe is germane because it is the time limit in which Global Insight1 was able to forecast cargo volumes in their models, which indicate that the terminal will reach capacity before that time. For business planning purposes, it is envisaged that the North Carolina International Terminal will commence operations and revenue generation in the year 2017. To achieve this goal, a three-phase build-out is proposed. Phase 1 will allow for initial operations to begin upon the completion of two berths, part of the yard and the requisite support facilities and infrastructure. This “Minimum Build-out” will be immediately followed by Phases 2 and 3, which complete the rest of the wharf and backland summing to a 271-acre terminal having a total of 4,270 linear feet (LF) of wharf and an annual throughput of 3 million twenty-foot equivalent units (TEUs).
It is recognized that for this terminal to come online in 2017, a concerted effort will be needed on a number of fronts. The Authority will be working with a number of federal, state, local and private entities. The funding sources required for the realization of the project will also be varied. Of particular note will be securing the needed federal monetary contribution for dredging of the main channel, which is often a protracted and time-consuming process.
A glossary of definitions of technical terms used in this document is presented in Appendix A. As noted above, Assumptions and Supplemental Data are summarized in Appendix B, and Drawings are presented in Appendix C. The appendices of this Infrastructure Report also contain several technical memoranda (TMs) prepared for the North Carolina International Terminal project, along with other technical background data that have been used to develop the planning for the Terminal but are too detailed for full inclusion in the body of the report:
• Automated Terminal Operations TM (Appendix D) • Port Capacity Calculations (Appendix E) • Yard Capacity Calculations (Appendix F) • Geotechnical Report (MACTEC) (Appendix G • Heavy Duty Pavement Systems TM (Appendix H) • Dredge Reports (Appendix I). • Basis of Estimate (Appendix J)
Additionally, there are improvements that the terminal will provide which can perhaps be leveraged to benefit the local community at large.
1 Firm used to assist with cargo forecasting for the North Carolina International Terminal.

TB062008004BAO\082630001 2-1 Copyright 2008 by CH2M HILL Inc.
Reproduction and distribution in whole or in part beyond the intended scope of the contract without the written consent of CH2M HILL Inc. is prohibited.
2.0 Terminal Operations, Planning and Design
2.1 Introduction Terminal operations, planning and design are driven by the commodity throughput forecasting over the design horizon of the facility. In the case of the North Carolina International Terminal, an evaluation of the emerging trends in the industry coupled with a rational assessment of the site and the probable funding cycle has led to a site-specific Capital Improvement Plan (CIP).
The North Carolina International Terminal will be developed over time in three phases of construction and will start as a semi-automated operation. This means that the waterside operations will be performed with manned tractors and translifters. The terminal will have the ability to be fully automated at a future date using Automated Guided Vehicles (AGVs).
The following subsection outlines selection of the design vessel, how it will be handled and how the semi-automated container operation will work. The fully automated operation is discussed in the Terminal Automation TM located in Appendix D. Also appended are the port capacity calculations (Appendix E) and the yard capacity calculations (Appendix F).
2.2 Vessel and Vessel Handling The size of the design vessel dictates, to a large extent, the basic waterside infrastructure including the channel layout; the berth configuration; the fendering system; and the number, size and capacity of the gantry shore cranes. The following discussion focuses on the selection of the design vessel, the vessel mooring system, and alternate marine power supply.
2.2.1 Design Vessel
The selection of the project design vessel was made based on a review of the world containerized cargo trade trends and attributes of the nearest competitive ports of Savannah, Georgia; Charleston South Carolina; and Hampton Roads, Virginia. These trends and attributes were related to the geographical location and the planned physical plant of the North Carolina International Terminal with respect to the following main considerations:
• The vessel’s foreseen port of embarkation
• Its volume of cargo
• Its foreseen route
• The current and future expected characteristics of the intended ports-of-call along the route
• The compatibility of the design vessel’s maneuverability with the North Carolina International Terminal
United States container traffic growth trends indicate that a significant number of vessels that will call at the North Carolina International Terminal will be using the transatlantic east-west European and the Southeast Asia through the Suez Canal to the eastern seaboard routes. An additional volume of traffic will be along the north-south east coast of the Americas route. The Northeast Asia to the U.S. east coast route—which will tend to transit the Panama Canal—is also trending upward. Upon completion of the third set of locks (scheduled for 2014), the

Infrastructure Report
2-2 TB062008004BAO\082630001 Copyright 2008 by CH2M HILL Inc.
Reproduction and distribution in whole or in part beyond the intended scope of the contract without the written consent of CH2M HILL Inc. is prohibited.
expanded Panama Canal will allow the transit of vessels which have the following maximum dimensions2:
• Beam of up to 160 feet (ft) 3 • Length overall (LOA): an overall length of up to 1,200 ft • Draft of up to 50 ft
The third set of locks of the Panama Canal will have the following dimensions:
• Width: 180 ft • Length: 1,400 ft • Depth: 60 ft
While the Canal will primarily cater to the vessels in the 8,000-TEU to 10,000-TEU range that will usually make multiple port calls on the East Coast, it is probable that the New Panamax (NPX) vessel will be in the 12,600-TEU range, and possible that it will be in the 13,300-TEU range4. Clearly, the following vessel configuration will not be able to transit the third set of locks of the Panama Canal due to the wide beam, so such a vessel does not represent the NPX class. It is, however, representative of an array of ships expected to feed the North Carolina International Terminal. These vessels can be represented by the following characteristics:
• Container capacity: 12,000 TEU • LOA: 1,260 ft • Beam: 185 ft (22 containers wide on deck) • Draft: 50.0 ft (15.2 m) • Berthing velocity: 0.5 feet per second (fps) • Approach angle: 5° • Allowable hull pressure: 5 kips/square foot • Dead weight tonnage (DWT) is approximately 162,385 long tons (LT)
Thus, this 12,000-TEU ship has been selected as the design vessel and is the largest vessel expected to call at the port (Figure 2-1). It should be noted that due to the constraint of the overall berth length, four 12,000-TEU vessels of these dimensions would not be able to berth simultaneously. For this reason, in the plan of the berth on the Terminal Concept Plan (Drawing C-2, Sheet 2 in Appendix C), four 8,000-TEU vessels are shown.
2.2.2 Vessel Mooring
A state-of-the-art mooring system has been selected for the terminal. Manufactured by MoorMaster, these automated mooring systems have been installed in various ports worldwide. Since their commissioning, these systems have performed over 12,000 automatic mooring operations. The system captures all of the flexibility and characteristics of traditional mooring lines but instead of rope, the units use vacuum pads to provide the mooring attachment. Each pad has a measurable working load providing a powerful physical attachment between the ship and the shore as shown in Figures 2-2 and 2-3.
The vacuum units can adjust to extensive surface irregularities and are able to slide under extreme loads without significant seal deformation or loss of attachment. Because the mooring units attach to the ship closer to the waterline and immediately counteract mooring forces, the system has a greater mooring efficiency than angled ropes. By using sophisticated internet-
2 Third Set of Locks Fact Sheet, Panama Canal Authority , April 24, 2006 3 There is speculation that the Panama Canal Authority will allow wider ships in the future, which would mean 21 boxes wide or 168 ft. (Horizons, Lloyd’s Register, Issue 22, December, 2007, page 11). 4 Horizons, Lloyd’s Register, Issue 22, December, 2007, page 10.

Infrastructure Report
TB062008004BAO\082630001 2-3 Copyright 2008 by CH2M HILL Inc.
Reproduction and distribution in whole or in part beyond the intended scope of the contract without the written consent of CH2M HILL Inc. is prohibited.
Figure 2-1 Cross-Section of a Representative Vessel Showing 23 Containers on Deck with
22 Below Deck

Infrastructure Report
2-4 TB062008004BAO\082630001 Copyright 2008 by CH2M HILL Inc.
Reproduction and distribution in whole or in part beyond the intended scope of the contract without the written consent of CH2M HILL Inc. is prohibited.
based control software, the system permits the user to monitor performance and clearly communicates all essential mooring load information in real-time. A typical MoorMaster installation ensures an “all secure” mooring within 12 seconds of unit activation (manual rope mooring typically takes 35 to 40 minutes and requires a work gang).
2.2.3 Alternative Maritime Power Supply
Ports are moving to Alternative Maritime Power Supply (AMP). AMP—also known as cold ironing—is the process of providing shore-side electrical power to a ship at berth while its main and auxiliary engines are turned off. A heavy wire, resembling an extension cord, is extended from the pier, plugged into the ship’s receptacle and power is supplied to the ship to operate its machinery, but not its main engines. This allows the ship to shut down the diesel engines that normally drive the ship’s electrical generators. When the diesel engines are not operating, the ship’s emissions are greatly reduced.
Infrastructure to support AMP is envisaged for the terminal. Technical details will need to be worked out as the design progresses including:
• Backland infrastructure and equipment • Wharf infrastructure and equipment • Cable management system • Shore-side electrical system5 • Vessel electrical system • Local code requirements • Utility company requirements • Vessel (global) standardization
2.3 Semi-Automated Operation The following discussion focuses on the movement of the container from the ship to the dock and from the dock to the storage yard. As mentioned, this will be a semi-automated operation because it utilizes manned tractors and translifters.
5 For budgetary considerations, a shore-side electrical system has been presumed and is discussed in Section 3.1.7, Site Utilities, of this report.
Figure 2-2 Series of Articulated Arms with Vacuum Pads Secured to Vessel Hull at Low Tide
Source: Cavotec
Figure 2-3 Vacuum Pad Secured to Vessel Hull at High Tide
Source: Cavotec
Infrastructure Report
TB062008004BAO\082630001 2-5 Copyright 2008 by CH2M HILL Inc.
Reproduction and distribution in whole or in part beyond the intended scope of the contract without the written consent of CH2M HILL Inc. is prohibited.
The following operating equipment will be utilized:
• Gantry shore cranes • Container cassettes • Tractor with translifters • Automated rail mounted gantry cranes (ARMGs) (container yard) • Rubber tire gantry (RTG) beam cranes (rail yard) • Straddle carrier (rail yard)
Each of these pieces of equipment and how the operation will work is briefly discussed below. A more detailed discussion of this equipment is presented in the Terminal Automation TM in Appendix D. Plan and section views are shown on Drawings C-3 through C-8, Sheets 3 through 8 in Appendix C.
2.3.1 Ship-to-Shore
Gantry Shore Cranes The terminal will have 16 gantry shore cranes designed to accommodate berthed vessels having up to 22 containers across. These cranes will have dual hoists, maximum sway control (anti-sway systems), and the necessary speed to meet the productivity requirements. The cranes will have either stationary or elevating lashing platforms which reduce the cycle time for ship-to shore movement. The platforms will have the capability to store two or four containers, which will enable the utilization of tandem spreader bars on both hoists.
The gantry shore cranes will either have two independent hoisting system sets to hoist two 40-foot containers or quad-hoist capability to hoist four 20-foot containers.
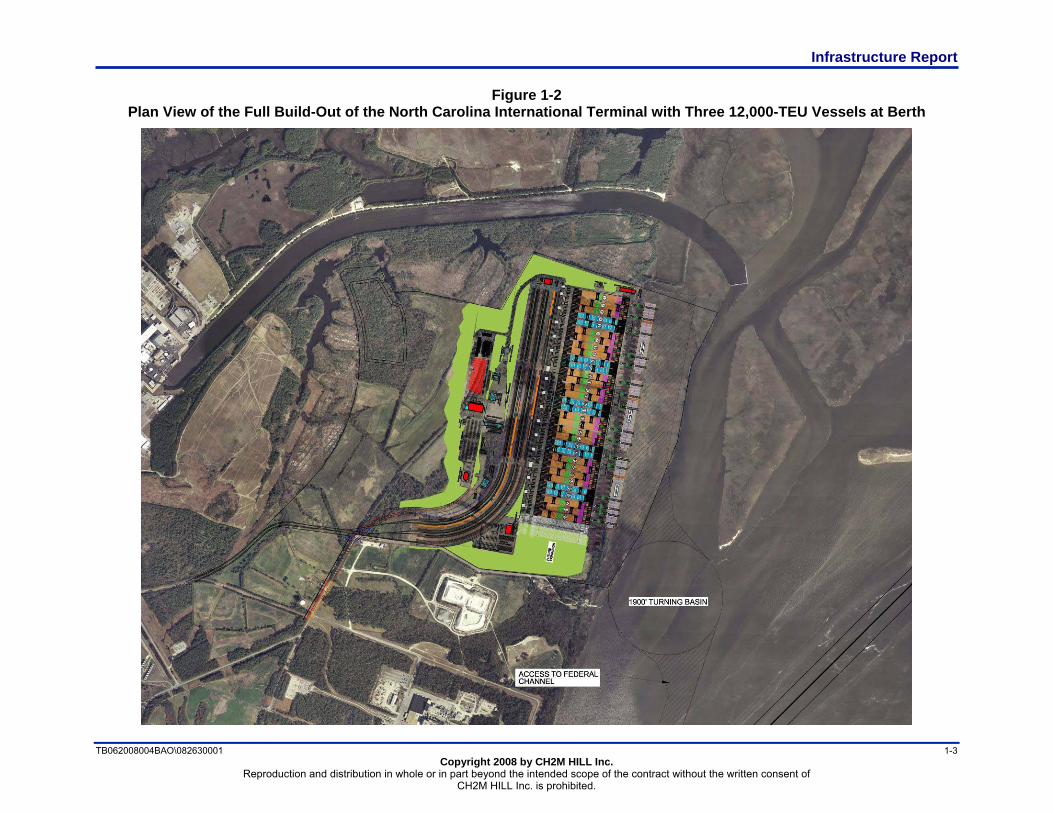
The gantry cranes will have a fully integrated optical character recognition (OCR) system that automatically reads and records the container’s ISO code number as it is handled by a crane. In Figure 2-4, a crane lowers a container towards a truck while OCR cameras mounted on the crane’s sill beam capture images of the container as it passes by. This process establishes real-time automatic tracking of all handled containers. Figure 2-5 shows an example OCR system display.
Figure 2-5 Example of OCR System Main Display
Source: Hi-Tech Solutions
Figure 2-4 Container Being Lowered Past OCR
Cameras on Crane Frame
Source: Hi-Tech Solutions

Infrastructure Report
2-6 TB062008004BAO\082630001 Copyright 2008 by CH2M HILL Inc.
Reproduction and distribution in whole or in part beyond the intended scope of the contract without the written consent of CH2M HILL Inc. is prohibited.
2.3.2 On Dock
The following discussion focuses on the movement of the container from the dock to the storage yard.
Container Cassette Container cassettes (see Figures 2-6, 2-7 and 2-8) are wheeled steel platforms on which containers can be set for transporting about the yard. The containers can be double-stacked so that either 2 x 40-ft or 4 x 20-ft containers can be moved. Container cassettes will serve as the “floating buffer” between the gantry shore cranes and the container blocks (which are discussed below) in the storage yard. Using this system, containers are disconnected from the equipment moving them. Thus, gantry shore cranes or automated rail mounted gantry cranes can work without stopping. This system is an efficient and flexible container handling operation which optimizes the horizontal transportation between the gantry shore cranes and the storage yard blocks.
One of the advantages of utilizing cassettes is that they do not need to be attached to the transportation equipment all the time, which makes for a more productive operation.
Tractor with Translifter The yard towing tractors known as “Ottawas” with translifters will be utilized for the movement of containers placed on cassettes from the gantry shore cranes to the container blocks in the yard, and vice versa. As mentioned, the cassettes act as a floating buffer by allowing the tractor to decouple and make another drop load of containers to either a gantry shore crane or an automated rail mounted gantry crane.
A translifter (Figure 2-7) is a self-loading trailer with 90 metric tons of loading capacity. It is designed to be coupled to any universal towing tractor. These manually operated vehicles lift and move the cassettes with the hydraulic system. Together with the cassettes, they create a flexible and reliable system for all terminal operation demands. Six to seven tractors with translifters will be used per gantry crane.
2.3.3 Storage Yard
The storage yard will be divided into container storage blocks. This block arrangement enables continuous and simultaneous access to each container slot by the yard equipment (see
Figure 2-6 Double-Stack Loaded Container
Cassette Buffering
Source: TTS
Figure 2-7 Translifter That Will Be Lowered, Driven Under Cassette, Then Raised
Source: TTS
Figure 2-8 Double-Stack Loaded
Container Cassette Being Towed by a Yard Tractor
Source: TTS

Infrastructure Report
TB062008004BAO\082630001 2-7 Copyright 2008 by CH2M HILL Inc.
Reproduction and distribution in whole or in part beyond the intended scope of the contract without the written consent of CH2M HILL Inc. is prohibited.
Figure 2-9). The yard will have 32 container blocks which are divided into two types: dry blocks and reefer blocks.
Figure 2-9 Rendering of the Container Storage Yard Showing the Blocks and the Landside Loading
to Truck Operation
Dry Block There will be 22 dry blocks that store 20-ft, 40-ft, and 45-ft containers, which allows for the storage of 1,760 TEU per block. Each block has 32 rows that are 10 containers wide and one container over five high. The first four rows are dedicated for hazardous cargo and will have provisions to contain cargo spills.
Reefer Block There will be 10 reefer blocks that store 20-ft and 45-ft refrigerated containers, which allow the storage of 896 TEU per block. Each block has 14 rows that are nine containers wide and one container over three high. At the face of each row there is a three-story-high steel structure which provides access to the reefer’s receptacles and allows for required servicing and monitoring.
Automated Rail Mounted Gantry Cranes Two ARMGs will operate each container block. A twin operation mode will be utilized where both cranes use the same rails.

Infrastructure Report
2-8 TB062008004BAO\082630001 Copyright 2008 by CH2M HILL Inc.
Reproduction and distribution in whole or in part beyond the intended scope of the contract without the written consent of CH2M HILL Inc. is prohibited.
Operation Waterside of each container block is the buffer area which consists of six vehicle lanes used for delivery or pick-up of containers. Tractors with translifters will deliver a container and leave it on the cassette for a pick-up by the ARMG. The operation within the block is fully automated. The cranes will be controlled by an ARMG management system which communicates with the Terminal Operating System (TOS) where the container position and required movement information reside. The ARMG management system will:
• Compute the crane traveling routes • Calculate crane speeds to avoid collisions • Coordinate the required repositioning of containers within the block
The positioning of the cranes will be controlled by sensors and lasers while camera systems will be used for the landing and picking up of containers.
Landside of each container block will be four lanes where containers will be delivered to trucks and tractors using straddle carriers. These containers will either be outward bound to the road system or bound for the rail yard.
After a truck passes through the gate, the driver will be directed to a specific block to pickup or deliver a container. Upon arrival at the designated container block, the driver will back into the delivery lane. In the event that the lane is occupied by another truck, the driver will park in the truck staging area until the lane frees.
When the lane is free, the driver will back into the lane and place a pass card against a reader which directs the ARMG to retrieve the appropriate container and lower it until it is approximately 15 ft above the chassis. This step will appear on a remote operator’s screen in the control center; the operator will then land the container onto the chassis aided by four cameras, each mounted on a corner of the spreader bar. These basic procedures will apply to containers being delivered to the blocks.
2.3.4 Semi-Automated Operation (Rail Yard)
Rubber Tire Gantry Cranes (RTGs) The intermodal rail yard will be developed with ten working tracks configured in five pairs. Each track will be approximately 4,575 ft in length. The rail yard RTG cranes will operate over two tracks and two rows of grounded container positions at a time. Each pair of tracks will have the capacity to accommodate 30 doublestack railcars and 600 TEUs. Each RTG crane will have an operator who will be aided by automated guidance and positioning technology to minimize cycle time and to ensure damage-free safe operations. RTG cranes are flexible in their mobility within the rail yard, which allows them to be relocated to any track position as daily production requires. A section view of the proposed intermodal yard is shown on Drawing C-6, Intermodal Yard Sections, on Sheet 6 in Appendix C.
Operation. Train arrivals and departures will be influenced by mainline train activity outside of the control of the Terminal. A robust and flexible operating system will be needed to accommodate train arrival and departure peaks, their occasional off-schedule arrivals and the rapid sequence of off-loading and reloading railcars.
Loading and unloading containers to and from rail will be supported by an activity reporting system that is fully integrated and that automatically transmits rail loading and unloading activities, including container positions on the railcar or locations on the ground. To minimize train departure delays, containers and railcars will be programmed and loaded by destination in train departure order. This will eliminate ancillary train switching activities after loaded railcars

Infrastructure Report
TB062008004BAO\082630001 2-9 Copyright 2008 by CH2M HILL Inc.
Reproduction and distribution in whole or in part beyond the intended scope of the contract without the written consent of CH2M HILL Inc. is prohibited.
leave the Terminal as well as the need to build a classification yard outside of the intermodal terminal.
The loading and unloading of containers will be performed by utilizing two RTG cranes working as a team to transfer containers between trackside ground positions and railcar well positions. One operating scenario would have the forward crane lift only the first level of containers. The second crane would allow enough time between lifts to facilitate the removal or placement of twist locks between double-stacked containers and then make the second lift. Ground men will be utilized to perform twist lock application and removal between alternate container lifts. Using this production practice, four RTG cranes will be able to work each pair of tracks simultaneously, and at current industry production levels, it is estimated that each pair of tracks can be unloaded and reloaded in less than five hours. The rail facility will use stabilized beam RTG cranes, eliminating all transfer sway and providing a sustainable production rate of 60 TEU per hour for each crane.
Mathematical modeling indicates that eight RTG cranes will need to be in operation at one time to meet peak rail demand and provide required rail throughput capacity at this facility. Severe train peaking or additional rail throughput can be accommodated by adding additional RTG cranes to this operation.
Straddle Carriers (Rail Yard) Straddle carriers (also called “shuttles”) (Figure 2-10) will be utilized for the transport of containers between the intermodal rail yard and the marine terminal container blocks. Five straddle carriers (one over two) will be used per rail yard RTG crane. Each straddle operator will be aided by automated reporting and task order technology to maximize travel route efficiency, minimize empty travel trips and provide demand-based container movement support.
Operation. Straddle carriers will drop off and pick up containers directly from the ground both at trackside and at the marine terminal container block transfer stations. This operating method creates a buffer between the ARMG operation and the RTG crane lift cycle and maximizes the container delivery and removal rate for each straddle carrier. This operating scenario provides independence in container movement cycles and allows each straddle carrier to maximize its potential productivity. This operation also provides the opportunity to maximize rail yard RTG productivity by eliminating lift cycle dependencies.
Deployment of straddle carriers in this operating scenario will yield higher productivity than utilizing terminal trucks with chassis or bombcarts, because the straddle carriers do not have to wait for containers to be delivered or hoisted.
Figure 2-10 Example of a Straddle Carrier
Source: Kalmar Industries


TB062008004BAO\082630001 3-1 Copyright 2008 by CH2M HILL Inc.
Reproduction and distribution in whole or in part beyond the intended scope of the contract without the written consent of CH2M HILL Inc. is prohibited.
3.0 Container Terminal Infrastructure The planning of the Terminal has characterized the needed infrastructure elements. This section discusses the considerations and conceptual designs of these various elements, including:
• Stormwater management facilities • Utilities • Wharf • Buildings
3.1 Site Civil Using the geotechnical report (see Appendix G) and other specific information available about the site, preliminary engineering has been performed which is aimed a establishing the estimated construction cost information needed. This work is based on known site conditions, appropriate design standards or the latest edition of promulgated codes6, and the conceptual terminal design.
3.1.1 General Site Description
The project site is approximately 20 miles south southwest of Wilmington, N.C. and covers some 600 acres in Brunswick County on the Cape Fear River. Currently, the parcel is zoned as Commercial Heavy Manufacturing (CO-HM) and is made up of land features including pasture/clear fields, woodlands, and wetland marshes.7 The topography ranges in elevation, with the majority of the site approximately 20 ft above the National Geodetic Vertical Datum of 1929 (NGVD). There is a bluff feature that slopes significantly from the tidal area (ranging from elevation 0 to 5 ft NGVD) to the upland area. The project site location is shown on Drawing No. C-1, Sheet 1 in Appendix C and the coordinates are provided in Section B.8, Site Location, in Appendix B, Assumptions and Supplemental Data. A site civil overall plan is provided in Drawing P-1, Sheet 9 in Appendix C.
3.1.2 Datum
A unified project datum has been established. Generally, the vertical datum used for defining dredge depths in ports is Mean Low Water (MLW) or Mean Lower Low Water (MLLW). However, these levels vary with time and therefore must be referenced to a standard fixed datum such as NGVD or the North American Vertical Datum (NAVD). Typically, North Carolina State Ports Authority projects standardize on the 1929 NGVD. As such the 1929 NGVD has been selected as the reference datum for this study. A more thorough discussion of the interrelationship between datums is located in Section B.7 in Appendix B, Assumptions and Supplemental Data.
3.1.3 Geotechnical/Seismic Considerations
Geotechnical Investigation A preliminary geotechnical investigation was performed by MACTEC in early 2008 (see Appendix G). The field investigation consisted of drilling nine boreholes to the depths of 52 to 76 feet below the ground surface (bgs). Standard Penetration Test (SPT) blow-counts were recorded in the borings at various depths, and soil samples were recovered for laboratory tests.
6 The applicable design standards and codes are listed in Appendix B, Assumptions and Supplemental Data. 7 A detailed environmental evaluation of the site has not yet been done. The requisite Environmental Impact Report (EIR) will establish the environmental impacts foreseen and the potential mitigation strategies which will be recommended. To date, no environmental fatal flaw has been brought forth which will fundamentally jeopardize the project.

Infrastructure Report
3-2 TB062008004BAO\082630001 Copyright 2008 by CH2M HILL Inc.
Reproduction and distribution in whole or in part beyond the intended scope of the contract without the written consent of CH2M HILL Inc. is prohibited.
The borings revealed a thin layer of topsoil overlying sandy soil deposits with varying amounts of silt and clay fines to the depths of 24 to 48 feet bgs. This sandy soil is loose, and it is expected to liquefy under the 2-percent-in-50-years earthquake ground motion (or an approximately 2,500-year return period ground motion).
Underneath the loose sandy soil, the borings encountered 10 to 25 feet of thick silty clayey soil deposit. This clayey soil is generally soft to medium stiff in consistency, and it will undergo large deformations or settlements when subjected to loads. A very dense sandy soil layer was encountered below the clayey soil to the depth of 58 to 77 feet bgs. Limestone was encountered in some of the borings to the maximum depths explored.
Groundwater was observed in the borings at depths that varied between 7 to 12 feet bgs, 24 hours after the drilling was completed.
Geotechnical Recommendations • Based on the review and evaluations of the available data, the following geotechnical
recommendations should be considered in the design:
• Slopes and structures need to be designed by considering liquefaction of the upper loose sandy soil. This includes loss of soil bearing capacity, soil lateral movements/spreading, seismic-induced settlements, and increased soil pressures to wharf and embankment.
• Pile foundations should be used to support large/heavy structures. Shallow foundations can be used for smaller structures, provided that they are designed to accommodate large (about 5 to 15 inches) and non-uniform settlements, including seismic-induced settlements.
• The loose sandy soil can be improved to mitigate liquefaction potential. If the site is improved, shallow foundations may be used to support large structures and liquefaction-induced hazards can be reduced.
• The soft clayey soil should be pre-loaded to minimize large settlements.
Seismic Design Recommendations • Based on the SPT blow-counts recorded during the field investigation, the subsurface soil
profile at the project site is classified as Site Class F (site with liquefiable soils).
• Per North Carolina Building Code (2006), a site-specific dynamic response analysis should be performed to characterize earthquake ground motions for a Site Class F.
• Consistent with the current seismic design criteria for ports and harbors that were recently adopted by the Port of Los Angeles (The Port of Los Angeles Seismic Code for Port Structures, POLA Code, 2007), a multi-level earthquake design scenario should be considered. A multi-level design scenario could consist of three earthquake design loads as follow:
− Operating Level Earthquake (OLE), typically defined as a 72-year return period ground motion (or ground motion with 50 percent chance of being exceeded in 50 years). The performance criteria for OLE are ‘forces and deformations should not result in significant damage and interruptions to wharf operations.’
− Contingency Level Earthquake (CLE), typically defined as a 475-year return period ground motion (or ground motion with 10 percent chance of being exceeded in 50 years). The performance criteria for CLE are ‘forces and deformations may result in controlled inelastic structural behavior and limited permanent deformations. Temporary loss of operation should be restorable within an acceptable period of time.’

Infrastructure Report
TB062008004BAO\082630001 3-3 Copyright 2008 by CH2M HILL Inc.
Reproduction and distribution in whole or in part beyond the intended scope of the contract without the written consent of CH2M HILL Inc. is prohibited.
− Ultimate Level Earthquake (ULE), typically determined by codes, such as ASCE 7-05 standard. The performance criteria for ULE are ‘forces and deformations should not result in the collapse of wharf.’
Additional Investigations • The preliminary geotechnical soil borings were performed at widely spaced locations over
the upland portion of the project area. Additional field investigations should be conducted at more locations to better characterize the subsurface conditions, especially at the proposed wharf locations near the Cape Fear River.
3.1.4 Terminal Surfaces
There are a number of pavement systems used throughout the industry, each having advantages and disadvantages. These systems are:
• Asphalt concrete (AC)
• Portland cement concrete (PCC)
• Roller compacted concrete (RCC) over a bound base (rigid systems)
• Concrete pavers (CP) on a bound base over aggregate base (flexible systems)
A complete comparison of the four abovementioned pavement systems is presented in the Heavy Duty Pavement Systems TM (see Appendix H).
AC Pavement AC pavement has been selected for the purpose of estimating the construction costs of the North Carolina International Terminal primarily due to its relatively low cost-to-performance ratio. It is commonly and successfully used in ports nationally and world-wide. The pavement cross-section typically includes the AC surface with a bound base course on top of an aggregate base over an appropriately prepared compacted aggregate sub-base. The compaction density of the AC can be as high as 99 percent, which is well above typical roadway specifications. However, even when properly designed and constructed, AC pavement will require an ongoing level of routine maintenance because container yards are subject to cyclic wheel and point loads over the same pavement section, which induces rutting and depressions in the pavement.
Conventionally, heavy duty pavements in the Southeastern U.S. generally include an aggregate base course on prepared sub-grade, with AC base and surface courses. As mentioned, experience with AC-paved marine terminals suggests that AC-surfaced pavements tend to degrade by rutting and cracking, followed by the development of potholes. In addition, heavy point loads from corner castings and chassis legs invariably punch into the surface, resulting in indentations from an early date. Rutting is particularly evident in locations that have channelized wheel passes.
A properly designed and constructed AC pavement can support heavy wheel loads such as those from a reach stacker operation. Specification of appropriate asphalt binders and aggregates will be required to reduce rutting and cracking. Crack sealing will be important to prevent moisture ingress. In general terms this may be achieved by applying slurry seal on a five-year cycle. It may also be appropriate to mill and replace the top layer of AC to regulate the surface profiles and remove the corner casting damage every seven to ten years. Whereas slurry seal can be applied relatively quickly, the mill and replace work can be disruptive to the terminal operations.

Infrastructure Report
3-4 TB062008004BAO\082630001 Copyright 2008 by CH2M HILL Inc.
Reproduction and distribution in whole or in part beyond the intended scope of the contract without the written consent of CH2M HILL Inc. is prohibited.
Recommended Pavement Sections The following pavement sections (see Table 3-1) are based upon the equipment types and operational parameters for the assumed pavement zones. The soil conditions have been assumed to be sound granular material. Depth of pavement sections may change based on actual soil conditions encountered. As such, they should be considered as indicative only of potential sections at this time and used solely for comparison of relative approximate prices. These sections will be updated as more information becomes available. Plan views indicating locations for the various paving types are shown on Drawings P-1 through P-3, Sheets 10 through 12 in Appendix C.
Table 3-1 Pavement Zones and Proposed Profiles
Pavement Zone Profile
Container operations, maneuvering from ship-to-shore gantry crane to stack and from stack to Intermodal Yard using straddle carriers
8" AC,12” CAB
Container stacking area 12” gravel/stone section (similar to railroad ballast-
sized stone), 12” CAB
Entrance road, gate area, parking and maintenance area and through traffic roadways using tractor and chassis
6" AC, 12" CAB
Notes: AC = asphalt concrete; CAB = crushed aggregate base
Preferred Pavement Issues The Authority must consider the disruption and cost of the routine maintenance required for the AC pavement should this system be adopted. While it is the cheapest pavement for initial construction, this cost advantage will be eroded over time. If regular routine maintenance cannot be tolerated, then the PCC and CP options should be considered. The following issues will be considered in the final analysis:
• Serviceability criteria • Maintenance criteria • Final selection of soil parameters • Importance of initial capital costs versus life cycle costs • Importance of surface finish • Importance of operator preference with paving systems
3.1.5 Site Grading
The existing average elevation of the site is + 20.0 ft NGVD. To minimize the amount of earthwork required, an average site elevation of +18 ft NGVD was selected. The wharf elevation was also set at +18 ft NGVD. The grade was assumed to have a one percent slope extending from the berth towards the western boundary of the site. The gravel container areas will be a highpoint in the container storage yard and minimum slopes will be used to direct rainfall to piping conveyance systems flowing to a stormwater treatment system. A preliminary grading plan is shown on Drawings P-5 through P-7, Sheets 13 through 15 in Appendix C.
The entrance road and gate area will be crowned and will use curbs and gutters to collect stormwater, which will be directed to the stormwater treatment system (see below).
The resulting surplus excavated material will be disposed of or stockpiled for possible use in construction.

Infrastructure Report
TB062008004BAO\082630001 3-5 Copyright 2008 by CH2M HILL Inc.
Reproduction and distribution in whole or in part beyond the intended scope of the contract without the written consent of CH2M HILL Inc. is prohibited.
3.1.6 Stormwater Management
A preliminary stormwater treatment concept was established to address the relevant regulations requiring compliance with North Carolina Best Management Practices (BMPs) to meet the pollutant removal efficiency design standard of 85 percent for total suspended solids (TSS). In North Carolina coastal areas, all water quality BMPs are generally designed to treat the runoff from the first 1 or 1½ inches of rainfall, depending on the classification of the water to which it drains. BMPs can be used alone or in series to achieve the required pollutant removal efficiencies and peak attenuation requirements. Some specific requirements which apply to this site include:
• Direct discharge into area waters is to be prevented.
• Stormwater management processes are expected to be typical of high density development but would depend on the final site configuration.
A preliminary stormwater treatment and conveyance system layout plan is shown on Drawings D-1 through D-3, Sheets 16 through 18 in Appendix C.
The primary method of treatment will be a wet detention pond which uses a permanent pool of water to treat the runoff, and preliminary calculations were performed to estimate the permanent pool size. The calculations were based on Table 10-4 of the North Carolina Stormwater Best Management Practices Manual (North Carolina Division of Water Quality, 2007).8 This size will achieve 90 percent TSS removal, which is required if a vegetative buffer is not installed at the outfall of the pond.
For the purposes of the conceptual design approach with the use of the wet detention pond, it is expected that when full site development is eventually achieved, somewhere on the order of 400 acres of the 600-acre site will be paved and is consequently some 98 percent impervious. The other 200 acres of developed area will remain pervious.
An appropriate discharge structure will be designed to slowly release the treated water and to limit post-development discharge to pre-development rates for the design storms. Any excess storage volume needed will be made available through the design of a berm around the pond.
A stormwater retention/treatment area will be constructed in the northeast corner of the site. An outfall will be provided which will slowly discharge the treated water. The perimeter of the site will be used for stormwater conveyance as shown in Figure 3-1, in conjunction with site-specific perimeter safety clear space requirements. Some of the piping systems will be routed to conveyance channels that flow to the stormwater pond. Grass-lined channels and other overland means will be used for conveyance from the undeveloped areas of the site to the stormwater pond.
3.1.7 Site Utilities
The mechanical utility requirements for the North Carolina International Terminal project are based on preliminary research and consultation with local authorities. The investigation included the mechanical utilities required within the container storage yard, the wharf, and areas within 10 feet of the buildings. Additional data will be collected and more 8 See Figure B-1 in Section B.9, Stormwater Sizing, in Appendix B, Assumptions and Supplemental Data.
Figure 3-1 Cross-Section of Stormwater Channel Along
Perimeter Site Security Fencing

Infrastructure Report
3-6 TB062008004BAO\082630001 Copyright 2008 by CH2M HILL Inc.
Reproduction and distribution in whole or in part beyond the intended scope of the contract without the written consent of CH2M HILL Inc. is prohibited.
detailed engineering and design work will be performed in subsequent phases of the project development.
Potable Water and Sewer Systems Through consultations with local municipalities and agencies, it was determined that ample water and sewer capacity is available for the Terminal site. However, to obtain an accurate water demand estimate, flow rate, and pressure in the existing water main, it will be necessary to conduct a flow test which will provide accurate information on the current flow rate and available water pressure in the main.
Projection of potable water demand was parametrically based on container terminals of a size similar to the North Carolina International Terminal. Preliminary calculations followed the American Water Works Association (AWWA) specifications for water use per day per person. Average water use and peak demand take into account the number of site personnel, visiting truckers, and ships at berth. Estimated potable water demand and the underlying assumptions for the North Carolina International Terminal are shown in Section B.6 in Appendix B, Assumptions and Supplemental Data.
A preliminary layout showing a conceptual plan for mechanical utilities is shown on Drawings U-1 through U-4, Sheets 19 through 22 in Appendix C. Based on industry practice, potable water service to the ships will be provided through potable water shore-tie stations comprised of a single 2½-inch-diameter water service line. Shore-tie stations will be spaced at approximately 1,000 ft along the wharf and each will be equipped with a reduced pressure zone (RPZ) backflow preventer and a meter. These shore-ties would be tapped from the 12-inch potable water loop located upland of the wharf. Potable water would typically be provided to buildings through 2½-inch-diameter water service lines.
A preliminary wastewater conveyance system layout is also shown on the same drawings (U-1 through U-4, Sheets 19 through 22 in Appendix C). All sanitary sewers for the project area will discharge into a local agency’s existing sewer line that is currently designed for farmland use9. Preliminary investigations indicate this line would be capable of accommodating the full sewerage capacity of the container terminal and all of its buildings, which is an estimated total of 20,400 gallons of sanitary sewer flow discharged per day. The port will not receive sanitary discharge from the ships.
Fire Fighting System The National Fire Protection Association (NFPA) Code 307 requires a minimum flow rate of 3,000 gallons per minute (gpm) for a duration of 4 hours for marine terminals and wharf structures. To meet this requirement, fire protection water will be provided by a grid pattern of buried piping with a 12-inch yard loop. This will allow for delivery of water to any location from any direction. The looped feeder will be capable of providing water to the area of greatest demand from at least two directions. Hydrants will be connected to the network and be spaced no more than 300 ft apart. Each hydrant will have a dedicated 150 ft of 2½-inch fire hose, with nozzle wrenches, spanners, and couplings all stored in a weather-proof hose house. The underlying assumptions for sizing the fire suppression system are provided in Section B.2 in Appendix B, Assumptions and Supplemental Data.
Electrical System To develop an understanding of area electric power resources available for use by the proposed terminal, representatives from local power suppliers were contacted. Discussions with the potential power suppliers resulted in the following conceptual assumptions:
9 The existing County water and sanitary sewer lines are shown on Drawing No. U-1, Sheet 19 in Appendix C. This connection is 7 miles from the site. Another option could be examined which is to have an onsite package treatment plant.
Infrastructure Report
TB062008004BAO\082630001 3-7 Copyright 2008 by CH2M HILL Inc.
Reproduction and distribution in whole or in part beyond the intended scope of the contract without the written consent of CH2M HILL Inc. is prohibited.
• Local power suppliers can supply a 69-kilovolt (kV) transmission feed to the terminal site. Also, local power suppliers can own and operate the 69- to 13.2-kV substation (transformer included) that will need to be constructed to serve the Terminal, and can provide a point of connection outside the fence for the port’s electrical service.
• For cost estimating purposes, it is anticipated that the Authority would provide the land for the substation (3 acres).
Preliminary power demand calculations and assumptions were based on other container terminal designs. Preliminary demand loads for wharf cranes, ARMGs, reefers, lighting, and buildings, as well as the underlying design assumptions, are shown in Section B.4 in Appendix B.
A preliminary layout of the conceptual plan for the electrical utilities is shown on Drawings E-1 through E-8, Sheets 23 through 30 in Appendix C. Its main components are described below.
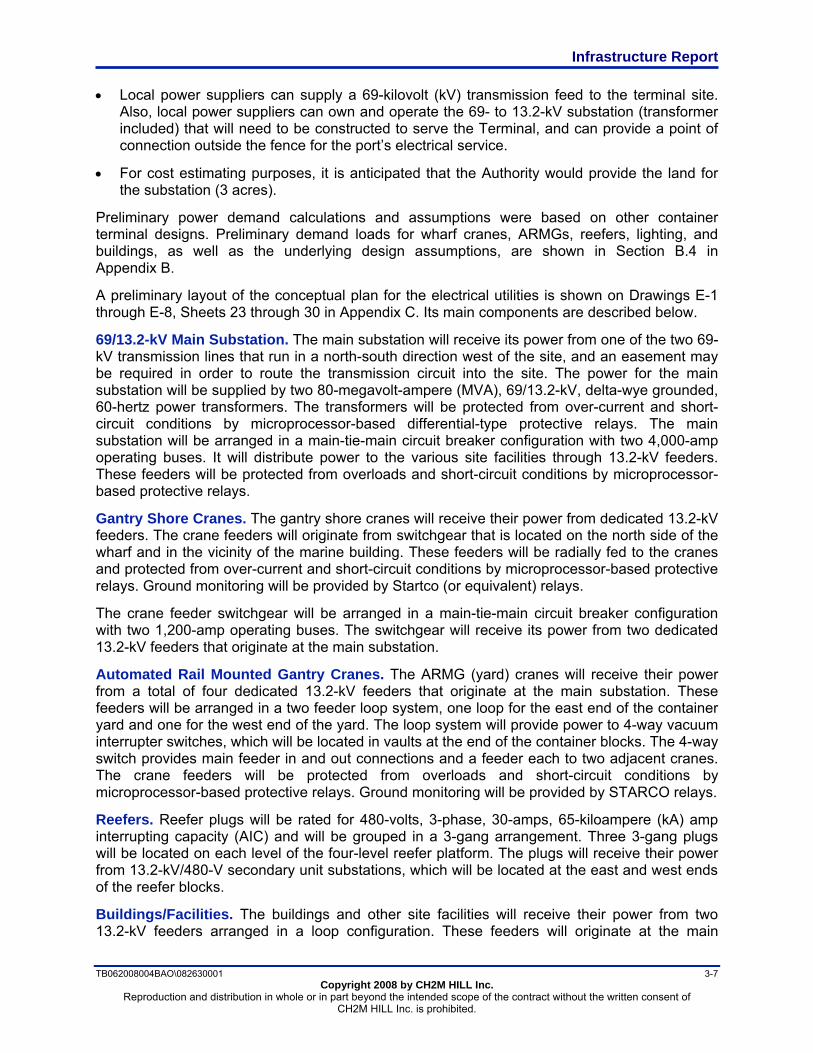
69/13.2-kV Main Substation. The main substation will receive its power from one of the two 69-kV transmission lines that run in a north-south direction west of the site, and an easement may be required in order to route the transmission circuit into the site. The power for the main substation will be supplied by two 80-megavolt-ampere (MVA), 69/13.2-kV, delta-wye grounded, 60-hertz power transformers. The transformers will be protected from over-current and short-circuit conditions by microprocessor-based differential-type protective relays. The main substation will be arranged in a main-tie-main circuit breaker configuration with two 4,000-amp operating buses. It will distribute power to the various site facilities through 13.2-kV feeders. These feeders will be protected from overloads and short-circuit conditions by microprocessor-based protective relays.
Gantry Shore Cranes. The gantry shore cranes will receive their power from dedicated 13.2-kV feeders. The crane feeders will originate from switchgear that is located on the north side of the wharf and in the vicinity of the marine building. These feeders will be radially fed to the cranes and protected from over-current and short-circuit conditions by microprocessor-based protective relays. Ground monitoring will be provided by Startco (or equivalent) relays.
The crane feeder switchgear will be arranged in a main-tie-main circuit breaker configuration with two 1,200-amp operating buses. The switchgear will receive its power from two dedicated 13.2-kV feeders that originate at the main substation.
Automated Rail Mounted Gantry Cranes. The ARMG (yard) cranes will receive their power from a total of four dedicated 13.2-kV feeders that originate at the main substation. These feeders will be arranged in a two feeder loop system, one loop for the east end of the container yard and one for the west end of the yard. The loop system will provide power to 4-way vacuum interrupter switches, which will be located in vaults at the end of the container blocks. The 4-way switch provides main feeder in and out connections and a feeder each to two adjacent cranes. The crane feeders will be protected from overloads and short-circuit conditions by microprocessor-based protective relays. Ground monitoring will be provided by STARCO relays.
Reefers. Reefer plugs will be rated for 480-volts, 3-phase, 30-amps, 65-kiloampere (kA) amp interrupting capacity (AIC) and will be grouped in a 3-gang arrangement. Three 3-gang plugs will be located on each level of the four-level reefer platform. The plugs will receive their power from 13.2-kV/480-V secondary unit substations, which will be located at the east and west ends of the reefer blocks.
Buildings/Facilities. The buildings and other site facilities will receive their power from two 13.2-kV feeders arranged in a loop configuration. These feeders will originate at the main

Infrastructure Report
3-8 TB062008004BAO\082630001 Copyright 2008 by CH2M HILL Inc.
Reproduction and distribution in whole or in part beyond the intended scope of the contract without the written consent of CH2M HILL Inc. is prohibited.
substation and will be routed in such a manner as to provide service points for each building or facility. Service to buildings will be provided at 13.2-kV/480-V or 208-V as required.
A 2,500-kVA, 13.2-kV, 3-phase generator will provide emergency power to the building loop feeder system.
Site Lighting. Site lighting will be a combination of high mast lighting and flood lighting where localized illumination is required. Power for site lighting will be provided by building or other facility transformers that are located in the vicinity of the particular lighting.
Alternative Maritime Power (AMP). Dedicated 13.2-kV feeders will provide power for each of the three AMP stations. These feeders will originate at the main substation.
Fire Pump. A dedicated 13.2-kV feeder will provide power to the fire pump, jockey pump and control system. This feeder will originate from the main substation.
Communication System. Four 4-inch PVC conduits will be routed parallel to the electrical power ductbank system to provide a conduit system for the site communication network. Single mode, twelve fiber cable will provide the backbone for the communication system throughout the site. The backbone is routed in such a manner as to provide convenient service drops to buildings and other terminal facilities.
3.1.8 Site Security
The Terminal must be designed to meet the legislated U.S. Coast Guard requirements of The Marine Transportation Security Act of 2002 and the regulations found in 33 Code of Federal Regulations (CFR) 105 for port terminal security. A site survey was conducted that considered a number of parameters including:
• Property borders and fencing • Procedures for entrance routes to and from the facility • Surrounding environment and vegetation • Operations of adjacent commercial areas • Level of security of adjacent commercial areas • Planned exterior site lighting • Emergency transportation routes close to the site • Rail routes in the area • Planned building exterior structure and standoff distances • Planned physical protection systems • Related or adjacent existing facilities’ security procedures that will be applied to the terminal
The detailed findings of this site survey will be included within the North Carolina International Terminal Area Wide Vulnerability Assessment (AWVA), estimated for completion in September 2008 by CH2M HILL. The AWVA provides an area-wide plan which integrates the Terminal’s security considerations with those of adjacent facilities, including the Progress Energy facility and Military Ocean Terminal, Sunny Point (MOTSU). The plan addresses such items as emergency response, emergency communications, physical protection, electronic security, response forces, etc.
The concept for security is to provide a layered defense in depth, meaning multiple layers of security consisting of delay, detection and response. The perimeter security system is the first line of defense in a balanced security system. The plan is to deploy a combination of ground-based radar, long-range thermal imaging cameras, and day-night pan/tilt/zoom cameras to identify and assess intruders entering the perimeter. A fiber-optic cable network will connect the cameras and radar units to the head-end control security monitoring system.

Infrastructure Report
TB062008004BAO\082630001 3-9 Copyright 2008 by CH2M HILL Inc.
Reproduction and distribution in whole or in part beyond the intended scope of the contract without the written consent of CH2M HILL Inc. is prohibited.
Additional security protection will be provided by a system of access control card reader locations. In accordance with emerging U.S. Department of Homeland Security requirements, Transportation Worker Identification Credential (TWIC) cards will be incorporated. Both the video and access control systems will be networked together using fiber-optic cabling and transmission control protocol with Internet protocol (TCP/IP) communications for a networked system.
3.2 Structures 3.2.1 Wharf
A conceptual design of the wharf structure at the North Carolina International Terminal was performed. The parameters that were used in that design are presented in Table 3-2.
Table 3-2 Wharf Configuration Parameters
Configuration Criteria
Deck Elevationa (ft) +18.00 ft NGVD
Dredge Depth (ft) -52.5 ft plus 2.0 ft over-dredge allowance MLLW
Container Crane Gage (ft) 100 ft-0 inch
Fender and Bollard Spacing (ft) 60 ft-0 inch
Note: a Vertical elevations would be referenced to National Geodetic Vertical Datum (NGVD). The specific datum would be identified in later phases of work. Mean Lower Low Water (MLLW) = -2.25 NGVD 1929.
Figure 3-2 and Drawing S-1, Sheet 31 in Appendix C show the conceptual design of the wharf in cross-section. This precast concrete pile-supported structure is founded upon a 1 in 5 sloping bottom from the berthing line up to a vertical steel sheet pile bulkhead wall located behind the land-side crane rail beam. The top of deck elevation was assumed to be +18 ft NGVD with the nominal operating dredge depth at -52.5 ft MLLW with a 2-ft over-dredge allowance, making the maintenance dredge depth -54.5 ft MLLW. Under these assumptions, the overall height of the wharf at the berthing face is 72.75 ft10 and at the land-side bulkhead is approximately 50 ft.
The majority of the wharf is to be designed for a 1,000-psf (pounds per square foot) live load. The wharf is also configured to have a travel or service lane outboard of the water-side crane rail beam where the live load will be 400 psf. A detailed discussion the various load conditions is presented in Section B.10 in Appendix B, Assumptions and Supplemental Data.
An electrical trench is located outboard of the water-side crane rail beam for the container crane Panzer belt system.
10 See Section B.7, Relationships Among Various Vertical Datums, in Appendix B for the conversion between MLLW and NGVD.

Infrastructure Report
3-10 TB062008004BAO\082630001 Copyright 2008 by CH2M HILL Inc.
Reproduction and distribution in whole or in part beyond the intended scope of the contract without the written consent of CH2M HILL Inc. is prohibited.
Figure 3-2 Cross-Section Showing the Pile-Supported Wharf Structure
Fenders and bollards will be spaced to accommodate container vessels ranging from barges to the 12,000-TEU project design vessel.
The general wharf configuration described below is based on best practices.
Foundation The foundation of the wharf is assumed to be an open pile system consisting of 24-inch-square pre-stressed concrete piles. The capacity of these driven piles is estimated at approximately 250 tons each. Pre-stressed concrete piles are commonly used in this type of wharf construction due to their high capacity, lower cost, and superior serviceability characteristics compared with other foundation alternatives. Also, considering the height of the top of deck structure, 24-inch piles were chosen due to the relatively long unbraced length of the piles. Drawing S-2, Sheet 32 in Appendix C, shows a conceptual pile plan.
Substructure The substructure of the wharf is characterized as cast-in-place concrete. The use of cast-in-place crane rail beams and piles caps will create a structure with redundant load paths and continuity that will allow for dispersal of berthing energy and mooring line and seismic forces.
Superstructure The superstructure is shown as concrete slabs supported by the cast-in-place crane rail beams. The superstructure slabs are ideally constructed from precast concrete planks with a composite concrete topping. The use of precast concrete would greatly reduce the amount of forming over water. A variation of this system includes full-depth precast concrete planks with non-composite asphalt or concrete wearing surface. The structure depth in the service lane is assumed to be 18 inches, with the remainder of the wharf assumed to be 24 inches deep.

Infrastructure Report
TB062008004BAO\082630001 3-11 Copyright 2008 by CH2M HILL Inc.
Reproduction and distribution in whole or in part beyond the intended scope of the contract without the written consent of CH2M HILL Inc. is prohibited.
Landside Retaining Wall Behind the wharf on the landside, a steel sheet pile retaining wall will be constructed which will be topped by a poured-in-place cap beam. This beam will be retained by appropriately spaced high-strength Dywidag (or similar) rods attached to a continuous dead man structure. This wall will be designed to stand alone independent of the wharf structure.
3.2.2 Buildings and Facilities
The Terminal will require a number of buildings to support its operations, as shown in the general layout plans (although exact locations, sizes, and specific uses of buildings will be determined later during final facility design). The approximate floor areas of the buildings were estimated based on similar facilities at similarly sized container terminals.
A general discussion of the buildings and related facilities is presented below.
Administration Building The Administration building will be sized to meet the future needs of the terminal at maximum build-out to avoid disrupting operations during the course of expansion. This building will house terminal management and staff for container terminal and gate operations, as well as container terminal security management and staff, and will provide office space for administrative and customer personnel. The building will include a break room, a conference and multi-media room, and mailroom.
The Administration Building will be located at the rear of the terminal adjacent to the gate and intermodal yard to allow visual surveillance of the entry and exit gate complexes. Office areas on the upper floors will have visual oversight of the container yard and container ship wharf where possible. The administration building will also include a stand-by generator system.
Gate Complex The gate complex is made up of various components which are to some extent interrelated. Each of these elements are discussed in brief.
Inbound/Outbound Gate Canopy. The purpose of this facility is to control the access of inbound and outbound terminal road traffic. The gate complex will generally consist of an inbound and outbound gate facility used to control access to the container handling and storage areas, facilitate the transfer of responsibility for the cargo from one party to another, allow for the exchange of information between truck drivers and the container terminal operator’s gate clerks, and allow for verification of container transaction records and verification of customs information. The inbound gate will control access to the container handling and storage areas and the outbound gate complex will control egress from the terminal.
This facility will consist of seven inbound, three outbound, two by pass and ten reversible lanes. An automated gate system will be comprised of communication and camera pedestals in between each lane and two camera bridges, at the entrance and exit. The canopy will require power, connectivity, lighting, and communication.
This facility will be constructed in phases. Phase 1 will consist of 7 inbound and 10 reversible lanes. Additional lanes will be added in Phase 2 reflecting the full build-out.
The Optical Character Recognition (OCR) Canopies. OCR canopies will be located at a pre-gate facility where vehicles enter and leave the terminal. The OCR system includes a number of instruments for data collection and will be connected to the Terminal Operating System. Its data flow will be tightly integrated with the gate operations control software and designed to perform the following functions for each transaction:
Infrastructure Report
3-12 TB062008004BAO\082630001 Copyright 2008 by CH2M HILL Inc.
Reproduction and distribution in whole or in part beyond the intended scope of the contract without the written consent of CH2M HILL Inc. is prohibited.
• Read the truck number printed atop the truck cab, if any
• Read the numbers of all containers on the truck’s trailer
• Collect a digital image of the sides of each container
• Transmit data to the TOS, where a gate transaction record is created and associated with the truck number
The OCR facility is designed and will be constructed for full build-out in Phase 1.
Customs Building. This building will be used primarily for custom inspectors and the driver - agent interface. It will consist of a general office area for servicing driver and agent related activities as well as a break-room. This building is designed and will be constructed for full build-out in Phase 1.
Drivers Assistance Shelter. A Drivers Assistance (DA) shelter will be used to help the driver of an inbound truck with inconsistencies and/or inaccuracies in his paperwork. This small structure will be located within an area which will include a number of stalls to park the truck and trailers while the driver uses the trouble resolution kiosk to resolve transaction issues before transitioning into the container yard. This building will be designed and constructed for full build-out in Phase 1.
Maintenance Building The Maintenance Building will be a mixed-use type structure designed to meet the unique requirements of container terminal rolling stock repairs. The purpose of this building will be to provide power shop repairs, parts storage, and chassis repair. Adjacent to the side of the building, a partially covered and fenced area for oversized parts storage will be provided.
The power repair area will consist of four drive-through bays and the chassis repair area will consist of three drive-through bays. The power repair area will have a pit along the length of one bay for fluid changing and access to the vehicles’ undercarriage. Drainage from this pit will be to an oil/water separator, and this area requires special ventilation for diesel emissions. An office area dedicated to management personnel will be included.
This building will be constructed in phases and will reach its full size by Phase 2.
Reefer Facilities Reefer Receiving / Reefer Dispatch. These are open-air facilities for the purpose of receiving, dispatching and repair of generator sets. The reefer receiving and dispatching facilities will be designed for full build-out in Phase 1.
Reefer Wash. The purpose of this facility is to wash the interiors and exteriors of refrigerated containers using manually operated high-pressure hot-spray washing machines. This facility will consist of a concrete platform with 50 bays. A small building will contain electrical and equipment rooms, toilet facilities and a receiving office. The reefer wash facility will be designed for full build-out in Phase 1.
Roadability. The purpose of the Roadability Facility is to facilitate repairs and inspection of outbound chassis. This building will be used to provide a sheltered area where minor repairs and maintenance on outbound chassis, before they are processed through the exit gate, are performed. Minor repairs include tire changes, lighting repairs, brake repair, mud flap replacement and other minor repairs. This building will be located near the exit gate complex and will include a break room and toilets. The Roadibility Facility will be designed for full build-out in Phase 1.

Infrastructure Report
TB062008004BAO\082630001 3-13 Copyright 2008 by CH2M HILL Inc.
Reproduction and distribution in whole or in part beyond the intended scope of the contract without the written consent of CH2M HILL Inc. is prohibited.
Straddle Carrier Shop This building will be designated specifically for the maintenance and repair of straddle carriers. A one-floor office area extending the width of the building will be used for management personnel and fluid storage. This facility will have a fueling station consisting of two 20,000-gallon (aboveground) diesel tanks furnished with pump and dispenser. All ground surfaces in and around this building (including parking area) will drain to an oil/water separator. This area requires special ventilation for diesel emissions.
This building will be constructed in phases and will reach its full size by Phase 2.
Rail Office and RTG Repair Area Rail Office. The facility will be used primarily for management personnel and parts storage. This building will be a one-floor office immediately adjacent to the RTG repair area, and all ground surfaces in and around this building (including parking area) will drain to an oil/water separator.
The Rail Office will be designed for full build-out in Phase 1.
RTG Repair Area. This will be a garage-type maintenance facility designed specifically for the maintenance and repair of RTGs. All ground surfaces in and around this building (including outside areas) will drain to an oil/water separator.
The RTG repair facility will be designed for full build-out in Phase 1.
Marine Operations and Crane Maintenance Building This facility will contain the ship loading/unloading operations and planning functions as well as break facilities for the stevedoring operations. In addition, ship-to-shore crane maintenance will be headquartered here. The first floor will be dedicated to vessel and crane operations. The second floor will be dedicated to marine operations management personnel.
This building will be multi-leveled and positioned with sufficient height so that marine operations can have unhindered views of the wharf area. Visual contact can be augmented by the use of TV cameras as required. Provisions for spare parts storage for the cranes, storage of special lashing gear, and repair of lifting spreaders is intended for this building.
This building will be constructed in phases and will reach its full size by Phase 2.
Miscellaneous Buildings Bus Stop Shelter. The purpose of this facility is to provide temporary shelter for users of the shuttle bus service operating throughout the terminal. Bus stops will be located at the major facilities in the terminal (for example, in the areas of the Straddle Carrier Shop and Administration Buildings).
Security / Guard Booth. The security booth provides a location to shelter guards at the primary entry and exit gate complex. The security booth requires one-way traffic orientation to align windows with truck cab position.
This building is designed for full build-out during Phase 1.
Main Substation. This building will be used to facilitate the transformation of the local electrical provider’s voltage supply to a common medium voltage for distribution inside the terminal. This facility will consist of a fence-enclosed open yard to contain transmission lines and high-voltage switch gear as well as a small building that will contain the medium voltage substation.
The substation will be configured with transmission line terminal and high voltage switches on one side of the switchyard and the medium voltage substation located on the opposite side.

Infrastructure Report
3-14 TB062008004BAO\082630001 Copyright 2008 by CH2M HILL Inc.
Reproduction and distribution in whole or in part beyond the intended scope of the contract without the written consent of CH2M HILL Inc. is prohibited.
Metering, monitoring, protection, and control equipment will be installed in the substation building.
This facility will be constructed in phases and will reach its full size by Phase 2. Further information is included in the electrical section of this report (see Section 3.1.7, Site Utilities).
U.S. Customs Building. The Terminal’s U.S. Customs Service functions include:
• Enforcing import and export laws and regulations • Assessing and collecting duties on imported merchandise • Controlling the import and export of merchandise • Functioning as the first line of defense in the nation's war on narcotics • Combating smuggling and related fraud
This small building will contain a general office area for servicing driver- and agent-related activities as well as a break-room and toilet.
This building will be designed and constructed for full build-out in Phase 1.
General Building and Area Requirements Generally speaking, each facility will be provided with the necessary support areas such as electrical rooms, telephone rooms, computer rooms, coffee areas, break rooms, duplication areas, lavatories, storage space, Americans with Disabilities Act (ADA) facilities, janitorial space, and circulation space. Exterior parking and storage areas have been defined where needed.
Security Gate-controlled perimeter fencing and security lighting systems will be provided to ensure terminal security. Fencing details will be provided to meet the requirements of the Super Carrier Initiatives11 and will generally consist of 8-ft-high chain link with an additional 3 strands of barbed wire.
11 Introduced to the industry in the 1980s, the Carrier Initiative Program was the first industry-government partnership program designed to protect the U.S. from the smuggling of narcotics, stowaways and other contraband. The Super Carrier Initiative Agreement (SCIA) with U.S. Customs requires compliance in security standards that represent the "Highest Degree of Due Diligence" specified by Customs.

TB062008004BAO\082630001 4-1 Copyright 2008 by CH2M HILL Inc.
Reproduction and distribution in whole or in part beyond the intended scope of the contract without the written consent of CH2M HILL Inc. is prohibited.
4.0 Port Access The North Carolina International Terminal will essentially be a logistics hub which requires sufficient marine and land access to efficiently transport the expected 3 million TEUs per year. Marine access will be provided through the federal navigational channel, an approach channel and turning basin and the berths themselves. Land access will be provided through the upgraded existing road and rail facilities as well as new infrastructure.
The following sections discuss the improvements which will be made to each of these transportation modes.
4.1 Dredging As referenced previously in this report, the North Carolina International Terminal will be designed to accommodate container ships which carry up to 12,000 TEUs. These vessels are substantially larger than any container ships that currently call on the existing Authority facilities or most other ports in the United States. The size of these vessels requires significant modifications to the dimensions and alignment of the existing ship channel, which in turn requires a considerable dredging program. This section highlights the salient details of the possible ship channel design and the estimated cost of construction.
CH2M HILL studied three potential alignments in terms of applicable navigation design criteria, navigation safety, environmental concerns, dredge volumes, cost, logistics, and schedule in order to accommodate the design vessel. Of the three designs evaluated, the design presented in this section represents the lowest estimated construction cost and shortest possible schedule while meeting navigation requirements. (Please note, however, that this channel design is not intended to be considered the final preferred or proposed design; it was developed for the purpose of developing preliminary dredging cost estimates and project sequencing. The channel design will require additional, more in-depth analysis during future permitting and study phases of the Terminal project.) The presented channel configuration and dredging plan requires the removal of approximately 68.3 million cubic yards at a cost of approximately $643 million (2008 USD) as shown in Table 4-1.
Table 4-1 Summary Of Dredging Volumes And Estimated Costs
Channel Reach Volume
(CY) Unit Price
($/CY) Estimated Cost
(2008 USD)
Berthing area 9,670,000 $8.43 $81,510,000
Access channel & turning basin 13,040,000 $8.11 $105,800,000
Main channel 45,580,000 $10.00 $455,950,000
Totals 68,290,000 $9.42 $643,260,000
Note: Numbers have been rounded to nearest 10,000 units; all costs include mobilization CY = cubic yards
Each of the areas of work shown in Table 4-1 is discussed briefly below. More detailed discussions are presented in the two dredging-related reports presented in Appendix I.

Infrastructure Report
4-2 TB062008004BAO\082630001 Copyright 2008 by CH2M HILL Inc.
Reproduction and distribution in whole or in part beyond the intended scope of the contract without the written consent of CH2M HILL Inc. is prohibited.
4.1.1 Channel Design and Dredging Plan
CH2M HILL completed a preliminary channel design and subsequent dredging plan and cost estimate. This task required the following:
• Collection and analysis of field data
• Evaluation of navigation requirements per U.S. Army Corps of Engineers (USACE) and U.S. Coast Guard regulations
• Evaluation of applicable dredging equipment and techniques
• Review of likely dredging, placement, and disposal methods
• Consideration of impact of shoaling to operations and maintenances
• Dredge material volume calculations (total and per material type)
• Capital cost
Existing geotechnical logs and laboratory analyses, including soil borings, wash probes, and physical data, were obtained from USACE records. The data set contained information from approximately 1,200 test sites, including vibracores, rock cores, split-spoon samples, and wash probes. Data from private sources were also incorporated into the analysis.
The soils information was analyzed to identify and locate the types of material that exist in the channel, including material that is suitable for beach fill or structural fill (sandy materials); soft sediments that were unsuitable for beneficial use (silts and clays); and areas of rock that would require special equipment and methods for dredging and disposal.
An additional 120 wash probes along the channel alignment and offshore were performed in order to supplement the available geotechnical information and to fill in the data gaps such as the sediment layers within the approach channel and turning basin.
The hydrographic survey was performed along the channel alignment and offshore portions in order to determine the existing sea bed level. The survey was performed by single-beam techniques at regular cross-section intervals perpendicular to the channel centerline. The survey was expanded at the offshore reach in order to gather data for several possible channel alignments.
The new physical data were compiled into a three-dimensional digital terrain model (DTM). In these models, the sea bed surface and the horizontal and vertical data from the soil borings and wash probes are input as separate layers. The software then “models” the different layers of materials via a graphic interface, allowing the team to properly align the channel to minimize dredge volume and avoid areas of rock to the extent possible.
The summary results of the wash probes and a representation of the hydrographic survey results are shown on Figure 4-1. Representative graphic depictions of the geologic profiles generated by the DTM are shown in Figures 4-2 and 4-3.
4.1.2 Navigation Channel
It was determined that the main channel (navigation channel) dimensions will vary from 600 ft wide by -55 ft deep offshore (to account for wave action) to 500 ft wide by -52.5 ft deep inshore. The ship channel alignment utilized for the cost estimate is a modification of the existing channel, meets all USACE navigation requirements, and will safely accommodate the design vessel. In addition, the channel will be realigned to avoid most of the existing rock outcroppings,

Infrastructure Report
TB062008004BAO\082630001 4-3 Copyright 2008 by CH2M HILL Inc.
Reproduction and distribution in whole or in part beyond the intended scope of the contract without the written consent of CH2M HILL Inc. is prohibited.
Figure 4-1 Wash Probe Results
Source: Gahagan & Bryant Associates
NORTH CAROLINA INTERNATIONAL
TERMINAL

Infrastructure Report
4-4 TB062008004BAO\082630001 Copyright 2008 by CH2M HILL Inc.
Reproduction and distribution in whole or in part beyond the intended scope of the contract without the written consent of CH2M HILL Inc. is prohibited.
Figure 4-2 Representative Geologic Profile for the Cut-Thru
Source: Gahagan & Bryant Associates

Infrastructure Report
TB062008004BAO\082630001 4-5 Copyright 2008 by CH2M HILL Inc.
Reproduction and distribution in whole or in part beyond the intended scope of the contract without the written consent of CH2M HILL Inc. is prohibited.
Figure 4-3 Representative Geologic Profile for the Current Channel
Source: Gahagan & Bryant Associates

Infrastructure Report
4-6 TB062008004BAO\082630001 Copyright 2008 by CH2M HILL Inc.
Reproduction and distribution in whole or in part beyond the intended scope of the contract without the written consent of CH2M HILL Inc. is prohibited.
existing beachheads and structures at Bald Head Island, and to provide safe navigation (e.g., turning radii, width, and depth).
The existing channel is comprised of discrete “reaches” of varying widths, and depths of -44 ft offshore (to account for wave action) and -42 ft inshore. The channel is currently dredged 2 ft below the prescribed depths to account for dredging inaccuracies.
The dimensions and alignment of the channel were developed by comparing the USACE channel design guidelines for the local wind, wave, and current activity with the dimensions and characteristics of the design vessel. “One-way” traffic (only one vessel transit inbound or outbound at any given time) was assumed.
The primary considerations for ship channel design include the ship dimensions, environmental conditions (wind, waves, and current), vessel characteristics while underway, and safety matters (e.g., frequency of vessel traffic). The relationships between the ship’s dimensions, the environmental elements, safety requirements, and the minimum channel dimensions have been developed by the USACE through a combination of theory and empirical data, both domestically and overseas.
The most dramatic modification of the channel would occur at Battery Island, where the existing channel is broken into four major turns (see Figure 4-4). The magnitude of these turns will not accommodate the design vessel, and were therefore bypassed, or “straightened,” to eliminate navigation hazards. This modification, designated as the “Cut-Thru” in Figure 4-4, also avoids impacts at Caswell Beach and the Southport riverfront.
In the initial conceptual design, the alignment for the offshore channel extension was developed based solely on minimizing the length of the channel. Geologic information obtained during this study indicated significant areas of rock within the initial alignment. The offshore portion of the channel was slightly redirected to avoid excavation of hard material, thereby reducing the schedule and cost. The alignment utilized for cost estimation and project sequencing in this report is shown in Figures 4-4 and 4-5.
The dredging methodology used in the various parts of the navigation channel will be directly dependent on the disposal options available for the dredged material, and some disposal options are dependent on the logistics and timing of different portions of the dredging operations.
An overview of the dredging and disposal areas is shown on Figure 4-6.
4.1.3 Berths, Approach Channel and Turning Basin
The berths, the turning basin, and the approach channel providing access from the berths to the federal channel is shown on Drawing B-1, Port Basin And Turning Basin Layout, Sheet 33 in Appendix C. It is based on the most efficient dredge template and the 1,900-LF diameter required for the turning basin considering the design vessel.
Material in the berth and turning basin areas is very soft and will most likely slough to a very shallow slope. For the initial construction, the side slope on the east side of the berth and turning basin area should be designed with a 5:1 side slope. After initial construction a more customary 3:1 side will most likely be more appropriate (see Figure 4-7).
The Turning Basin and Berthing area majority of the material is very soft silt to elevation – 36 MLLW with refusal of the probe within the dredge footprint typically below –44 MLLW. The probes indicated a clay layer above the rock that varied in thickness from a few inches to over 30 ft thick. The volume for this clay layer was calculated as a separate material type due to anticipated production rate decreases during dredging.
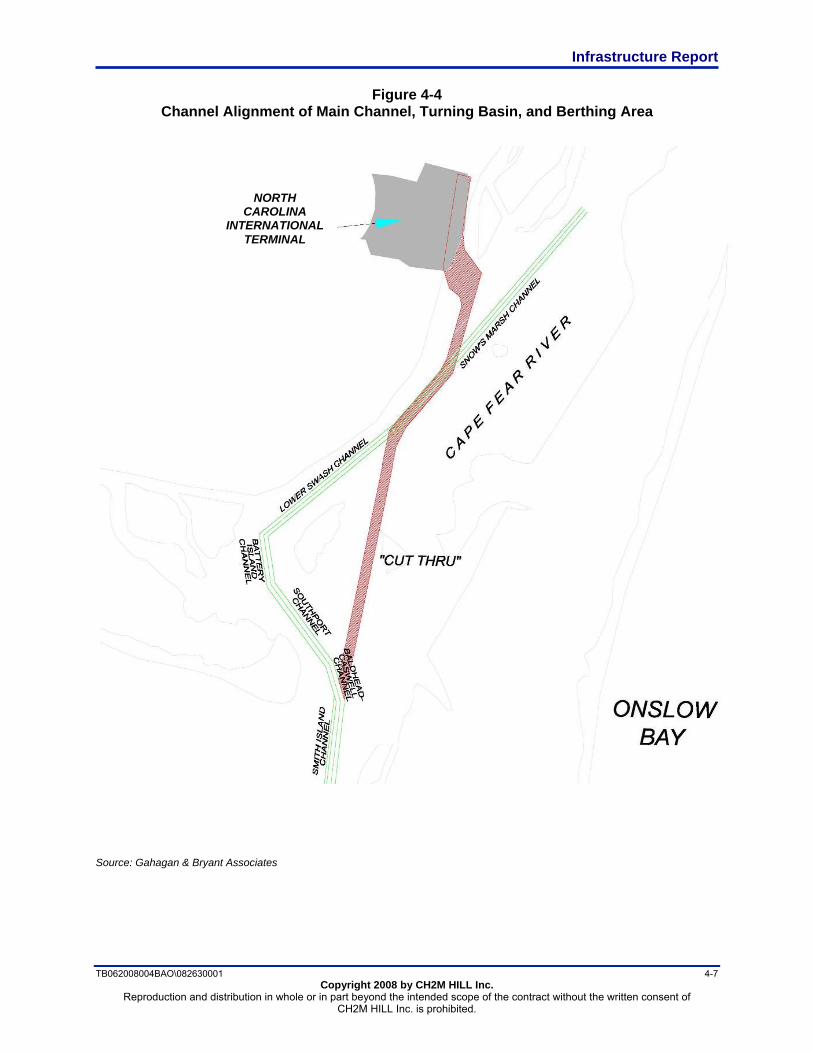
Infrastructure Report
TB062008004BAO\082630001 4-7 Copyright 2008 by CH2M HILL Inc.
Reproduction and distribution in whole or in part beyond the intended scope of the contract without the written consent of CH2M HILL Inc. is prohibited.
Figure 4-4 Channel Alignment of Main Channel, Turning Basin, and Berthing Area
Source: Gahagan & Bryant Associates
NORTH
CAROLINA INTERNATIONAL
TERMINAL
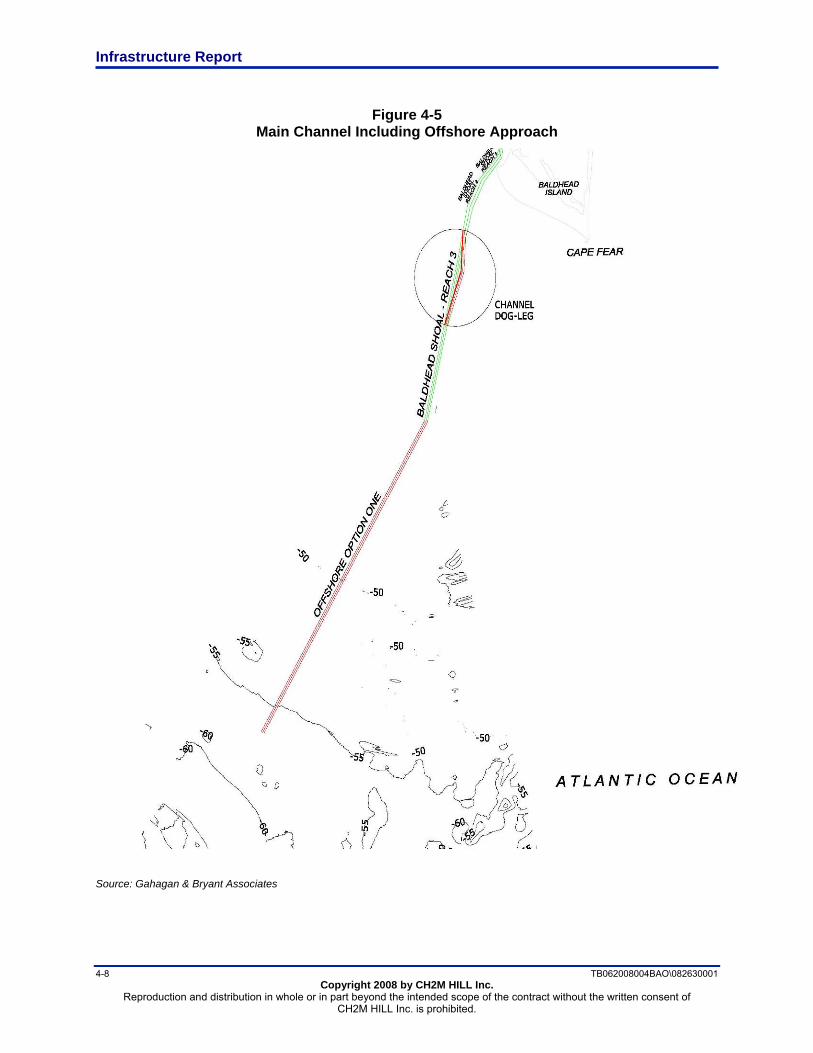
Infrastructure Report
4-8 TB062008004BAO\082630001 Copyright 2008 by CH2M HILL Inc.
Reproduction and distribution in whole or in part beyond the intended scope of the contract without the written consent of CH2M HILL Inc. is prohibited.
Figure 4-5
Main Channel Including Offshore Approach
Source: Gahagan & Bryant Associates

Infrastructure Report
TB062008004BAO\082630001 4-9 Copyright 2008 by CH2M HILL Inc.
Reproduction and distribution in whole or in part beyond the intended scope of the contract without the written consent of CH2M HILL Inc. is prohibited.
Figure 4-6 Proposed Dredging and Placement Areas
Source: Gahagan & Bryant Associates
North
Carolina International
Terminal

Infrastructure Report
4-10 TB062008004BAO\082630001 Copyright 2008 by CH2M HILL Inc.
Reproduction and distribution in whole or in part beyond the intended scope of the contract without the written consent of CH2M HILL Inc. is prohibited.
Figure 4-7 Proposed Dredging and Placement Areas Typical Dredge Section
Turning Basin Area
Source: Gahagan & Bryant Associates
4.1.4 Estimated Dredging Unit Costs
Projected unit costs for the various types of dredging are based on USACE contracts in the project vicinity within the last two years, with the exception of the rock dredging performed in 2000. All of the projects were between 1 and 3 million cubic yards.
The total dredging budget was divided by the quantity of material to be dredged to derive a total unit cost including prorated mobilization costs. This assumption eliminates the need, at this level, for determining exact contract sizes because the mobilization costs are distributed over reasonable quantities of material for individual contracts.
In order to eliminate individual contractors’ business factors that may have been in place at the time of bidding of each contract the following procedure was followed:
• If the contract award was higher than the government estimate, then the value of the contract was utilized.
• If the contract award was less than the government estimate, then the average of the government estimate and the award was utilized.
• For the rock dredging contract awarded in 2000, an additional 20 percent was added to the price in order to account for labor and fuel inflation over the past 7 years.

Infrastructure Report
TB062008004BAO\082630001 4-11 Copyright 2008 by CH2M HILL Inc.
Reproduction and distribution in whole or in part beyond the intended scope of the contract without the written consent of CH2M HILL Inc. is prohibited.
• For hopper dredging beyond the existing channel, 15 percent cost was added to account for additional weather and sea conditions.
Fuel has become a critical factor in analyzing dredging costs. Depending on the type of dredging, and the type of disposal, fuel represents between 25 percent and 35 percent of the dredging costs. For this study, fuel was chosen to represent 30 percent of the cost as of November 2007. Since that time the price of fuel has increased by 50 percent, thus a total increase in unit costs of 15 percent has been applied to the unit estimates. Costs are assumed to be in 2008 dollars; no time-value-of-money calculations have been performed.
4.2 Roadway Access Roadway access to the North Carolina International Terminal will need to be capable of handling the 50 percent of the container volume to be transported by trucks. A traffic analysis of the conceptual roadway access to the terminal was conducted using the anticipated volume, existing roadway capacity, possible exit routes, and required improvements in order to obtain the required capacity.
The capacity and level of service (LOS) analyses utilized a nationally accepted standard in traffic capacity evaluation, the Transportation Research Board’s Highway Capacity Manual (HCM), and its methodology (TRB, 2006). The HCM details the method to evaluate a highway segment’s LOS by comparing existing and projected traffic volume densities along a corridor and generating corresponding LOSs. These LOSs are measures of effectiveness for evaluating highway capacities and determining the effects of roadway improvements. The established highway corridor LOSs range from A to E, with an LOS of A representing the best (least) traffic density and an LOS of E representing a heavily congested highway segment with high traffic densities and substantial traffic delays. The HCM establishes an LOS of C as the operating threshold to maintain for a studied corridor as determined by the route’s highway classification. All highway routes within this study were classified as rural major arterials. Each alternative was evaluated using this methodology, the projected traffic volumes, and the typical roadway sections described above. From this evaluation, conceptual critical roadway improvements were identified, which in turn allowed cost and impact estimates to be created for each corridor.
Although the anticipated capacity of the North Carolina International Terminal is 3 million TEU, the study considered both 3- and 4-million-TEU port operating capacities in order to bracket the anticipated impacts from the facility. These traffic volumes were reduced to design hourly volume flow rates and each was evaluated to determine required typical roadway sections.
Based on the capacity analysis utilizing the data obtained for this study, an LOS of C would be achieved, even with the projected traffic volumes, by constructing either of the conceptual exit routes to an improved four through-lane roadway section. Whichever exit route might be selected in the future, the route should be designed to provide four through-lanes, a physical median or a two-way left turn lane, and limited access control.
A capacity analysis of the investigated access routes (see Figure 4-8) from the end of the exit corridors to US 17, to form a North Carolina International Terminal transportation corridor, determined that either the new conceptual alignment (Route 4) or the NC 87 route (Route 1) would operate at an LOS of C with improvements to each roadway route to create a typical section consisting of four travel through-lanes, a physical median with limited access control, and/or a two-way left turn lane (Figure 4-9). The capacity analysis also determined that the NC 211 route (Route 2) would require an eight-lane typical section from NC 133 south from the airport to the NC 133 Connector (Figure 4-10) to achieve an LOS of C with the projected traffic volumes.

Infrastructure Report
4-12 TB062008004BAO\082630001 Copyright 2008 by CH2M HILL Inc.
Reproduction and distribution in whole or in part beyond the intended scope of the contract without the written consent of CH2M HILL Inc. is prohibited.
The results from both the capacity analysis and the subsequent estimated costs suggest that Exit Corridor 2 (see Drawing T-1, Roadway Exit Corridors, Sheet 34 in Appendix C) and the new conceptual alignment (Route 4; see Figure 4-8 and Drawing T-2, Roadway Routes, Sheet 35 in Appendix C), which utilize existing highway alignments in combination with new corridors, are reasonable alternative routes for improved site access. This alternative appears to offer the least amount of displacement due to required right-of-way acquisition, the least impact to established residential and commercial properties, the shortest travel distances, and a cost-effective use of roadway improvement budgets. This was selected for cost estimating purposes only, and may not be the final alternative selected.
Figure 4-8 Existing and Proposed Access Routes into North Carolina International Terminal

Infrastructure Report
TB062008004BAO\082630001 4-13 Copyright 2008 by CH2M HILL Inc.
Reproduction and distribution in whole or in part beyond the intended scope of the contract without the written consent of CH2M HILL Inc. is prohibited.
Figure 4-9 4-Lane New and Existing Alignment

Infrastructure Report
4-14 TB062008004BAO\082630001 Copyright 2008 by CH2M HILL Inc.
Reproduction and distribution in whole or in part beyond the intended scope of the contract without the written consent of CH2M HILL Inc. is prohibited.
Figure 4-10 8-Lane Alignment

Infrastructure Report
TB062008004BAO\082630001 4-15 Copyright 2008 by CH2M HILL Inc.
Reproduction and distribution in whole or in part beyond the intended scope of the contract without the written consent of CH2M HILL Inc. is prohibited.
4.3 Rail Access Rail access to and on the North Carolina International Terminal must be developed with sufficient capacity to allow 50 percent of the container volume to be efficiently transported by rail rather than by trucks. This required an analysis of existing rail lines and facilities, required upgrades, possible alternatives, and the conceptual requirements for the on-terminal intermodal yard and off-terminal intermodal support yard.
Rail traffic moving into and out of the Terminal would use the CSX east/west main rail line that runs between Wilmington, North Carolina and Charlotte, North Carolina and would also use the north/south USA rail line. The USA rail line is a 17-mile route owned and operated by the United States Army (Army) which currently services the Military Ocean Terminal, Sunny Point (MOTSU) and other industries near the proposed development site. Existing rail alignments currently stop short of the proposed development site, and connecting rail infrastructure will need to be constructed to reach the Terminal boundary. To accommodate proposed intermodal rail services, upgrades to alignment and rail infrastructure will be required along the entire length of this rail route.
4.3.1 Current Rail Condition
Rail access to the Terminal development site traverses property and track owned by several separate entities: the northernmost industrial rail line is owned by the CSX Corporation and connects the CSX main line and the CSX Davis Yard with the USA rail line and the USA Leland Yard, a distance of 4.5 miles. It is used to interchange railcars with the Army and to provide switching services to industries located west of the CSX - Sunny Point Junction. The rail intersection of CSX Sunny Point Junction and USA rail line Mile Post 0 is shown in Figure 4-11.
Figure 4-11 CSX Sunny Point Junction and Mile Post 0 on the USA Rail Line – Looking West & East
The USA line is operated by the Army to move railcars over its 17-mile length between Leland Yard and the MOTSU and other industries located south of MOTSU at the southern end of the USA rail line, including Progress Energy, Primary Energy, and Archer Daniels Midland Company (ADM). Figure 4-12 provides a view of Leland Yard and Rail Security Gate.
The distance between the USA line southern interchange point and the project site is approximately 5.5 miles by rail. Figure 4-13 shows the Primary Energy rail structure near the juncture with the USA rail line.
Rail access to the proposed North Carolina International Terminal would most likely be via CSX, USA, Primary Energy, and ADM right-of-way (ROW). A new rail spur would exit the ADM ROW and would enter into the proposed Terminal along the southwest border of the proposed site.
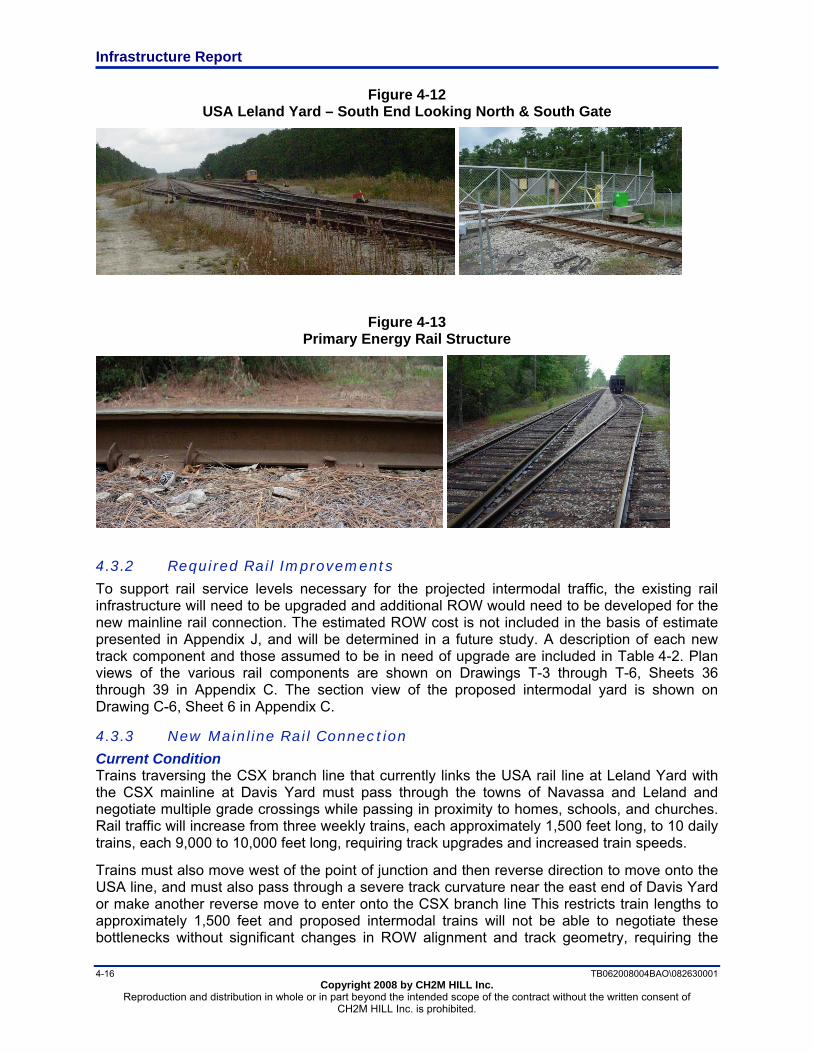
Infrastructure Report
4-16 TB062008004BAO\082630001 Copyright 2008 by CH2M HILL Inc.
Reproduction and distribution in whole or in part beyond the intended scope of the contract without the written consent of CH2M HILL Inc. is prohibited.
Figure 4-12 USA Leland Yard – South End Looking North & South Gate
Figure 4-13 Primary Energy Rail Structure
4.3.2 Required Rail Improvements
To support rail service levels necessary for the projected intermodal traffic, the existing rail infrastructure will need to be upgraded and additional ROW would need to be developed for the new mainline rail connection. The estimated ROW cost is not included in the basis of estimate presented in Appendix J, and will be determined in a future study. A description of each new track component and those assumed to be in need of upgrade are included in Table 4-2. Plan views of the various rail components are shown on Drawings T-3 through T-6, Sheets 36 through 39 in Appendix C. The section view of the proposed intermodal yard is shown on Drawing C-6, Sheet 6 in Appendix C.
4.3.3 New Mainline Rail Connection
Current Condition Trains traversing the CSX branch line that currently links the USA rail line at Leland Yard with the CSX mainline at Davis Yard must pass through the towns of Navassa and Leland and negotiate multiple grade crossings while passing in proximity to homes, schools, and churches. Rail traffic will increase from three weekly trains, each approximately 1,500 feet long, to 10 daily trains, each 9,000 to 10,000 feet long, requiring track upgrades and increased train speeds.
Trains must also move west of the point of junction and then reverse direction to move onto the USA line, and must also pass through a severe track curvature near the east end of Davis Yard or make another reverse move to enter onto the CSX branch line This restricts train lengths to approximately 1,500 feet and proposed intermodal trains will not be able to negotiate these bottlenecks without significant changes in ROW alignment and track geometry, requiring the

Infrastructure Report
TB062008004BAO\082630001 4-17 Copyright 2008 by CH2M HILL Inc.
Reproduction and distribution in whole or in part beyond the intended scope of the contract without the written consent of CH2M HILL Inc. is prohibited.
purchase of property in the areas of Davis Yard and Leland Yard to accommodate any improved alignment. An alternative rail connecting route was explored with these considerations in mind.
Table 4-2 Summary of Required Rail Components
Rail Component Description
Intermodal Yard located within boundary of the marine terminal
Conceptual IY features are assumed to include:
• Ten IY working tracks
• Average working track length of 3,660 feet
• Total working track length of 36,600 feet
• Railcar capacity of 120 (305-foot double-stack cars)
• Five groups of two tracks; track pairs on 15-foot centers
• Track spacing for operating area between track groups on 118-foot centers
• Inside gantry crane width (ICW) of 70 feet
• Two lift zones adjacent to each two track group
Meets required rail throughput projections of 877,000 annual rail containers. All IY features would be constructed within the proposed terminal boundaries.
Intermodal support yard located outside the marine terminal entrance and extending along the approaching rail line for approximately 13,000 feet
Conceptual support yard features are assumed to include:
• Five arrival /departure tracks
• One combined runaround and industry access track
• End-to-end track connections between IY and support yard
• Support yard length of 13,000 feet
• Total support yard track length of 79,000 linear feet
• Expand rail bridge over power plant outflow
Tracks on 15-foot and 25-foot centers, allowing service vehicle access within rail yard. Support yard features will require land acquisition and development outside the proposed terminal boundaries.
USA Line
Assumed rail upgrade features include:
• Seven two-lane grade separations
• 105,600 linear feet of new track
• Four new turnouts
• 22,000 linear feet of controlled siding
Rail upgrade features would be constructed within the boundaries of existing rail ROW.
New Leland Yard to CSX ML Connection
Assumed new rail features include:
• New single track rail bridge over US highway 74/76
• 27,000 linear feet of new track
• Four new turnouts
New mainline connection will require land acquisition and rail development outside existing rail ROW.

Infrastructure Report
4-18 TB062008004BAO\082630001 Copyright 2008 by CH2M HILL Inc.
Reproduction and distribution in whole or in part beyond the intended scope of the contract without the written consent of CH2M HILL Inc. is prohibited.
Alternative Rail Connection A new rail alignment paralleling the future I-140 in the area of US 74/76 at Leland presents a superior alternative to the current CSX branch line connection, by supporting:
• Bi-directional east/west connection at the CSX mainline. • Progressive train movements between CSX mainline and USA rail line. • Progressive train movements between the Davis Yard and the USA rail line. • Track geometry capable of supporting train speeds of 40 miles per hour. • Rail grade separations over US 74/76 and under proposed I-140. • Maintain rail access to existing industry in the vicinity of CSX Sunny Point Junction. • Align rail parallel to proposed I-140 to minimize required property take. • Design track compliant with current CSX standards.
Rail design features include:
• One new track connection near the southern end of Leland Yard. • Two new track connections where the new alignment meets the CSX mainline. • One new rail structure over US 74/76 and CSX industrial branch line. • One highway structure (I-140) over rail near CSX mainline. • Rail line elevation transition of 1 percent to meet grade separation. • New single track alignment of 22,000 feet.
Benefits and advantages over the existing branch line include:
• Eliminating rail service conflict in Leland and Navassa. • Eliminating track geometry restriction at Davis Yard. • Eliminating track geometry restriction at Sunny Point Junction and Mile zero. • Providing for progressive train movement between CSX mainline and USA line. • Providing track capacity to support proposed port intermodal movements. • Providing opportunity to abandon 20,000 linear feet of existing branch line track. • Providing opportunity for sale of existing branch line ROW. • Eliminating the need to upgrade 20,000 feet of existing branch line track. • Eliminating six public grade crossings. • Eliminating six private grade crossings.
Constraints and disadvantages over the existing branch line include are that it:
• Requires land purchase for a new rail ROW. • Requires grade separation over US 74/76. • Requires grade separation under proposed I-140. • Requires construction of 22,000 linear feet of new track.
4.3.4 Development Considerations
As the development of this alternative rail line connection moves forward, issues requiring further consideration include:
• Land availability, contours, and environmental permitting. • Impacts to proposed I-140 co-use of ROW. • Change of interchange use for Leland Yard. • Train operational changes. • Continuation of industry rail service. • Rail line maintenance.

Infrastructure Report
TB062008004BAO\082630001 4-19 Copyright 2008 by CH2M HILL Inc.
Reproduction and distribution in whole or in part beyond the intended scope of the contract without the written consent of CH2M HILL Inc. is prohibited.
4.3.5 Intermodal Yard
The following assumptions were used in considering the on-terminal intermodal rail component of the terminal. These assumptions define conceptual terminal operating practices and infrastructure requirements to support the intermodal movement of containers through the terminal. (See Drawing T-6, Sheet 39, Rail Connection Intermodal Yard, and Drawing C-6, Sheet 6, Intermodal Yard Sections, in Appendix C.)
The current goal is to support 50 percent of the volume of containers moving into and out of the marine terminal by means of an on-terminal intermodal yard or rail facility. This rail planning phase was based on the following cargo projections:
• Annual Terminal throughput: 3 million TEU • Intermodal rail volume: 50 percent (1. 5 million TEU or 877,000 annual rail lifts)
Considering an annual rail throughput of 877,000 containers over a rail line operating 360 days per year, the expected daily rail throughput is 2,436 containers. A 10,000-foot train can haul 262 containers, which equates to 9.4 trains per day.
Development Considerations As the development of terminal operations moves forward, refinement of the modal interchange between the intermodal yard and the marine terminal would consider the following:
• Planning for rail loading and unloading and berth and container yard operations should avoid operational dependency between modes. Methods that support the modal interchange of containers between intermodal yard and container yard operations should be examined or modeled to expose reliance issues and production rate limits.
• Track-side staging and intermodal yard ground space for container management has been included to provide operational separation between rail lift operations and track-side delivery and take-away operations. Reducing this track-side staging area may directly impact the rail production rate.
Additional detail dealing with intermodal yard rail operations is included in Section 2.3.4, Semi-Automated Operation (Rail Yard).
Intermodal Support Yard The function of the intermodal support yard is to operate as a buffer between on-terminal rail loading and unloading activities and the arrival and departure of mainline trains. (See Rail Connection Intermodal Support Yard, Drawing T-5, Sheet 38 in Appendix C.) Turnover of loading tracks, makeup and departure of trains, and the arrival and placement of trains require close coordination between the support yard and the intermodal yard. The goal of the support yard is to maximize intermodal yard throughput capacity and minimize railcar handling and train delays. The following assumptions were used in considering the off-terminal intermodal support yard rail components. These assumptions complement the conceptual terminal operating practices and infrastructure requirements necessary to support the intermodal movement of containers through the marine terminal:
• Annual Marine Terminal Throughput: 3 million TEU. • Intermodal Rail Volume: 50 percent (1. 5 million TEU or 877,000 annual rail lifts). • Maximum train length of 10,000 feet. • Mainline trains per day 10 combined in and out.

Infrastructure Report
4-20 TB062008004BAO\082630001 Copyright 2008 by CH2M HILL Inc.
Reproduction and distribution in whole or in part beyond the intended scope of the contract without the written consent of CH2M HILL Inc. is prohibited.
4.3.6 Conclusions and Recommendations
Recommendations to develop sufficient rail service to meet the goal of 50 percent volume by rail include:
• An appropriately sized on-terminal intermodal yard.
• An intermodal support yard to transition between the on-terminal intermodal yard and the main rail access. Significant changes to right-of-way alignment and track structure will be required in the area designated for the Rail Support Yard. Recommend further analysis of this area to determine property ownership and acquisition requirements, construction feasibility and further structures and rail alignment impacts.
• An alternative mainline rail connection to replace the current CSX branch line connection.
• Upgrade the existing USA rail line within the existing ROW.
• Address risks associated with current practice of granting roadway easements across the USA rail line. Housing development is progressing along the length of this rail line and developers are requesting roadway easements and improvements across the rail right of way. Future easements could restrict train movements as well as overall rail line capacity. Government rail right of way easements are not handled locally and grantor many not be sensitive to potential rail line use.
• Analyze rail structure for entire length of proposed rail route starting at the CSX Mainline and concluding at the proposed entrance of the marine terminal for intermodal service suitability.

TB062008004BAO\082630001 5-1 Copyright 2008 by CH2M HILL Inc.
Reproduction and distribution in whole or in part beyond the intended scope of the contract without the written consent of CH2M HILL Inc. is prohibited.
5.0 Construction Cost Estimate The goal of the cost estimate is to establish an opinion of the probable construction cost at this planning stage of design, based on the current knowledge of the infrastructure requirements and the conceptual engineering as detailed in this Infrastructure Report.
5.1 Estimate Classification The cost estimate is a Feasibility or Class IV as defined by the American Association of Cost Engineering (AACE). It is considered accurate to +50 percent to –30 percent, based upon a 5 percent design deliverable. The estimate was based on material, equipment, and labor pricing as of May 27, 2008. Such prices are highly subject to variation because of shortages and volatile energy markets, and this estimate should be routinely evaluated for market changes.
The estimate was prepared from the information available at the time for guidance in project evaluation and implementation. The actual final cost of the project will depend upon the actual labor and material costs, competitive market conditions, final project costs, implementation schedule, and other variable factors. As a result, the actual final project costs will likely vary from this estimate.
5.2 Estimate Methodology This cost estimate is a “bottom rolled up” type estimate with detailed cost items and breakdown of Labor, Materials and Equipment (details shown in Appendix J). Some price quotations were obtained for various items. This estimate includes allowance cost and dollars per square foot costs for certain components of the estimate.
The complete Basis of Estimate is attached in Appendix J. In addition to information discussed in this section, it includes discussions of the project description, scope of work, markups, escalations rate, market conditions, quotes, cost resources, labor costs, sales tax, allowance costs, major assumptions, excluded costs, and reference documents.
5.3 Current Estimate The current estimate of construction costs with contingency is $2,5173,929,000. Table 5-1 shows the breakdown of the estimated costs into the appropriate cost centers.
Table 5-1 Summary of Estimated Construction Costs
Category Description Total Project Cost (2008 $)
A Container Terminal $1,430,229,000
B Roadway & Bridges $260,826,000
C Rail Line & Bridges $72,779,000
D Navigational Channel Dredging $681,325,000
E Project Development Costs $72,770,000
Total Project Estimate (2008 $) without Escalation $2,517,929,000


TB062008004BAO\082630001 6-1 Copyright 2008 by CH2M HILL Inc.
Reproduction and distribution in whole or in part beyond the intended scope of the contract without the written consent of CH2M HILL Inc. is prohibited.
6.0 Project Timeline Figure 6-1 shows the timeline for project planning, development, and construction of the Terminal.
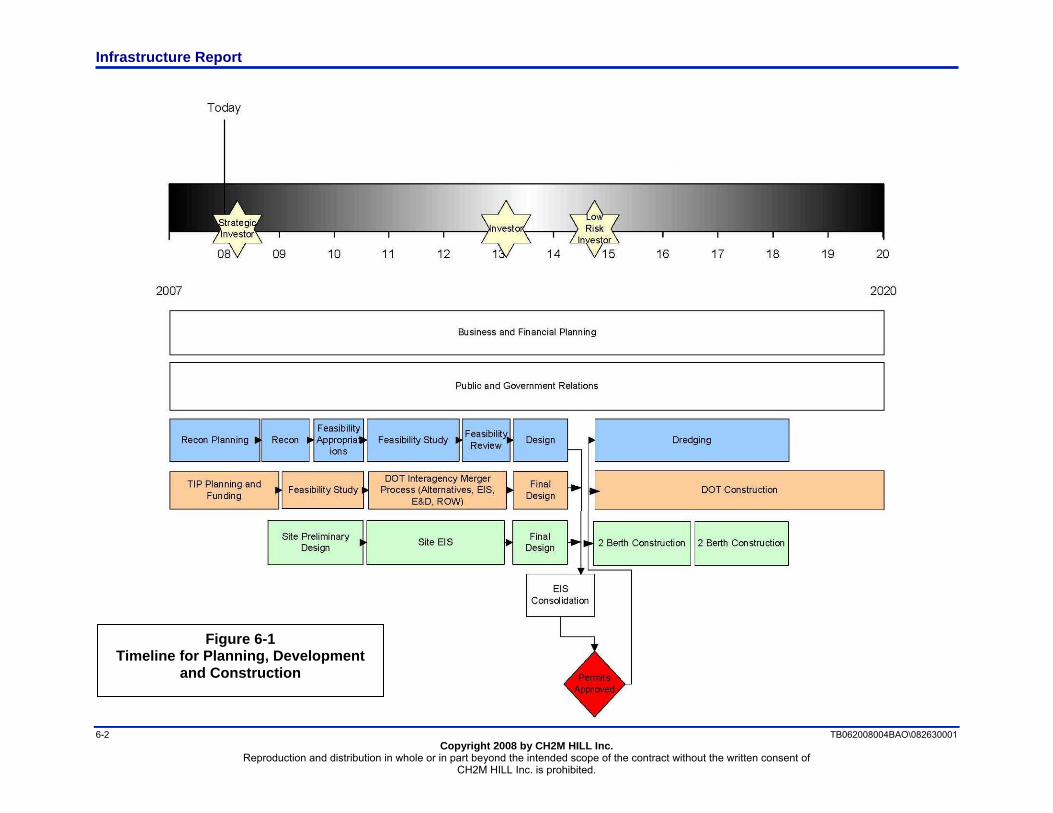
Infrastructure Report
6-2 TB062008004BAO\082630001 Copyright 2008 by CH2M HILL Inc.
Reproduction and distribution in whole or in part beyond the intended scope of the contract without the written consent of CH2M HILL Inc. is prohibited.
Figure 6-1 Timeline for Planning, Development
and Construction

TB062008004BAO\082630001 7-1 Copyright 2008 by CH2M HILL Inc.
Reproduction and distribution in whole or in part beyond the intended scope of the contract without the written consent of CH2M HILL Inc. is prohibited.
7.0 List of Works Cited CH2M HILL. 2008. North Carolina International Terminal Planning Assumptions. Prepared for
the North Carolina State Ports Authority. March 15.
Hi-Tech Solutions. 2004. “SeeCrane Crane Mounted Recognition System” web page: http://www.htsol.com/Products/SeeCrane.html.
International Code Council (ICC). 2006. North Carolina State Building Code.
Lloyd’s Register. 2007. Horizons. Issue 22. December.
North Carolina Division of Water Quality. 2007. Stormwater Best Management Practices Manual. North Carolina Department of Environment and Natural Resources. Manual originally published in July 2007; Wet Detention Basin chapter updated in September 2007.
Panama Canal Authority. 2006. Third Set of Locks Fact Sheet. April 24.
Port of Los Angeles (POLA). 2007. The Port of Los Angeles Seismic Code for Port Structures.
Transportation Research Board of the National Academies (TRB). 2006. Highway Capacity Manual.
7.1 Additional Works Referenced Gibson, Garrett (Contracts Manager, Great Lakes Dredge & Dock). 2006. Personal
communication with Chris Gibson, Gahagan & Bryant Associates. March 2006.
Permanent International Association of Navigation Congresses (PIANC). 2002. International Commission for the Reception of Large Ships. Guidelines for the Design of Fenders Systems.
Tanner, John, P.E. (Tanner Engineering). Personal communication with Chris Gibson, Gahagan & Bryant Associates. August 2007.
United Nations Conference on Trade and Development, 1985. Port Development: A Handbook for Planners in Developing Countries.
United States Army Corps of Engineers (USACE). 2006. Engineering Manual (EM) 1110-2 1613, Hydraulic Design of Deep-Draft Navigation Projects. 31 May.