North Carolina Common Core Math One Standards for...
22
Copyright ©2015 Pearson Education, Inc. or its affiliate(s). All rights reserved. A Correlation of Connected Mathematics Project 3 Grade 8, Algebra 1 ©2014 to the North Carolina Common Core Math One Standards for Assessment
Transcript of North Carolina Common Core Math One Standards for...
Copyright ©2015 Pearson Education, Inc. or its affiliate(s). All rights reserved.
A Correlation of
Connected Mathematics Project 3
Grade 8, Algebra 1 ©2014
to the
North Carolina
Common Core Math One Standards for Assessment

A Correlation of Connected Mathematics Project 3, Grade 8, Algebra 1, ©2014 to the North Carolina Common Core Math One Standards for Assessment
1
Common Core Math One Standards for Assessment
Connected Mathematics Project 3 Grade 8, Algebra 1
The Real Number System N--RN Extend the properties of exponents to rational exponents. N-RN.1 Explain how the definition of the meaning of rational exponents follows from extending the properties of integer exponents to those values, allowing for a notation for radicals in terms of rational exponents. For example, we define 51/3 to be the cube root of 5 because we want (51/3)3 = 5(1/3)3 to hold, so (51/3)3 must equal 5.
Growing, Growing, Growing: 5.1: Looking for Patterns Among Exponents; 5.2: Rules of Exponents; 5.3: Extending the Rules of Exponents
N-RN.2 Rewrite expressions involving radicals and rational exponents using the properties of exponents.
Growing, Growing, Growing: 5.3: Extending the Rules of Exponents
Note: At this level, focus on fractional exponents with a numerator of 1. Quantities N--Q Reason quantitatively and use units to solve problems. N-Q.1 Use units as a way to understand problems and to guide the solution of multi-step problems; choose and interpret units consistently in formulas; choose and interpret the scale and the origin in graphs and data displays.
Thinking with Mathematical Models: 1.1: Bridge Thickness and Strength; 1.2: Bridge Length and Strength; 3.2: Distance, Speed, and Time; 4.1: Vitruvian Man: Relating Body Measurements; 4.2: Older and Faster Growing, Growing, Growing: 2.1: Killer Plant Strikes Lake Victoria: y-Intercepts Other Than 1; 2.2: Growing Mold: Interpreting Equations for Exponential Functions; 3.2: Investing for the Future: Growth Rates; 4.3: Cooling Water: Modeling Exponential Decay; 5.4: Operations With Scientific Notation Frogs, Fleas, and Painted Cubes: 2.1: Trading Land: Representing Areas of Rectangles; 2.2: Changing Dimensions: The Distributive Property
A Correlation of Connected Mathematics Project 3, Grade 8, Algebra 1, ©2014 to the North Carolina Common Core Math One Standards for Assessment
2
Common Core Math One Standards for Assessment
Connected Mathematics Project 3 Grade 8, Algebra 1
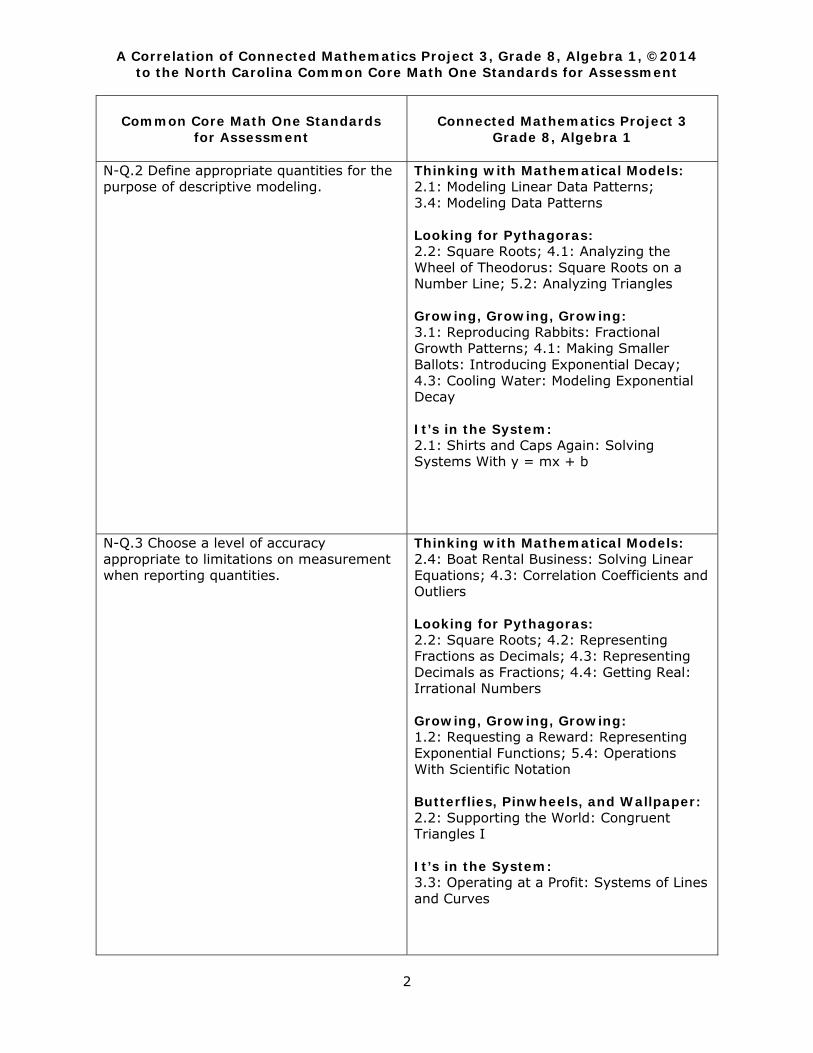
N-Q.2 Define appropriate quantities for the purpose of descriptive modeling.
Thinking with Mathematical Models: 2.1: Modeling Linear Data Patterns; 3.4: Modeling Data Patterns Looking for Pythagoras: 2.2: Square Roots; 4.1: Analyzing the Wheel of Theodorus: Square Roots on a Number Line; 5.2: Analyzing Triangles Growing, Growing, Growing: 3.1: Reproducing Rabbits: Fractional Growth Patterns; 4.1: Making Smaller Ballots: Introducing Exponential Decay; 4.3: Cooling Water: Modeling Exponential Decay It’s in the System: 2.1: Shirts and Caps Again: Solving Systems With y = mx + b
N-Q.3 Choose a level of accuracy appropriate to limitations on measurement when reporting quantities.
Thinking with Mathematical Models: 2.4: Boat Rental Business: Solving Linear Equations; 4.3: Correlation Coefficients and Outliers Looking for Pythagoras: 2.2: Square Roots; 4.2: Representing Fractions as Decimals; 4.3: Representing Decimals as Fractions; 4.4: Getting Real: Irrational Numbers Growing, Growing, Growing: 1.2: Requesting a Reward: Representing Exponential Functions; 5.4: Operations With Scientific Notation Butterflies, Pinwheels, and Wallpaper: 2.2: Supporting the World: Congruent Triangles I It’s in the System: 3.3: Operating at a Profit: Systems of Lines and Curves

A Correlation of Connected Mathematics Project 3, Grade 8, Algebra 1, ©2014 to the North Carolina Common Core Math One Standards for Assessment
3
Common Core Math One Standards for Assessment
Connected Mathematics Project 3 Grade 8, Algebra 1
Seeing Structure in Expressions A--SSE Interpret the structure of expressions. A-SSE.1 Interpret expressions that represent a quantity in terms of its context.
Say It with Symbols: 1.1: Tiling Pools: Writing Equivalent Expressions; 1.4: Diving In: Revisiting the Distributive Property; 2.2: Predicting Profit: Substituting Expressions; 3.3: Factoring Quadratic Equations; 4.3: Generating Patterns: Linear, Exponential, Quadratic; 5.1: Using Algebra to Solve a Puzzle Frogs, Fleas, and Painted Cubes: 2.1: Trading Land: Representing Areas of Rectangles; 2.2: Changing Dimensions: The Distributive Property; 2.3: Factoring Quadratic Expressions; 2.4: Quadratic Functions and Their Graphs
a. Interpret parts of an expression, such as terms, factors, and coefficients.
Say It with Symbols: 1.1: Tiling Pools: Writing Equivalent Expressions; 1.2: Thinking in Different Ways: Determining Equivalence; 1.3: The Community Pool Problem: Interpreting Expressions; 1.4: Diving In: Revisiting the Distributive Property; 2.1: Walking Together: Adding Expressions; 2.2: Predicting Profit: Substituting Expressions; 3.3: Factoring Quadratic Equations; 4.3: Generating Patterns: Linear, Exponential, Quadratic; 5.1: Using Algebra to Solve a Puzzle Frogs, Fleas, and Painted Cubes: 2.2: Changing Dimensions: The Distributive Property; 2.3: Factoring Quadratic Expressions; 2.4: Quadratic Functions and Their Graphs
A Correlation of Connected Mathematics Project 3, Grade 8, Algebra 1, ©2014 to the North Carolina Common Core Math One Standards for Assessment
4
Common Core Math One Standards for Assessment
Connected Mathematics Project 3 Grade 8, Algebra 1
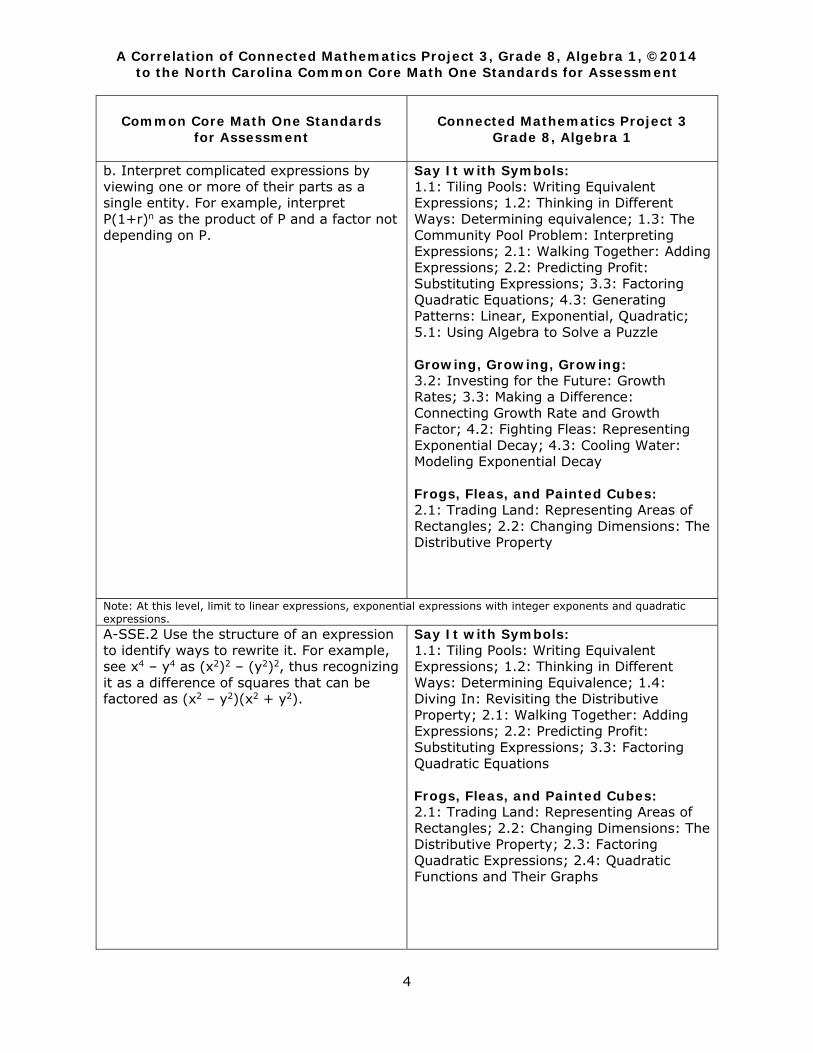
b. Interpret complicated expressions by viewing one or more of their parts as a single entity. For example, interpret P(1+r)n as the product of P and a factor not depending on P.
Say It with Symbols: 1.1: Tiling Pools: Writing Equivalent Expressions; 1.2: Thinking in Different Ways: Determining equivalence; 1.3: The Community Pool Problem: Interpreting Expressions; 2.1: Walking Together: Adding Expressions; 2.2: Predicting Profit: Substituting Expressions; 3.3: Factoring Quadratic Equations; 4.3: Generating Patterns: Linear, Exponential, Quadratic; 5.1: Using Algebra to Solve a Puzzle Growing, Growing, Growing: 3.2: Investing for the Future: Growth Rates; 3.3: Making a Difference: Connecting Growth Rate and Growth Factor; 4.2: Fighting Fleas: Representing Exponential Decay; 4.3: Cooling Water: Modeling Exponential Decay Frogs, Fleas, and Painted Cubes: 2.1: Trading Land: Representing Areas of Rectangles; 2.2: Changing Dimensions: The Distributive Property
Note: At this level, limit to linear expressions, exponential expressions with integer exponents and quadratic expressions. A-SSE.2 Use the structure of an expression to identify ways to rewrite it. For example, see x4 – y4 as (x2)2 – (y2)2, thus recognizing it as a difference of squares that can be factored as (x2 – y2)(x2 + y2).
Say It with Symbols: 1.1: Tiling Pools: Writing Equivalent Expressions; 1.2: Thinking in Different Ways: Determining Equivalence; 1.4: Diving In: Revisiting the Distributive Property; 2.1: Walking Together: Adding Expressions; 2.2: Predicting Profit: Substituting Expressions; 3.3: Factoring Quadratic Equations Frogs, Fleas, and Painted Cubes: 2.1: Trading Land: Representing Areas of Rectangles; 2.2: Changing Dimensions: The Distributive Property; 2.3: Factoring Quadratic Expressions; 2.4: Quadratic Functions and Their Graphs
A Correlation of Connected Mathematics Project 3, Grade 8, Algebra 1, ©2014 to the North Carolina Common Core Math One Standards for Assessment
5
Common Core Math One Standards for Assessment
Connected Mathematics Project 3 Grade 8, Algebra 1
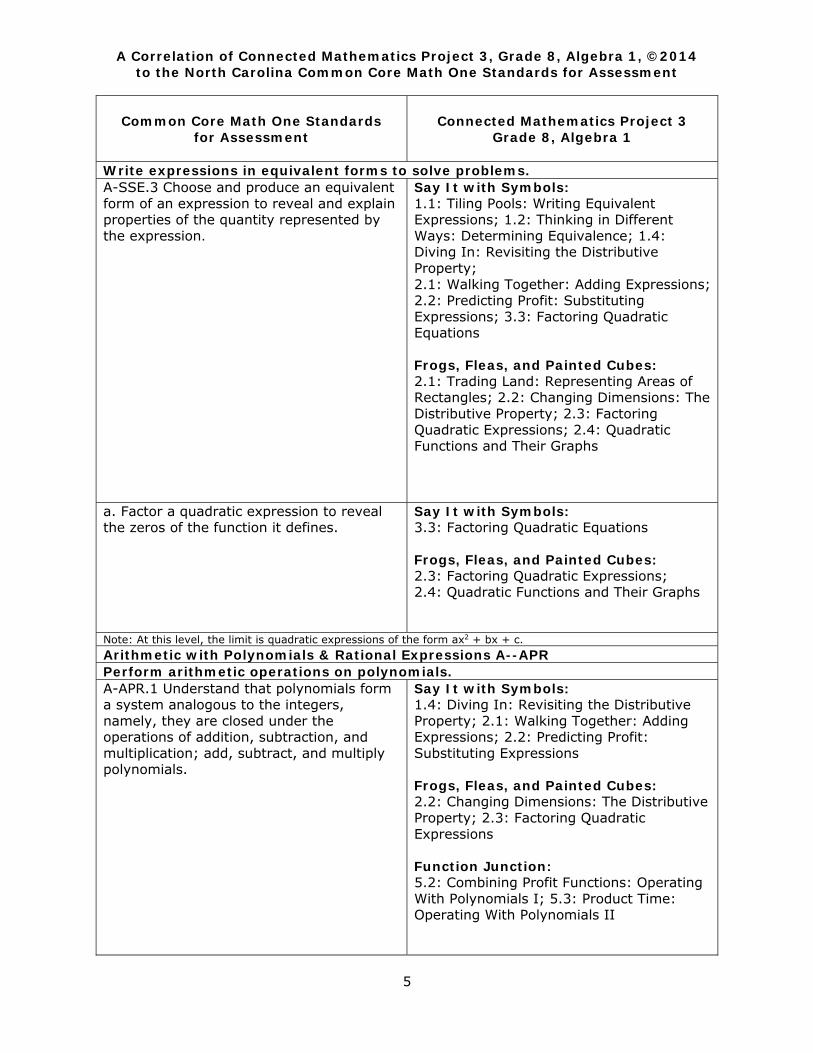
Write expressions in equivalent forms to solve problems. A-SSE.3 Choose and produce an equivalent form of an expression to reveal and explain properties of the quantity represented by the expression.
Say It with Symbols: 1.1: Tiling Pools: Writing Equivalent Expressions; 1.2: Thinking in Different Ways: Determining Equivalence; 1.4: Diving In: Revisiting the Distributive Property; 2.1: Walking Together: Adding Expressions; 2.2: Predicting Profit: Substituting Expressions; 3.3: Factoring Quadratic Equations Frogs, Fleas, and Painted Cubes: 2.1: Trading Land: Representing Areas of Rectangles; 2.2: Changing Dimensions: The Distributive Property; 2.3: Factoring Quadratic Expressions; 2.4: Quadratic Functions and Their Graphs
a. Factor a quadratic expression to reveal the zeros of the function it defines.
Say It with Symbols: 3.3: Factoring Quadratic Equations Frogs, Fleas, and Painted Cubes: 2.3: Factoring Quadratic Expressions; 2.4: Quadratic Functions and Their Graphs
Note: At this level, the limit is quadratic expressions of the form ax2 + bx + c. Arithmetic with Polynomials & Rational Expressions A--APR Perform arithmetic operations on polynomials. A-APR.1 Understand that polynomials form a system analogous to the integers, namely, they are closed under the operations of addition, subtraction, and multiplication; add, subtract, and multiply polynomials.
Say It with Symbols: 1.4: Diving In: Revisiting the Distributive Property; 2.1: Walking Together: Adding Expressions; 2.2: Predicting Profit: Substituting Expressions Frogs, Fleas, and Painted Cubes: 2.2: Changing Dimensions: The Distributive Property; 2.3: Factoring Quadratic Expressions Function Junction: 5.2: Combining Profit Functions: Operating With Polynomials I; 5.3: Product Time: Operating With Polynomials II
A Correlation of Connected Mathematics Project 3, Grade 8, Algebra 1, ©2014 to the North Carolina Common Core Math One Standards for Assessment
6
Common Core Math One Standards for Assessment
Connected Mathematics Project 3 Grade 8, Algebra 1
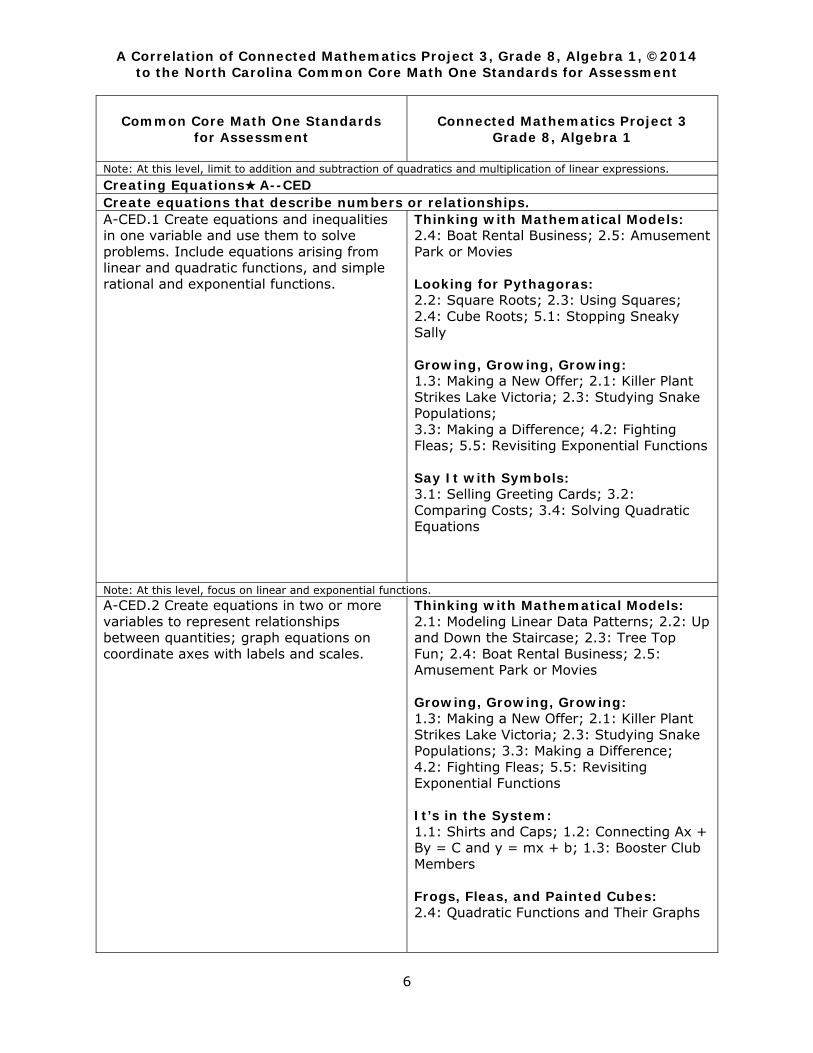
Note: At this level, limit to addition and subtraction of quadratics and multiplication of linear expressions. Creating Equations★ A--CED Create equations that describe numbers or relationships. A-CED.1 Create equations and inequalities in one variable and use them to solve problems. Include equations arising from linear and quadratic functions, and simple rational and exponential functions.
Thinking with Mathematical Models: 2.4: Boat Rental Business; 2.5: Amusement Park or Movies Looking for Pythagoras: 2.2: Square Roots; 2.3: Using Squares; 2.4: Cube Roots; 5.1: Stopping Sneaky Sally Growing, Growing, Growing: 1.3: Making a New Offer; 2.1: Killer Plant Strikes Lake Victoria; 2.3: Studying Snake Populations; 3.3: Making a Difference; 4.2: Fighting Fleas; 5.5: Revisiting Exponential Functions Say It with Symbols: 3.1: Selling Greeting Cards; 3.2: Comparing Costs; 3.4: Solving Quadratic Equations
Note: At this level, focus on linear and exponential functions. A-CED.2 Create equations in two or more variables to represent relationships between quantities; graph equations on coordinate axes with labels and scales.
Thinking with Mathematical Models: 2.1: Modeling Linear Data Patterns; 2.2: Up and Down the Staircase; 2.3: Tree Top Fun; 2.4: Boat Rental Business; 2.5: Amusement Park or Movies Growing, Growing, Growing: 1.3: Making a New Offer; 2.1: Killer Plant Strikes Lake Victoria; 2.3: Studying Snake Populations; 3.3: Making a Difference; 4.2: Fighting Fleas; 5.5: Revisiting Exponential Functions It’s in the System: 1.1: Shirts and Caps; 1.2: Connecting Ax + By = C and y = mx + b; 1.3: Booster Club Members Frogs, Fleas, and Painted Cubes: 2.4: Quadratic Functions and Their Graphs
A Correlation of Connected Mathematics Project 3, Grade 8, Algebra 1, ©2014 to the North Carolina Common Core Math One Standards for Assessment
7
Common Core Math One Standards for Assessment
Connected Mathematics Project 3 Grade 8, Algebra 1
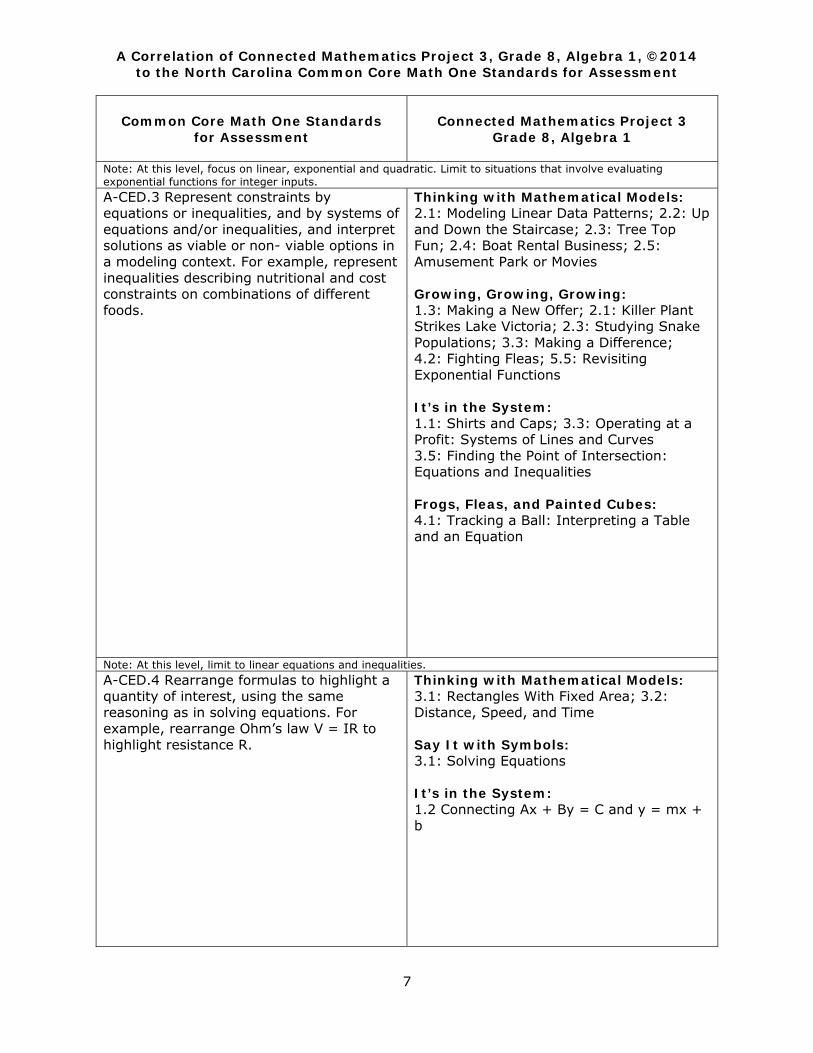
Note: At this level, focus on linear, exponential and quadratic. Limit to situations that involve evaluating exponential functions for integer inputs. A-CED.3 Represent constraints by equations or inequalities, and by systems of equations and/or inequalities, and interpret solutions as viable or non- viable options in a modeling context. For example, represent inequalities describing nutritional and cost constraints on combinations of different foods.
Thinking with Mathematical Models: 2.1: Modeling Linear Data Patterns; 2.2: Up and Down the Staircase; 2.3: Tree Top Fun; 2.4: Boat Rental Business; 2.5: Amusement Park or Movies Growing, Growing, Growing: 1.3: Making a New Offer; 2.1: Killer Plant Strikes Lake Victoria; 2.3: Studying Snake Populations; 3.3: Making a Difference; 4.2: Fighting Fleas; 5.5: Revisiting Exponential Functions It’s in the System: 1.1: Shirts and Caps; 3.3: Operating at a Profit: Systems of Lines and Curves 3.5: Finding the Point of Intersection: Equations and Inequalities Frogs, Fleas, and Painted Cubes: 4.1: Tracking a Ball: Interpreting a Table and an Equation
Note: At this level, limit to linear equations and inequalities. A-CED.4 Rearrange formulas to highlight a quantity of interest, using the same reasoning as in solving equations. For example, rearrange Ohm’s law V = IR to highlight resistance R.
Thinking with Mathematical Models: 3.1: Rectangles With Fixed Area; 3.2: Distance, Speed, and Time Say It with Symbols: 3.1: Solving Equations It’s in the System: 1.2 Connecting Ax + By = C and y = mx + b
A Correlation of Connected Mathematics Project 3, Grade 8, Algebra 1, ©2014 to the North Carolina Common Core Math One Standards for Assessment
8
Common Core Math One Standards for Assessment
Connected Mathematics Project 3 Grade 8, Algebra 1
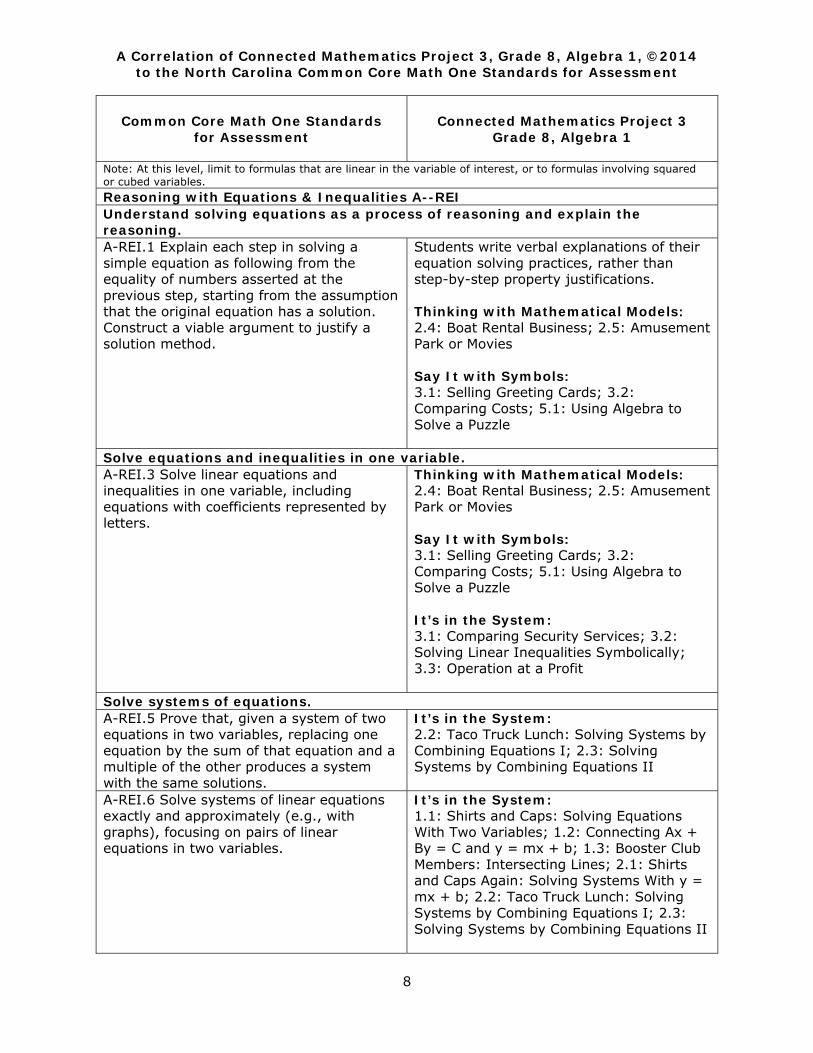
Note: At this level, limit to formulas that are linear in the variable of interest, or to formulas involving squared or cubed variables. Reasoning with Equations & Inequalities A--REI Understand solving equations as a process of reasoning and explain the reasoning. A-REI.1 Explain each step in solving a simple equation as following from the equality of numbers asserted at the previous step, starting from the assumption that the original equation has a solution. Construct a viable argument to justify a solution method.
Students write verbal explanations of their equation solving practices, rather than step-by-step property justifications. Thinking with Mathematical Models: 2.4: Boat Rental Business; 2.5: Amusement Park or Movies Say It with Symbols: 3.1: Selling Greeting Cards; 3.2: Comparing Costs; 5.1: Using Algebra to Solve a Puzzle
Solve equations and inequalities in one variable. A-REI.3 Solve linear equations and inequalities in one variable, including equations with coefficients represented by letters.
Thinking with Mathematical Models: 2.4: Boat Rental Business; 2.5: Amusement Park or Movies Say It with Symbols: 3.1: Selling Greeting Cards; 3.2: Comparing Costs; 5.1: Using Algebra to Solve a Puzzle It’s in the System: 3.1: Comparing Security Services; 3.2: Solving Linear Inequalities Symbolically; 3.3: Operation at a Profit
Solve systems of equations. A-REI.5 Prove that, given a system of two equations in two variables, replacing one equation by the sum of that equation and a multiple of the other produces a system with the same solutions.
It’s in the System: 2.2: Taco Truck Lunch: Solving Systems by Combining Equations I; 2.3: Solving Systems by Combining Equations II
A-REI.6 Solve systems of linear equations exactly and approximately (e.g., with graphs), focusing on pairs of linear equations in two variables.
It’s in the System: 1.1: Shirts and Caps: Solving Equations With Two Variables; 1.2: Connecting Ax + By = C and y = mx + b; 1.3: Booster Club Members: Intersecting Lines; 2.1: Shirts and Caps Again: Solving Systems With y = mx + b; 2.2: Taco Truck Lunch: Solving Systems by Combining Equations I; 2.3: Solving Systems by Combining Equations II
A Correlation of Connected Mathematics Project 3, Grade 8, Algebra 1, ©2014 to the North Carolina Common Core Math One Standards for Assessment
9
Common Core Math One Standards for Assessment
Connected Mathematics Project 3 Grade 8, Algebra 1
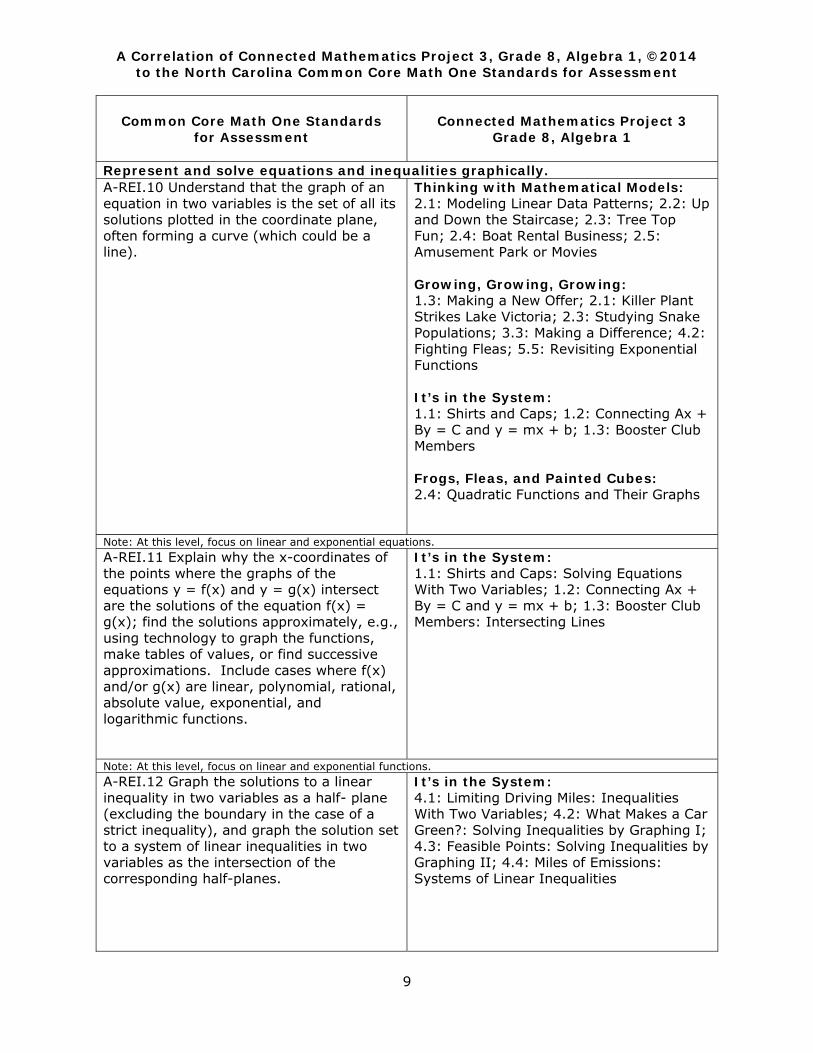
Represent and solve equations and inequalities graphically. A-REI.10 Understand that the graph of an equation in two variables is the set of all its solutions plotted in the coordinate plane, often forming a curve (which could be a line).
Thinking with Mathematical Models: 2.1: Modeling Linear Data Patterns; 2.2: Up and Down the Staircase; 2.3: Tree Top Fun; 2.4: Boat Rental Business; 2.5: Amusement Park or Movies Growing, Growing, Growing: 1.3: Making a New Offer; 2.1: Killer Plant Strikes Lake Victoria; 2.3: Studying Snake Populations; 3.3: Making a Difference; 4.2: Fighting Fleas; 5.5: Revisiting Exponential Functions It’s in the System: 1.1: Shirts and Caps; 1.2: Connecting Ax + By = C and y = mx + b; 1.3: Booster Club Members Frogs, Fleas, and Painted Cubes: 2.4: Quadratic Functions and Their Graphs
Note: At this level, focus on linear and exponential equations. A-REI.11 Explain why the x-coordinates of the points where the graphs of the equations y = f(x) and y = g(x) intersect are the solutions of the equation f(x) = g(x); find the solutions approximately, e.g., using technology to graph the functions, make tables of values, or find successive approximations. Include cases where f(x) and/or g(x) are linear, polynomial, rational, absolute value, exponential, and logarithmic functions.
It’s in the System: 1.1: Shirts and Caps: Solving Equations With Two Variables; 1.2: Connecting Ax + By = C and y = mx + b; 1.3: Booster Club Members: Intersecting Lines
Note: At this level, focus on linear and exponential functions. A-REI.12 Graph the solutions to a linear inequality in two variables as a half- plane (excluding the boundary in the case of a strict inequality), and graph the solution set to a system of linear inequalities in two variables as the intersection of the corresponding half-planes.
It’s in the System: 4.1: Limiting Driving Miles: Inequalities With Two Variables; 4.2: What Makes a Car Green?: Solving Inequalities by Graphing I; 4.3: Feasible Points: Solving Inequalities by Graphing II; 4.4: Miles of Emissions: Systems of Linear Inequalities

A Correlation of Connected Mathematics Project 3, Grade 8, Algebra 1, ©2014 to the North Carolina Common Core Math One Standards for Assessment
10
Common Core Math One Standards for Assessment
Connected Mathematics Project 3 Grade 8, Algebra 1
Interpreting Functions F--IF Understand the concept of a function and use function notation. F-IF.1 Understand that a function from one set (called the domain) to another set (called the range) assigns to each element of the domain exactly one element of the range. If f is a function and x is an element of its domain, then f(x) denotes the output of f corresponding to the input x. The graph of f is the graph of the equation y = f(x).
Thinking with Mathematical Models: 2.1: Modeling Linear Data Patterns; 3.2: Distance, Speed and Time Growing, Growing, Growing: 2.1: Killer Plant Strikes Lake Victoria; 2.2: Growing Mold; 5.5: Revisiting Exponential Functions Say It with Symbols: 3.1: Selling Greeting Cards; 4.4: What’s the Function? Frogs, Fleas, and Painted Cubes: 4.1: Tracking a Ball: Interpreting a Table and an Equation; 4.4: Painted Cubes: Looking at Several Functions Function Junction: 1.1: Filling Functions; 1.2: Domain, Range, and Function Notation; 5.1: Properties of Polynomial Expressions and Functions
F-IF.2 Use function notation, evaluate functions for inputs in their domains, and interpret statements that use function notation in terms of a context.
Frogs, Fleas, and Painted Cubes: 4.2: Measuring Jumps: Comparing Quadratic Relationships; 4.3: Putting It All Together: Functions and Patterns of Change; 4.4: Painted Cubes: Looking at Several Functions Function Junction: 1.1: Filling Functions; 1.3: Taxi Fares, Time Payments, and Step Functions; 1.4: Piecewise-Defined Functions; 5.1: Properties of Polynomial Expressions and Functions; 5.2: Combining Profit Functions: Operating With Polynomials II
Note: At this level, the focus is linear and exponential functions. F-IF.3 Recognize that sequences are functions, sometimes defined recursively, whose domain is a subset of the integers. For example, the Fibonacci sequence is defined recursively by f(0) = f(1) = 1, f(n+1) = f(n) + f(n-1) for n ≥ 1.
Function Junction: 2.1: Arithmetic Sequences; 2.2: Geometric Sequences
A Correlation of Connected Mathematics Project 3, Grade 8, Algebra 1, ©2014 to the North Carolina Common Core Math One Standards for Assessment
11
Common Core Math One Standards for Assessment
Connected Mathematics Project 3 Grade 8, Algebra 1
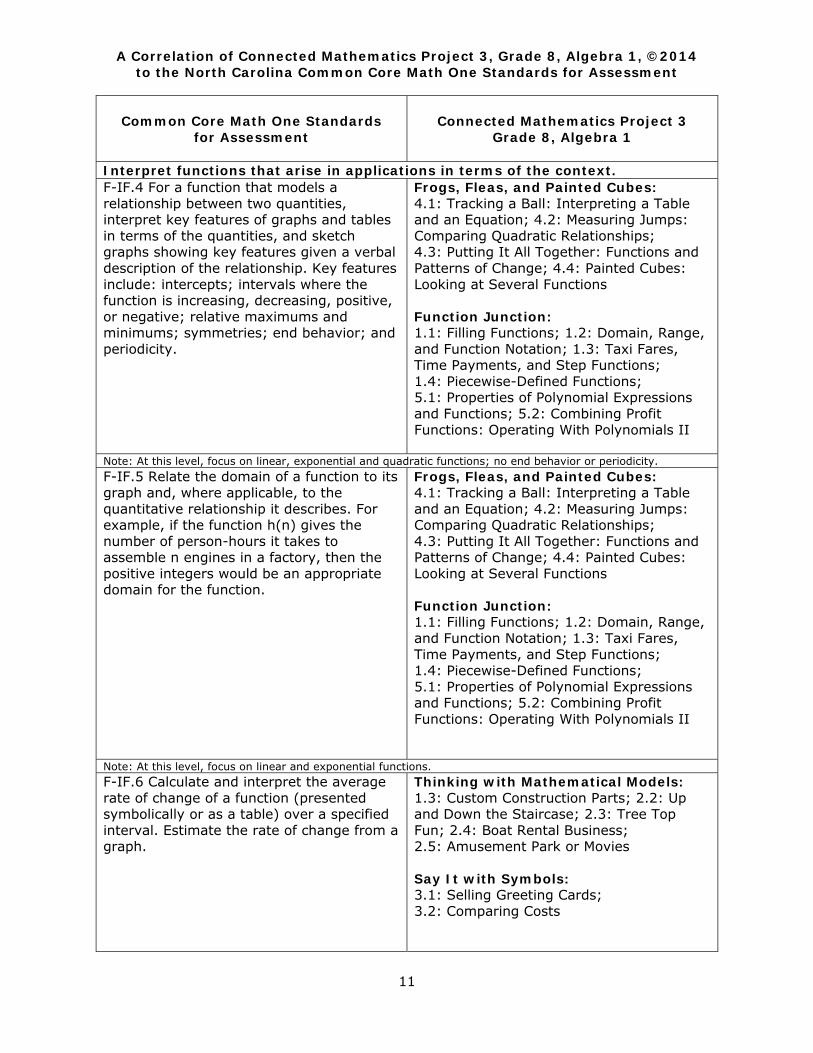
Interpret functions that arise in applications in terms of the context. F-IF.4 For a function that models a relationship between two quantities, interpret key features of graphs and tables in terms of the quantities, and sketch graphs showing key features given a verbal description of the relationship. Key features include: intercepts; intervals where the function is increasing, decreasing, positive, or negative; relative maximums and minimums; symmetries; end behavior; and periodicity.
Frogs, Fleas, and Painted Cubes: 4.1: Tracking a Ball: Interpreting a Table and an Equation; 4.2: Measuring Jumps: Comparing Quadratic Relationships; 4.3: Putting It All Together: Functions and Patterns of Change; 4.4: Painted Cubes: Looking at Several Functions Function Junction: 1.1: Filling Functions; 1.2: Domain, Range, and Function Notation; 1.3: Taxi Fares, Time Payments, and Step Functions; 1.4: Piecewise-Defined Functions; 5.1: Properties of Polynomial Expressions and Functions; 5.2: Combining Profit Functions: Operating With Polynomials II
Note: At this level, focus on linear, exponential and quadratic functions; no end behavior or periodicity. F-IF.5 Relate the domain of a function to its graph and, where applicable, to the quantitative relationship it describes. For example, if the function h(n) gives the number of person-hours it takes to assemble n engines in a factory, then the positive integers would be an appropriate domain for the function.
Frogs, Fleas, and Painted Cubes: 4.1: Tracking a Ball: Interpreting a Table and an Equation; 4.2: Measuring Jumps: Comparing Quadratic Relationships; 4.3: Putting It All Together: Functions and Patterns of Change; 4.4: Painted Cubes: Looking at Several Functions Function Junction: 1.1: Filling Functions; 1.2: Domain, Range, and Function Notation; 1.3: Taxi Fares, Time Payments, and Step Functions; 1.4: Piecewise-Defined Functions; 5.1: Properties of Polynomial Expressions and Functions; 5.2: Combining Profit Functions: Operating With Polynomials II
Note: At this level, focus on linear and exponential functions. F-IF.6 Calculate and interpret the average rate of change of a function (presented symbolically or as a table) over a specified interval. Estimate the rate of change from a graph.
Thinking with Mathematical Models: 1.3: Custom Construction Parts; 2.2: Up and Down the Staircase; 2.3: Tree Top Fun; 2.4: Boat Rental Business; 2.5: Amusement Park or Movies Say It with Symbols: 3.1: Selling Greeting Cards; 3.2: Comparing Costs

A Correlation of Connected Mathematics Project 3, Grade 8, Algebra 1, ©2014 to the North Carolina Common Core Math One Standards for Assessment
12
Common Core Math One Standards for Assessment
Connected Mathematics Project 3 Grade 8, Algebra 1
Note: At this level, focus on linear functions and exponential functions whose domain is a subset of the integers. Analyze functions using different representations. F-IF.7 Graph functions expressed symbolically and show key features of the graph, by hand in simple cases and using technology for more complicated cases.
Thinking with Mathematical Models: 2.1: Modeling Linear Data Patterns; 2.3: Tree Top Fun: Equations for Linear Functions; 2.5: Amusement Park or Movies: Intersecting Linear Functions Growing, Growing, Growing: 2.1: Killer Plant Strikes Lake Victoria: y-Intercepts Other Than 1; 4.3: Cooling Water: Modeling Exponential Decay Say It with Symbols: 3.3: Factoring Quadratic Equations Frogs, Fleas, and Painted Cubes: 1.2: Reading Graphs and Tables; 2.4: Quadratic Functions and Their Graphs; 4.1: Tracking a Ball: Interpreting a Table and an Equation Function Junction: 1.3: Taxi Fares, Time Payments, and Step Functions; 1.4: Piecewise-Defined Functions; 4.4: Complex Numbers; 5.1: Properties of Polynomial Expressions and Functions
a. Graph linear and quadratic functions and show intercepts, maxima, and minima.
Thinking with Mathematical Models: 2.1: Modeling Linear Data Patterns; 2.2: Up and Down the Staircase: Exploring Slope; 2.4: Boat Rental Service: Solving Linear Equations; Say It with Symbols: 3.3: Factoring Quadratic Equations Function Junction: 4.1: Applying Square Roots; 4.3: The Quadratic Formula; 4.4: Complex Numbers Frogs, Fleas, and Painted Cubes: 1.2: Reading Graphs and Tables; 2.4: Quadratic Functions and Their Graphs; 4.1: Tracking a Ball: Interpreting a Table and an Equation

A Correlation of Connected Mathematics Project 3, Grade 8, Algebra 1, ©2014 to the North Carolina Common Core Math One Standards for Assessment
13
Common Core Math One Standards for Assessment
Connected Mathematics Project 3 Grade 8, Algebra 1
e. Graph exponential and logarithmic functions, showing intercepts and end behavior, and trigonometric functions, showing period, midline, and amplitude.
Growing, Growing, Growing: 2.1: Killer Plant Strikes Lake Victoria: y-Intercepts Other Than 1; 2.2: Growing Mold: Interpreting Equations for Exponential Functions; 3.1: Reproducing Rabbits: Fractional Growth Patterns; 3.2: Investing for the Future: Growth Rates; 3.3: Making a Difference: Connecting Growth Rate and Growth Factor; 4.1: Making Smaller Ballots: Introducing Exponential Decay; 4.2: Fighting Fleas: Representing Exponential Decay; 4.3: Cooling Water: Modeling Exponential Decay
Note: At this level, for part e, focus on exponential functions only. F-IF.8 Write a function defined by an expression in different but equivalent forms to reveal and explain different properties of the function.
Say It with Symbols: 1.2: Thinking in Different Ways: Determining Equivalence; 1.3: The Community Pool Problem: Interpreting Expressions; 2.2: Predicting Profit: Substituting Expressions; 3.3: Factoring Quadratic Equations
a. Use the process of factoring and completing the square in a quadratic function to show zeros, extreme values, and symmetry of the graph, and interpret these in terms of a context.
Say It with Symbols: 3.3: Factoring Quadratic Equations Frogs, Fleas, and Painted Cubes: 2.3: Factoring Quadratic Expressions; 2.4: Quadratic Functions and Their Graphs
A Correlation of Connected Mathematics Project 3, Grade 8, Algebra 1, ©2014 to the North Carolina Common Core Math One Standards for Assessment
14
Common Core Math One Standards for Assessment
Connected Mathematics Project 3 Grade 8, Algebra 1
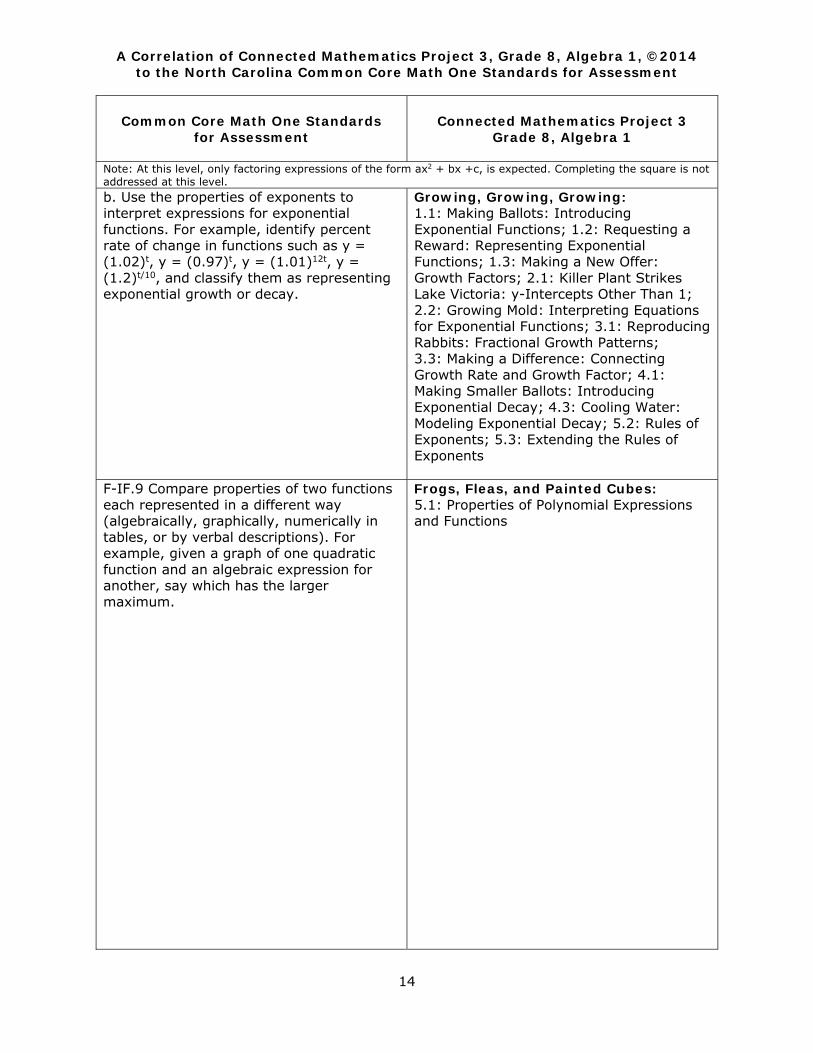
Note: At this level, only factoring expressions of the form ax2 + bx +c, is expected. Completing the square is not addressed at this level. b. Use the properties of exponents to interpret expressions for exponential functions. For example, identify percent rate of change in functions such as y = (1.02)t, y = (0.97)t, y = (1.01)12t, y = (1.2)t/10, and classify them as representing exponential growth or decay.
Growing, Growing, Growing: 1.1: Making Ballots: Introducing Exponential Functions; 1.2: Requesting a Reward: Representing Exponential Functions; 1.3: Making a New Offer: Growth Factors; 2.1: Killer Plant Strikes Lake Victoria: y-Intercepts Other Than 1; 2.2: Growing Mold: Interpreting Equations for Exponential Functions; 3.1: Reproducing Rabbits: Fractional Growth Patterns; 3.3: Making a Difference: Connecting Growth Rate and Growth Factor; 4.1: Making Smaller Ballots: Introducing Exponential Decay; 4.3: Cooling Water: Modeling Exponential Decay; 5.2: Rules of Exponents; 5.3: Extending the Rules of Exponents
F-IF.9 Compare properties of two functions each represented in a different way (algebraically, graphically, numerically in tables, or by verbal descriptions). For example, given a graph of one quadratic function and an algebraic expression for another, say which has the larger maximum.
Frogs, Fleas, and Painted Cubes: 5.1: Properties of Polynomial Expressions and Functions
A Correlation of Connected Mathematics Project 3, Grade 8, Algebra 1, ©2014 to the North Carolina Common Core Math One Standards for Assessment
15
Common Core Math One Standards for Assessment
Connected Mathematics Project 3 Grade 8, Algebra 1
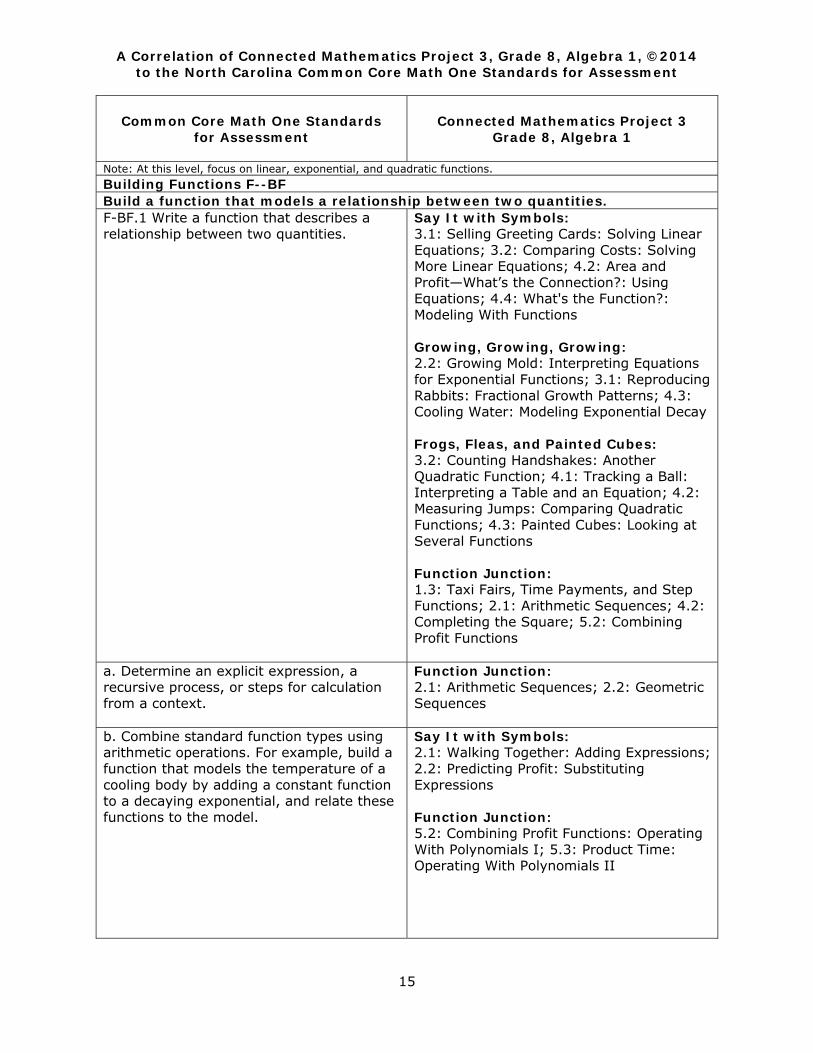
Note: At this level, focus on linear, exponential, and quadratic functions. Building Functions F--BF Build a function that models a relationship between two quantities. F-BF.1 Write a function that describes a relationship between two quantities.
Say It with Symbols: 3.1: Selling Greeting Cards: Solving Linear Equations; 3.2: Comparing Costs: Solving More Linear Equations; 4.2: Area and Profit—What’s the Connection?: Using Equations; 4.4: What's the Function?: Modeling With Functions Growing, Growing, Growing: 2.2: Growing Mold: Interpreting Equations for Exponential Functions; 3.1: Reproducing Rabbits: Fractional Growth Patterns; 4.3: Cooling Water: Modeling Exponential Decay Frogs, Fleas, and Painted Cubes: 3.2: Counting Handshakes: Another Quadratic Function; 4.1: Tracking a Ball: Interpreting a Table and an Equation; 4.2: Measuring Jumps: Comparing Quadratic Functions; 4.3: Painted Cubes: Looking at Several Functions Function Junction: 1.3: Taxi Fairs, Time Payments, and Step Functions; 2.1: Arithmetic Sequences; 4.2: Completing the Square; 5.2: Combining Profit Functions
a. Determine an explicit expression, a recursive process, or steps for calculation from a context.
Function Junction: 2.1: Arithmetic Sequences; 2.2: Geometric Sequences
b. Combine standard function types using arithmetic operations. For example, build a function that models the temperature of a cooling body by adding a constant function to a decaying exponential, and relate these functions to the model.
Say It with Symbols: 2.1: Walking Together: Adding Expressions; 2.2: Predicting Profit: Substituting Expressions Function Junction: 5.2: Combining Profit Functions: Operating With Polynomials I; 5.3: Product Time: Operating With Polynomials II

A Correlation of Connected Mathematics Project 3, Grade 8, Algebra 1, ©2014 to the North Carolina Common Core Math One Standards for Assessment
16
Common Core Math One Standards for Assessment
Connected Mathematics Project 3 Grade 8, Algebra 1
Note: At this level, limit to addition or subtraction of constant to linear, exponential or quadratic functions or addition of linear functions to linear or quadratic functions. F-BF.2 Write arithmetic and geometric sequences both recursively and with an explicit formula, use them to model situations, and translate between the two forms.
Function Junction: 2.1: Arithmetic Sequences; 2.2: Geometric Sequences
Note: At this level, formal recursive notation is not used. Instead, use of informal recursive notation (such as NEXT = NOW + 5 starting at 3) is intended. Build new functions from existing functions. F-BF.3 Identify the effect on the graph of replacing f(x) by f(x) + k, k f(x), f(kx), and f(x + k) for specific values of k (both positive and negative); find the value of k given the graphs. Experiment with cases and illustrate an explanation of the effects on the graph using technology. Include recognizing even and odd functions from their graphs and algebraic expressions for them.
Function Junction: 3.1: Sliding Up and Down: Vertical Translations of Functions; 3.2: Stretching and Flipping Up and Down: Multiplicative Transformations of Functions; 3.3: Sliding Left and Right: Horizontal Translations of Functions; 3.4: Getting From Here to There: Transforming y = x2
Note: At this level, limit to vertical and horizontal translations of linear and exponential functions. Even and odd functions are not addressed. Linear, Quadratic, & Exponential Models★ F-LE Construct and compare linear and exponential models and solve problems. F-LE.1 Distinguish between situations that can be modeled with linear functions and with exponential functions
Say It with Symbols: 3.1: Selling Greeting Cards: Solving Linear Equations; 3.2: Comparing Costs: Solving More Linear Equations; 4.3: Generating Patterns: Linear, Exponential, Quadratic; 4.4: What's the Function?": Modeling With Functions
a. Prove that linear functions grow by equal differences over equal intervals, and that exponential functions grow by equal factors over equal intervals.
Say It with Symbols: 4.3: Generating Patterns: Linear, Exponential, Quadratic
b. Recognize situations in which one quantity changes at a constant rate per unit interval relative to another.
Thinking with Mathematical Models: 2.1: Modeling Linear Data Patterns; 2.2: Up and Down the Staircase: Exploring Slope; 2.3: Tree Top Fun: Equations for Linear Functions; 2.4: Boat Rental Service: Solving Linear Equations; 2.5: Amusement Park or Movies: Intersecting Linear Functions Function Junction: 2.1: Arithmetic Sequences
A Correlation of Connected Mathematics Project 3, Grade 8, Algebra 1, ©2014 to the North Carolina Common Core Math One Standards for Assessment
17
Common Core Math One Standards for Assessment
Connected Mathematics Project 3 Grade 8, Algebra 1
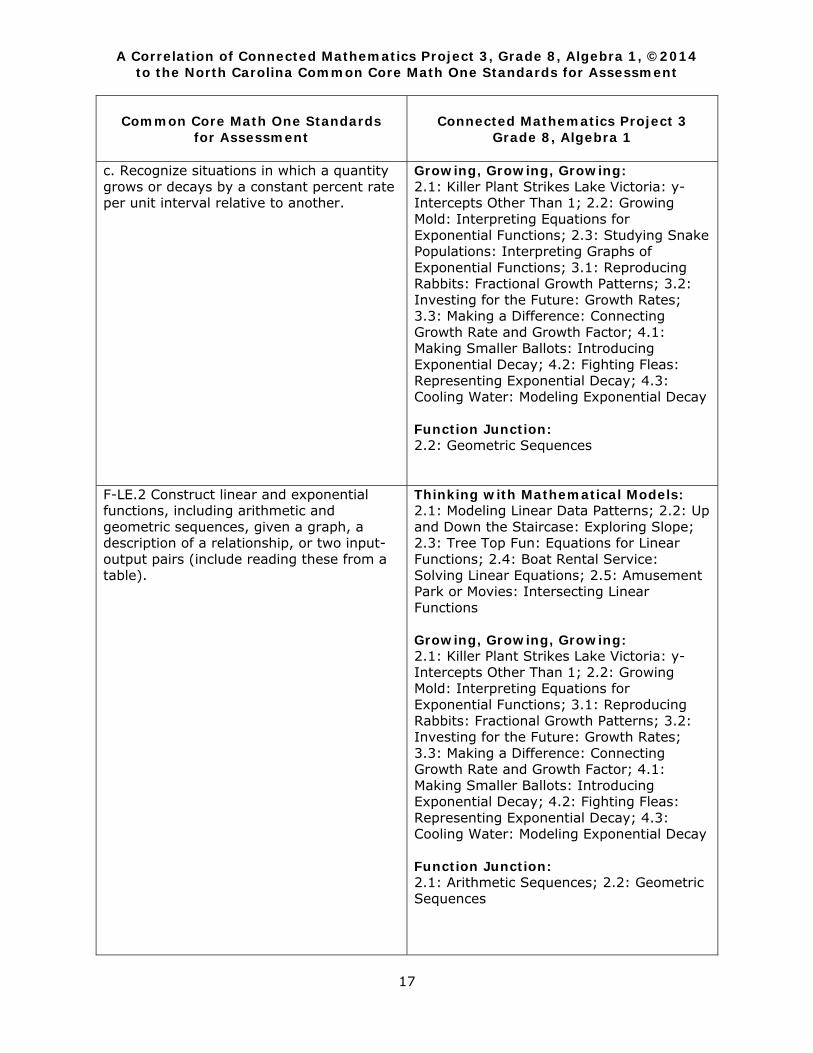
c. Recognize situations in which a quantity grows or decays by a constant percent rate per unit interval relative to another.
Growing, Growing, Growing: 2.1: Killer Plant Strikes Lake Victoria: y-Intercepts Other Than 1; 2.2: Growing Mold: Interpreting Equations for Exponential Functions; 2.3: Studying Snake Populations: Interpreting Graphs of Exponential Functions; 3.1: Reproducing Rabbits: Fractional Growth Patterns; 3.2: Investing for the Future: Growth Rates; 3.3: Making a Difference: Connecting Growth Rate and Growth Factor; 4.1: Making Smaller Ballots: Introducing Exponential Decay; 4.2: Fighting Fleas: Representing Exponential Decay; 4.3: Cooling Water: Modeling Exponential Decay Function Junction: 2.2: Geometric Sequences
F-LE.2 Construct linear and exponential functions, including arithmetic and geometric sequences, given a graph, a description of a relationship, or two input-output pairs (include reading these from a table).
Thinking with Mathematical Models: 2.1: Modeling Linear Data Patterns; 2.2: Up and Down the Staircase: Exploring Slope; 2.3: Tree Top Fun: Equations for Linear Functions; 2.4: Boat Rental Service: Solving Linear Equations; 2.5: Amusement Park or Movies: Intersecting Linear Functions Growing, Growing, Growing: 2.1: Killer Plant Strikes Lake Victoria: y-Intercepts Other Than 1; 2.2: Growing Mold: Interpreting Equations for Exponential Functions; 3.1: Reproducing Rabbits: Fractional Growth Patterns; 3.2: Investing for the Future: Growth Rates; 3.3: Making a Difference: Connecting Growth Rate and Growth Factor; 4.1: Making Smaller Ballots: Introducing Exponential Decay; 4.2: Fighting Fleas: Representing Exponential Decay; 4.3: Cooling Water: Modeling Exponential Decay Function Junction: 2.1: Arithmetic Sequences; 2.2: Geometric Sequences
A Correlation of Connected Mathematics Project 3, Grade 8, Algebra 1, ©2014 to the North Carolina Common Core Math One Standards for Assessment
18
Common Core Math One Standards for Assessment
Connected Mathematics Project 3 Grade 8, Algebra 1
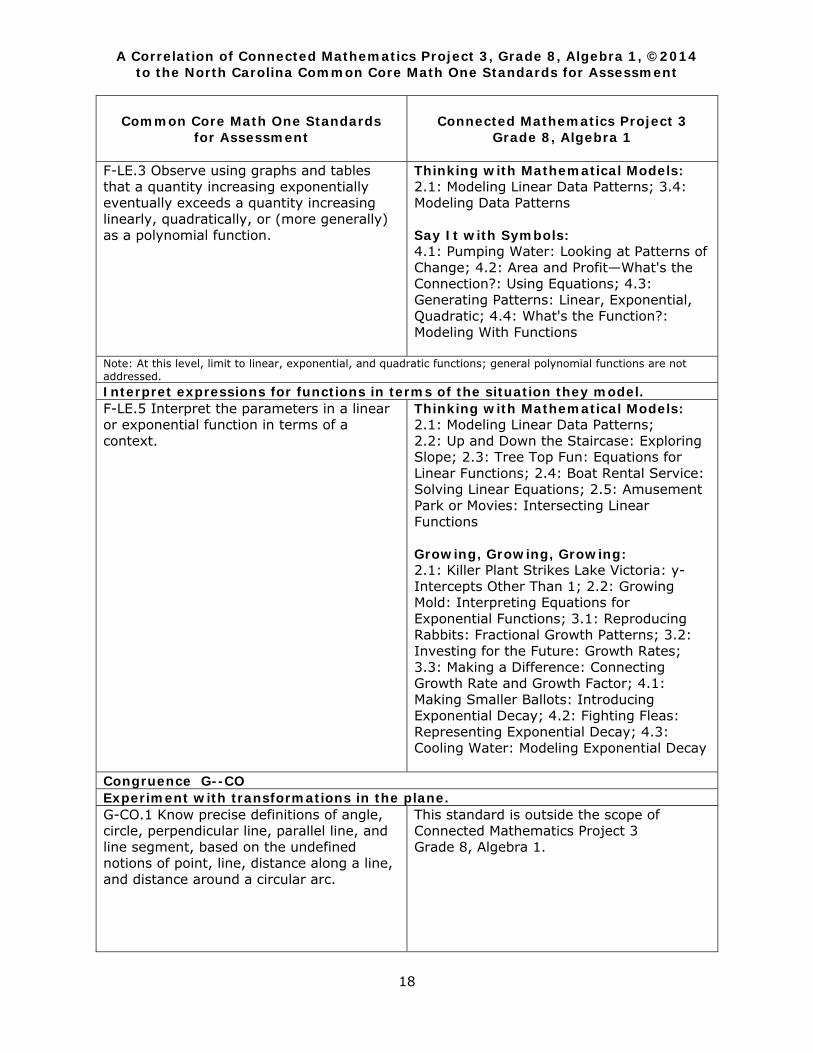
F-LE.3 Observe using graphs and tables that a quantity increasing exponentially eventually exceeds a quantity increasing linearly, quadratically, or (more generally) as a polynomial function.
Thinking with Mathematical Models: 2.1: Modeling Linear Data Patterns; 3.4: Modeling Data Patterns Say It with Symbols: 4.1: Pumping Water: Looking at Patterns of Change; 4.2: Area and Profit—What's the Connection?: Using Equations; 4.3: Generating Patterns: Linear, Exponential, Quadratic; 4.4: What's the Function?: Modeling With Functions
Note: At this level, limit to linear, exponential, and quadratic functions; general polynomial functions are not addressed. Interpret expressions for functions in terms of the situation they model. F-LE.5 Interpret the parameters in a linear or exponential function in terms of a context.
Thinking with Mathematical Models: 2.1: Modeling Linear Data Patterns; 2.2: Up and Down the Staircase: Exploring Slope; 2.3: Tree Top Fun: Equations for Linear Functions; 2.4: Boat Rental Service: Solving Linear Equations; 2.5: Amusement Park or Movies: Intersecting Linear Functions Growing, Growing, Growing: 2.1: Killer Plant Strikes Lake Victoria: y-Intercepts Other Than 1; 2.2: Growing Mold: Interpreting Equations for Exponential Functions; 3.1: Reproducing Rabbits: Fractional Growth Patterns; 3.2: Investing for the Future: Growth Rates; 3.3: Making a Difference: Connecting Growth Rate and Growth Factor; 4.1: Making Smaller Ballots: Introducing Exponential Decay; 4.2: Fighting Fleas: Representing Exponential Decay; 4.3: Cooling Water: Modeling Exponential Decay
Congruence G--CO Experiment with transformations in the plane. G-CO.1 Know precise definitions of angle, circle, perpendicular line, parallel line, and line segment, based on the undefined notions of point, line, distance along a line, and distance around a circular arc.
This standard is outside the scope of Connected Mathematics Project 3 Grade 8, Algebra 1.
A Correlation of Connected Mathematics Project 3, Grade 8, Algebra 1, ©2014 to the North Carolina Common Core Math One Standards for Assessment
19
Common Core Math One Standards for Assessment
Connected Mathematics Project 3 Grade 8, Algebra 1
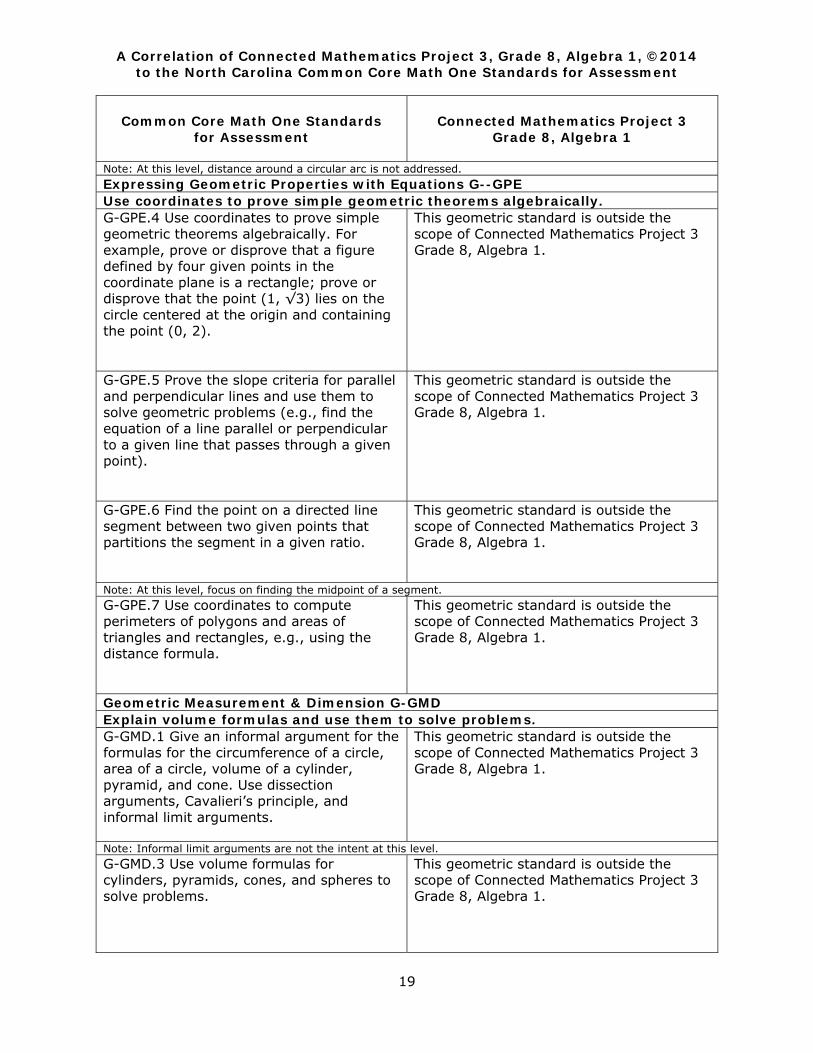
Note: At this level, distance around a circular arc is not addressed. Expressing Geometric Properties with Equations G--GPE Use coordinates to prove simple geometric theorems algebraically. G-GPE.4 Use coordinates to prove simple geometric theorems algebraically. For example, prove or disprove that a figure defined by four given points in the coordinate plane is a rectangle; prove or disprove that the point (1, √3) lies on the circle centered at the origin and containing the point (0, 2).
This geometric standard is outside the scope of Connected Mathematics Project 3 Grade 8, Algebra 1.
G-GPE.5 Prove the slope criteria for parallel and perpendicular lines and use them to solve geometric problems (e.g., find the equation of a line parallel or perpendicular to a given line that passes through a given point).
This geometric standard is outside the scope of Connected Mathematics Project 3 Grade 8, Algebra 1.
G-GPE.6 Find the point on a directed line segment between two given points that partitions the segment in a given ratio.
This geometric standard is outside the scope of Connected Mathematics Project 3 Grade 8, Algebra 1.
Note: At this level, focus on finding the midpoint of a segment. G-GPE.7 Use coordinates to compute perimeters of polygons and areas of triangles and rectangles, e.g., using the distance formula.
This geometric standard is outside the scope of Connected Mathematics Project 3 Grade 8, Algebra 1.
Geometric Measurement & Dimension G-GMD Explain volume formulas and use them to solve problems. G-GMD.1 Give an informal argument for the formulas for the circumference of a circle, area of a circle, volume of a cylinder, pyramid, and cone. Use dissection arguments, Cavalieri’s principle, and informal limit arguments.
This geometric standard is outside the scope of Connected Mathematics Project 3 Grade 8, Algebra 1.
Note: Informal limit arguments are not the intent at this level. G-GMD.3 Use volume formulas for cylinders, pyramids, cones, and spheres to solve problems.
This geometric standard is outside the scope of Connected Mathematics Project 3 Grade 8, Algebra 1.

A Correlation of Connected Mathematics Project 3, Grade 8, Algebra 1, ©2014 to the North Carolina Common Core Math One Standards for Assessment
20
Common Core Math One Standards for Assessment
Connected Mathematics Project 3 Grade 8, Algebra 1
Note: At this level, formulas for pyramids, cones and spheres will be given. Interpreting Categorical & Quantitative Data S-ID Summarize, represent, and interpret data on a single count or measurement variable. S-ID.1 Represent data with plots on the real number line (dot plots, histograms, and box plots).
Thinking with Mathematical Models: 4.4: Measuring Variability: Standard Deviation; 4: Variability and Associations in Data (ACE 10, 15, 23); 5: Variability and Associations in Categorical Data (ACE 32-33)
S-ID.2 Use statistics appropriate to the shape of the data distribution to compare center (median, mean) and spread (interquartile range, standard deviation) of two or more different data sets.
Thinking with Mathematical Models: 4.4: Measuring Variability: Standard Deviation; 4: Variability and Associations in Data (ACE 15-20, 23-24); 5: Variability and Associations in Categorical Data (ACE 26-29, 33)
S-ID.3 Interpret differences in shape, center, and spread in the context of the data sets, accounting for possible effects of extreme data points (outliers).
Thinking with Mathematical Models: 4.4: Measuring Variability: Standard Deviation; 4: Variability and Associations in Data (ACE 15-20, 23-24); 5: Variability and Associations in Categorical Data (ACE 26-29, 33)
Summarize, represent, and interpret data on two categorical and quantitative variables. S-ID.5 Summarize categorical data for two categories in two-way frequency tables. Interpret relative frequencies in the context of the data (including joint, marginal, and conditional relative frequencies). Recognize possible associations and trends in the data.
Thinking with Mathematical Models: 5.1: Wood or Steel? That's the Question: Relationships in Categorical Data; 5.2: Politics of Girls and Boys: Analyzing Data in Two-Way Tables; 5.3: After-School Jobs and Homework: Working Backward: Setting Up a Two-Way Table
S-ID.6 Represent data on two quantitative variables on a scatter plot, and describe how the variables are related.
Thinking with Mathematical Models: 4.1: Vitruvian Man: Relating Body Measurements; 4.2: Older and Faster: Negative Correlation; 4.3: Correlation Coefficients and Outliers
a. Fit a function to the data; use functions fitted to data to solve problems in the context of the data. Use given functions or choose a function suggested by the context. Emphasize linear and exponential models.
Thinking with Mathematical Models: 4.1: Vitruvian Man: Relating Body Measurements; 4.2: Older and Faster: Negative Correlation; 4.3: Correlation Coefficients and Outliers
b. Informally assess the fit of a function by plotting and analyzing residuals.
Thinking with Mathematical Models: 4.1: Vitruvian Man: Relating Body Measurements
A Correlation of Connected Mathematics Project 3, Grade 8, Algebra 1, ©2014 to the North Carolina Common Core Math One Standards for Assessment
21
Common Core Math One Standards for Assessment
Connected Mathematics Project 3 Grade 8, Algebra 1
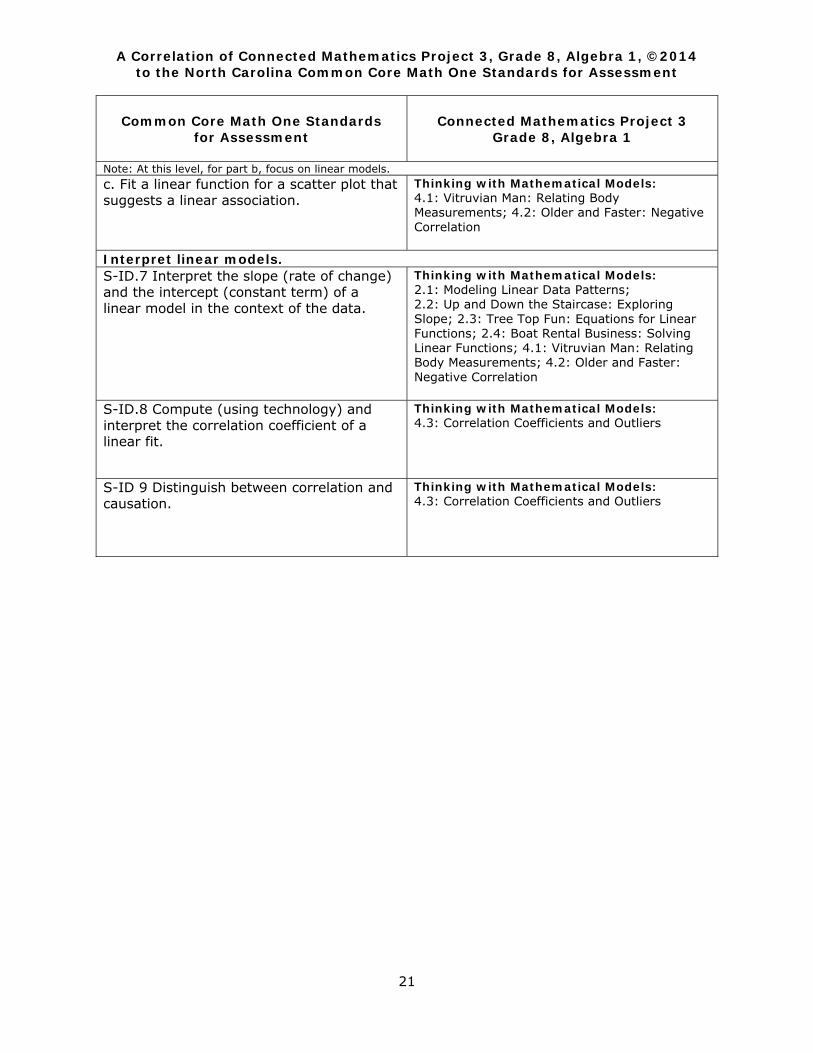
Note: At this level, for part b, focus on linear models. c. Fit a linear function for a scatter plot that suggests a linear association.
Thinking with Mathematical Models: 4.1: Vitruvian Man: Relating Body Measurements; 4.2: Older and Faster: Negative Correlation
Interpret linear models. S-ID.7 Interpret the slope (rate of change) and the intercept (constant term) of a linear model in the context of the data.
Thinking with Mathematical Models: 2.1: Modeling Linear Data Patterns; 2.2: Up and Down the Staircase: Exploring Slope; 2.3: Tree Top Fun: Equations for Linear Functions; 2.4: Boat Rental Business: Solving Linear Functions; 4.1: Vitruvian Man: Relating Body Measurements; 4.2: Older and Faster: Negative Correlation
S-ID.8 Compute (using technology) and interpret the correlation coefficient of a linear fit.
Thinking with Mathematical Models: 4.3: Correlation Coefficients and Outliers
S-ID 9 Distinguish between correlation and causation.
Thinking with Mathematical Models: 4.3: Correlation Coefficients and Outliers