North American Banking & Capital Markets - ey.com · downplay concerns and cautioned against...
20
North American Banking & Capital Markets Key themes from the Q3 2015 earnings calls October 2015
Transcript of North American Banking & Capital Markets - ey.com · downplay concerns and cautioned against...
North American Banking & Capital Markets
Key themes from the Q3 2015 earnings calls
October 2015

North American Banking & Capital Markets 2
Contents
Top 10 key themes: 3Q15 earnings season 3
Key themes overview 5
Theme 1. Earnings performance — difficult environment drove disappointing results 5
Theme 2. Macro-environment — backdrop framed by global market instability and unchanged US interest rates 7
Theme 3. Expense trends — meaningful efficiency ratio improvements will not be possible without revenue growth 8
Theme 4. Capital — macro challenges did not impact capital ratios 10
Theme 5. Regulatory and compliance — Fed’s G-SIB surcharge prompted some banks to focus on balance sheet size 11
Theme 6. Credit quality trends — oil and gas portfolios remained subject to careful monitoring 12
Theme 7. Cross-border activities — foreign currency translation impacted revenues of US-based global banks 13
Theme 8. Innovation — digital investments expected to drive efficiency 14
Theme 9. Lending trends — loans grew, but their profitability did not 15
Theme 10. Acquisitions and divestments — portfolio acquisitions 16
Appendix 17
Summary of key banking sector themes 17
Select key performance indicators (KPIs) 18
Scope, limitations and methodology of the review 19
North American Banking & Capital Markets 3
nm
Top 10 key themes: 3Q15 earnings season
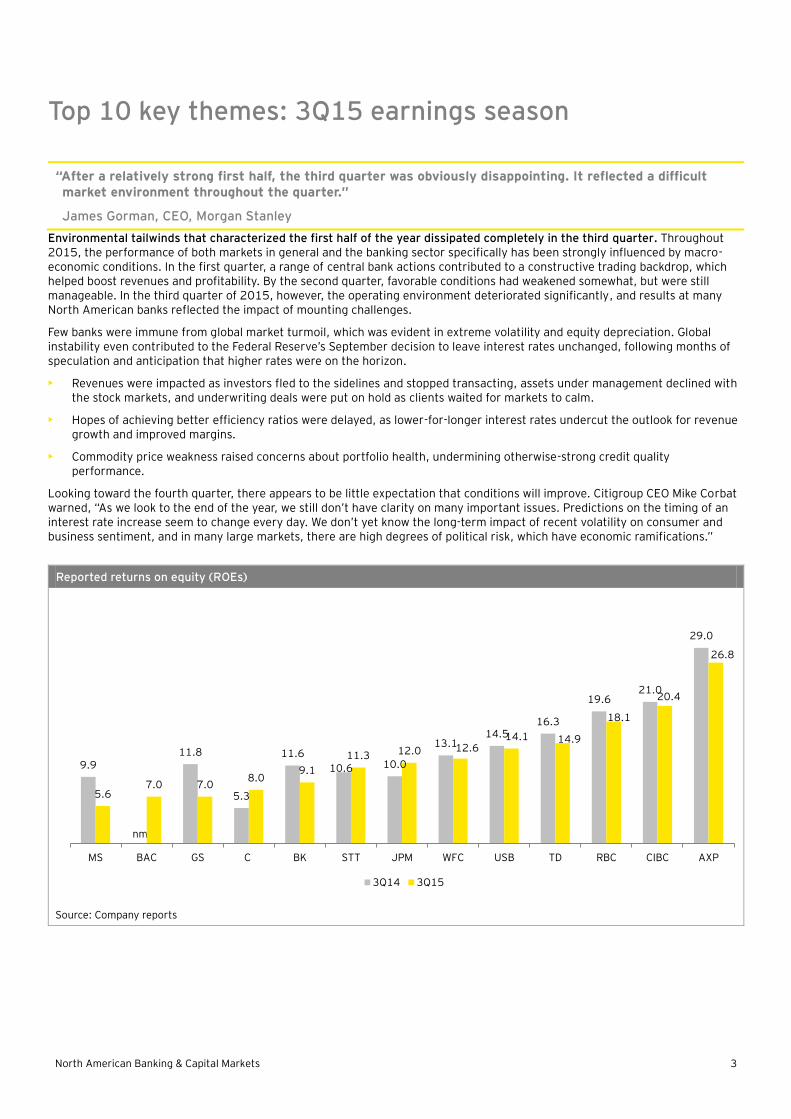
Environmental tailwinds that characterized the first half of the year dissipated completely in the third quarter. Throughout 2015, the performance of both markets in general and the banking sector specifically has been strongly influenced by macro-economic conditions. In the first quarter, a range of central bank actions contributed to a constructive trading backdrop, which helped boost revenues and profitability. By the second quarter, favorable conditions had weakened somewhat, but were still manageable. In the third quarter of 2015, however, the operating environment deteriorated significantly, and results at many North American banks reflected the impact of mounting challenges.
Few banks were immune from global market turmoil, which was evident in extreme volatility and equity depreciation. Global instability even contributed to the Federal Reserve’s September decision to leave interest rates unchanged, following months of speculation and anticipation that higher rates were on the horizon.
• Revenues were impacted as investors fled to the sidelines and stopped transacting, assets under management declined with the stock markets, and underwriting deals were put on hold as clients waited for markets to calm.
• Hopes of achieving better efficiency ratios were delayed, as lower-for-longer interest rates undercut the outlook for revenue growth and improved margins.
• Commodity price weakness raised concerns about portfolio health, undermining otherwise-strong credit quality performance.
Looking toward the fourth quarter, there appears to be little expectation that conditions will improve. Citigroup CEO Mike Corbat warned, “As we look to the end of the year, we still don’t have clarity on many important issues. Predictions on the timing of an interest rate increase seem to change every day. We don’t yet know the long-term impact of recent volatility on consumer and business sentiment, and in many large markets, there are high degrees of political risk, which have economic ramifications.”
“After a relatively strong first half, the third quarter was obviously disappointing. It reflected a difficult market environment throughout the quarter.”
James Gorman, CEO, Morgan Stanley
Reported returns on equity (ROEs)
Source: Company reports
9.911.8
5.3
11.6
10.6 10.0
13.114.5
16.3
19.621.0
29.0
5.67.0 7.0
8.09.1
11.3 12.0 12.614.1 14.9
18.1
20.4
26.8
MS BAC GS C BK STT JPM WFC USB TD RBC CIBC AXP
3Q14 3Q15
North American Banking & Capital Markets 4
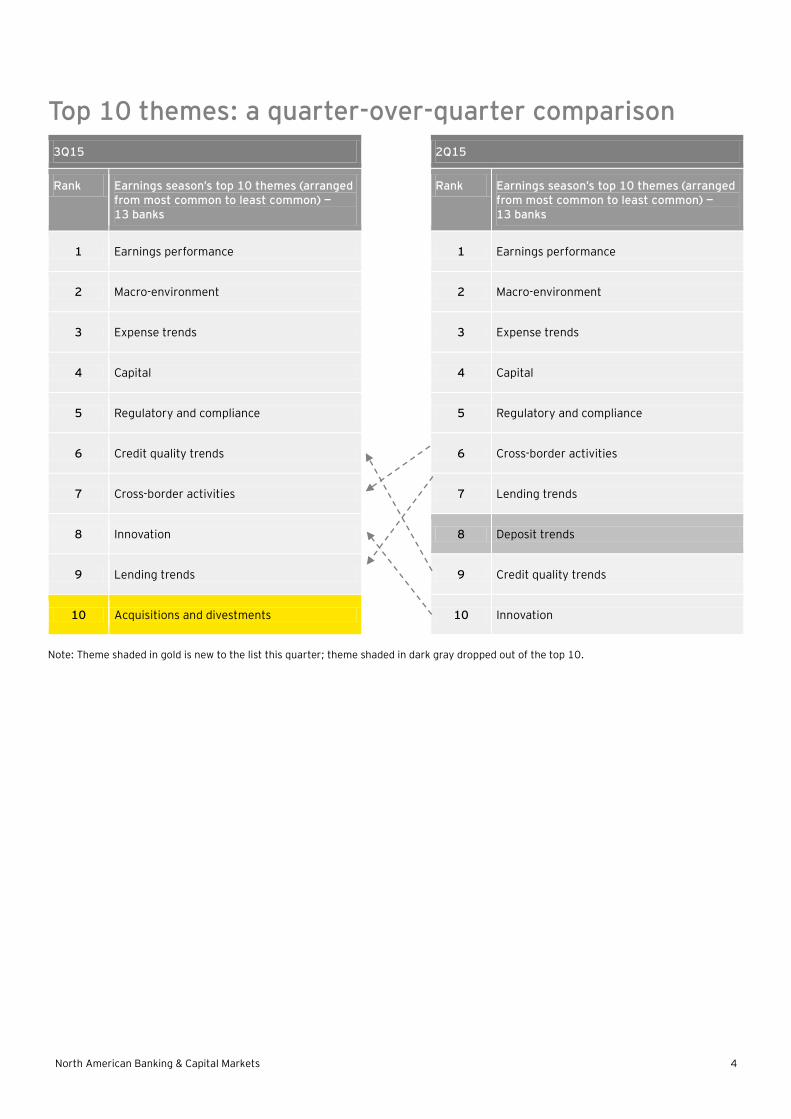
Top 10 themes: a quarter-over-quarter comparison
3Q15 2Q15
Rank Earnings season’s top 10 themes (arranged from most common to least common) — 13 banks
Rank Earnings season’s top 10 themes (arranged from most common to least common) — 13 banks
1 Earnings performance 1 Earnings performance
2 Macro-environment 2 Macro-environment
3 Expense trends 3 Expense trends
4 Capital 4 Capital
5 Regulatory and compliance 5 Regulatory and compliance
6 Credit quality trends
6 Cross-border activities
7 Cross-border activities
7 Lending trends
8 Innovation
8 Deposit trends
9 Lending trends 9 Credit quality trends
10 Acquisitions and divestments 10 Innovation
Note: Theme shaded in gold is new to the list this quarter; theme shaded in dark gray dropped out of the top 10.
North American Banking & Capital Markets 5
Key themes overview
Theme 1. Earnings performance — difficult environment drove disappointing results
“3Q 2015 results primarily reflect the challenges from the decline in global equity markets and persistently low market interest rates, as well as the seasonal decline in securities finance in comparison to the second quarter.”
Mike Bell, CFO, State Street
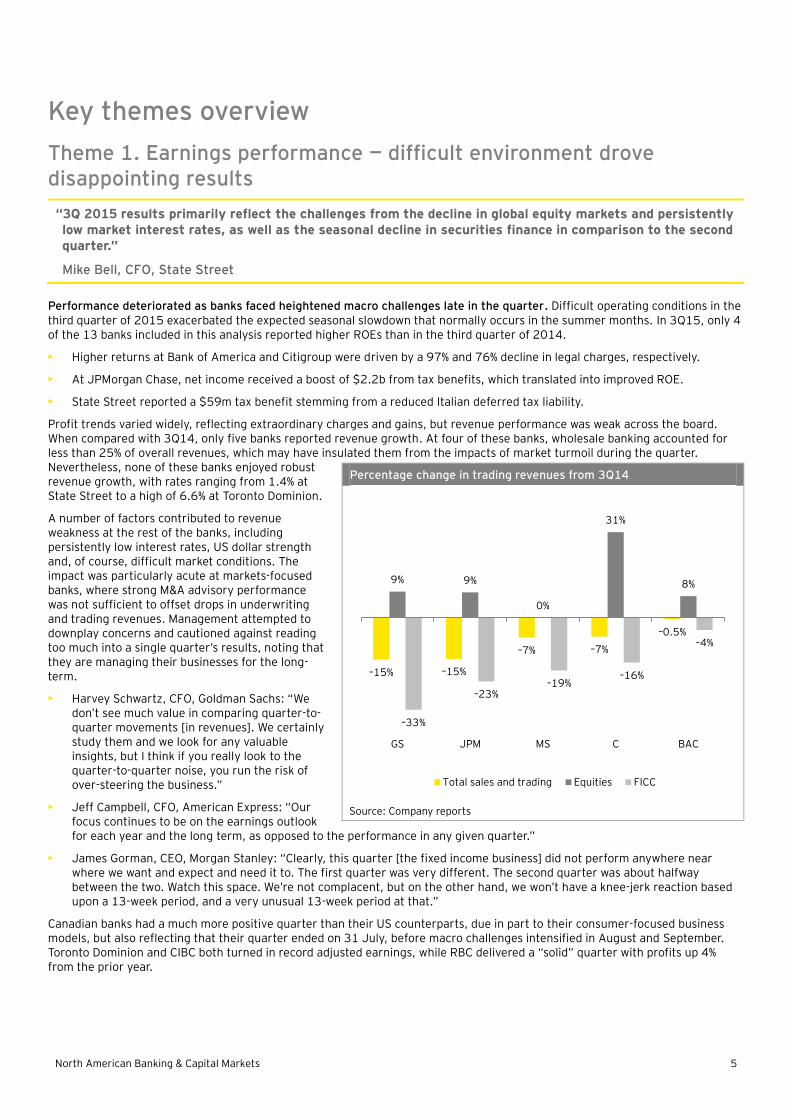
Performance deteriorated as banks faced heightened macro challenges late in the quarter. Difficult operating conditions in the third quarter of 2015 exacerbated the expected seasonal slowdown that normally occurs in the summer months. In 3Q15, only 4 of the 13 banks included in this analysis reported higher ROEs than in the third quarter of 2014.
• Higher returns at Bank of America and Citigroup were driven by a 97% and 76% decline in legal charges, respectively.
• At JPMorgan Chase, net income received a boost of $2.2b from tax benefits, which translated into improved ROE.
• State Street reported a $59m tax benefit stemming from a reduced Italian deferred tax liability.
Profit trends varied widely, reflecting extraordinary charges and gains, but revenue performance was weak across the board. When compared with 3Q14, only five banks reported revenue growth. At four of these banks, wholesale banking accounted for less than 25% of overall revenues, which may have insulated them from the impacts of market turmoil during the quarter. Nevertheless, none of these banks enjoyed robust revenue growth, with rates ranging from 1.4% at State Street to a high of 6.6% at Toronto Dominion.
A number of factors contributed to revenue weakness at the rest of the banks, including persistently low interest rates, US dollar strength and, of course, difficult market conditions. The impact was particularly acute at markets-focused banks, where strong M&A advisory performance was not sufficient to offset drops in underwriting and trading revenues. Management attempted to downplay concerns and cautioned against reading too much into a single quarter’s results, noting that they are managing their businesses for the long-term.
• Harvey Schwartz, CFO, Goldman Sachs: “We don’t see much value in comparing quarter-to-quarter movements [in revenues]. We certainly study them and we look for any valuable insights, but I think if you really look to the quarter-to-quarter noise, you run the risk of over-steering the business.”
• Jeff Campbell, CFO, American Express: “Our focus continues to be on the earnings outlook for each year and the long term, as opposed to the performance in any given quarter.”
• James Gorman, CEO, Morgan Stanley: “Clearly, this quarter [the fixed income business] did not perform anywhere near where we want and expect and need it to. The first quarter was very different. The second quarter was about halfway between the two. Watch this space. We’re not complacent, but on the other hand, we won’t have a knee-jerk reaction based upon a 13-week period, and a very unusual 13-week period at that.”
Canadian banks had a much more positive quarter than their US counterparts, due in part to their consumer-focused business models, but also reflecting that their quarter ended on 31 July, before macro challenges intensified in August and September. Toronto Dominion and CIBC both turned in record adjusted earnings, while RBC delivered a “solid” quarter with profits up 4% from the prior year.
Percentage change in trading revenues from 3Q14
Source: Company reports
–15% –15%
–7% –7%
–0.5%
9% 9%
0%
31%
8%
–33%
–23%–19%
–16%
–4%
GS JPM MS C BAC
Total sales and trading Equities FICC
North American Banking & Capital Markets 6
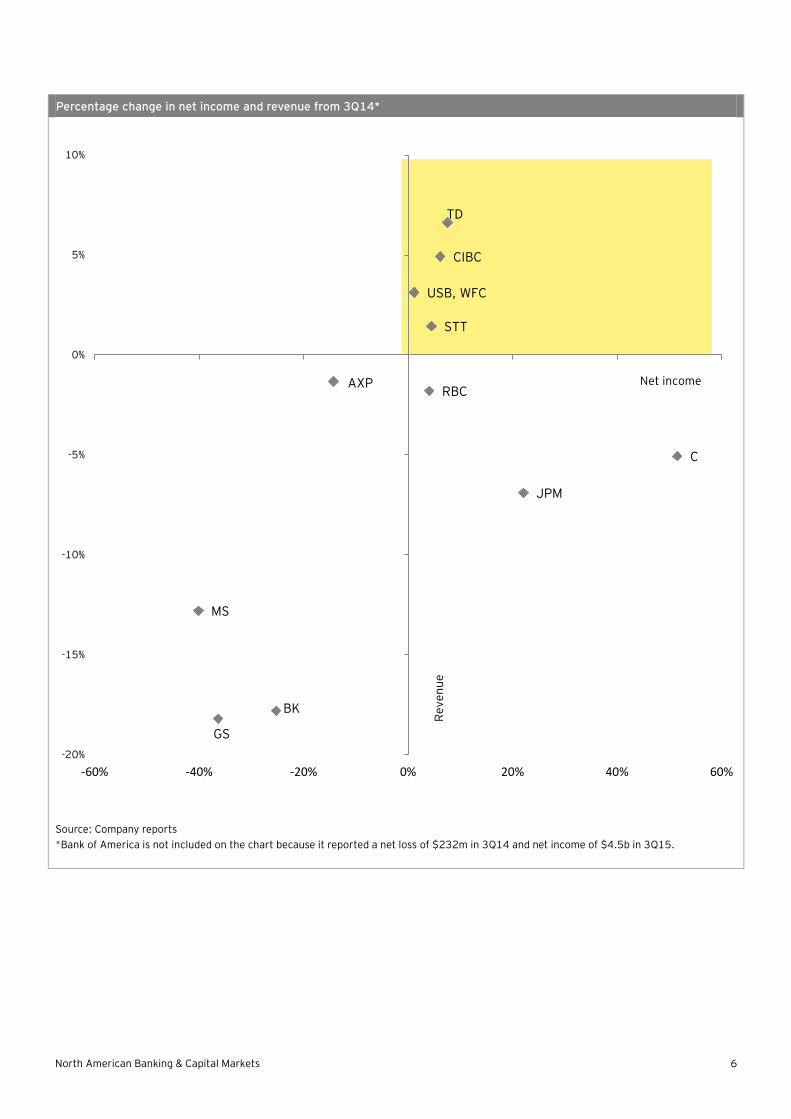
Percentage change in net income and revenue from 3Q14*
Source: Company reports
*Bank of America is not included on the chart because it reported a net loss of $232m in 3Q14 and net income of $4.5b in 3Q15.
CIBC
RBC
TD
JPM
USB, WFC
C
GS
STT
BK
MS
AXP
-20%
-15%
-10%
-5%
0%
5%
10%
-60% -40% -20% 0% 20% 40% 60%
Re
ve
nu
e
Net income
North American Banking & Capital Markets 7
Theme 2. Macro-environment — backdrop framed by global market instability and unchanged US interest rates
“We are living in uncertain times, with increased volatility and financial market turmoil having broader and longer implications.”
Bharat Masrani, CEO, Toronto Dominion
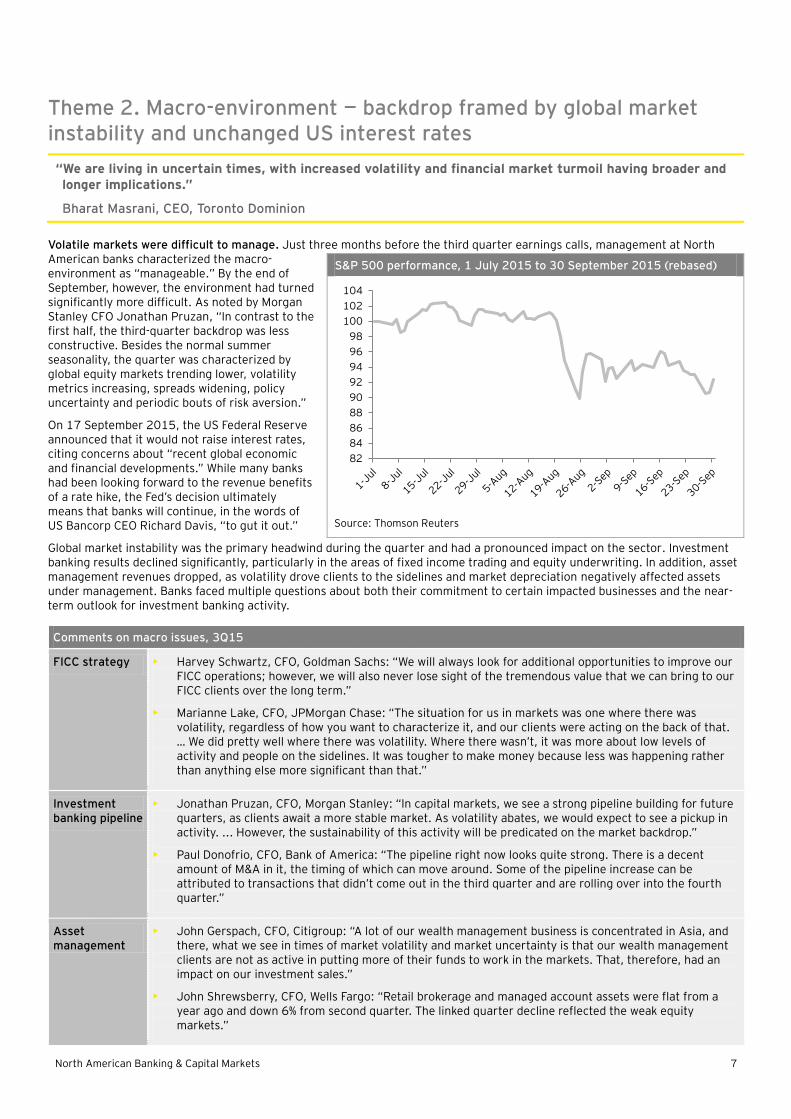
Volatile markets were difficult to manage. Just three months before the third quarter earnings calls, management at North American banks characterized the macro-environment as “manageable.” By the end of September, however, the environment had turned significantly more difficult. As noted by Morgan Stanley CFO Jonathan Pruzan, “In contrast to the first half, the third-quarter backdrop was less constructive. Besides the normal summer seasonality, the quarter was characterized by global equity markets trending lower, volatility metrics increasing, spreads widening, policy uncertainty and periodic bouts of risk aversion.”
On 17 September 2015, the US Federal Reserve announced that it would not raise interest rates, citing concerns about “recent global economic and financial developments.” While many banks had been looking forward to the revenue benefits of a rate hike, the Fed’s decision ultimately means that banks will continue, in the words of US Bancorp CEO Richard Davis, “to gut it out.”
Global market instability was the primary headwind during the quarter and had a pronounced impact on the sector. Investment banking results declined significantly, particularly in the areas of fixed income trading and equity underwriting. In addition, asset management revenues dropped, as volatility drove clients to the sidelines and market depreciation negatively affected assets under management. Banks faced multiple questions about both their commitment to certain impacted businesses and the near-term outlook for investment banking activity.
S&P 500 performance, 1 July 2015 to 30 September 2015 (rebased)
Source: Thomson Reuters
Comments on macro issues, 3Q15
FICC strategy • Harvey Schwartz, CFO, Goldman Sachs: “We will always look for additional opportunities to improve our FICC operations; however, we will also never lose sight of the tremendous value that we can bring to our FICC clients over the long term.”
• Marianne Lake, CFO, JPMorgan Chase: “The situation for us in markets was one where there was volatility, regardless of how you want to characterize it, and our clients were acting on the back of that. … We did pretty well where there was volatility. Where there wasn’t, it was more about low levels of activity and people on the sidelines. It was tougher to make money because less was happening rather than anything else more significant than that.”
Investment banking pipeline
• Jonathan Pruzan, CFO, Morgan Stanley: “In capital markets, we see a strong pipeline building for future quarters, as clients await a more stable market. As volatility abates, we would expect to see a pickup in activity. ... However, the sustainability of this activity will be predicated on the market backdrop.”
• Paul Donofrio, CFO, Bank of America: “The pipeline right now looks quite strong. There is a decent amount of M&A in it, the timing of which can move around. Some of the pipeline increase can be attributed to transactions that didn’t come out in the third quarter and are rolling over into the fourth quarter.”
Asset management
• John Gerspach, CFO, Citigroup: “A lot of our wealth management business is concentrated in Asia, and there, what we see in times of market volatility and market uncertainty is that our wealth management clients are not as active in putting more of their funds to work in the markets. That, therefore, had an impact on our investment sales.”
• John Shrewsberry, CFO, Wells Fargo: “Retail brokerage and managed account assets were flat from a year ago and down 6% from second quarter. The linked quarter decline reflected the weak equity markets.”
82
84
86
88
90
92
94
96
98
100
102
104
North American Banking & Capital Markets 8
Theme 3. Expense trends — meaningful efficiency ratio improvements will not be possible without revenue growth
“In some of the businesses, where we’ve seen some of the revenue challenges, for instance, in some of the international consumer businesses, we’ve already begun to look at the core expenses there and have begun to adjust the trajectory.”
John Gerspach, CFO, Citigroup
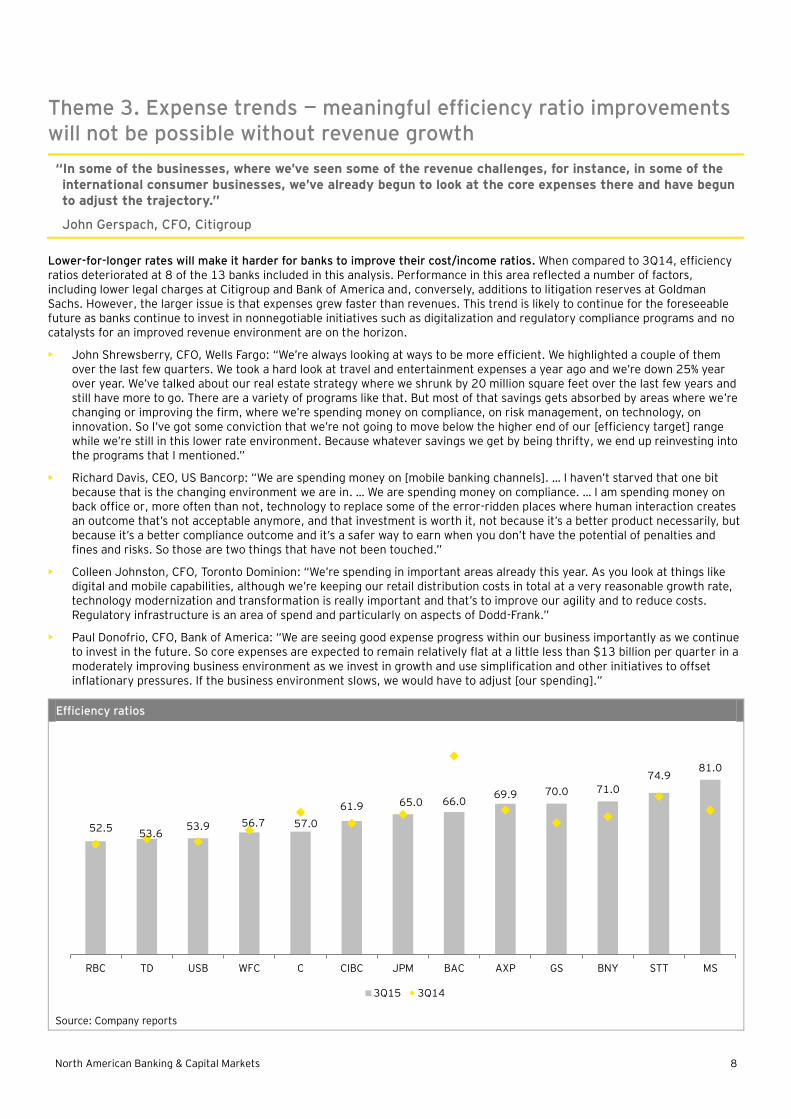
Lower-for-longer rates will make it harder for banks to improve their cost/income ratios. When compared to 3Q14, efficiency ratios deteriorated at 8 of the 13 banks included in this analysis. Performance in this area reflected a number of factors, including lower legal charges at Citigroup and Bank of America and, conversely, additions to litigation reserves at Goldman Sachs. However, the larger issue is that expenses grew faster than revenues. This trend is likely to continue for the foreseeable future as banks continue to invest in nonnegotiable initiatives such as digitalization and regulatory compliance programs and no catalysts for an improved revenue environment are on the horizon.
• John Shrewsberry, CFO, Wells Fargo: “We’re always looking at ways to be more efficient. We highlighted a couple of them over the last few quarters. We took a hard look at travel and entertainment expenses a year ago and we’re down 25% year over year. We’ve talked about our real estate strategy where we shrunk by 20 million square feet over the last few years and still have more to go. There are a variety of programs like that. But most of that savings gets absorbed by areas where we’re changing or improving the firm, where we’re spending money on compliance, on risk management, on technology, on innovation. So I’ve got some conviction that we’re not going to move below the higher end of our [efficiency target] range while we’re still in this lower rate environment. Because whatever savings we get by being thrifty, we end up reinvesting into the programs that I mentioned.”
• Richard Davis, CEO, US Bancorp: “We are spending money on [mobile banking channels]. … I haven’t starved that one bit because that is the changing environment we are in. … We are spending money on compliance. … I am spending money on back office or, more often than not, technology to replace some of the error-ridden places where human interaction creates an outcome that’s not acceptable anymore, and that investment is worth it, not because it’s a better product necessarily, but because it’s a better compliance outcome and it’s a safer way to earn when you don’t have the potential of penalties and fines and risks. So those are two things that have not been touched.”
• Colleen Johnston, CFO, Toronto Dominion: “We’re spending in important areas already this year. As you look at things like digital and mobile capabilities, although we’re keeping our retail distribution costs in total at a very reasonable growth rate, technology modernization and transformation is really important and that’s to improve our agility and to reduce costs. Regulatory infrastructure is an area of spend and particularly on aspects of Dodd-Frank.”
• Paul Donofrio, CFO, Bank of America: “We are seeing good expense progress within our business importantly as we continue to invest in the future. So core expenses are expected to remain relatively flat at a little less than $13 billion per quarter in a moderately improving business environment as we invest in growth and use simplification and other initiatives to offset inflationary pressures. If the business environment slows, we would have to adjust [our spending].”
Efficiency ratios
Source: Company reports
52.553.6
53.9 56.7 57.0
61.9 65.0 66.069.9 70.0 71.0
74.981.0
RBC TD USB WFC C CIBC JPM BAC AXP GS BNY STT MS
3Q15 3Q14
North American Banking & Capital Markets 9
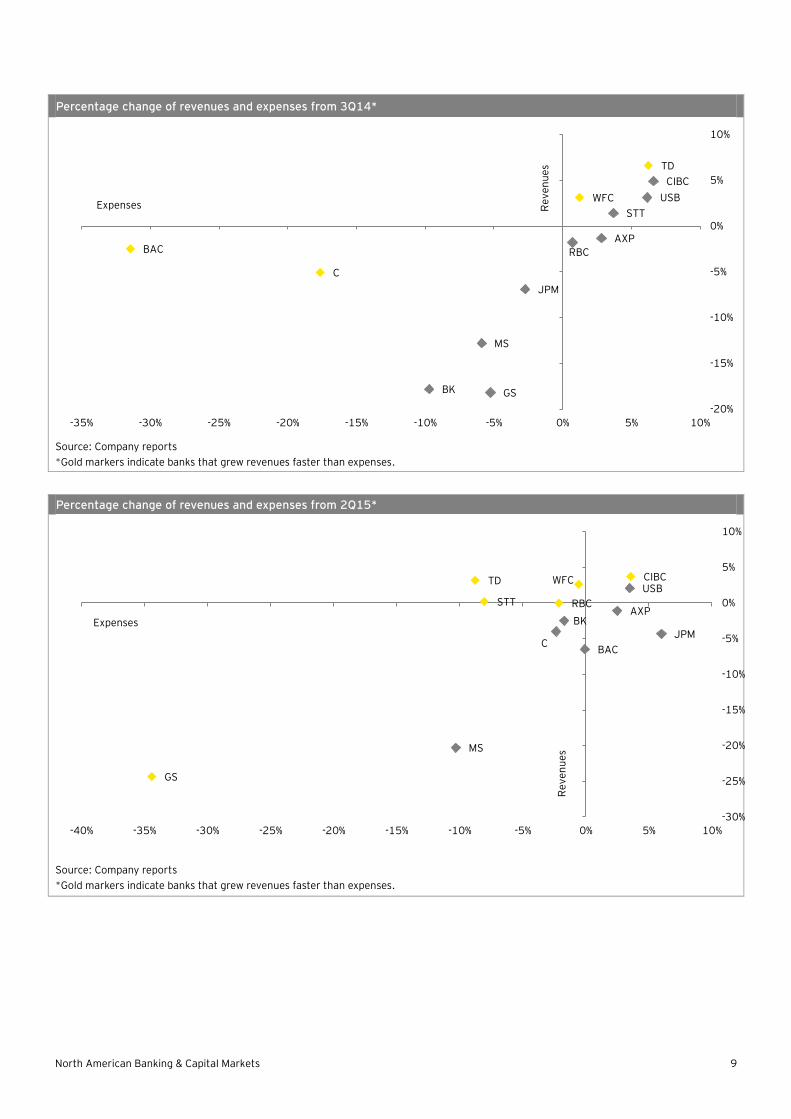
Percentage change of revenues and expenses from 3Q14*
Source: Company reports
*Gold markers indicate banks that grew revenues faster than expenses.
Percentage change of revenues and expenses from 2Q15*
Source: Company reports
*Gold markers indicate banks that grew revenues faster than expenses.
BAC
C
BK
MS
GS
JPM
RBC
WFC
AXP
STT
USB
TD
CIBC
-20%
-15%
-10%
-5%
0%
5%
10%
-35% -30% -25% -20% -15% -10% -5% 0% 5% 10%
Expenses Re
ve
nu
es
GS
MS
TD
STT
C
RBC
BK
WFC
BAC
AXP
USBCIBC
JPM
-30%
-25%
-20%
-15%
-10%
-5%
0%
5%
10%
-40% -35% -30% -25% -20% -15% -10% -5% 0% 5% 10%
Expenses
Re
ve
nu
es

North American Banking & Capital Markets 10
Theme 4. Capital — macro challenges did not impact capital ratios
“We continue to make progress against our capital targets.”
Marianne Lake, CFO, JPMorgan Chase
Capital strength remained intact. While the turbulent macro-environment took a toll on profitability in 3Q15, it did not impact banks’ capital strength or their appetite to return capital to shareholders through buybacks and dividends. Only three of the banks included in this analysis — American Express, Bank of New York Mellon and Morgan Stanley — reported lower Common Equity Tier 1 (CET1) capital ratios in 3Q15 when compared to the prior quarter. Notably, each still maintained ratios in excess of regulatory requirements.
• BNY Mellon attributed the slight decline to an increase in operational and credit risk-weighted assets (RWAs).
• American Express CFO Jeff Campbell did not comment on the 30-basis-point dip and instead observed, “Our performance again demonstrates our confidence in the company’s ability to generate capital while maintaining its financial strength. It also demonstrates our ongoing commitment to using that capital strength to create value for our shareholders.”
• At Morgan Stanley, a 10-basis-point decline in the advanced transitional CET1 ratio was not addressed at all.
Banks in the US and Canada continued to call attention to their ability to generate sufficient excess capital to pay dividends, execute share buyback programs and, in the case of Royal Bank of Canada, use it for strategic acquisitions.
• Victor Dodig, CEO, Canadian Imperial Bank of Commerce: “[We are announcing] our fourth consecutive dividend increase, raising our quarterly dividend by CA$0.03 to CA$1.12 per share. And this is consistent with our plan to move towards the upper end of our 40% to 50% target payout range. With this increase, our dividends paid will have grown by 12% over the past year.”
• Janice Fukakusa, CFO, Royal Bank of Canada: “Our CET1 ratio has increased 60 basis points from last year, as we’ve continued to build capital in anticipation of closing the announced acquisition of City National in our first fiscal quarter of 2016.”
• Mike Corbat, CEO, Citigroup: “In total, we generated $14 billion of regulatory capital so far this year and have been able to return over $4 billion of that capital to our shareholders in the form of share buybacks and common dividends.”
• Brian Moynihan, CEO, Bank of America: “Our capital is again at record levels and we returned over $3 billion to shareholders so far this year through common share repurchases and dividends.”
• John Stumpf, CEO, Wells Fargo: “Our financial performance resulted in strong capital generation, and returning capital to our shareholders remains a priority. Our dividend payout ratio is 35%, and we repurchased 52 million shares of common stock in the third quarter.”
Common Equity Tier 1 (CET1) ratios*
Source: Company reports
* All-in basis for Canadian banks; standardized transitional for American Express, Bank of America, Goldman Sachs, JPMorgan Chase and State Street; advanced transitional for BNY Mellon, Morgan Stanley and US Bancorp; advanced fully phased for Citigroup and Wells Fargo
10.0 9.9
10.910.6 10.8 11.3 11.2 11.4 11.6
11.812.9
13.514.0
10.1 10.1 10.510.7 10.8
11.5 11.6 11.6 12.0 12.413.0 13.2 13.9
RBC TD BK WFC CIBC JPM BAC C STT GS USB AXP MS
2Q15 3Q15
North American Banking & Capital Markets 11
Theme 5. Regulatory and compliance — Fed’s G-SIB surcharge prompted some banks to focus on balance sheet size
“Any opportunity that we think we can reduce our systemic footprint, now that the rule is finalized, obviously, we would look to do that. I think that is just good practice. I think the trade-off is whether or not making those reductions impacts your ability to deliver to clients.”
Harvey Schwartz, CFO, Goldman Sachs
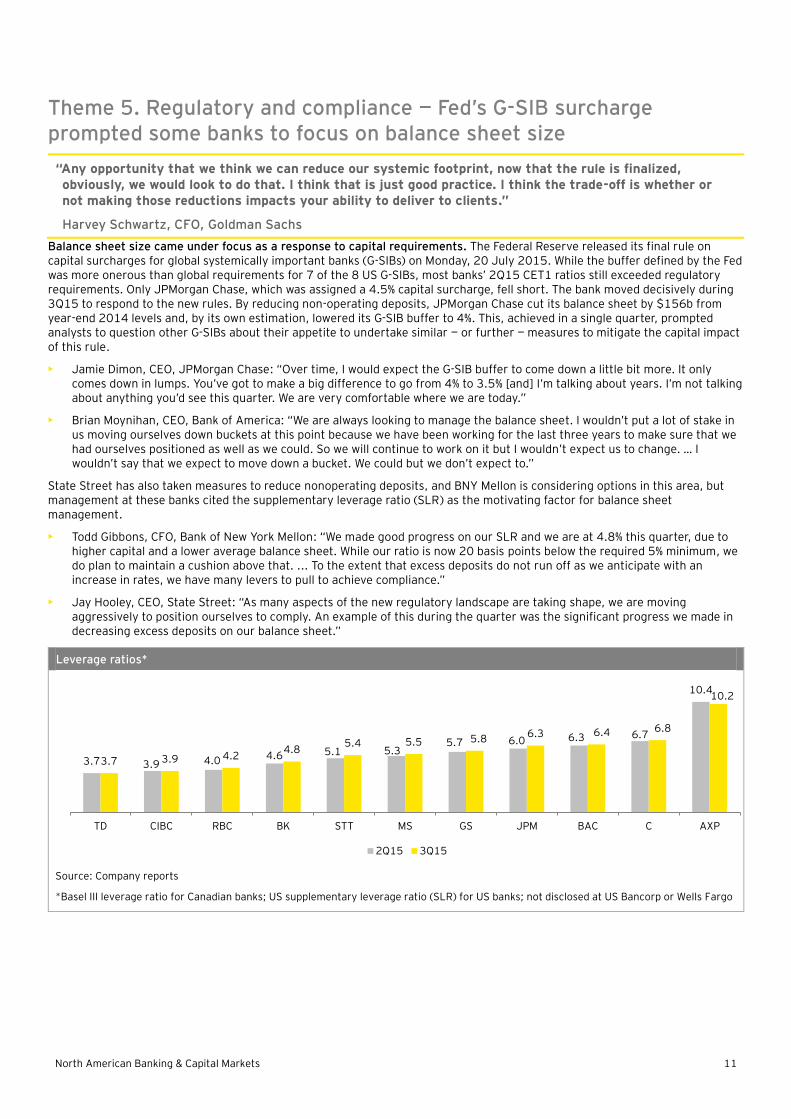
Balance sheet size came under focus as a response to capital requirements. The Federal Reserve released its final rule on capital surcharges for global systemically important banks (G-SIBs) on Monday, 20 July 2015. While the buffer defined by the Fed was more onerous than global requirements for 7 of the 8 US G-SIBs, most banks’ 2Q15 CET1 ratios still exceeded regulatory requirements. Only JPMorgan Chase, which was assigned a 4.5% capital surcharge, fell short. The bank moved decisively during 3Q15 to respond to the new rules. By reducing non-operating deposits, JPMorgan Chase cut its balance sheet by $156b from year-end 2014 levels and, by its own estimation, lowered its G-SIB buffer to 4%. This, achieved in a single quarter, prompted analysts to question other G-SIBs about their appetite to undertake similar — or further — measures to mitigate the capital impact of this rule.
• Jamie Dimon, CEO, JPMorgan Chase: “Over time, I would expect the G-SIB buffer to come down a little bit more. It only comes down in lumps. You’ve got to make a big difference to go from 4% to 3.5% [and] I’m talking about years. I’m not talking about anything you’d see this quarter. We are very comfortable where we are today.”
• Brian Moynihan, CEO, Bank of America: “We are always looking to manage the balance sheet. I wouldn’t put a lot of stake in us moving ourselves down buckets at this point because we have been working for the last three years to make sure that we had ourselves positioned as well as we could. So we will continue to work on it but I wouldn’t expect us to change. … I wouldn’t say that we expect to move down a bucket. We could but we don’t expect to.”
State Street has also taken measures to reduce nonoperating deposits, and BNY Mellon is considering options in this area, but management at these banks cited the supplementary leverage ratio (SLR) as the motivating factor for balance sheet management.
• Todd Gibbons, CFO, Bank of New York Mellon: “We made good progress on our SLR and we are at 4.8% this quarter, due to higher capital and a lower average balance sheet. While our ratio is now 20 basis points below the required 5% minimum, we do plan to maintain a cushion above that. ... To the extent that excess deposits do not run off as we anticipate with an increase in rates, we have many levers to pull to achieve compliance.”
• Jay Hooley, CEO, State Street: “As many aspects of the new regulatory landscape are taking shape, we are moving aggressively to position ourselves to comply. An example of this during the quarter was the significant progress we made in decreasing excess deposits on our balance sheet.”
Leverage ratios*
Source: Company reports
*Basel III leverage ratio for Canadian banks; US supplementary leverage ratio (SLR) for US banks; not disclosed at US Bancorp or Wells Fargo
3.7 3.9 4.0 4.6 5.1 5.35.7 6.0 6.3 6.7
10.4
3.7 3.9 4.24.8
5.4 5.5 5.8 6.3 6.4 6.8
10.2
TD CIBC RBC BK STT MS GS JPM BAC C AXP
2Q15 3Q15
North American Banking & Capital Markets 12
Theme 6. Credit quality trends — oil and gas portfolios remained subject to careful monitoring
“We believe the energy services sector will incur greater challenges in the near term as it adjusts to lower commodity prices, and this view is reflected in our reserving process.”
John Shrewsberry, CFO, Wells Fargo
Banks kept close watch on their energy portfolios. Comments on credit trends during the 3Q15 earnings season closely mirrored those made in the prior quarter. Management at Bank of America, Toronto Dominion, US Bancorp and Wells Fargo all described overall credit performance as “strong” and American Express CFO Jeff Campbell noted that write-offs were — once again — at historically low levels. Also in line with the second quarter, management described efforts to monitor energy lending portfolios for deterioration. Measures discussed included stress testing, redetermination processes and provisioning. While most downplayed the size of their exposure, they also acknowledged that the extended outlook for lower commodity prices poses sufficient risk to justify enhanced monitoring of these portfolios.
Oil and gas-related credit disclosures, 3Q15
John Gerspach, CFO, Citigroup
• “We have been building reserves [on energy-related loans] because it certainly is prudent in this environment. We took $140 million of reserves this quarter. That’s roughly equal to what we took during the first half of the year. We took about $100 million in the first quarter, $40 million in the second. So this is something that we’re looking at every day, and we’re adjusting the provisions accordingly.”
John Shrewsberry, CFO, Wells Fargo
• “We’ve started the fall re-determinations, and reserve-based energy loans are performing as expected. We believe the energy services sector will incur greater challenges in the near term as it adjusts to lower commodity prices, and this view is reflected in our reserving process.”
Brian Moynihan, CEO, Bank of America
• “Our criticized assets were up modestly if you sort of dive into the oil and gas segment. And last quarter we increased criticized assets about $1 billion because of oil and gas. This quarter we saw that increase decline significantly to about 40% of that level, which was then offset by improvements in the rest of the portfolio. So we saw a modest increase in criticized assets. We feel pretty good right now where we are with oil and gas.”
Marianne Lake, CFO, JPMorgan Chase
• “Reflected in our results is a net reserve release of $281 million pretax, which reflects a little less than $600 million of consumer reserve releases as favorable credit trends continue, offset by a build of a little over $300 million in wholesale, approximately $160 million of which is additional reserves associated with the oil and gas sector given expectations that energy prices will remain lower for longer.”
Laura Dottori-Attanasio, Chief Risk Officer, CIBC
• As it relates to our Wholesale and Business banking portfolios, we have CA$17.4 billion of direct exposure. … Our loans outstanding have decreased 2% quarter-over-quarter. Fifty-seven percent of our direct exposure is to exploration and production companies and only 5% is in the services space. Seventy-nine percent of this is in investment-grade exposure. This quarter, one oil and gas account of less than CA$10 million became impaired with no material losses expected from this account at this time. … The credit quality of both the wholesale and business banking oil and gas portfolio and the indirect retail portfolios affected by the price of oil remain relatively stable despite a few down grades. Continued low prices may lead to additional loan losses. That said, these losses would be expected to remain within our risk appetite tolerance. We continue to be vigilant and to proactively monitor these portfolios.
Mark Hughes, Chief Risk Officer, Royal Bank of Scotland
• Our drawn exposure to the oil and gas sector represents 1.6% of the total loan book, up marginally from last quarter mainly due to foreign exchange translation. … As the price of oil has continued to decline through the year, we’ve updated our stress scenarios. From a wholesale perspective, we stress test on a name-by-name basis. Our most recent scenario assumes a CA$35 oil price for the remainder of 2015 and uses the forward price curve for 2016, which currently averages CA$45. Based on this scenario, we’re now monitoring a handful of additional names compared to our prior scenarios. If the price of oil stays at current levels, we could see an uptick in wholesale provisions. However, we have seen a number of companies raise capital, delay capital spending, or cut dividends, which should help mitigate some of the impact.
North American Banking & Capital Markets 13
Theme 7. Cross-border activities — foreign currency translation impacted revenues of US-based global banks
“Like other US companies with a significant global footprint, our reported results are being significantly impacted by changes in foreign exchange rates. Over the past year, the dollar has strengthened significantly year over year against the currencies that we are most exposed to outside the US. The dollar strength will have an impact on our performance for the balance of the year and could impact 2016, as well.
Jeff Campbell, CFO, American Express
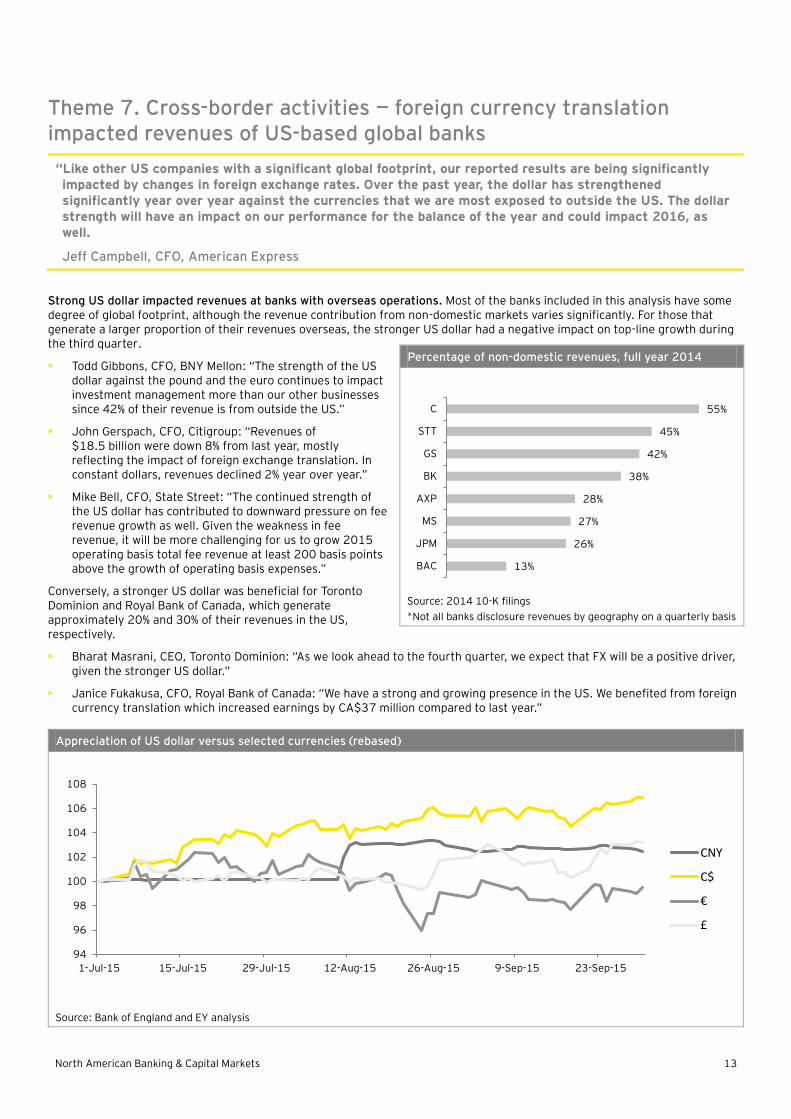
Strong US dollar impacted revenues at banks with overseas operations. Most of the banks included in this analysis have some degree of global footprint, although the revenue contribution from non-domestic markets varies significantly. For those that generate a larger proportion of their revenues overseas, the stronger US dollar had a negative impact on top-line growth during the third quarter.
• Todd Gibbons, CFO, BNY Mellon: “The strength of the US dollar against the pound and the euro continues to impact investment management more than our other businesses since 42% of their revenue is from outside the US.”
• John Gerspach, CFO, Citigroup: “Revenues of $18.5 billion were down 8% from last year, mostly reflecting the impact of foreign exchange translation. In constant dollars, revenues declined 2% year over year.”
• Mike Bell, CFO, State Street: “The continued strength of the US dollar has contributed to downward pressure on fee revenue growth as well. Given the weakness in fee revenue, it will be more challenging for us to grow 2015 operating basis total fee revenue at least 200 basis points above the growth of operating basis expenses.”
Conversely, a stronger US dollar was beneficial for Toronto Dominion and Royal Bank of Canada, which generate approximately 20% and 30% of their revenues in the US, respectively.
• Bharat Masrani, CEO, Toronto Dominion: “As we look ahead to the fourth quarter, we expect that FX will be a positive driver, given the stronger US dollar.”
• Janice Fukakusa, CFO, Royal Bank of Canada: “We have a strong and growing presence in the US. We benefited from foreign currency translation which increased earnings by CA$37 million compared to last year.”
Percentage of non-domestic revenues, full year 2014
Source: 2014 10-K filings
*Not all banks disclosure revenues by geography on a quarterly basis
Appreciation of US dollar versus selected currencies (rebased)
Source: Bank of England and EY analysis
13%
26%
27%
28%
38%
42%
45%
55%
BAC
JPM
MS
AXP
BK
GS
STT
C
94
96
98
100
102
104
106
108
1-Jul-15 15-Jul-15 29-Jul-15 12-Aug-15 26-Aug-15 9-Sep-15 23-Sep-15
CNY
C$
€
£
North American Banking & Capital Markets 14
Theme 8. Innovation — digital investments expected to drive efficiency
“Deposits via mobile devices now represent 14% of consumer deposit transactions. Mobile processing is better for us and it is better for our customers. It is one-tenth the cost relative to processing and financial centers and more convenient for customers.”
Paul Donofrio, CFO, Bank of America
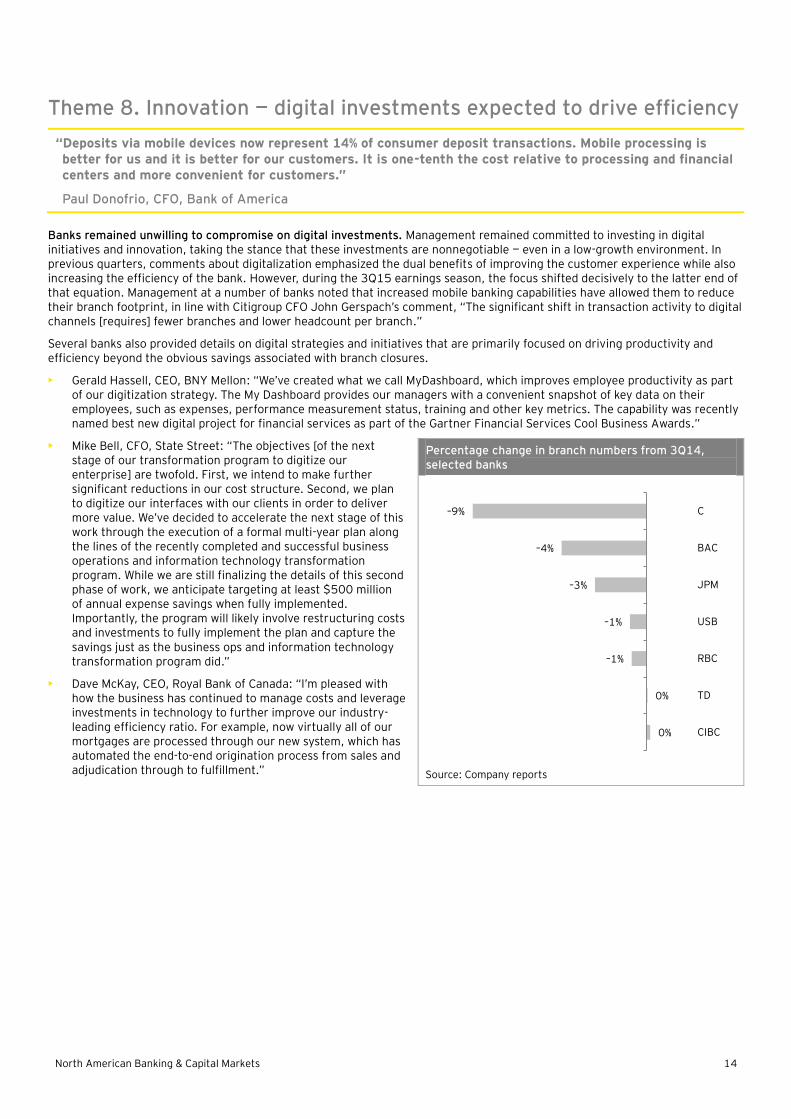
Banks remained unwilling to compromise on digital investments. Management remained committed to investing in digital initiatives and innovation, taking the stance that these investments are nonnegotiable — even in a low-growth environment. In previous quarters, comments about digitalization emphasized the dual benefits of improving the customer experience while also increasing the efficiency of the bank. However, during the 3Q15 earnings season, the focus shifted decisively to the latter end of that equation. Management at a number of banks noted that increased mobile banking capabilities have allowed them to reduce their branch footprint, in line with Citigroup CFO John Gerspach’s comment, “The significant shift in transaction activity to digital channels [requires] fewer branches and lower headcount per branch.”
Several banks also provided details on digital strategies and initiatives that are primarily focused on driving productivity and efficiency beyond the obvious savings associated with branch closures.
• Gerald Hassell, CEO, BNY Mellon: “We’ve created what we call MyDashboard, which improves employee productivity as part of our digitization strategy. The My Dashboard provides our managers with a convenient snapshot of key data on their employees, such as expenses, performance measurement status, training and other key metrics. The capability was recently named best new digital project for financial services as part of the Gartner Financial Services Cool Business Awards.”
• Mike Bell, CFO, State Street: “The objectives [of the next stage of our transformation program to digitize our enterprise] are twofold. First, we intend to make further significant reductions in our cost structure. Second, we plan to digitize our interfaces with our clients in order to deliver more value. We’ve decided to accelerate the next stage of this work through the execution of a formal multi-year plan along the lines of the recently completed and successful business operations and information technology transformation program. While we are still finalizing the details of this second phase of work, we anticipate targeting at least $500 million of annual expense savings when fully implemented. Importantly, the program will likely involve restructuring costs and investments to fully implement the plan and capture the savings just as the business ops and information technology transformation program did.”
• Dave McKay, CEO, Royal Bank of Canada: “I’m pleased with how the business has continued to manage costs and leverage investments in technology to further improve our industry-leading efficiency ratio. For example, now virtually all of our mortgages are processed through our new system, which has automated the end-to-end origination process from sales and adjudication through to fulfillment.”
Percentage change in branch numbers from 3Q14, selected banks
Source: Company reports
0%
0%
–1%
–1%
–3%
–4%
–9%
CIBC
TD
RBC
USB
JPM
BAC
C

North American Banking & Capital Markets 15
Theme 9. Lending trends — loans grew, but their profitability did not
“On a linked quarter basis, consumer loans have begun to grow at a pace stronger than wholesale loans driven by growth in our residential mortgage portfolio and continued strength in our home equity and auto lending businesses. This mix of loan growth is a key factor in the stabilization of our net interest margin.”
Kathy Rogers, CFO, US Bancorp
Banks are lending more, but not earning more on their portfolios. North American banks grew end-of-period net loans on both a year-over-year and sequential basis, with the exceptions of Bank of America and Citigroup, which continue to run off non-core portfolios. However, higher loan balances have not necessarily translated into higher margins, reflecting the impact of the lower-for-longer interest rate environment. With positive trends solidifying in both the consumer and commercial segments, management at some banks appears to be shifting focus from growing overall loans to emphasizing higher-margin products. However, it may be too soon to characterize this as an industry-wide trend, as some banks, such as Wells Fargo, are more interested in growing customer relationships and core deposits, which typically offset net interest margin (NIM), while also looking to loan growth as a driver of net interest income, as opposed to margins.
• John Gerspach, CFO, Citigroup: “It’s not just the fact that you get loan growth; what also matters is where you get the loan growth and in what loan products do you get the loan growth. So the key for us is to begin to see the loan growth in those higher-margin credit card products. We’d like to see the loan growth in the retail bank, that’s fine, but those loans are usually slightly lower margins. … So loan growth is one thing and I feel pretty good about our ability to grow loans, but I’ll feel better when we begin to see better growth coming out of the card products.”
• David Williamson, Group Head of Retail and Business Banking, CIBC: “We’re growing the overall book [in Business Banking], but the commercial mortgage book, [which is] the lower margin part, we’re not growing. The over 10% growth that we’re getting in Business Banking funds managed in the loan book is all coming in the higher margin business. That mix change is what’s lifting margins in Business Banking. … [In Personal Banking] our mortgage growth is about at industry average, about 6%, maybe a bit better than industry average. But it’s composed of 15% growth in the higher margin CIBC-branded mortgages and a runoff in the low margin broker mortgages. So that’s a wind assist on margins that we’ll have for some foreseeable time and have had for a while.”
• Mike Pedersen, Group Head of US Banking, Toronto Dominion: “The margin did decline a bit more than we expected this quarter, but mostly because we grew faster than we expected and that was especially in larger commercial loans and in super-prime auto lending. In this environment, with origination margins lower than portfolio margins, if you’re outgrowing the market in lending, you’re subject to more margin pressure but it’s still good NII business.”
Basis point change in net interest margin from prior quarters for selected banks
Source: Company reports
*BK, GS and STT do not disclose end-of-period net loans.
Percentage change in end-of-period loans from prior
quarters*
Source: Company reports
*BK, GS and STT do not disclose end-of-period net loans.
–27
–6
3
1
–1
–1
2
7
–1
–2
–19
–16
–16
–12
–11
–10
–6
–3
3
4
BAC
TD
RBC
USB
STT
WFC
CIBC
JPM
C
BK
From 3Q14 From 2Q15
–1%
0.2%
3%
0%
3%
2%
3%
2%
5%
9%
–4%
–0.1%
4%
4%
8%
8%
9%
9%
13%
24%
C
BAC
USB
AXP
RBC
WFC
CIBC
JPM
TD
MS
From 3Q14 From 2Q15

North American Banking & Capital Markets 16
Theme 10. Acquisitions and divestments — portfolio acquisitions
Asset sales wind down. US banks have made great progress in winding down non-core businesses in the years since the financial crisis, and during the 3Q15 earnings season, only a few such transactions were discussed. Conversely, a number of banks discussed acquisitions of portfolios and small strategic businesses, highlighting ongoing efforts to increase assets under management and loan portfolios. Management at some banks noted a preference to “grow our underlying core loans with customers that we can continue to do business with.” However, high-margin organic growth is a challenge in the current macro-environment, which makes portfolio acquisitions an attractive opportunity for well-capitalized banks.
“We’re working towards closing the acquisition of City National later this year, which increases our leverage to a strengthening US economy and creates a platform for long-term growth.”
Dave McKay, CEO, Royal Bank of Canada
Deals discussed in 3Q15 earnings calls
Acquisitions • Harvey Schwartz, CFO, Goldman Sachs: “We closed the Pacific Global Advisors acquisition during the quarter, which added $18 billion of assets. This represents our seventh acquisition since the beginning of 2012. Over that time frame, total long-term net inflows were $195 billion; $71 billion of these net flows came from acquisitions.”
• John Shrewsberry, CFO, Wells Fargo: “Operating from a position of strength allows us to make quality acquisitions that help us serve more markets and meet more of our customers’ financial needs. … Yesterday we announced an agreement to acquire GE Capital’s commercial distribution finance and vendor finance businesses as well as certain corporate finance loan and lease assets. … This agreement provides us with a unique opportunity to add relationships and earning assets in businesses where GE Capital was an unequivocal market leader and where we either have meaningful experience or, in the case of commercial distribution finance, is a strong complement to our existing capabilities.”
• Richard Davis, CEO, US Bancorp: “[We recently acquired] the Auto Club card portfolio. There are more where that came from, and those are very attractive deals. They are bolt-on, they are low capital, but for the provision you need to put in front of them and the small conversion cost, it’s a good way to grow the balance sheet and we will continue to see opportunities there.”
• Mike Pedersen, Group Head of US Banking, Toronto Dominion: “Our focus in the US business is on organic growth at this time. We do, of course, look at things as they come up from time to time, and in that respect I’d say we’re more focused on potential asset plays in the line of the Nordstrom card portfolio or similar things than we are on, for example, larger branch-based acquisitions.”
• Mike Corbat, CEO, Citigroup: “We’ve been open to portfolio acquisitions, and whether it was Best Buy or whether it will be Costco, but all of those need to be in our targeted segments. You are not going to see us going out, breaking into new products or things that we don’t view today as really being core to who we are as a franchise.”
Asset sales • John Gerspach, CFO, Citigroup: “We currently expect to close roughly $31 billion of previously announced asset sales [in the fourth quarter], including our retail and cards businesses in Japan, and OneMain Financial. We will continue with other ongoing portfolio sales.”
• Gerald Hassell, CEO, BNY Mellon: “One highlight of our business improvement program is the sale of Meriten, our German-based boutique, where we had a marginally profitable business and identified the opportunity to better redeploy our capital. That closed in the third quarter.”
North American Banking & Capital Markets 17
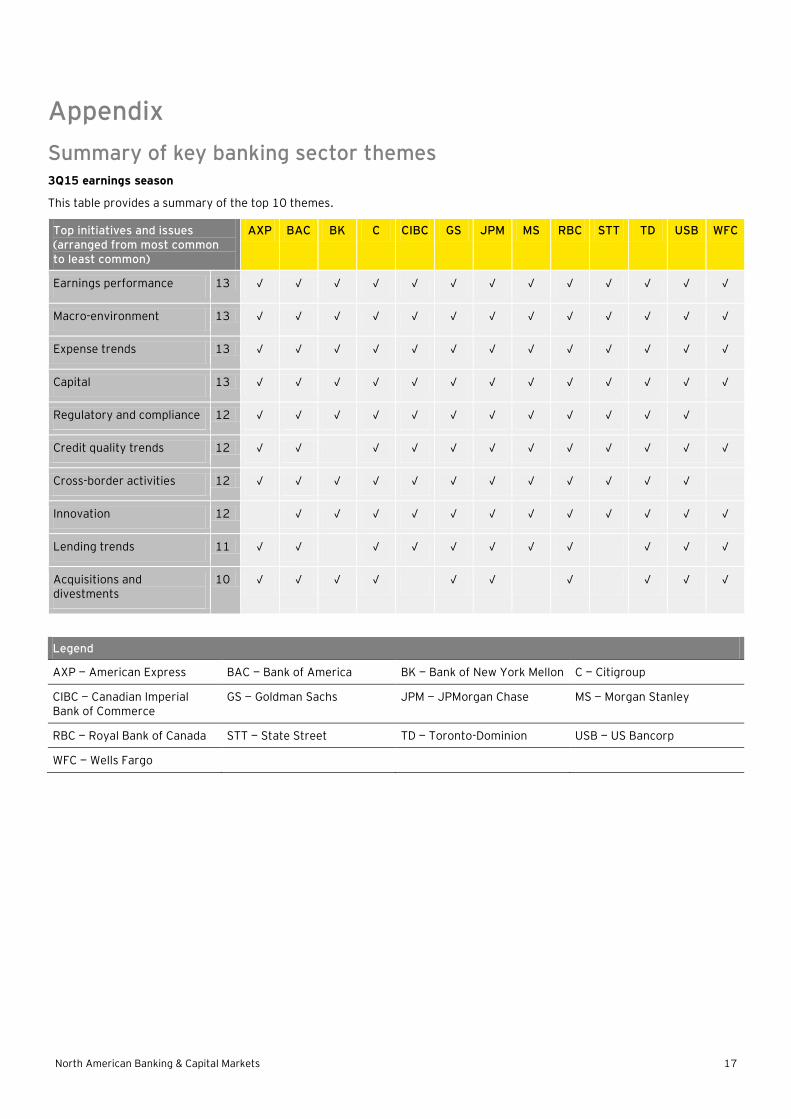
Appendix
Summary of key banking sector themes 3Q15 earnings season
This table provides a summary of the top 10 themes.
Top initiatives and issues (arranged from most common to least common)
AXP BAC BK C CIBC GS JPM MS RBC STT TD USB WFC
Earnings performance 13 √ √ √ √ √ √ √ √ √ √ √ √ √
Macro-environment 13 √ √ √ √ √ √ √ √ √ √ √ √ √
Expense trends 13 √ √ √ √ √ √ √ √ √ √ √ √ √
Capital 13 √ √ √ √ √ √ √ √ √ √ √ √ √
Regulatory and compliance 12 √ √ √ √ √ √ √ √ √ √ √ √
Credit quality trends 12 √ √ √ √ √ √ √ √ √ √ √ √
Cross-border activities 12 √ √ √ √ √ √ √ √ √ √ √ √
Innovation 12 √ √ √ √ √ √ √ √ √ √ √ √
Lending trends 11 √ √ √ √ √ √ √ √ √ √ √
Acquisitions and divestments
10 √ √ √ √ √ √ √ √ √ √
Legend
AXP — American Express BAC — Bank of America BK — Bank of New York Mellon C — Citigroup
CIBC — Canadian Imperial Bank of Commerce
GS — Goldman Sachs JPM — JPMorgan Chase MS — Morgan Stanley
RBC — Royal Bank of Canada STT — State Street TD — Toronto-Dominion USB — US Bancorp
WFC — Wells Fargo
North American Banking & Capital Markets 18
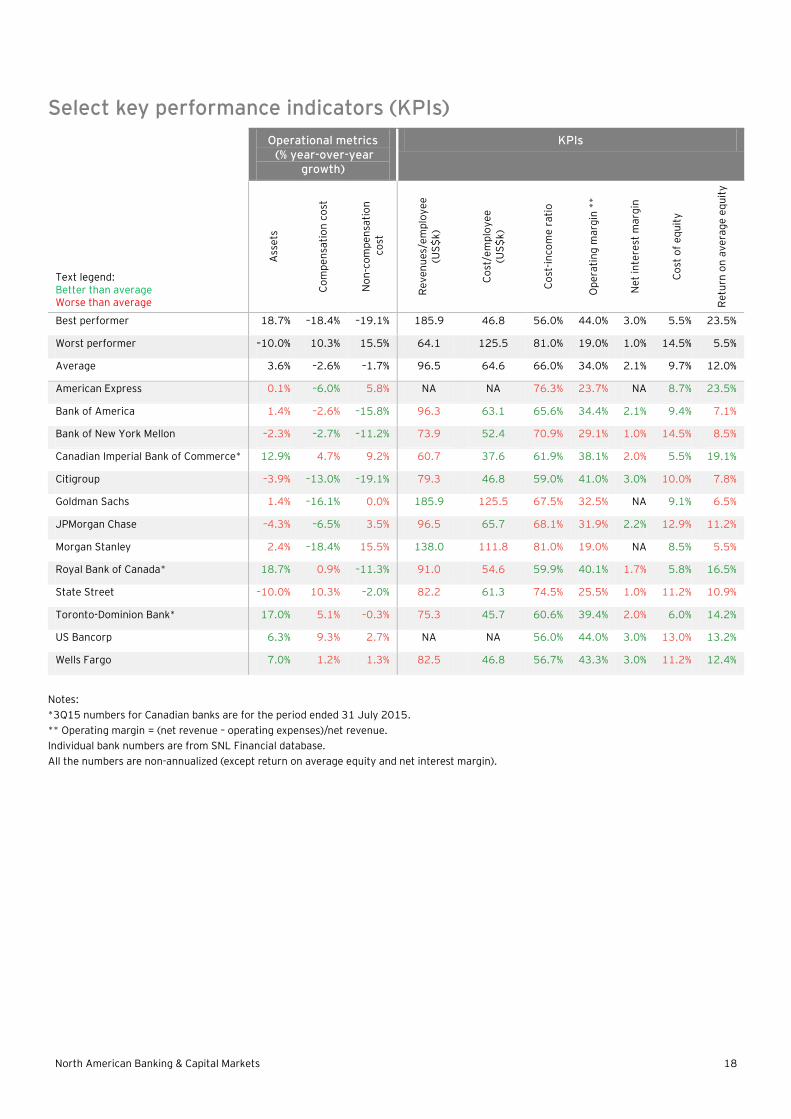
Select key performance indicators (KPIs)
Operational metrics (% year-over-year
growth)
KPIs
Text legend: Better than average Worse than average
Ass
ets
Co
mp
en
sati
on
co
st
No
n-c
om
pe
nsa
tio
n
co
st
Re
ve
nu
es/
em
plo
ye
e
(US
$k)
Co
st/e
mp
loy
ee
(U
S$
k)
Co
st-i
nco
me
ra
tio
Op
era
tin
g m
arg
in *
*
Ne
t in
tere
st m
arg
in
Co
st o
f e
qu
ity
Re
turn
on
av
era
ge
eq
uit
y
Best performer 18.7% –18.4% –19.1% 185.9 46.8 56.0% 44.0% 3.0% 5.5% 23.5%
Worst performer –10.0% 10.3% 15.5% 64.1 125.5 81.0% 19.0% 1.0% 14.5% 5.5%
Average 3.6% –2.6% –1.7% 96.5 64.6 66.0% 34.0% 2.1% 9.7% 12.0%
American Express 0.1% –6.0% 5.8% NA NA 76.3% 23.7% NA 8.7% 23.5%
Bank of America 1.4% –2.6% –15.8% 96.3 63.1 65.6% 34.4% 2.1% 9.4% 7.1%
Bank of New York Mellon –2.3% –2.7% –11.2% 73.9 52.4 70.9% 29.1% 1.0% 14.5% 8.5%
Canadian Imperial Bank of Commerce* 12.9% 4.7% 9.2% 60.7 37.6 61.9% 38.1% 2.0% 5.5% 19.1%
Citigroup –3.9% –13.0% –19.1% 79.3 46.8 59.0% 41.0% 3.0% 10.0% 7.8%
Goldman Sachs 1.4% –16.1% 0.0% 185.9 125.5 67.5% 32.5% NA 9.1% 6.5%
JPMorgan Chase –4.3% –6.5% 3.5% 96.5 65.7 68.1% 31.9% 2.2% 12.9% 11.2%
Morgan Stanley 2.4% –18.4% 15.5% 138.0 111.8 81.0% 19.0% NA 8.5% 5.5%
Royal Bank of Canada* 18.7% 0.9% –11.3% 91.0 54.6 59.9% 40.1% 1.7% 5.8% 16.5%
State Street –10.0% 10.3% –2.0% 82.2 61.3 74.5% 25.5% 1.0% 11.2% 10.9%
Toronto-Dominion Bank* 17.0% 5.1% –0.3% 75.3 45.7 60.6% 39.4% 2.0% 6.0% 14.2%
US Bancorp 6.3% 9.3% 2.7% NA NA 56.0% 44.0% 3.0% 13.0% 13.2%
Wells Fargo 7.0% 1.2% 1.3% 82.5 46.8 56.7% 43.3% 3.0% 11.2% 12.4%
Notes:
*3Q15 numbers for Canadian banks are for the period ended 31 July 2015.
** Operating margin = (net revenue – operating expenses)/net revenue.
Individual bank numbers are from SNL Financial database.
All the numbers are non-annualized (except return on average equity and net interest margin).
North American Banking & Capital Markets 19
Scope, limitations and methodology of the review
The purpose of this review is to examine the key themes discussed during the 3Q15 earnings reporting season among 13 major North American institutions operating within the banking and capital markets sector.
The identification of the top 10 themes is based solely on an examination of the transcripts and associated presentation materials of the earnings conference calls held from 26 August 2015 to 23 October 2015.
For this analysis, the following North America-based banks were reviewed:
• American Express (AXP)
• Bank of America (BAC)
• Bank of New York Mellon (BK)
• Canadian Imperial Bank of Commerce (CIBC)
• Citigroup (C)
• Goldman Sachs (GS)
• JPMorgan Chase (JPM)
• Morgan Stanley (MS)
• Royal Bank of Canada (RBC)
• State Street (STT)
• Toronto-Dominion (TD)
• US Bancorp (USB)
• Wells Fargo (WFC)
The period covered was 3Q15, ended 30 September 2015. Exceptions are the following:
• CIBC, RBC and TD, for which the period covered, 3Q15, ended 31 July 2015
Unless otherwise noted, all currency amounts are in US dollars.

North American Banking & Capital Markets 20
EY | Assurance | Tax | Transactions | Advisory About EY EY is a global leader in assurance, tax, transaction and advisory services. The insights and quality services we deliver help build trust and confidence in the capital markets and in economies the world over. We develop outstanding leaders who team to deliver on our promises to all of our stakeholders. In so doing, we play a critical role in building a better working world for our people, for our clients and for our communities. EY refers to the global organization, and may refer to one or more, of the member firms of Ernst & Young Global Limited, each of which is a separate legal entity. Ernst & Young Global Limited, a UK company limited by guarantee, does not provide services to clients. For more information about our organization, please visit ey.com.
About EY Global Banking & Capital Markets In today’s globally competitive and highly regulated environment, managing risk effectively while satisfying an array of divergent stakeholders is a key goal of banks and securities firms. Global Banking & Capital Markets brings together a worldwide team of professionals to help you succeed — a team with deep technical experience in providing assurance, tax, transaction and advisory services. We work to anticipate market trends, identify the implications and develop points of view on relevant sector issues. Ultimately it enables us to help you meet your goals and compete more effectively. © 2015 EYGM Limited.
All Rights Reserved.
EYG no. EK0396 BMC Agency BACS 1002753 ED None
This material has been prepared for general informational purposes only and is not intended to be relied upon as accounting, tax or other professional advice. Please refer to your advisors for specific advice.
The views of third parties set out in this publication are not necessarily the views of the global EY organization or its member firms. Moreover, they should be seen in the context of the time they were made.
ey.com