North America Quarterly Construction Cost ... -...
15
FOURTH QUARTER 2017 QUARTERLY CONSTRUCTION COST REPORT NORTH AMERICA
Transcript of North America Quarterly Construction Cost ... -...

FOURTH QUARTER 2017
QUARTERLY CONSTRUCTION COST REPORT
NORTH AMERICA

AC HOTEL TUCSON BY MARRIOTTTUCSON, AZ
The AC Hotel Tucson by Marriott is the first hotel built in Downtown Tucson, AZ in over 40 years. The project includes an 8-story building with hotel lobby and new commercial space on the 1st floor, a 200-space parking garage on floors 2-5, and a 136-room boutique hotel on floors 6-8.
RLB provided Project Management and Cost Management services. This urban site posed a number design and construction challenges in which RLB worked with the Owner and Design-Build Team to resolve proactively. With AC being a new Marriott brand, RLB has helped streamline the incorporation of the brand’s design requirements, and has exercised expertise in project controls to hold Owner expectations regarding schedule and budget.
ON THE COVER

1
NORTH AMERICA
As we welcome 2018, we’re pleased to bring you the latest edition of the Rider Levett Bucknall Quarterly Construction Cost Report.
Largely based on the rapid completion of projects and the continued availability of favorable-term financing which fuels development, the industry outlook through the end of this year remains positive. But there are a few hurdles, particularly on the horizon, on which we are keeping a watchful eye.
The serious and widespread damage inflicted by the 2017 hurricanes in Texas and the Caribbean, along with the record-setting wildfires throughout California (and, subsequently, the mudslides just north of Los Angeles) exacerbated the still-tight labor market in the United States.
An underlying factor is compounding the shortage. If the construction labor force is generally unable to afford living in the places where their services are most in demand, employers will eventually increase wages to attract workers—but at this point in time, this has not yet been fully realized.
Additionally, slow processing of insurance claims and federal emergency relief funds have not only prolonged the recovery process, but, as on-the-ground conditions deteriorate over time, the costs of undertaking repairs creep upward. Coupled with steep and expected increases in the price of construction-materials staples such as gypsum board, lumber and plywood, and PVC products, the rebuilding looks to be drawn out and costly.
Surveys show that long-term industry confidence is slipping, for reasons that are largely rooted in Washington D.C. The long-promised infrastructure initiative seems to have slipped off the federal agenda, and may be headed to the individual states to implement. Legislation on immigration and resident aliens, while not yet law, threatens to destabilize and/or reduce the construction workforce at a time when the need for labor is peaking.
Julian Anderson FRICSPresident, North AmericaChairman of the Global Board

USA REPORT
2
NATIONAL CONSTRUCTION COST INDEX
182
.16
147.
74
149
.19
150
.75
151.
89
153
.09
154
.56
156
.33
158
.48
161.
11
162
.98
164
.96
166
.85
Q3 ‘15
Q2 ‘16
Q1 ‘16
Q4 ‘15
Q3 ‘14
Q2 ‘15
Q1‘15
Q4 ‘14
Q3 ‘13
Q2 ‘14
Q1 ‘14
Q4 ‘13
Q3 ‘17
Q2 ‘13
Q1 ‘13
169
.05
171.
38
173
.84
176
.48
Q3 ‘16
Q2 ‘17
Q1 ‘17
Q4 ‘16
178
.34
180
.11
185.8
7
Q4 ‘12
Q4 ‘17
183
.99
According to the U.S. Department of Commerce,
construction-put-in-place during October 2017 was
estimated at a seasonally adjusted annual rate of $1,241.5
billion, which is
$1,241.5Billion
the revised September estimate of $1,224.6 billion, and
above the October 2016 estimate of $1,206.6 billion.
1.4% above
2.9% above
Welcome to the fourth quarter 2017 issue of the Rider Levett Bucknall Quarterly Cost Report! This issue contains data current to October 1, 2017.
The National Construction Cost Index shows the changing cost of construction between October 2012 and October 2017,
relative to a base of 100 in April 2001. Index recalibrated as of April 2011.

3
KEY UNITED STATES STATISTICS
GDP represented in percent change from the preceding quarter, seasonally adjusted at annual rates. CPI quarterly figures represent the monthly value at the end of the quarter. Inflation rates represent the total price of inflation from the previous quarter, based on the change in the Consumer Price Index. ABI is derived from a monthly American Institute of Architects survey of architectural firms of their work on the boards, reported at the end of the period. Construction Put-in-Place figures represent total value of construction dollars in billions spent at a seasonally adjusted annual rate taken at the end of each quarter. General Unemployment rates are based on the total population 16 years and older. Construction Unemployment rates represent only the percent of experienced private wage and salary workers in the construction industry 16 years and older. Unemployment rates are seasonally adjusted, reported at the end of the period.* Adjustments made to GDP based on amended changes from the Bureau of Economic Analysis.Sources: U.S. Bureau of Labor Statistics, Bureau of Economic Analysis, American Institute of Architects.
Construction Unemployment
Construction unemployment
evens out after a drop during
the second quarter, currently
at 4.7%.
Gross Domestic Product* (GDP)
GDP recovers from a dip in Q1, and was
sitting at 3.3% during Q3.
Consumer Price Index (CPI)
CPI experiences a nominal but
steady increase. Inflation has
grown 2.2% from this time last
year.
Architectural Billings Index (ABI)
ABI experiences its first dip
since this time last year. It is yet
to be determined if this dip is in
response to impacts from recent
hurricanes or from other factors.
National Unemployment
National unemployment
experiences nominal
variance from this time last
year.

54
INDICATIVE CONSTRUCTION COSTS
CONSTRUCTION INDUSTRY CONFIDENCE INDEX
0
10
20
30
40
50
60
70
80
90
100
Q42014
Q12015
Q22015
Q32015
Q42015
Q12016
Q22016
Q32016
Q42016
Q12017
Q22017
Q32017
77 7874
68 68
61 62
58
68
76
72
66
2014
2015
2016
2017
Average over three-year period
USAREPORT
The data in the chart below represents estimates of current building costs in each respective market. Costs may vary as a consequence of factors such as site conditions, climatic conditions, standards of specification, market conditions, etc. Values of U.S. locations represent hard construction costs based on U.S. dollars per square foot of gross floor area, while values of Canadian locations represent hard construction costs based on Canadian dollars per square foot.
The North American construction market continues to recover from the crash in 2009; and is now the third-longest market recovery period in U.S. history. ENR’s Construction Industry Confidence Index (CICI), launched in 2009, is a survey of different types of firms (Design Professionals, General Contractors and Subcontractors) and represents their overall view of the current and future construction market. The index is 66 in the third quarter of 2017, reflecting a drop of six points since the previous quarter. Despite the drop, industry confidence remains high, as an index above 50 reflects sentiment for market growth.
While it is expected that construction will continue to prosper through the end of 2018, long-term market concerns are what have led to a downturn in industry confidence.
Source: 2017 3Q Engineering News Record Confidence Survey
OFFICES RETAIL SHOPPING HOTELS HOSPITAL INDUSTRIAL PARKING RESIDENTIAL EDUCATION
PRIME SECONDARY CENTER STRIP 5 STAR 3 STAR GENERAL WAREHOUSE GROUND BASEMENT MULTI-FAMILY SINGLE-FAMILY ELEMENTARY HIGH SCHOOL UNIVERSITY
LOCATION LOW HIGH LOW HIGH LOW HIGH LOW HIGH LOW HIGH LOW HIGH LOW HIGH LOW HIGH LOW HIGH LOW HIGH LOW HIGH LOW HIGH LOW HIGH LOW HIGH LOW HIGH
USA
Boston 300 475 200 300 175 275 125 200 375 550 250 375 400 650 100 175 75 125 90 150 175 300 250 350 280 380 290 405 330 480
Chicago 280 450 175 280 185 280 135 220 390 650 270 390 360 700 110 185 80 125 120 155 160 340 220 420 250 380 300 400 350 600
Denver 165 255 120 185 90 145 75 140 215 325 155 190 380 470 90 150 50 75 90 120 90 200 90 410 250 300 260 315 305 415
Honolulu 285 525 245 400 210 490 175 430 515 740 325 545 475 755 145 225 100 145 140 265 195 440 280 755 340 475 405 605 440 715
Las Vegas 140 295 105 190 115 480 65 145 350 500 150 300 285 455 50 100 50 85 60 150 70 405 90 350 180 315 200 455 235 455
Los Angeles 225 340 165 250 150 330 120 185 355 520 255 330 475 705 110 175 105 125 130 175 185 295 190 335 340 450 360 485 390 555
New York 375 575 300 400 275 425 175 300 400 600 300 400 475 700 115 200 95 175 125 200 200 375 275 400 295 405 305 455 330 480
Phoenix 160 275 120 175 120 200 80 140 300 500 150 250 350 500 55 100 45 70 60 110 90 185 100 400 170 250 220 340 300 420
Portland 180 250 130 180 140 240 120 180 230 330 150 190 380 525 90 150 85 105 110 150 150 240 125 280 270 335 285 350 310 440
San Francisco 210 325 190 300 225 350 225 325 400 600 350 500 450 650 140 190 110 145 175 215 320 430 200 400 340 450 315 400 250 375
Seattle 205 250 150 205 135 305 110 155 245 340 225 240 390 540 100 125 95 120 140 165 165 260 170 300 275 320 325 480 315 475
Washington 275 425 200 300 150 275 125 175 350 525 250 350 400 650 90 150 70 125 80 125 175 300 250 350 280 355 280 380 330 480
CANADA
Calgary 235 295 190 285 220 310 110 160 300 450 190 245 550 720 85 145 75 90 75 120 140 215 125 315 185 260 220 310 300 450
Toronto 195 260 174 250 200 250 105 160 300 355 195 260 500 645 115 150 70 90 70 90 130 205 190 330 175 195 200 230 200 295
6
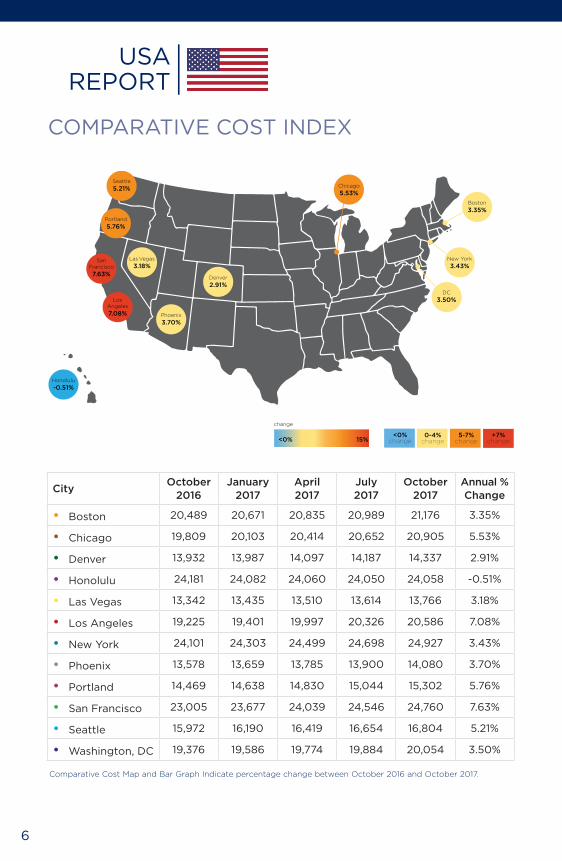
COMPARATIVE COST INDEX
USAREPORT
CityOctober
2016January
2017April 2017
July2017
October2017
Annual % Change
• Boston 20,489 20,671 20,835 20,989 21,176 3.35%
• Chicago 19,809 20,103 20,414 20,652 20,905 5.53%
• Denver 13,932 13,987 14,097 14,187 14,337 2.91%
• Honolulu 24,181 24,082 24,060 24,050 24,058 -0.51%
• Las Vegas 13,342 13,435 13,510 13,614 13,766 3.18%
• Los Angeles 19,225 19,401 19,997 20,326 20,586 7.08%
• New York 24,101 24,303 24,499 24,698 24,927 3.43%
• Phoenix 13,578 13,659 13,785 13,900 14,080 3.70%
• Portland 14,469 14,638 14,830 15,044 15,302 5.76%
• San Francisco 23,005 23,677 24,039 24,546 24,760 7.63%
• Seattle 15,972 16,190 16,419 16,654 16,804 5.21%
• Washington, DC 19,376 19,586 19,774 19,884 20,054 3.50%
New York
3.43%
Honolulu
-0.51%
Boston
3.35%
Chicago
5.53%
Denver
2.91%
Las Vegas
3.18%San
Francisco
7.63%
LosAngeles
7.08%
Seattle
5.21%
DC
3.50%
Portland
5.76%
Phoenix
3.70%
0-4%change
5-7%change
+7%change<0% 15%
change
<0%change
Comparative Cost Map and Bar Graph Indicate percentage change between October 2016 and October 2017.

Each quarter we look at the comparative cost of construction in 12 US cities, indexing them to show how costs are changing in each city in particular, and against the costs in the other 11 locations. You will be able to find this information in the graph titled Comparative Cost Index (above) and in the Cost and Change Summary (right).
Our Comparative Cost Index tracks the ‘true’ bid cost of construction, which includes, in addition to costs of labor and materials, general contractor and sub-contractor overhead costs and fees (profit). The index also includes applicable sales/use taxes that ‘standard’ construction contracts attract. In a ‘boom,’ construction costs typically increase more rapidly than the net cost of labor and materials. This happens as the overhead levels and profit margins are increased in response to the increasing demand. Similarly, in a ‘bust’, construction cost increases are dampened (or may even be reversed) due to reductions in overheads and profit margins.
7
8,000 16,000 20,000
2017
2016
2017
2016
2017
2016
2017
2016
2017
2016
2017
2016
2017
2016
2017
2016
2017
2016
2017
2016
2017
2016
BOSTON
CHICAGO
DENVER
HONOLULU
LAS VEGAS
LOS ANGELES
PHOENIX
PORTLAND
SAN FRANCISCO
SEATTLE
WASHINGTON, DC
NEW YORK
2017
2016
12,000
3.35%
5.53%
2.91%
-0.51%
3.18%
7.08%
3.70%
5.76%
5.21%
3.50%
7.63%
3.43%
INDEX 24,000 28,000
8,000 16,000 20,00012,000INDEX 24,000 28,000

8
USAREPORT
0
4%
8%
OCT2017
JAN2017
APR2017
12%
2%
COST INDEX Denver
0.40% 0.79% 0.64%
JUL2017
1.06%
0
4%
8%
OCT2017
JAN2017
APR2017
12%
2%
COST INDEX Las Vegas
0.69% 0.56% 0.77%
JUL2017
1.12%
0
4%
8%
JAN2017
APR2017
12%
2%
COST INDEX Chicago
1.48% 1.55% 1.16%
JUL2017
1.23%
OCT2017
-1%
0%
1%
OCT2017
JAN2017
APR2017
2%
-2%
COST INDEX Honolulu
-0.41% -0.09% -0.04%
JUL2017
0.03%
0
4%
8%
OCT2017
JAN2017
APR2017
12%
2%
COST INDEX Los Angeles
0.91% 3.07% 1.65%
JUL2017
1.28%
The following escalation charts track changes in the cost of construction each quarter in many of the cities where RLB offices are located. Each chart illustrates the percentage change per period and the cumulative percentage change throughout the charted timeline.
Percentage change per quarter Cumulative percentage change for the period shown
0
4%
8%
OCT2017
JAN2017
APR2017
JUL2017
12%
2%
COST INDEX Boston
0.89% 0.79% 0.74% 0.89%

Our research suggests that between July 1, 2017 and October 1, 2017 the national average increase in construction cost was approximately 1.0%. Several locations saw increases over 1%, including Chicago, Denver, Las Vegas, Los Angeles, Phoenix, and Portland. However, Boston, Honolulu, New York, San Francisco, Seattle, and Washington DC all experienced increases less than 1%.
0
4%
8%
OCT2017
JAN2017
APR2017
12%
2%
COST INDEX Portland
1.17% 1.31% 1.44%
JUL2017
1.71%
0
4%
8%
OCT2017
JAN2017
APR2017
12%
2%
COST INDEX Seattle
1.37% 1.41% 1.43%
JUL2017
0.90%
0
4%
8%
OCT2017
JAN2017
APR2017
12%
2%
COST INDEX Phoenix
0.60% 0.92% 0.84%
JUL2017
1.29%
COST INDEX San Francisco
0
4%
8%
OCT2017
JAN2017
APR2017
12%
2%
2.92% 1.53% 2.11%
JUL2017
0.87%
0
4%
8%
OCT2017
JAN2017
APR2017
12%
2%
COST INDEX Washington DC
1.08% 0.96% 0.55%
JUL2017
0.86%
0
4%
8%
OCT2017
JAN2017
APR2017
12%
2%
COST INDEX New York
0.84% 0.81% 0.81%
JUL2017
0.93%
9

10
CANADAREPORT
0-4%change
5-9%change
10-15%change<0% 15%
change
Toronto
1.42%
Calgary
-0.85%
<0%change
CityOctober
2016January
2017April 2017
July2017
October2017
Annual% Change
• Calgary 18,435 18,190 18,089 18,080 18,279 -0.85%
• Toronto 18,690 18,800 18,664 18,569 18,956 1.42%
COMPARATIVE COST INDEX
Nationally, construction activities gained some momentum as the value of building permits rose 3.5% in the first month of Q4 2017 (October). Main contributor to this rise relate to higher construction intentions for building component in Quebec and Ontario, as well as factories and plants in Alberta. Seasonally adjusted year-to-date value of permits increased 1% for the same period in 2016. Commercial and industrial building component push the non-residential sector higher in Ontario municipalities and Quebec. Other active sectors include multi-family dwellings in Quebec with 78% of permit value coming from the census metropolitan area (CMA) of Montreal. During October 2017, multiple high-value permits for apartment condominiums in Montreal CMA accounted for Quebec’s provincial increase..

KEY CANADIAN STATISTICS
GDP represented in percent change from the preceding quarter, seasonally adjusted at annual rates. CPI quarterly figures represent the monthly value at the end of the quarter. Inflation rates represent the total price of inflation from the previous quarter, based on the change in the Consumer Price Index. General Unemployment rates are based on the total population 16 years and older. Construction Unemployment rates represent only the percent of experienced private wage and salary workers in the construction industry 15 years and older. Unemployment rates are seasonally adjusted, reported at the end of the period.
Sources: Statistics Canada
Value of Building Permits
The seasonally adjusted value
of building permits continues
to fluctuate quarter-to-quarter.
Permits have increased 1% from the
same period in 2016.
Gross Domestic Product
Experiencing a 0.42% change from
last quarter, GDP shows minimal
fluctuation, indicating a nominal
3.32% variance from this time last
year.
Consumer Price Index
Canada’s Consumer Price Index grows
steadily every quarter, with a variance
of 1.47% from this time last year.
Unemployment
Canada’s unemployment
continues to decrease steady,
down 0.8% from this time last
year.
Housing Starts
Housing Starts are up 42% from Q1 2017;
11.43% higher than this time last year.
11
12
While the information in this publication is believed to be correct, no responsibility is accepted for its accuracy.
Persons desiring to utilize any information appearing in this publication should verify its applicability to their specific
circumstances.
This issue was compiled by Taryn Harbert with contributions from Evans Pomegas, Grant Owen, Edd Hamzanlui, Paul
Brussow, Maelyn Uyehara, Cassie Idehara, Simon James, Philip Mathur, Scott Macpherson, Graham Roy, Daniel Junge,
George Bergeron, Peter Knowles, Catherine Stoupas, Joe Pendlebury, Edward Traore, and Robin Kankerwal.
© December 2017 by Rider Levett Bucknall Ltd.
ABOUT RIDER LEVETT BUCKNALL
Rider Levett Bucknall is an award-winning international firm known for providing project management, construction cost consulting, and related property and construction advisory services – at all stages of the design and construction process. The firm was voted #1 Cost Consultant for 2016, 2017, and 2018 by World Architecture Magazine.

If you have questions or for more information, please contact us.
AUSTINPhone: +1 512 704 3026E-mail: [email protected]: Ward Simpson
BOSTONPhone: +1 617 737 9339E-mail: [email protected]: Grant Owen
CALGARYPhone: +1 403 571 0505E-mail: [email protected]: Edward Traore
CHICAGOPhone: +1 312 819 4250E-mail: [email protected]: Chris Harris
DENVERPhone: +1 720 904 1480E-mail: [email protected]: Peter Knowles
HILOPhone: +1 808 934 7953E-mail: [email protected]: Kevin Mitchell
HONOLULUPhone: +1 808 521 2641E-mail: [email protected]: Paul Brussow Maelyn Uyehara Erin Kirihara
LAS VEGASPhone: +1 702 227 8818E-mail: [email protected]: Simon James
LOS ANGELESPhone: +1 213 689 1103E-mail: [email protected]: Philip Mathur Brian Lowder
MAUIPhone: +1 808 875 1945E-mail: [email protected]: Kevin Mitchell
NEW YORKPhone: +1 212 952 1300 E-mail: [email protected] Contact: Grant Owen
PHOENIXPhone: +1 602 443 4848E-mail: [email protected]: Julian Anderson Scott Macpherson John Jozwick
PORTLANDPhone: +1 503 226 2730E-mail: [email protected]: Graham Roy
SAN FRANCISCOPhone: +1 415 362 2613E-mail: [email protected]: Catherine Stoupas
SAN JOSEPhone: +1 650 943 2317E-mail: [email protected]: Joel Brown
SEATTLEPhone: +1 206 223 2055E-mail: [email protected]: Emile Le Roux
ST. LUCIAPhone: +1 758 452 2125E-mail: [email protected]: Mark Williamson
TORONTOPhone: +1 905 827 8218E-mail: [email protected]: Joe Pendlebury
TUCSONPhone: +1 520 777 7581E-mail: [email protected]: Joel Brown
WAIKOLOAPhone: +1 808 883 3379E-mail: [email protected]: Kevin Mitchell
WASHINGTON, DCPhone: +1 202 457 1450E-mail: [email protected]: Grant Owen
13

rlb.com