North America Midstream Infrastructure through 2035 ...
30
North America Midstream Infrastructure through 2035: Capitalizing on Our Energy Abundance Prepared by ICF International for The INGAA Foundation, Inc. Support provided by America’s Natural Gas Alliance ICF International 9300 Lee Highway Fairfax Virginia 22031 INGAA Foundation Final Report No. 2014.01 March 18, 2014
Transcript of North America Midstream Infrastructure through 2035 ...

0 The INGAA Foundation Inc.
North America Midstream Infrastructure through 2035: Capitalizing on Our Energy Abundance Prepared by ICF International for The INGAA Foundation, Inc. Support provided by America’s Natural Gas Alliance
ICF International 9300 Lee Highway Fairfax Virginia 22031
INGAA Foundation Final Report No. 2014.01
March 18, 2014

1 The INGAA Foundation Inc.
Contents
Study Objectives and Scope of Work
Similarities to and Differences from the 2011 Study
Base Case Assumptions and Trends
Midstream Infrastructure Requirements for the Base Case
Comparison of Low Growth Case with the Base Case
Results of Economic Impact Analysis
Concluding Remarks

2 The INGAA Foundation Inc.
Study Objectives
The objective of this study is to estimate future midstream infrastructure requirements, including natural gas, natural gas liquids, and oil infrastructure requirements through 2035. Study is based on a detailed supply/demand outlook for North American energy markets.
In the context of this analysis, the midstream includes:
o Natural gas gathering and lease equipment, processing, pipeline transportation and storage, and LNG export facilities.
o Natural gas liquids (NGLs) pipeline transportation, fractionation, and NGL export facilities.
o Crude oil gathering and lease equipment, pipeline transportation, and storage facilities.
A Low Growth Case is also considered.
Study provides an update to the INGAA Foundation’s 2011 infrastructure study.
Study also analyzes the impacts of midstream infrastructure investments on jobs and the economy. Study has been initiated to more fully consider recent trends and investigate the impacts of those
trends, particularly robust shale gas and tight oil development, on future infrastructure requirements.

3 The INGAA Foundation Inc.
Scope of Work
This study projects natural gas and liquids infrastructure requirements, by:
Considering regional natural gas supply/demand projections that rely on the most current market trends.
Considering well completion and production information across major supply areas.
Considering gas processing requirements by region.
Considering how power plant gas use is likely to change in the future.
Reviewing underground natural gas storage requirements by region.
Completing an analysis of NGL and oil infrastructure requirements by applying well and production information across major supply areas.
Considering a number of new gas uses and additional types of infrastructure that were not considered in the 2011 study (discussed on the next slide)
This study assesses the economic impacts of midstream infrastructure investments, by:
Completing a regional impact analysis that relies on IMPLAN.
Considering the direct, indirect, and induced impacts of the infrastructure development.
This study considers new infrastructure needs. It does not investigate replacement of existing infrastructure, nor does it investigate operations and maintenance of existing infrastructure.

4 The INGAA Foundation Inc.
Similarities to and Differences from the 2011 Study Even though this study projects a lower number of gas wells, versus the 2011 study, shale gas
production growth is still robust and it continues to yield significant development of natural gas infrastructure. But, the current slate of gas transportation projects generally require less miles of pipe and rely to a greater
extent on using existing infrastructure in different ways - for example, adding compression to increase line capacity and reversing lines to accommodate growth from new production areas.
Even though less miles of pipe are required, investment in new gas pipelines is close to estimates from the prior study because line costs have continued to rise over the past few years.
Oil and NGL production growth is projected to be much greater, leading to increased infrastructure needs for oil and NGL processing, transport, and storage. This study considers repurposing of gas infrastructure for transport of oil and NGLs.
Some production projections for various regions have increased, for example Marcellus gas production is much greater in this current study, leading to more pronounced midstream development within and from that area.
Beyond differences mentioned above, this study also projects much greater investment and job impacts for new infrastructure because some types of activity that were overlooked in the 2011 study are now considered, including: LNG exports, NGL fractionation, Mexican exports, compression in gas gathering systems, crude oil gathering
line and pumping needs, oil storage, and lease equipment requirements.

5 The INGAA Foundation Inc.
Assumptions for Base Case
U.S. GDP assumed to grow at 2.6% per year, Canadian GDP grows at 2.5% per year, and population grows at approximately 1% per year after 2014.
Roughly 4,000 trillion cubic feet (Tcf) of recoverable gas resource. Abundant and cost effective tight oil supplies spread across the U.S. and Canada, and vast amount of oil sands resource in Western Canada.
Oil prices of $100 per barrel in Base Case continues to drive “oil-gas price arbitrage” investments. LNG exports, and petrochemical activities, including ammonia production, ethylene production, and propylene production fair well in this environment. U.S. and Canada LNG exports approach 9 billion cubic feet per day (Bcfd) by 2022.
Relatively high oil price continues to spur oil and NGL focused production activities.
Electric load growth averages 1.3% per year and coal plant retirements of roughly 60 Gigawatts (GW) in the U.S. and Canada drive interest in gas-fired power generation.
Midstream infrastructure development driven by supply and demand trends, and assumed to not be a constraining or limiting factor on market development. Projects under construction are completed, and projects planned for development are implemented in
response to market needs.

6 The INGAA Foundation Inc.
Midstream Infrastructure Cost Assumptions in 2012$ Unit costs assumed for midstream infrastructure development
remain constant in real terms throughout the projection.
Average pipeline costs are $155,000 per inch-mile, varying regionally. – The average cost was $94,000 per inch-mile in the 2011 Study.
Costs for gathering lines vary by diameter.
Compression and pumping costs are $2,600 per horsepower (HP).
Costs for lease equipment are $88,000 per gas well and $210,000 per oil well.
Gas processing costs (not including compression) are about $520,000 per million cubic feet per day (MMcfd).
Costs for NGL fractionation facilities average $6,500 per barrel of oil equivalent (BOE) of NGL processed.
Costs for NGL export facilities are purity dependent: – $6,200 per BOE of ethane processed,
– $5,000 per BOE of propane processed, and
– $5,000 per BOE of Butane processed.
Costs for crude oil storage tanks average of $15 per barrel of oil.
LNG export facility costs average $5-6 billion per Bcfd of export.
Region Regional Cost Factors
Canada 0.80
Central 0.69
Midwest 0.85
Northeast 1.46
Offshore 1.00
Southeast 1.09
Southwest 0.68
Western 1.14
Pipeline Cost Multipliers
Diameter (Inches)
Gathering Line Costs
(2012$/inch-mile)
1 $46,228 2 $34,671 4 $28,892 6 $24,164 8 $25,215
10 $39,398 12 $68,291 14 $110,316 16 $122,135
Gathering Line Costs
Region Regional Cost Factors
Canada 1.00 Central 1.06
Midwest 1.16 Northeast 1.24 Offshore 1.00
Southeast 1.00
Southwest 0.98
Western 1.07
Compression and Pumping Multipliers
Field Type Expansion New
Salt Cavern $26 $31
Depleted Reservoir $15 $18
Aquifer $30 $37
Natural Gas Storage Costs (Millions of 2012$ per Bcf of
Working Gas Capacity)

7 The INGAA Foundation Inc.
Projected Natural Gas Price and Demand in the Base Case
Projected Henry Hub gas prices are likely to average between $5 and $6 per million British thermal unit (MMBtu) in the longer term.
Projected gas prices are high enough to support projected supply development, but not so high as to adversely impact market growth.
$0$1$2$3$4$5$6$7$8$9
$10
Average Annual Natural Gas Prices at Henry Hub (2012$/MMBtu)
Other*
Residential Commercial
Industrial
Power Generation
LNG Exports
Mexico Exports
0102030405060708090
100110120130
U.S. and Canadian Gas Consumption Average Annual Billion Cubic Feet per Day (Bcfd)
*Other includes lease, plant, and pipeline fuel gas use.
Total gas consumption (including exports from the U.S. and Canada) is projected to increase at a rate of 1.8% per year – By 2035, total gas consumption in the U.S. and Canada is
projected to reach an average of almost 120 Bcfd.

8 The INGAA Foundation Inc.
Natural Gas, Oil, and NGL Production in the Base Case
Total gas production increases by 1.8% per year, rising to over 120 Bcfd by 2035.
Shale gas grows to two-thirds of the total production by 2035, while conventional gas production declines significantly.
Offshore Tight
Shale
0102030405060708090
100110120130
Conventional Onshore
U.S. and Canadian Natural Gas Production (Average Annual Bcfd)
NGL
0
5
10
15
20
25
Crude Oil
U.S. and Canadian Liquid Production Average Annual Million Barrels per Day (Bbl/d)
Robust crude oil and condensate production growth in the U.S. and Canada driven by relatively high oil price.
– Oil and condensate production grows to 18.2 million barrels per day (MMBPD) or by 2.3% per year through 2035
– Incremental production comes from Western Canada oil sands and tight oil supplies.
NGL production in the U.S. and Canada grows by 3.2% per year, rising to roughly 6 MMBPD by 2035.

9 The INGAA Foundation Inc.
Natural Gas Flow, NGL, and Crude Oil Flows in the Base Case
Natural Gas Flow NGL Flow
Crude Oil Flow

10 The INGAA Foundation Inc.
Inter-Regional Natural Gas Pipeline Capacity Added in the Base Case (Bcfd)
Originating Region 2014-2020 2021-2025 2026-2030 2031-2035 2014-2035 Average Annual
2014-2035
U.S. and Canada 24.2 6.9 8.4 3.4 42.9 1.9 U.S. 23.2 5.9 7.9 2.9 39.9 1.8 Canada 1.0 1.0 0.5 0.5 3.0 0.1 Central 5.0 - 1.4 0.8 7.2 0.3 Midwest 3.0 0.5 - - 3.5 0.2 Northeast 6.0 2.3 1.9 - 10.1 0.5 Offshore - - - - - - Southeast 4.4 0.7 1.7 1.1 7.9 0.4 Southwest 4.8 2.0 2.9 0.5 10.2 0.5 Western - 0.5 - 0.5 1.0 0.0 Arctic - - - - - -

11 The INGAA Foundation Inc.
Inter-Regional Natural Gas Liquids Pipeline Capacity Added in the Base Case (Million Bbl/d)
Originating Region 2014-2020 2021-2025 2026-2030 2031-2035 2014-2035 Average Annual
2014-2035
U.S. and Canada 3.2 0.2 0.3 - 3.6 0.2 U.S. 2.8 - 0.3 - 3.1 0.1 Canada 0.3 0.2 - - 0.5 0.0 Central 1.0 - - - 1.0 0.0 Midwest 0.3 - 0.1 - 0.4 0.0 Northeast 0.9 - 0.2 - 1.1 0.0 Offshore - - - - - - Southeast - - - - - - Southwest 0.7 - - - 0.7 0.0 Western - - - - - - Arctic - - - - - -

12 The INGAA Foundation Inc.
Inter-Regional Crude Oil and Lease Condensate Pipeline Capacity Added in the Base Case (Million Bbl/d)
Originating Region 2014-2020 2021-2025 2026-2030 2031-2035 2014-2035 Average Annual
2014-2035
U.S. and Canada 7.4 1.7 0.7 0.4 10.2 0.5 U.S. 5.2 - 0.3 - 5.4 0.2 Canada 2.2 1.7 0.4 0.4 4.7 0.2 Central 0.5 - 0.3 - 0.7 0.0 Midwest 2.7 - - - 2.7 0.1 Northeast 0.2 - - - 0.2 0.0 Offshore - - - - - - Southeast - - - - - - Southwest 1.7 - - - 1.7 0.1 Western - - - - - - Arctic - - - - - -

13 The INGAA Foundation Inc.
Summary of Capital Expenditures in the Base Case

14 The INGAA Foundation Inc.
Pipeline Miles, Compression, and Capital Expenditures by Diameter Class and Type of Transport in the Base Case, 2014-2035 (Thousand Miles) 1" to <= 8" >8" to <= 16" >16" to <= 24" > 24" Total % of Total
Natural Gas 291.2 24.3 9.6 13.7 338.8 62% NGL 0.8 10.3 3.9 0.1 15.1 3% Crude Oil 171.6 2.0 2.5 12.5 188.6 35% Total 463.6 36.6 16.0 26.3 542.5 100%
(Thousand HP) 1" to <= 8" >8" to <= 16" >16" to <= 24" > 24" Total % of Total
Natural Gas 7,647 3,300 103 1,740 12,790 75% NGL 397 83 166 16 661 4% Crude Oil 336 79 243 2,847 3,505 21% Total 8,380 3,462 512 4,603 16,956 100%
(Billions of 2012$) 1" to <= 8" >8" to <= 16" >16" to <= 24" > 24" Total % of Total
Natural Gas $50.1 $40.9 $33.7 $78.3 $203.0 66% NGL $2.5 $18.4 $7.8 $0.2 $29.0 9% Crude Oil $13.8 $2.0 $7.1 $54.6 $77.5 25% Total $66.5 $61.3 $48.6 $133.2 $309.5 100%

15 The INGAA Foundation Inc.
Natural Gas Capital Expenditures for the Base Case Versus Prior Study Values
Comparison of Natural Gas Capital Expenditures in Current Study Versus Prior Study
*Capital expenditures reported in Prior Study were converted from 2010$ to 2012$ using a 4% inflation factor.
**NA refers to Not Available.

16 The INGAA Foundation Inc.
Natural Gas Metrics for the Base Case in Current Study Versus Prior Study Values
Current Study,
2014-2035 Current Study
Average Annual Prior Study, 2011-2035
Prior Study Average Annual
Gas Well Completions (1000s) 307 14 729 29 Oil Well Completions (1000s) 914 42 777 31 Total Well Completions (1000s) 1,221 56 1,506 60 Miles of Transmission Mainline (1000s) 18.6 0.8 35.6 1.4 Miles of Laterals to/from Power Plants, Storage Fields and Processing Plants (1000s) 17.1 0.8 13.9 0.6
Miles of Gas Gathering Line (1000s) 303.1 13.8 414 16.5 Inch-Miles of Transmission Mainline (1000s) 568 26 1,043 42 Inch-Miles of Laterals to/from Power Plants, Storage Fields and Processing Plants (1000s) 279 13 304 12
Inch-Miles of Gathering Line (1000s) 1,095 50 1,518 61 Compression for Pipelines (1000 HP) 4,388 199 4,946 197 Compression for Gathering Line (1000 HP) 8,402 382 NA NA Gas Storage (Bcf Working Gas) 823 37 589 24 Processing Capacity (Bcfd) 34.2 1.6 32.5 1.3 LNG Export Facilities (Bcfd) 9.3 0.4 NA NA
17 The INGAA Foundation Inc.
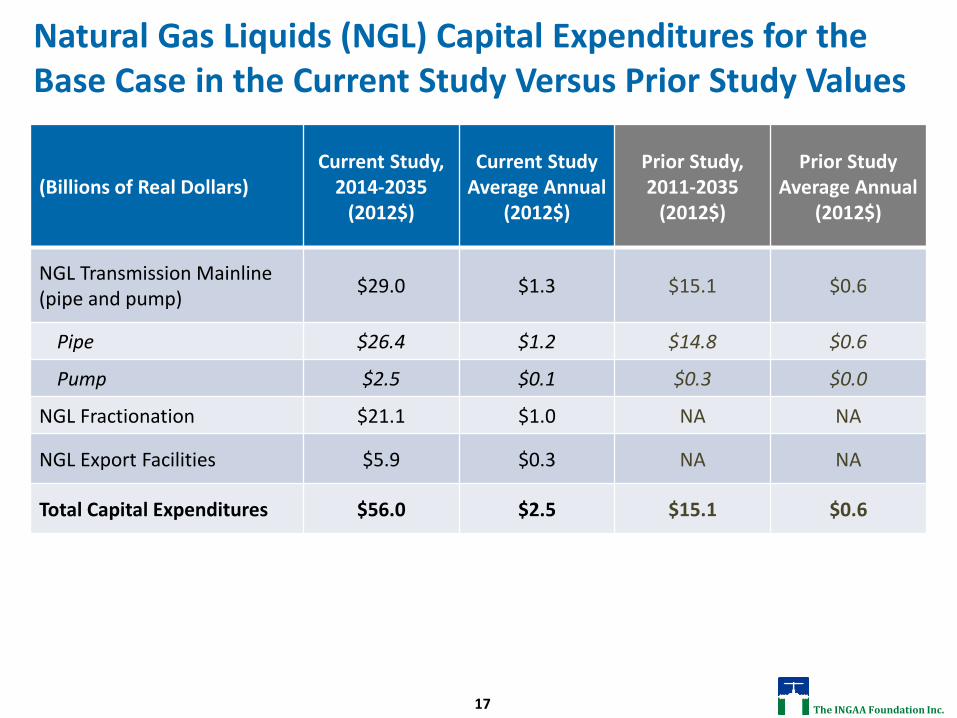
Natural Gas Liquids (NGL) Capital Expenditures for the Base Case in the Current Study Versus Prior Study Values
(Billions of Real Dollars) Current Study,
2014-2035 (2012$)
Current Study Average Annual
(2012$)
Prior Study, 2011-2035
(2012$)
Prior Study Average Annual
(2012$)
NGL Transmission Mainline (pipe and pump) $29.0 $1.3 $15.1 $0.6
Pipe $26.4 $1.2 $14.8 $0.6
Pump $2.5 $0.1 $0.3 $0.0
NGL Fractionation $21.1 $1.0 NA NA
NGL Export Facilities $5.9 $0.3 NA NA
Total Capital Expenditures $56.0 $2.5 $15.1 $0.6

18 The INGAA Foundation Inc.
Natural Gas Liquids Metrics for the Base Case in the Current Study Versus Prior Study Values
Current Study,
2014-2035 Current Study
Average Annual Prior Study, 2011-2035
Prior Study Average Annual
Miles of NGL Transmission Mainline (1000s) 15.1 0.7 12.5 0.5 Inch-Miles of NGL Transmission Mainline (1000s) 220 10 164 7 Pump for NGL Transmission Mainline (1000 HP) 661 30 166 7
Fractionation Capacity Built (MBOE/d) 3,326 151 NA NA
NGL Export Facility Capacity Built (MBOE/d) 1,402 64 NA NA

19 The INGAA Foundation Inc.
Crude Oil Capital Expenditures for the Base Case in the Current Study Versus Prior Study Values
(Billions of Real Dollars) Current Study,
2014-2035 (2012$)
Current Study Average Annual
(2012$)
Prior Study, 2011-2035
(2012$)
Prior Study Average Annual
(2012$)
Crude Oil Gathering Line (pipe only) $12.7 $0.6 NA NA
Crude Oil Lease Equipment $192.5 $8.8 NA NA Crude Oil Transmission Mainline (pipe and pump) $63.3 $2.9 $32.6 $1.4
Pipe $53.5 $2.4 $31.2 $1.3
Pump $9.8 $0.4 $1.5 $0.1
Crude Oil Storage Laterals $1.5 $0.1 NA NA
Crude Oil Storage Tanks $1.7 $0.1 NA NA
Total Capital Expenditures $271.8 $12.4 $32.6 $1.4

20 The INGAA Foundation Inc.
Crude Oil Metrics for the Base Case in the Current Study Versus Prior Study Values
Current Study,
2014-2035 Current Study
Average Annual Prior Study, 2011-2035
Prior Study Average Annual
Oil Well Completions (1000s) 914 42 777 31
Miles of Crude Oil Gathering Line (1000s) 171.6 7.8 NA NA
Miles of Transmission Mainline (1000s) 16.2 0.7 19.3 0.8
Miles of Crude Oil Storage Laterals (1000s) 0.8 0 NA NA
Inch-Miles of Crude Oil Gathering Line (1000s) 379 17 NA NA
Inch-Miles of Transmission Mainline (1000s) 432 20 355 15 Inch-Miles of Crude Oil Storage Laterals (1000s) 14 1 NA NA
Pump for Transmisson Mainline (1000 HP) 3,505 159 754 31
Crude Storage Capacity Built (MMBbl) 133 6 NA NA
Number of Crude Storage Tanks Built 26,504 1,205 NA NA
Number of Crude Storage Farms Built 39 2 NA NA

21 The INGAA Foundation Inc.
Assumptions for Low Growth Case
Economic growth roughly 30% below Base Case levels.
Gas and oil resource base unchanged, but capital availability reduced, limiting resource development.
Oil prices fall to $75 per barrel due to reduced economic activity, creating less incentive for “oil-gas price arbitrage” investments. LNG exports, and petrochemical activities, including ammonia production, ethylene production, and propylene production don’t fair as well in this environment. U.S. and Canada LNG exports are only 4 Bcfd by 2022, versus the Base Level of 9 Bcfd.
Oii and NGL development not as robust because of lower oil prices.
Electric load grows more modestly at an average of 1.0% per year, driving less interest in gas-fired power generation.
As in the Base Case, midstream infrastructure development driven by supply and demand trends and the cost assumptions for the midstream infrastructure are the same as in the Base Case. But, less infrastructure is needed due to the reduced market development.

22 The INGAA Foundation Inc.
U.S. and Canadian Natural Gas Production (Bcfd): An Example of How the Low Growth Case Impacts Markets
U.S and Canada gas production in the Low Growth Case grows by a little less than 1% per year, versus 1.8% per year in the Base Case. – Total gas production in the Low Growth Case is projected to be 22 Bcfd lower than the Base Case by 2035.
Offshore
Tight
Shale
0
10
20
30
40
50
60
70
80
90
100
110
120
130
2008
2009
2010
2011
2012
2013
2014
2015
2016
2017
2018
2019
2020
2021
2022
2023
2024
2025
2026
2027
2028
2029
2030
2031
2032
2033
2034
2035
Conventional Onshore
Reference Case Low Growth Case
Offshore
Tight
Shale
0
10
20
30
40
50
60
70
80
90
100
110
120
130
2008
2009
2010
2011
2012
2013
2014
2015
2016
2017
2018
2019
2020
2021
2022
2023
2024
2025
2026
2027
2028
2029
2030
2031
2032
2033
2034
2035
Coalbed Methane
Conventional Onshore

23 The INGAA Foundation Inc.
Total Capital Expenditures: Low Growth Case Versus the Base Case
All measures of investment,
including dollar amounts and
metrics supporting infrastructure
development are down by about 30 percent in the Low
Growth Case, versus the Base Case.
24 The INGAA Foundation Inc.
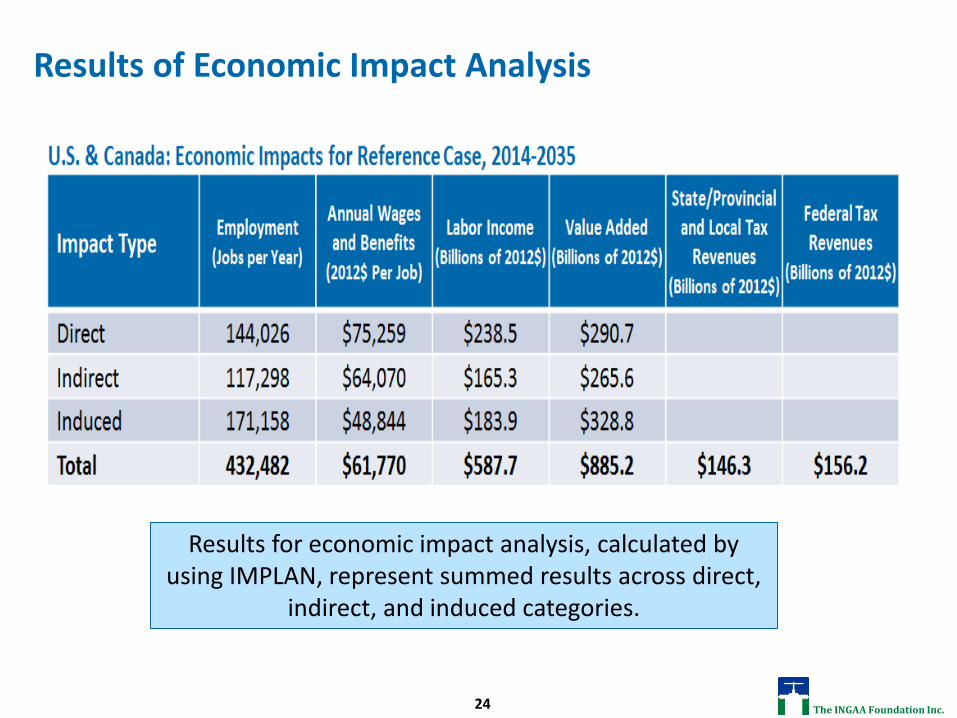
Results of Economic Impact Analysis
Results for economic impact analysis, calculated by using IMPLAN, represent summed results across direct,
indirect, and induced categories.

25 The INGAA Foundation Inc.
Results of Economic Impact Analysis (Continued)

26 The INGAA Foundation Inc.
Results of Economic Impact Analysis (Continued)

27 The INGAA Foundation Inc.
Results of Economic Impact Analysis (Continued)

28 The INGAA Foundation Inc.
Conclusions The results of this study depict a robust environment for midstream infrastructure development over the
entire projection period.
$641 billion of investment in midstream infrastructure development in the Base Case versus $465 billion of investment in the Low Growth Case.
The Base Case yields $885 billion of value added to the U.S. and Canadian economies as a result of the midstream infrastructure development.
The new infrastructure development provides 312,000 to 433,000 jobs on average per year through 2035.
Economic benefits are widespread across all parts of the economy and geographically widespread.
Investment in pipelines is $310 billion in the Base Case, with 43 Bcfd of incremental gas transport capability, 10.2 million Bbl/d of oil transport capability, and 3.6 million Bbl/d of NGL transport capability added.
Almost 68,000 miles of new transmission pipeline and laterals built through 2035, 35,700 for gas transport, 15,100 miles for NGL transport, and 17,000 for oil transport.
Additionally, almost 475,000 miles of new gathering line will be needed to move incremental production from just over 1.2 million new oil and gas wells through 2035. Roughly two-thirds of the gathering lines are gathering gas production while the remainder of the line is gathering oil and condensate production.
The new pipeline and gathering assets include almost 17 million horsepower of pumping and compression capability at a cost of over $47 billion.
Investment in new processing and fractionation capacity totals almost $50 billion.
Investment in lease equipment totals well over $200 billion. This equipment includes separators, dehydrators, pumps, valves, flowlines, and tanks.
Investment in gas and oil storage totals roughly $15 billion.
Investment in oil, NGL, and LNG export facilities totals almost $50 billion.

29 The INGAA Foundation Inc.
Kevin Petak [email protected]
703-218-2753
Rich Hoffmann [email protected]
202.216.5909
Cathy Landry [email protected]
202.216.5913