Norman Koren Imatest LLC Boulder, Colorado … · May. 18, 2006 P. 2 Imatest : introduction Norman...
35
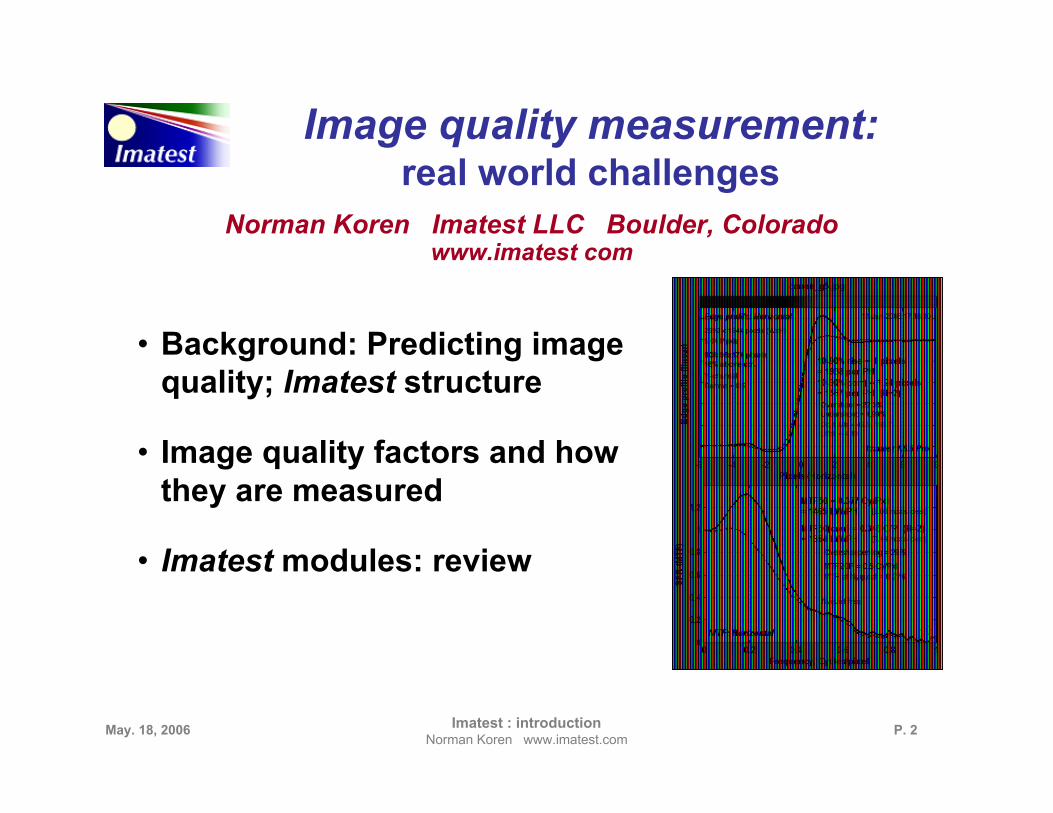
P. 2 May. 18, 2006 Imatest : introduction Norman Koren www.imatest.com Image quality measurement: real world challenges Norman Koren Imatest LLC Boulder, Colorado www.imatest com • Background: Predicting image quality; Imatest structure • Image quality factors and how they are measured • Imatest modules: review
Transcript of Norman Koren Imatest LLC Boulder, Colorado … · May. 18, 2006 P. 2 Imatest : introduction Norman...
P. 2May. 18, 2006 Imatest : introductionNorman Koren www.imatest.com
Image quality measurement:real world challenges
Norman Koren Imatest LLC Boulder, Coloradowww.imatest com
• Background: Predicting imagequality; Imatest structure
• Image quality factors and howthey are measured
• Imatest modules: review
P. 3
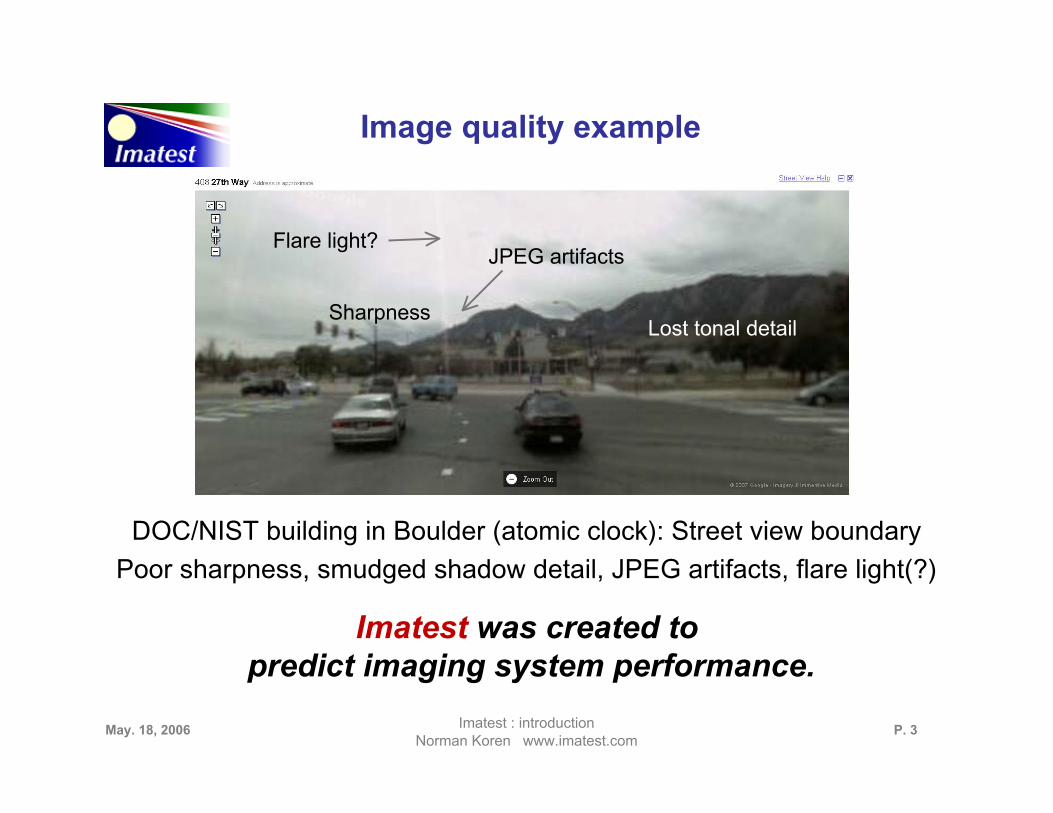
Image quality example
May. 18, 2006 Imatest : introductionNorman Koren www.imatest.com
DOC/NIST building in Boulder (atomic clock): Street view boundary
Poor sharpness, smudged shadow detail, JPEG artifacts, flare light(?)
Imatest was created to predict imaging system performance.
Lost tonal detailSharpness
Flare light?JPEG artifacts
P. 4May. 18, 2006 Imatest : introductionNorman Koren www.imatest.com
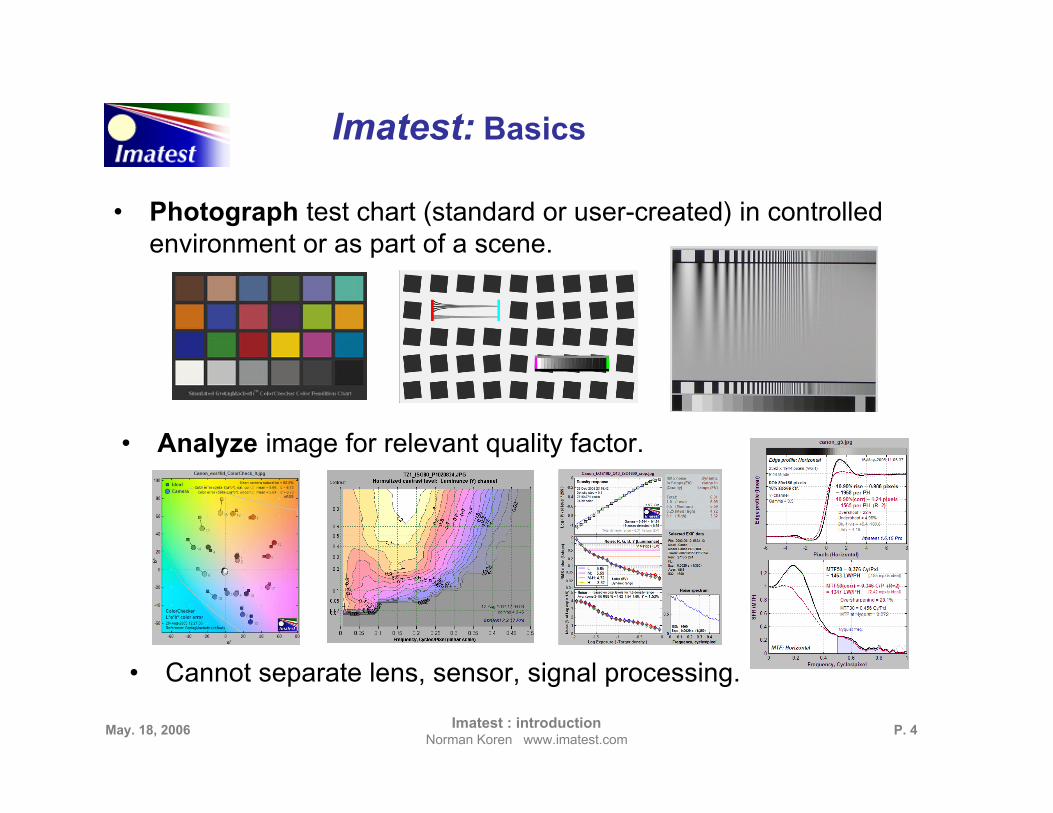
Imatest: Basics
• Photograph test chart (standard or user-created) in controlledenvironment or as part of a scene.
• Cannot separate lens, sensor, signal processing.
• Analyze image for relevant quality factor.
P. 5May. 18, 2006 Imatest : introductionNorman Koren www.imatest.com
Imatest: Background
• Created to enable individual photographers totest lenses and cameras.
– Lens sharpness?
– Camera dynamic range?
– Color reproduction accuracy?
• Widely adopted by industry: mobile imagingand many others.
• Compiled Matlab.
• Downloaded from www.imatest.com.
• Modules analyze images of standard targets.
P. 6May. 18, 2006 Imatest : introductionNorman Koren www.imatest.com
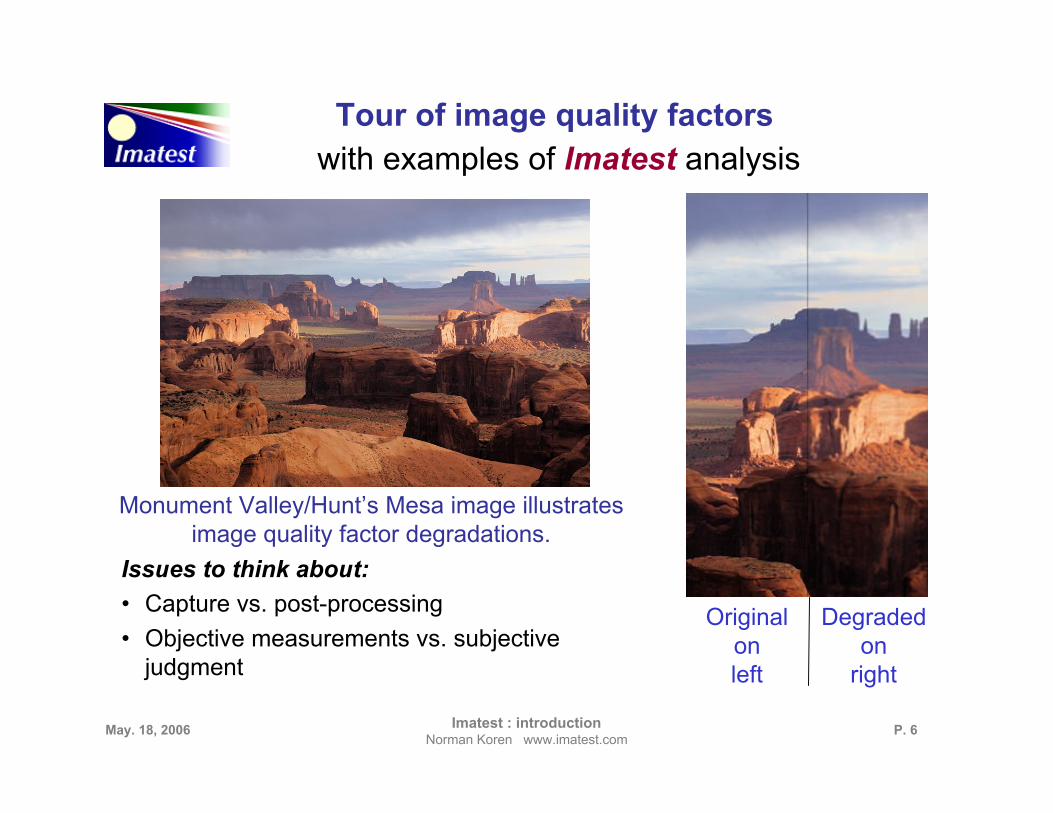
Tour of image quality factorswith examples of Imatest analysis
Monument Valley/Hunt’s Mesa image illustratesimage quality factor degradations.
Originalonleft
Degradedon
right
Issues to think about:
• Capture vs. post-processing
• Objective measurements vs. subjectivejudgment
P. 7May. 18, 2006 Imatest : introductionNorman Koren www.imatest.com
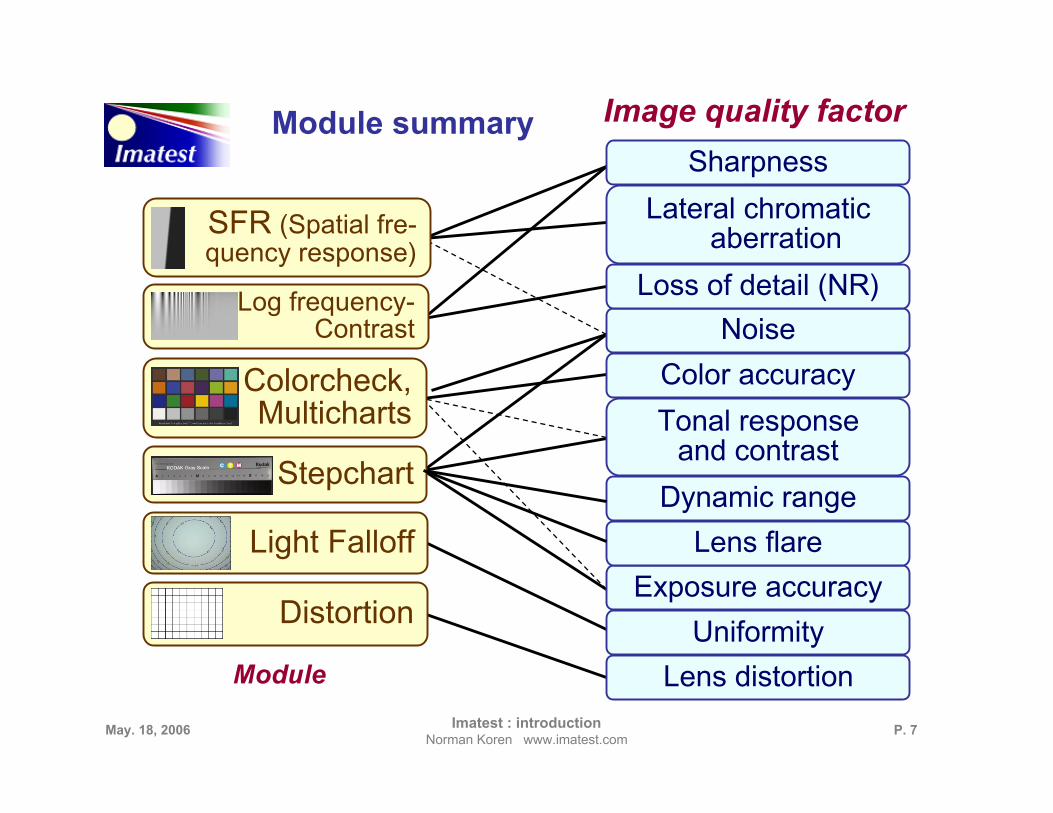
Module summary Image quality factor
Sharpness
Color accuracy
Tonal responseand contrast
Dynamic range
Exposure accuracy
Uniformity
Lens distortion
Lateral chromaticaberration
Noise
Colorcheck,Multicharts
SFR (Spatial fre-quency response)
Stepchart
Distortion
Light Falloff
Log frequency-Contrast
Loss of detail (NR)
Module
Lens flare

P. 8May. 18, 2006 Imatest : introductionNorman Koren www.imatest.com
Spatial frequency response (SFR);Modulation transfer function (MTF)
• Upper: Sine and bar patterns:original and blurred.
• Middle: Level of the blurred barpattern (red curve). Contrastdecreases at high spatialfrequencies.
• Lower: the corresponding MTF(SFR) curve (blue curve).
• Low frequency MTF is definedto be 1 (100%). MTF can belarger than 1.
• Strongly affected by signalprocessing (sharpening).
Measuring sharpness
Spatial frequency
P. 9May. 18, 2006 Imatest : introductionNorman Koren www.imatest.com
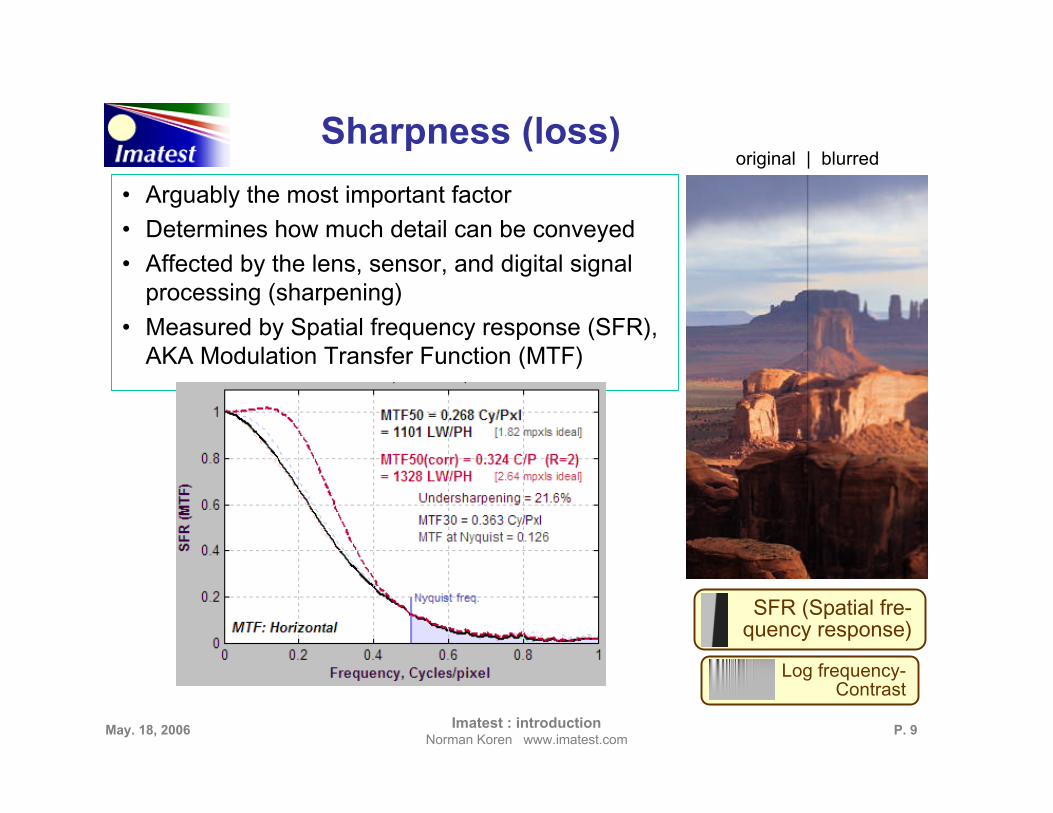
Sharpness (loss)
• Arguably the most important factor
• Determines how much detail can be conveyed
• Affected by the lens, sensor, and digital signalprocessing (sharpening)
• Measured by Spatial frequency response (SFR),AKA Modulation Transfer Function (MTF)
SFR (Spatial fre-quency response)
Log frequency-Contrast
original | blurred
P. 10May. 18, 2006 Imatest : introductionNorman Koren www.imatest.com
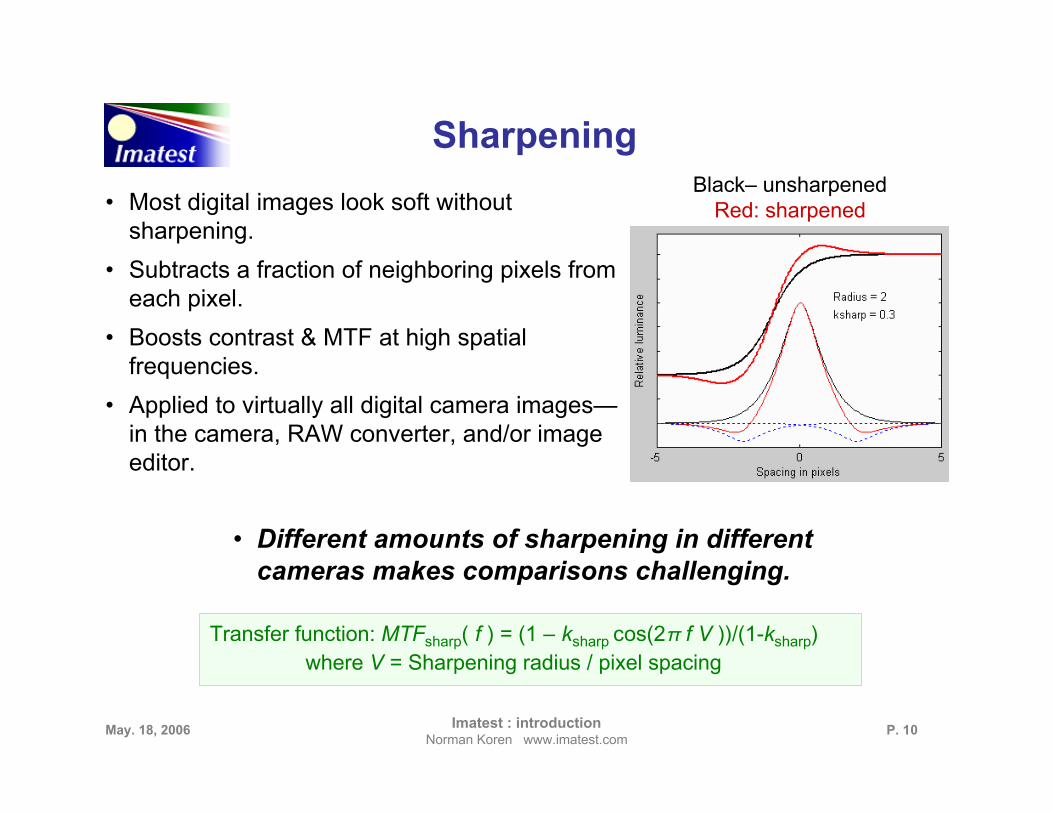
Sharpening
• Most digital images look soft withoutsharpening.
• Subtracts a fraction of neighboring pixels fromeach pixel.
• Boosts contrast & MTF at high spatialfrequencies.
• Applied to virtually all digital camera images—in the camera, RAW converter, and/or imageeditor.
• Different amounts of sharpening in differentcameras makes comparisons challenging.
Transfer function: MTFsharp( f ) = (1 – ksharp cos(2π f V ))/(1-ksharp)where V = Sharpening radius / pixel spacing
Black– unsharpenedRed: sharpened
P. 11May. 18, 2006 Imatest : introductionNorman Koren www.imatest.com
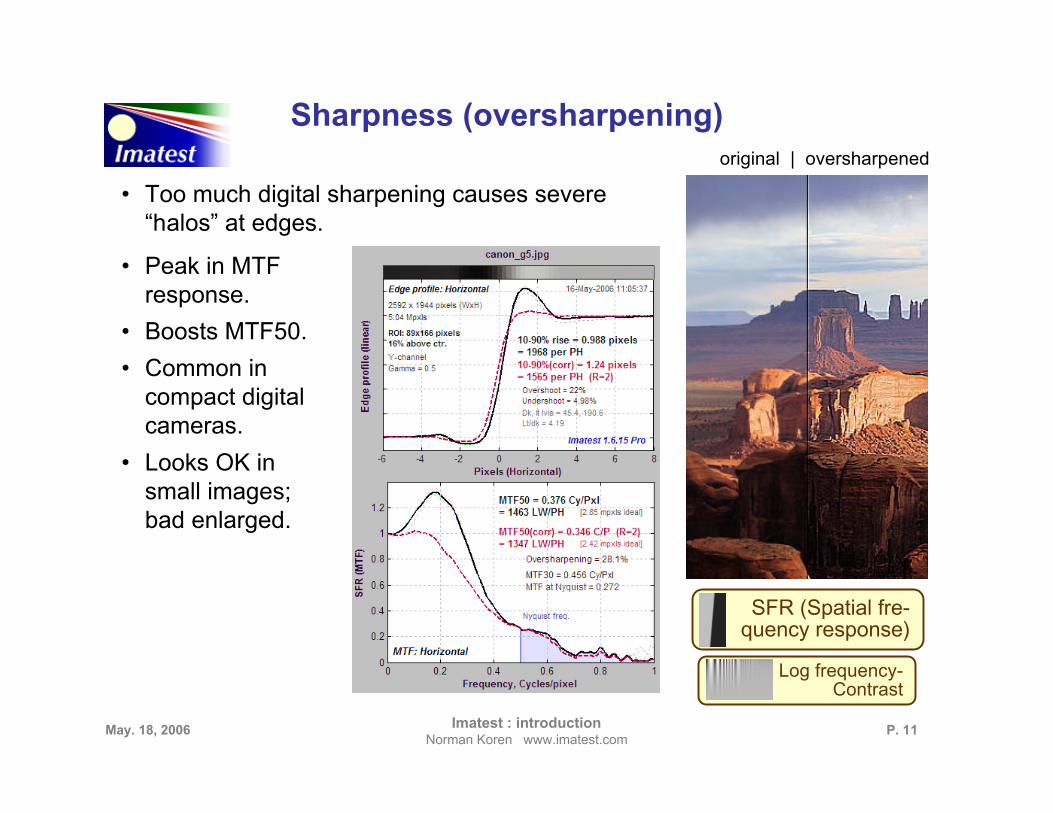
Sharpness (oversharpening)
• Too much digital sharpening causes severe“halos” at edges.
SFR (Spatial fre-quency response)
• Peak in MTFresponse.
• Boosts MTF50.
• Common incompact digitalcameras.
• Looks OK insmall images;bad enlarged.
Log frequency-Contrast
original | oversharpened
P. 12May. 18, 2006 Imatest : introductionNorman Koren www.imatest.com
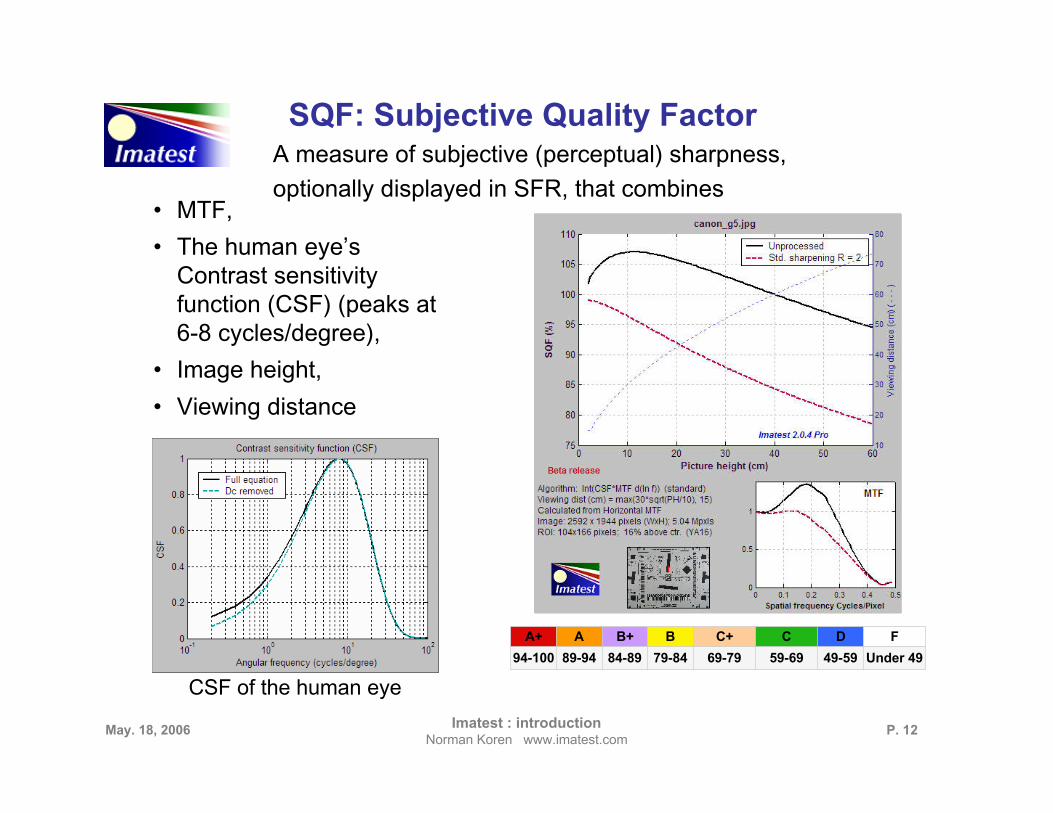
SQF: Subjective Quality FactorA measure of subjective (perceptual) sharpness,
optionally displayed in SFR, that combines• MTF,
• The human eye’sContrast sensitivityfunction (CSF) (peaks at6-8 cycles/degree),
• Image height,
• Viewing distance
A+ A B+ B C+ C D F
94-100 89-94 84-89 79-84 69-79 59-69 49-59 Under 49
CSF of the human eye
P. 13May. 18, 2006 Imatest : introductionNorman Koren www.imatest.com
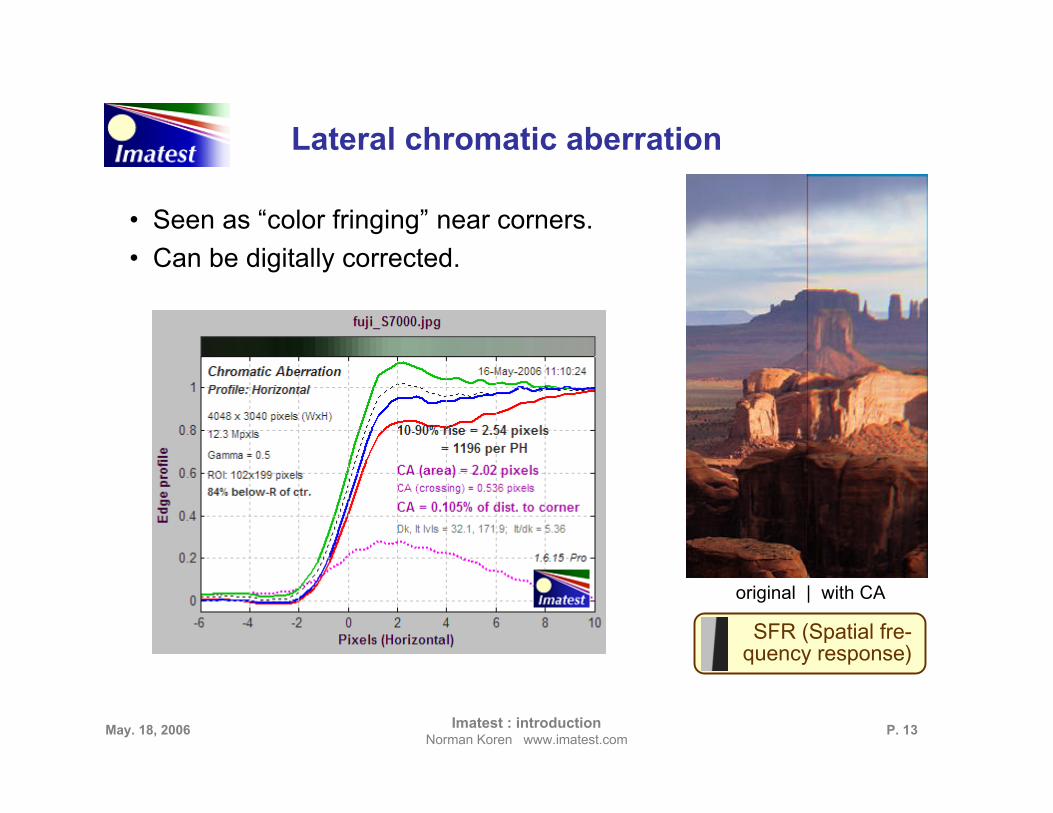
Lateral chromatic aberration
• Seen as “color fringing” near corners.
• Can be digitally corrected.
SFR (Spatial fre-quency response)
original | with CA
P. 14May. 18, 2006 Imatest : introductionNorman Koren www.imatest.com
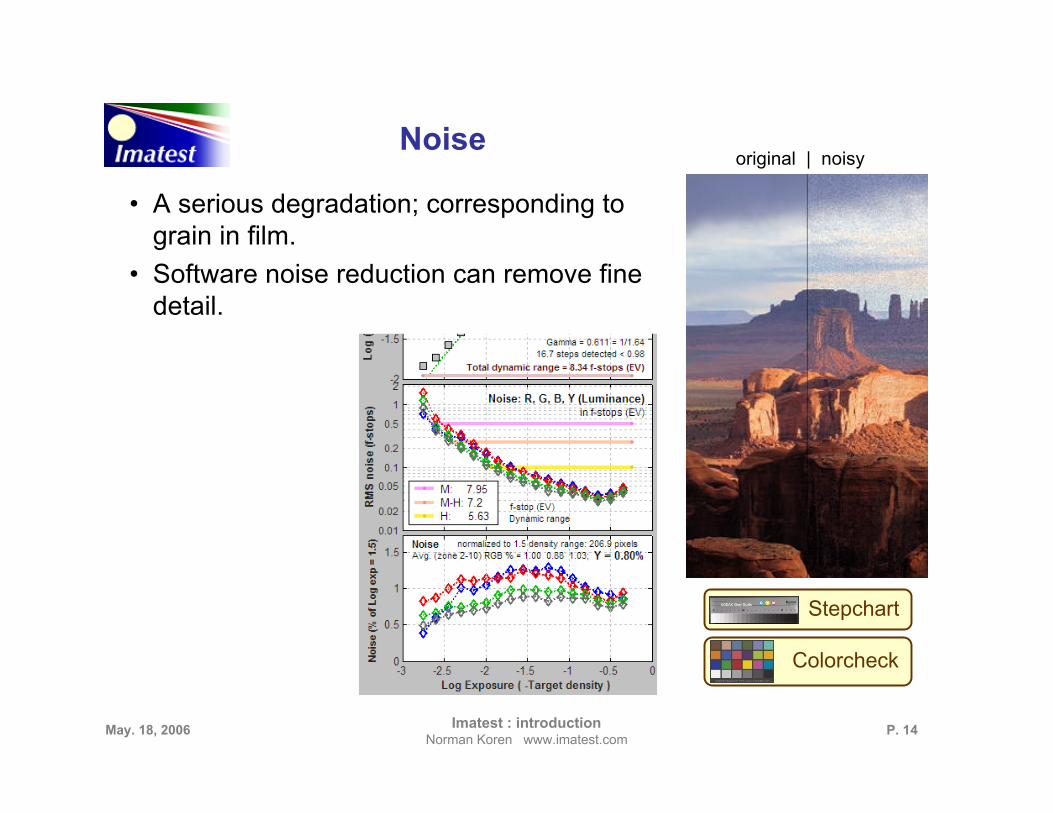
Noise
• A serious degradation; corresponding tograin in film.
• Software noise reduction can remove finedetail.
Colorcheck
Stepchart
original | noisy
P. 15May. 18, 2006 Imatest : introductionNorman Koren www.imatest.com
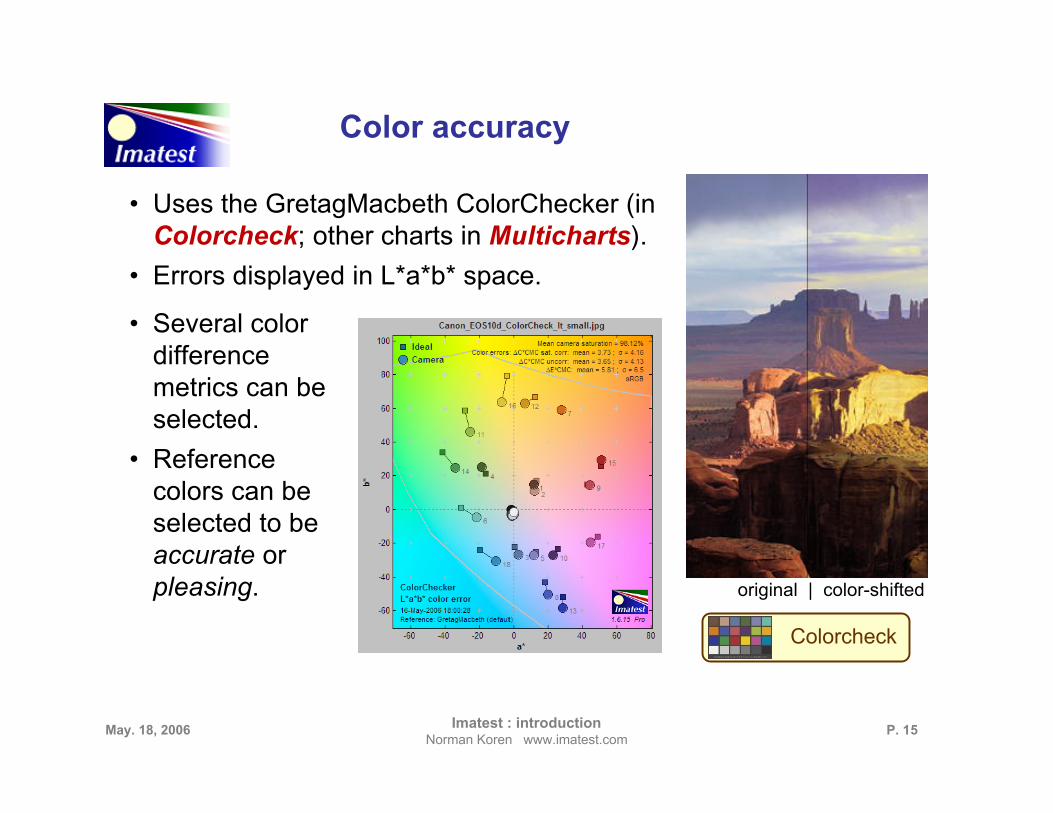
Color accuracy
• Uses the GretagMacbeth ColorChecker (inColorcheck; other charts in Multicharts).
• Errors displayed in L*a*b* space.
Colorcheck
original | color-shifted
• Several colordifferencemetrics can beselected.
• Referencecolors can beselected to beaccurate orpleasing.
P. 16May. 18, 2006 Imatest : introductionNorman Koren www.imatest.com
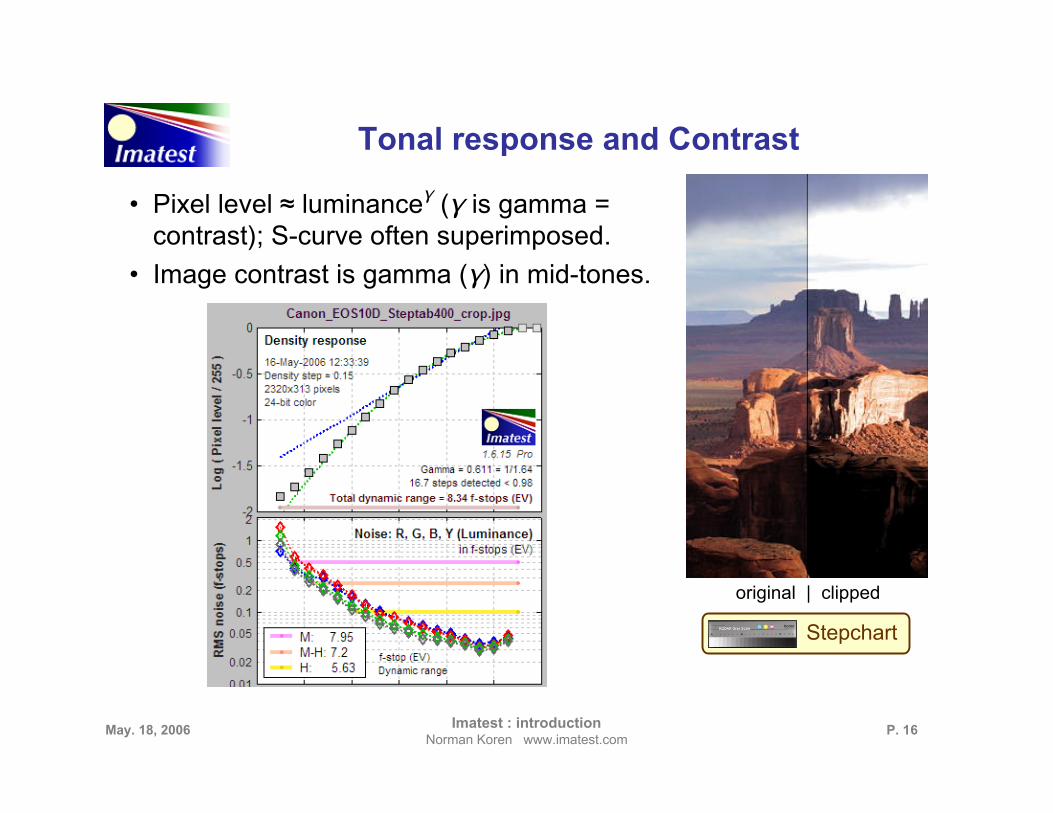
Tonal response and Contrast
• Pixel level ≈ luminanceγ (γ is gamma =contrast); S-curve often superimposed.
• Image contrast is gamma (γ) in mid-tones.
Stepchart
original | clipped
P. 17May. 18, 2006 Imatest : introductionNorman Koren www.imatest.com
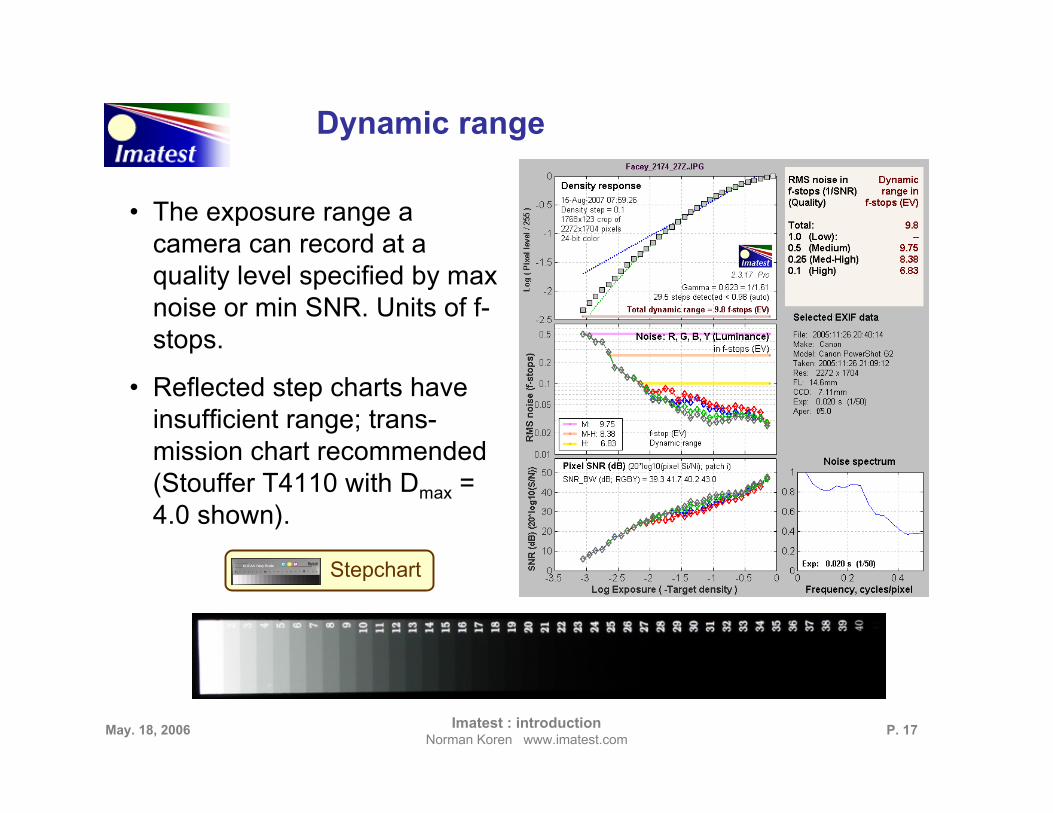
Dynamic range
• The exposure range acamera can record at aquality level specified by maxnoise or min SNR. Units of f-stops.
• Reflected step charts haveinsufficient range; trans-mission chart recommended(Stouffer T4110 with Dmax =4.0 shown).
Stepchart
P. 18May. 18, 2006 Imatest : introductionNorman Koren www.imatest.com
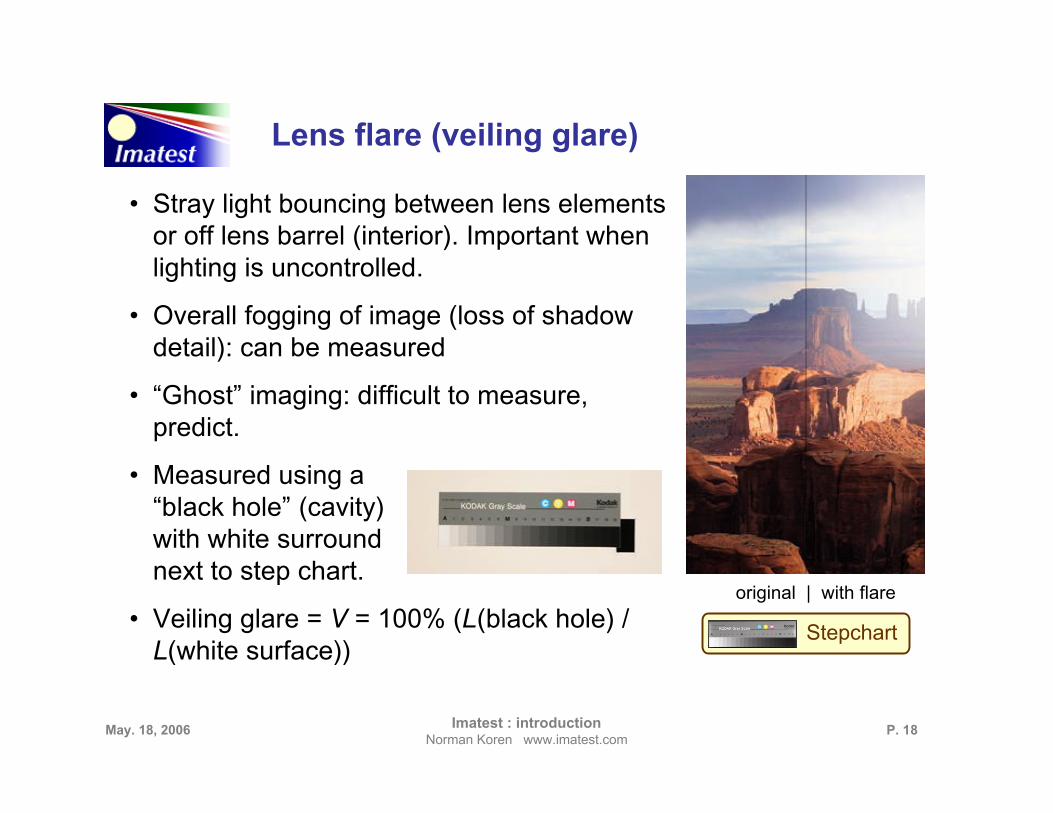
Lens flare (veiling glare)
• Stray light bouncing between lens elementsor off lens barrel (interior). Important whenlighting is uncontrolled.
• Overall fogging of image (loss of shadowdetail): can be measured
• “Ghost” imaging: difficult to measure,predict.
• Measured using a“black hole” (cavity)with white surroundnext to step chart.
• Veiling glare = V = 100% (L(black hole) /L(white surface))
Stepchart
original | with flare
P. 19May. 18, 2006 Imatest : introductionNorman Koren www.imatest.com
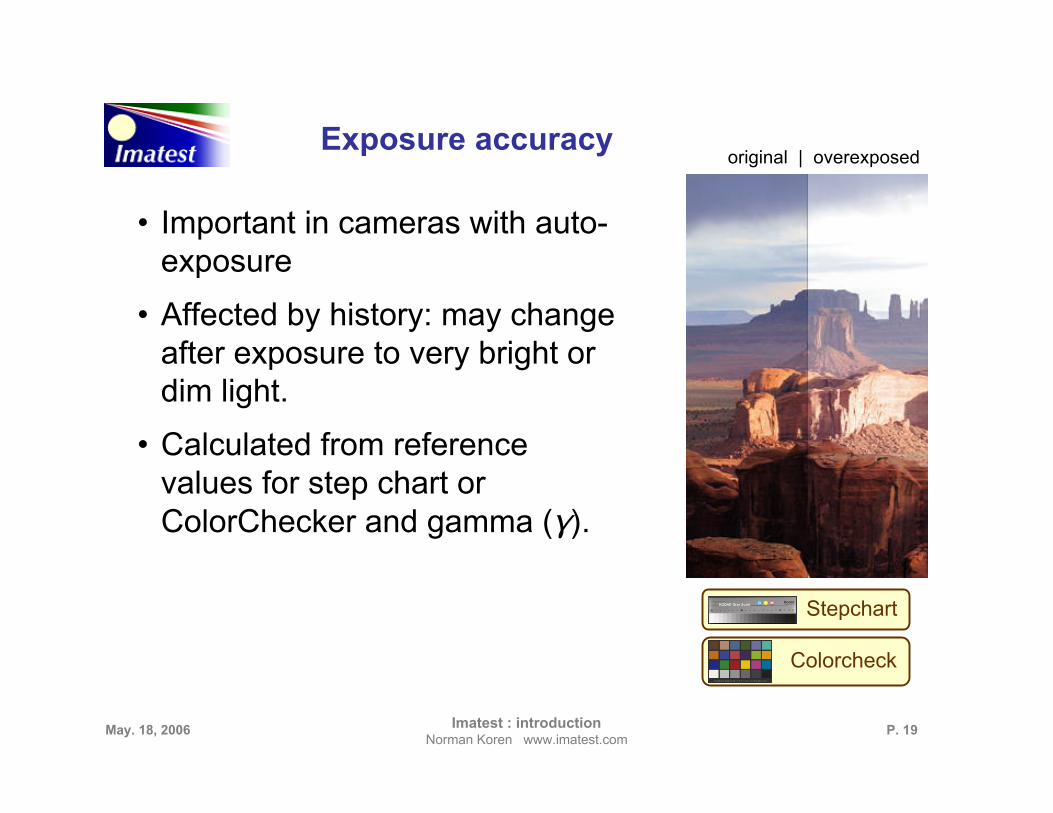
Exposure accuracy
• Important in cameras with auto-exposure
• Affected by history: may changeafter exposure to very bright ordim light.
• Calculated from referencevalues for step chart orColorChecker and gamma (γ).
Stepchart
Colorcheck
original | overexposed
P. 20May. 18, 2006 Imatest : introductionNorman Koren www.imatest.com
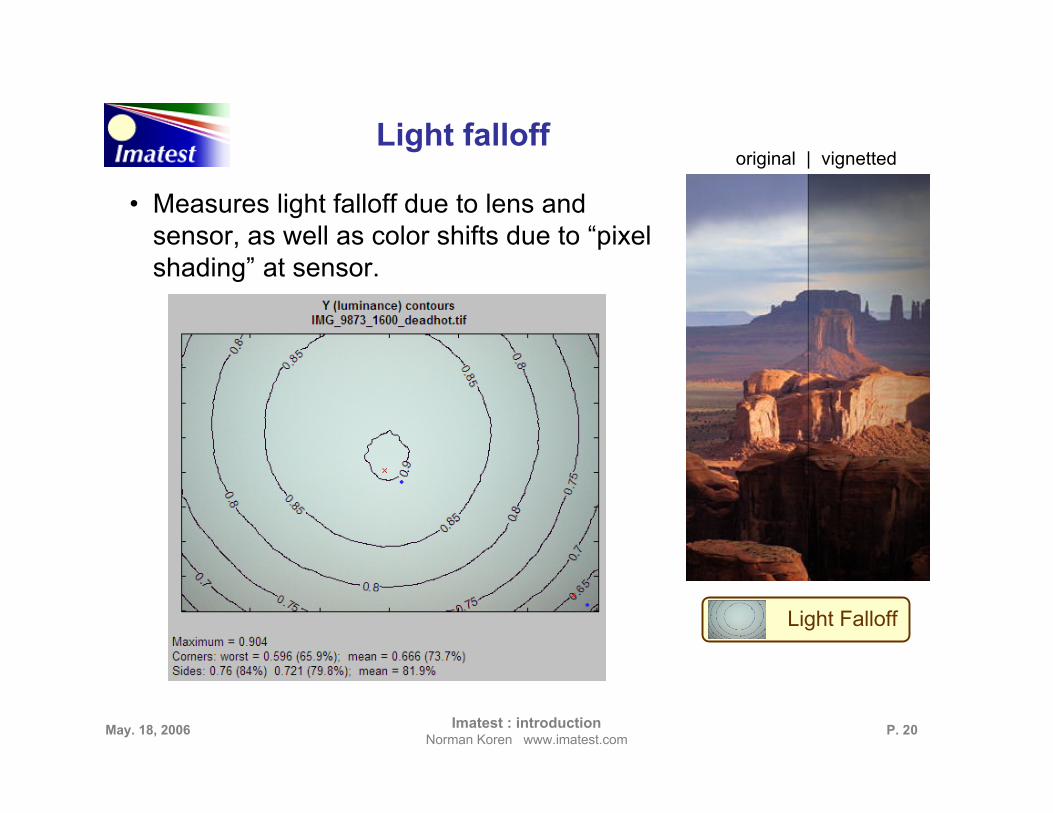
Light falloff
• Measures light falloff due to lens andsensor, as well as color shifts due to “pixelshading” at sensor.
Light Falloff
original | vignetted
P. 21May. 18, 2006 Imatest : introductionNorman Koren www.imatest.com
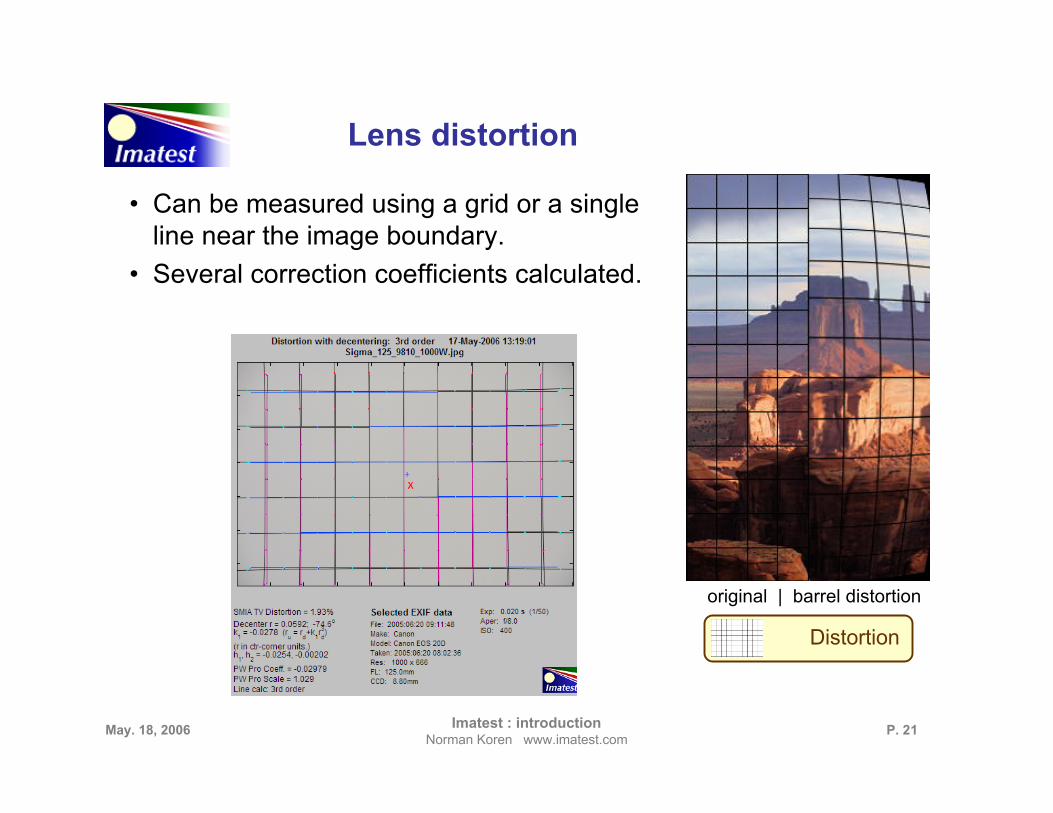
Lens distortion
• Can be measured using a grid or a singleline near the image boundary.
• Several correction coefficients calculated.
Distortion
original | barrel distortion
P. 22May. 18, 2006 Imatest : introductionNorman Koren www.imatest.com
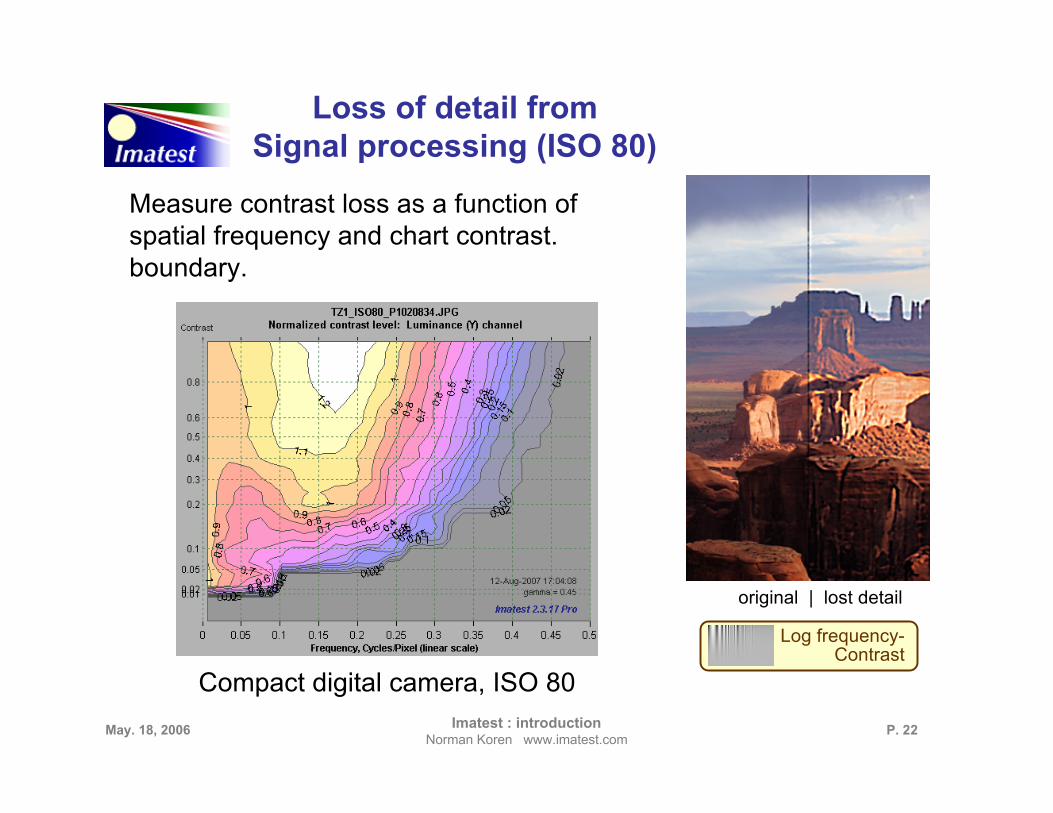
Loss of detail fromSignal processing (ISO 80)
Measure contrast loss as a function ofspatial frequency and chart contrast.boundary.
Log frequency-Contrast
Compact digital camera, ISO 80
original | lost detail
P. 23May. 18, 2006 Imatest : introductionNorman Koren www.imatest.com
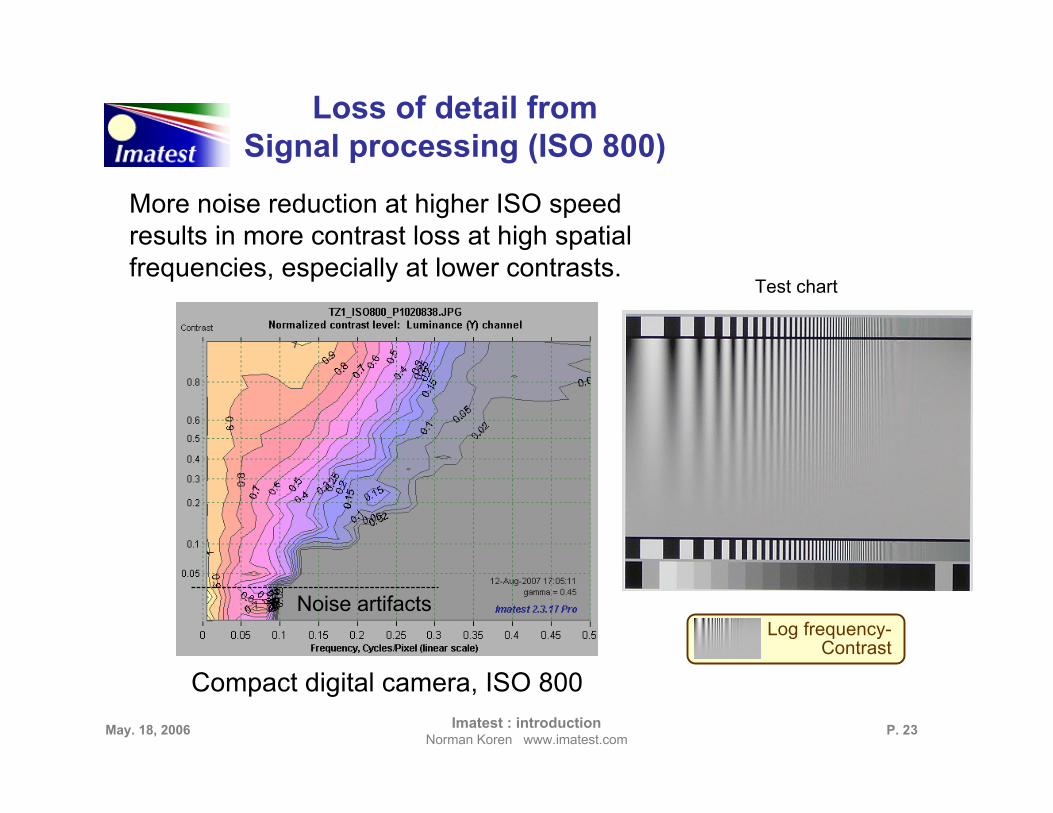
Loss of detail fromSignal processing (ISO 800)
More noise reduction at higher ISO speedresults in more contrast loss at high spatialfrequencies, especially at lower contrasts.
Log frequency-Contrast
Compact digital camera, ISO 800
Noise artifacts
Test chart
P. 24May. 18, 2006 Imatest : introductionNorman Koren www.imatest.com
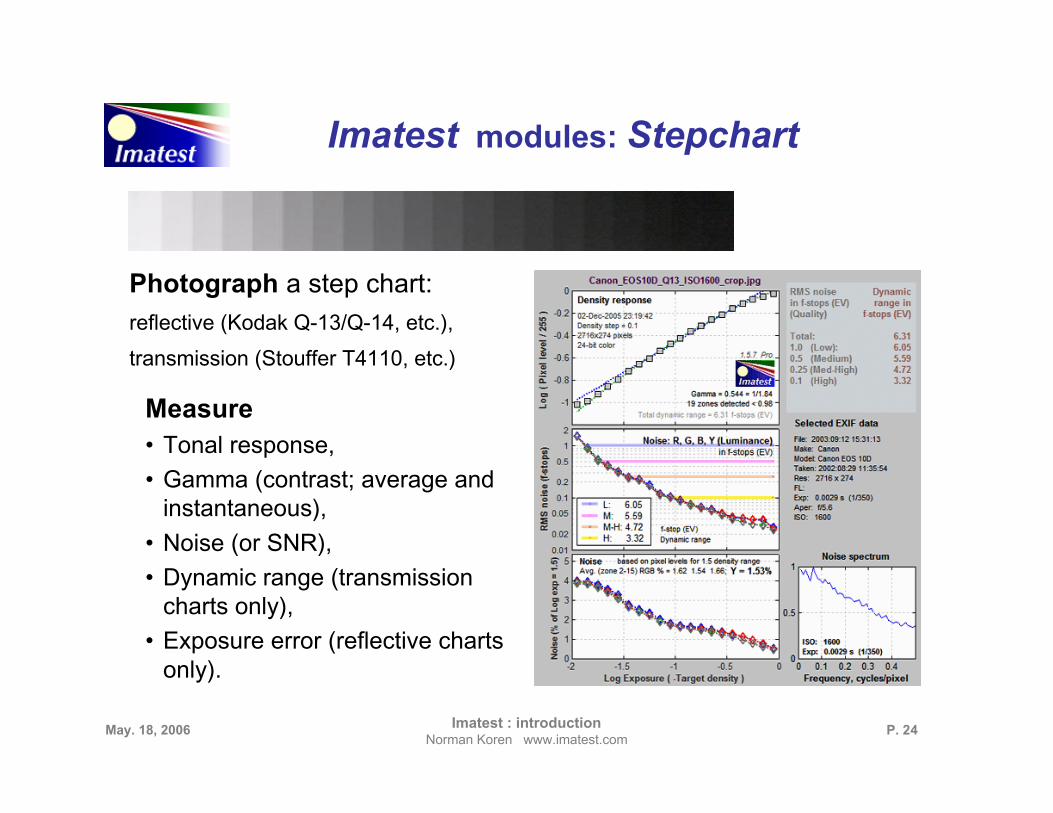
Imatest modules: Stepchart
Photograph a step chart:
reflective (Kodak Q-13/Q-14, etc.),
transmission (Stouffer T4110, etc.)
Measure• Tonal response,
• Gamma (contrast; average andinstantaneous),
• Noise (or SNR),
• Dynamic range (transmissioncharts only),
• Exposure error (reflective chartsonly).
P. 25May. 18, 2006 Imatest : introductionNorman Koren www.imatest.com
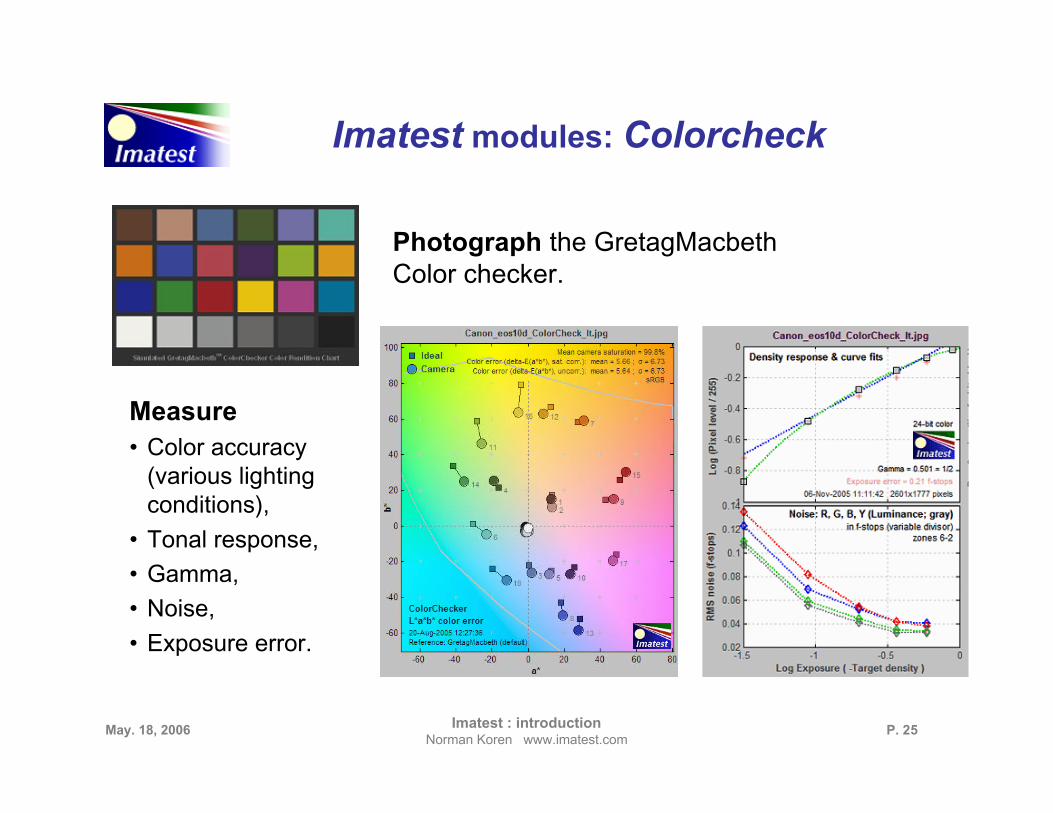
Imatest modules: Colorcheck
Photograph the GretagMacbethColor checker.
Measure• Color accuracy
(various lightingconditions),
• Tonal response,
• Gamma,
• Noise,
• Exposure error.
P. 26May. 18, 2006 Imatest : introductionNorman Koren www.imatest.com
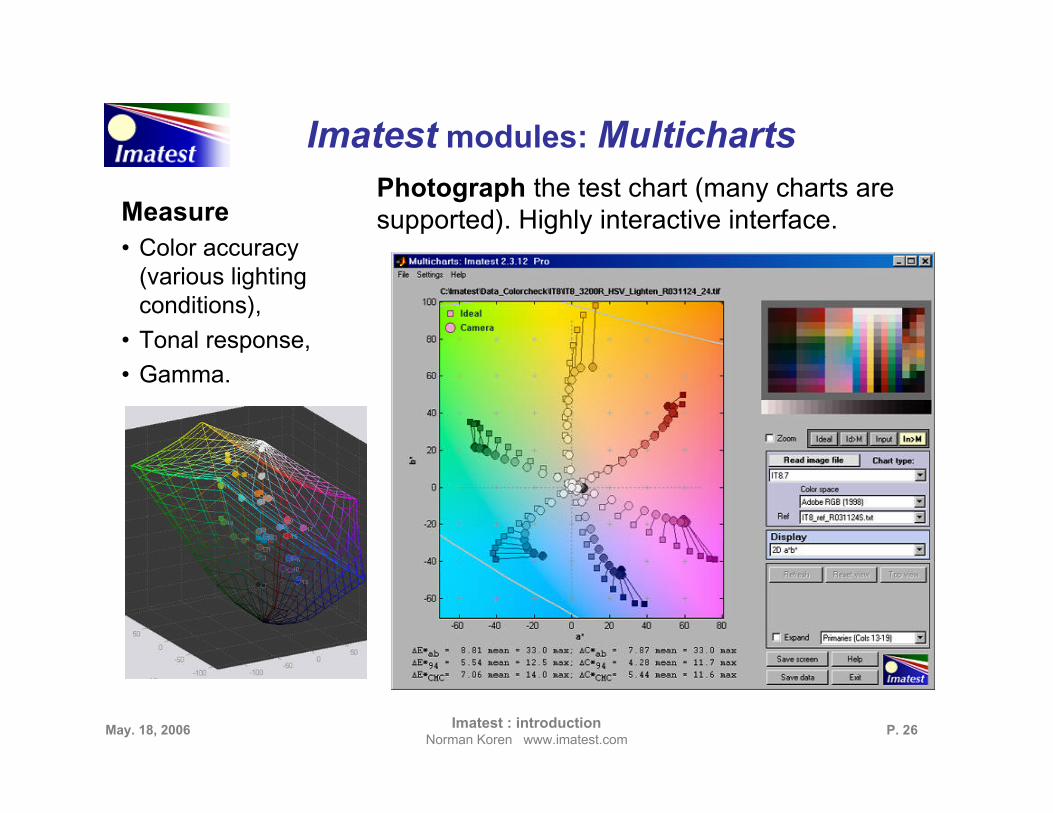
Imatest modules: MultichartsPhotograph the test chart (many charts aresupported). Highly interactive interface.Measure
• Color accuracy(various lightingconditions),
• Tonal response,
• Gamma.
P. 27May. 18, 2006 Imatest : introductionNorman Koren www.imatest.com
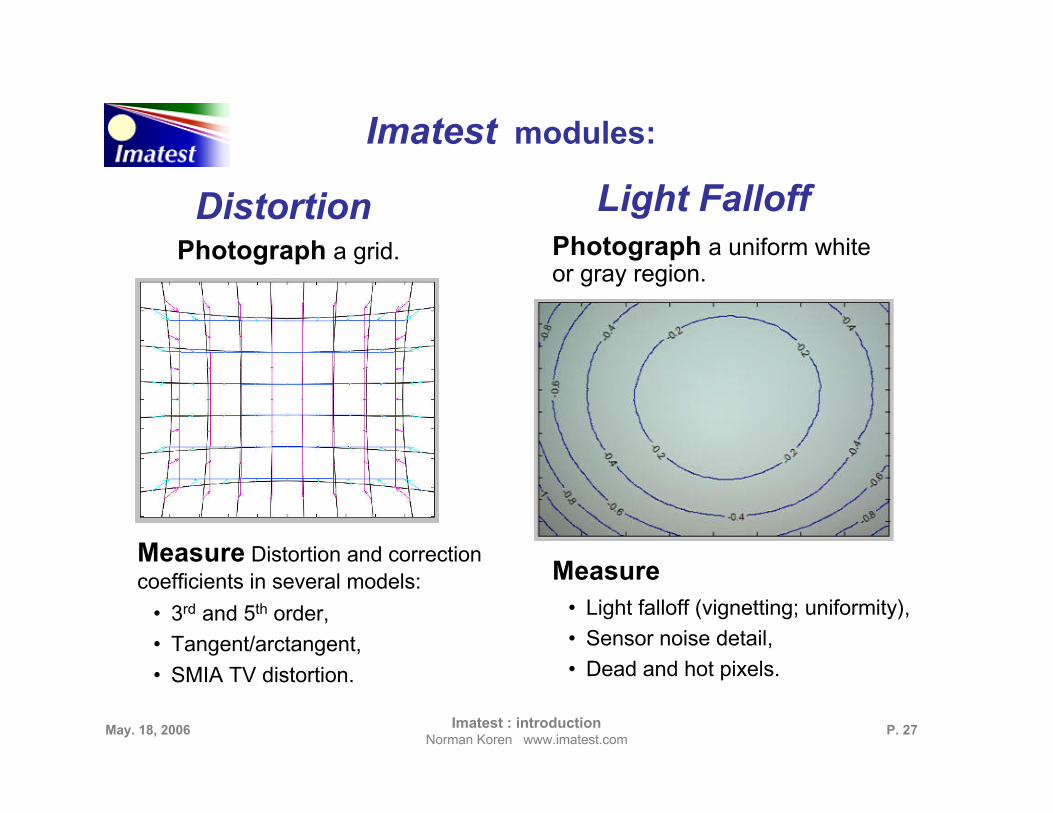
Imatest modules:
DistortionPhotograph a grid.
• 3rd and 5th order,
• Tangent/arctangent,
• SMIA TV distortion.
Measure Distortion and correctioncoefficients in several models:
Light FalloffPhotograph a uniform whiteor gray region.
• Light falloff (vignetting; uniformity),
• Sensor noise detail,
• Dead and hot pixels.
Measure
P. 28May. 18, 2006 Imatest : introductionNorman Koren www.imatest.com
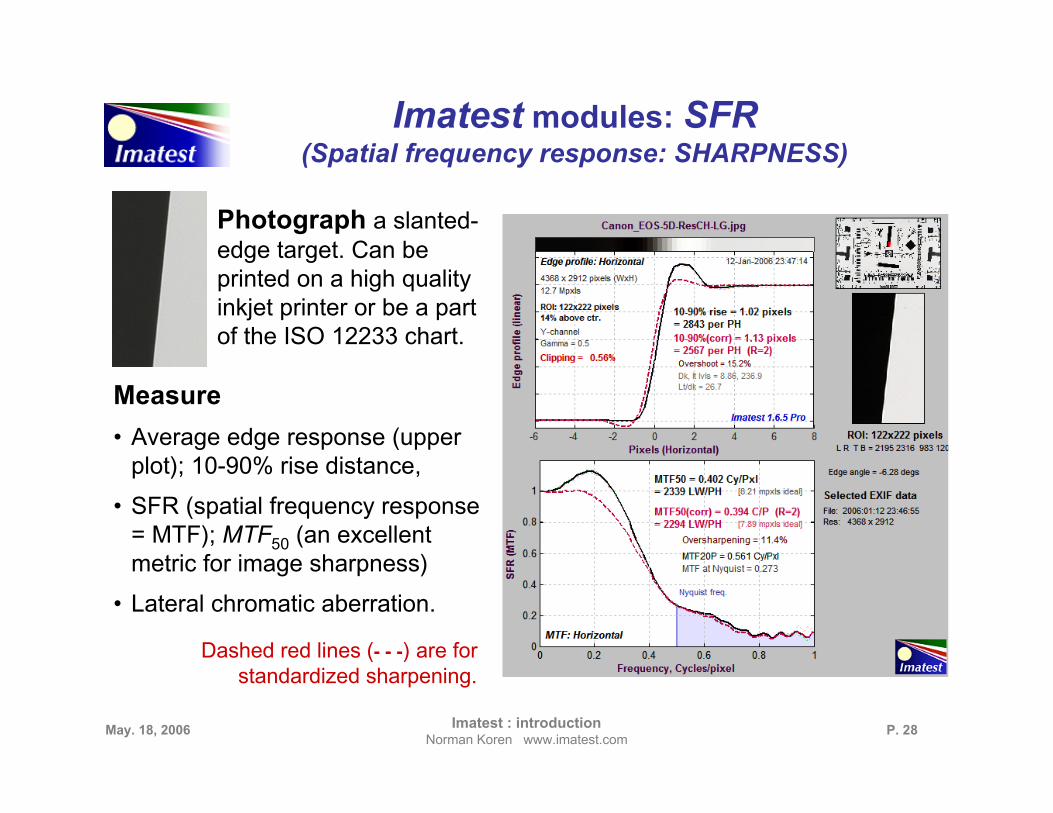
Imatest modules: SFR(Spatial frequency response: SHARPNESS)
Photograph a slanted-edge target. Can beprinted on a high qualityinkjet printer or be a partof the ISO 12233 chart.
Measure
• Average edge response (upperplot); 10-90% rise distance,
• SFR (spatial frequency response= MTF); MTF50 (an excellentmetric for image sharpness)
• Lateral chromatic aberration.
Dashed red lines (- - -) are forstandardized sharpening.
P. 29May. 18, 2006 Imatest : introductionNorman Koren www.imatest.com
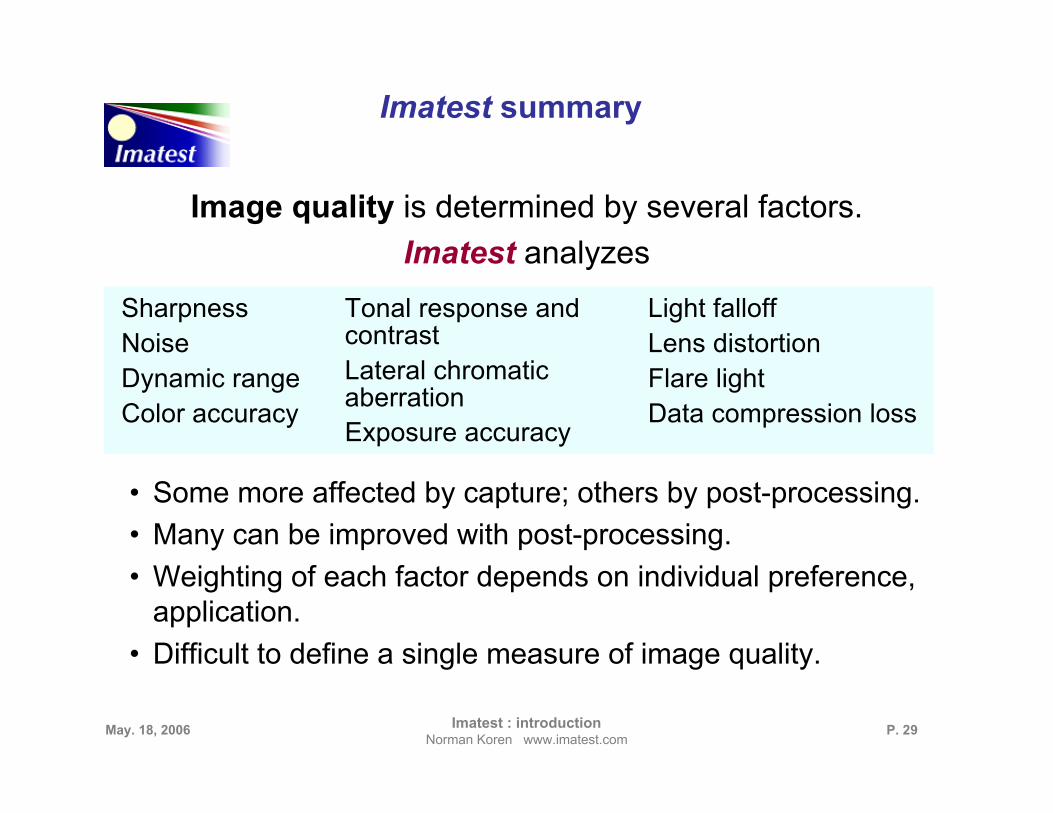
Imatest summary
SharpnessNoiseDynamic rangeColor accuracy
Image quality is determined by several factors.
Imatest analyzes
Light falloffLens distortionFlare lightData compression loss
Tonal response andcontrastLateral chromaticaberrationExposure accuracy
• Some more affected by capture; others by post-processing.
• Many can be improved with post-processing.
• Weighting of each factor depends on individual preference,application.
• Difficult to define a single measure of image quality.
P. 30May. 18, 2006 Imatest : introductionNorman Koren www.imatest.com
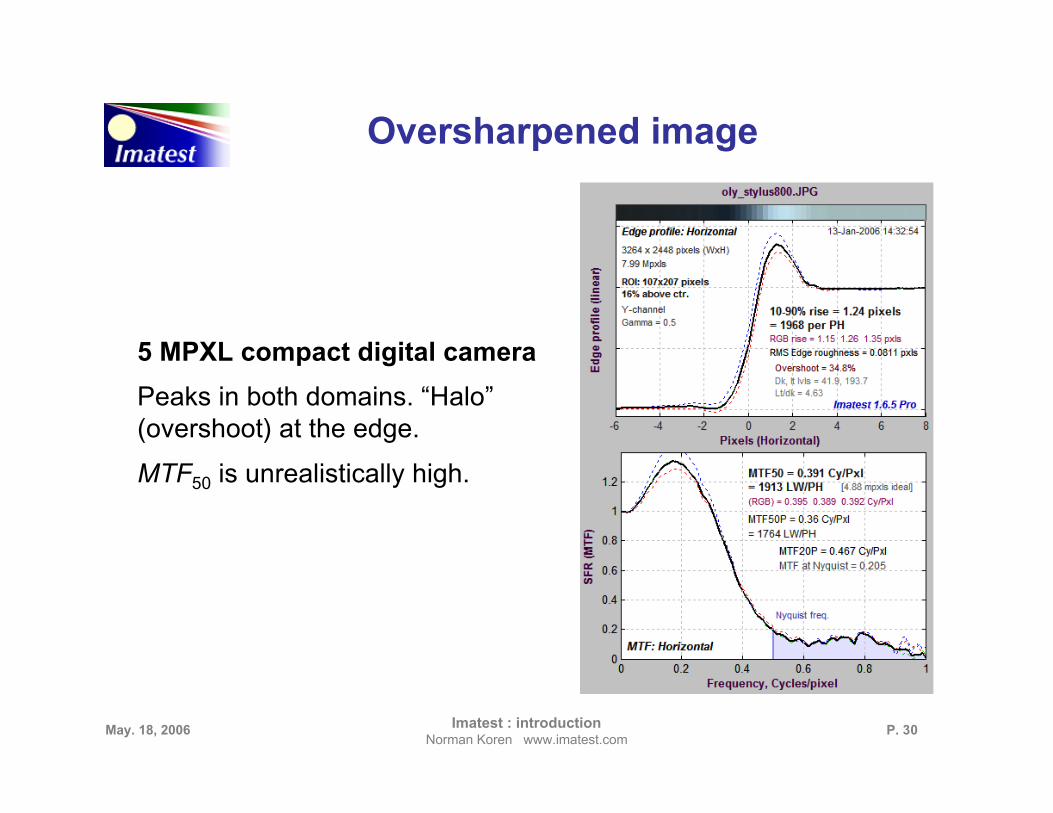
Oversharpened image
5 MPXL compact digital camera
Peaks in both domains. “Halo”(overshoot) at the edge.
MTF50 is unrealistically high.
P. 31May. 18, 2006 Imatest : introductionNorman Koren www.imatest.com
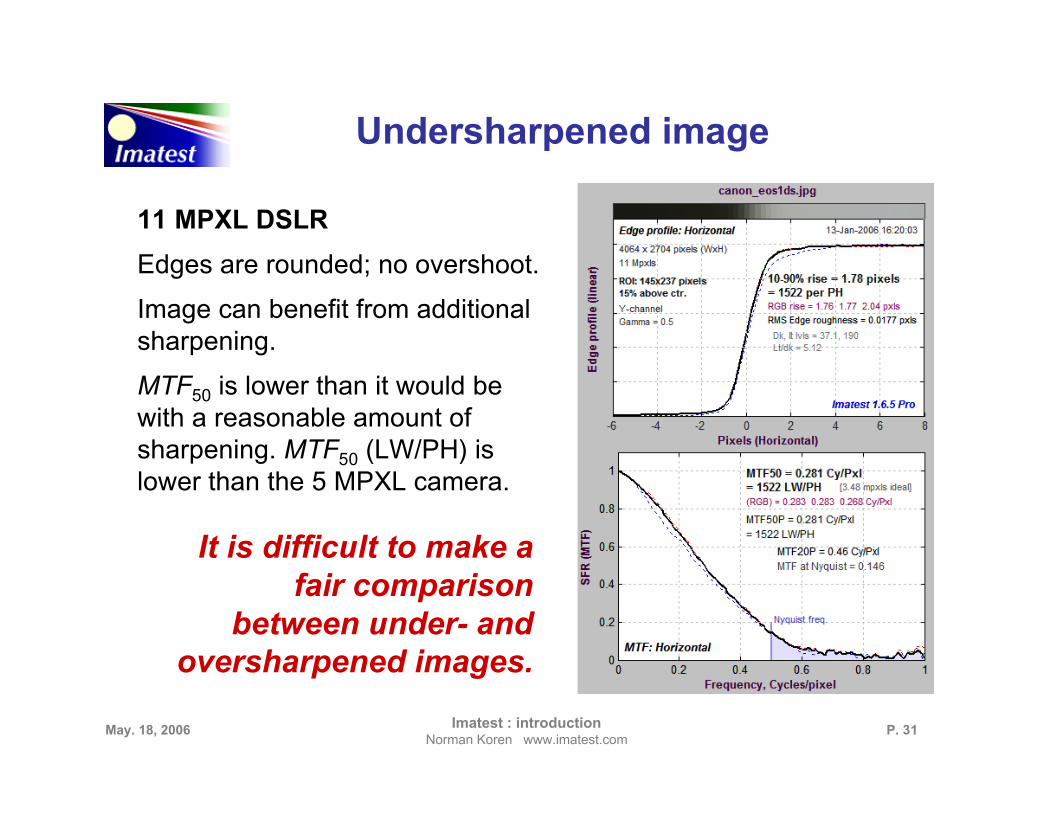
Undersharpened image
11 MPXL DSLR
Edges are rounded; no overshoot.
Image can benefit from additionalsharpening.
MTF50 is lower than it would bewith a reasonable amount ofsharpening. MTF50 (LW/PH) islower than the 5 MPXL camera.
It is difficult to make afair comparison
between under- andoversharpened images.
P. 32May. 18, 2006 Imatest : introductionNorman Koren www.imatest.com
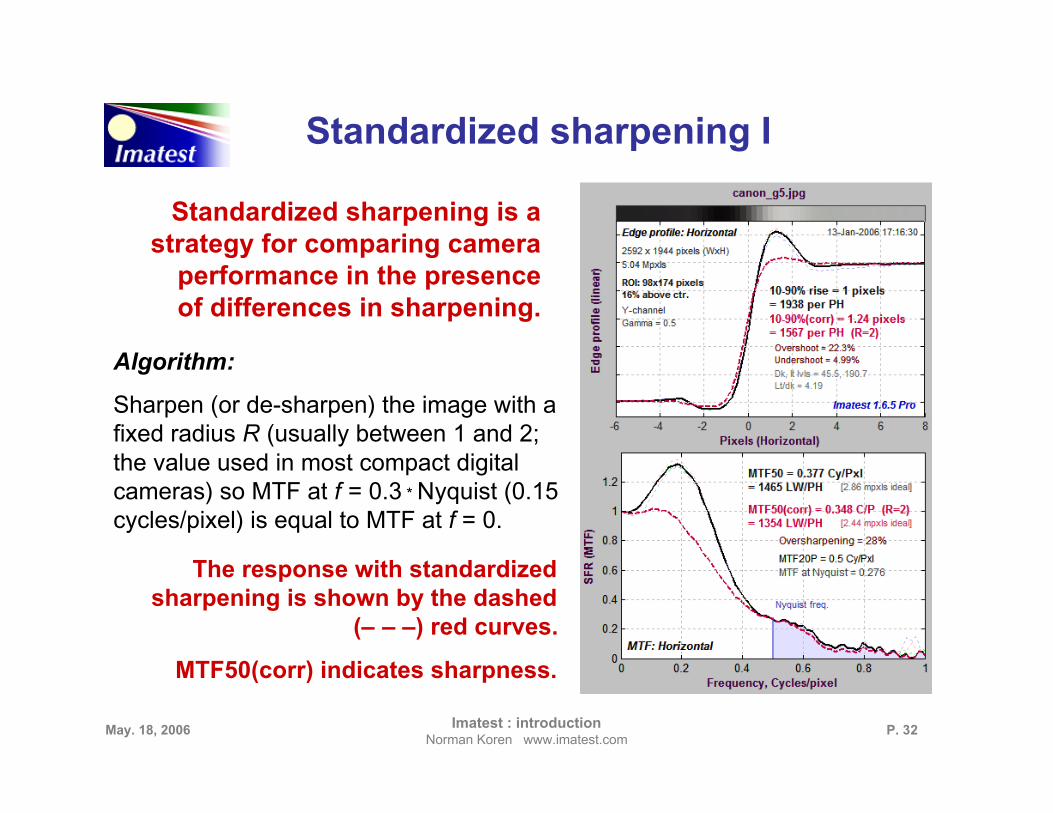
Standardized sharpening I
Algorithm:
Sharpen (or de-sharpen) the image with afixed radius R (usually between 1 and 2;the value used in most compact digitalcameras) so MTF at f = 0.3 * Nyquist (0.15cycles/pixel) is equal to MTF at f = 0.
Standardized sharpening is astrategy for comparing camera
performance in the presenceof differences in sharpening.
The response with standardizedsharpening is shown by the dashed
(– – –) red curves.
MTF50(corr) indicates sharpness.
P. 33May. 18, 2006 Imatest : introductionNorman Koren www.imatest.com
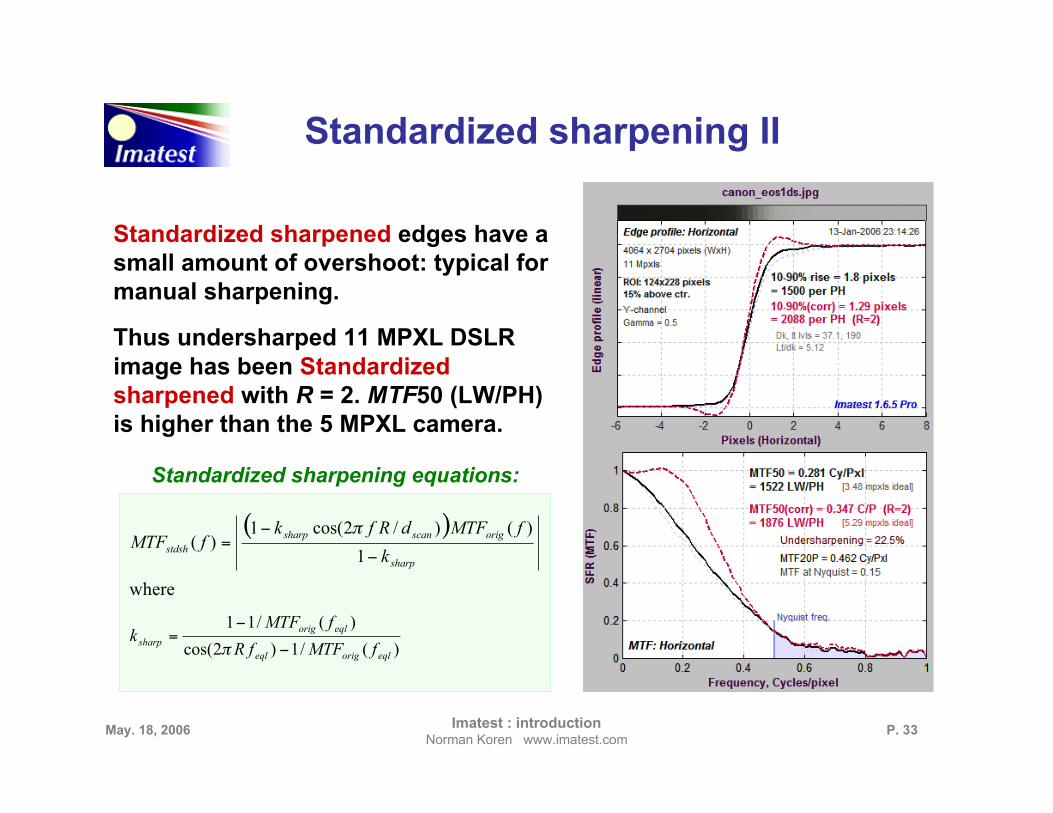
Standardized sharpening II
Standardized sharpened edges have asmall amount of overshoot: typical formanual sharpening.
Thus undersharped 11 MPXL DSLRimage has been Standardizedsharpened with R = 2. MTF50 (LW/PH)is higher than the 5 MPXL camera.
( )
sharp
origscansharp
stdshk
fMTFdRfkfMTF
!
!=
1
)()/2cos(1)(
"
)(/1)2cos(
)(/11
eqlorigeql
eqlorig
sharpfMTFfR
fMTFk
!
!=
"
where
Standardized sharpening equations:
P. 34May. 18, 2006 Imatest : introductionNorman Koren www.imatest.com
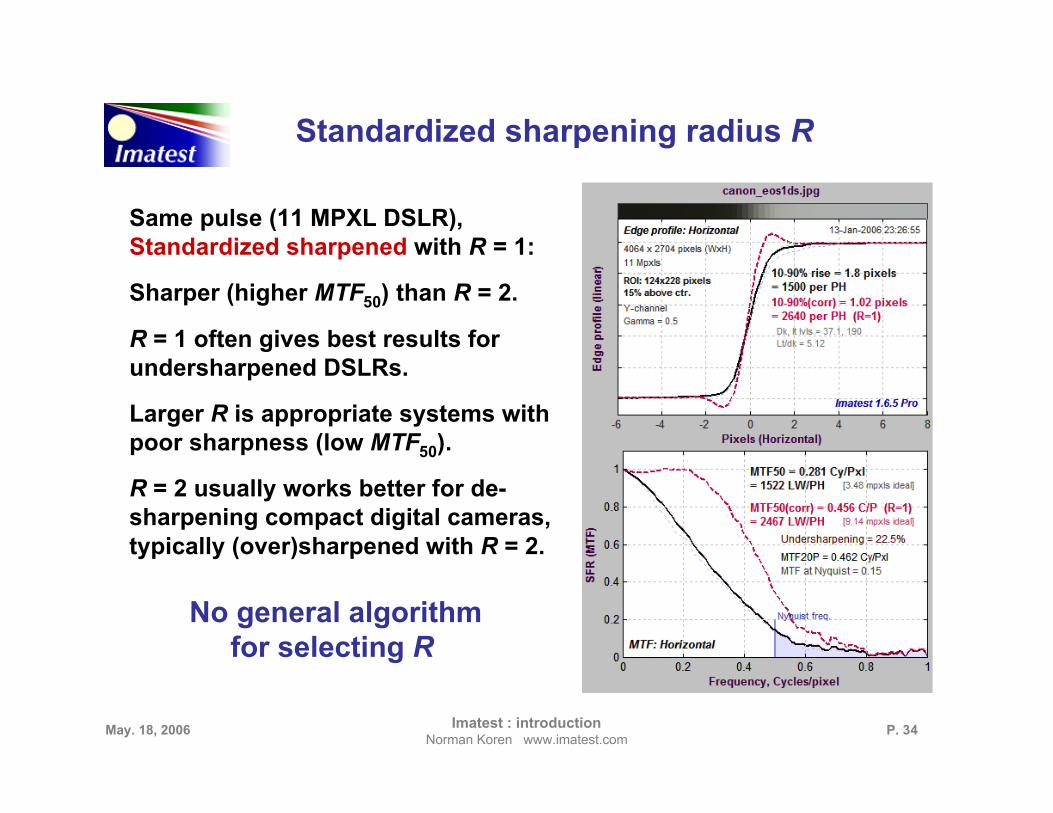
Standardized sharpening radius R
Same pulse (11 MPXL DSLR),Standardized sharpened with R = 1:
Sharper (higher MTF50) than R = 2.
R = 1 often gives best results forundersharpened DSLRs.
Larger R is appropriate systems withpoor sharpness (low MTF50).
R = 2 usually works better for de-sharpening compact digital cameras,typically (over)sharpened with R = 2.
No general algorithmfor selecting R
P. 35May. 18, 2006 Imatest : introductionNorman Koren www.imatest.com
Standardized sharpeningConclusions
• Useful for comparing performance of differentcameras with light to moderate signal processing. but
• Can be fooled by sophisticated signal processing(complex sharpening & noise reduction withthresholds)
– Almost any response curve can be replicated with sufficientsharpening, but...
– Excessive sharpening boosts noise & other artifacts. Canworsen appearance.
• Additional tests needed.
P. 36May. 18, 2006 Imatest : introductionNorman Koren www.imatest.com
Slanted-edge measurementsConclusions
• Excellent for measuring sharpness:Convenient, accurate, valid well beyond Nyquist frequency.
• Affected by in-camera sharpening. Best with no or knownsharpening.
• Cannot distinguish between response above Nyquistcaused by weak anti-aliasing filter and sharpening; doesnot indicate potential seriousness of Moiré fringing.
• Additional tests will be added to fully characterize systemquality, e.g., CIPA DC-003 & Siemens Star, which canmeasure the onset of aliasing.