The Normal Curve and Z-scores Using the Normal Curve to Find Probabilities.
Upload
ace-matilacCategory
view
68download
1
TOPIC OUTLINE:
1. The Normal Curve
a. Definition/Description
b. Area Under Normal Curve
2. Standard Scores
a. Z-Scores
b. T-Scores
c. Other Standard Scores

NORMAL CURVE
- Karl Friedrich
Gauss:
one of the scientist
that developed the
concept of normal
curve.
Common term:
Laplace-Gaussian
Curve or Gaussian

* Normal Curve
is a continuous
probability distribution
in statistics
Karl Pearson:
first to refer to the
curve as “Normal
Curve”
NORMAL CURVE
- Karl Friedrich
Gauss:
one of the scientist
that developed the
concept of normal
curve.
Common term:
Laplace-Gaussian
Curve or Gaussian

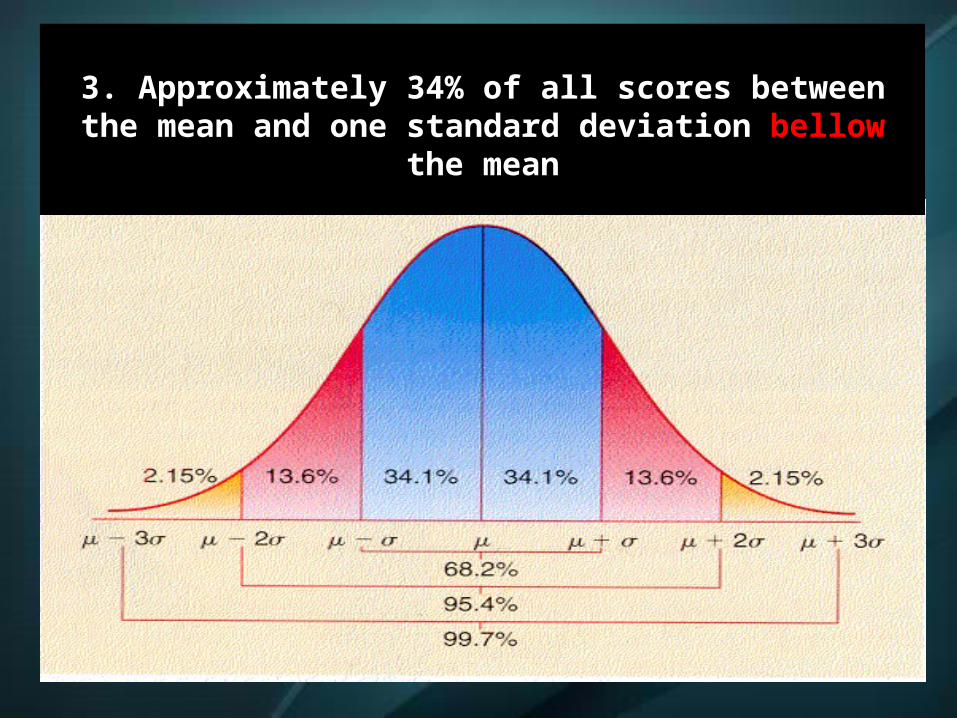
Characteristics:
- Smooth bell shaped curved
- Asymptotic: approaching the x-axis but never touches it
- Symmetric: made up of exactly similar parts facing each other

Characteristics:
- Ranges from negative to positive infinity
- With two tails

A normal curve has two tails.
• The area on the normal curve between 2 and 3 standard deviations above the mean is referred to as a tail.
• The area between -2 and -3 standard deviations below the mean is also referred to as a tail.

AREA UNDER THE NORMAL CURVEThe normal curve can be divided into areas defined in units of
standard deviation.

1. 50% of the scores occur above the mean and 50% of scores occur below the mean
50%(ABOVE)
50%(BELOW)
MEAN

2. Approximately 34% of all scores between the mean and one standard deviation above the mean
3. Approximately 34% of all scores between the mean and one standard deviation bellow the mean

4. Approximately 68% of all scores between the mean and ±1 standard deviation.

5. Approximately 95% of all scores between the mean and ±2 standard deviation.

STANDARD SCORES
-is a raw score that has been converted from one scale to another scale.Raw scores maybe converted to standard scores because standard scores are more easily to understand than raw scores.
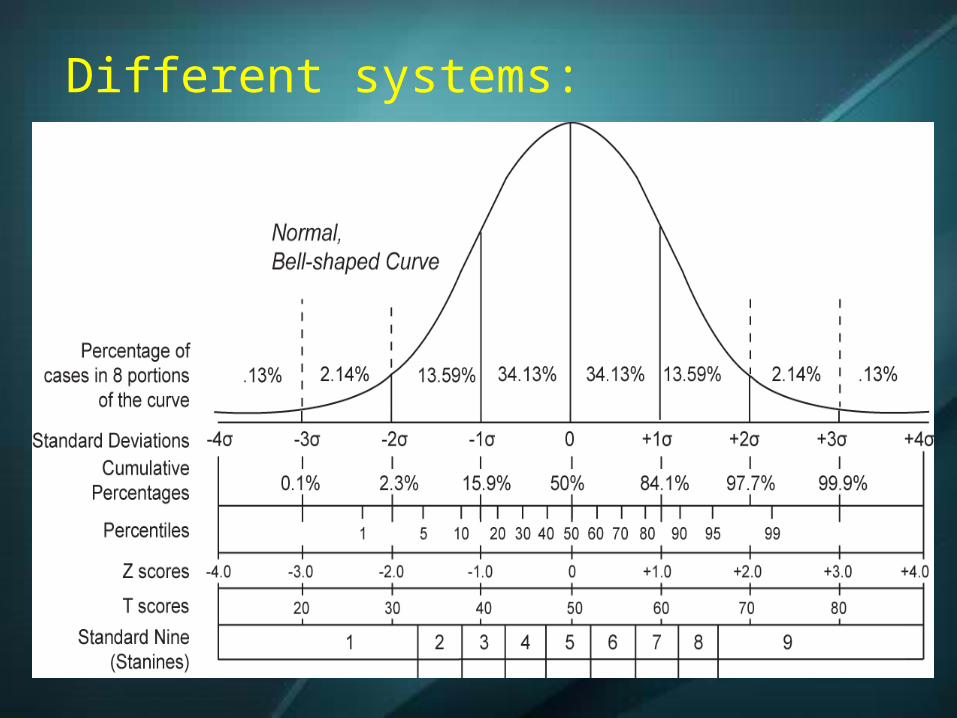
Different systems:
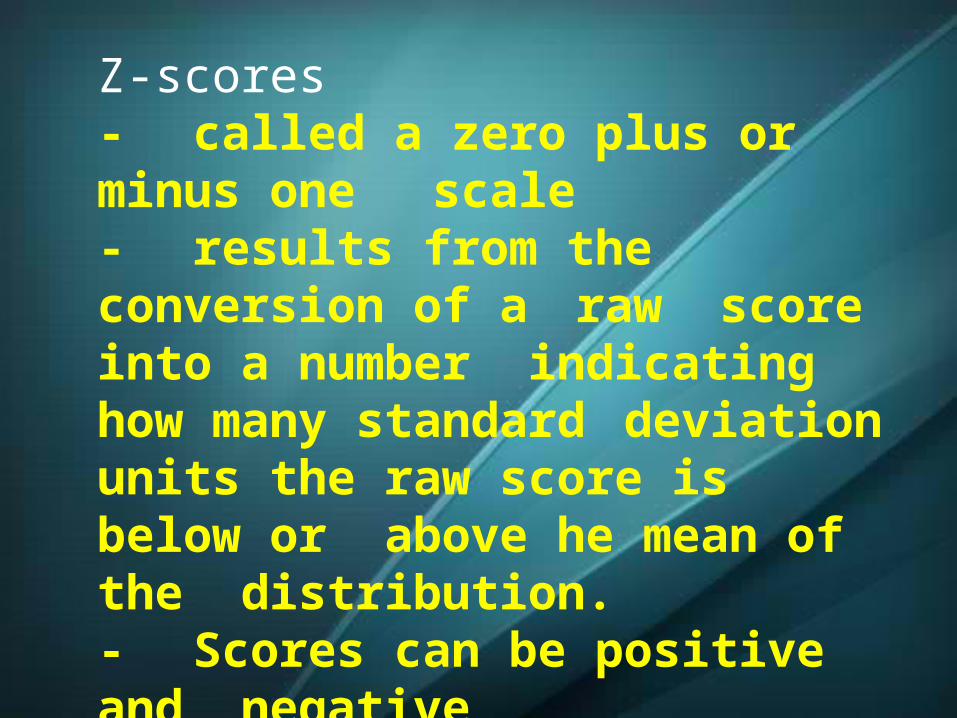
Z-scores- called a zero plus or minus one scale- results from the conversion of a raw score into a number indicating how many standard deviation units the raw score is below or above he mean of the distribution. - Scores can be positive and negative

Z-scores
- X - raw score- U - mean- Q - standard deviation
xz
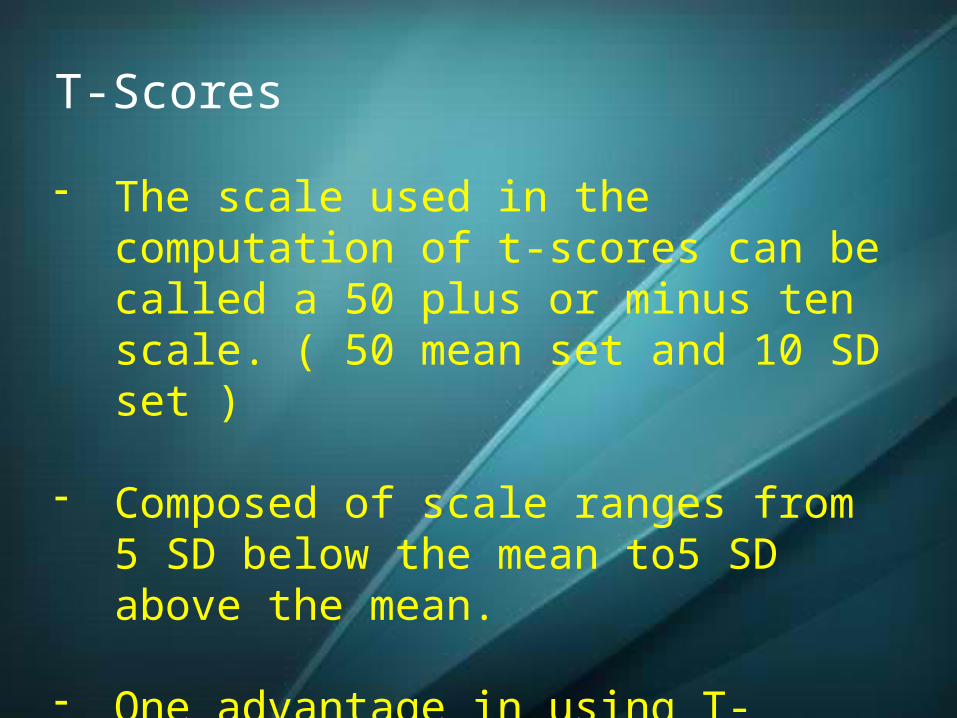
T-Scores
- The scale used in the computation of t-scores can be called a 50 plus or minus ten scale. ( 50 mean set and 10 SD set )
- Composed of scale ranges from 5 SD below the mean to5 SD above the mean.
- One advantage in using T-Scores is that none of the scores is negative.

Page 99
- SD = 15- Mean = 50
Process:
Value = (mean + (number of deviation x 1 standard deviation) )65 = ( 50 + ( 1 X 15 )Value = (mean – (number of deviation x 1 standard deviation) )35 = ( 50 – ( 1 X 15 )
X bar + 1s = 50 + 15 =
X bar - 1s = 50 - 15 =
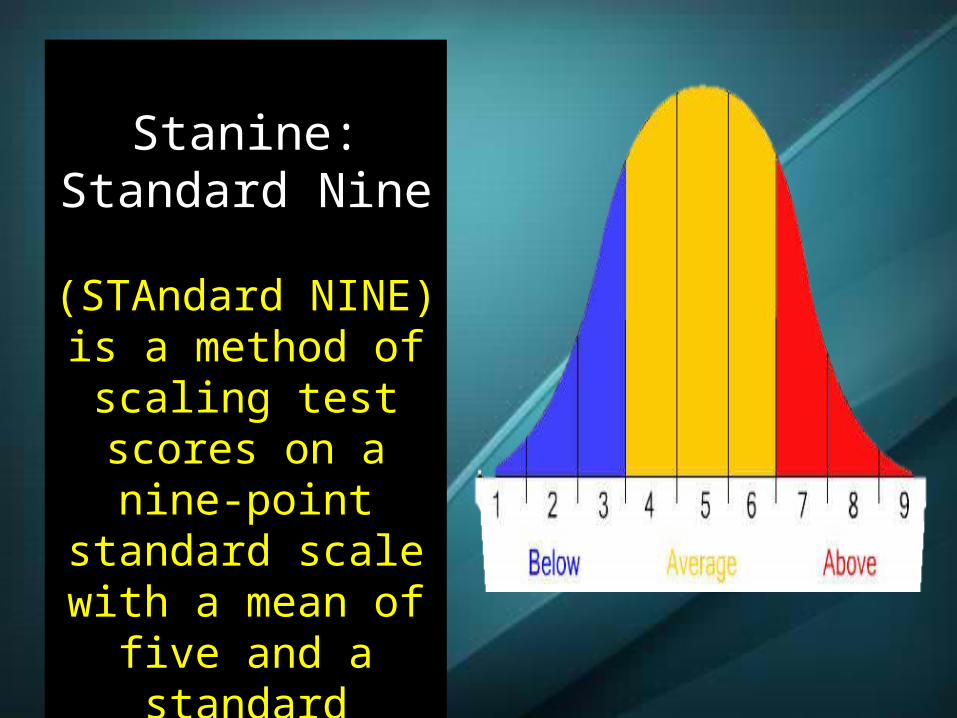
Stanine: Standard Nine
(STAndard NINE) is a method of scaling test scores on a nine-point standard scale with a
mean of five and a standard deviation of
two.

SUMMARY:
Karl Friedrich Gauss: one of the scientist that developed the concept of normal curve.
Normal Curve is a continuous probability distribution in statistics
Karl Pearson: first to refer to the curve as “Normal Curve”
Asymptotic:approaching the x-axis but never touches it
Symmetric:made up of exactly similar parts facing each other
STANDARD SCORES-is a raw score that has been converted from one scale to another scale.
Z-scorescalled a zero plus or minus one scaleScores can be positive and negative
T-Scoresa none of the scores is negative. It can be called a 50 plus or minus ten scale. ( 50 mean set and 10 SD set )
Stanine: Standard Nine(STAndard NINE) is a method of scaling test scores on a nine-point standard scale with a mean of five and a standard deviation of two.

Reanne MariquitAB PSYCHOLOGY
Rhea MoringAB PSYCHOLOGY
Ace MatilacAB PSYCHOLOGY
UNIVERSITY OF IMMACULATE CONCEPTION Davao City, Philippines © 2015
Reference: Cohen, Swerdilik, & Sturman (2013). Psychological Testing and Assessment: An Introduction to Test and Measurement, Eight h Edition. Philippines: McGrawHill Education.