Norges Bank 1 Monetary policy framework in Norway Øistein Røisland Norges Bank.
Upload
edgar-youngCategory
view
222download
4
Norges Bank
11
Executive Board meeting23 April 2008

Norges Bank
2
0
1
2
3
4
5
2006 2007 2008 2009 2010 20110
1
2
3
4
5
-3
-2
-1
0
1
2
3
4
5
2006 2007 2008 2009 2010 2011-3
-2
-1
0
1
2
3
4
5
0123456789
2006 2007 2008 2009 2010 20110123456789
-1
0
1
2
3
4
5
2006 2007 2008 2009 2010 2011-1
0
1
2
3
4
5
Sources: Statistics Norway and Norges Bank
Baseline scenario MPR 1/08 with fan charts. Per cent
Output gap
CPI-ATECPI
90%
70%
50%
30%
Key policy rate

Norges Bank
3
Executive Board’s strategy
• The key policy rate should be in the interval 5%-6% in the period to the publication of the next Monetary Policy Report on 25 June, unless the Norwegian economy is exposed to major shocks.
Monetary Policy Report 1/08

Norges Bank
44
-2.5
-1.5
-0.5
0.5
1.5
2.5
3.5
4.5
5.5
2002 2003 2004 2005 2006 2007 2008
-2.5
-1.5
-0.5
0.5
1.5
2.5
3.5
4.5
5.5
Source: Statistics Norway
Weighted median
CPI-ATE
20 per cent trimmed mean
CPI
Inflation indicators 12-month change. Per cent. January 2002 – March 2008

Norges Bank
5
1
2
3
4
Jan-07 Jul-07 Jan-08 Jul-08
1
2
3
4
Jan 97/07 Jul 97/07 Jan 98/08 Jul 98/08
Domestically produced goods and services1)
Development since January 1997 and January 2007. 12-month change. Per cent
2007
1997
Sources: Statistics Norway and Norges Bank 1) Adjusted for tax changes and excluding energy products

Norges Bank
6
0
2
4
6
8
10
1983 1987 1991 1995 1999 2003 2007
0
2
4
6
8
10
Unemployed Percentage of labour force. Seasonally adjusted.
February 1983 – March 2008
Sources: Statistics Norway, Norwegian Labour and Welfare Administration (NAV) and Norges Bank
Registered unemployed and on labour market programmes
LFS unemployment
Registered unemployed

Norges Bank
7
-5
0
5
10
15
20
25
30
2002 2003 2004 2005 2006 2007 2008
-10
0
10
20
30
2002 2003 2004 2005 2006 2007 2008
Households Enterprises
House prices
Property prices and creditGrowth from same month/half-year previous year.
Per cent. January 2002 ― March 2008
Credit
Credit
Commercial property prices
Sources: Norwegian Association of Real Estate Agents, Association of Real Estate Agency Firms, Finn.no, ECON Pöyry, Statistics Norway and Norges Bank

Norges Bank
8
0,0
0,5
1,0
1,5
2,0
2,5
Q1 06 Q3 06 Q1 07 Q3 07 Q1 08
0,0
0,5
1,0
1,5
2,0
2,5
Actual
MPR 1/08Monthly indicator MPR 1/08
Mainland GDP Basic values excluding energy production. Growth on previous quarter.
Seasonally adjusted. Per cent. 06 Q1 – 08 Q2
Sources: Statistics Norway and Norges Bank

Norges Bank
9
0
20
40
60
80
100
120
2004 2006 2008 2010
0
20
40
60
80
100
120
0
50
100
150
200
250
2001 2003 2005 2007
0
50
100
150
200
250Metals
Farmed salmon and trout
Aggregated export price index
Pulp and paper products
Oil price (Brent Blend) in USD per barrel
Futures prices (broken line)
Price indices1) for Norwegian exports in NOK
2001=100. Q1 2001 – Q1 2008
1) Norges Banks calculations are based on world market prices
21 April 08
Sources: Reuters (EcoWin), Statistics Norway and Norges Bank
10 March 08 (MPR 1/08)

Norges Bank
1010
International commodity prices in SDRIndex, week 1 2000 = 100. Week 1 2000 – Week 16 2008
50
100
150
200
250
300
2000 2002 2004 2006 2008
50
100
150
200
250
300
Non-food agriculturalsFood
Industrials
All items
Metals
Sources: Reuters (EcoWin), The Economist and Norges Bank

Norges Bank
11
Commodity prices, food In USD. Indices. 3 January 2006 = 100.
3 January 2006 – 21 April 2008
50
100
150
200
250
300
350
400
2006 2007 2008
50
100
150
200
250
300
350
400
Soyabeans
Wheat
Coffee
Maize
Sources: Reuters (EcoWin)

Norges Bank
12
0.0
0.4
0.8
1.2
1.6
2.0
2.4
2.8
Aug-07 Oct-07 Dec-07 Feb-08 Apr-08
0.0
0.4
0.8
1.2
1.6
2.0
2.4
2.8
Sources: Consensus Economics, IMF and Norges Bank
Projections for GDP growth in the US in 2008 August 2007 – April 2008
Goldman Sachs
JP Morgan
Morgan Stanley
IMF
Norges Bank
Consensus Forecasts
Norges Bank
13
0.0
0.4
0.8
1.2
1.6
2.0
2.4
2.8
3.2
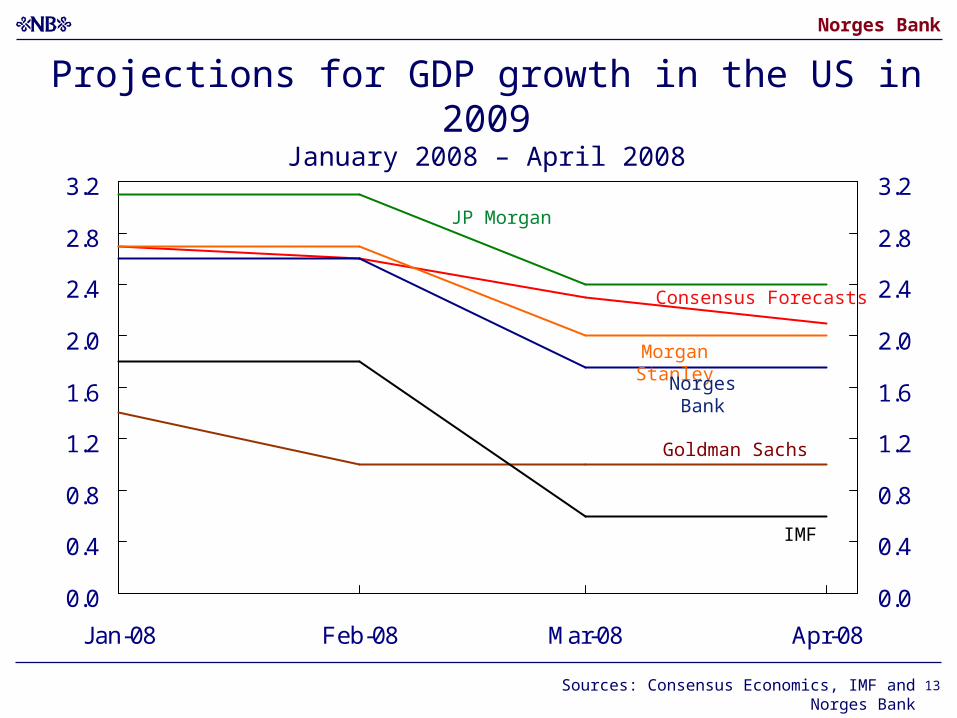
Jan-08 Feb-08 Mar-08 Apr-08
0.0
0.4
0.8
1.2
1.6
2.0
2.4
2.8
3.2
Consensus Forecasts
Projections for GDP growth in the US in 2009January 2008 – April 2008
Goldman Sachs
JP Morgan
Morgan Stanley
IMF
Norges Bank
Sources: Consensus Economics, IMF and Norges Bank

Norges Bank
14
CPI/HICP 12-month change. January 1997 – March 2008
-2
-1
0
1
2
3
4
5
1997 1999 2001 2003 2005 2007
-2
-1
0
1
2
3
4
5
US
Euro area
Japan
UK
Sources: Reuters (EcoWin) and national statistics agencies

Norges Bank
15
-4
0
4
8
12
16
20
2002 2003 2004 2005 2006 2007 2008
-4
0
4
8
12
16
20
China
Consumer prices in BRIC countries1)
12-month change. Per cent. January 2002 – March 2008
Brazil
India2)
Russia
1) Brazil, Russia, India and China2) Wholesale prices. 12-month change calculated on
the basis of weekly figures. Sources: Thomson Reuters and Norges Bank

Norges Bank
16
0
1
2
3
4
5
6
Apr-02 Dec-02 Aug-03 Apr-04 Dec-04 Aug-05 Apr-06 Dec-06 Aug-07 Apr-080
1
2
3
4
5
6
Credit premiums on corporate bonds1)
Five-year maturity. In percentage points. 10 April 2002 – 21 April 2008
USA
Europa
Source: Reuters (EcoWin)1) Bonds with a BBB rating.

Norges Bank
17
0.0
0.2
0.4
0.6
0.8
1.0
1.2
May-07 Sep-07 Jan-08 May-08 Sep-08 Jan-09
0.0
0.2
0.4
0.6
0.8
1.0
1.2
Difference between three-month money market rates and expected key rates1)
In percentage points. Historic (from 1 May 2007) and ahead (at 21 April 2008)
Norway 2)
US
UK
Euro area
Sources: Bloomberg, Reuters and Norges Bank1) The expected key rate is measured by the Overnight Indexed Swap (OIS). 2) Norges Bank’s estimates.

Norges Bank
18
0
1
2
3
4
5
6
Jan-05 Jan-06 Jan-07 Jan-08 Jan-09 Jan-10 Jan-11
0
1
2
3
4
5
6
Sources: Reuters and Norges Bank
Key policy rates and forward rates13 March and 21 April 2008
Norway
US
Euro area21 April 2008
After previous monetary policy meeting (13 March 2008)
UK

Norges Bank
19Sources: Reuters and Norges Bank
4
4.5
5
5.5
6
Jul-08 Jan-09 Jul-09 Jan-10 Jul-10 Jan-11 Jul-11
4
4.5
5
5.5
6
Market 21 April 2008
Key policy rate in the baseline scenario and estimated forward rates1)
Per cent
19
Market after MPR 1/08 (13 March 2008)
Baseline scenario MPR 1/08Baseline scenario MPR 1/08
I) A credit risk premium and a technical difference of 0.20 percentage point have been deducted to ensure comparability with the key policy rate.
Norges Bank
20
3.75
4.25
4.75
5.25
5.75
6.25
6.75
May-07 Jul-07 Sep-07 Nov-07 Jan-08 Mar-08
3.75
4.25
4.75
5.25
5.75
6.25
6.75
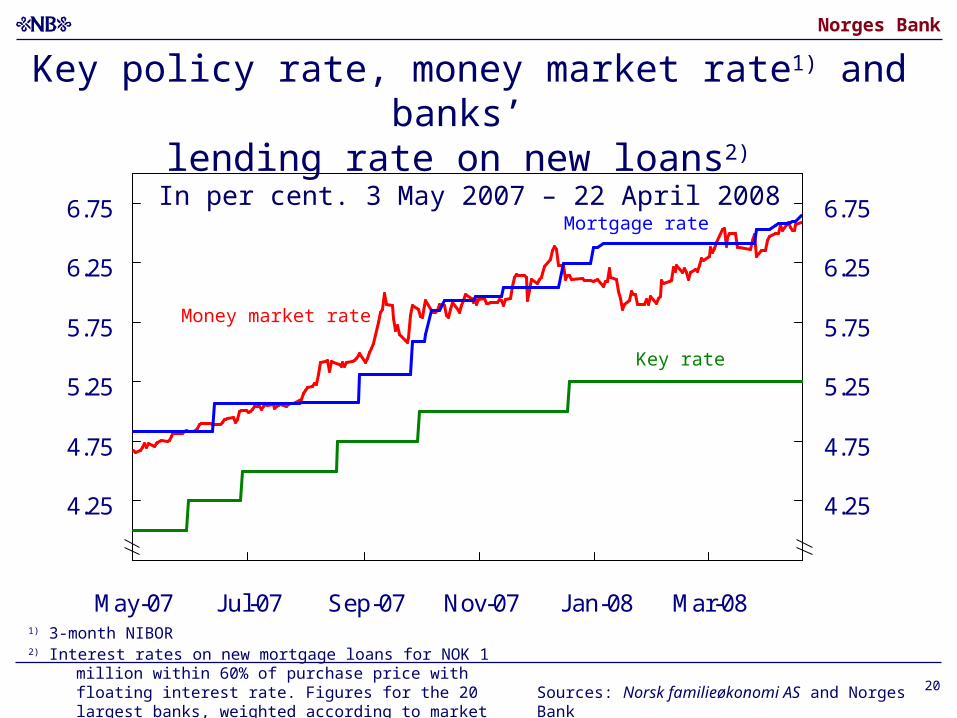
Key policy rate, money market rate1) and banks’ lending rate on new loans2) In per cent. 3 May 2007 – 22 April 2008
Mortgage rate
Money market rate
Key rate
1) 3-month NIBOR2) Interest rates on new mortgage loans for NOK 1 million within 60%
of purchase price with floating interest rate. Figures for the 20 largest banks, weighted according to market share. Sources: Norsk familieøkonomi AS and Norges Bank

Norges Bank
21
85
88
91
94
97
100
103
2002 2003 2004 2005 2006 2007 2008 2009 2010 2011
-1
0
1
2
3
4
5
21 April 2008
3-month interest rate differential and import-weighted exchange rate (I-44) 1)
January 2002 – December 2011
21 April 2008
MPR 1/08
Weighted interest ratedifferential (left-hand scale)
I-44 (right-hand scale)
Sources: Reuters and Norges Bank
1) A rising curve denotes an appreciation of the krone.

Norges Bank
22
-20
-15
-10
-5
0
5
10
15
20
25
1970 1975 1980 1985 1990 1995 2000 2005 2010
-20
-15
-10
-5
0
5
10
15
20
25
Real exchange rateDeviation from mean1). 1970 – 20082). Per cent
1) Mean in the period 1970-2007. 2) Data for 2008 based on observations to 21 April
Mean January - April 2008Relative consumer
prices
Relative wage costs
Sources: Statistics Norway, Technical Reporting Committee on Income Settlements, Ministry of Finance and Norges Bank

Norges Bank
2323
Key policy rate
Source: Norges Bank
0
1
2
3
4
5
6
7
8
9
2005 2006 2007 2008 2009 2010 2011
0
1
2
3
4
5
6
7
8
9
Strategy interval
1/053/04
2/053/05 1/06
2/063/06
2/071/07
3/07
MPR 1/08
1/08