Volcanological and Structural Aspects of the Venetia Kimberlite

Nordic Volcanological Institute 8701 University of Iceland
1982
r •
~CRR~NA ELDF JALLl:,S TGDIJ\i -,/.
THE CHEMISTRY OF GROUNDWATER IN THE LANGJOKULL-THINGVELLIR DRAINAGE AREA, SOUTH ICELAND
by
Juhani Airo

Nordic Volcanological Institute 8701
University of Iceland
1982
THE CHEMISTRY OF GROUNDWATER IN THE LANGJOKULL-THINGVELLIR
DRAINAGE AREA, SOUTH ICELAND
by
Juhani Airo
- 1 -
INTRODUCTION
This report describes the chemical characteristics of
waters of the Thingvellir-Langjokull drainage area in
southern Iceland. The area is largely covered by post
glacial lava. Sampling sites were selected with the
view to compare the chemistry of glacial meltwater,
surface waters and cold groundwater emerging in natural
springs. By virtue of the sparse settlement, the natural
state of the ground- and surface water in the region has
not been affected by human activities. The region,
therefore, affords good opportunities to study the geo
logical and meteorological factors controlling the origin
of dissolved species in these natural waters.
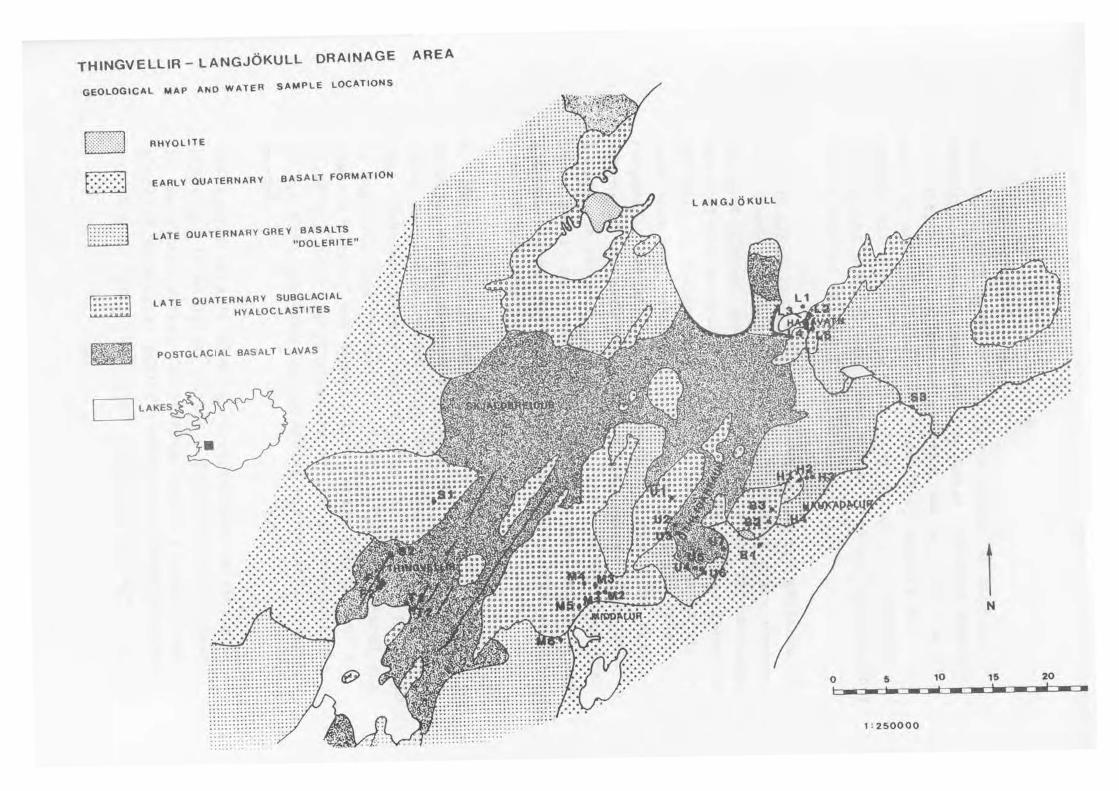
The Thingvellir-Langjokull drainage area covers the
interior of the country within and east of the Reykjanes
Langjokull rift zone. The area is devided into several
watersheds by hyaloclastite mountain ridges. Large parts
of the area north of The Lake Thingvallavatn and south of·
the Langjokull glacier are covered with porous and fissured
postglacial lava fields with no visible water on the
surface. Less permeable late quaternary basalt formations
crop out on both sides of the lava fields (Fig. 1). Eleva
tion varies from 103 m.a.s.l. at the Lake Thingvallavatn
to 500 m.a.s.l. at the Lake Hagavatn on the southern edge
of the Langjokull glacier. The highest mountains in the
area are over 1000 m.a.s.l. Strata dip is about 10 m/km
southwest to the Lake Thingvallavatn and the longest
distance between recharge and discharge areas is about
40 km. The residence time of water which travel the
longest distances underground are 2-3 months - 2-3 years
as estimated using the permeability values of Tomasson
- 2 -
(1971). Secondary permeability such as tectonic fissures
inevitably affect flow rates and, therefore, the age of
the water.
Vegetation is rare in these fields and the northern part
of the area is a desert. The southern part is covered by
a thin humus layer and moss, grass, bushes and even small
trees especially in Haukadalur area. In the recharge area
towards north, the melt water and precipitation seeps almost
immediately into the bedrock through surface morain and
alluvial cover. A humus soil layer is practically absent
and therefore the content of carbon dioxide in infiltrating
water will not rise as much as it would if such a layer
was present.
Water is discharged mainly through springs on the southern
edge of the postglacial lavas or hyaloclastites on the
border of early quaternary basalt formation. The so called
spring-fed rivers originate in these springs. Usually
this water has travelled long distances through sub
terraneous aquifers. The flow appears to be remarkably
constant for some of the springs and seasonal variations
are smoothed out and the water temperature is constant.
The temperature of most springs is 3-5 °c, depending on the
soil temperature of the drainage area. The climate is of
cool maritime type. The mean annual temperature in two·
nearby meteorological stations, Haell and Hveravellir, is
3,7 and -0,9 °c, respectively (ten year average) and
precipitation of the same stations is 1148 and 923 mm,
respectively.
- 3 -
GENERAL GEOLOGY OF THE AREA (written by Pall Imsland)
Four stratigraphical formations, showing differences in
lithofacies occupy the bedrock of the studied area, i.e.
the border region of the southern lowland and the highland
behind it, towards Langjokull. These formations range in
from the fresh postglacial lavas to the mid-quaternary
lava-beds of the older pile, apparently about 1,5 million
years old. This area extends from the central axis of the
active volcanic rift zone about 40 km, out into a slightly
eroded and tilted lava pile.
During the formation of this crustal segment the quaternary
ice-age occupied the northern hemisphere. In Iceland this
meant the coming and going of cold and warm periods, when
glaciers covered the country and melted away in turn, at
least ten times during the last three million years
(Saemundsson, 1979). The consequence of this on the
rock formations is drastic. During glacial periods the
volcanic eruptions took place under the ice-cover and
the eruption materials were turned into fragments, which
piled up over the eruption sites to form heaps (in contrast
to beds (Jones, 1969 & 1970). These materials consolidated
into elastic rocks called hyaloclastites; which range in
lithofacies from fine-grained glassy tuffs, through
a variety of breccias of glassy groundmass and aphanatic
vesicular basalt clasts, to the more typical pillow lavas
and irregular masses of enbe-jointed basalt. During inter
glaciai periods the lavas were able to flow more freely
and form a bedded lava pile.
Erosion, mostly glacial, of the hyaloclastites delivered
masses of sediments. These deposited on the lavas and are

- 4 -
now found as interbeds of sedimentary hyaloclastites
(reworked hyaloclastites) between lavas in older sections
of the pile. These reworked hyaloclastite sedimentary
layers show a variety in lithology as f.i. fluvial and
lacustrine tuffs, tillitic, glacifluvial or fluvial
conglomerates and breccias.
The four bedrock formations are shown on the following
map, which is a simplified portion of the geological map
of Iceland (Kjartansson, 1962, 1965, 1968 and Saemundsson
& Einarsson, 1980). These formations are:
1. The old lavas. These occupy the basalt lava pile
furthest towards east and west and lowest in the section.
They are all quaternary in age, but older than 0,7 million
years (i.e. the Brunhes-Matuyama magnetic pole reversal, see
Saemundsson, 1979). They are primarily fissure lavas, which
originate in fissure swarms, now extinct. Their origiDal
porosity is now decreased, as vesicles and cracks are
partly filled by secondary minerals. This pile of lavas
contains sedimentary horizons of the various types
mentioned above. This formation does not appear within
the sampled area but borders it. The groundwaterflow is
apparently nowhere from these rocks and into the sampled
area, so this formation apparently does not affect the
composition of the water samples.
2. The grey basalts. These are interglacial lavas which
mostly were produced during the two last interglacial
periods. They are usually taken to originate in relatively
large shield volcanoes. They are lighter in colour than
basalts usually are. This results from a coarse-grained
texture compared to most lavas, which is as well the reason
for the doleritic name sometimes used for this rock type,
especially in older literature. These basalts are
THINGVELLIR - LANGJOKULL DRAINAGE
GEOLOGICAL MAP ANO WATER SA~PLE LOCATIONS
-~ ~
[illillJ . . .
RHYOLITE
EARLY QUATERNARY BASALT FORMATION
LATE QUATERNARY GREY BASALTS "DOLERITE"
LATE QUATERNARY SUBGLACIAL HYALOCLASTITES
POSTGLACIAL BASALT LAVAS
··~· . .: .: : ... ...
;::??'J ........ . , . . . . . . . ... . . . . . . ... . . . . .. . . . . . .. . . .. . .. . . . . . . . .
D LAKES
AREA
LANGJOKULL
t N
0 5 10 15 20 1------------1 : 2soooo
- 6 -
texturally more open as well, as a result of numerous
intercrystal small cavities. As these cavities came as
an addition to the decreasing vesicles, which are still
empty of secondary minerals, these grey basalts are
usually quite good aquifers. They occupy a considerable
part of the studied area, and within them are located some
of the sampled wells.
3. The hyaloclastites. These rocks are the products of
the fissure and shield volcanism that took place during
the last glacial period or two. Due to the circumstances
the eruption materials were not able to flow as lavas and
did heap up within the ice-sheet. Each hyaloclastite is
thus much more restricted in horizontal section and
comparably thicker, when compared to lavas. The elastic
nature of the material causes a high degree of porosity
in all the various lithological types. Being young the
formation is only slightly eroded. It does occupy a con
siderable areal of the central part of the area, containing
some of the sampled wells.
4. The postglacial lavas. These are the basalt lavas
produced by the fissure eruptions and shield volcanoes
after the ice retreated from the area, around 10000 years
ago. They are highly vesicular and in addition fractured
by the rift zone tectonics. They occupy the central and
western part of the sampled area, where the flow of the
lavas has been highly affected by the graben-tectonics
in the rift zone and the bordering hyaloclastite topo
graphy.
The entire area is thus characterized by basalts of
different lithological facies. Rhyolites only appear
in two places within the studied area. A young (last
glacial) subglacial peslitic formation (Prestahnjukur)
is found in the northwestern corner of the area, but this

- 7 -
does apparently not affect the sampled waters. Another
older rhyolite occurence, an eroded small extinct central
volcano, is found in Bjarnasfell in the southeastern
corner of the area, close to some of the sampling
localities. The process of obtaining a chemical equi
librium between the basalt and the groundwater may be
slightly affected by the difference in lithology of
the various basalts within the area, which range from
100 % crystalline lavas to 100 % glassy tuffs. The basalts
do as well range somewhat in chemical composition and
mineralogy, within the range allowed for by the tholeiitic
suite restriction. This may as well affect the chemical
equilibrium. The loose materials covering the bedrock
are, on the other hand, unlikely to be of much importance,
as they are mostly of local, or nearly so, origin; morainic
material. The soil and vegetation were avoided as much as
possible, during sampling.

- 8 -
SAMPLING AND ANALYSIS
Water samples were collected during July and September,
1982. The pH, temperature, and usually also the total
carbonate of the water were measured in the field. The
pH probe and buffer solutions were allowed to equilibriate
at the water temperature before a reading was recorded.
Samples for chemical analysis were filtered through a hand
held Millipore filter 0,�5 µm after flushing with appr. 50 ml
of fluid. Sample bottles of polyethylene were rinsed three
times before filling up. One 100 ml sample bottle for
cation analyses was acidified with 0.2 ml of concentrated
HCl and another with 0,2 ml of concentrated HN03
. Two
samples were left untreated for pH, total carbonate, spesific
conductance, silica, chloride and sulfate analysis
(altogether 1,5 1). One 100 ml sample for total carbonate
was treated with 0,5 ml of 0,05 M NaOH solution. Time
lapse between collection and analysis varied from 3 hours
to two days.
The necessity of filtering in the field has been emphasized
by Eyles et al (1982). Especially electrolyte poor waters
(glacial melt water) tend to dissolve various components
from suspended unorganic matter upon storage. Eyles et al
(1982) observed the largest increase in concentrations of
Mg and silica in unfiltered samples.
Total carbonate was titrated potentiometrically with 0,05 N
HCl solution from pH 8,2 to 3,8. A portable pH-meter was
used to estimate tbe pH, and the correct pH value was then
calculated. In the laboratory total carbonate was re
estimated by back titration which gave on the whole lower
concentrations of total carbonate, or by about 10 % on
average. The concentrations reported in �able 1 are those
measured in the field.

- 9 -
Analysis of total carbonate was undertaken immediately after
arrival of the samples. Total carbonate of untreated and
treated samples was titrated with HCl. The results
compare well and with the field measurements. On the
contrary the pH values measured in the field and in the
laboratory sometimes differ many tenths of pH units.
The phenomenon was observed earlier by Rist (1973).
The general trend was that high pH values decreased and
low values increased during storage.
Silicate was determined colorimetrically using the
molybdosilicic acid complex. Spesific conductance was
measured in the laboratory with a Griffin Conductance
Bridge. Sodium and potassium were determined with a
Beckman �95 atomic absorption spectrometer. Litium
addition did not affect to results of randomly chosen
samples, and that is why all the samples were measured
without any addition. Samples acidified with HCl and
HN03
as well as untreated samples gave identical con
centrations within the precision of the method.
Calcium and magnesium were determined with the same AAS
instrument. La2o
3 solution was added as a releasing
agent before measurement.
Sulfate was measured by titration with barium perchlorate
after concentration and cation exchange. In acid solution
a column of activated alumina will retain sulfate more
readily than most other anions, and it is possible to
separate as little as 0,1 mg/1 sulfate. The sulfate is
then eluted from the column with 0,25 M ammonium hydroxide,
passed through a small cation exchange column and titrated
with 0,005 M barium perchlorade using Thorin indicator.

- 10 -
Chloride was determined argentometrically by titration
with 0,02 M AgN03
solution and K2
cr2o 4 indicator. An
ion-selective electrode (Orion Research 96-17) was also
used to measure chloride. The results of the both methods
are in good agreement.
Intercalibration of the sulfate and chloride methods with
two Finnish laboratories (Food and Environmental Laboratory
of the City of Helsinki and National Board of Waters,
Research Laboratory) showed identical results with auto
analyzator (photometric Thorin method for sulfate and
photometric mercury thiocyanate for chloride), whereas
ion chromatography analysis gave lower concentrations.
DISCUSSION
Chemical analyses of 32 samples are presented in table 1.
The glacial lake Hagavatn was chosen to represent precipi
tation and meltwater, i.e. the chemistry of the water in
the recharge area. The northern edges of the postglacial
lavas are porous and permeable without any humus layer.
A great deal of meltwater and all precipitation therefore
seep quickly down through the surface morain layer into
the bedrock, and start to flow towards the southwest as
subterraneously as groundwater.
Sample 11 is meltwater collected on the glacier. It's
main feature is low electrolyte content, although the water
is very turbid, having a large amount of suspended material.
The pH value (6,0) is in the same order of magnitude as in
pure rain water (5,7). Meteoric water is always contaminated
to some extent with seawater. Deviation in the ratios of
some elements in sea water and in the glacial meltwater,
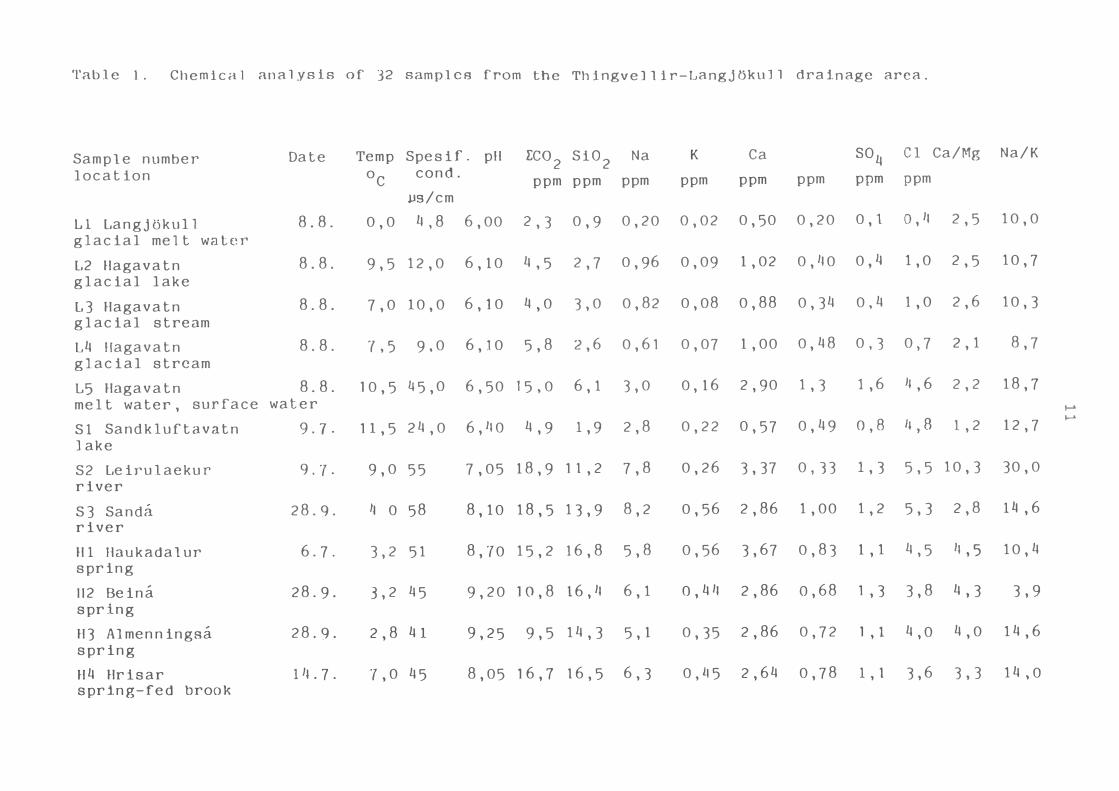
Table 1. Chemical analysis of 32 samples from the ThingveJlir-LangjOkull drainage area.
Sample number Date Temp Spesif. pll EC02
Si02
Na K Ca Mg so
4 Cl Ca/Mg Na/K
location oC
cond. ppm ppm ppm ppm ppm ppm ppm ppm JJs/cm
Ll Langjokul1 8.8. 0,0 Lt, 8 6,00 2,3 0,9 0,20 0,02 0,50 0,20 O,l 0,4 2,5 10,0
glacial melt water
L2 Hagavatn 8.8. 9,5 12,0 6,10 4 1 5 2,7 0,96 0,09 1,02 0, 40 0 ' lj 1,0 2,5 10,7
glacial lake
L3 Hagavatn 8.8. 7,0 10,0 6, 10 lj '0 3,0 0,82 0,08 0,88 0,34 0,4 1,0 2,6 10,3
glacial stream
L4 llagavatn 8.8. 7,5 9,0 6, 10 5,8 2,6 0,61. 0,07 1,00 O, 48 0,3 0,7 2, 1 8,7
glacial stream
LS Hagavatn 8.8. 10,5 lJ 5, 0 6,50 15 IO 6,1 3,0 O, 16 2,90 1,3 1 , 6 l.j 6'
2,2 18,7
melt water, surface water t-'
Sl Sandkluftavatn 9.1. 11,5 24,0 6 1 LIO 4,9 1,9 2,8 0,22 0,57 O ,49 0,8 4,8 1, 2 12,7
t-'
lake
S2 Leirulaekur 9.7. 9,0 55 7,05 18,9 11, 2 7,8 0,26 3,37 0,13 1, 3 5,5 10,3 30,0 river
S3 Sanda 28.9. l.j O 58 8, 10 18,5 13,9 8,2 0,56 2,86 1,00 1,2 5,3 2,8 lll , 6 river
Hl Haukadalur 6.7. 3,2 51 8, 70 15,2 16,8 5,8 0,56 3,67 0,83 1, 1 4,5 LI , 5 10,4 spring
112 Beina 28.9. 3,2 45 9,20 10,8 16,4 6,1 o,44 2,86 o,68 1 , 3 3,8 4 I 3 3,9 spring
H3 Almenningsa 28.9. 2,8 41 9,25 9,5 14, 3 5,1 0,35 2,86 0,72 l , 1 4,0 4,0 14,6 spring
H4 Hrisar }LL 7. 7,0 45 8,05 16,7 16,5 6,3 O I L15 2,64 0,78 1 I 1 3,6 3,3 14 IO spring-fed brook

'l'able 1. continued
Dale Temp Spesif. pH rco2
Si02
Na K Ca Mg so4
Cl Ca/Mg Na/K o
c cond. ppm ppm ppm ppm ppm ppm ppm ppm
lJs/cm
81 SLakksa 21. 9. 2,9 68,o 6,70 211 , 3 22,4 6,5 0,39 5,00 2,00 3,0 6,5 2,5 16,7 river
82 Hellisgil 28.9. 6,0 75 8,75 2 l , 6 22,4 J0,2 O, 49 4,8 0,83 2,2 6,2 5,9 20,8 mountain stream
83 Margargil 14. 7. l2, 0 77 8,55 26,4 20,4 12,8 0,38 4,10 0, 40 2,8 6,3 10,0 33,7 mountain stream
Ul Bruara ti�. 7. 4,0 36 8,55 10,6 12,4 5, LI 0,34 1,80 0,42 1 ,6 4, 1 4,3 15,9 spring-fed river
U2 Ka 1 fa Pemri 28.9. 2,5 4 9 9,85 7,5 15,9 7,6 0,34 2 , iw 0,36 1,6 3,8 6,7 22,4 spring
U3 Mvuta 28.9. 2,3 47 9,50 8,9 111 '6 6,1 0,29 2,36 0,58 1,6 3,9 4 , 1 21,0 spring
U4 Brekka 21. 9. 5,0 56 7,35 18,8 15,7 5,5 0,41 4,50 1,24 1,8 5,5 3,7 13,4 spring
US Brekka 21. 9. ,, '2 55 7,35 19,4 15,7 5,6 0, 112 4,53 1,26 1, 7 5,8 3,5 13,3 spring
U6 Brekka 9.7. 10,0 57 8,65 17,2 lll, 6 5,9 O, 4 3 4,19 0,99 1,7 5,4 4,2 13,7 spring-fed brook
U7 Brekka 14.7. 4,2 80 7,20 30,4 l9,0 spring
7,6 0,70 5,50 1,85 2,7 6,6 3,1 10,9
Ml Middalur 9.7. 3,7 58 9,65 10,8 15,2 11,3 0, 10 2,18 0,05 1, 3 11 , 4 1114 113 spring
M2 Middalur 7.8. 3,5 60 9,60 l 1, 5 15, 1 spring
11, 2 0,08 2,54 0,06 1,3 4,5 42 140
M3 Middalur 7.8. 3,5 58 9,65 11 , l 111 , 7 11, 2 0,08 2,20 0, 15 1 , 4 4,5 15 140 spring
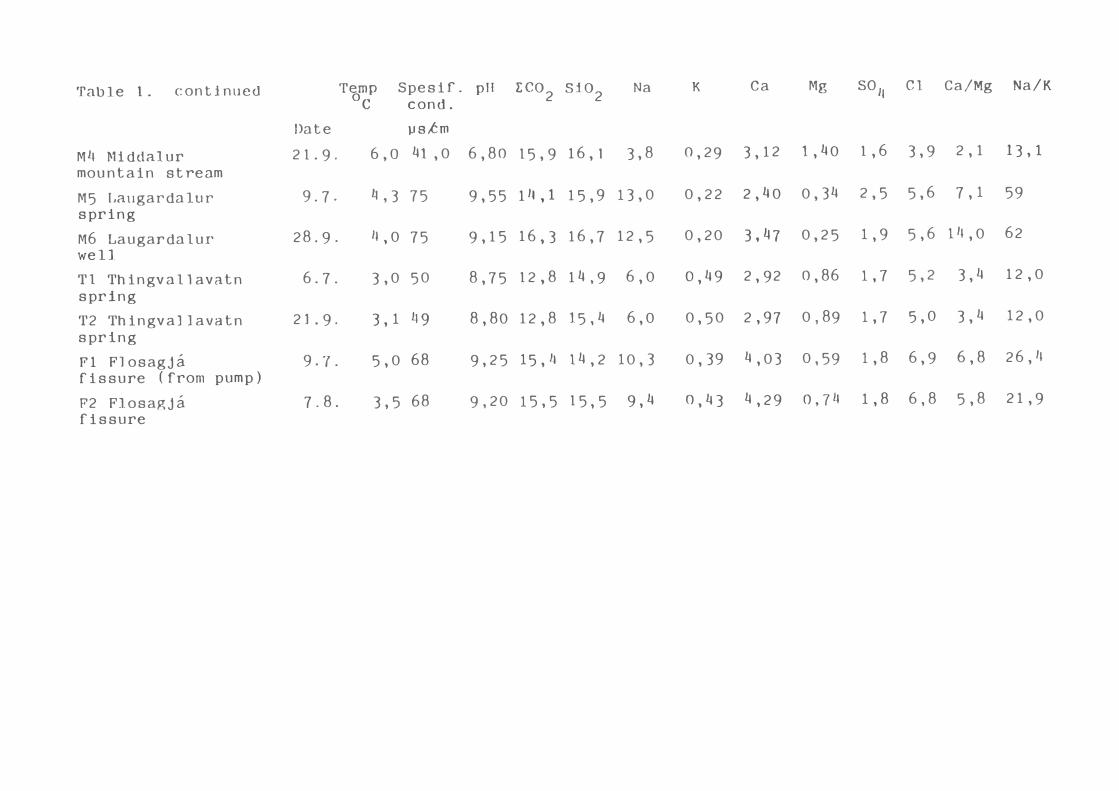
Table 1. continued Temp Spesif. pH oc cond.
I:C02 Si02Na K Ca Mg so, _1
Cl Ca/Mg Na/K
Date µs,.cm
MLI Midc.tal ur 21. 9. 6,o 41 , 0 6,80 15,9 16, 1 3,8 0,29 3,12 1,40 1,6 3,9 2,1 13,1
mountain stream
M5 Laugardalur 9.7. ,� '3 75 9,55 11� , 1 15,9 13,0 0,22 2, 40 0,34 2,5 5,6 7,1 59 spring
M6 Laugardalur 28.9. LI , 0 75 9,15 16,3 16,7 12,5 0,20 3 ' lt 7 0,25 1,9 5,6 14,0 62
well
Tl Thingvallavatn 6.7. 3,0 50 8,75 12,8 14,9 6,0 O, 49 2,92 0,86 1, 7 5,2 3,4 12,0
spring
T2 ThingvaJlavatn 21. 9. 3, 1 L19 8,80 12,8 15,4 6,0 0,50 2,97 0,89 1,7 5,0 3,4 12,0
spring
f' 1 Flosagja 9.7. 5,0 68 9,25 15,4 14, 2 10,3 0,39 4,03 0,59 1,8 6,9 6,8 26,4 fissure ( from pump)
F2 Flosagja 7.8. 3,5 68 9,20 15,5 15,5 9,4 O, 43 4,29 0, 7'-l 1,8 6,8 5,8 21,9 fissure
- lll -
which are shown in figures 2,3 and 4, can be used to
evaluate reactions between the meltwater and the suspended
solids.
2,5 Mg
2.0
1,5
1,0
0,5
0
-------------�distance from the sea o 40 80 km sea Sandkluftavatn gtacier Fig.2. CaJM�tios as a tunc1lon of the distance from the sea.
Na
30 <!'
25
20
15
10
5
0,25
0,20
o. 15
o. 10
0,05
0
...._ ____________ distance from the sea 0 40 80 km sea Sandkluftavatn glacier Fig.3. Na/K-ratios as a function of the distance from the sea.
so,
Cl
'--------------:-� distance from the sea O 40 80 km sea Sandkluftavatn glacier Fig.4. SO /Cl-ratios as a function of the distance from the sea.
- 15 -
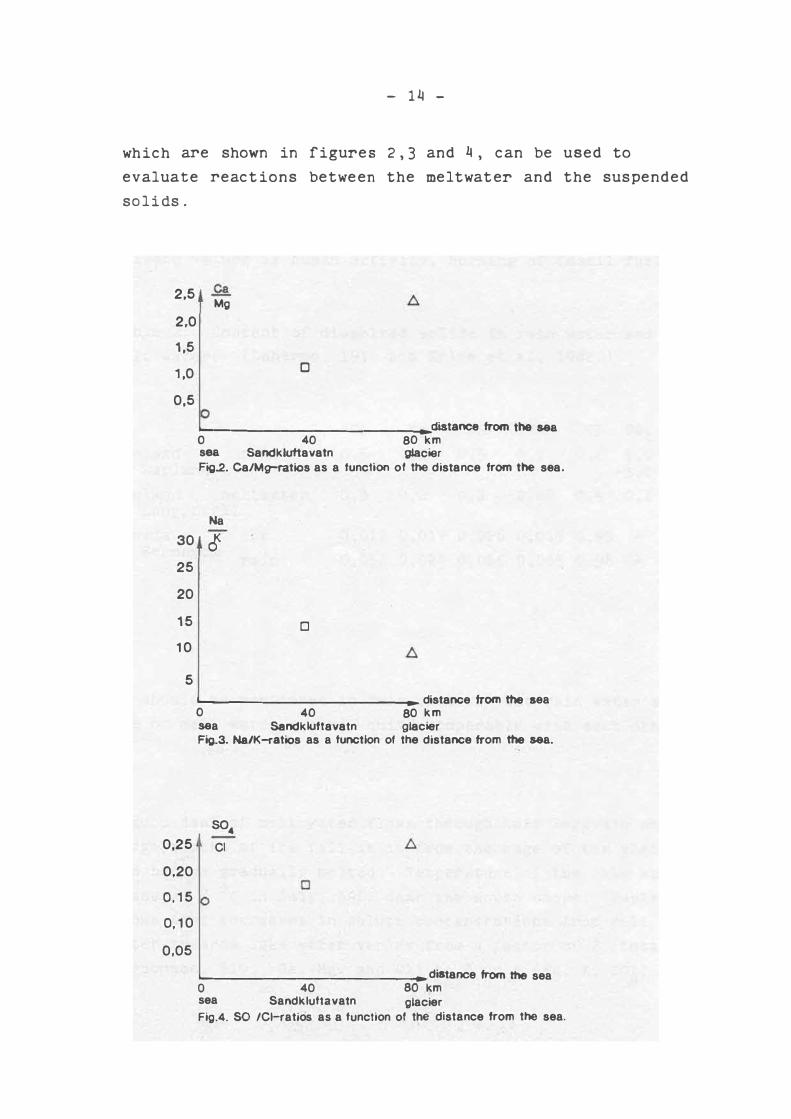
As compared to precipitation in Finnish Lapland the Ca, Mg,
Na and chloride contents are quite similar to those shown
in table 2. The potassium content is somewhat higher in
Lapland but sulfate concentrations are still higher, about
10-30 times (Lahermo, 1970). The main reason for high
sulfate values is human activity, burning of fossil fuels.
Table 2. Content of dissolved so.lids in rain water and
melt water. (Lahermo, 1970 and Eyles et al, 1982.)
Ca Mg Na K Cl so4
Finland rain 0,5 0,1 0,5 0,2 0,2 1,0 Lapland -3, O
Iceland me.ltwater 0,5 0,2 0,2 0,02 0,4 0,1 Langjokull
Canada i'ce 0,011 0,017 0,026 0,015 0,95 Berendom
rain 0,052 0,024 0,065 0,065 0,98
Si02
0,4
0,9
0,14
It should be mentioned in this context that rain water and
ice or melt water are not quite comparable with each other
A good deal of melt water flows through Lake Hagavatn and
large blocks of ice fall in it from the edge of the glacier
and become gradually melted. Temperature of the lake was
measured 8 °c in July, 1982 near the south shore. Table 1
shows that increases in solute concentrations from melt
water towards lake water varies from a factor of 2 (total
carbonate, Si02
, Ca, Mg, and Cl) to 4 or 5 (Na, K, so4).

- 16 -
These results give rise to some ideas on geochemical
denudation. Sodium and calcium are the principal elements
leached from glacier basin. The majority of Canadian
denudation (Eyles et al, 1982) is shown to be the result of
calcium loss.
The chemistry of the glacial streams at their source has
not undergone modification from meteoric water to the same
extent as the lake water. However, the amount of dissolved
solids has increased much at a sample site tens of kilo
meters downstream (table 3). Still the concentration of
sodium is highest among cations.
Table 3. The increase of dissolved matter in a glacial
river (Arnason, 1976).
Far L3
Hvita Gullfoss
Na
0,82
8,12
K
0,08
0,58
Ca
o,88
3,66
Mg
0,3�
1,31
Si02 so43,0 0,4
10,2 5,0
Cl pH
1,0 6,1
3,9 7,5
Bragi Arnason (1976) has shown that the waters issuing
from the springs in the Thingvellir-Haukadalur area
originate, at least partly, in the Langjokull glacier. The
changes in chemical composition during this subterraneous
flow warrants some discussion. When the water flows
underground it may react with the rocks. The chemical
composition of spring waters is determined by ion supply
from the atmosphere and what is leached from the rocks in
contact with the water. The atmospheric supply is deter
mined by two factors, sea water contamination in the
precipitation and carbon dioxide, which is dissolved in the

- 17 -
water. The concentrations of solutes in groundwaters of terrains covered with humus is largely controlled by a few parameters. Among these probably the most important is
the Quantity of co2
(and organic acids) generated in the soil zones by root respiration and the bacterial decay of organic matter. Virtually all of the co
2 that dissolves
in groundwater is neutralized to Hco3
by reaction withsilicate minerals. The total dissolved solids of groundwaters in such terrains therefore depends in the main on the H
2co3 content of soil water as it leaves the zone rich
in decaying organic matter, and on the extent to which H
2co3 used in silicate weathering below this zone is
replenished by the downward transport of co2. On the bases
of this one would expect low content of dissolved inorganic matter in the discharge area.
pH values of the samples under discussion increase from
6,0 to 9,85. The highest values are found in springs at
the southern end of Uthlidahraun. These springs have also the lowest total carbonite concentrations (below 10 mg/lJ. This is in accordance with early laboratory experiments (Nesbitt et al, 1980), which show that co
2reacts with
silicates the products being silicic acid and bicarbonate. At the same time pH increases. These waters have apparently flown deep enough to prevent dissolution of atmospheric co
2during their travel between recharge and discharge areas
and have reached or approached equilibrium with some
secondary minerals in the basalt at 4 °c. Silica concentrations are normally around 15 mg/1 in distant origin springs. Sodium concentrations are 6±1 mg/1, potassium 0,3±0,1 mg/1, calcium 2,4±0,5 mg/1 and magnesium 0,5±0,3
mg/1. Sulfate concentrations seem to increase with the distance of underground flow from 1,1 to 1,8 mg/1.
Chloride show the same trend; from 3,8 to 5,6 mg/1.

- 18 -
Springs in Haukadalur are similar to those at Uthlidahraun,
but have not reacted as much as infeared from their higher
magnesium content and lower pH. Mixing of local waters
with distant origin groundwater is probably seen in sample
number Hl.
The chemistry of mountain streams in Bjarnarfell differs
much from the spring waters. Samples B2 and B3 have a
little lower pH values, 8,75 and 8,55 respectively, and
higher xco2
content, 21,6 and 26,4 mg/1, compared to the
spring waters. Silica concentrations are the highest in
the studied area, 22,� and 20,4 mg/1, sodium (10,2 and 12,8
mg/1), calcium (4,86 and 4,10 mg/1) and sulfate (2,2 and
2,8 mg/1) are almost twice as high as in nearby (Hauka
dalur) springs.
Sample Bl was collected from a river, draining a rhyolitic
part of the mountain Bjarnarfell. It has a unique
chemistry among the samples: pH is low (6,70); alkalies
are low but alkaline earths high, especially magnesium
(2,0 mg/1) and sulfate (3,0 mg/1) concentrations, which
are the highest found in the study.
The Middalur and Laugardalur palagonite formation has a
distinct effect on the water composition. The highest
Ca/Mg ratios (44) and Na/K ratios (140) are found in this
region. "Normal" Ca/Mg ratios of spring waters are 3-6 and
Na/K ratios 15-20. Magnesium and potassium concentrations
are extremely low; magnesium concentrations are lower than
in melt water in Langjokull. pH values are also high: 9,60.
One explanation is the cation exchange with certain mine
rals. Cation exchange theory (Nesbitt et al, 1980)
and experimental studies (Malmqvist et al, 1978) confirm
that large cations are retained on clay minerals.

- 19 -
The high Na/K and Ca/Mg ratios probably result from cation
exchange and fixation on clay minerals where larger ions
are retained in preference to smaller ones. Water samples
MS and M6 show a similar tendency, but the respective
ratios are lower. Surface water H4 from the same area does
not show high Ca/Mg and Na/K ratios.
Springs in the northeastern shore of the Lake Thingvalla
vatn are typical grounwater discharges of distant origin
(Langjokull), but they have a little lower pH and a higher
total carbonate concentration than the springs by Uthlid.a
hraun, which might be due to the mixing of precipitation
with groundwater.
The water in Flosagja originates from mountains to the
North and North-West of the Lake Thingvallavatn (Arnason,
1976). Samples Fl and F2 have high pH values (9,25 and
9,20) although total carbonate concentrations are also
high {15,5 mg/1). So sodium and calcium concentrations
have reached a higher level as compared to the springs in
Uthlidahraun, Haukadalur and Thingvallavatn_ Chloride
content is the highest in the present study.
Typical features of surface water in the Thingvellir
Langjokull drainage area are a low pH, high temperature
{over 5 °c) and high magnesium content with high pH values.
Low Ca/Mg and Na/K ratios are typical of the local surface
water. Surface and groundwater can thus be separated from
each other by chemical methods.
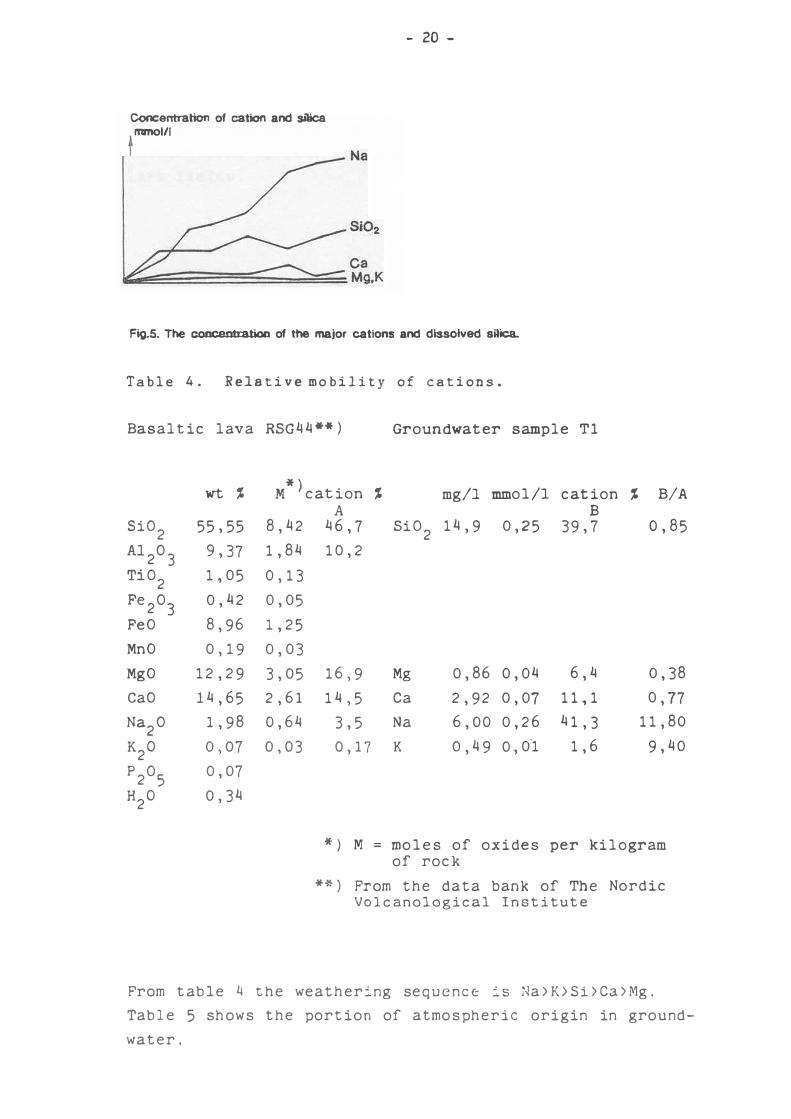
The weathering of the basaltic rocks in the study area is
shown in the figure 5, and the relative mobility of cations
during the chemical weathering of basalts is presented in
table 4.
Concentration of cation and silica
mmol/1
- 20 -
Fig.5. The conceutration of the major cations and dissolved silk:&.
Table 4. Relative mobility of cations.
Basaltic lava RSG44**) Groundwater sample Tl
wt % M*)cation % mg/1 mmol/1 cation % BIAA B
Si02 55,55 8,42 46,7 Si02 14,9 0,25 39,7 o,85 A12o3
9,37 1,84 10,2
Ti 02 1,05 0,13 Fe2o3 0,42 0,05 FeO 8,96 1,25 MnO 0,19 0,03 MgO 12,29 3,05 16,9 Mg 0,86 0,04 6,4 0,38 cao 14,65 2,61 14,5 Ca 2,92 0,07 11,1 0,77 Na2o 1,98 o,64 3,5 Na 6,00 0,26 41,3 11,80
K20 0,07 0,03 0, 17 K O, 49 0, 0·1 1,6 9,40
P205 0,07
H20 0,34
*) M = moles of oxides per kilogram of rock
**) Prom the data bank of The Nordic Volcanological Institute
From table 4 the weathering sequence �s Na>K>Si>Ca>Mg. Table 5 shows the portion of atmospheric origin in groundwater.

- 21 -
Table 5. Calculated ratios, in percent, of inorganic
matter borne by rain in groundwater discharged fro� basalt
lava fields.
Ca Mg Na K so4
Cl Si02
Tl 2,92 0,86 6,0 0,49 1,7 5,2 14,9
Ll 0,50 0,20 0,2 0,02 0,1 0,4 0,9
Ll/Tl 100% 17 23 3 4 6 8 8
*) silicic % 10-15 5-10 30 40 30-100 30 5
*) subsilicic % 5 5 40 40 10-40 30 5
*) Finnish Lapland (Lahermo, 1970)
From table 5 it can be seen that the portions of atmospheric
origin in groundwater are low. They might be higher if
evaporation and respiration are estimated.
The next three figures show the most significant corre1a·
tions found among values of table 1. Figure 6 illustrates
correlation between pH values and silica concentrations,
figure 7 pH values and total carbonate concentrations
and figure 8 the correlation between the ratious Na/K
and Ca/Mg.

pH 10 ~
.u2
M3!4~1
•u3 eM5
F2 H2 • • • F1 ,H3 •Me 9~
T1T2 H1 B2 ~· • U1 • 83
• • 83 H4 • • 81 '
N N
I
U4 •u5
.ur 92
71 • •M4
81 • l5 • • 81
6~ • l1
u .. ,_3 L2
6 10 15 20 25 8102 Fig. 6. pH values versus silica. mg/I

101
91
8~
7
6
pH
• l1
• 81
, . . L:, L2 L4
5
• U2
• U3
• H3
10
Flg.7. pH values versus total carbonate.
M3 ••• M1 M2
• H2
T2
' T1 • U1
• M5
F1
' F2 M6
• H1
• L6
15
• H4
• M4
• U6
• S3
• • U4 U6
• S2
20
• B2
• 81
• 83
26
• U7
30 mg/I
Lco2
N \.tJ

Ca Mg
40
30
20
14 1 12
10 • • S2
8
8 •U2•Ft
a21 f'2
4 • ' H3UhU3 H2 J1~\>4,U5,U9
2 ur~.. ~5 91
10 20 30 40 150
Fig. 8. Ca/Mg ratios veraua Na/K ratios.
• Me
• MS
80 70 80 90 100 110
• Mt
120 130
• M2
• M3
140
N•IK
~
•
- 25 -
REFERENCES
Arnason,B., Groundwater Systems in Iceland Traced by Deuterium, 1976.
Butler, D., Lyons, W.B., Hassinger, J., and Mayewski, P.A., Shallow core snow chemistry of AthabascaGlacier, Alberta, Can. J. Earth Sci 17, 278-281, 1980.
-
Eyles, N., Sasseville, D.R., Slatt, R.M.� and Roderson, R.J., Geochemical denudation rates and solutetransport mechanisms in a maritime temperateglacier basin, Can. J. Earth Sci 1:..2., 1570-1581, 1982.
Fritz, J.S., Yamamura, S.S., and Richard, M.J., Titration of sulfate following separation with alumina, Anal. Chem. 29, 158-161, 1957.
Holland, H.D., The Chemistry of the Atmosphere and Oceans, John Wiley & Sons, 1978.
Jones, J.G., Intraglacial volcanoes of the Laugarvatn region, South-West Iceland I, Quart. Journ. Geol. Soc. Lond., vol. 124, 197-211, 1969.
Jones, J.G., Intraglacial volcanoes of the Laugarvatn region, South-West Iceland II, Journ. Geol., vol. 78, 127-140, 1970.
Kjartansson, G., Geological Map of Iceland, Sheet 6, South-Central Iceland (1:250000), Menningasjodur, Rvik, 1962.
Kjartansson, G., Geological Map of Iceland, Sheet 5, Central Iceland (1:250000), Menningasjodur, Rvik, 1965.
Kjartansson, G., Geological Map of Iceland, Sheet 2, West-Central Iceland (1:250000), Menningasjodur, Rvik, 1968.
Lahermo, P., Chemical geology of ground ?,.nd S1:;1.Tface waters in Pinn�sh Lapland, Bull. Comm. Geol. Finl. 242, 1-106, 1970.
Malmqvist, L., Bergstrom, R., and Englund, A., Geochemical properties of a small stream in glaciated terrain, Geochemical presses., 1978.
Nesbitt, H.W., Marcovics, G. 1
and Price, R.C., Chemical processes affecting alkalis and alkaline earths during continental weathering, Geochim. Cosmochim. Acta .:t..:±_, 1659-1666, 1980.
Rist, S., Islenzk votn, 1956. Rist, S., Vatnasvid Hvitar-olfusar, Orkustofnum, 1973.
- 26 -
Saemundsson, K., and Einarsson, S., Geological Map of Iceland, Sheet 3, South-West Iceland (1:250000), 2. ed., Naturufraedistofnun Islands & LandmaelingarIslands, Rvik, 1980.
Standard Methods for the Examination of Water and Wastewater, 13th Edition, APHA Washington, 1971.
Tomasson, H., Hrauneyjarfoss, Geological report, Research Report of the National Energy Authority, prepared for the National Power Company, 1971.


![8701 Acuarela Brochure FINAL - heylhomes.comheylhomes.com/available/8701 Acuarela Brochure FINAL.pdf · IIB"IIIU] reayåas Dinina/ LivinÀ 28116 DBL. OVEN . H o M E s . Title: 8701](https://static.fdocuments.in/doc/165x107/5bb8297d09d3f21e6a8c23ef/8701-acuarela-brochure-final-acuarela-brochure-finalpdf-iibiiiu-reayaas.jpg)