
Nordic Statistics 2017 - DiVA portal1146911/FULLTEXT05.pdf · Nordic co-operation has firm...
64
Nordic Statistics 2017
Transcript of Nordic Statistics 2017 - DiVA portal1146911/FULLTEXT05.pdf · Nordic co-operation has firm...

NordicStatistics 2017

2
KolofonNordic Statistics 2017
Ed: Klaus Munch Haagensen, Statistics DenmarkUlla Agerskov, Nordic Council of MinistersDatabase: Troels A. Vestergaard, Statistics Denmark
ANP 2017:748 ISBN 978-92-893-5100-3 (PRINT)ISBN 978-92-893-5101-0 (PDF)ISBN 978-92-893-5102-7 (EPUB)ISSN 2414-6609 (ONLINE)ISSN 2414-6595 (PRINT)http://dx.doi.org/10.6027/ANP2017-748
© Nordic Council of Ministers 2017
Layout: Mette Agger TangPrint: Arco SpecialtrykkerietPrinted in Denmark
NO
RDIC
SWAN ECOLABE
L
PR
INTED MATTER 541
-618
Nordic co-operation Nordic co-operation is one of the world’s most extensive forms of regional collaboration, involving Denmark, Finland, Iceland, Norway, Sweden, the Faroe Islands, Greenland, and Åland. Nordic co-operation has firm traditions in politics, the economy, and culture. It plays an important role in European and international collaboration, and aims at creating a strong Nordic community in a strong Europe.Nordic co-operation seeks to safeguard Nordic and regional interests and principles in the global community. Shared Nordic values help the region solidify its position as one of the world’s most innovative and competitive.

3
Nordic Statistics 2017

5
Preface
Although small individually, the importance of the Nordic countries as a group is considerable. Did you know that the combined gross domestic product of the Nordic Region makes it the world’s twelfth largest economy? Or even that the Nordic Region is bigger than the whole of India, making it the seventh largest landmass in the world?
This pocket edition of Nordic Statistics 2017 offers a glimpse into the data that helps to paint a picture of our Nordic society – for example, that every resident of Iceland visits the theatre twice as often as those living in Denmark, Norway and Sweden.
For more information on this data, please visit www.norden.org/facts for links to Nordic Statistics and for more data that opens the door to countless fascinating analyses.
Happy reading!
6
Symbols Nil -Less than half 0Not applicable .Data not available ..Link to database :
Country codesDenmark DKFaroe Islands FOGreenland GLFinland FIÅland AXIceland ISNorway NOSweden SENordic Region NREuro area EAThe European Union EU
7
Contents / themes
The Nordics ....................................................................................8The Nordic Region in an international context .................. 10 Nordic green ................................................................................ 16Gender, business and work...................................................... 24Nordic welfare ............................................................................ 30Children and young people ...................................................... 38Innovation and creativity ......................................................... 48Economy ...................................................................................... 56
8
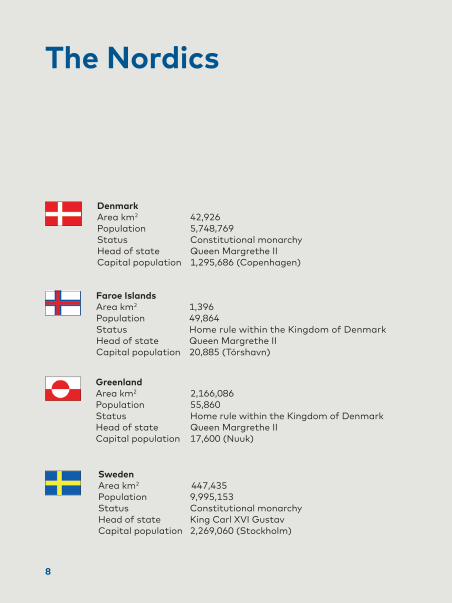
Sweden Area km2 447,435Population 9,995,153Status Constitutional monarchyHead of state King Carl XVI GustavCapital population 2,269,060 (Stockholm)
DenmarkArea km2 42,926 Population 5,748,769Status Constitutional monarchy Head of state Queen Margrethe IICapital population 1,295,686 (Copenhagen)
Greenland Area km2 2,166,086Population 55,860Status Home rule within the Kingdom of DenmarkHead of state Queen Margrethe IICapital population 17,600 (Nuuk)
Faroe IslandsArea km2 1,396Population 49,864Status Home rule within the Kingdom of DenmarkHead of state Queen Margrethe II Capital population 20,885 (Tórshavn)
The Nordics

9
FinlandArea km2 338 430Population 5,503,297Status RepublicHead of state President Sauli NiinistöCapital population 1,138,502 (Helsinki)
IcelandArea km2 103,492Population 338,349Status RepublicHead of state President Guðni JóhannessonCapital population 216,878 (Reykjavik)
Åland Area km2 1,581Population 29,214Status Home rule within the Republic of FinlandHead of state President Sauli Niinistö Capital population 11,565 (Mariehamn)
Norway Area km2 323,781Population 5,258,317Status Constitutional monarchyHead of state King Harald V Capital population 1,281,127 (Oslo)

10 ECONOMY
KEY FIGURES 2016*
The Nordic Regionin an international context
*2016 or most recent accessible data. In this table, the Nordic Region consists of Denmark, Finland, Iceland, Norway and Sweden. Purchasing power standards (PPS) are designed to eliminate differences in price levels between the member states.
10
ECONOMY 11
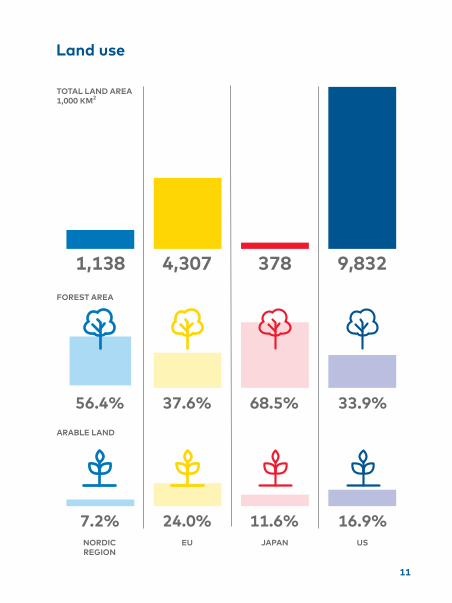
EUNORDIC REGION
USJAPAN
7.2% 24.0% 11.6% 16.9%
Land use
FOREST AREA
ARABLE LAND
9,8323784,3071,138
56.4% 37.6% 68.5% 33.9%
TOTAL LAND AREA1,000 KM2
11
2
12 ECONOMY
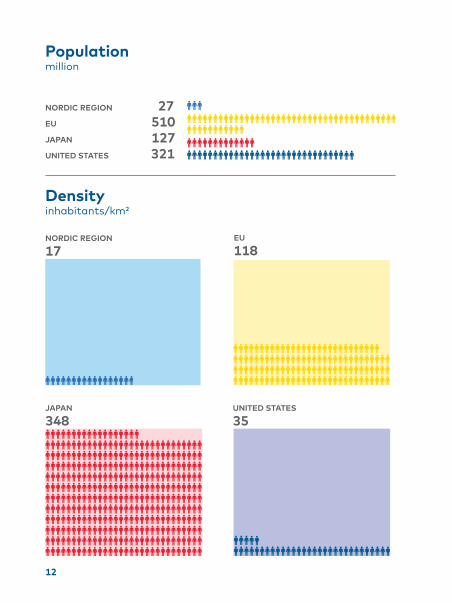
Population million
NORDIC REGION 27EU 510JAPAN 127UNITED STATES 321
NORDIC REGION 17
EU 118
JAPAN 348
UNITED STATES 35
Densityinhabitants/km²
ECONOMY 13
EUTHE NORDIC REGION
USJAPAN
1.91.41.61.8
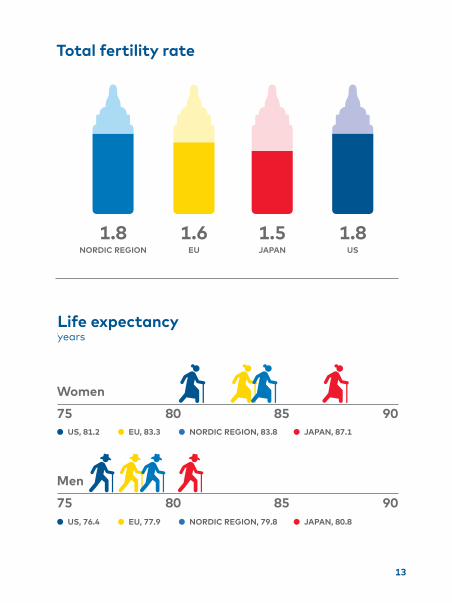
1.8 1.6 1.5 1.8EUNORDIC REGION USJAPAN
Total fertility rate
Total fertility rate
Life expectancyYears
75 80 85 90
Women
75 80 85 90
Men
THE NORDIC REGION EU JAPAN US
Life expectancyyears
● US, 76.4 ● EU, 77.9 ● NORDIC REGION, 79.8 ● JAPAN, 80.8
● US, 81.2 ● EU, 83.3 ● NORDIC REGION, 83.8 ● JAPAN, 87.1

14 ECONOMY
EUNORDIC REGION
USJAPAN
2.0 1.9 1.0 1.6
GDP
GDP PER CAPITAPPS, USD
GDP GROWTH%
18,5695,28719,9041,362
50,693 38,918 40,737 56,066
TOTAL GDP BILLION PPS, USD

ECONOMY 15
NORDIC EU JAPAN US REGION
USEU
Taxes% of GDP
NORDIC REGION
JAPAN
42 37 32 26
2,27
3
2,000
1,500
1,000
500
0
423
2,01
6
622
627
1,51
0
365
1,85
9
Exports / importsbillion USD

16
Since 2000, the Nordic economies have grown 28% and CO2 emissions have fallen by 18%.
PHO
TO: S
CA
NPI
X

17
Nordic green
18 NORDIC GREEN
Nordic Green
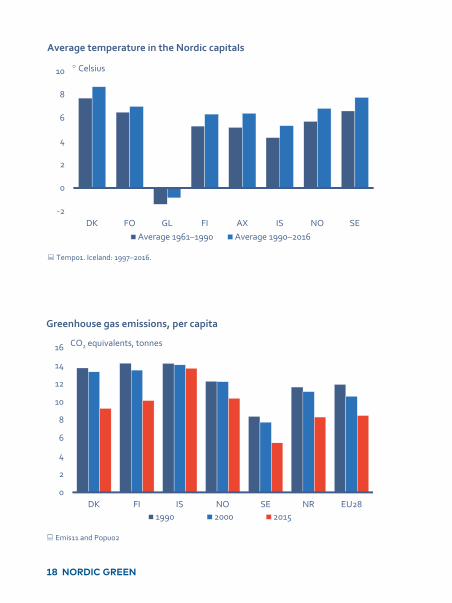
Average temperature in the Nordic capitals
Temp01. Iceland: 1997–2016.
‐2
0
2
4
6
8
10
DK FO GL FI AX IS NO SEAverage 1961–1990 Average 1990–2016
Celsius
Greenhouse gas emissions, per capita
Emis11 and Popu02
0
2
4
6
8
10
12
14
16
DK FI IS NO SE NR EU281990 2000 2015
CO2 equivalents, tonnes
Decoupling environmental impact from economic growth
Emis11 and Naac01
80
90
100
110
120
130
GDP Greenhouse gas emissions
Nordic Region2000=100
+ 28 %
- 18 %
Decoupling environmental impact from economic growth
Emis11 and Naac01
80
90
100
110
120
130
GDP Greenhouse gas emissions
2000=100 EU28
+ 21 %
- 16 %

NORDIC GREEN 19
Nordic Green
Average temperature in the Nordic capitals
Temp01. Iceland: 1997–2016.
‐2
0
2
4
6
8
10
DK FO GL FI AX IS NO SEAverage 1961–1990 Average 1990–2016
Celsius
Greenhouse gas emissions, per capita
Emis11 and Popu02
0
2
4
6
8
10
12
14
16
DK FI IS NO SE NR EU281990 2000 2015
CO2 equivalents, tonnes
Decoupling environmental impact from economic growth
Emis11 and Naac01
80
90
100
110
120
130
GDP Greenhouse gas emissions
Nordic Region2000=100
+ 28 %
- 18 %
Decoupling environmental impact from economic growth
Emis11 and Naac01
80
90
100
110
120
130
GDP Greenhouse gas emissions
2000=100 EU28
+ 21 %
- 16 %
20 NORDIC GREEN
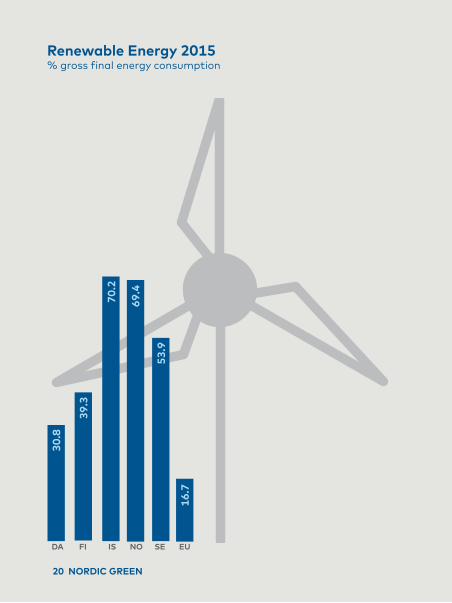
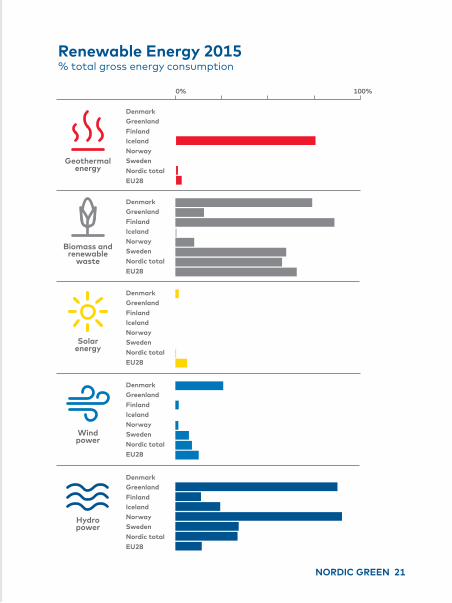
Renewable Energy 2015% gross final energy consumption
DA FI IS NO SE EU
30.8
39.3
70.2
69.4
53.9
16.7
20 NORDIC GREEN
NORDIC GREEN 21
Biomass and renewable
waste
DenmarkGreenlandFinlandIcelandNorwaySwedenNordic totalEU28
Solar energy
DenmarkGreenlandFinlandIcelandNorwaySwedenNordic totalEU28
Windpower
DenmarkGreenlandFinlandIcelandNorwaySwedenNordic totalEU28
Hydro power
DenmarkGreenlandFinlandIcelandNorwaySwedenNordic totalEU28
Renewable Energy 2015% total gross energy consumption
Geothermal energy
Denmark
0% 100%
GreenlandFinlandIcelandNorwaySwedenNordic totalEU28
22 NORDIC GREEN
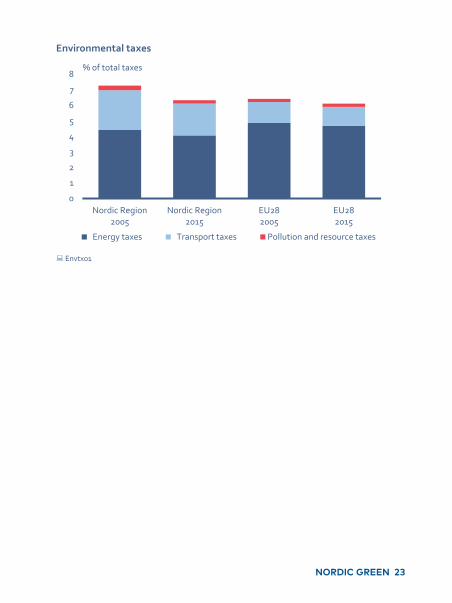
Environmental taxes
Envtx01
0
1
2
3
4
5
6
7
8
Nordic Region2005
Nordic Region2015
EU282005
EU282015
Energy taxes Transport taxes Pollution and resource taxes
% of total taxes
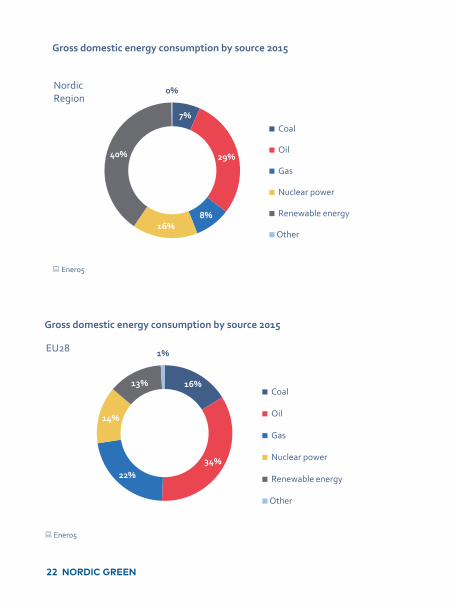
Gross domestic energy consumption by source 2015
Ener05
7%
29%
8%16%
40%
0%
Coal
Oil
Gas
Nuclear power
Renewable energy
Other
Nordic Region
Gross domestic energy consumption by source 2015
Ener05
16%
34%22%
14%
13%
1%
Coal
Oil
Gas
Nuclear power
Renewable energy
Other
EU28
NORDIC GREEN 23
Environmental taxes
Envtx01
0
1
2
3
4
5
6
7
8
Nordic Region2005
Nordic Region2015
EU282005
EU282015
Energy taxes Transport taxes Pollution and resource taxes
% of total taxes
Gross domestic energy consumption by source 2015
Ener05
7%
29%
8%16%
40%
0%
Coal
Oil
Gas
Nuclear power
Renewable energy
Other
Nordic Region
Gross domestic energy consumption by source 2015
Ener05
16%
34%22%
14%
13%
1%
Coal
Oil
Gas
Nuclear power
Renewable energy
Other
EU28
24
In the Nordic Region, 7 out of 10 women are in work. The comparable figure for the EU is 5 out of 10.
PHO
TO: U
NS
PLA
SH

25
Gender, business and work
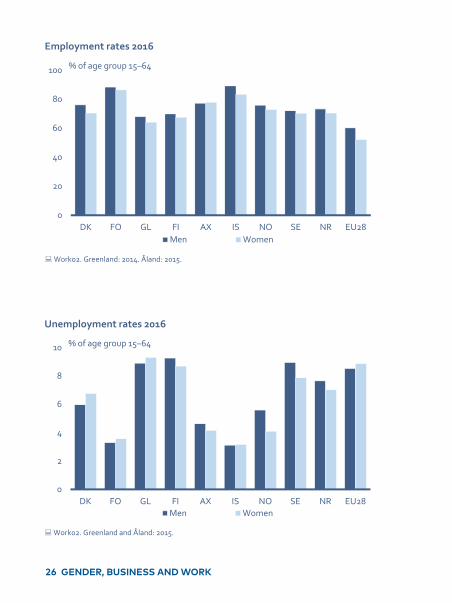
26 GENDER, BUSINESS AND WORK
Unemployment rates 2016
Work02. Greenland and Åland: 2015.
0
2
4
6
8
10
DK FO GL FI AX IS NO SE NR EU28Men Women
% of age group 15–64
54%46%
Men
Women
EU28
All employed by gender 2016
Work02
52%48%
Men
Women
Nordic Region
Gender, business and work
Employment rates 2016
Work02. Greenland: 2014. Åland: 2015.
0
20
40
60
80
100
DK FO GL FI AX IS NO SE NR EU28Men Women
% of age group 15–64

GENDER, BUSINESS AND WORK 27
54%46%
Men
Women
EU28
All employed by gender 2016
Work02
52%48%
Men
Women
Nordic Region
Gender, business and work
Employment rates 2016
Work02. Greenland: 2014. Åland: 2015.
0
20
40
60
80
100
DK FO GL FI AX IS NO SE NR EU28Men Women
% of age group 15–64
Gender wage gap%
NORDIC REGION
EU28
15.3 16.3
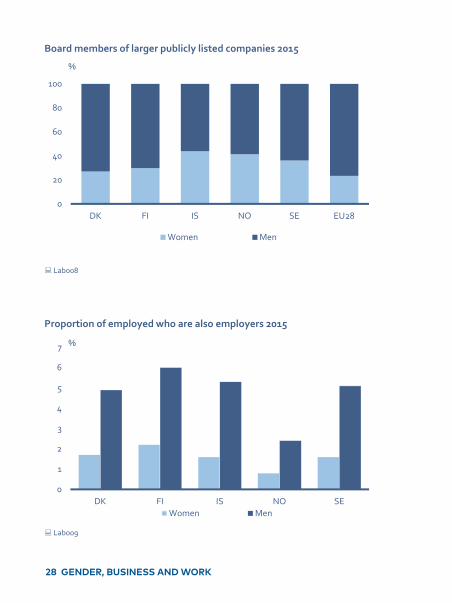
28 GENDER, BUSINESS AND WORK
Board members of larger publicly listed companies 2015
Labo08
0
20
40
60
80
100
DK FI IS NO SE EU28
Women Men
%
Proportion of employed who are also employers 2015
Labo09
0
1
2
3
4
5
6
7
DK FI IS NO SEWomen Men
%
Parental leave
Soci04
0
5
10
15
20
25
30
35
DK FI IS NO SE
2000 2015
% of total days taken by men

GENDER, BUSINESS AND WORK 29
DENMARK FINLAND ICELAND NORWAY SWEDEN
10 11 30 21 27
Share of parental leave taken by fathers%
Board members of larger publicly listed companies 2015
Labo08
0
20
40
60
80
100
DK FI IS NO SE EU28
Women Men
%
Proportion of employed who are also employers 2015
Labo09
0
1
2
3
4
5
6
7
DK FI IS NO SEWomen Men
%
Parental leave
Soci04
0
5
10
15
20
25
30
35
DK FI IS NO SE
2000 2015
% of total days taken by men
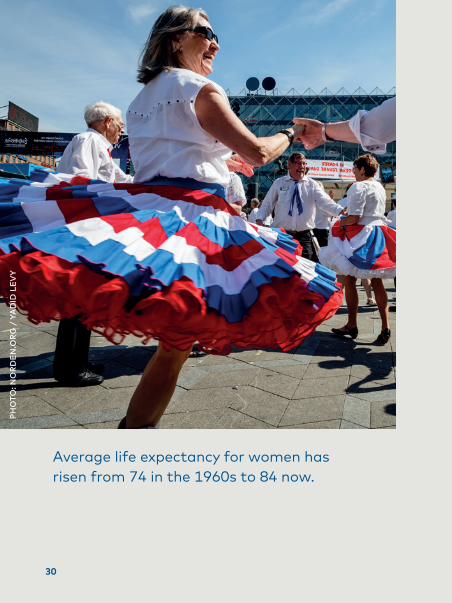
30
Average life expectancy for women has risen from 74 in the 1960s to 84 now.
PHO
TO: N
OR
DE
N.O
RG
/ Y
AD
ID L
EV
Y
31
Nordic welfare
32 NORDIC WELFARE
Nordic welfare
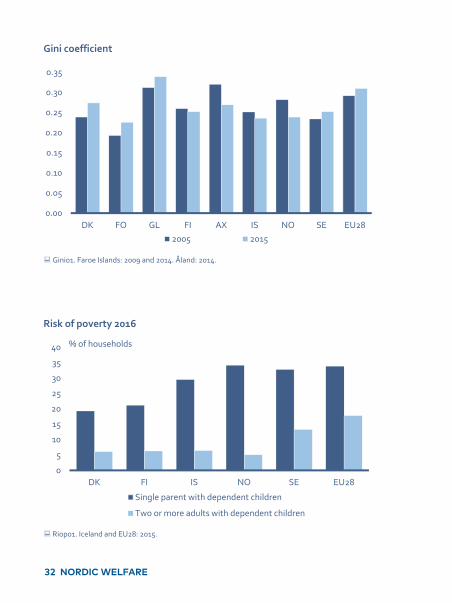
Gini coefficient
Gini01. Faroe Islands: 2009 and 2014. Åland: 2014.
0.00
0.05
0.10
0.15
0.20
0.25
0.30
0.35
DK FO GL FI AX IS NO SE EU282005 2015
Risk of poverty 2016
Riop01. Iceland and EU28: 2015.
0
5
10
15
20
25
30
35
40
DK FI IS NO SE EU28
Single parent with dependent children
Two or more adults with dependent children
% of households
Recipients of financial social assistance
Soci12. Finland: 2015=2014.
0
1
2
3
4
DK FO FI IS NO SE
2005 2010 2015
% of population aged 18+
Social expenditure by source 2014
Soex06
0
20
40
60
80
100
DK FO FI IS NO SE
Public authorities Employers Insured Other means
% of total expenditure

NORDIC WELFARE 33
Nordic welfare
Gini coefficient
Gini01. Faroe Islands: 2009 and 2014. Åland: 2014.
0.00
0.05
0.10
0.15
0.20
0.25
0.30
0.35
DK FO GL FI AX IS NO SE EU282005 2015
Risk of poverty 2016
Riop01. Iceland and EU28: 2015.
0
5
10
15
20
25
30
35
40
DK FI IS NO SE EU28
Single parent with dependent children
Two or more adults with dependent children
% of households
Recipients of financial social assistance
Soci12. Finland: 2015=2014.
0
1
2
3
4
DK FO FI IS NO SE
2005 2010 2015
% of population aged 18+
Social expenditure by source 2014
Soex06
0
20
40
60
80
100
DK FO FI IS NO SE
Public authorities Employers Insured Other means
% of total expenditure
34 NORDIC WELFARE
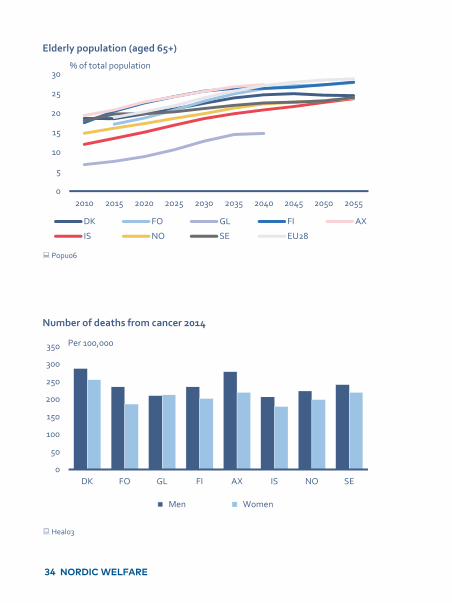
Elderly population (aged 65+)
Popu06
0
5
10
15
20
25
30
2010 2015 2020 2025 2030 2035 2040 2045 2050 2055
DK FO GL FI AX
IS NO SE EU28
% of total population
Number of deaths from cancer 2014
Heal03
0
50
100
150
200
250
300
350
DK FO GL FI AX IS NO SE
Men Women
Per 100,000
Total fertility rate 2016
Chil02. Greenland: 2015
0.0
0.5
1.0
1.5
2.0
2.5
3.0
DK FO GL FI AX IS NO SE NR EU28
Life expectancy 2016
Life01. Greenland, Åland and EU28: 2015
66
6870
72
7476
78
80
8284
86
DK FO GL FI AX IS NO SE NR EU28Men Women
Years

NORDIC WELFARE 35
Elderly population (aged 65+)
Popu06
0
5
10
15
20
25
30
2010 2015 2020 2025 2030 2035 2040 2045 2050 2055
DK FO GL FI AX
IS NO SE EU28
% of total population
Number of deaths from cancer 2014
Heal03
0
50
100
150
200
250
300
350
DK FO GL FI AX IS NO SE
Men Women
Per 100,000
Total fertility rate 2016
Chil02. Greenland: 2015
0.0
0.5
1.0
1.5
2.0
2.5
3.0
DK FO GL FI AX IS NO SE NR EU28
Life expectancy 2016
Life01. Greenland, Åland and EU28: 2015
66
6870
72
7476
78
80
8284
86
DK FO GL FI AX IS NO SE NR EU28Men Women
Years
36 NORDIC WELFARE
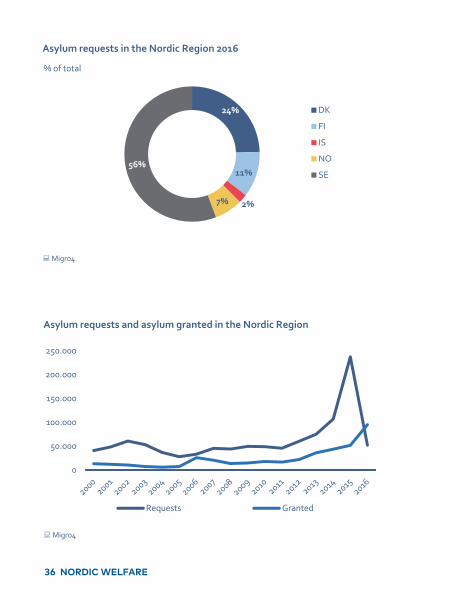
Asylum requests in the Nordic Region 2016
Migr04
24%
11%
2%7%
56%
DK
FI
IS
NO
SE
% of total
Asylum requests and asylum granted in the Nordic Region
Migr04
0
50.000
100.000
150.000
200.000
250.000
Requests Granted
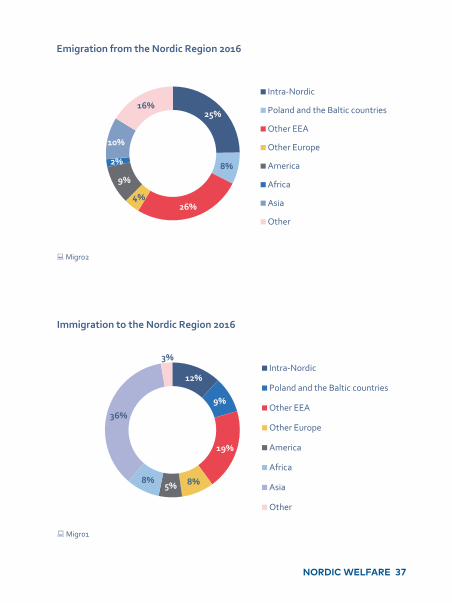
Emigration from the Nordic Region 2016
Migr02
25%
8%
26%4%
9%
2%
10%
16%
Intra‐Nordic
Poland and the Baltic countries
Other EEA
Other Europe
America
Africa
Asia
Other
Immigration to the Nordic Region 2016
Migr01
12%
9%
19%
8%5%8%
36%
3%Intra‐Nordic
Poland and the Baltic countries
Other EEA
Other Europe
America
Africa
Asia
Other
NORDIC WELFARE 37
Asylum requests in the Nordic Region 2016
Migr04
24%
11%
2%7%
56%
DK
FI
IS
NO
SE
% of total
Asylum requests and asylum granted in the Nordic Region
Migr04
0
50.000
100.000
150.000
200.000
250.000
Requests Granted
Emigration from the Nordic Region 2016
Migr02
25%
8%
26%4%
9%
2%
10%
16%
Intra‐Nordic
Poland and the Baltic countries
Other EEA
Other Europe
America
Africa
Asia
Other
Immigration to the Nordic Region 2016
Migr01
12%
9%
19%
8%5%8%
36%
3%Intra‐Nordic
Poland and the Baltic countries
Other EEA
Other Europe
America
Africa
Asia
Other
38
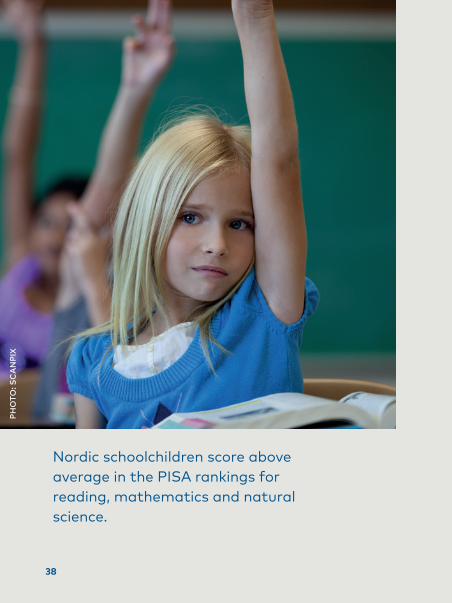
Nordic schoolchildren score above average in the PISA rankings for reading, mathematics and natural science.
PHO
TO: S
CA
NPI
X
39
Children and young people

40 CHILDREN AND YOUNG PEOPLE
Children and young people
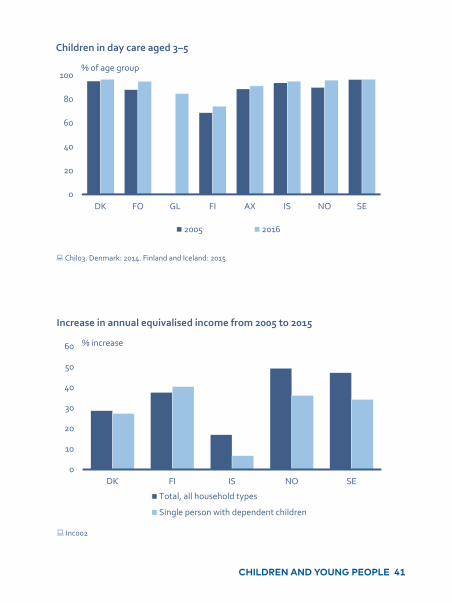
Children in day care aged 3–5
Chil03. Denmark: 2014. Finland and Iceland: 2015.
0
20
40
60
80
100
DK FO GL FI AX IS NO SE
2005 2016
% of age group
Most popular names – newborn 2016
SofiaNivi
AnnaSofiaAlice
EmiliaNoraAlice
NoahInuk
BenjaminOnniLeonAron
WilliamOscar
DENMARK
GREENLAND
FAROE ISLANDS
FINLAND
ÅLAND
ICELAND (2015)
NORWAY
SWEDEN
Increase in annual equivalised income from 2005 to 2015
Inco02
0
10
20
30
40
50
60
DK FI IS NO SE
Total, all household types
Single person with dependent children
% increase
CHILDREN AND YOUNG PEOPLE 41
Children and young people
Children in day care aged 3–5
Chil03. Denmark: 2014. Finland and Iceland: 2015.
0
20
40
60
80
100
DK FO GL FI AX IS NO SE
2005 2016
% of age group
Increase in annual equivalised income from 2005 to 2015
Inco02
0
10
20
30
40
50
60
DK FI IS NO SE
Total, all household types
Single person with dependent children
% increase
42 CHILDREN AND YOUNG PEOPLE
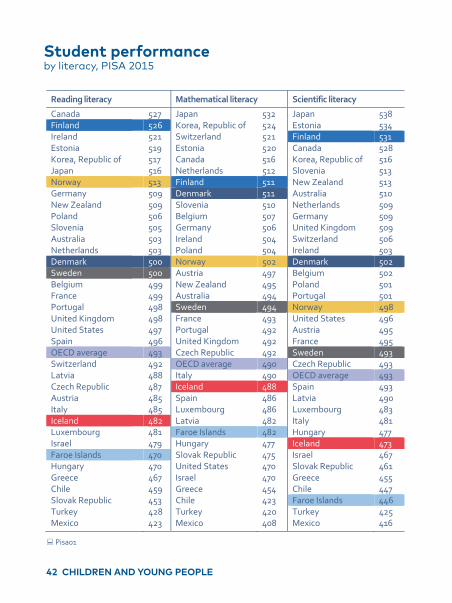
Student performance by literacy, PISA 2015
Reading literacy Mathematical literacy Scientific literacy
Canada 527 Japan 532 Japan 538 Finland 526 Korea, Republic of 524 Estonia 534 Ireland 521 Switzerland 521 Finland 531 Estonia 519 Estonia 520 Canada 528 Korea, Republic of 517 Canada 516 Korea, Republic of 516 Japan 516 Netherlands 512 Slovenia 513 Norway 513 Finland 511 New Zealand 513 Germany 509 Denmark 511 Australia 510 New Zealand 509 Slovenia 510 Netherlands 509 Poland 506 Belgium 507 Germany 509 Slovenia 505 Germany 506 United Kingdom 509 Australia 503 Ireland 504 Switzerland 506 Netherlands 503 Poland 504 Ireland 503 Denmark 500 Norway 502 Denmark 502 Sweden 500 Austria 497 Belgium 502 Belgium 499 New Zealand 495 Poland 501 France 499 Australia 494 Portugal 501 Portugal 498 Sweden 494 Norway 498 United Kingdom 498 France 493 United States 496 United States 497 Portugal 492 Austria 495 Spain 496 United Kingdom 492 France 495 OECD average 493 Czech Republic 492 Sweden 493 Switzerland 492 OECD average 490 Czech Republic 493 Latvia 488 Italy 490 OECD average 493 Czech Republic 487 Iceland 488 Spain 493 Austria 485 Spain 486 Latvia 490 Italy 485 Luxembourg 486 Luxembourg 483 Iceland 482 Latvia 482 Italy 481 Luxembourg 481 Faroe Islands 482 Hungary 477 Israel 479 Hungary 477 Iceland 473 Faroe Islands 470 Slovak Republic 475 Israel 467 Hungary 470 United States 470 Slovak Republic 461 Greece 467 Israel 470 Greece 455 Chile 459 Greece 454 Chile 447 Slovak Republic 453 Chile 423 Faroe Islands 446 Turkey 428 Turkey 420 Turkey 425 Mexico 423 Mexico 408 Mexico 416
Pisa01
Student performanceby literacy, PISA 2015

CHILDREN AND YOUNG PEOPLE 43
MATHEMATICS
SCIENCE
OECD AVERAGE
493
PISA 2015
500 526 482 513 500
DENMARK
OECD AVERAGE
OECD AVERAGE
FINLAND ICELAND NORWAY SWEDEN
511 511 488 502 494
502 531 473 498 493
READING
493
490
Student performance by literacy, PISA 2015
Reading literacy Mathematical literacy Scientific literacy
Canada 527 Japan 532 Japan 538 Finland 526 Korea, Republic of 524 Estonia 534 Ireland 521 Switzerland 521 Finland 531 Estonia 519 Estonia 520 Canada 528 Korea, Republic of 517 Canada 516 Korea, Republic of 516 Japan 516 Netherlands 512 Slovenia 513 Norway 513 Finland 511 New Zealand 513 Germany 509 Denmark 511 Australia 510 New Zealand 509 Slovenia 510 Netherlands 509 Poland 506 Belgium 507 Germany 509 Slovenia 505 Germany 506 United Kingdom 509 Australia 503 Ireland 504 Switzerland 506 Netherlands 503 Poland 504 Ireland 503 Denmark 500 Norway 502 Denmark 502 Sweden 500 Austria 497 Belgium 502 Belgium 499 New Zealand 495 Poland 501 France 499 Australia 494 Portugal 501 Portugal 498 Sweden 494 Norway 498 United Kingdom 498 France 493 United States 496 United States 497 Portugal 492 Austria 495 Spain 496 United Kingdom 492 France 495 OECD average 493 Czech Republic 492 Sweden 493 Switzerland 492 OECD average 490 Czech Republic 493 Latvia 488 Italy 490 OECD average 493 Czech Republic 487 Iceland 488 Spain 493 Austria 485 Spain 486 Latvia 490 Italy 485 Luxembourg 486 Luxembourg 483 Iceland 482 Latvia 482 Italy 481 Luxembourg 481 Faroe Islands 482 Hungary 477 Israel 479 Hungary 477 Iceland 473 Faroe Islands 470 Slovak Republic 475 Israel 467 Hungary 470 United States 470 Slovak Republic 461 Greece 467 Israel 470 Greece 455 Chile 459 Greece 454 Chile 447 Slovak Republic 453 Chile 423 Faroe Islands 446 Turkey 428 Turkey 420 Turkey 425 Mexico 423 Mexico 408 Mexico 416
Pisa01

44 CHILDREN AND YOUNG PEOPLE
Higher education students 2015
Educ02 and Popu02. Greenland: 2012. Åland: Includes only students at Åland University of Applied Sci‐ences. Sweden: 2014.
0
2
4
6
8
10
12
14
16
18
20
DK GL FI AX IS NO SE
% of age group 20–39
Higher education students
Educ02 and Popu02
0
2
4
6
8
10
12
14
16
2000 2005 2015Men Women
% of age group 20–39, Nordic Region
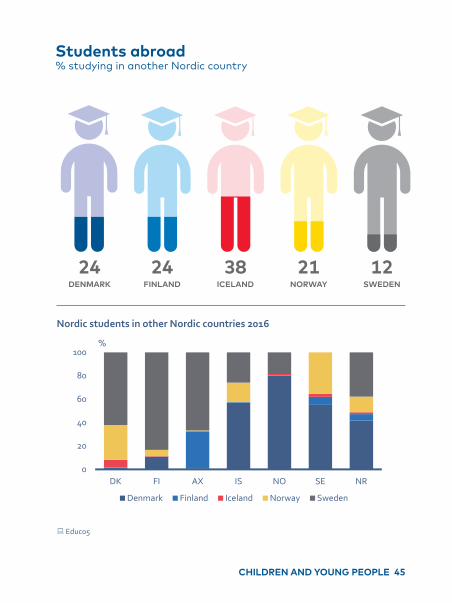
Nordic students in other Nordic countries 2016
Educ05
0
20
40
60
80
100
DK FI AX IS NO SE NR
Denmark Finland Iceland Norway Sweden
%
CHILDREN AND YOUNG PEOPLE 45
Higher education students 2015
Educ02 and Popu02. Greenland: 2012. Åland: Includes only students at Åland University of Applied Sci‐ences. Sweden: 2014.
0
2
4
6
8
10
12
14
16
18
20
DK GL FI AX IS NO SE
% of age group 20–39
Higher education students
Educ02 and Popu02
0
2
4
6
8
10
12
14
16
2000 2005 2015Men Women
% of age group 20–39, Nordic Region
ICELAND
Students abroad % studying in another Nordic country
DENMARK FINLAND NORWAY SWEDEN
24 24 38 21 12
Nordic students in other Nordic countries 2016
Educ05
0
20
40
60
80
100
DK FI AX IS NO SE NR
Denmark Finland Iceland Norway Sweden
%
46 CHILDREN AND YOUNG PEOPLE
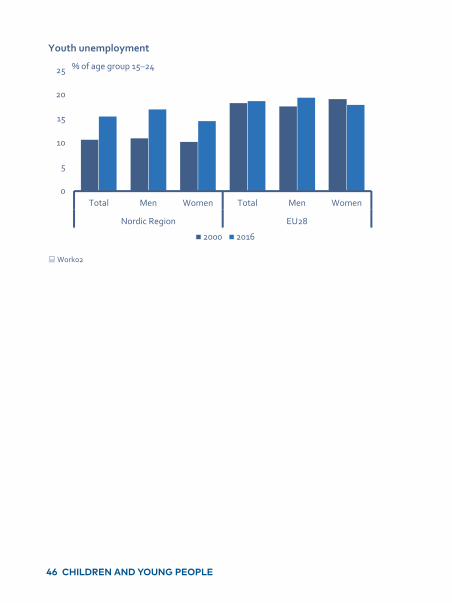
Youth unemployment
Work02
0
5
10
15
20
25
Total Men Women Total Men Women
Nordic Region EU28
2000 2016
% of age group 15–24

CHILDREN AND YOUNG PEOPLE 47
Youth unemployment
Work02
0
5
10
15
20
25
Total Men Women Total Men Women
Nordic Region EU28
2000 2016
% of age group 15–24
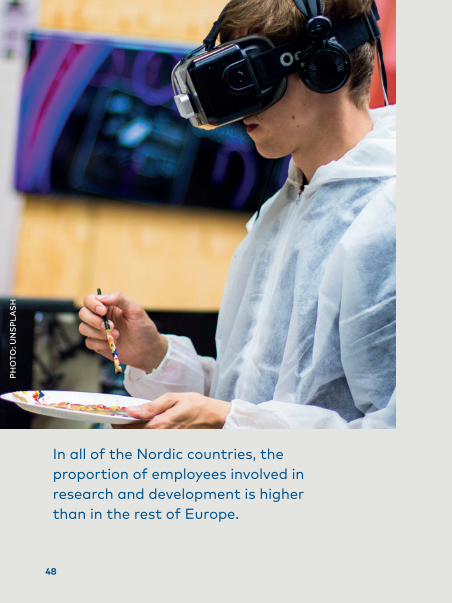
48
In all of the Nordic countries, the proportion of employees involved in research and development is higher than in the rest of Europe.
PHO
TO: U
NS
PLA
SH

49
Innovation and creativity
50 INNOVATION AND CREATIVITY
Innovation and creativity
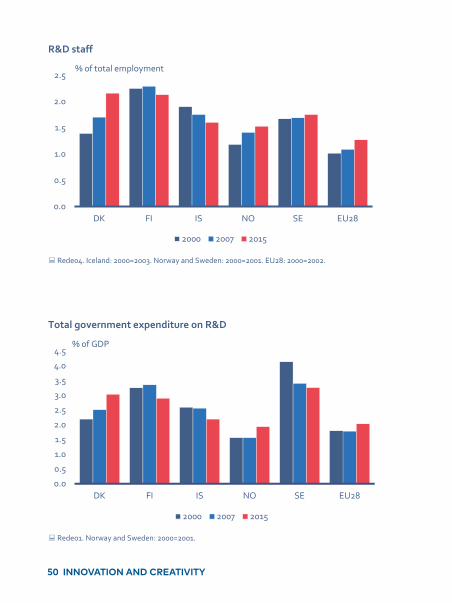
R&D staff
Rede04. Iceland: 2000=2003. Norway and Sweden: 2000=2001. EU28: 2000=2002.
0.0
0.5
1.0
1.5
2.0
2.5
DK FI IS NO SE EU28
2000 2007 2015
% of total employment
Total government expenditure on R&D
Rede01. Norway and Sweden: 2000=2001.
0.0
0.5
1.0
1.5
2.0
2.5
3.0
3.5
4.0
4.5
DK FI IS NO SE EU28
2000 2007 2015
% of GDP
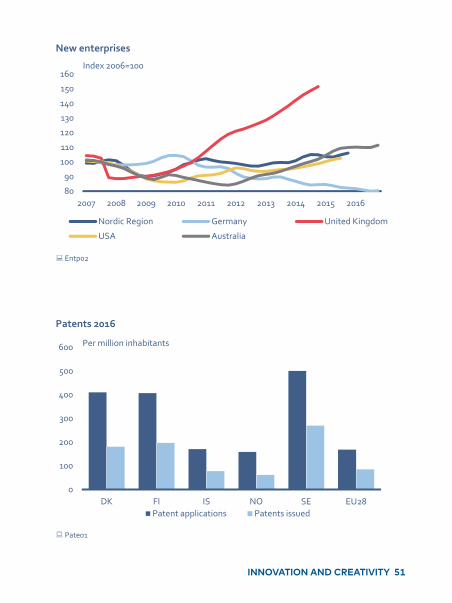
New enterprises
Entp02
80
90
100
110
120
130
140
150
160
2007 2008 2009 2010 2011 2012 2013 2014 2015 2016
Nordic Region Germany United Kingdom
USA Australia
Index 2006=100
Patents 2016
Pate01
0
100
200
300
400
500
600
DK FI IS NO SE EU28Patent applications Patents issued
Per million inhabitants
INNOVATION AND CREATIVITY 51
Innovation and creativity
R&D staff
Rede04. Iceland: 2000=2003. Norway and Sweden: 2000=2001. EU28: 2000=2002.
0.0
0.5
1.0
1.5
2.0
2.5
DK FI IS NO SE EU28
2000 2007 2015
% of total employment
Total government expenditure on R&D
Rede01. Norway and Sweden: 2000=2001.
0.0
0.5
1.0
1.5
2.0
2.5
3.0
3.5
4.0
4.5
DK FI IS NO SE EU28
2000 2007 2015
% of GDP
New enterprises
Entp02
80
90
100
110
120
130
140
150
160
2007 2008 2009 2010 2011 2012 2013 2014 2015 2016
Nordic Region Germany United Kingdom
USA Australia
Index 2006=100
Patents 2016
Pate01
0
100
200
300
400
500
600
DK FI IS NO SE EU28Patent applications Patents issued
Per million inhabitants
52 INNOVATION AND CREATIVITY
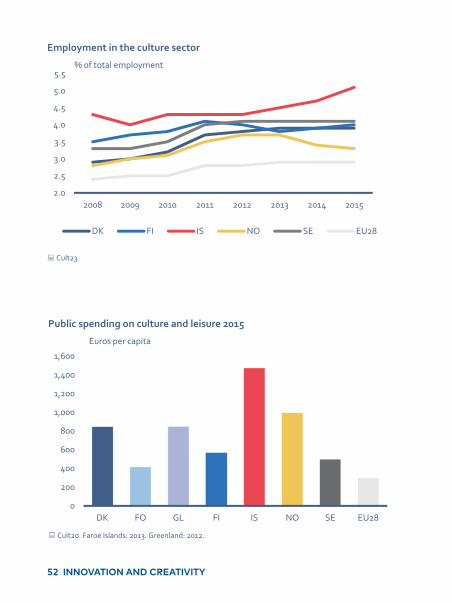
Employment in the culture sector
Cult23
2.0
2.5
3.0
3.5
4.0
4.5
5.0
5.5
2008 2009 2010 2011 2012 2013 2014 2015
DK FI IS NO SE EU28
% of total employment
Public spending on culture and leisure 2015
Cult20. Faroe Islands: 2013. Greenland: 2012.
0
200
400
600
800
1,000
1,200
1,400
1,600
DK FO GL FI IS NO SE EU28
Euros per capita
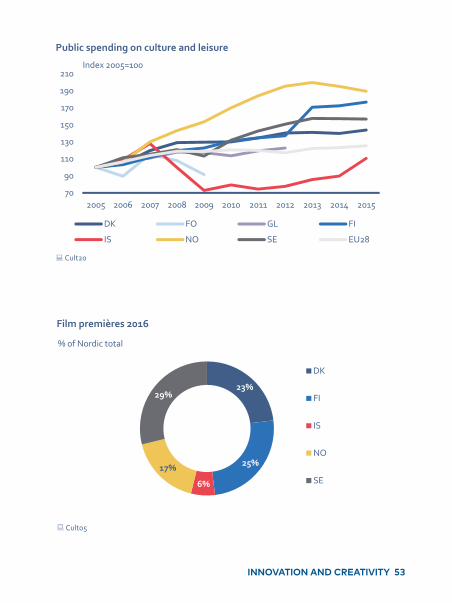
Public spending on culture and leisure
Cult20
70
90
110
130
150
170
190
210
2005 2006 2007 2008 2009 2010 2011 2012 2013 2014 2015
DK FO GL FI
IS NO SE EU28
Index 2005=100
Film premières 2016
Cult05
23%
25%
6%
17%
29%
DK
FI
IS
NO
SE
% of Nordic total
INNOVATION AND CREATIVITY 53
Employment in the culture sector
Cult23
2.0
2.5
3.0
3.5
4.0
4.5
5.0
5.5
2008 2009 2010 2011 2012 2013 2014 2015
DK FI IS NO SE EU28
% of total employment
Public spending on culture and leisure 2015
Cult20. Faroe Islands: 2013. Greenland: 2012.
0
200
400
600
800
1,000
1,200
1,400
1,600
DK FO GL FI IS NO SE EU28
Euros per capita
Public spending on culture and leisure
Cult20
70
90
110
130
150
170
190
210
2005 2006 2007 2008 2009 2010 2011 2012 2013 2014 2015
DK FO GL FI
IS NO SE EU28
Index 2005=100
Film premières 2016
Cult05
23%
25%
6%
17%
29%
DK
FI
IS
NO
SE
% of Nordic total

54 INNOVATION AND CREATIVITY
Film premières 2016
Cult05
0
50
100
150
200
250
300
350
DK FO GL FI IS NO SE
National Foreign
Number
Theatre visits 2016
Cult15. Finland: 2015. Iceland: 2014. Sweden: 2010.
10
20
30
40
50
60
70
80
90
DK FO GL FI IS NO SE
Visits per 100 inhabitants

INNOVATION AND CREATIVITY 55
Film premières 2016
Cult05
0
50
100
150
200
250
300
350
DK FO GL FI IS NO SE
National Foreign
Number
Theatre visits 2016
Cult15. Finland: 2015. Iceland: 2014. Sweden: 2010.
10
20
30
40
50
60
70
80
90
DK FO GL FI IS NO SE
Visits per 100 inhabitants

56
About one fifth of the foreign trade in the Nordic countries is trade with other Nordic countries.
PHO
TO: U
NS
PLA
SH

57
Economy

58
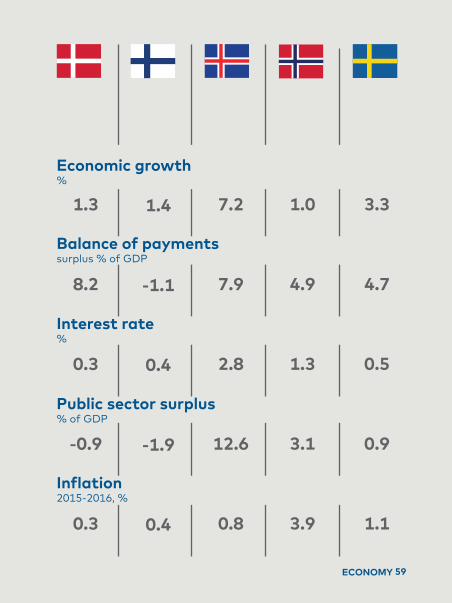
KEY FIGURES 2016
Economy
Unemployment%
DENMARK 6.3
FINLAND 9.0
ICELAND 3.1
NORWAY 4.9
SWEDEN 8.4
ECONOMY
59
Balance of paymentssurplus % of GDP
Interest rate%
Public sector surplus% of GDP
Inflation2015-2016, %
Economic growth%
1.3
8.2
0.3
-0.9
0.3
1.4
-1.1
0.4
-1.9
0.4
7.2
7.9
2.8
12.6
0.8
1.0
4.9
1.3
3.1
3.9
3.3
4.7
0.5
0.9
1.1
ECONOMY

60 ECONOMY
Economy
GDP – real annual growth
Naac02. EA19: The 19 EU member states that had adopted the euro as their sole legal tender by 1 January 2015.
‐10
‐5
0
5
10
15
DK FI IS NO SE EA19
%
GDP per capita
Naac04. PPS: Purchasing Power Standard, which eliminates price differences between the countries.
20,000
25,000
30,000
35,000
40,000
45,000
50,000
DK FI AX IS NO SE EA19
PPS/euros per capita
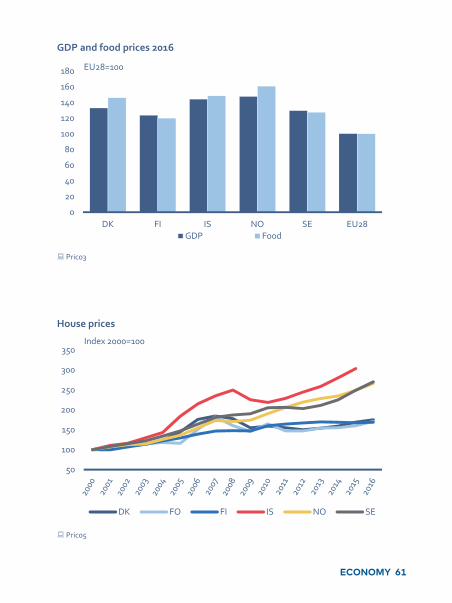
GDP and food prices 2016
Pric03
0
20
40
60
80
100
120
140
160
180
DK FI IS NO SE EU28GDP Food
EU28=100
House prices
Pric05
50
100
150
200
250
300
350
DK FO FI IS NO SE
Index 2000=100
ECONOMY 61
Economy
GDP – real annual growth
Naac02. EA19: The 19 EU member states that had adopted the euro as their sole legal tender by 1 January 2015.
‐10
‐5
0
5
10
15
DK FI IS NO SE EA19
%
GDP per capita
Naac04. PPS: Purchasing Power Standard, which eliminates price differences between the countries.
20,000
25,000
30,000
35,000
40,000
45,000
50,000
DK FI AX IS NO SE EA19
PPS/euros per capita
GDP and food prices 2016
Pric03
0
20
40
60
80
100
120
140
160
180
DK FI IS NO SE EU28GDP Food
EU28=100
House prices
Pric05
50
100
150
200
250
300
350
DK FO FI IS NO SE
Index 2000=100
62 ECONOMY
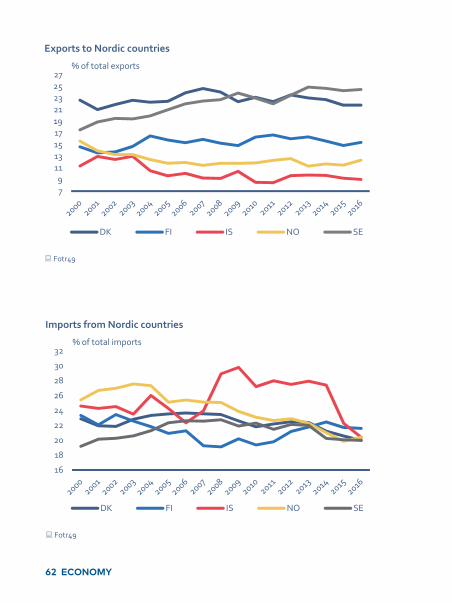
Exports to Nordic countries
Fotr49
79111315171921232527
DK FI IS NO SE
% of total exports
Imports from Nordic countries
Fotr49
16
18
20
22
24
26
28
30
32
DK FI IS NO SE
% of total imports
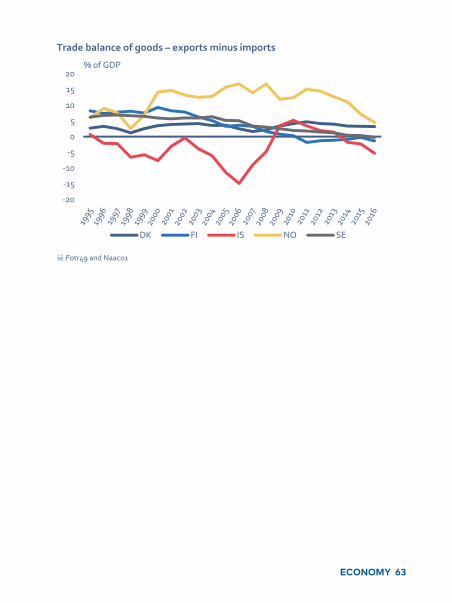
Trade balance of goods – exports minus imports
Fotr49 and Naac01
‐20
‐15
‐10
‐5
0
5
10
15
20
DK FI IS NO SE
% of GDP
ECONOMY 63
Exports to Nordic countries
Fotr49
79111315171921232527
DK FI IS NO SE
% of total exports
Imports from Nordic countries
Fotr49
16
18
20
22
24
26
28
30
32
DK FI IS NO SE
% of total imports
Trade balance of goods – exports minus imports
Fotr49 and Naac01
‐20
‐15
‐10
‐5
0
5
10
15
20
DK FI IS NO SE
% of GDP
Nordic Council of MinistersNordens HusVed Stranden 18DK-1061 Copenhagen Kwww.norden.org
ANP2017-748 ISBN 978-92-893-5100-3 (PRINT)ISBN 978-92-893-5101-0 (PDF)ISBN 978-92-893-5102-7 (EPUB)ISSN 2414-6609 (ONLINE)ISSN 2414-6595 (PRINT)

![Statistics on Patient Mobility in the Nordic Countries... · 2015, Gränsöverskridanden hälso- och sjukvård i Norden [Cross-border health and medical care in the Nordic countries].](https://static.fdocuments.in/doc/165x107/5fae660f29e09d17812148bb/statistics-on-patient-mobility-in-the-nordic-countries-2015-grnsverskridanden.jpg)

![[Nordic Built Challenge 17.12.2013] Trine Pertou Mach, Nordic Built: Nordic Built](https://static.fdocuments.in/doc/165x107/547174dcb4af9f980a8b4ad9/nordic-built-challenge-17122013-trine-pertou-mach-nordic-built-nordic-built.jpg)