Nordic Market report 2013 - Nordic energy · PDF fileMarket indicators ..... 33 Annex -...
42
Nordic Market report 2013 Report 6/2013
Transcript of Nordic Market report 2013 - Nordic energy · PDF fileMarket indicators ..... 33 Annex -...
Nordic Market report 2013
Report 6/2013

Nordic Market report 2013 Development in the Nordic Electricity Market
Nordic Energy Regulators 2013

2
Report 6/2013
NordREG c/o Norwegian Water Resources and Energy Directorate P.O. Box 5091 Majorstua N-0301 Oslo Norway Tel. +47 22 95 95 95 Internet: www.nordicenergyregulators.org July 2013

3
Table of contents Summary ........................................... .................................................. 5
Security of supply ................................ ............................................... 6
Supply ............................................ ...................................................... 8
Tables and figures - Supply .................................................................... 9
Demand ............................................ .................................................. 13
Tables and figures - Demand .................................................................14
Transmission ...................................... ............................................... 17
Tables and figures – Transmission ........................................................18
Wholesale market .................................. ........................................... 21
Tables and figures – Wholesale market .................................................22
Retail market ..................................... ................................................ 28
Tables and figures – Retail market .........................................................29
Financial market .................................. .............................................. 30
Tables and figures – Financial market ....................................................31
Market indicators ................................. ............................................. 33
Annex - Description of market indicators .......... ............................. 36

4
Preface The Nordic Market report describes in a timely manner the status and developments in the Nordic electricity market with focus on generation, consumption, transmission, wholesale power market and retail markets. The report has been published annually since 2006. The Nordic Market report 2013 is based on the information for the year 2012 available in June 2013.
Last year, the structure of the Nordic Market was revised from the versions published in the previous years. While the statistical content was preserved and listed at the end of each chapter, the descriptive parts of the report was made more compact. In this year’s report, we have made minor changes in order to further give the readers a quick and clear view of the Nordic electricity markets.
A working group with participants from the regulators in Denmark, Finland, Norway and Sweden has prepared the report. The members of the group were Henrik Gommesen (Energitilsynet, chairperson), Elin Söderlund (Energimarknadsinspektionen), Mats Øivind Willumsen (Norges vassdrags- og energidirektorat) and Markus Nora (Energiamarkkinavirasto).
Oslo, July 2013
Ove Flataker
Chair of NordREG

5
Summary The Nordic power system is hydro based with hydropower accounting for about 50 per cent of the total Nordic generation capacity at 100.832 MW installed capacity. The rest of the generation comes from a mixture of sources: Thermal power (second largest generation source), nuclear power and wind.
The total power generation in the Nordic region in 2012 was 399 TWh – 28 TWh or 7.5 per cent more than in 2011 – mainly due to a considerably higher reservoir levels at the start of 2012 than one year earlier. Hydro power generation increased by 37 TWh from 2011. As expected when hydro generation is increasing due to a strong hydrological situation, thermal generation decreases as they become less profitable. Thermal power plants generated 13 TWh less in 2012 than in 2011.
During 2012 the total Nordic electricity consumption was 386.6 TWh during 2012 – an increase of 2 per cent compared to 2011. The total consumpotion in Sweden was 141.7 TWh, in Norway it was 128.2 TWh, in Finland it exceeded to 82.9 TWh and Denmark 33.8 TWh.
Usually peak load occur during the cold time of the year (December-February). In 2012 the peak load in the Nordic region took place in the morning (hour 9) on Friday, February 3rd. The peak load was 68,837 GW. which was 2 percent higher than previous year.
The Nordic transmission grid is part of the transmission network in north-western Europe and it combines practically the whole Nordic region to one synchronous power system. Interconnec-tors also link the Nordic market to Germany, Poland, Estonia and Russia and the Netherlands. Eastern Denmark is synchronous with the Nordic grid while western Denmark is synchronous with the continental Europe.
Market splitting in the Nordic electricity market was forced 75 per cent of the time (74 per cent in 2011). The most actively used links were typically congested 35-55 per cent of the time. Between SE1-FI the flow was on average 86 per cent of the maximum capacity. Other links with high utilization rates were SE3-SE4 73 per cent, SE4-PL 77 per cent, NO2-DK1 71 per cent and SE3-FI 67 per cent.
Retail prices in the Nordic markets followed a general trend of declining prices in the first half of 2012 and increasing prices in the second half of 2012 throughout the region.
Supplier switching was 6.7 % in Denmark, 7.7 % in Finland, 9.9 % in Sweden and around 13.0 % in Norway.
The Nordic financial electricity market decreased for the second year in a row in terms of the volume and the value turnovers and the number of transactions. The volume turnover was 1,662 TWh (1723 TWh in 2011), which is 3.5 per cent less than in 2011. The value turnover for one fell notable 22 per cent down to 57 030 M€ (73,352 M€ in 2011). Nevertheless, the value turnover was 4.6 times the value of the physical market1, which is higher than previous year (4.1 in 2011). The number of transactions was 143,375 (161,589 in 2011) which corresponds to a decreased of 11%.
1 NPS System price x Nordic consumption

6
Security of supply Denmark Danish generation capacity rose by 480 MW - from 13.540 MW in 2011 to 14.020 MW in 2012. The increase was made mainly in Condensing power, wind generation capacity and CHP industrial capacity.
There are no loads generally classified as special peak load reserves and operational Reserves are used to cope with disturbances.
To enhance security of supply Danish grid companies are reinforcing the grids (both transmission and distribution) according to the national Danish cable action plan. New interconnectors will also contribute to security of supply.
Finland There were no significant changes in the generation or transmission capacities in Finland during 2012. The total electricity generation capacity at the end of 2012 was 16947 MW, including 1240 MW system reserve and capacity used by the power plants themselves, but excluding the 950 MW capacity which is not in generation readiness. The import capacity from neighboring countries is 4660 MW, but due to the current Russian electricity market structure there are some uncertainties related to the 1400 MW import.
The fast disturbance reserve was strengthened by a new 318 MW gas turbine plant in late 2012. The plant is not used for commercial electricity production, but only in situations when there are disturbances in the power system.
The peak consumption and generation in 2012 were 14,304 MW and 12,051 MW respectively (14,804 MW and 12,261 MW in 2011). The maximum generation and transmission capacities are currently adequate to meet the demand. The start of the commercial operation of the 1600 MW Olkiluoto 3 Nuclear reactor, which constitutes the majority of the new generation capacity in the near future, has been delayed further until 2016. This does not pose serious challenges to the security of supply, as the need for decommissioning old capacity is not severe.
Norway In Norway, about 95 % of the installed capacity is hydro based, thus production is highly dependent on weather conditions. Installed Norwegian power production capacity was 32,512 MW at the turn of 2012 - 2013, an increase of 798 MW from the year before. In addition, Norway has two reserve gas power turbines in Middle Norway with a total capacity of 300 MW.
A new 140 km DC cable between Norway and Denmark, Skagerak IV, was granted license June 2010. The transmission capacity will be 700 MW. The cable is expected to be in commission in 2014. There is also license applications for a DC cable to Germany with capacity of 1400 MW sent in 2009/2010, expected commissioned in 2018. Further, the Norwegian TSO (Statnett) and National Grid in UK have signed a cooperation agreement with the aim of commissioning a new DC cable between Norway and UK within 2020. The license application was sent in May 2013. Excepted capacity is 1400 MW.
The 92 km, 420 kV OH line from Sima to Samnanger is under construction and is expected to be commissioned in 2013/2014. The line will improve the security of supply to the region of Hordaland/Bergen area with Norway’s second largest city, and also integrate new hydro power.
7
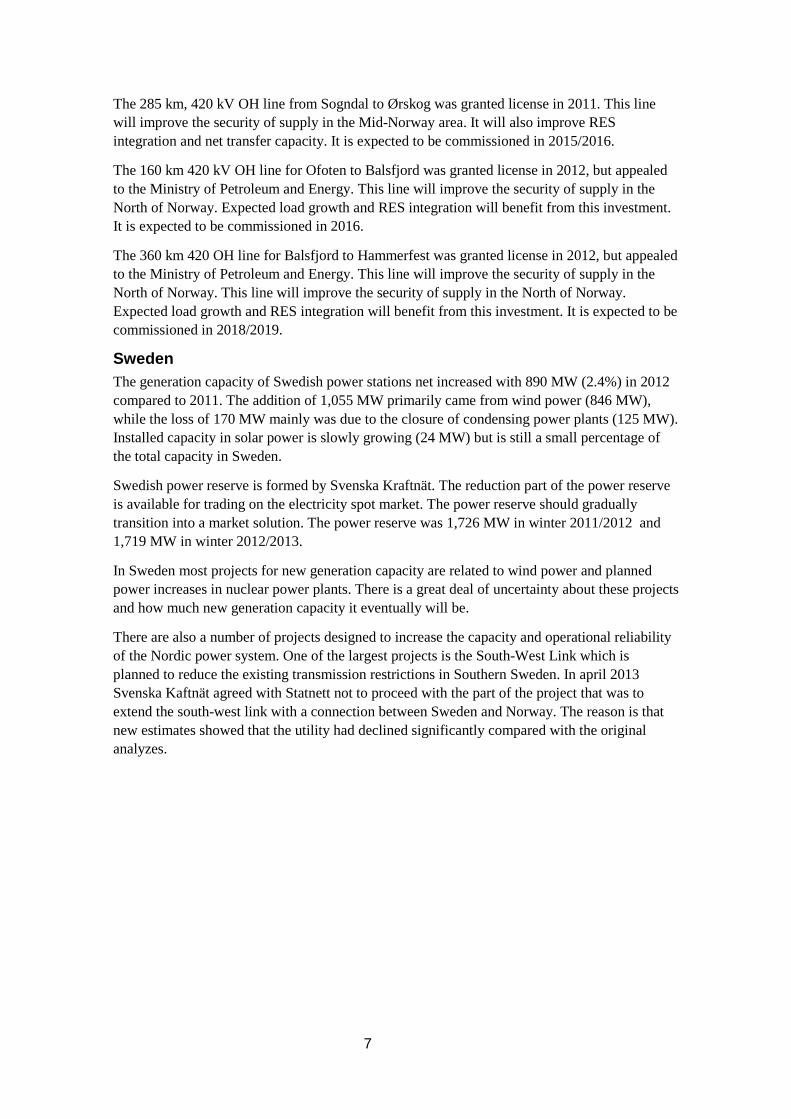
The 285 km, 420 kV OH line from Sogndal to Ørskog was granted license in 2011. This line will improve the security of supply in the Mid-Norway area. It will also improve RES integration and net transfer capacity. It is expected to be commissioned in 2015/2016.
The 160 km 420 kV OH line for Ofoten to Balsfjord was granted license in 2012, but appealed to the Ministry of Petroleum and Energy. This line will improve the security of supply in the North of Norway. Expected load growth and RES integration will benefit from this investment. It is expected to be commissioned in 2016.
The 360 km 420 OH line for Balsfjord to Hammerfest was granted license in 2012, but appealed to the Ministry of Petroleum and Energy. This line will improve the security of supply in the North of Norway. This line will improve the security of supply in the North of Norway. Expected load growth and RES integration will benefit from this investment. It is expected to be commissioned in 2018/2019.
Sweden The generation capacity of Swedish power stations net increased with 890 MW (2.4%) in 2012 compared to 2011. The addition of 1,055 MW primarily came from wind power (846 MW), while the loss of 170 MW mainly was due to the closure of condensing power plants (125 MW). Installed capacity in solar power is slowly growing (24 MW) but is still a small percentage of the total capacity in Sweden.
Swedish power reserve is formed by Svenska Kraftnät. The reduction part of the power reserve is available for trading on the electricity spot market. The power reserve should gradually transition into a market solution. The power reserve was 1,726 MW in winter 2011/2012 and 1,719 MW in winter 2012/2013.
In Sweden most projects for new generation capacity are related to wind power and planned power increases in nuclear power plants. There is a great deal of uncertainty about these projects and how much new generation capacity it eventually will be.
There are also a number of projects designed to increase the capacity and operational reliability of the Nordic power system. One of the largest projects is the South-West Link which is planned to reduce the existing transmission restrictions in Southern Sweden. In april 2013 Svenska Kaftnät agreed with Statnett not to proceed with the part of the project that was to extend the south-west link with a connection between Sweden and Norway. The reason is that new estimates showed that the utility had declined significantly compared with the original analyzes.

8
Supply The Nordic power system is a mixture of generation sources such as wind, hydro, nuclear and other thermal power2. Hydropower, which accounts for about 50 per cent of the total Nordic generation capacity, is the major source of electricity generation in the region. It represents virtually all of the Norwegian and nearly half of the Swedish generation capacity.
CHP (Combined Heat and Power) is the second largest generation source accounting for 30 per cent of the total Nordic power generation capacity. The thermal power generation (Finland and Denmark) in the Nordic region act as “swing-production”, i.e. balances the total production during seasons when the level of hydropower generation in Norway and Sweden is low relative to demand. The third largest power source, with a share of 12 per cent of the total Nordic generation capacity, is nuclear power, only located in Sweden and Finland. Wind power accounts for about 9 per cent and its notable increase continued from previous year.
The Nordic region has a total of 100.832 MW installed capacity for power generation and the total power generation in the Nordic region in 2012 was 399 TWh – 28 TWh or 7.5 per cent less than in 2011. This increase in supply was mainly due to a considerably higher reservoir levels at the start of 2012 than one year earlier. At the beginning of 2011 the reservoir levels in Norway were at a record low, twelve months earlier they had risen to an all-time high. A cold end to the year also stimulated demand and thus supply. Hydro power generation increased by 37 TWh from 2011. As expected when hydro generation is increasing due to a strong hydrological situation, thermal generation decreases as they become less profitable. Thermal power plants generated 13 TWh less in 2012 than in 2011.
The high reservoir levels at the beginning of 2012 were a result of record high inflow in 2011. Inflow levels normalized in 2012, decreasing from 242 TWh to 227 TWh. Combined with higher generation, lower inflow led to a more normal reservoir level at the end of the year – about 8 percentage points lower than at the beginning of the year for Norway and Sweden in total.
The shares of the largest producers were close to the values of previous year. Vattenfall maintained its position as the largest electricity generator in the Nordic region with 18.8 % of the total generation followed by Statkraft (13.6 %), Fortum (12.1 %) and E.ON (7.0 %).
2 Based on for example coal, gas and biofuels.

9
Tables and figures - Supply Table 1. Nordic Generation capacity (MW) by power s ource, 2012
Denmark Finland Norway Sweden Nordic region
Installed capacity (total) 14 020 16 947 32 512 37 353 100 832
Nuclear power - 2 732 - 9 363 12 095
Other thermal power 9 848 11 051 1 108 8 018 30 025
- Condensing power 1 955 2 155 - 1 498 5 608
- CHP, district heating 7 082 4 409 - 3 571 15 062
- CHP, industry 811 3 321 - 1 375 5 507
- Gas turbines etc. 0 1 166 - 1 574 2 740
Hydro power 9 3 164 30 700 16 203 50 076
Wind power 4 163 286 704 3 745 8 898
Sun power 0 0 0 24 24
Source: Swedenergy, NVE, DERA, EMI
Figure 1. Total power generation in the Nordic regi on, 2010-2012
Source: Nord Pool Spot
0
2000
4000
6000
8000
10000
12000
1 6 11 16 21 26 31 36 41 46 51
GW
h
Week
2010
2011
2012

10
Figure 2. Power generation by power source in the N ordic region 2012
Source: Nord Pool Spot
Table 2. Generation capacity by producers, 2012
Capacity (MW) Share (%)
Denmark - Dong Energy 6 137 6.1 %
- Vattenfall 1 816 1.8 %
Finland
- Fortum 5 040 5.0 %
- PVO 3 514 3.5 %
- Helsingin Energia 1 483 1.5 %
Norway
- Statkraft 13 384 13.3 %
- E-CO Energi 2 800 2.8 %
- Hydro 1 958 1.9 %
Sweden
- Vattenfall 13 803 13.7 %
- E.ON Sweden 6 721 6.7 %
- Fortum 5 870 5.8 %
Other generators 38 306 38.0 %
Total Nordic region 100 832 100 %
Source: Swedenergy, NVE, DERA, EMI
0
1000
2000
3000
4000
5000
6000
7000
1 6 11 16 21 26 31 36 41 46 51
GW
h
Week
Hydropower
NuclearPower
Otherthermalpower
Windpower

11
Figure 3. Share of total Nordic electricity generat ed by the four largest generators, 2002-2012
Source: Swedenergy
Figure 4. Effective inflows to the Nordic water res ervoirs, 2010 – 2012
Source: Nord Pool Spot
5%
7%
9%
11%
13%
15%
17%
19%
21%
23%
25%S
hare
of t
otal
nor
dic
gene
ratio
n
Vattenfall
Fortum
Statkraft
E.ON
0
2.000
4.000
6.000
8.000
10.000
12.000
14.000
16.000
18.000
20.000
1 6 11 16 21 26 31 36 41 46 51
GW
h
Week
2010
2011
2012
12
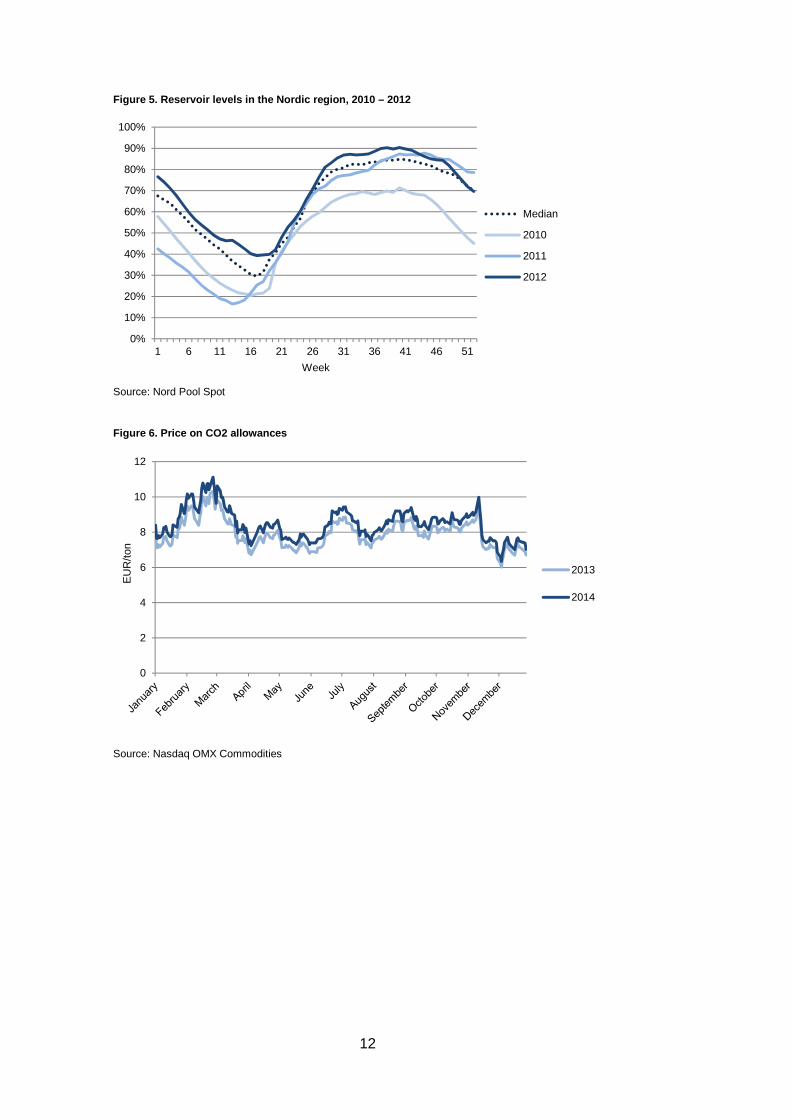
Figure 5. Reservoir levels in the Nordic region, 20 10 – 2012
Source: Nord Pool Spot
Figure 6. Price on CO2 allowances
Source: Nasdaq OMX Commodities
0%
10%
20%
30%
40%
50%
60%
70%
80%
90%
100%
1 6 11 16 21 26 31 36 41 46 51
Week
Median
2010
2011
2012
0
2
4
6
8
10
12
EU
R/to
n
2013
2014

13
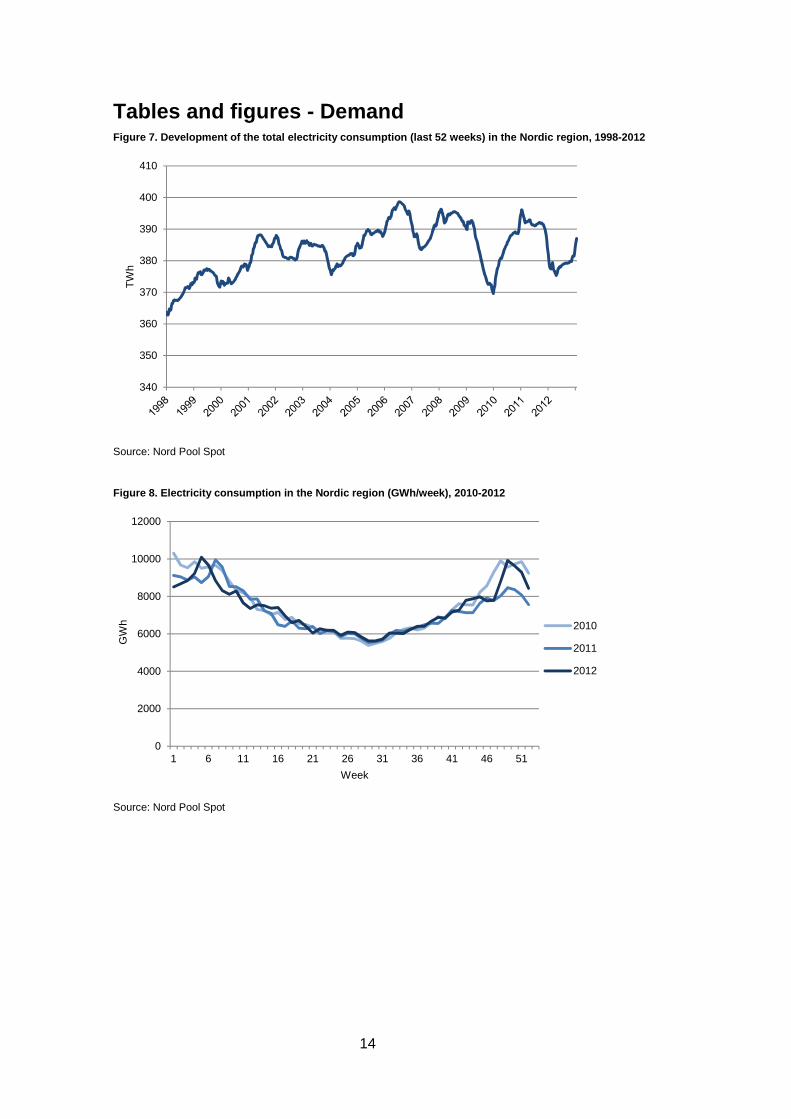
Demand In the Nordic region electricity prices have historically been low due to a large share of cost-effective hydropower and nuclear. This has resulted in abundance of energyintensive industry and a large share of electricity heated houses. Therefore the electricity consumption in the Nordic region is relatively high in comparison with other European countries. Development of overall energy consumption in the Nordic region depends on the development of the GDP and average temperatures during the year, with lower electricity demand in the summer and increased consumption in wintertime.
During 2012 the total Nordic electricity consumption was 386.6 TWh during 2012 which is an increase with 2 % compared to 2011.
Swedish, Norwegian and Finnish electricity is highly influenced by a large share of energy intensive industries and a significant amount of electricity heated houses. In Denmark the electricity consumption is less fluctuating than in the other Nordic countries due to less industrial demand. The total consumption in Sweden was 141.7 TWh, in Norway it was 128.2 TWh, in Finland it exceeded to 82.9 TWh and Denmark 33.8 TWh. In Sweden, Norway and Finland there was some recovery in electricity consumption last year after the fall in consumption due to the economic crisis. In Denmark on the other hand, where consumption is relatively low compared to the other Nordic countries, the consumption went further down (3%) from last year.
It was generally warmer in 2012 than normal. Average temperatures were about 0.6 degrees above normal. In December, however, the temperature got significantly below normal (2.3 degrees).
Usually peak load occur during the cold time of the year (December-February). In 2012 the peak load in the Nordic region took place in week 5on friday, Febuary 3rd, in the morning (hour 9). The peak load was 68,837 GW. which was 2 percent higher than previous year.
The load decreases significantly during night-time and peaks during the morning and late afternoon (when people start to work/uses domestic services at home). During the most strained hours the aggregate consumption in the Nordic area exceeded the aggregate production leading to a net exchange (net import) from neighbouring countries. In the most strained hour in 2012 the net import was 1,974 GW.
In Denmark demand peaked at 6,142 GW during the evening (17:00) on February 6th. Swedish demand peaked at 26,517 GW in the morning (07:00) on February 3rd. Finnish peak load occurred at 14,304 GW in the evening (17:00) on February 3rd. In Norway demand peaked at 23,443 GW in the morning (08:00) on December 5th.
14
Tables and figures - Demand Figure 7. Development of the total electricity cons umption (last 52 weeks) in the Nordic region, 1998- 2012
Source: Nord Pool Spot
Figure 8. Electricity consumption in the Nordic reg ion (GWh/week), 2010-2012
Source: Nord Pool Spot
340
350
360
370
380
390
400
410
TW
h
0
2000
4000
6000
8000
10000
12000
1 6 11 16 21 26 31 36 41 46 51
GW
h
Week
2010
2011
2012

15
Figure 9. Electricity consumption in the Nordic cou ntries (last 52 weeks), 2008-2012
Source: Nord Pool Spot
Figure 10. Mean temperature in the Nordic region 3 in 2012 compared to a normal year
Source: Nord Pool Spot
3 Temperature measured daily in 13 Nordic cities (Oslo, Bergen, Trondheim, Tromsø, Helsinki, Sodankyla, Vasa, Tampere, Stockholm, Gothenburg, Östersund, Luleå and Copenhagen).
0
20
40
60
80
100
120
140
160T
Wh
Norway
Sweden
Finland
Denmark
-20,0
-15,0
-10,0
-5,0
0,0
5,0
10,0
15,0
20,0
25,0
Deg
rees
Cel
cius
Normal
2012

16
Figure 11. Load in the Nordic region during week 5, 2012
Source: Nord Pool Spot
Figure 12. Consumption, generation and exchange in the Nordic region, February 3, hour 9
Source: Nord Pool Spot
0
10
20
30
40
50
60
70
80G
W
Denmark
Finland
Sweden
Norway
Hour 9, peak load; 68,837 GW
-5
0
5
10
15
20
25
30
Norway Sweden Finland Denmark
GW
Consumption
Generation
Net exchange

17
Transmission The Nordic transmission grid is part of the transmission network in north-western Europe and it combines practically the whole Nordic region to one synchronous power system. Interconnectors also link the Nordic market to Germany, Poland, Estonia and Russia and the Netherlands. Eastern Denmark is synchronous with the Nordic grid while western Denmark is synchronous with the continental Europe.
No new price area crossing links were added to the Nordic transmission grid during 2012. Minor capacity improvements were done between NO5-NO2, NO4-SE1 and DK1-Germany. Exceptionally good year with regard to hydro power generation posed a challenge for the transmission capacities and this was seen as divergence of the area prices.
Between February and April there was an underwater cable failure in the Fenno Skan 2 and, owing to a fire in the thyristor hall of Fenno skan 1 at the Swedish end, Fenno Skan 1 was out of the market from July and the rest of 2012. On average 70 per cent of the maximum capacity between Finland and Sweden was available. Nevertheless, as the import flow from Russia to Finland was significantly decreased due to the Russian electricity market arrangements, import of electricity from Sweden to Finland reached all-time high 14.4 TWh.
Market splitting in the Nordic electricity market was forced 75 per cent of the time (74 per cent in 2011). Market splitting implies that the Nordic market is divided in a couple of different zones with different prices. The most actively used links were typically congested 35-55 per cent of the time. Between SE1-FI the flow was on average 86 per cent of the maximum capacity. Other links with high utilization rates were SE3-SE4 73 per cent, SE4-PL 77 per cent, NO2-DK1 71 per cent and SE3-FI 67 per cent.
Decided national grid improvements will be introduced between SE3-SE4 in 2013 and in the Western Norway during 2013-2014. Next country crossing improvements will be Estlink 2 between FI-EE and Skagerrak 4 between NO5-DK1, both high-voltage direct current links expected to be commissioned in 2014.
ITVC links between Western and Central Europe and Northern Europe were in active use, yet the price difference between Nord Pool Spot (system price 31.20 euro/MWh) and then European Power Exchange (EPEX DE 42.60 euro/MWh) was higher than in the previous year (NPS 47.05 e/MWh and EPEX 51.12 euro/MWh in 2011).
NB. High congestion level does not necessarily indicate insufficient transmission capacity. Due to exceptional circumstances and rapid changes the levels may peak temporarily. Long term examination and forecasts are needed for evaluation of requirements for improvements.

18
Tables and figures – Transmission Figure 13. Transmission network in north-western Eu rope
Source: Svenska Kraftnät

19
Figure 14. Shares of the annual hours the different price areas have shared the same price in 2012

20
Figure 15. Shares of congestion hours between neigh bouring price areas and maximum transmission capacities in 2012

21
Wholesale market In the Nordic market electricity is traded financially on Nasdaq OMX. In the financial market the players can secure prices for future purchases or sales of electricity.
Due to a much better hydrological situation in the Nordic region last year than the year before, the average system price4 in the Nord Pool area decreased by one third from 2011 to 2012 – from 47.05 euro/MWh to 31.20 euro/MWh. The highest monthly system price occurred in the cold month of February, but even then the monthly average did not reach higher than 49.06 euro/MWh – only just higher than the annual average in 2011.
In July, the average price was 13.70 euro/MWh. That is the lowest monthly average system price at Nord Pool since August 2000.
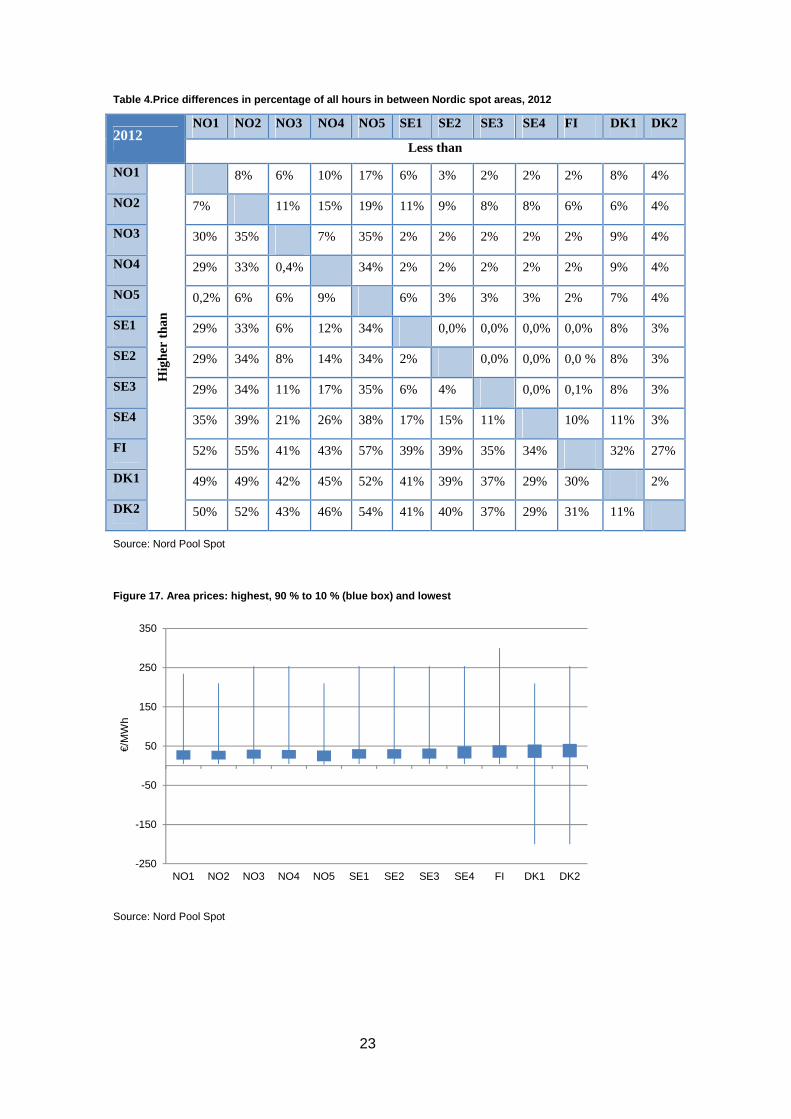
There was a common Nordic price for 25.1 % of the hours in 2012. By comparison, there was a common Nordic price for 26.2 % of the time in 2011. 2012 were the first whole year with Sweden divided into four elspot areas. The Swedish areas had a common price for 83.3 percent of the time. The most southern area – SE4 – had the highest annual average price of the four areas, with 34.21 €/MWh. The average was lower up north, with SE1 having the lowest annual average at 31.72 €/MWh.
Prices differences were somewhat higher in 2012 than the year before. Again, the hydrological surplus in Norway and Sweden caused prices in these areas to decrease more than in Finland and Denmark – and congestion to occur more often in the Nordic system. In 2011 the difference between the highest and lowest annual average price in the Nordic elspot area was 3.56 euro/MWh.
In 2012 the difference increased to 8.61 euro/MWh. Both years, Danish DK2 had the highest annual average price and Norwegian NO5 the lowest.
The Danish elspot areas, DK1 and DK2, had negative prices for 33 and 31 hours respectively in 2012. For five hours on Christmas Day prices in these areas were -200 euro/MWh due to high intermittent generation coupled with low demand.
The total volume traded at Nord Pool Spot in 2012 was about 84 % of the total Nordic electricity consumption – about six percentage points more than the year before. The total volume traded at Nord Pool Spot in 2012 was over 323 TWh, compared to approximately 294 TWh in 2011. Trade volumes at Nord Pool are often regarded as a measure of liquidity in the spot market.
4 The system price is calculated as the price that would be realized if there were no congestions between the elspot areas.

22
Tables and figures – Wholesale market Figure 16. Development of weekly system price and f orward price at Nord Pool Spot, 2009-2015
Source: Nord Pool Spot
Table 3. Average price in the different Nord Pool s pot areas, 2012
Spot prices €/MWh 2012 Change from 2011
East Norway (NO1) 29.56 -36%
South West Norway (NO2) 29.16 -37%
Middle Norway (NO3) 31.48 -34%
North Norway (NO4) 31.17 -30%
West Norway (NO5) 28.95 -37%
Sweden Luleå (SE1) 31.72 N.A.*
Sweden Sundsvall (SE2) 31.78 N.A.*
Sweden Stockholm (SE3) 32.32 N.A.*
Sweden Malmö (SE4) 34.21 N.A.*
Finland (FI) 36.64 -26%
West Denmark (DK1) 36.33 -24%
East Denmark (DK2) 37.56 -24%
*Sweden have been separated into four elspot areas only since November 1 2011
Source: Nord Pool Spot
0
10
20
30
40
50
60
70
80
90
100
€/M
Wh
System price
Average system pricelast 52 weeksForward system price,as of January 2 2013
23
Table 4.Price differences in percentage of all hour s in between Nordic spot areas, 2012
2012 NO1 NO2 NO3 NO4 NO5 SE1 SE2 SE3 SE4 FI DK1 DK2
Less than
NO1 H
ighe
r th
an
8% 6% 10% 17% 6% 3% 2% 2% 2% 8% 4%
NO2 7% 11% 15% 19% 11% 9% 8% 8% 6% 6% 4%
NO3 30% 35% 7% 35% 2% 2% 2% 2% 2% 9% 4%
NO4 29% 33% 0,4% 34% 2% 2% 2% 2% 2% 9% 4%
NO5 0,2% 6% 6% 9% 6% 3% 3% 3% 2% 7% 4%
SE1 29% 33% 6% 12% 34% 0,0% 0,0% 0,0% 0,0% 8% 3%
SE2 29% 34% 8% 14% 34% 2% 0,0% 0,0% 0,0 % 8% 3%
SE3 29% 34% 11% 17% 35% 6% 4% 0,0% 0,1% 8% 3%
SE4 35% 39% 21% 26% 38% 17% 15% 11% 10% 11% 3%
FI 52% 55% 41% 43% 57% 39% 39% 35% 34% 32% 27%
DK1 49% 49% 42% 45% 52% 41% 39% 37% 29% 30% 2%
DK2 50% 52% 43% 46% 54% 41% 40% 37% 29% 31% 11%
Source: Nord Pool Spot
Figure 17. Area prices: highest, 90 % to 10 % (blue box) and lowest
Source: Nord Pool Spot
-250
-150
-50
50
150
250
350
NO1 NO2 NO3 NO4 NO5 SE1 SE2 SE3 SE4 FI DK1 DK2
€/M
Wh

24
Figure 18. Comparison between the Nordic system pri ce (upper figure, Nord Pool) and German wholesale p rice (lower figure, EEX) - average, maximum and minimum hourly prices during the summer (week 14-39 2012)
Source: Nord Pool Spot and EEX
0
10
20
30
40
50
60
70
80
90
100€/
MW
h
Averageprice
Max and minprice
0
10
20
30
40
50
60
70
80
90
€/M
Wh
Averageprice
Max and minprice

25
Figure 19. Comparison between the Nordic system pri ce (upper figure, Nord Pool) and German wholesale p rice (lower figure, EEX) – average, maximum and minimum hourly prices during the winter (week 40-13 2012)
Source: Nord Pool Spot and EEX
0
50
100
150
200
250€/
MW
h
Averageprice
Max and minprice
-250
-200
-150
-100
-50
0
50
100
150
200
250
€/M
Wh
Averageprice
Max and minprice

26
Figure 20. Volumes traded at Nord Pool Spot market as a percentage of total Nordic consumption, 1997 – 2012
Source: Nord Pool Spot
Table 5. Volume of the Nordic balancing market 2012 (GWh)
2012 NO1 NO2 NO3 NO4 NO5 SE1 SE2 SE3 SE4 FI DK1 DK2 Totalt
GWh 308.2 600.7 163.6 210.2 344.4 716.5 774.9 303.7 26.3 307.0 492.7 168.5 492.7
Source: Nord Pool Spot
Figure 21. Weekly regulating volumes for the whole of Nordic area
Source: Nord Pool Spot
0
10
20
30
40
50
60
70
80
90P
erce
nt
-150
-100
-50
0
50
100
1 5 9 13 17 21 25 29 33 37 41 45 49
GW
h
Week
Downward regulation Upward regulation Net

27
Figure 22. Hourly regulating volumes for the whole Nordic area for an average week in 2012
Source: Nord Pool Spot
0
100
200
300
400
500
600
700
800M
Wh

28
Retail market Retail prices excl. VAT, taxes, distribution tariffs etc. in the Nordic markets followed a general trend of declining prices in the first half of 2012 and increasing prices in the second half of 2012 throughout the region.
In Sweden and Norway retail prices fell from 6.37 and 5.41 eurocent/kWh respectively in February to 2.37 and 1.69 eurocent/kWh in July. In December prices reached 5.44 eurocent/kWh in Sweden and 4.76 eurocent/kWh in Norway.
In Finland and Denmark prices fell from 5.55 and 6.04 eurocent/kWh respectively in February to 5.09 and 4.70 eurocent/kWh in July. In December the Finnish and Danish prices were 5.27 and 5.13 eurocent/kWh respectively.
Supplier switching i.e. the rate of consumers changing supplier can be seen as an indicator of consumer awareness and activity on the market.
There are significant differences between the Nordic countries when it comes to supplier switching; 6.7 % in Denmark, 7.7 % in Finland, 9.9 % in Sweden and around 13.0 % in Norway.
Consumer’s propensity to switch depends on many factors like transparency of prices and products, information/awareness of the market and active marketing etc., economic incentives and size of consumption and factors like contract lengths, demand for variable/fixed prices etc.
The number of suppliers on the Nordic markets varies significantly but on all markets the numbers of suppliers are sufficient to support and maintain active competition on the markets.
In Norway there are some 30 suppliers operating nation-wide, in Sweden app. 100, in Finland 28 and in Denmark app. 25.

29
Tables and figures – Retail market Figure 23. Retail prices in the Nordic region 2012 (excl. VAT, taxes, distribution tariffs etc.)
Source: Regulatory authorities
Table 6. Supplier switching on Nordic electricity m arkets 2008 – 2012
2009 2010 2011 2012
Norway 8.0 10.2 11.2 13.0
Sweden 11.0 10.0 11.3 9.9
Finland 8.1 7.6 7.6 7.7
Denmark 6.1 4.2 3.5 6.7
Source: Regulatory authorities
0,00
1,00
2,00
3,00
4,00
5,00
6,00
7,00
Eur
ocen
t/kW
h
Sweden
Norway
Finland
Denmark

30
Financial market Nasdaq OMX is the single financial energy market for Norway, Denmark, Sweden and Finland. It serves as a market place for futures, forwards and other derivatives for which electricity is the underlying commodity. Electricity derivatives are used primarily by companies that conduct electricity trading, mainly to hedge against price movements in the electricity market.
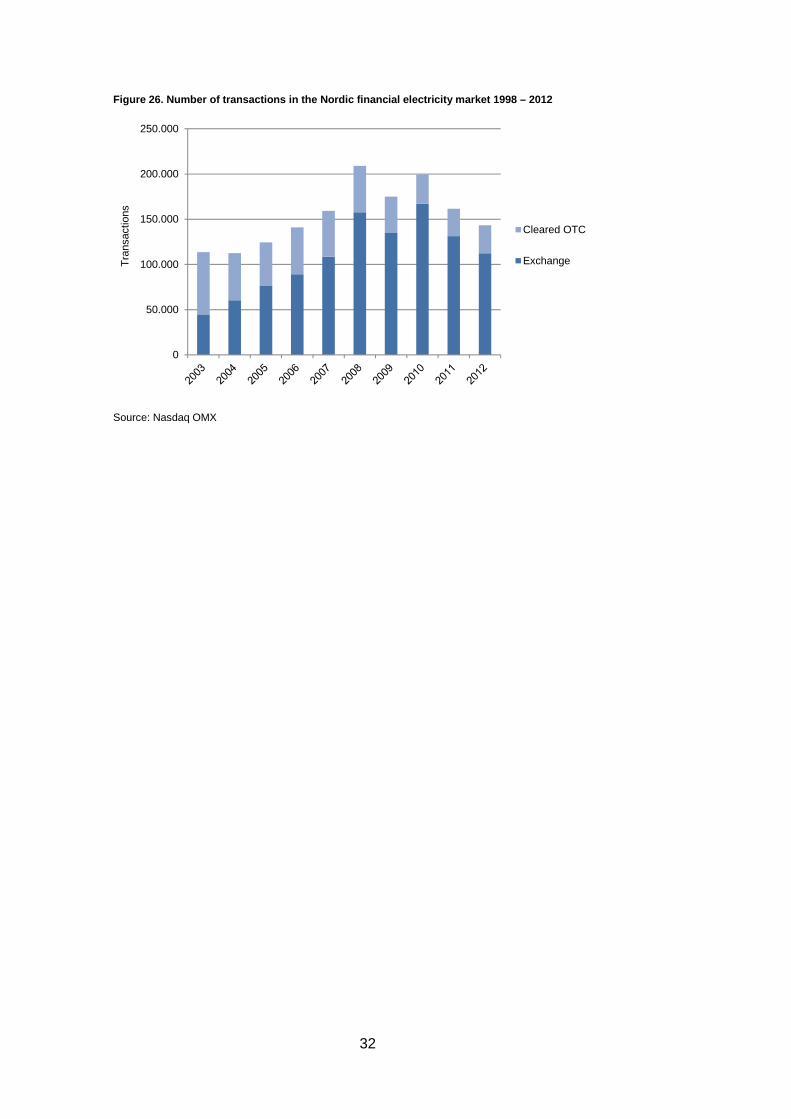
The Nordic financial electricity market decreased for the second year in a row in terms of the volume and the value turnovers and the number of transactions. The volume turnover was 1,662 TWh (1,723 TWh in 2011), which is 3.5 per cent less than in 2011. The value turnover for one fell notable 22 per cent down to 57,030 M€ (73,352 M€ in 2011). Nevertheless, the value turnover was 4.6 times the value of the physical market5, which is higher than previous year (4.1 in 2011). The number of transactions was 143,375 (161,589 in 2011) which corresponds to a decreased of 11%.
High hydropower reservoir levels, low wholesale prices and moderate expectations for the economic growth decreased slightly the need for and the cost of hedging during 2012. Although the level of activity on the financial market was somewhat lower than between 2000-2011 in general, the role of the financial market can still be stated to be crucial for functioning electricity market.
5 NPS System price x Nordic consumption

31
Tables and figures – Financial market Figure 24. Volume turnover in the Nordic financial electricity market 1998 – 2012
Source: Nasdaq OMX
Figure 25. Value turnover in the Nordic financial e lectricity market 1998 – 2012
Source: Nasdaq OMX
0
500
1.000
1.500
2.000
2.500
3.000
3.500
TW
h Cleared OTC
Exchange
0
20.000
40.000
60.000
80.000
100.000
120.000
140.000
ME
UR
Cleared OTC
Exchange
32
Figure 26. Number of transactions in the Nordic fin ancial electricity market 1998 – 2012
Source: Nasdaq OMX
0
50.000
100.000
150.000
200.000
250.000T
rans
actio
ns
Cleared OTC
Exchange

33
Market indicators NordREG has developed a set market indicators to monitor developments in the market and to develop methods of quantitatively evaluation of the market. The indicators are number of suppliers on the markets, supplier switching rate, price differences in the retail markets and concentration in the whole sale market.
The market indicators reveal that the Nordic retail markets for electricity appear competitive – with enough suppliers on the markets to enable active price competition as shown by the price difference indicator.
On the other hand a factor as concentration in the whole sale markets show that the competitive environment of the retail markets could improve. It should however be taken into account, that power generation is very capital intensive business which in itself lead to more concentrated markets. However the increasing share of renewables (wind and solar energy) may lead to less concentrated whole sale markets.
Considered over the period of 4 years where NordREG has published the market indicators it seems all indicators are quite stable for all 4 countries – generally with most changes to the price difference indicator and the concentration in the whole sale markets indicator.
However, comparing the indicator values of the four Nordic countries should take into account that there are structural differences between the markets, which affect the results.
It should also be taken into account that some of the results may be very close to the limit for a specific indicator value. In 2013, Finland has a HHI index of 1,102 which gives a score of 3 on the concentration indicator where an HHI of 1,100 would have given a score of 4 on the indicator. Similarly, in 2013 Denmark scores 2 on the supplier switching indicator, but a switching rate only 0.3% higher in 2013 would have resulted in a score of 3.
34
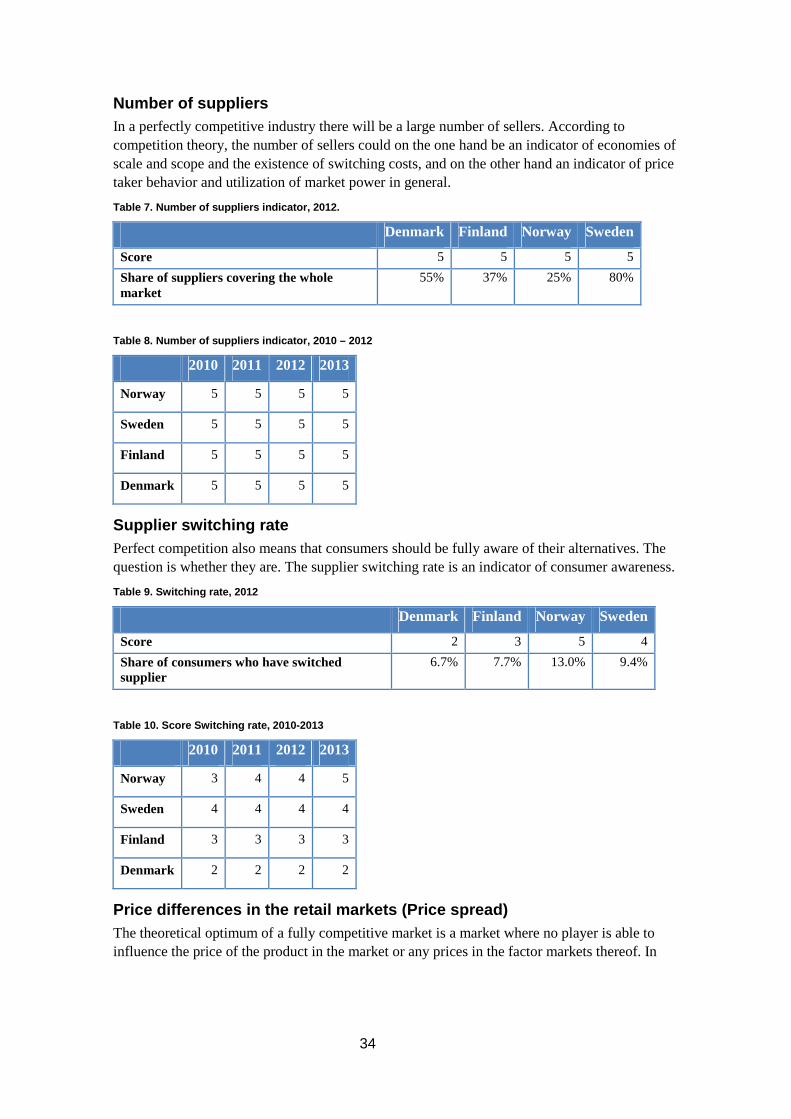
Number of suppliers In a perfectly competitive industry there will be a large number of sellers. According to competition theory, the number of sellers could on the one hand be an indicator of economies of scale and scope and the existence of switching costs, and on the other hand an indicator of price taker behavior and utilization of market power in general.
Table 7. Number of suppliers indicator, 2012.
Denmark Finland Norway Sweden
Score 5 5 5 5
Share of suppliers covering the whole market
55% 37% 25% 80%
Table 8. Number of suppliers indicator, 2010 – 2012
2010 2011 2012 2013
Norway 5 5 5 5
Sweden 5 5 5 5
Finland 5 5 5 5
Denmark 5 5 5 5
Supplier switching rate Perfect competition also means that consumers should be fully aware of their alternatives. The question is whether they are. The supplier switching rate is an indicator of consumer awareness.
Table 9. Switching rate, 2012
Denmark Finland Norway Sweden
Score 2 3 5 4
Share of consumers who have switched supplier
6.7% 7.7% 13.0% 9.4%
Table 10. Score Switching rate, 2010-2013
2010 2011 2012 2013
Norway 3 4 4 5
Sweden 4 4 4 4
Finland 3 3 3 3
Denmark 2 2 2 2
Price differences in the retail markets (Price spre ad) The theoretical optimum of a fully competitive market is a market where no player is able to influence the price of the product in the market or any prices in the factor markets thereof. In
35
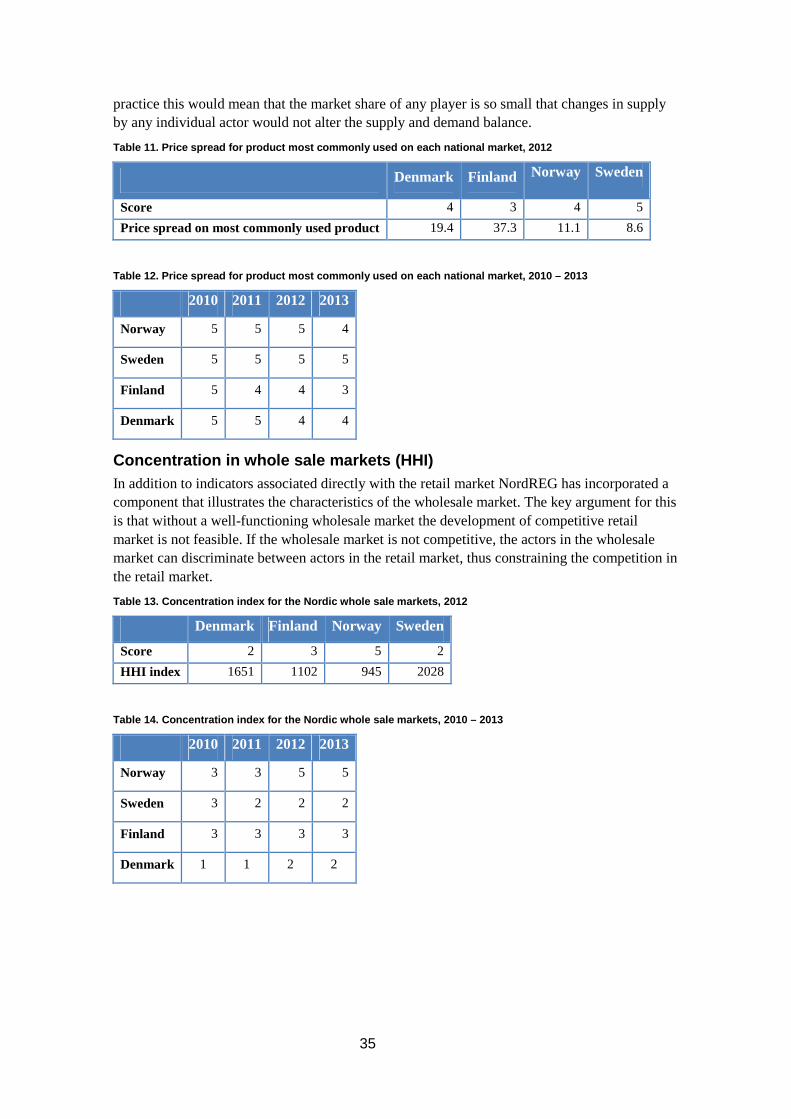
practice this would mean that the market share of any player is so small that changes in supply by any individual actor would not alter the supply and demand balance.
Table 11. Price spread for product most commonly us ed on each national market, 2012
Denmark Finland Norway Sweden
Score 4 3 4 5
Price spread on most commonly used product 19.4 37.3 11.1 8.6
Table 12. Price spread for product most commonly us ed on each national market, 2010 – 2013
2010 2011 2012 2013
Norway 5 5 5 4
Sweden 5 5 5 5
Finland 5 4 4 3
Denmark 5 5 4 4
Concentration in whole sale markets (HHI) In addition to indicators associated directly with the retail market NordREG has incorporated a component that illustrates the characteristics of the wholesale market. The key argument for this is that without a well-functioning wholesale market the development of competitive retail market is not feasible. If the wholesale market is not competitive, the actors in the wholesale market can discriminate between actors in the retail market, thus constraining the competition in the retail market.
Table 13. Concentration index for the Nordic whole sale markets, 2012
Denmark Finland Norway Sweden
Score 2 3 5 2
HHI index 1651 1102 945 2028
Table 14. Concentration index for the Nordic whole sale markets, 2010 – 2013
2010 2011 2012 2013
Norway 3 3 5 5
Sweden 3 2 2 2
Finland 3 3 3 3
Denmark 1 1 2 2

36
Annex - Description of market indicators Description and definitions of retail market indicators for the Nordic Electricity Markets.
Indicator: Number of suppliers It is difficult to determine the number of suppliers that is needed for competition to be efficient. The optimal number of competitors would basically depend on the characteristics of the production costs and the market. For example, in a market with no entry and exit barriers, no cost of switching, only one supplier would be necessary, as the threat of entry would be sufficient to keep prices in line with marginal cost. Thus the number of suppliers should be considered in relation with indicators of entry barriers, cost of production and switching costs. Scaling is a problem with this indicator. It is hard to determine where to draw the line between the number of suppliers that indicates imperfect competition and what number of suppliers indicates more efficient competition.
It should also be mentioned that not all suppliers are active in all regions of a national market, thus leading to different competitive situations in the regions. A large number of suppliers could as such actually indicate a large degree of market segmentation. Particular if there is cross ownership between the different suppliers.
Only suppliers covering the whole of the individual countries are counted. NordREG considered selecting e.g. the capital region to work as a proxy, but concluded that selecting the whole country would still be more representative. When presenting this indicator in the Nordic Market Report, the total number of suppliers and the percentage share of the suppliers covering the whole market will be elaborated.
When presenting the number of suppliers’ indicator, the following scale will apply:
Number of suppliers Score
>10 5
>8 4
>5 3
>3 2
>0 1
The scale has been chosen in order to measure the indicators’ impact on competition and in order to enable comparisons between the different indicators. The scale 1-5 has on the one hand been chosen in order to differentiate and on the other hand not to pretend accuracy which is not available.
Indicator: Supplier switching rate Perfect competition also means that consumers should be fully aware of their alternatives. The question is whether they are. The supplier switching rate is an indicator of consumer awareness.
Switching supplier is defined as the action through which a consumer changes supplier. The switching rate measures the consumer awareness and activity which is crucial to a well-functioning market. High switching rates could be interpreted as a sign of adequate consumer information, and vice versa.

37
The switching rate also reflects a number of other aspects in the retail market, such as general prevailing options among general public, innovativeness of contract offering, marketing activity and overall dynamics.
Though a low switching rate could indicate low consumer awareness, it is not necessarily so. No hinders to switching together with perfect consumer information would imply that the consumers switch supplier as soon as there is a better offer available. That again means that the switching rate could be low because of hinders to the switching or low price spread. If the former is the case, the switching rate would be low due to entry barriers on the demand side. If the latter is the case, low switching rate could be misinterpreted as imperfect consumer information when in fact the market could be working perfectly well. The indicator should thus be considered in relation with the price spread.
An insignificant budget impact of switching supplier could also explain a situation of low switching rate. The less the share of what the consumer will gain from switching supplier makes of his or her budget, the less is his or her incentive to make the switch.
The indicator will be calculated as number of household switching contracts per year as a percentage share of the total number of household consumers and presented in the following manner:
Switching rate, % Score
>12 5
>9 4
>7 3
>3 2
>0 1
Indicator: Price differences in the retail market ( Price spread) A low price spread (no or only small price differences) in the retail market is regarded as an indication of a high level of competition as a competitive market tends to minimize price differences between homogenous products. The price spread indicator will illustrate that a consumer can save money by switching the supplier. With a homogenous product6 like electricity consumers should always choose the lowest price on comparable products. The price spread is included among the indicators to reflect the price taking behavior in the market, as if the law of one price would apply and the difference between different suppliers’ prices would be negligible.
Choosing the same product in each country is problematic. Even though a product is available in each country the use of that product varies and may not be representative for the individual market. However, comparing price spreads of the most commonly used product in the free market in each country will constitute a coherent measure as an indicator for the competition in each national market.
6 Electricity in itself is a homogenous product. In recent years certain attributes has been inscribed to the product, such as green attributes for electricity generated from renewable energy sources. If green attributes are important for the consumers, the products are no longer homogenous but heterogeneous. And the consumers may not necessarily choose the product with the lowest price.

38
The price spread will be calculated as the ratio between the lowest and highest price at the retail market, offered for the most commonly used product in each country. The supply obligation products are excluded. The aim is to measure price competition on the most used product in different markets; hence the product itself has less importance.
The price of the most commonly used product will be defined as the price of the offer for this product to an average consumption household. The capital regions will be used as a geographical proxy.
Observations defined as typical outliers could cause a problem when calculating the price spread as the ratio between the highest and lowest price. NordREG believes that the prices observed are actual prices for actual products. Thus there should be no general problem of outliers. However, this is first and foremost an empirical question, that will be dealt with if outliers appear.
When calculating the price spread it is also a question of whether to base the calculation on one or more observations. The more observations, the more robust the indicator might be. However, NordREG find the question best be answered and a decision taken, when there has been an opportunity to scrutinize the actual data collected for the indicator.
The price spread indicator will be presented in the following manner:
Price spread, % Score
≤10 5
>10,<20 4
≥20,<30 3
≥30,<50 2
≥50 1
Indicator: Concentration in whole sale markets (HHI ) In the economic theory of industrial organisation a basic assumption is that the potential to abuse market power is related to the firm’s market share. It is assumed that the more concentrated the market is the likelier it is that market is not well functioning. In the prolonging this implicates that an increase in markets concentration can lead to higher prices and lower consumer welfare.
The Herfindahl-Hirschman index (HHI) serves as indicator of market concentration and thus price taker behaviour of the wholesale market. A high score indicates a high concentration in the market which – all other things being equal – theoretically implies weaker conditions for competition. Similarly a low score indicates a low concentration in the market and stronger conditions for competition. The index however is not a very good indicator of the competitive character of a market since it merely points out the structural dominance of the market.
The HHI should be calculated for several market areas in order to reflect the Nordic electricity markets: The whole Nordic market as one, national markets and other subdivisions hereof (e.g. Sweden-Finland) subject to specific evaluations when numeric figures have been calculated.
NordREG has calculated the indicator for each national generation market and complemented this by weighing it with the time fragment the entire Nordic market shares a common price in the set of indicators.

39
The indicator both illustrates the concentration of the national generation market and the share of pan-Nordic sourcing. As the calculation of HHI for each country is based on market shares in the wholesale market, a market that in reality is a Nordic market, bottlenecks within the Nordic market is taken in to account.
The indicator will be presented according to the following scale:
HHi Score
≤1000 5
>1000,≤1100 4
>1100,≤1500 3
>1500,≤2200 2
>2200 1

NordREG c/o Norwegian Water Resources and Energy Directorate P.O. Box 5091 Majorstua N-0301 Oslo Norway Tel. +47 22 95 95 95 Internet: www.nordicenergyregulators.org


![[Nordic Built Challenge 17.12.2013] Trine Pertou Mach, Nordic Built: Nordic Built](https://static.fdocuments.in/doc/165x107/547174dcb4af9f980a8b4ad9/nordic-built-challenge-17122013-trine-pertou-mach-nordic-built-nordic-built.jpg)